final development of healthmod - natsem.canberra.edu.au · 1 the australian health system has...
TRANSCRIPT
National Centre for Social and Economic Modelling
• University of Canberra •
Development of ‘HealthMod’ - A Model of the Use and Costs of
Medical Services in Australia
Sharyn Lymer, Laurie Brown, Alicia Payne and Ann Harding
Paper presented at the 8th Nordic Seminar on Microsimulation Models
Oslo, Norway 8-9th June 2006

About NATSEM
The National Centre for Social and Economic Modelling was established on 1 January 1993, and supports its activities through research grants, commissioned research and longer term contracts
for model maintenance and development with the federal departments of Family, Community Services and Indigenous Affairs, Employment and Workplace Relations, Treasury, and
Education, Science and Training.
NATSEM aims to be a key contributor to social and economic policy debate and analysis by developing models of the highest quality, undertaking independent and impartial research, and
supplying valued consultancy services.
Policy changes often have to be made without sufficient information about either the current environment or the
consequences of change. NATSEM specialises in analysing data and producing models so that decision makers have the best
possible quantitative information on which to base their decisions.
NATSEM has an international reputation as a centre of excellence for analysing microdata and constructing microsimulation
models. Such data and models commence with the records of real (but unidentifiable) Australians. Analysis typically begins by looking at either the characteristics or the impact of a policy
change on an individual household, building up to the bigger picture by looking at many individual cases through the use of
large datasets.
It must be emphasised that NATSEM does not have views on policy. All opinions are the authors’ own and are not necessarily
shared by NATSEM.
Director: Ann Harding
© NATSEM, University of Canberra 2006
National Centre for Social and Economic Modelling University of Canberra ACT 2601 Australia
170 Haydon Drive Bruce ACT 2617
Phone + 61 2 6201 2780 Fax + 61 2 6201 2751 Email [email protected] Website www.natsem.canberra.edu.au

Development of HealthMod iii
NATSEM paper
Abstract This paper describes the development of a microsimulation model ‘HealthMod’ which simulates the use and costs of medical and related services by Australian families. Australia has a universal social insurance scheme known as ‘Medicare’, which provides all Australians with access to free or low-cost essential medical services (primarily general practitioner services as well as diagnostic and imaging services). Individuals may pay a direct out-of pocket contribution if fees charged for services are higher than the reimbursement schedule set by government. Over 75% of visits to general practitioners in Australia are bulk billed to government, meaning that patients are not required to provide a copayment. HealthMod is based on the 2001 National Health Survey. This survey has a number of deficiencies in terms of modelling the Medicare Benefits Scheme (MBS). The paper outlines three major methodological steps that had to be taken in the model construction: the imputation of synthetic families, the imputation of short term health conditions, and the annualisation of doctor visits and costs. Some preliminary results on the use of doctor services provided through the MBS are presented.
Author note Associate Professor Laurie Brown is Research Director (Health) at the National Centre for Social and Economic Modelling, Ms Sharyn Lymer is a Senior Research Fellow, Ms Alicia Payne is a Research Officer and Professor Ann Harding is Professor of Applied Economics and Social Policy at the University of Canberra and Director of NATSEM.
Acknowledgments The construction of the current version of the HealthMod model is being supported by an Australian Research Council linkage grant (no. LP0454275), and by our Industry Partners to this grant - Medicare Australia, the Productivity Commission, the Australian Bureau of Statistics, the Australian Institute of Health and Welfare, and the NSW Department of Health.
General caveat NATSEM research findings are generally based on estimated characteristics of the population. Such estimates are usually derived from the application of microsimulation modelling techniques to microdata based on sample surveys. These estimates may be different from the actual characteristics of the population because of sampling and nonsampling errors in the microdata and because of the assumptions underlying the modelling techniques. The microdata do not contain any information that enables identification of the individuals or families to which they refer.
iv
Contents
Abstract iii
Author note iii
Acknowledgments iii
General caveat iii
1 Introduction 1
2 Medicare – Australia’s Public Health Insurance Scheme 2
3 Methodological Steps 4 3.1 Generation of Synthetic Families through Statistical Matching 5 3.2 Imputation of Short-term Health Conditions 12 3.3 Imputation of Doctor Visits 18
4 Conclusions 23
References 25
NATSEM paper - Development of HealthMod 1
1 Introduction
This paper describes the development of a microsimulation model ‘HealthMod’, which simulates the use and costs of medical and related services by Australian families. HealthMod is being constructed under an Australian Research Council linkage grant (LP0454275). This program of research aims ultimately to construct a microsimulation model of the Australian health sector, including medical, hospital and pharmaceutical sectors, with a capacity to investigate and assess the likely distributional impacts of possible policy changes and their likely revenue or expenditure implications for government within Australia.
The current focus of the modelling to date has been on the medical sector. Australia has a universal social insurance scheme known as ‘Medicare’, which provides all Australians with access to free or low-cost essential medical services, primarily general practitioner services as well as diagnostic and imaging services. HealthMod is based on the Australian Bureau of Statistics (ABS) 2001 National Health Survey (NHS01). The NHS01 contains information about the health of Australians - including presence of health conditions (long term), health risk factors, health service usage (generally referenced to a two week window prior to interview), medication use (for National Health Priority Areas1) and a range of demographic and socio-economic information. However, this survey has a number of major deficiencies in terms of modelling the Medicare Benefits Scheme (MBS). So, whilst the NHS01 was decided on as the starting point for the basefile for HealthMod, due to its richness of health data, it was evident that supplementation of these data was required.
This paper outlines three major methodological steps that had to be taken in the model’s construction: the imputation of synthetic families; the imputation of short term health conditions; and the annualisation of doctor visits and costs. Before these are discussed, a brief overview of Medicare is provided in the next section as background. Some preliminary results on the use of doctor services and the benefits provided through the MBS are presented as validation of the model construction undertaken to date.
1 The Australian health system has identified 7 national health priority areas (NHPAs), including
arthritis and musculoskeletal conditions, asthma, cancer control, cardiovascular health, diabetes mellitus, injury prevention and control, and mental health. The diseases and conditions targeted under the NHPA initiative were chosen because they currently impose high social and financial costs on Australian society and, through appropriate and focused attention, significant gains in the health of Australia’s population can be achieved.
2 NATSEM paper - Development of HealthMod
2 Medicare – Australia’s Public Health Insurance Scheme
Medicare is Australia’s universal public health insurance scheme. It provides free or subsidised health care services to all Australians while allowing individuals to choose private health services if they wish. Australians’ contribute to the funding of Medicare via a 1.5% levy on the taxable income of wage and salary earners2. Australia’s public hospitals are jointly funded by the Commonwealth and State and Territory governments. The ‘Medibank’ scheme, later Medicare3, was first introduced in 1975 by the newly elected ‘Whitlam’ Labor Government. The aims of the scheme have been described as providing the ‘most equitable and efficient means of providing health insurance coverage for all Australians’ and to be ‘universal in coverage, equitable in distribution of costs and administratively simple to manage (Biggs, 2004:2). Since its introduction, the scheme has been updated on an ongoing basis.
Medicare currently provides:
• medical benefit payments covering some or all of the cost to the patient of out-of-hospital medical services, such as visiting a general practitioner (GP) or specialist;
• free hospital services to public patients in public hospitals; and
• subsidised hospital services for private patients (Medicare Australia, 2006; Department of Health and Ageing, 2006).
Out-of-hospital services covered by Medicare include:
• consultation fees for doctors and specialists;
• tests and examinations by doctors needed to treat illnesses, including X-rays and pathology tests;
• eye tests performed by optometrists;
• most surgical and other therapeutic procedures performed by doctors;
• some surgical procedures performed by approved dentists;
2 This represents a minimum contribution as there are additional surcharges for ‘high’ income earners
who do not take out private health insurance coverage. 3 When the Whitlam government was dismissed in 1975, and a Liberal - National Coalition led by
Fraser subsequently elected, many major changes were made to the original Medibank scheme. When a Labor government was re-elected in 1984, they rejected these changes and reinstated a scheme largely similar to the original Medibank. It was renamed Medicare. This was the introduction of ‘Medicare as we know it’.
NATSEM paper - Development of HealthMod 3
• some items associated with cleft lip and palate, as specified under a special scheme; and
• some specified allied health services ((Medicare Australia, 2006; Department of Health and Ageing, 2006).
The benefits individuals and families receive are based on a schedule of fees for service set by the Australian Commonwealth Government. These are indexed each year, with Medicare paying 100 per cent of the schedule fee for most out-of-hospital services provided by a doctor. The Schedule Fee represents a price deemed as standard for a particular medical service (for example, a standard consultation with a GP). However, the fee charged by doctors for their services is not regulated and doctors may choose to charge patients more than the schedule fee. The difference between the total charge and the Schedule Fee - known as the ‘gap’ - is an ‘out-of-pocket’ cost to the patient. As of 2005, patients receive a rebate of 100 per cent of this amount. If the service is charged at the schedule fee than it is effectively free.
‘Bulkbilling’ is an important aspect of the scheme. If a doctor ‘bulk-bills’, this means that Medicare is billed directly for the service and the doctor accepts the Medicare benefit (schedule fee) as full payment. Thus, a bulkbilled service incurs no out-of-pocket cost to the patient. Sometimes doctors will offer bulk-billing only to patients who are concession cardholders - individuals and families eligible for certain federal government pensions and allowances, senior citizens or people on low incomes. Recent federal budget measures have seen the introduction of financial incentives for doctors to provide bulkbilling, especially in rural areas. Over 75 per cent of visits to general practitioners in Australia are bulk-billed, although these rates vary greatly across areas.
Another key aspect of Medicare is the ‘Safety Net’. This is a MBS policy setting aimed at protecting individuals and families from high medical expenses incurred within a calendar year. If the safety net threshold is exceeded in a calendar year then the individual, or members of the family unit, start to receive additional rebates on any further services (80 per cent of their out-of-pocket costs in addition to the Schedule Fee). There are two threshold levels; a general level which was set at $1000 at 1 January 2006; and a concession level at $500 for which eligibility is based on a combination of income and family size (www.medicareaustralia.gov.au). These are effective for both single persons and families. However, for the medical costs of each family member to contribute towards a family’s safety net, they have to be registered with Medicare Australia as part of that family.
Medicare provides free in-hospital services to all patients who are treated by doctors and specialists as public patients in public hospitals — i.e. public patients in public hospitals are not charged for their medical care and treatment costs. This is administered by State and Territory Governments and is not included as part of the Medicare Benefits Schedule. Medicare also covers 75 per cent of the Medicare
4 NATSEM paper - Development of HealthMod
schedule fees for services and procedures provided by a treating doctor to private patients — i.e. those that opt to pay for their hospital services either in a public or private hospital. Private health insurance may cover some or all of the outstanding cost. Medicare does not cover the accommodation costs, or other items such as theatre fees and medicines associated with a hospital stay.
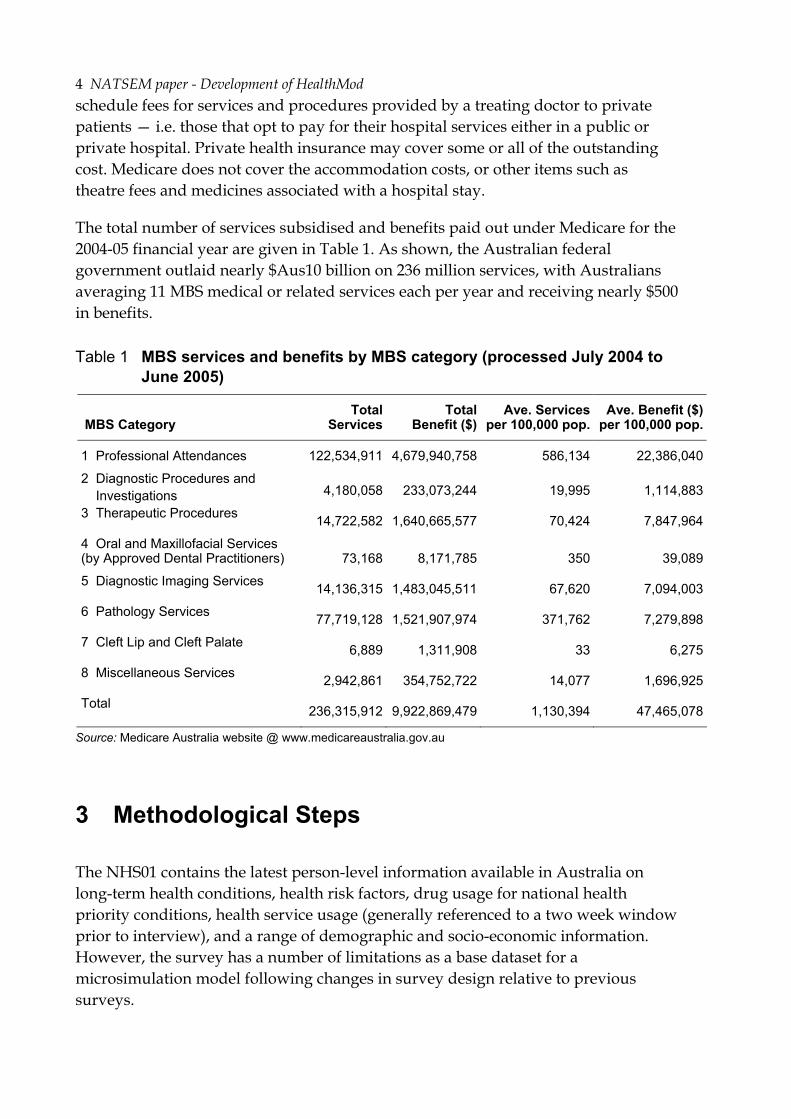
The total number of services subsidised and benefits paid out under Medicare for the 2004-05 financial year are given in Table 1. As shown, the Australian federal government outlaid nearly $Aus10 billion on 236 million services, with Australians averaging 11 MBS medical or related services each per year and receiving nearly $500 in benefits.
Table 1 MBS services and benefits by MBS category (processed July 2004 to June 2005)
MBS Category Total
Services Total
Benefit ($)Ave. Services
per 100,000 pop. Ave. Benefit ($)
per 100,000 pop.
1 Professional Attendances 122,534,911 4,679,940,758 586,134 22,386,040
2 Diagnostic Procedures and Investigations 4,180,058 233,073,244 19,995 1,114,883
3 Therapeutic Procedures 14,722,582 1,640,665,577 70,424 7,847,964
4 Oral and Maxillofacial Services (by Approved Dental Practitioners) 73,168 8,171,785 350 39,089
5 Diagnostic Imaging Services 14,136,315 1,483,045,511 67,620 7,094,003
6 Pathology Services 77,719,128 1,521,907,974 371,762 7,279,898
7 Cleft Lip and Cleft Palate 6,889 1,311,908 33 6,275
8 Miscellaneous Services 2,942,861 354,752,722 14,077 1,696,925
Total 236,315,912 9,922,869,479 1,130,394 47,465,078
Source: Medicare Australia website @ www.medicareaustralia.gov.au
3 Methodological Steps
The NHS01 contains the latest person-level information available in Australia on long-term health conditions, health risk factors, drug usage for national health priority conditions, health service usage (generally referenced to a two week window prior to interview), and a range of demographic and socio-economic information. However, the survey has a number of limitations as a base dataset for a microsimulation model following changes in survey design relative to previous surveys.
NATSEM paper - Development of HealthMod 5
Three key problems and the methods designed to overcome these have been selected for discussion here. First, unlike previous national health surveys, the 2001 survey only fully enumerated4 single person households and some single adult households with children. The ABS therefore recommends that any analysis of the 2001 file be undertaken at the person level only (ABS, 2003). To model aspects of the Australian health system - such as the MBS safety net - complete information about all family members, their combined health service use and their combined income/medical expenditure is required. Second, the survey has limited coverage of short term health conditions. Information was collected only for the short term component of national health priority problems (which are predominantly long-term). Given that around 70 per cent of general practitioner visits in Australia are prompted by short term health problems, this is a major limitation (since these conditions need to be adequately captured in the base file). Doctor usage is being modelled within HealthMod with health conditions as an explanatory variable. Hence, the annual picture of the presence of health conditions is also required. Third, the survey uses a two week window for reporting the use of medical and related services. To model the impact of policy, such as safety net, an annual picture of doctor visits and use of other medical services such as diagnostic procedures, diagnostic imaging and pathology services is required. To address these issues, we have produced an augmented dataset by creating synthetic families through statistical matching, imputing short-term conditions and annualising medical services covered under the MBS.
3.1 Generation of Synthetic Families through Statistical Matching
In HealthMod, the derivation of family structure has been undertaken using statistical matching methods. Statistical matching is a procedure used to link two files or datasets where each record from one file is matched with a record from the second file that generally does not represent the same unit, but does represent a similar unit. It is a method to bring together microdata that are not available from a single data source5. Statistical matching had been trialed previously in NATSEM-in Medicines Australia’s MediSim Model of the Australian Pharmaceutical Benefits Scheme (Brown et al, 2004; ABS NATSEM Technical Working Group, 2004). The development of HealthMod has aimed to build on the methodological foundations previously developed in building MediSim.
In HealthMod, the records that were matched were from NATSEM’s Household Expenditure Survey (HES)-based STINMOD/01a6 and the NHS01. The HES contains
4 Fully enumerated means obtained information on all persons in the household. 5 Rodgers (1984) gives a clear description of statistical matching, as do Rassler (2002), Radner et al
(1980), Cohen (1991), and Moriarty and Scheuren (2001). 6 STINMOD/01a is NATSEM’s static microsimulation model of the Australian tax and transfer
system, based on the 1998-99 Household Expenditure Survey (HES).
6 NATSEM paper - Development of HealthMod
around 18,000 person records and the NHS01 around 27,000 person records. Since these records involve sample surveys (rather than administrative data or a census), and considering the incomplete coverage of families in the NHS01, the matching of records involved finding the closest statistical match. If the same subjects were available on each data file this would have been an exact matching process. The HES was used as the donor file. The HES includes family structure information as well as income and expenditure (including amount spent on medical care and health expenses) and demographic data. The statistical matching of NHS01 and HES allows the retention of the health information available on NHS01, whilst borrowing the family structure from HES and theoretically adding detailed information about family income and health expenditure.
Differences in sample size among the different surveys should not be an issue as weighted duplications of records may be created so that the sample sizes in both datasets are equal (Taylor, Gomulka and Sutherland, 2000). The main difficulty likely to be encountered is the choice of weights in the merged file. The weights in either the NHS or HES could be selected — but the risk is that the statistical distribution and parameters of the variables merged from the other survey are not maintained. If constrained statistical matching is used, then the goal is to try to maintain the marginal distributions of the non-matched variables by minimising the difference in the weights of the records in the merged file to those of the two original surveys (Cohen, 1991).
The advantage of statistical matching is the ease and flexibility of future analysis that can be done from a matched dataset. However, it has an inherent assumption of conditional independence (CIA). That is, given the common (demographic) variables between the two files, the health variables are independent of the household income and medical expenditure. However, because all the variables are not observed together, this assumption cannot be tested (except if an auxiliary dataset containing all variables of interest was available). From CIA, it follows that the true joint distribution of all variables are reflected in the matched file. Preservation of the joint distribution is important if analysis using the matched file requires the use of “all” variables and analysis is sensitive to the joint distribution. If CIA does not hold, it may mask an important component of the relationship and potentially bias analysis involving the full set of variables.
Statistical matching will perform “better” with the use of well-selected common variables between the two datasets. This was limited by the common variables available and the strength of the correlation between the common variables and unconstrained variables Between the NHS01 and HES, the common variables available were mainly demographic and included age, sex, concessional cardholder status, labour force status, number of usual residents in household and equivalised income decile. For HealthMod, the emphasis of the statistical matching was creating families and no health variables were included in the matching strategy.
NATSEM paper - Development of HealthMod 7
As CIA cannot be tested in our matching process, the confidence that can be felt about a match is highly dependent on the correlation of the common variables to the health variables on the NHS side and the income/expenditure variables on the HES side. In this case the correlations are not particularly strong. Using only the family structure allocation from HES has less reliance on the assumption of conditional independence as it only borrows from a common variable and analysis is not using the joint distributions. It is the use of the income and expenditure data from HES —and assuming that the matched dataset is a true reflection of the relationship between these variables and presence of health conditions and health services use —that is more problematic.
In choosing to only add family structure from HES, there was a trade off of losing detailed income variables and medical expenditure variables from future analysis. The NHS01 does have some income data that is be available to the model, even though the HES income data is not brought across in the statistical matching.
Methods
The basic method of performing statistical matching used in the development of HealthMod involved a two-stage process:
1. Person records being subdivided into homogeneous cell groups based on common variables; and
2. Persons belonging to the same group being matched together using a distance function.
The homogeneous groups ensure a required standard of matching is maintained, whilst the distance function tries to find the closest matching individuals from the two surveys who are in the same group.
By using a conservative number of cell groups (no more than about 100), the distance function can be used to determine the relative importance of the common variables. From a practical point, the cell groups must be such that there is sample from both surveys in that cell group for the second stage to work.
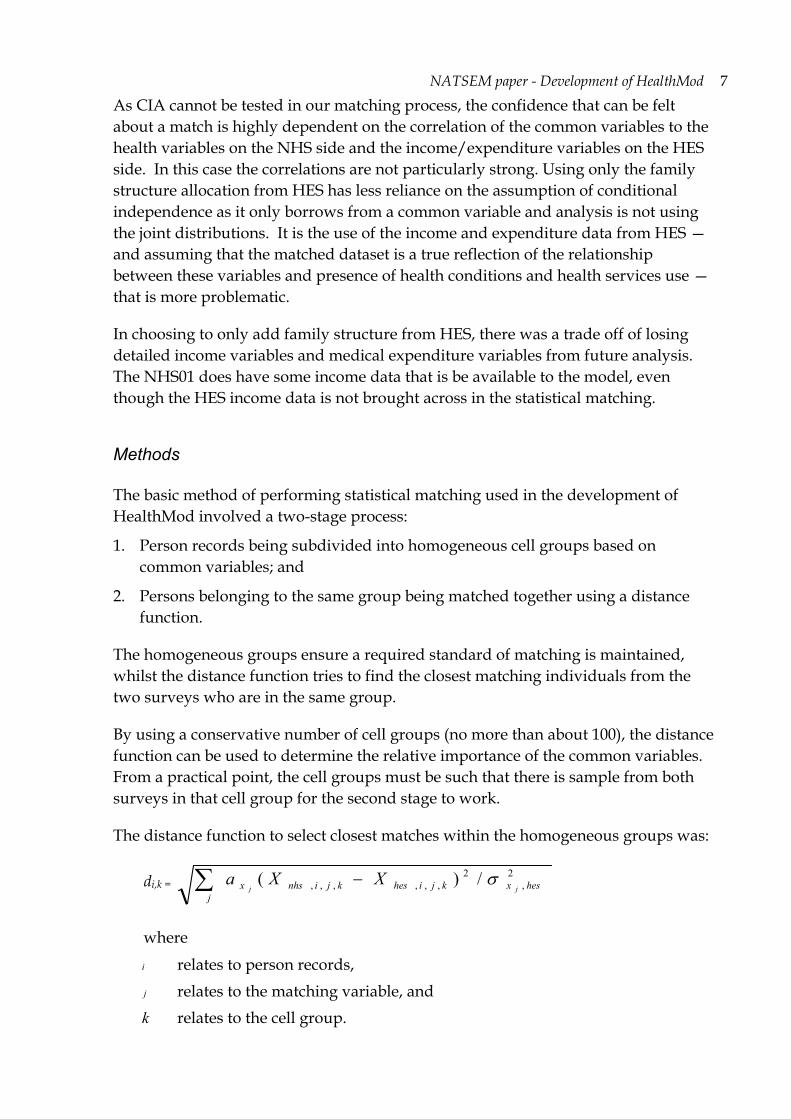
The distance function to select closest matches within the homogeneous groups was:
di,k = ∑ −j
hesxkjiheskjinhsx jjXXa 2
,2
,,,,,, /)( σ
where
i relates to person records, j relates to the matching variable, and k relates to the cell group.
8 NATSEM paper - Development of HealthMod
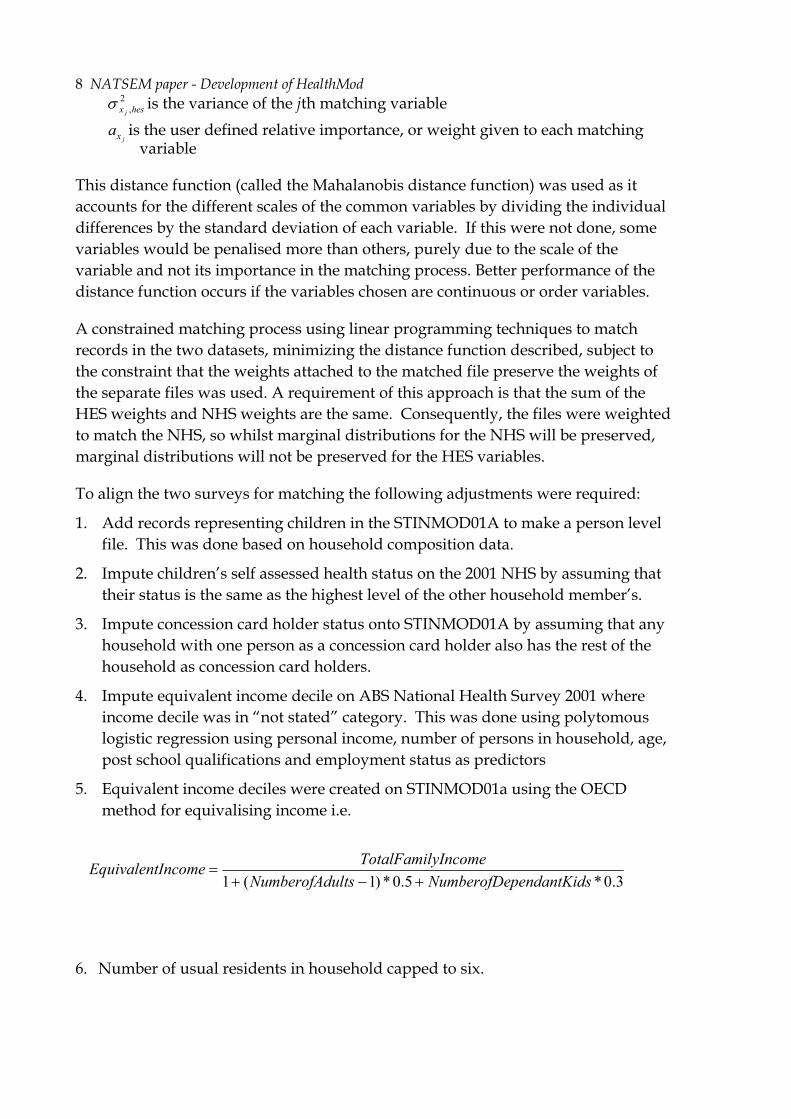
2,hesx j
σ is the variance of the jth matching variable
jxa is the user defined relative importance, or weight given to each matching
variable
This distance function (called the Mahalanobis distance function) was used as it accounts for the different scales of the common variables by dividing the individual differences by the standard deviation of each variable. If this were not done, some variables would be penalised more than others, purely due to the scale of the variable and not its importance in the matching process. Better performance of the distance function occurs if the variables chosen are continuous or order variables.
A constrained matching process using linear programming techniques to match records in the two datasets, minimizing the distance function described, subject to the constraint that the weights attached to the matched file preserve the weights of the separate files was used. A requirement of this approach is that the sum of the HES weights and NHS weights are the same. Consequently, the files were weighted to match the NHS, so whilst marginal distributions for the NHS will be preserved, marginal distributions will not be preserved for the HES variables.
To align the two surveys for matching the following adjustments were required:
1. Add records representing children in the STINMOD01A to make a person level file. This was done based on household composition data.
2. Impute children’s self assessed health status on the 2001 NHS by assuming that their status is the same as the highest level of the other household member’s.
3. Impute concession card holder status onto STINMOD01A by assuming that any household with one person as a concession card holder also has the rest of the household as concession card holders.
4. Impute equivalent income decile on ABS National Health Survey 2001 where income decile was in “not stated” category. This was done using polytomous logistic regression using personal income, number of persons in household, age, post school qualifications and employment status as predictors
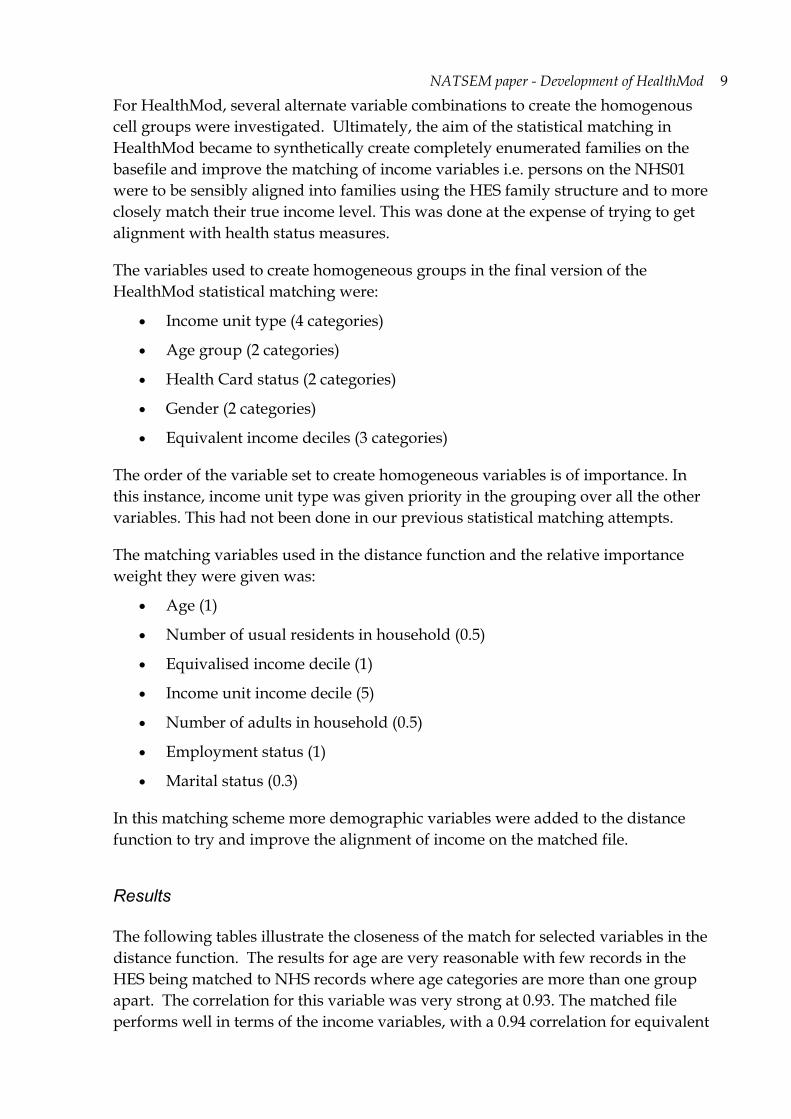
5. Equivalent income deciles were created on STINMOD01a using the OECD method for equivalising income i.e.
6. Number of usual residents in household capped to six.
3.0*5.0*)1(1 spendantKidNumberofDeultsNumberofAdyIncomeTotalFamilIncomeEquivalent
+−+=
NATSEM paper - Development of HealthMod 9
For HealthMod, several alternate variable combinations to create the homogenous cell groups were investigated. Ultimately, the aim of the statistical matching in HealthMod became to synthetically create completely enumerated families on the basefile and improve the matching of income variables i.e. persons on the NHS01 were to be sensibly aligned into families using the HES family structure and to more closely match their true income level. This was done at the expense of trying to get alignment with health status measures.
The variables used to create homogeneous groups in the final version of the HealthMod statistical matching were:
• Income unit type (4 categories)
• Age group (2 categories)
• Health Card status (2 categories)
• Gender (2 categories)
• Equivalent income deciles (3 categories)
The order of the variable set to create homogeneous variables is of importance. In this instance, income unit type was given priority in the grouping over all the other variables. This had not been done in our previous statistical matching attempts.
The matching variables used in the distance function and the relative importance weight they were given was:
• Age (1)
• Number of usual residents in household (0.5)
• Equivalised income decile (1)
• Income unit income decile (5)
• Number of adults in household (0.5)
• Employment status (1)
• Marital status (0.3)
In this matching scheme more demographic variables were added to the distance function to try and improve the alignment of income on the matched file.
Results
The following tables illustrate the closeness of the match for selected variables in the distance function. The results for age are very reasonable with few records in the HES being matched to NHS records where age categories are more than one group apart. The correlation for this variable was very strong at 0.93. The matched file performs well in terms of the income variables, with a 0.94 correlation for equivalent

10 NATSEM paper - Development of HealthMod
income deciles (Table 3). The alignment between the matched value and the actual value (from HES) of the income unit’s income decile was also relatively strong with a correlation of 0.93. In most cases the actual and matched values were within 2 categories of each other. The matching performed better at the extremes of the range i.e. 1st and 10th deciles compared in the middle ranges (Table 4).
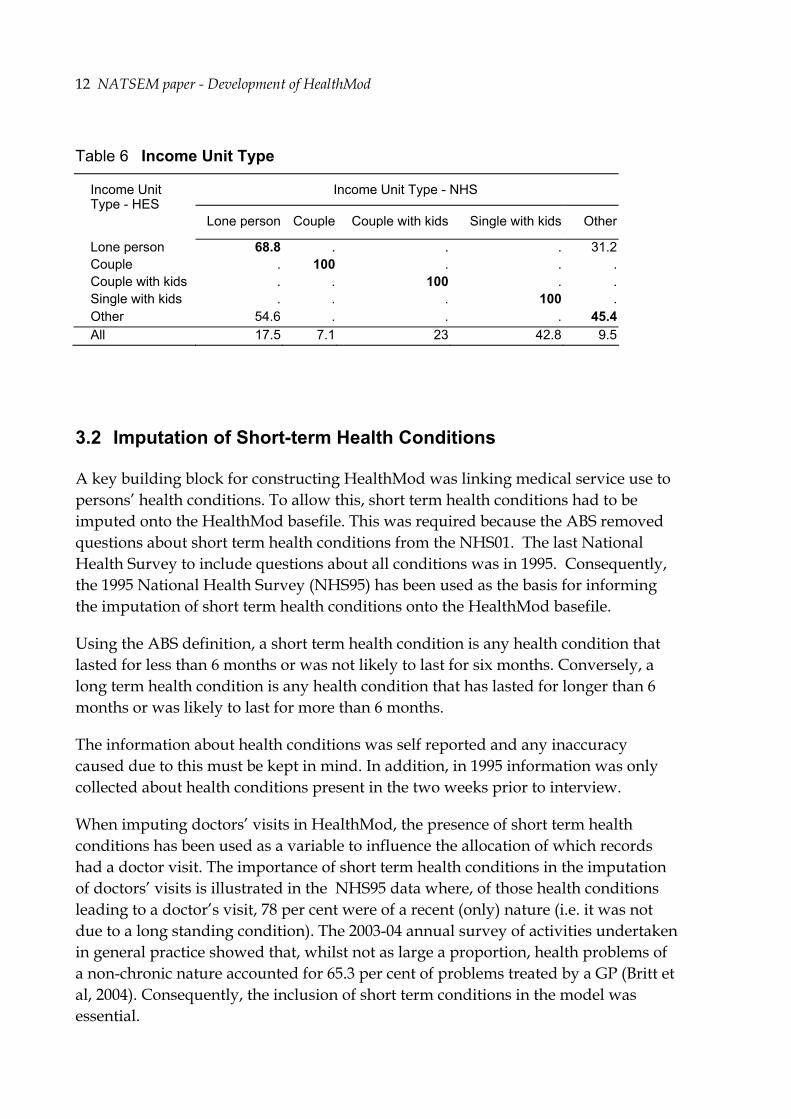
The matched file does not perform as well in linking the persons to households of the same number of residents, with a lower correlation of 0.75. However, most of the matched values are still within one category of the actual value (Table 5). In terms of income unit type, mismatching occurs, with lone person and ‘other’ income unit types the fact these two categories were not isolated from each other in the creation of the homogeneous groups.
Table 2 Age Group
Age Group (in years) - NHS Age Group (in years) -
HES 0-4 5-9 10-14 15-19 20-24 25-29 30-34 35-3940-44 45-4950-54 55-59 60-64 65-69 70-74 75+
0-4 79 18.6 2.4 . . . . . . . . . . . . .5-9 14.4 65.4 20.1 . . . . . . . . . . . . .10-14 4.6 17.7 77.7 . . . . . . . . . . . . .15-19 . . . 68 13.1 8.5 6.8 1.2 1.2 0.4 0.2 0.2 0.1 0.1 0.2 0.120-24 . . . 27.5 28.2 16.7 7.3 4.7 6.4 3.5 1.5 1.1 2.5 0.4 0.2 .25-29 . . . 7.6 15.2 33 22.2 4.8 3.8 4.4 3.2 2.2 1.7 2 0.1 .30-34 . . . 2 6.4 8.7 40.3 20.9 7.1 6.4 3.2 1.2 1.2 0.9 1.2 0.635-39 . . . 1.3 2.7 5.6 6.7 45.9 17.4 7.8 5.4 2.5 0.9 1.2 1.5 1.140-44 . . . 0.9 2 3.5 5 10.7 44.3 13.9 8.2 3.9 2.2 2.2 1.9 1.345-49 . . . 1.4 1.5 1.2 1.6 4.8 14 39.6 16.8 8.3 2.9 2.2 2.5 3.150-54 . . . 0.2 1 1 0.9 2.7 5.8 12.3 35.8 24 7.7 2.7 2.3 3.555-59 . . . 0.2 0.5 0.7 1 0.8 2 4.5 9.2 36 29.8 4.3 4.6 6.360-64 . . . . . 0.2 0.5 0.5 0.8 1.3 1.6 6.3 41.5 32.2 9.6 5.665-69 . . . . 0 . . 0.1 0.3 0.9 1.5 2.9 5.7 39.2 32.2 17.370-74 . . . . 0.1 0.1 0.1 0.1 0.2 1 2 3.3 4.5 2.8 47.5 38.575+ . . . . . . . 0.1 0.4 0.2 0.9 1.2 3.7 1.6 3.2 88.9
All 9.2 8.6 6.6 6.5 4.7 5.8 7.2 8 7.9 6.8 5.9 5.1 4.6 3.7 3.8 5.5

NATSEM paper - Development of HealthMod 11
Table 3 Equivalent Income Deciles
Equivalent Income decile - NHS Equivalent income decile - HES 1 2 3 4 5 6 7 8 9 10
1 68.1 17.6 13.9 0 0.1 0.1 0.2 . . . 2 21.2 43.8 34.8 . . 0.1 0.1 . . . 3 7.8 26.5 65.2 . . 0.3 0.3 . . . 4 . . . 38.3 22.2 28.3 11.1 . . . 5 . . . 17.1 31.8 22.9 28.2 . . . 6 . . . 14.1 17.1 39.5 29.3 . . . 7 . . . 2.8 9.2 16.7 71.2 . . . 8 . . . . . . . 67.8 30.3 2 9 . . . . . . . 18.9 47.2 33.9 10 . . . . . . . 12.9 24 63.1
Table 4 Income Unit Income Decile
Income Unit Income Decile - NHS Income Unit Income Decile - HES 1 2 3 4 5 6 7 8 9 10
1 84.3 6.8 6.2 2.5 0.2 0 . . . . 2 32.1 34.4 29.4 4 0.1 . . . . . 3 0.1 31 43.7 24 1.1 0.1 . . . . 4 0.8 5.9 21.5 60.5 10 1.1 0 . . . 5 0.4 1.4 9.9 41.6 43.9 2.6 0.1 . . . 6 0.1 0.1 2.3 18.6 43.3 34.7 0.9 0 0 . 7 . 0 2 2.6 4.9 29.6 36.8 9.3 7.6 7.1 8 . . 0.2 2 2.1 4.1 2.4 51.3 28.3 9.6 9 . . 0.1 1.8 1.7 2.4 0.9 1.7 71.2 20.1 10 . . 0 0.2 1.1 0.7 0.4 0.4 0.9 96.2 All 10.6 7.6 11.2 15.3 11.1 9.5 5.9 7 10.3 11.6
Table 5 Number of persons in household
Number of persons in household - NHS Number of persons in household - HES
1 2 3 4 5 6+
1 65.6 15.4 8.4 4.6 3.3 2.7 2 9.9 75.6 9.9 3.4 0.9 0.3 3 3.5 16.6 54.3 22.8 2.5 0.3 4 1.9 1.8 17 60.6 14.8 3.9 5 1.7 0.9 2.4 35.7 44 15.3 6+ 9 1.7 2.3 7.3 29.7 50 All 12.4 26.5 18.5 25.2 11.7 5.8
12 NATSEM paper - Development of HealthMod
Table 6 Income Unit Type
Income Unit Type - NHS Income Unit Type - HES
Lone person Couple Couple with kids Single with kids Other
Lone person 68.8 . . . 31.2 Couple . 100 . . . Couple with kids . . 100 . . Single with kids . . . 100 . Other 54.6 . . . 45.4 All 17.5 7.1 23 42.8 9.5
3.2 Imputation of Short-term Health Conditions
A key building block for constructing HealthMod was linking medical service use to persons’ health conditions. To allow this, short term health conditions had to be imputed onto the HealthMod basefile. This was required because the ABS removed questions about short term health conditions from the NHS01. The last National Health Survey to include questions about all conditions was in 1995. Consequently, the 1995 National Health Survey (NHS95) has been used as the basis for informing the imputation of short term health conditions onto the HealthMod basefile.
Using the ABS definition, a short term health condition is any health condition that lasted for less than 6 months or was not likely to last for six months. Conversely, a long term health condition is any health condition that has lasted for longer than 6 months or was likely to last for more than 6 months.
The information about health conditions was self reported and any inaccuracy caused due to this must be kept in mind. In addition, in 1995 information was only collected about health conditions present in the two weeks prior to interview.
When imputing doctors’ visits in HealthMod, the presence of short term health conditions has been used as a variable to influence the allocation of which records had a doctor visit. The importance of short term health conditions in the imputation of doctors’ visits is illustrated in the NHS95 data where, of those health conditions leading to a doctor’s visit, 78 per cent were of a recent (only) nature (i.e. it was not due to a long standing condition). The 2003-04 annual survey of activities undertaken in general practice showed that, whilst not as large a proportion, health problems of a non-chronic nature accounted for 65.3 per cent of problems treated by a GP (Britt et al, 2004). Consequently, the inclusion of short term conditions in the model was essential.

NATSEM paper - Development of HealthMod 13
Health Condition Groups
Health conditions identified in the national health surveys could be classified into over 100 different categories. However, this number of health condition groups stretched the effectiveness of the monte carlo simulation method used for the imputation. A higher level condition grouping, based on 26 groups, was therefore developed.
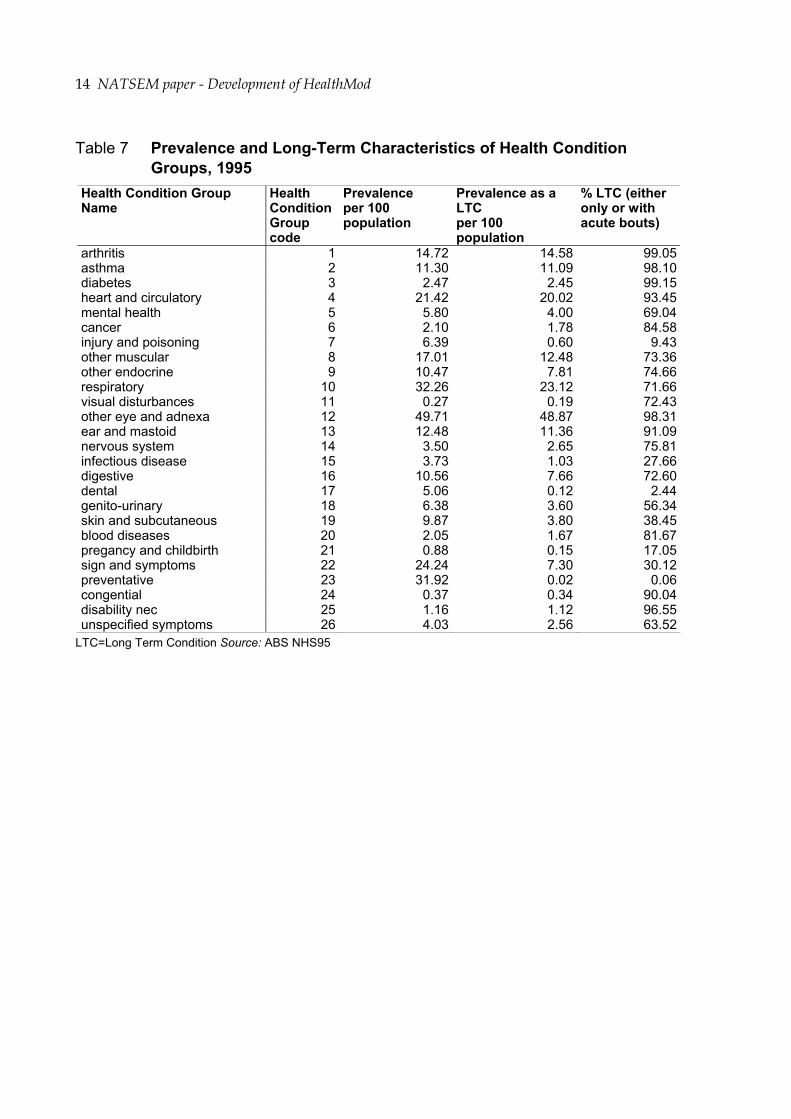
Not all of these groups necessarily included a short term component. The prevalence of the 26 groups, in NHS95, was examined (to determine if all groups needed to be imputed as short term health conditions). Health condition groups that were predominantly long term in nature (i.e. more than 95 per cent of the cases were long term in nature) were excluded, as well as conditions that were rare (i.e. less than 1 per cent). Table 7 shows that the condition groups arthritis, asthma, diabetes, other eye and adnexa and disability nec. are all predominately long term health conditions. It was felt that the exclusion of these conditions from the short term health conditions imputation would not lead to a significant loss of information and accuracy in our model.
Table 7 also shows that injury and poisoning, infectious disease, signs and symptoms, skin and subcutaneous diseases groups have significant proportions that are short term in nature. The inclusion of these health condition groups was essential in the imputation process. The prevalences of the health condition groups: visual disturbances, pregnancy complications and childbirth and congenital conditions; were less than 1%. As such, the inclusion of these health conditions in the short term health condition imputation was most probably unnecessary. However, there was a need to separately include an imputation of pregnant women in the model. These women were highly likely to visit a doctor, and regularly so, during their pregnancy. Pregnancy also has significant implications with regard to the use of imaging, pathology, hospital and pharmaceutical services for women in the 18-45 year age group. Most pregnant women were likely to have at least one hospital visit, use imaging services and were highly unlikely to be taking most prescription medications.
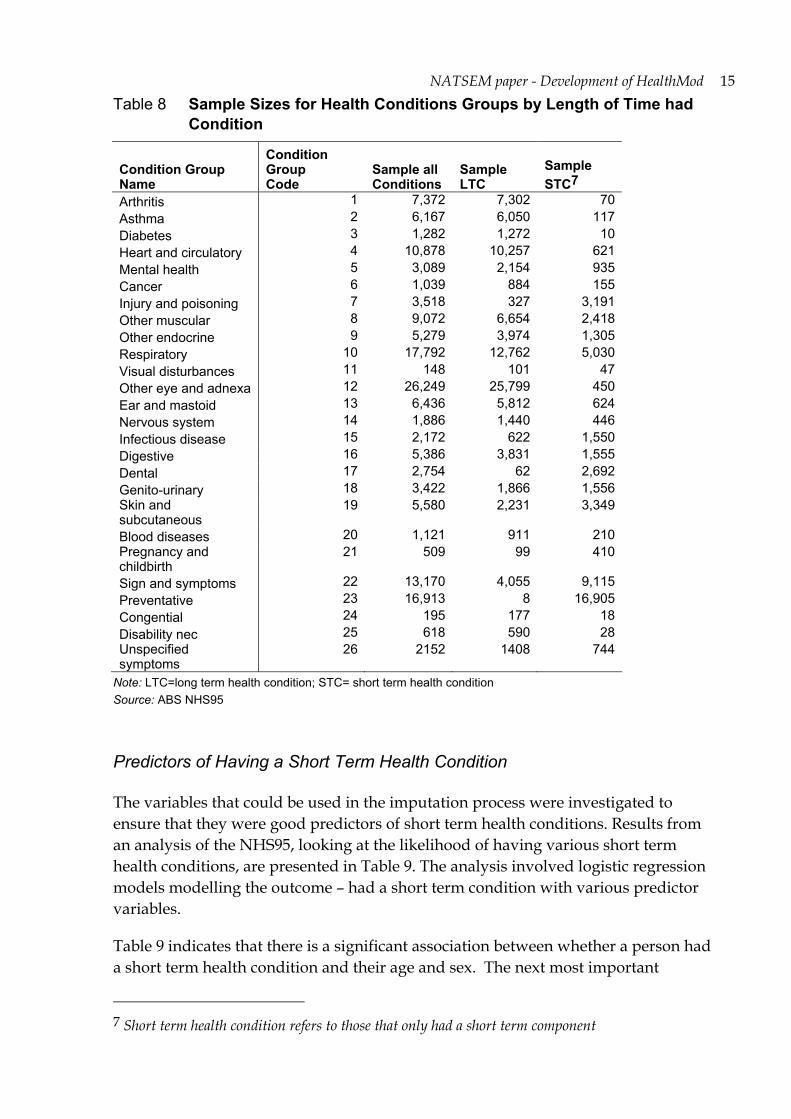
For modelling, it was of concern whether the survey sample size in each of the condition types was sufficient to allow reliable imputation. As Table 8 shows there were insufficient records available (i.e. less than 150 records) for the condition groups: arthritis, asthma, diabetes, visual disturbances, congenital and disability nec.
To give a representation of the 2001 world —and in the absence of any other information — the prevalence of the short term health conditions were up-rated to 2001, based on age-sex specific rates of change observed in the long term elements of conditions.
14 NATSEM paper - Development of HealthMod
Table 7 Prevalence and Long-Term Characteristics of Health Condition Groups, 1995
Health Condition Group Name
Health Condition Group code
Prevalence per 100 population
Prevalence as a LTC per 100 population
% LTC (either only or with acute bouts)
arthritis 1 14.72 14.58 99.05asthma 2 11.30 11.09 98.10diabetes 3 2.47 2.45 99.15heart and circulatory 4 21.42 20.02 93.45mental health 5 5.80 4.00 69.04cancer 6 2.10 1.78 84.58injury and poisoning 7 6.39 0.60 9.43other muscular 8 17.01 12.48 73.36other endocrine 9 10.47 7.81 74.66respiratory 10 32.26 23.12 71.66visual disturbances 11 0.27 0.19 72.43other eye and adnexa 12 49.71 48.87 98.31ear and mastoid 13 12.48 11.36 91.09nervous system 14 3.50 2.65 75.81infectious disease 15 3.73 1.03 27.66digestive 16 10.56 7.66 72.60dental 17 5.06 0.12 2.44genito-urinary 18 6.38 3.60 56.34skin and subcutaneous 19 9.87 3.80 38.45blood diseases 20 2.05 1.67 81.67pregancy and childbirth 21 0.88 0.15 17.05sign and symptoms 22 24.24 7.30 30.12preventative 23 31.92 0.02 0.06congential 24 0.37 0.34 90.04disability nec 25 1.16 1.12 96.55unspecified symptoms 26 4.03 2.56 63.52
LTC=Long Term Condition Source: ABS NHS95
NATSEM paper - Development of HealthMod 15
Table 8 Sample Sizes for Health Conditions Groups by Length of Time had Condition
Condition Group Name
Condition Group Code
Sample all Conditions
Sample LTC
Sample STC7
Arthritis 1 7,372 7,302 70 Asthma 2 6,167 6,050 117 Diabetes 3 1,282 1,272 10 Heart and circulatory 4 10,878 10,257 621 Mental health 5 3,089 2,154 935 Cancer 6 1,039 884 155 Injury and poisoning 7 3,518 327 3,191 Other muscular 8 9,072 6,654 2,418 Other endocrine 9 5,279 3,974 1,305 Respiratory 10 17,792 12,762 5,030 Visual disturbances 11 148 101 47 Other eye and adnexa 12 26,249 25,799 450 Ear and mastoid 13 6,436 5,812 624 Nervous system 14 1,886 1,440 446 Infectious disease 15 2,172 622 1,550 Digestive 16 5,386 3,831 1,555 Dental 17 2,754 62 2,692 Genito-urinary 18 3,422 1,866 1,556 Skin and subcutaneous
19 5,580 2,231 3,349
Blood diseases 20 1,121 911 210 Pregnancy and childbirth
21 509 99 410
Sign and symptoms 22 13,170 4,055 9,115 Preventative 23 16,913 8 16,905 Congential 24 195 177 18 Disability nec 25 618 590 28 Unspecified symptoms
26 2152 1408 744
Note: LTC=long term health condition; STC= short term health condition Source: ABS NHS95
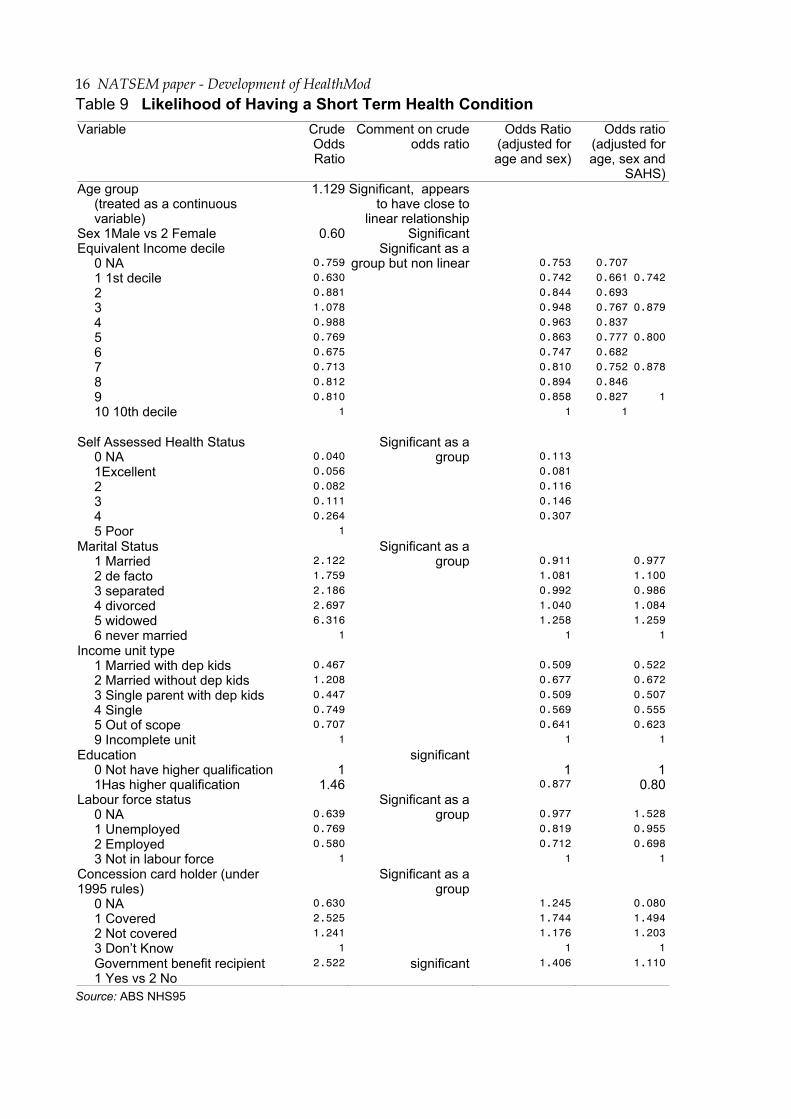
Predictors of Having a Short Term Health Condition
The variables that could be used in the imputation process were investigated to ensure that they were good predictors of short term health conditions. Results from an analysis of the NHS95, looking at the likelihood of having various short term health conditions, are presented in Table 9. The analysis involved logistic regression models modelling the outcome – had a short term condition with various predictor variables.
Table 9 indicates that there is a significant association between whether a person had a short term health condition and their age and sex. The next most important
7 Short term health condition refers to those that only had a short term component
16 NATSEM paper - Development of HealthMod
Table 9 Likelihood of Having a Short Term Health Condition Variable Crude
Odds Ratio
Comment on crude odds ratio
Odds Ratio (adjusted for age and sex)
Odds ratio (adjusted for age, sex and
SAHS)Age group
(treated as a continuous variable)
1.129 Significant, appears to have close to
linear relationship
Sex 1Male vs 2 Female 0.60 Significant Equivalent Income decile
0 NA 1 1st decile 2 3 4 5 6 7 8 9 10 10th decile
0.759 0.630 0.881 1.078 0.988 0.769 0.675 0.713 0.812 0.810
1
Significant as a group but non linear
0.753 0.742 0.844 0.948 0.963 0.863 0.747 0.810 0.894 0.858
1
0.707 0.661 0.693 0.767 0.837 0.777 0.682 0.752 0.846 0.827
1
0.742
0.879
0.800
0.878
1
Self Assessed Health Status 0 NA 1Excellent 2 3 4 5 Poor
0.040 0.056 0.082 0.111 0.264
1
Significant as a group
0.113 0.081 0.116 0.146 0.307
Marital Status 1 Married 2 de facto 3 separated 4 divorced 5 widowed 6 never married
2.122 1.759 2.186 2.697 6.316
1
Significant as a group
0.911 1.081 0.992 1.040 1.258
1
0.977 1.100 0.986 1.084 1.259
1 Income unit type
1 Married with dep kids 2 Married without dep kids 3 Single parent with dep kids 4 Single 5 Out of scope 9 Incomplete unit
0.467 1.208 0.447 0.749 0.707
1
0.509 0.677 0.509 0.569 0.641
1
0.522 0.672 0.507 0.555 0.623
1Education
0 Not have higher qualification 1Has higher qualification
11.46
significant 1
0.877 1
0.80Labour force status
0 NA 1 Unemployed 2 Employed 3 Not in labour force
0.639 0.769 0.580
1
Significant as a group
0.977 0.819 0.712
1
1.528 0.955 0.698
1Concession card holder (under 1995 rules)
0 NA 1 Covered 2 Not covered 3 Don’t Know
0.630 2.525 1.241
1
Significant as a group
1.245 1.744 1.176
1
0.080 1.494 1.203
1Government benefit recipient 1 Yes vs 2 No
2.522 significant 1.406 1.110
Source: ABS NHS95
NATSEM paper - Development of HealthMod 17
predictor after adjusting for age and sex was self assessed health status. These results confirmed our use of age, sex and self assessed health status as key predictors of having a short term health condition. A monte carlo process of random allocation was used in selecting the records to have short term health conditions, the probabilities being based on the person’s age group, gender and self assessed health status.
These results confirmed our use of age, sex and self assessed health status as key predictors of having a short term health condition. We have previously used equivalent income as a predictor in the modelling as well. It was not significant predictor of having a short term health condition after adjusting for age sex and self assessed health status. Potentially, we could have used variables such as marital status, income unit type, education, card holder status, government benefit recipient status or labour force status in the model as they were all significant predictors of having a short term health condition.
The potential use of a variety of these variables was tested when we explored the use of separate logistic regression models to determine probabilities of having a condition. For each short term health condition, an individual logistic regression model was developed aiming to achieve the best prediction properties. Various combinations of variables were tested for significance; higher order interaction terms were trialled and Hosmer-Lemeshow goodness-of-fit test was used for the final decision on the model to use. This leads to a very complex method of imputing the short term conditions that was not found to produce better results than the simpler imputation method.
In summary, the approach taken was to analyse univariate models, followed by multivariate models, use of separate models for each of the 26 conditions, and then after evaluation, returning to a generic model applied to all conditions. To annualise short term health conditions, a fortnightly imputation of conditions was carried out 26 times to represent the full year.
Validation
Three aspects of the imputation of short term conditions were considered in validation: the replication of the target condition prevalence in the model; the replication of the age-sex distribution of those with the various conditions and the replication of the distribution of the number of conditions experienced by a person. In general, the model slightly underestimated the prevalence of short term health conditions. In terms of comparing the demographic profile of those who were allocated to have various conditions to the demographic profile of the NHS95, only two condition groups (injury and poisoning and preventative) did not perform
18 NATSEM paper - Development of HealthMod
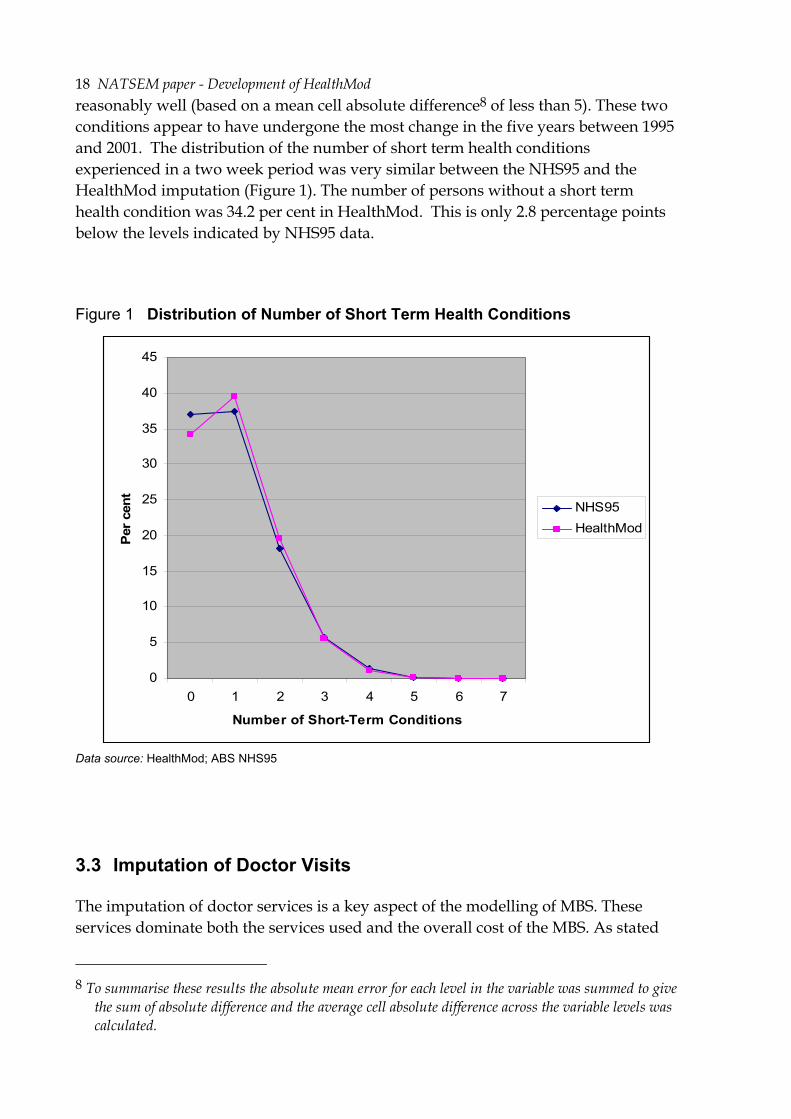
reasonably well (based on a mean cell absolute difference8 of less than 5). These two conditions appear to have undergone the most change in the five years between 1995 and 2001. The distribution of the number of short term health conditions experienced in a two week period was very similar between the NHS95 and the HealthMod imputation (Figure 1). The number of persons without a short term health condition was 34.2 per cent in HealthMod. This is only 2.8 percentage points below the levels indicated by NHS95 data.
Figure 1 Distribution of Number of Short Term Health Conditions
0
5
10
15
20
25
30
35
40
45
0 1 2 3 4 5 6 7
Number of Short-Term Conditions
Per c
ent
NHS95HealthMod
Data source: HealthMod; ABS NHS95
3.3 Imputation of Doctor Visits
The imputation of doctor services is a key aspect of the modelling of MBS. These services dominate both the services used and the overall cost of the MBS. As stated
8 To summarise these results the absolute mean error for each level in the variable was summed to give
the sum of absolute difference and the average cell absolute difference across the variable levels was calculated.
NATSEM paper - Development of HealthMod 19
above, short term health conditions have been used as predictive variables in the imputation of having a doctor’s visit, as well as in the imputation of the number of visits to a doctor the person will have in a two week period.
A summary of the current methodology for imputing visits to doctors and their costs within a two-week window is as follows:
1. Determine the probability of a person having a doctor’s visit based on the condition/s they had, as well as their income, age group and sex. Monte carlo simulation is used to allocate whether a record had a doctor’s visit in a two week time period. Seasonality was imposed by scaling the probabilities of having a doctor’s visit based on the monthly fluctuations in Medicare Australia data (averaged over 3 years 2001-2003).
2. Determine primary health condition leading to a doctor’s visit. A cumulative probability distribution was created based on the conditions allocated to the person and the likelihood of having that health condition. A monte carlo simulation was used to allocate which condition the person had that was the primary reason for a doctor’s visit in the two week window.
3. Determine the distribution of the number of doctor visits amongst those who had a doctors’ visit (from 1 to 10), based on the condition that was the primary reason of a doctor’s visit in the last two weeks, income group, age group and sex of the record (from NHS95).
4. Allocate the doctors’ visits to being GP or specialist using a logistic regression model where age, income, self assessed health status and number of long term health conditions were the predictor variables. This model was determined from NHS01.
5. Allocate doctors’ visits to a Broad Type of Service (BTOS) category based on GP/other, age and sex. Probabilities are determined from Medicare Australia data.
6. Allocate the doctors’ visits to either bulk billed or not based on GP/other, BTOS, age and sex (each year will have to be individually constrained as there was a trend of decreasing bulk billing in some of the key BTOS categories)
7. Align services against Medicare Australia administrative data.
8. Cost services, allocating an average cost based on the age and sex of the persons as well BTOS, if the service was bulk billed or not and if the service was provided by a GP or not. The total annual cost is the sum of the costs.
9. Align costs against Medicare Australia administrative data.
20 NATSEM paper - Development of HealthMod
10. Repeat the steps 26 times to annualise doctor visits.
The imputation of two types of doctors’ services is problematic: obstetric visits, and radiotherapy and therapeutic nuclear medicine. These services can only be allocated to records with a particular condition. Consequently, more care was required in the allocation to the correct type of record and also ensuring the correct numbers of people across the year were receiving the service so that the average number of services per person was within reasonable tolerances.
The allocation of radiotherapy and nuclear medicine services was limited to those patients with cancer. Since 99 per cent of these services are provided by a specialist medical practitioner, all these services were deemed to have been provided by a specialist.
The allocation of obstetric visits has been carried out as a separate process to the general allocation of doctor services. The first stage in the allocation of obstetric visits was to identify women who gave birth in 2001 and 2002. The two years are required as some women pregnant in 2001 will not give birth till 2002. The target was to have approximately 242,000 confinements in 2001. This was based on the number of registered births (246,400) then factoring for the number of pregnancies that result in multiple births. The age of the woman was used to condition the probability of being pregnant, as was information obtained from the NHS01 about their reproductive history (e.g. hysterectomies, infertility etc) to determine women in reproductive age group who could not be pregnant as well as women who had responded in the NHS01 such that it was clear they were pregnant during 2001.
Having allocated confinements, this information was used to determine when women were pregnant. It was assumed that women were pregnant for the 8 months prior to the month of birth as well as in the month they gave birth. Women receiving specific obstetric services through the MBS were then allocated. The initial allocation used the assumption that women who have concessional cards are more likely to use either hospital services, midwives or visit a general practitioner. Obstetric services were then allocated based on the number of months in the year the woman was pregnant for and also the stage of her pregnancy (i.e. women in the last months of their pregnancy received more services than women in their first trimester)
Model Results
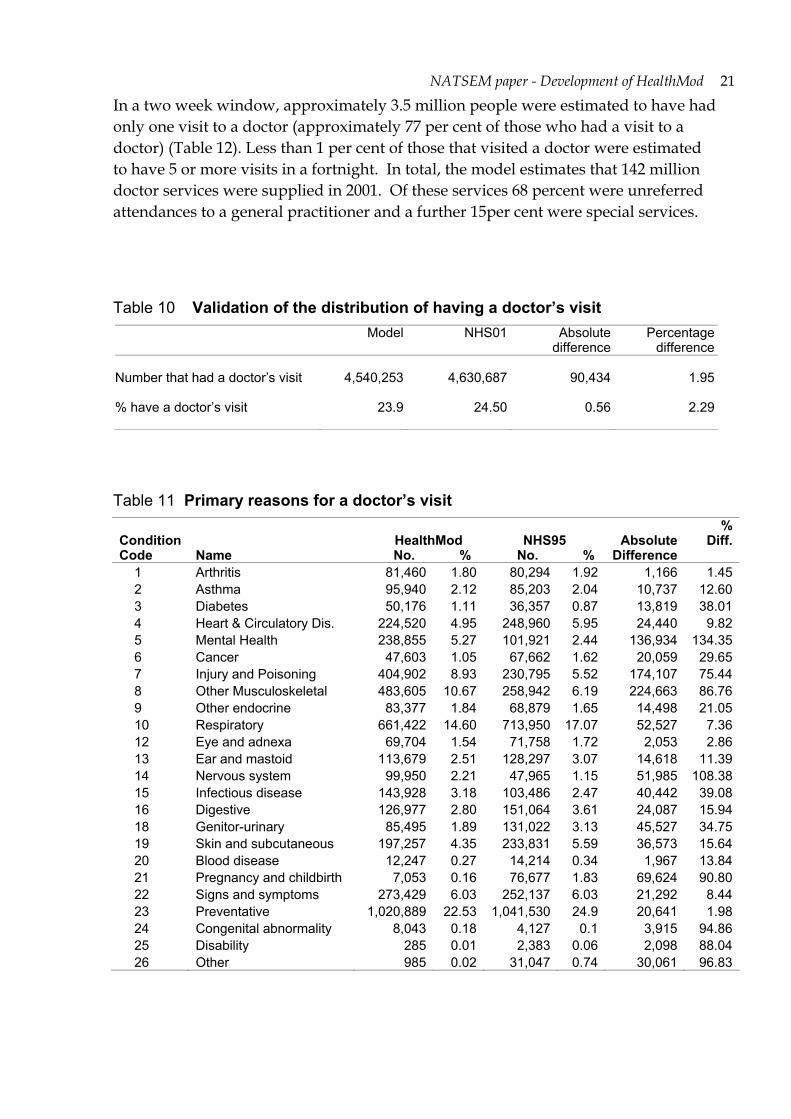
Overall, the model estimates that in any two week window approximately 4.5 million (24 per cent) of Australians visited a doctor (Table 10). This was within 2 per cnet of the number enumerated in the 2001 NHS. The main reason allocated for the last visit to a doctor was preventative (1 million, 22.5 per cent), followed by respiratory conditions (660,000; 14.6 per cent) and other musculoskeletal conditions (480,000; 10.7 per cent) (Table 11).
NATSEM paper - Development of HealthMod 21
In a two week window, approximately 3.5 million people were estimated to have had only one visit to a doctor (approximately 77 per cent of those who had a visit to a doctor) (Table 12). Less than 1 per cent of those that visited a doctor were estimated to have 5 or more visits in a fortnight. In total, the model estimates that 142 million doctor services were supplied in 2001. Of these services 68 percent were unreferred attendances to a general practitioner and a further 15per cent were special services.
Table 10 Validation of the distribution of having a doctor’s visit Model NHS01 Absolute
difference Percentage
difference Number that had a doctor’s visit 4,540,253 4,630,687 90,434 1.95 % have a doctor’s visit 23.9 24.50 0.56 2.29
Table 11 Primary reasons for a doctor’s visit
Condition Code Name
HealthMod No. %
NHS95 No. %
Absolute Difference
% Diff.
1 Arthritis 81,460 1.80 80,294 1.92 1,166 1.452 Asthma 95,940 2.12 85,203 2.04 10,737 12.603 Diabetes 50,176 1.11 36,357 0.87 13,819 38.014 Heart & Circulatory Dis. 224,520 4.95 248,960 5.95 24,440 9.825 Mental Health 238,855 5.27 101,921 2.44 136,934 134.356 Cancer 47,603 1.05 67,662 1.62 20,059 29.657 Injury and Poisoning 404,902 8.93 230,795 5.52 174,107 75.448 Other Musculoskeletal 483,605 10.67 258,942 6.19 224,663 86.769 Other endocrine 83,377 1.84 68,879 1.65 14,498 21.0510 Respiratory 661,422 14.60 713,950 17.07 52,527 7.3612 Eye and adnexa 69,704 1.54 71,758 1.72 2,053 2.8613 Ear and mastoid 113,679 2.51 128,297 3.07 14,618 11.3914 Nervous system 99,950 2.21 47,965 1.15 51,985 108.3815 Infectious disease 143,928 3.18 103,486 2.47 40,442 39.0816 Digestive 126,977 2.80 151,064 3.61 24,087 15.9418 Genitor-urinary 85,495 1.89 131,022 3.13 45,527 34.7519 Skin and subcutaneous 197,257 4.35 233,831 5.59 36,573 15.6420 Blood disease 12,247 0.27 14,214 0.34 1,967 13.8421 Pregnancy and childbirth 7,053 0.16 76,677 1.83 69,624 90.8022 Signs and symptoms 273,429 6.03 252,137 6.03 21,292 8.4423 Preventative 1,020,889 22.53 1,041,530 24.9 20,641 1.9824 Congenital abnormality 8,043 0.18 4,127 0.1 3,915 94.8625 Disability 285 0.01 2,383 0.06 2,098 88.0426 Other 985 0.02 31,047 0.74 30,061 96.83

22 NATSEM paper - Development of HealthMod
Table 12 Distribution of frequency of a doctor’s visit
Frequency of Doctor's Visit
HealthMod No. %
NHS95 No. %
Absolute Difference
% Diff.
1 3,511,656 77.34 3,231,795 76.83 279,861 8.66 2 822,804 18.12 732,739 17.42 90,064 12.29 3 142,778 3.14 144,020 3.42 1,242 0.86 4 48,854 1.08 60,825 1.45 11,971 19.68 5 9,861 0.22 17,051 0.41 7,190 42.17 6 731 0.02 7,735 0.18 7,004 90.55 7 2,317 0.05 5,620 0.13 3,303 58.77 8 0 0 281 0.01 281 100.00 9 and over 1,252 0.02 6,507 0.15 5,256 80.77
Table 13 Total doctors services, by service type, 2001 (Preliminary Results)
BTOS Name Medicare
Aust. HealthModAbsolute
Difference %
Difference0101 Unreferred attendances -VR GP 91,952,523 102,955,525 -11,003,002 -11.97
0102 Unreferred attendances - enhanced primary care 323,056 467,682 - 144,626 -44.77
0103 Unreferred attendances - other 8,059,031 7,973,377 85,654 1.06 0200 Specialist attendances 19,656,169 16,307,890 3,348,279 17.03 0300 Obstetrics 1,470,160 1,470,204 44 < 0.010400 Anaesthetics 2,140,921 1,661,908 479,013 22.37 0700 Operations 6,039,494 5,720,388 319,106 5.28 0800 Assistance at operations 279,281 241,815 37,466 13.42 1000 Radiotherapy and therapeutic
nuclear medicine 642,033 813,546 -171,513
-26.71
1100 Miscellaneous 5,525,245 4,601,105 924,140 16.73 Total
134,617,753 142,213,440 -7,595,687 -5.64
Costing of doctor services
The initial step towards costing of doctors’ services was the allocation of whether the services were bulk billed or not. The services that are bulk billed have the same charge and benefit. Bulk billing was randomly allocated based on the type of service and whether the service was provided by a general practitioner. For obstetric services the bulk billing of services was also conditioned by the age of the woman.
Costing of obstetric doctor services was trialled to see if the methodology for attaching cost of services was appropriate. Obstetrics was chosen for this initial trial as it had one of the best outcomes with regard to validation of number of services provided and the number of people receiving these services. Administrative data
NATSEM paper - Development of HealthMod 23
from Medicare Australia was used in the determination of costs of services. The average rates charged for the type of service based on whether it was provided by a GP or specialist, and whether the service was bulk billed or not, were attached to the records of women who have used the service. The total charge to a record is simply the number of services multiplied by the average cost per service.
Data on the benefit received for services as supplied by Medicare Australia was the average across those that were and were not receiving the Medicare safety net. Thus, consideration needs to be given to possible adjustments to ensure that those on safety net receive more benefit and those not on safety net receive less benefit before the final benefit received by those that used the service is attributed..
Finally, out of pocket cost is then simply the difference between the rate charged and the benefit received.
At the moment the results from this process look reasonable, with HealthMod producing estimates for total charges for obstetric service (excluding hospital services) within 10 per cent of the Medicare Australia expenditure target. The next step is to roll-out this methodology to the other service types.
4 Conclusions
Microsimulation modelling of the health sector is exceptionally challenging – in part because of the complexity of the system but also because of the limitations with data availability and quality. Three main steps were taken to overcome the 2001 NHS survey limitations as the main base file for HealthMod.
For the purposes of the HealthMod project, it was important to enhance the NHS01 basefile to include family structure. This is to allow the modelling of policy issues, such as safety net thresholds, which are measured at the family level not the person level. To achieve this enhancement, statistical matching has been used. The quality of the matching is dependent on the variables constrained in the matching process. These variables need to reflect the aim of the matching - for HealthMod the emphasis moved to focussing on trying to get family structure in terms of income unit type and income levels as close as possible. The statistical matching allowed the retention of the health information available on NHS 2001, whilst borrowing the family structure from another survey. The synthetic families created through the statistical matching are of a sufficient quality to provide confidence in the income unit level analyses.
The results from the validation of short term health conditions indicate that these are being adequately represented on HealthMod in comparison to the National Health Survey. There are no alternative data sources to allow external benchmarking. Because the pattern of visits to a doctor are based on health conditions (both long

24 NATSEM paper - Development of HealthMod
term and short term), as well as socio-economic factors, it was important to ensure the imputation of short term health conditions was reliable. This appears to have been achieved. The estimates on doctor visits produced by HealthMod approximate the distributions within the earlier 1995 National Health Survey and administrative data from Medicare Australia. More recently, in order to refine the costing and improve the potential to estimate the MBS safety net, further steps have been introduced into the imputation of doctor visits. For example, prior to determining bulk billing, services are identified as either being provided in or out of hospital.
In conclusion, the application of the methods outlined above and use of complementary data sets have significantly improved the usefulness of the 2001 NHS as a basefile for HealthMod. This has enabled improved modelling of the Australian Medicare system, a key policy platform for ensuring all Australians have access to free or low cost health services.

NATSEM paper - Development of HealthMod 25
References
Australian Bureau of Statistics 2003, National Health Survey: User’s Guide, 2001, Catalogue No. 4363.0.55.001, Canberra.
Australian Department of Health and Ageing (DHA), May 2006, Medicare Benefits Schedule @ http://www9.health.gov.au/mbs/
Biggs, A., 2004 (update on 2003), Medicare Background Brief, Australian Parliamentary Library Current Issues E-Brief @ www.aph.gov.au/library/intguide/SP/medicare.htm
Britt H, Miller GC, Know S, Charles J, Valenti L, Pan Y, Henderson J, Bayram C, O’Halloran J, Ng A 2004 General Practice Activity in Australia 2003-04 AIHW Cat. No. GEP16 Canberra: Australian Institute of Health and Welfare (General Practice Series No. 16)
Brown, L, A Abello, B Phillips and A Harding 2004, Moving Towards an Improved Micro-Simulation Model of the Australian Pharmaceutical Benefits Scheme, Australian Economic Review, vol 37:1, pp. 41-61.
Cohen, M. 1991, ‘Statistical matching and microsimulation models’ in Citro, C.F. and Hanushek, E.A. (eds), The Uses of Microsimulation Modelling, Review and Recommendations, Vol 1, National Academy Press, Washington
Medicare Australia, 2006, website @ www.medicareaustralia.gov.au
Moriarty, C., and Scheuren, F., 2001, 'Statistical Matching: Pitfalls of Current Procedures', in Proceedings of the Annual Meeting of the American Statistical Association, August 5-9, 2001.
Radner, D. B., Allen, R., Gonzalez, M. E., Jabine, T. B., and Muller, H. J. 1980, "Report on Exact and Statistical Matching Techniques," Statistical Policy Working Paper 5, U.S. Government Printing Office.
Rassler, Susanne, 2002. Statistical Matching: A Frequentist Theory, Practical Applications, and Alternative Bayesian Approaches, Springer-Verlag.
Rodgers, W., 1984, An Evaluation of Statistical Matching, Journal of Business and Economic Statistics, Vol. 2, No. 1, January 1984.
Taylor, R., Gomulka, J. and Sutherland, H. 2000, Creating Order out of Chaos? Identifying Homogeneous Groups of Households Across Multiple Datasets, Paper presented at the 26th General Conference of the International Association for Research in Income and Wealth, Cracow, Poland, 27 August to 2 September.
Technical Working Group ABS-NATSEM Collaboration on Statistical Matching 2004, Statistical Matching of the HES and NHS: An Exploration of Issues in the Use of Unconstrained and Constrained Approaches in Creating a Basefile for a Microsimulation Model of the Pharmaceutical Benefits Scheme, ABS Methodology Advisory Committee Paper, June 2004.