final exam review!!!!!. experimental design random sampling stratified sampling convenience sampling...
TRANSCRIPT
AP StatisticsFinal Exam Review!!!!!
Experimental DesignRandom SamplingStratified SamplingConvenience SamplingCluster SamplingSystematic SamplingMultistage SamplingCensus etc…………
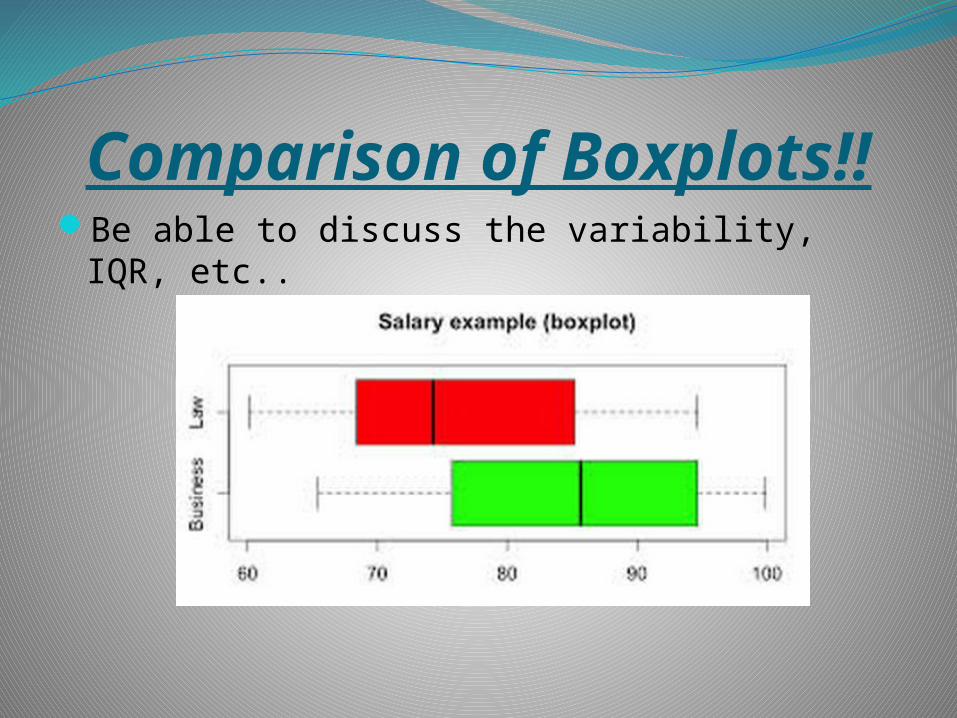
Comparison of Boxplots!!Be able to discuss the variability, IQR, etc..
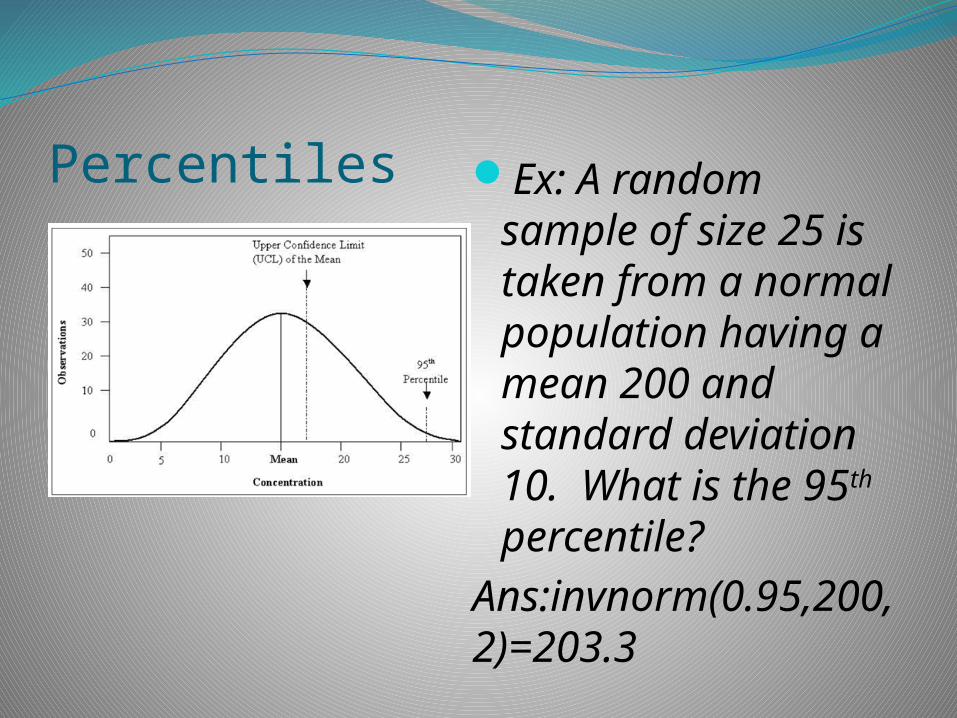
Percentiles Ex: A random sample of size 25 is taken from a normal population having a mean 200 and standard deviation 10. What is the 95th percentile?
Ans:invnorm(0.95,200,2)=203.3
Probability!!Formulas:P(A and B)=P(A)P(B) If they are independentP(A or B)=P(A) + P(B) If they are mutually exclusive
OR
P(A or B)=P(A) + P(B)- P(A and B) if they have two events in common!!
P(AІB)= P(A and B)/ P(B)
Probability Examples
Ex 1: The probability I like Pretzels is .45. The probability I likes Bagels is .25. The probability I like Pretzels and Bagels is .35. Are these 2 events independent?
Is P(P and B)=P(P)*P(B)? 0.35 ≠ (0.45)(0.25)
Therefore they are not independent!
Ex 2: The probability that I play volleyball on Tuesday is 0.9. The probability that I play volleyball and go running on Tuesday is 0.6. What is the probability I went running, given that I went to volleyball?
P(R|V)= 0.6/0.9=0.6667
Venn Diagram
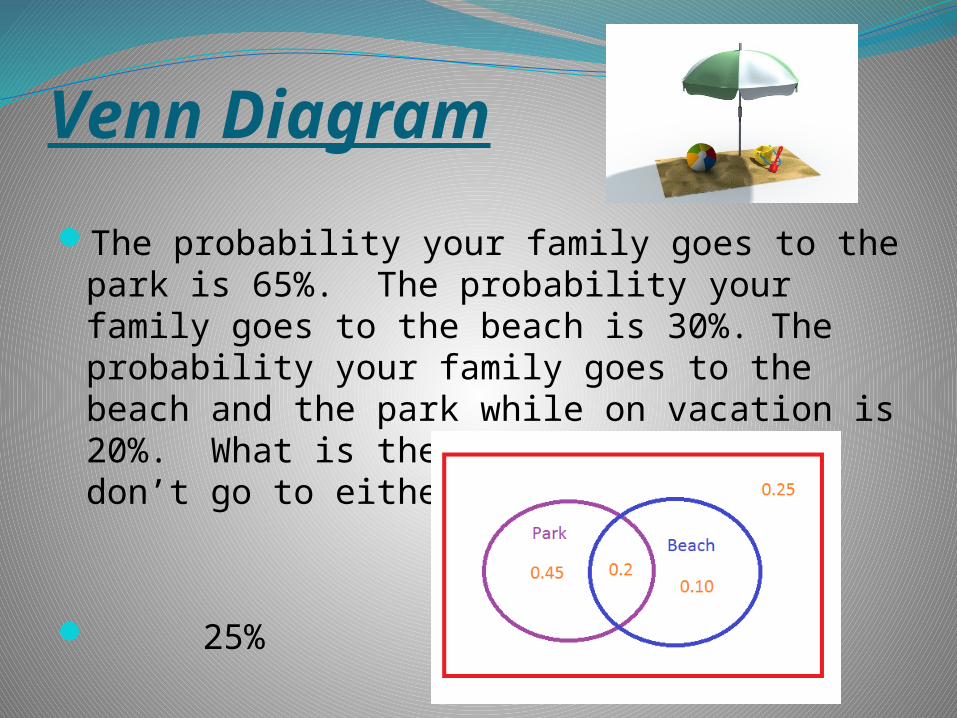
The probability your family goes to the park is 65%. The probability your family goes to the beach is 30%. The probability your family goes to the beach and the park while on vacation is 20%. What is the probability they don’t go to either?
25%
Mean and Standard Deviation of Independent Events
The mean amount of calories in a cup of cereal is 200 calories with a standard deviation of 20. The mean amount of calories in a cup of milk is 100 calories with a standard deviation of 10.
What is the mean and standard deviation of the amount of calories if you pour one cup of cereal and one cup of milk.
=
Error in a Significance TestType I: (α) -Reject H₀ when in fact H₀ is true.
Type II: (β) -Accept H₀, when in fact Ha is true.
** Remember to define and also state in terms of the problem
Increase Power????? Increase you sample size!!!!!!!
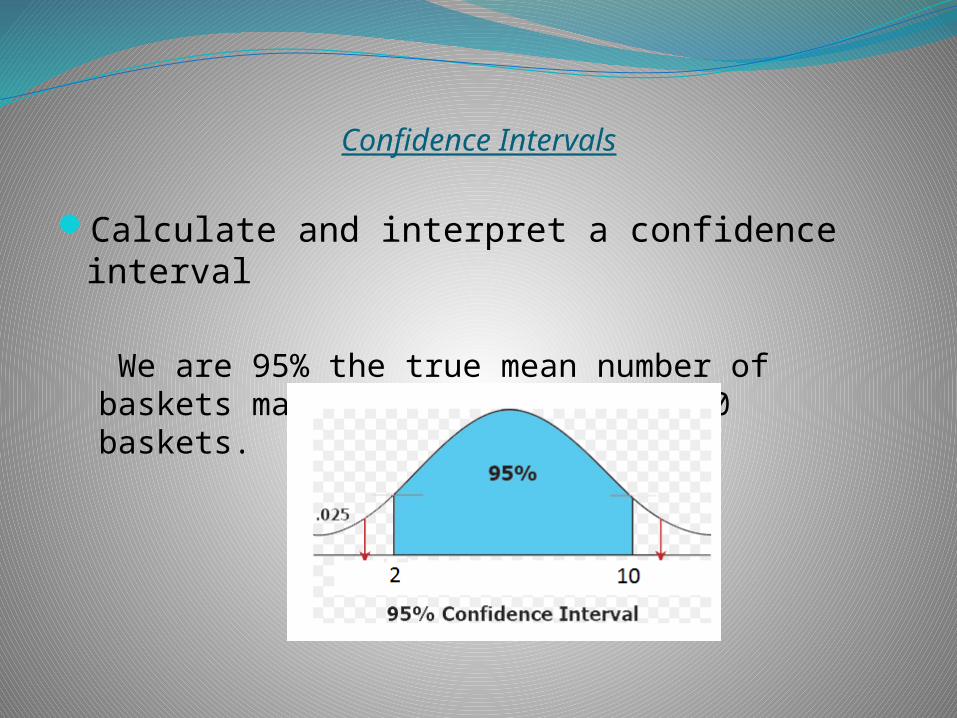
Confidence Intervals
Calculate and interpret a confidence interval
We are 95% the true mean number of baskets made was between 2 and 10 baskets.
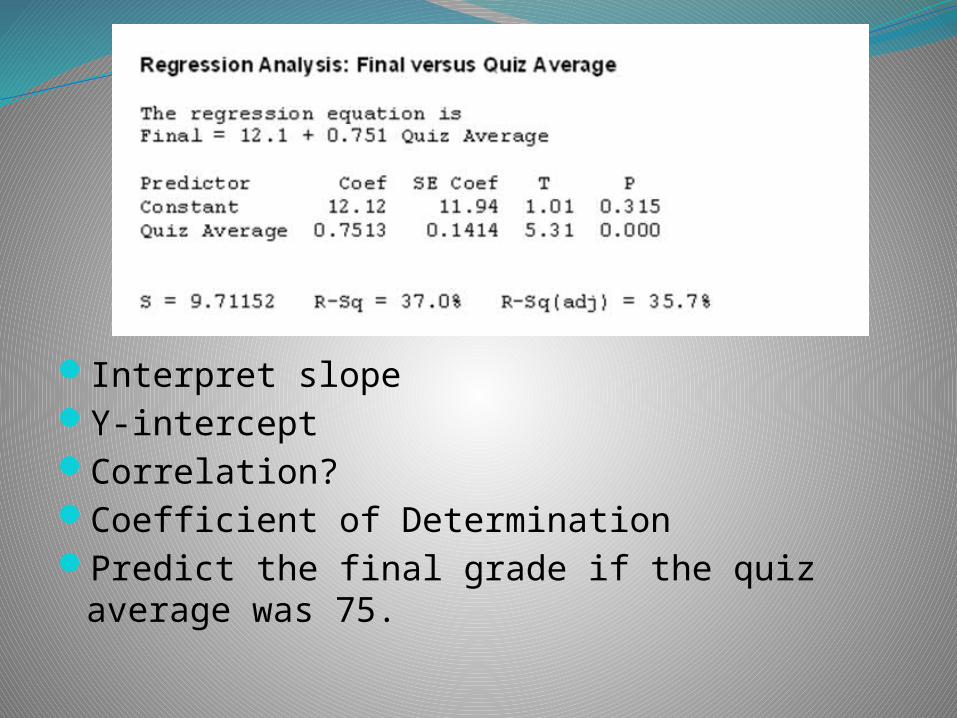
Interpret slopeY-interceptCorrelation?Coefficient of DeterminationPredict the final grade if the quiz average
was 75.
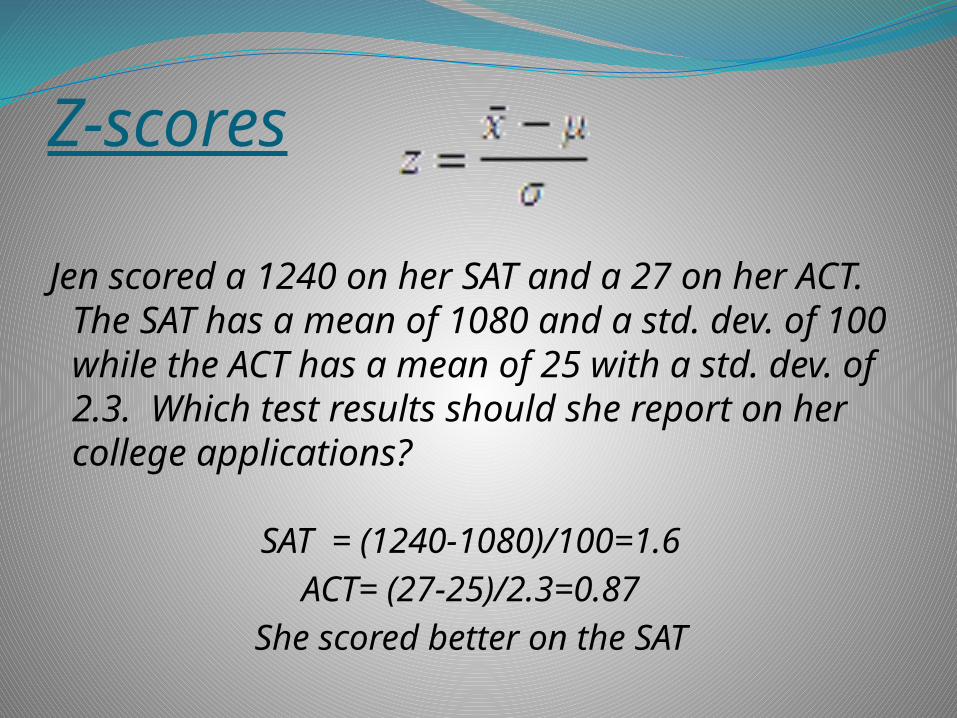
Z-scores
Jen scored a 1240 on her SAT and a 27 on her ACT. The SAT has a mean of 1080 and a std. dev. of 100 while the ACT has a mean of 25 with a std. dev. of 2.3. Which test results should she report on her college applications?
SAT = (1240-1080)/100=1.6ACT= (27-25)/2.3=0.87
She scored better on the SAT
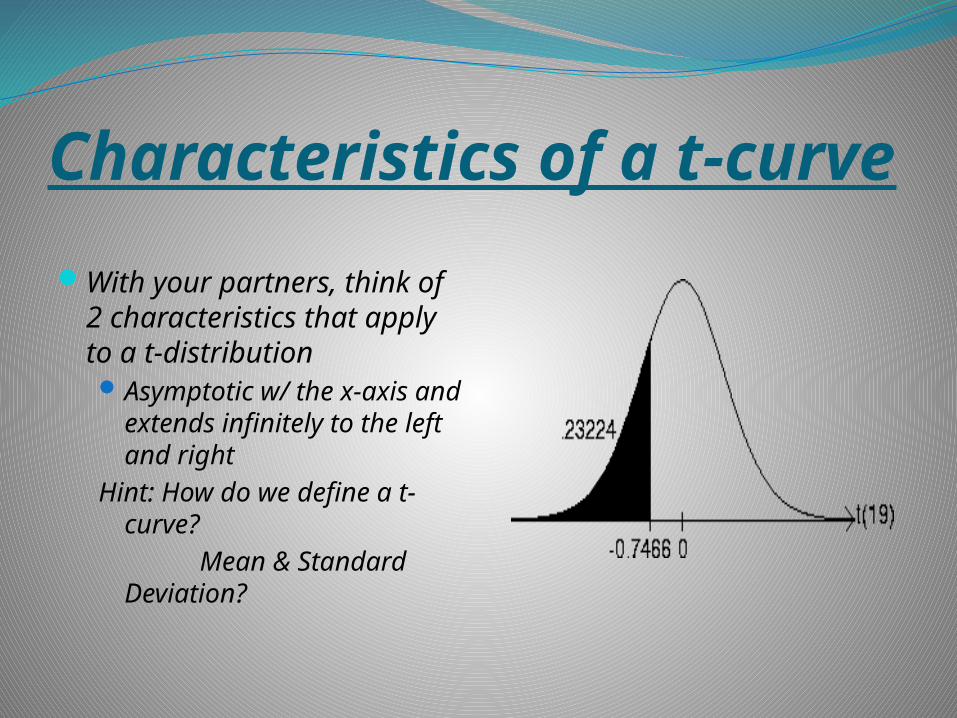
Characteristics of a t-curve
With your partners, think of 2 characteristics that apply to a t-distributionAsymptotic w/ the x-axis
and extends infinitely to the left and right
Hint: How do we define a t-curve?
Mean & Standard Deviation?
How measures of center are affectedWhat happens to the: -mean -standard deviation -median -correlationa) If I double everyone’s quiz grade.b) If I add 5 extra credit points to everyone’s
quiz grade.
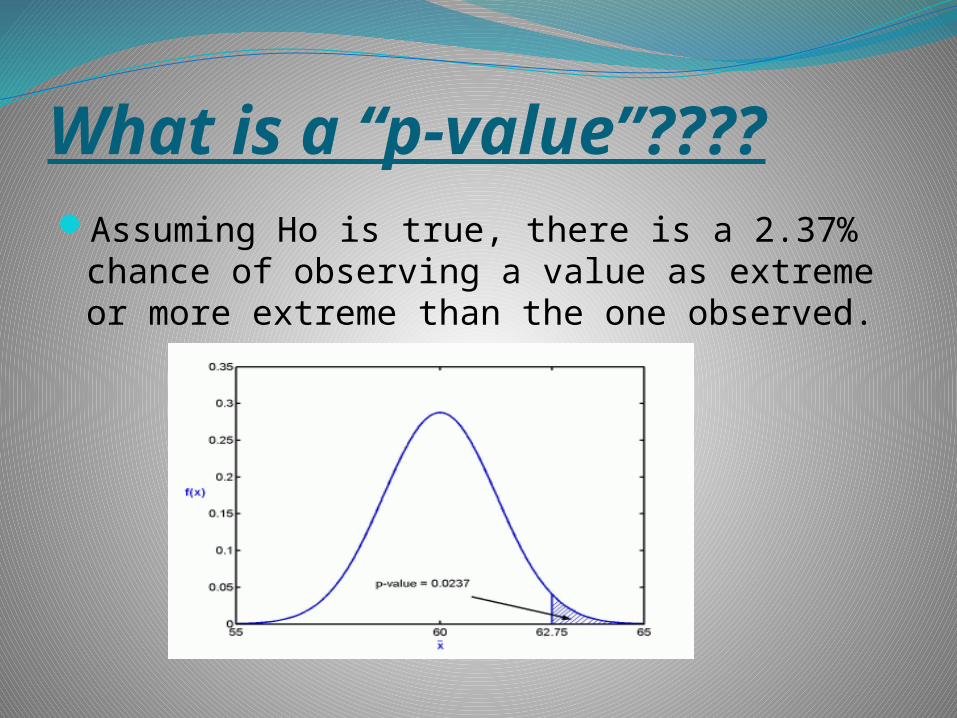
What is a “p-value”????Assuming Ho is true, there is a 2.37% chance
of observing a value as extreme or more extreme than the one observed.
Binomial Distribution-There are a fixed # of trials-They are independent-The probability of success, p, is the same
-There are 2 outcomes, success or failure.
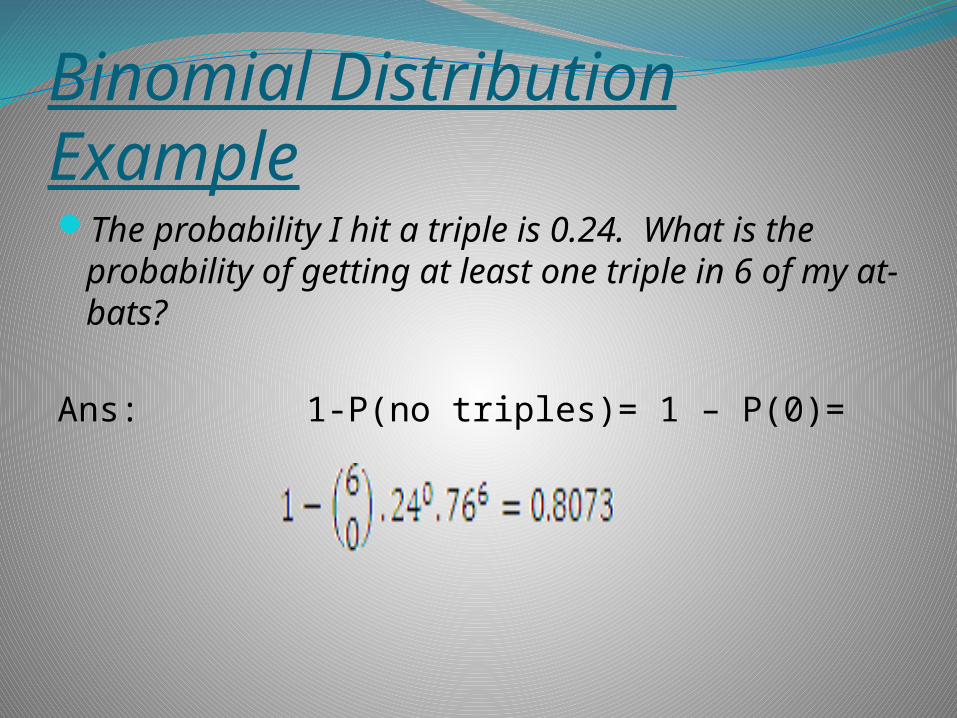
Binomial Distribution ExampleThe probability I hit a triple is 0.24. What is
the probability of getting at least one triple in 6 of my at-bats?
Ans: 1-P(no triples)= 1 – P(0)=
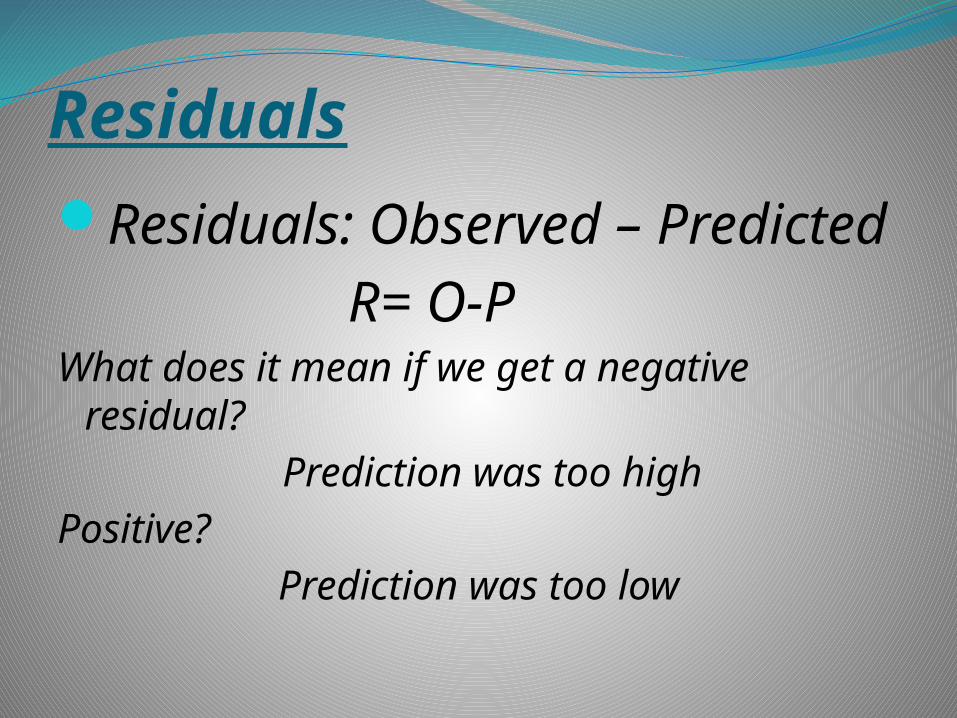
ResidualsResiduals: Observed – Predicted
R= O-PWhat does it mean if we get a negative
residual?Prediction was too high
Positive?Prediction was too low
Probability Distributions?
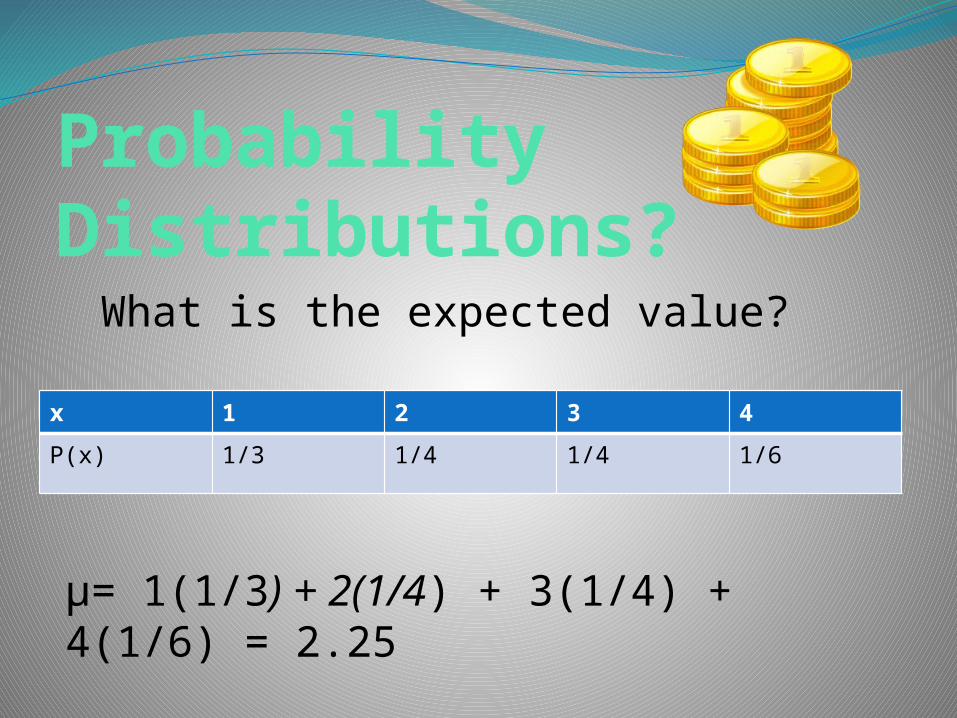
What is the expected value?
x 1 2 3 4
P(x) 1/3 1/4 1/4 1/6
μ= 1(1/3) + 2(1/4) + 3(1/4) + 4(1/6) = 2.25
Central Limit TheoremWhat is the difference between the central limit theorem and the law of large numbers?
Margin of ErrorOne sample t-interval
One proportion z-interval
Free Response QuestionsThere will be 4 free response questions. They
could include any of the following topics.- Linear Regression Test (How to read the output) Interpet slope, y-int, residuals, y=a+bx,etc….-Probability- Are they independent?-Matched pairs t-test -2 Sample t-test-Chi-Squared Test
-know Goodness of fit, Homogeneity, and Independence