final interchange justification report - tacomacms.cityoftacoma.org/planning/er-its/pot rd_i-5_final...
TRANSCRIPT


Final Interchange Justification Report Port of Tacoma Road Interchange with Interstate 5 Fife, Washington Submitted to City of Fife Fife, Washington February 2012 Submitted by BergerABAM 33301 Ninth Avenue South, Suite 300 Federal Way, Washington 98003-2600 In association with Fehr and Peers Heffron Transportation GeoEngineers, Inc. Widener & Associates ESM Consulting Engineers Job No. SAPWT-09-139

Final Intersection Justification Report BergerABAM, SAPWT-09-139 Port of Tacoma Road Intersection with Interstate 5 February 2012 City of Fife, Washington Page ii of xiv
FINAL INTERCHANGE JUSTIFICATION REPORT
Port of Tacoma Road Interchange with Interstate 5 Fife, Washington
TABLE OF CONTENTS SECTION PAGE LIST OF ABBREVIATIONS AND ACRONYMS........................................................................................ VII EXECUTIVE SUMMARY ....................................................................................................................... VIII PROJECT DESCRIPTION ......................................................................................................................XII EIGHT POLICY POINTS ....................................................................................................................... XIII 1 POLICY POINT 1: NEED FOR ACCESS POINT REVISION .......................................................1-1
1.1 Summary ....................................................................................................................1-1
1.2 Safety .........................................................................................................................1-1
1.3 Capacity/Congestion ................................................................................................1-2
1.4 Transportation Demand ............................................................................................1-3
1.4.1 Roadway Deficiencies ..................................................................................1-4
1.5 Analysis and Data ......................................................................................................1-4
1.5.1 Forecasting ...................................................................................................1-5
1.5.2 Planned Improvements.................................................................................1-5
1.5.3 Operational and Safety Analysis Methods and Assumptions .....................1-6
1.5.4 Existing Conditions (2006)...........................................................................1-6
1.5.5 Traffic Operations .........................................................................................1-6
1.5.6 Safety ......................................................................................................... 1-20
1.6 No-Build Conditions for 2020 (Year of Opening) .................................................. 1-27
1.6.1 No-Build 2020 Traffic Operations ............................................................. 1-27
1.6.2 No-Build 2020 Safety ................................................................................ 1-32
1.6.3 No-Build 2040 Traffic Operations (Design Year) ...................................... 1-43
1.6.4 No-Build 2040 Safety (Design Year) ......................................................... 1-48
1.6.5 Transportation Demand Management ..................................................... 1-48
2 POLICY POINT 2: REASONABLE ALTERNATIVES...................................................................2-1
2.1 Summary ....................................................................................................................2-1
2.2 Alternatives Developed .............................................................................................2-1
2.2.1 No-Build Alternatives ....................................................................................2-1
2.2.2 Build Alternatives .........................................................................................2-1
2.3 Alternative Screening ...............................................................................................2-7
Final Intersection Justification Report BergerABAM, SAPWT-09-139 Port of Tacoma Road Intersection with Interstate 5 February 2012 City of Fife, Washington Page iii of xiv
2.3.1 Recommended Alternative ...........................................................................2-9
3 POLICY POINT 3: OPERATIONAL AND ACCIDENT ANALYSIS ................................................3-1
3.1 Summary ....................................................................................................................3-1
3.1.1 2020 Year of Opening Condition ..................................................................3-1
3.1.2 2040 Design Year Condition ........................................................................3-2
3.2 Analysis Methods and Assumptions ........................................................................3-2
3.2.1 Travel Demand Forecasting .........................................................................3-3
3.2.2 Operational and Safety Analysis Methods and Assumptions .....................3-3
3.2.3 Potential Accident Forecast Methodology ..................................................3-3
3.3 Year of Opening Conditions (2020) ..........................................................................3-3
3.3.1 3.1.1 Year of Opening (2020) Freeway Operations .....................................3-4
3.3.2 Year of Opening (2020) Intersection Operations ........................................3-4
3.3.3 Year of Opening (2020) Safety .................................................................. 3-10
3.4 Design Year Operations (2040) ............................................................................. 3-10
3.4.1 Design Year (2040) Freeway Operations .................................................. 3-19
3.4.2 Design Year (2040) Intersection Operations ............................................ 3-19
3.4.3 Design Year (2040) Safety ........................................................................ 3-32
4 POLICY POINT 4: ACCESS CONNECTIONS AND DESIGN ......................................................4-1
4.1 Summary ....................................................................................................................4-1
4.2 Directionality .............................................................................................................4-1
4.3 Access Connections to Public Roads .......................................................................4-1
4.4 Design Standards ......................................................................................................4-1
4.5 Ramp Terminals ........................................................................................................4-5
5 POLICY POINT 5: LAND USE AND TRANSPORTATION PLANS ..............................................5-1
5.1 Summary ....................................................................................................................5-1
5.2 Land Use ....................................................................................................................5-1
5.2.1 Current Land Use ..........................................................................................5-1
5.2.2 Future Land Use ............................................................................................5-1
5.2.3 Land Use Impacts .........................................................................................5-1
5.3 Statewide Transportation Plans ...............................................................................5-2
5.3.1 Washington Transportation Plan .................................................................5-2
5.3.2 WSDOT State Highway System Plan ............................................................5-2
5.4 Regional Transportation Plans .................................................................................5-2
5.4.1 PSRC Transportation 2040 Plan ..................................................................5-2
5.4.2 Pierce County Comprehensive Plan.............................................................5-2
5.4.3 Sound Transit ................................................................................................5-2
5.5 Local Transportation Plans .......................................................................................5-3

Final Intersection Justification Report BergerABAM, SAPWT-09-139 Port of Tacoma Road Intersection with Interstate 5 February 2012 City of Fife, Washington Page iv of xiv
5.5.1 City of Tacoma Comprehensive Plan ...........................................................5-3
5.5.2 City of Fife Comprehensive Plan ..................................................................5-3
6 POLICY POINT 6: FUTURE INTERCHANGES ..........................................................................6-1
6.1 Summary ....................................................................................................................6-1
6.2 Previous Planning for Revised Port of Tacoma Road Interchange with I-5 ...........6-1
6.3 Other Proposed Projects Considered .......................................................................6-1
6.3.1 SR 167 Extension Program ..........................................................................6-2
6.3.2 I-5/SR 161/SR 18 Interchange Improvements ..........................................6-2
6.3.3 Tacoma/Pierce County HOV Program .........................................................6-2
7 POLICY POINT 7: COORDINATION..........................................................................................7-1
7.1 Summary ....................................................................................................................7-1
7.2 SR 167 Extension Program ......................................................................................7-1
7.2.1 SR 167 Extension Puyallup to SR 509 ........................................................7-1
7.2.2 I-5/SR 167 Interchange ...............................................................................7-1
7.3 Project Funding .........................................................................................................7-1
7.3.1 Port of Tacoma Road Interchange with I-5 .................................................7-1
7.3.2 SR 167 Extension Program ..........................................................................8-1
8 POLICY POINT 8: ENVIRONMENTAL PROCESSES .................................................................8-1
8.1 Summary ....................................................................................................................8-1
8.2 Planning Requirements ............................................................................................8-1
8.3 Schedule of Environmental and IJR Decision ..........................................................8-1
LIST OF TABLES Table 1-1. Planned Network Improvements for 2020 and 2040 .................................................... 1-5 Table 1-2. Levels of Service Criteria for Freeway Analysis ............................................................. 1-7 Table 1-3. Levels of Service Criteria for Signalized and Unsignalized Intersections .................... 1-7 Table 1-4. Existing Freeway Levels of Service ................................................................................. 1-8 Table 1-5. Intersection Levels of Service - Existing Peak Hour Conditions ................................. 1-19 Table 1-6. Freeway Mainline Accident Rates (2002 to 2008) ...................................................... 1-21 Table 1-7. Types of Freeway Accidents (2002 to 2008) ............................................................... 1-22 Table 1-8. Freeway Ramp Accident Rates (2002 to 2008) .......................................................... 1-23 Table 1-9. Freeway Ramp Accident Types (2002 to 2008) ........................................................... 1-25 Table 1-10. Corridor Segment Accident Rates (2002 to 2008).................................................... 1-26 Table 1-11. Intersection Accident Rates (2002 to 2008) ............................................................. 1-26 Table 1-12. 2020 No-Build I-5 Mainline Freeway Operations Summary ...................................... 1-28 Table 1-13. Intersection Levels of Service – 2020 Peak Hour Conditions – No-Build ................ 1-33 Table 1-14. Freeway Mainline Accident Forecast (2020 No-Build) .............................................. 1-40 Table 1-15. Freeway Ramp Accident Forecast (2020 No-Build) .................................................. 1-41 Table 1-16. Corridor Segment Accident Forecast (2020 No-Build) .............................................. 1-42 Table 1-17. Intersection Accident Forecast (2020 No-Build) ....................................................... 1-42 Table 1-18. 2040 No-Build I-5 Mainline Freeway Operations Summary ...................................... 1-44
Final Intersection Justification Report BergerABAM, SAPWT-09-139 Port of Tacoma Road Intersection with Interstate 5 February 2012 City of Fife, Washington Page v of xiv
Table 1-19. Intersection Levels of Service - 2040 Peak Hour Conditions – No-Build ................. 1-55 Table 1-20. Freeway Mainline Accident Forecast (2040 No-Build) .............................................. 1-56 Table 1-21. Freeway Ramp Accident Forecast (2040 No-Build) .................................................. 1-57 Table 1-22. Corridor Segment Accident Forecast (2040 No-Build) .............................................. 1-58 Table 1-23. Intersection Accident Forecast (2040 No-Build) ....................................................... 1-58 Table 1-24. TEEM Model TDM Analysis Results ............................................................................ 1-60 Table 2-1. Alternative Screening Results Summary ........................................................................ 2-8 Table 3-1. 2020 Proposed Alternative I-5 Mainline Freeway Operations Summary ...................... 3-5 Table 3-2. Intersection Levels of Service - 2020 Peak Hour Conditions – Proposed
Alternative ................................................................................................................ 3-9 Table 3-3. 2040 Proposed Alternative I-5 Mainline Freeway Operations .................................... 3-20 Table 3-4. Intersection Levels of Service - 2040 Peak Hour Conditions – Proposed
Alternative .............................................................................................................. 3-33 Table 4-1. Interchange Spacing ....................................................................................................... 4-2 Table 4-2. Geometric Characteristics of the Proposed Alternative ................................................ 4-3 Table 4-3. Deviations ........................................................................................................................ 4-3 LIST OF FIGURES Vicinity Map ........................................................................................................................................ viii Alternative 6 – Diamond Couplet ........................................................................................................ ix Figure 1-1. Interstate 5 Mainline Freeway Growth Rates............................................................... 1-3 Figure 1-2. AM Peak Hour Lane Configurations and Level of Service - Existing
Conditions ............................................................................................................... 1-10 Figure 1-3. PM Peak Hour Lane Configurations and Level of Service - Existing
Conditions ............................................................................................................... 1-11 Figure 1-4. AM Peak Hour Traffic Volumes and Lane Configurations - Existing
Conditions (Inset A) ................................................................................................ 1-13 Figure 1-5. AM Peak Hour Traffic Volumes and Lane Configurations - Existing
Conditions (Inset B) ................................................................................................ 1-14 Figure 1-6. AM Peak Hour Traffic Volumes and Lane Configurations - Existing
Conditions (Inset C) ................................................................................................ 1-15 Figure 1-7. PM Peak Hour Traffic Volumes and Lane Configurations - Existing
Conditions (Inset A) ................................................................................................ 1-16 Figure 1-8. PM Peak Hour Traffic Volumes and Lane Configurations - Existing
Conditions (Inset B) ................................................................................................ 1-17 Figure 1-9. PM Peak Hour Traffic Volumes and Lane Configurations - Existing
Conditions (Inset C) ................................................................................................ 1-18 Figure 1-10. AM Peak Hour Lane Configurations and Level of Service - 2020 No
Action ...................................................................................................................... 1-30 Figure 1-11. PM Peak Hour Lane Configurations and Level of Service - 2020 No
Action ...................................................................................................................... 1-31 Figure 1-12. AM Peak Hour Traffic Volumes and Lane Configurations - 2020 No
Action (Inset A) ....................................................................................................... 1-34 Figure 1-13. AM Peak Hour Traffic Volumes and Lane Configurations - 2020 No
Action (Inset B) ....................................................................................................... 1-35 Figure 1-14. AM Peak Hour Traffic Volumes and Lane Configurations - 2020 No
Action (Inset C) ....................................................................................................... 1-36 Figure 1-15. PM Peak Hour Traffic Volumes and Lane Configurations - 2020 No
Action (Inset A) ....................................................................................................... 1-37

Final Intersection Justification Report BergerABAM, SAPWT-09-139 Port of Tacoma Road Intersection with Interstate 5 February 2012 City of Fife, Washington Page vi of xiv
Figure 1-16. PM Peak Hour Traffic Volumes and Lane Configurations - 2020 No Action (Inset B) ....................................................................................................... 1-38
Figure 1-17. PM Peak Hour Traffic Volumes and Lane Configurations - 2020 No Action (Inset C) ....................................................................................................... 1-39
Figure 1-18. AM Peak Hour Lane Configurations and Level of Service - 2040 No Action ...................................................................................................................... 1-46
Figure 1-19. PM Peak Hour Lane Configurations and Level of Service - 2040 No Action ...................................................................................................................... 1-47
Figure 1-20. AM Peak Hour Traffic Volumes and Lane Configutations - 2040 No Action (Inset A) ....................................................................................................... 1-49
Figure 1-21. AM Peak Hour Traffic Volumes and Lane Configutations - 2040 No Action (Inset B) ....................................................................................................... 1-50
Figure 1-22. AM Peak Hour Traffic Volumes and Lane Configutations - 2040 No Action (Inset C) ....................................................................................................... 1-51
Figure 1-23. PM Peak Hour Traffic Volumes and Lane Configutations - 2040 No Action (Inset A) ....................................................................................................... 1-52
Figure 1-24. AM Peak Hour Traffic Volumes and Lane Configutations - 2040 No Action (Inset B) ....................................................................................................... 1-53
Figure 1-25. PM Peak Hour Traffic Volumes and Lane Configutations - 2040 No Action (Inset C) ....................................................................................................... 1-54
Figure 2-1. Alternative Considered and Evaluated for Access Point Revision .............................. 2-2 Figure 2-2. Alternative Considered and Evaluated for Access Point Revision .............................. 2-3 Figure 3-1. AM Peak Hour Lane Configurations and Level of Service - 2020
Alternative 6 ............................................................................................................. 3-7 Figure 3-2. PM Peak Hour Lane Configurations and Level of Service - 2020
Alternative 6 ............................................................................................................. 3-8 Figure 3-3. AM Peak Hour Traffic Volumes and Lane Configurations - 2020
Proposed Alternative (Inset A) ............................................................................... 3-11 Figure 3-4. AM Peak Hour Traffic Volumes and Lane Configurations - 2020
Proposed Alternative (Inset B)............................................................................... 3-12 Figure 3-5. AM Peak Hour Traffic Volumes and Lane Configurations - 2020
Proposed Alternative (Inset C) ............................................................................... 3-13 Figure 3-6. AM Peak Hour Traffic Volumes and Lane Configurations - 2020
Proposed Alternative (Inset B)............................................................................... 3-14 Figure 3-7. PM Peak Hour Traffic Volumes and Lane Configurations - 2020
Proposed Alternative (Inset A) ............................................................................... 3-15 Figure 3-8. PM Peak Hour Traffic Volumes and Lane Configurations - 2020
Proposed Alternative (Inset B)............................................................................... 3-16 Figure 3-9. PM Peak Hour Traffic Volumes and Lane Configurations - 2020
Proposed Alternative (Inset C) ............................................................................... 3-17 Figure 3-10. PM Peak Hour Traffic Volumes and Lane Configurations - 2020
Proposed Alternative (Inset B)............................................................................... 3-18 Figure 3-11. AM Peak Hour Lane Configurations and Level of Service - 2040
Alternative 6 ........................................................................................................... 3-22 Figure 3-12. AM Peak Hour Lane Configurations and Level of Service - 2040
Alternative 6 ........................................................................................................... 3-23 Figure 3-13. AM Peak Hour Traffic Volumes and Lane Configurations - 2040
Proposed Alternative (Inset A) ............................................................................... 3-24 Figure 3-14. AM Peak Hour Traffic Volumes and Lane Configurations - 2040
Proposed Alternative (Inset B)............................................................................... 3-25

Final Intersection Justification Report BergerABAM, SAPWT-09-139 Port of Tacoma Road Intersection with Interstate 5 February 2012 City of Fife, Washington Page vii of xiv
Figure 3-15. AM Peak Hour Traffic Volumes and Lane Configurations - 2040 Proposed Alternative (Inset C) ............................................................................... 3-26
Figure 3-16. AM Peak Hour Traffic Volumes and Lane Configurations - 2040 Proposed Alternative (Inset B)............................................................................... 3-27
Figure 3-17. PM Peak Hour Traffic Volumes and Lane Configurations - 2040 Proposed Alternative (Inset A) ............................................................................... 3-28
Figure 3-18. PM Peak Hour Traffic Volumes and Lane Configurations - 2040 Proposed Alternative (Inset C) ............................................................................... 3-30
Figure 4-1. Geometric Deviation Locations ..................................................................................... 4-4 LIST OF APPENDICES Appendix A: Methods and Assumptions Technical Memorandum Appendix B: Operational Analysis Methods and Assumptions Technical Memorandum Appendix C: CADD Drawings Appendix D: Final Technical Advisory Committee Recommendation Memorandum LIST OF ABBREVIATIONS AND ACRONYMS City City of Fife CTR Commute Trip Reduction DCE Documented Categorical Exclusion DM Design Manual EIS Environmental Impact Statement FHWA Federal Highway Administration FMSIB Freight Mobility Strategic Investment Board HCM Highway Capacity Manual HOV High-Occupancy Vehicle HSP Highway System Plan HSS Highway of State Significance I-5 Interstate 5 IJR Interchange Justification Report LOS Level of Service MEV Million Entering Vehicles MP Milepost MVM Million Vehicle Mile PDO Property Damage Only Port Port of Tacoma PSRC Puget Sound Regional Council ROW Right-of-Way SPUI Single Point Urban Interchange SR State Route TAC Technical Advisory Committee TDM Transportation Demand Management TEEM TDM Effectiveness Estimation Methodology TIP Transportation Improvement Program VA Value Analysis WSDOT Washington State Department of Transportation WTP Washington Transportation Plan

Final Intersection Justification Report BergerABAM, SAPWT-09-139 Port of Tacoma Road Intersection with Interstate 5 February 2012 City of Fife, Washington Page viii of xiv
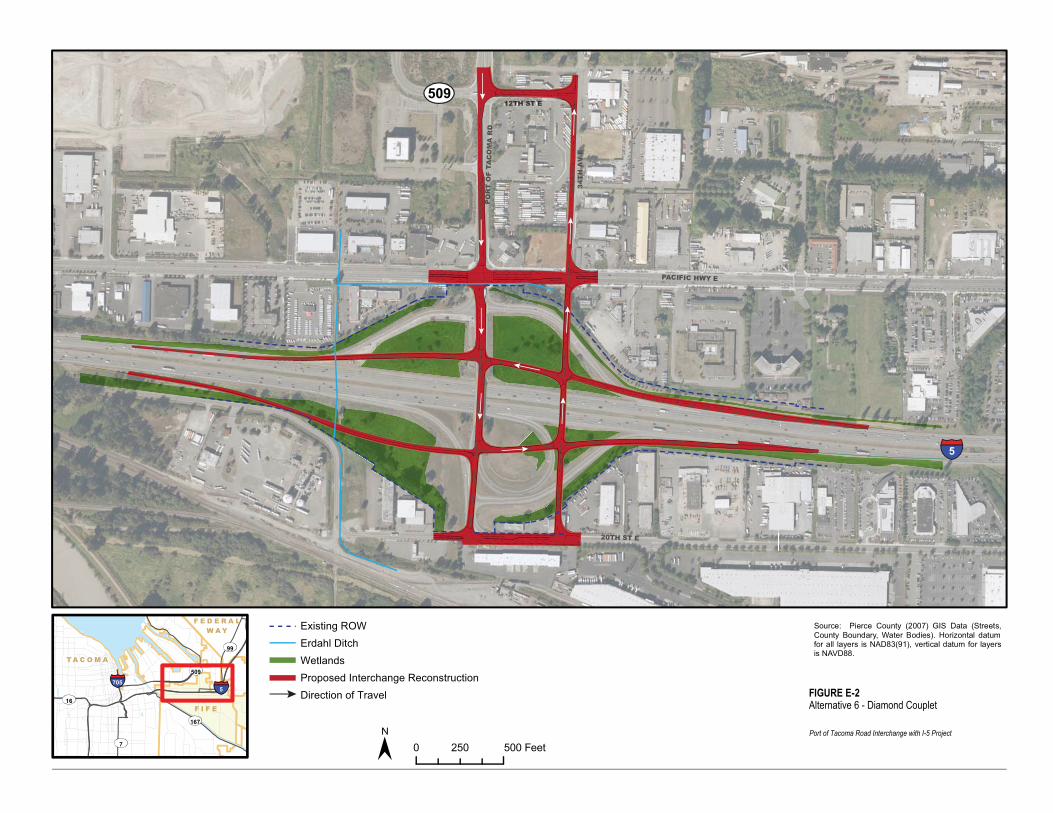
FINAL INTERCHANGE JUSTIFICATION REPORT PORT OF TACOMA ROAD INTERCHANGE WITH INTERSTATE 5 FIFE, WASHINGTON EXECUTIVE SUMMARY Project Description The interchange of Port of Tacoma Road with Interstate 5 (I-5) is located just east of the Puyallup River Bridge in the City of Fife (City). This interchange is an integral element of the freight and truck operations of both the City and the Port of Tacoma (Port). As its name suggests, Port of Tacoma Road is the main access between the Port and I-5; the road also connects to major arterials, such as State Route 509 (SR 509) (South Frontage Road) and Pacific Highway East. Between SR 509 and 20th Street East, Port of Tacoma Road is a principal arterial fronting local businesses. (See Vicinity Map on page viii.) The existing interchange of Port of Tacoma Road with I-5 is a One Quad Parclo B interchange, with a single loop ramp in the southeast quadrant, which serves the northbound I-5 to northbound Port of Tacoma Road movement. Problems with the current configuration include closely spaced intersections and heavy congestion. The southbound off-ramp and on-ramps of the Port of Tacoma Road interchange are geometrically deficient with substandard alignments for exiting and entering I-5 at freeway speeds. Between 2002 and 2008, six fatal accidents occurred in the project vicinity. High truck volumes, coupled with very closely spaced intersections, make it difficult for vehicles and freight to access this area. Description of Proposed Action After a thorough screening process, Alternative 6 – a diamond couplet interchange—was chosen as the Proposed Alternative. With this alternative, 34th Avenue East and Port of Tacoma Road will become a set of paired one-way couplets or one-way streets that function as a single higher-capacity street; 34th Avenue East will become a one-way street to the north and Port of Tacoma Road will become a one-way street to the south. This improvement will construct a one-way couplet system by revising the northbound and southbound ramps, converting Port of Tacoma Road to a one-way road in the southerly direction, and extending and reconstructing 34th Avenue to a one-way road in the northerly direction. (See Alternative 6 –Diamond Couplet Interchange on page ix.) Exiting the southbound ramp, vehicles will approach a traffic light at the extension of 34th Avenue East and either turn right onto 34th Avenue East or continue straight to Port of Tacoma Road. With 34th Avenue East now a one-way northbound street from 20th Street East to 12th Street East, vehicles on the southbound exit ramp continuing straight through the signal will then encounter another signal at Port of Tacoma Road, at which they may either then proceed straight onto the southbound I-5 on-ramp or turn left to cross I-5 on Port of Tacoma Road. With Port of Tacoma Road now a one-way southbound street from 12th Street East to 20th Street East, there will be no right turns on Port of Tacoma Road from the one-way westbound road connecting to the southbound on-ramp to I-5.

Puyallup River
Thea Foss Waterw
ay
T A C O M A
Pierce County
King County
F I F E
705
7
167
509
99
5
RIVER RD E
PAC
IFIC H
WY
E
PAC
IFIC
AV
E L ST
VALLEY AV E
54TH
AV
E
PACIFIC HWY E
E P
OR
TLA
ND
AV
LINCOLN AV
T84 E H ST
PUYALLUP AV
E RO
OS
EV
ELT AV
S C S
T
TS HT83 E
E FAIRBANKS ST
D E NL NOISIVI
BAY ST
E 34TH ST
Ki n gKi n g
Pi e r c ePi e r c e
Ma s o nMa s o n
Th u r s t o nTh u r s t o n
Ki t s a pKi t s a p
J e f f e r s o nJ e f f e r s o n
90
5
405
0 2,000 Feet1,000
FIGURE E-1Vicinity Map
Port of Tacoma Road Interchange with I-5 Project
Alternative Alignment
City LimitsCounty Boundary
Source: Pierce County (2007) GIS Data (Streets,County Boundary, Water Bodies). Horizontal datumfor all layers is NAD83(91), vertical datum for layersis NAVD88.
Existing ROWErdahl Ditch WetlandsProposed Interchange ReconstructionDirection of Travel
34T
H A
V E
PACIFIC HWY E
PO
RT
OF
T AC
OM
AR
D
20TH ST E
509
5
15
705
167
99
7
16
509
F I F E
T A C O M A
F E D E R A LW A Y
0 500 Feet250
FIGURE E-2Alternative 6 - Diamond Couplet
Port of Tacoma Road Interchange with I-5 Project
Source: Pierce County (2007) GIS Data (Streets,County Boundary, Water Bodies). Horizontal datumfor all layers is NAD83(91), vertical datum for layersis NAVD88.
12TH ST E

Final Intersection Justification Report BergerABAM, SAPWT-09-139
Port of Tacoma Road Intersection with Interstate 5 February 2012
City of Fife, Washington Page xi of xiv
Under the Proposed Alternative, vehicles leaving the northbound off-ramp will encounter a
traffic signal at Port of Tacoma Road, and proceed straight to 34th Avenue East or turn right on
Port of Tacoma Road. At 34th Avenue East, another traffic signal will allow vehicles to continue
straight to the northbound on-ramp or turn left on 34th Avenue East. Additional local road
improvements will widen 12th Street East; 20th Street East; and, on a smaller scale, Pacific
Highway East.

Final Intersection Justification Report BergerABAM, SAPWT-09-139 Port of Tacoma Road Intersection with Interstate 5 February 2012 City of Fife, Washington Page xii of xiv
FINAL INTERCHANGE JUSTIFICATION REPORT PORT OF TACOMA ROAD INTERCHANGE WITH INTERSTATE 5 FIFE, WASHINGTON PROJECT DESCRIPTION The interchange of Port of Tacoma Road with Interstate 5 (I-5) is located just east of the Puyallup River Bridge in the City of Fife (City). This interchange is an integral element of the freight and truck operations of both the City and the Port of Tacoma (Port). As its name suggests, Port of Tacoma Road is the main access between the Port and I-5; the road also connects to major arterials, such as State Route 509 (SR 509) (South Frontage Road) and Pacific Highway East. Between SR 509 and 20th Street East, Port of Tacoma Road is a principal arterial fronting local businesses. (See Vicinity Map on page viii.) The existing interchange of Port of Tacoma Road with I-5 is a One Quad Parclo B interchange, with a single loop ramp in the southeast quadrant, which serves the northbound I-5 to northbound Port of Tacoma Road movement. Problems with the current configuration include closely spaced intersections and heavy congestion. The southbound off-ramp and on-ramps of the Port of Tacoma Road interchange are geometrically deficient with substandard alignments for exiting and entering I-5 at freeway speeds. Between 2002 and 2008, six fatal accidents occurred in the project vicinity. High truck volumes, coupled with very closely spaced intersections, make it difficult for vehicles and freight to access this area. Consistency with Policy Points This Interchange Justification Report (IJR) provides support for the Federal Highway Administration’s (FHWA) eight policy points as described in this summary and in the following text. Policy Point 1 describes the need for the proposed access point revision, while Policy Point 2 describes all the alternatives considered, and Policy Point 3 presents the Proposed Alternative’s ability to improve the system’s performance. The proposed reconfiguration design accommodates spacing requirements and constraints and meets geometric standards as described in Policy Point 4, and as detailed in Policy Point 5, is compatible with the pertinent land use and transportation plans for the area. The design process included future or in-progress interchanges as described in Policy Point 6. While the Port of Tacoma Road interchange with I-5 is a stand-alone project, the design assumed the completion of several projects in the project vicinity (Policy Point 7). Project and environmental planning over the past year resulted in significant progress in determining interchange layout and assessing environmental effects. Policy Point 8 outlines the status of the proposal’s environmental processes and the schedule for the proposal’s expected completion.

Final Intersection Justification Report BergerABAM, SAPWT-09-139
Port of Tacoma Road Intersection with Interstate 5 February 2012
City of Fife, Washington Page xiii of xiv
EIGHT POLICY POINTS
The stakeholders of the Port of Tacoma Road Interchange with Interstate 5 (I-5) project have
established that the purpose of the project is to provide efficient movement of traffic into and
out of the Port of Tacoma and surrounding areas (especially for trucks); and to improve safety
and reliability of access to local and area businesses; while balancing effects to the natural and
community environments. The Proposed Alternative satisfies the project’s objective. This
Interchange Justification Report (IJR) provides support for the Federal Highway
Administration’s (FHWA) eight policy points.
Policy Point 1 describes the need for the proposed access point revision. Freeway operational
analysis documented that the Port of Tacoma Road interchange with I-5 operates below the
acceptable level of service (LOS) as shown in the Washington State Department of
Transportation (WSDOT) Highway System Plan (HSP). These conditions will only worsen as
the Port of Tacoma (Port) continues to grow as projected.
Policy Point 2 describes all the alternatives considered in the process of finding a proposed
alternative that would address the transportation demand in the project area. The alternatives
included no build or limited construction alternatives, as well as build alternatives. A three-
tiered screening process led to the recommended operational alternative. The recommended
alternative satisfies the access needs of the Port and the City without negative impacts on
freeway operations or the local network. A diamond couplet interchange was found to best
satisfy the project’s purpose and need and is the Proposed Alternative.
Policy Point 3 presents the Proposed Alternative’s ability to improve the system’s performance.
Operational and accident analysis shows that the Proposed Alternative will not adversely affect
the operation and safety of the freeway or local street system. The Proposed Alternative will
improve freeway LOS and facilitate mobility to local and area businesses.
The Proposed Alternative provides for fully directional access between I-5 and Port of Tacoma
Road, 34th Avenue East, and other local roads via interchange ramps and one-way couplet
arterials. The proposed reconfiguration design accommodates spacing requirements and
constraints, and meets geometric standards as described in Policy Point 4.
As required by Policy Point 5, the Proposed Alternative is compatible with the land use and
transportation plans for the area, including the Washington Transportation Plan (WTP), the
WSDOT HSP, the Puget Sound Regional Council (PSRC) Transportation 2040 Plan, the Pierce
County Comprehensive Plan, Sound Transit Sound Move, and the comprehensive plans of the
cities of Tacoma and Fife.
As required by Policy Point 6, the design process included future or in-progress interchanges.
Policy Point 7 documents the status of coordinating projects. While the Port of Tacoma Road
interchange with I-5 is a stand-alone project that does not require the completion of other
projects to function, the design assumed that several projects in the project vicinity have been or
will be completed.

Final Intersection Justification Report BergerABAM, SAPWT-09-139
Port of Tacoma Road Intersection with Interstate 5 February 2012
City of Fife, Washington Page xiv of xiv
Policy Point 8 documents the status of the proposal’s environmental processes and the schedule
for its expected completion. Project and environmental planning over the past year resulted in
significant progress in determining interchange layout and assessing environmental effects.
According to determinations by FHWA and WSDOT, the project is classified as a Documented
Categorical Exclusion (DCE) and does not require the preparation of an environmental impact
statement (EIS). Applicable permits will not be determined until an environmental review is
substantially complete and the Final IJR has been reviewed.

Final Intersection Justification Report BergerABAM, SAPWT-09-139
Port of Tacoma Road Intersection with Interstate 5 February 2012
City of Fife, Washington Page 1-1
1 POLICY POINT 1: NEED FOR ACCESS POINT REVISION
What are the current and projected needs and why won’t the existing access points and existing or
improved local system meet the needs? Is the anticipated demand short or long trips?
1.1 Summary
This project studies the need for interchange access to Port of Tacoma Road, the primary access
to the Port (see Vicinity Map on page viii). The project stakeholders developed the following
purpose statement to guide the development and evaluation of alternatives: “The purpose of
the project is to provide efficient movement of traffic into and out of the Port of Tacoma and
surrounding areas (especially for trucks) to increase the level of service and improve reliability
of access to local and area businesses.”
The project will serve both regional traffic oriented to the Port of Tacoma along I-5, as well as
local traffic traveling between the Port and industrial businesses in the cities of Tacoma and
Fife. The study considered and evaluated interchange improvements, as well as supporting
intersection and roadway improvement concepts, to reduce congestion, increase freight
mobility, and improve safety at the interchange.
The project limits for the study are as follows.
• On Interstate 5: From the 54th Avenue East interchange with I-5 to the Ferguson
Street/Puyallup River Overcrossing; I-5 Milepost (MP)
Boundaries: 135.5 to 137.0
• On Port of Tacoma Road: From 20th Street East to 12th Street East
• On 34th Avenue East: From 20th Street East to 12th Street East
• On 12th Street East: From 54th Avenue East to Port of Tacoma Road
In addition to the project area limits, a greater study area was included to capture how
improvements at the Port interchange could influence operations on I-5. The greater study area
captures the area along I-5 between the northbound on-ramp/southbound off-ramp at the I-705
interchange, and the northbound off-ramp/southbound on-ramp at the SR 18 interchange. This
7.7-mile corridor captures the adjacent interchanges to the east and west of Port of Tacoma
Road, as well as the truck scales/rest area at MP 140.2.
1.2 Safety
The accident and safety analysis reviewed existing conditions on the I-5 mainline and ramps
within the study area using 2002 to 2008 data provided by WSDOT. The accident and safety
analysis reviewed existing conditions on the local arterials within the study area using 2002 to
2008 data provided by the City. The analysis summarized the number, types, and locations of
accidents in the corridor by segment on the I-5 mainline and at each ramp. The following bullets
summarize key findings.

Final Intersection Justification Report BergerABAM, SAPWT-09-139
Port of Tacoma Road Intersection with Interstate 5 February 2012
City of Fife, Washington Page 1-2
• The accident rate on the mainline I-5 freeway corridor is generally low. The highest accident
rate occurred between the East 28th Street and East Bay Street/SR 167 off-ramps. At this
location, the accident rate is 3.46 per million vehicle mile (MVM) traveled.
• The majority of accidents recorded in the study area (58.7 percent) were rear-end accidents.
• For the I-5 freeway corridor within the study area, 43.2 percent and 44.7 percent of the
accidents occurred on northbound and southbound mainlines, respectively.
• Looking at accident severity, most (64.2 percent) were property damage only (PDO). Six
fatal accidents occurred in the study area during the 7 years for which data were collected.
Five occurred on the southbound direction.
• The accident rates on ramps are higher compared to the I-5 mainline. The southbound off-
ramp to Port of Tacoma Road has the highest accident rate, with 28.4 accidents per MVM
traveled.
• Overall, almost half of the accidents that occurred on ramps (47.3 percent) were rear-end
strikes.
• Overall, most of the accidents on ramps (63.9 percent) were PDO. No fatal accidents were
reported on ramps between 2002 and 2008.
• The review and analysis of local arterial accidents focused on roadway segments and
intersections. The segment of 54th Avenue East between 12th Street East and 20th Street East
had the highest rate, with 10.73 accidents per MVM.
• Overall, most of the accidents on the analyzed arterial segments (77.5 percent) were PDO.
One fatal accident was reported on the segment of Pacific Highway East between Port of
Tacoma Road and 54th Avenue East.
• At the arterial intersections, an accident rate was calculated using number of accidents per
million entering vehicles (MEV). The intersection of Pacific Highway East/54th Avenue East
had the highest rate with 0.64 accidents per MEV.
• Overall, most (74.7 percent) of the accidents at the analyzed intersections were PDO. No
fatal accidents were reported between 2002 and 2008.
1.3 Capacity/Congestion
The freeway analysis investigated the congestion on I-5, the major north-south freeway in
Washington. I-5 is a highway of state significance (HSS) and a principal north-south arterial for
the National Defense System. Regionally, I-5 connects the major cities of western Washington,
including Bellingham, Everett, Seattle, Tacoma, Olympia, and Vancouver, and is a major freight
route. Within the study area, I-5 experiences traffic congestion during the AM and PM peak
hours, as well as heavy traffic volumes during midday.
Final Intersection Justification Report BergerABAM, SAPWT-09-139
Port of Tacoma Road Intersection with Interstate 5 February 2012
City of Fife, Washington Page 1-3
100000
120000
140000
160000
180000
200000
220000
240000
260000
1990 1995 2000 2005 2010 2015 2020
Year
ADT
I-5 Actual
Trend
Intersection analyses indicate that the Port of Tacoma Road/I-5 southbound ramps and the
intersection of Port of Tacoma Road/Pacific Highway South are heavily congested during peak
periods, particularly for the southbound I-5 off-ramp movement.
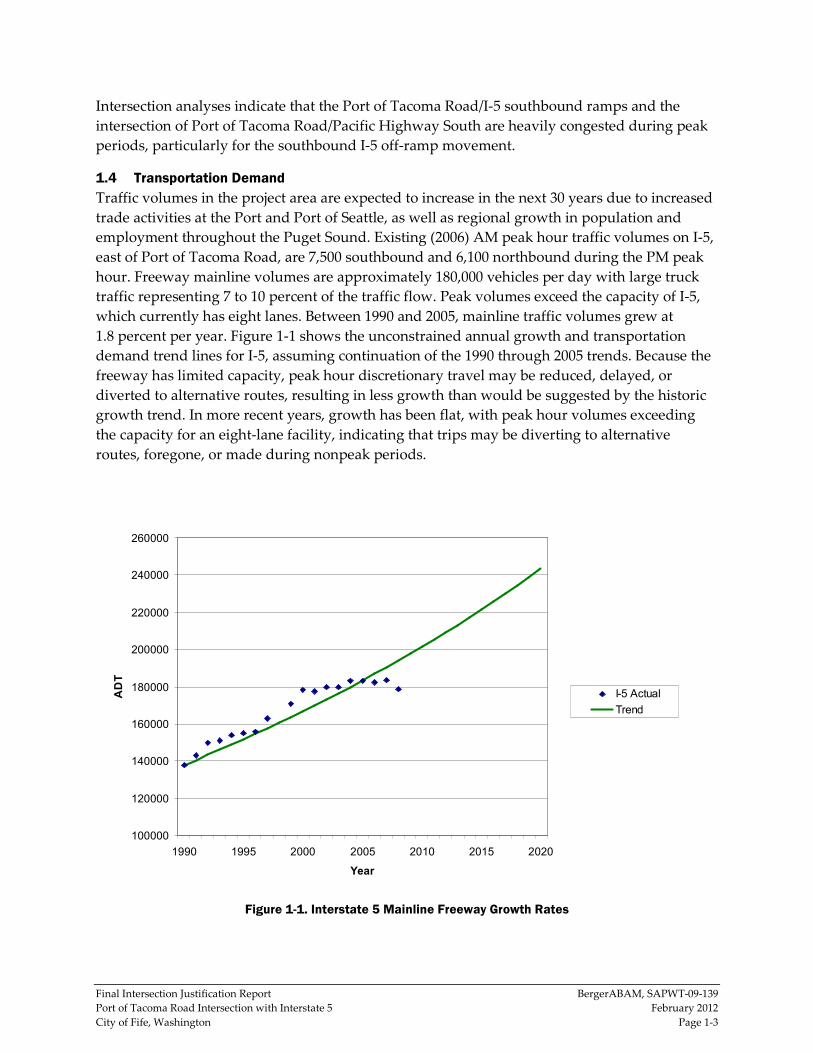
1.4 Transportation Demand
Traffic volumes in the project area are expected to increase in the next 30 years due to increased
trade activities at the Port and Port of Seattle, as well as regional growth in population and
employment throughout the Puget Sound. Existing (2006) AM peak hour traffic volumes on I-5,
east of Port of Tacoma Road, are 7,500 southbound and 6,100 northbound during the PM peak
hour. Freeway mainline volumes are approximately 180,000 vehicles per day with large truck
traffic representing 7 to 10 percent of the traffic flow. Peak volumes exceed the capacity of I-5,
which currently has eight lanes. Between 1990 and 2005, mainline traffic volumes grew at
1.8 percent per year. Figure 1-1 shows the unconstrained annual growth and transportation
demand trend lines for I-5, assuming continuation of the 1990 through 2005 trends. Because the
freeway has limited capacity, peak hour discretionary travel may be reduced, delayed, or
diverted to alternative routes, resulting in less growth than would be suggested by the historic
growth trend. In more recent years, growth has been flat, with peak hour volumes exceeding
the capacity for an eight-lane facility, indicating that trips may be diverting to alternative
routes, foregone, or made during nonpeak periods.
Figure 1-1. Interstate 5 Mainline Freeway Growth Rates

Final Intersection Justification Report BergerABAM, SAPWT-09-139
Port of Tacoma Road Intersection with Interstate 5 February 2012
City of Fife, Washington Page 1-4
For a more accurate forecast, a detailed travel demand analysis was performed using land use
forecasts and the regional travel demand model developed by PSRC, along with land use data
from the City’s traffic model. These forecasts assume the addition of roadway and transit
improvements, as well as diversion of traffic onto alternative routes that provide travel time
savings.
1.4.1 Roadway Deficiencies
The regional freeways and local arterials within the project study area operate as a system, with
congestion and delays affecting both upstream and downstream operations. Traffic queues at
an intersection can back up onto the freeway mainline, resulting in increased congestion and
delay.
1.5 Analysis and Data
To demonstrate the need for the proposed improvements at the Port of Tacoma Road
interchange, accident and operation analyses were performed using methods and procedures
endorsed by the Port stakeholders (Appendix A: Method and Assumptions Technical
Memorandum). The analysis considered 2020 as the opening year for a realistic target time line
for obtaining funding, completing design and environmental documentation, acquiring
necessary right-of-way (ROW) and permits, and completing construction on any selected
improvements. Year 2040 was identified as the design year based on available land use and
traffic forecasts. Other important assumptions are as follows.
• PSRC-funded improvements are assumed in the 2020 baseline model. These include a
number of regional widening projects, such as high-occupancy vehicle (HOV) lanes on I-5
and widening projects on state routes. The model also includes arterial widening projects
found in the transportation improvement programs (TIPs) of Pierce County and the cities of
Tacoma, Federal Way, and Fife.
• The 2020 baseline model also includes the effects of funded improvements to the regional
transit system, such as planned extensions to Sound Transit light rail, and enhancements to
commuter rail and express bus, King County Rapid Ride, and park-and-rides.
• The baseline analysis also considered increases in freight activity at the Port terminal
acreage based on observed truck counts and classification.
• The 2040 analysis assumed that the SR 167 extension project was in place. This project is not
currently funded and is not assumed to be by 2020.
• Both AM and PM peak periods were analyzed to determine operational conditions for the
following three scenarios: existing (2006), opening year (2020), and design year (2040). The
existing conditions analysis was based on 2006 counts, which may represent more typical
conditions than do counts collected during the current (2009) economic climate.

Final Intersection Justification Report BergerABAM, SAPWT-09-139
Port of Tacoma Road Intersection with Interstate 5 February 2012
City of Fife, Washington Page 1-5
1.5.1 Forecasting
Appendix A describes the forecasting methodology for developing future year travel demand
volume forecasts. This memorandum details the travel demand forecasting model’s
development and lists the assumptions used. It also reviews the microsimulation assumptions
used for the evaluation of the interchange alternatives.
1.5.2 Planned Improvements
Table 1-1 presents improvements assumed to be constructed by the year of opening (2020) and
design year (2040). The analysis of the alternatives conducted for the 2040 period assumed the
extension of SR 167 to I-5, an assumption that was critical to the 2040 analysis because the
extension will be needed to maintain sufficient operations in the study area. Without the
improvement, the model’s forecast indicated that the area’s transportation system would be
over capacity, which would lead to severe congestion and poor systemwide operations.
Table 1-1. Planned Network Improvements for 2020 and 2040
Sponsor Project 2020 2040
WSDOT I-5 HOV lanes, SR 16 to 320th Street vicinity � �
WSDOT SR 16 HOV lanes, I-5 to Olympic Drive � �
Kent, Tukwila,
SeaTac, Federal
Way, WSDOT
SR 99 HOV lane extensions, South 138th Street to South 170th Street, Kent-Des Moines Road to
Dash Point Road
� �
WSDOT SR 161 widening, South 360th Street to 24th Street East � �
WSDOT SR 167, extend the SB HOV lane north to I-405; add a SB auxiliary lane from I-405 to the off-
connection at SW 41st Street
�
WSDOT SR 167, add one SB GP lane and extend SB HOV, SE 180th Street to I-405 � �
WSDOT I-405 widening project includes new interchanges at SR 515 and 132nd Street NE and an HOV
interchange at North 8th Street in Renton
� �
WSDOT SR 410, widen to 4-lanes, 214th Avenue to 234th Avenue � �
WSDOT SR 518 - add EB lane, North Airport Expressway to I-5/I-405 interchange � �
WSDOT SR 167 extension from Puyallup to I-5 �
Federal Way South 356th Street - widen to 5 lanes to SR 99 � �
Fife Valley Avenue East - upgrade to major arterial � �
Pierce County 176th Street East - widen to 4 lanes, SR 7 to SR 161 � �
Pierce County Canyon Road East - 106th Street East to 192nd Street East � �
Pierce County Canyon Road East - extend major arterial from 192nd Street East to SR 7 � �
Pierce County Canyon Road East - widen to 5 lanes, 84th Street East to 99th Street East � �
Tacoma D Street Overpass construction - Puyallup Avenue to South 23rd Street � �
Fife Reconstruct 70th, 20th to Valley Avenue � �
Fife Reconstruct 20th, 54th to 63rd � �
Fife Reconstruct 70th Avenue East – North Segment � �
Fife 34th Avenue East and 12th Street East intersection reconstruction � �
Fife Pacific Highway East and 54th Avenue East intersection improvements � �
Fife 20th Street East and Frank Albert Signal � �

Final Intersection Justification Report BergerABAM, SAPWT-09-139
Port of Tacoma Road Intersection with Interstate 5 February 2012
City of Fife, Washington Page 1-6
Sponsor Project 2020 2040
Fife 20th Street East and Port of Tacoma Road signal* � �
Fife 20th Street East reconstruction – Port of Tacoma Road to Industry Drive � �
Fife 20th Street East and Industry Drive signal � �
Fife 20th Street East reconstruction – Industry Drive to 54th Avenue East � �
Sound Transit Light Rail Initial Segment - Sea-Tac International Airport to UW (2016) � �
Sound Transit Light Rail Extension - UW to Northgate, Seattle to Bellevue (2020) � �
Sound Transit Light Rail Extension - Bellevue to Overlake Transit Center (2021) �
Sound Transit Light Rail Extension - Northgate to Lynnwood, SeaTac to South 272nd (2023) �
Sound Transit Light Rail Stations - Redondo/Star Lake, Jackson Park, Shoreline, Bel-Red, Overlake �
Sound Transit Express Bus Service Increase (17% increase in service) � �
Sound Transit Commuter Rail Service Increase (65% increase in capacity) Tacoma-Seattle � �
Sound Transit Commuter Rail Extension - Tacoma to Lakewood � �
Sound Transit Commuter Rail Station Improvements - Everett, Mukilteo, Edmonds, Tukwila, South Tacoma,
Lakewood
� �
Sound Transit Parking Garage at Sounder stations - Mukilteo, Auburn, Sumner, Puyallup, South Tacoma,
Lakewood
� �
Sound Transit,
WSDOT, Pierce
Transit
Park & Ride Expansions - Everett LRT Station, Mercer Island, Mountlake Terrace I- 5, South 200th,
South Bellevue, Lynnwood Transit Center, Tacoma Dome Station, Kent vicinity of I-405, Puyallup,
Kent Station, Burien, Marysville, SR 9/SR 2/Lake Stevens, Highline Community College Intermodal
Transit facility, SR 16 Peninsula
� �
King County
Metro
Rapid-Ride Bus Rapid Transit - Pacific Highway South, Redmond TC to Bellevue TC, West Seattle to
Downtown, Ballard to Downtown, Aurora to Downtown
� �
1.5.3 Operational and Safety Analysis Methods and Assumptions
Operational analysis methods and assumptions are based on the Highway Capacity Manual
(HCM) 2000 methodology (Appendix B). To provide a better understanding of existing and
future conditions, a VISSIM microsimulation model was constructed to provide a detailed
analysis of intersection and freeway operations. The VISSIM model shows the interactions
between factors that include signal timing, traffic volumes, free-flow speeds, saturation flows,
and roadway geometrics. Appendix A contains a summary of these assumptions.
1.5.4 Existing Conditions (2006)
The existing conditions analysis reviewed the traffic operations and safety of the current facility.
The traffic operations analysis evaluated the freeway and intersection performance for 2006
conditions in the study area. The safety analysis reviewed the historical accident data, including
the frequency and types of accidents on freeways, corridors, ramps, and at intersections.
1.5.5 Traffic Operations
The regional freeways and local arterials within the study area operate as a system, with
congestion and delays affecting both upstream and downstream operations. Using the VISSIM
model, the analysis evaluated freeway operations, including merge and weave analyses,
density, and calculated the intersection LOS and arterial queues of study area roadways.
Final Intersection Justification Report BergerABAM, SAPWT-09-139
Port of Tacoma Road Intersection with Interstate 5 February 2012
City of Fife, Washington Page 1-7
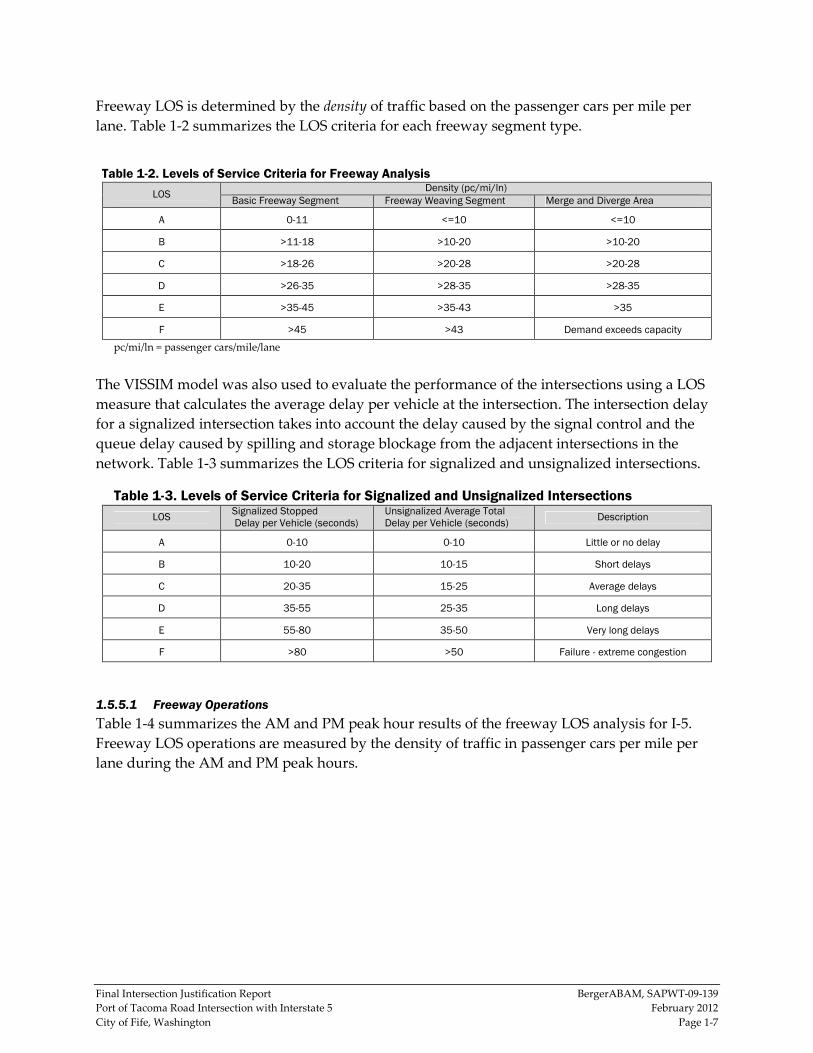
Freeway LOS is determined by the density of traffic based on the passenger cars per mile per
lane. Table 1-2 summarizes the LOS criteria for each freeway segment type.
Table 1-2. Levels of Service Criteria for Freeway Analysis
LOS Density (pc/mi/ln)
Basic Freeway Segment Freeway Weaving Segment Merge and Diverge Area
A 0-11 <=10 <=10
B >11-18 >10-20 >10-20
C >18-26 >20-28 >20-28
D >26-35 >28-35 >28-35
E >35-45 >35-43 >35
F >45 >43 Demand exceeds capacity
pc/mi/ln = passenger cars/mile/lane
The VISSIM model was also used to evaluate the performance of the intersections using a LOS
measure that calculates the average delay per vehicle at the intersection. The intersection delay
for a signalized intersection takes into account the delay caused by the signal control and the
queue delay caused by spilling and storage blockage from the adjacent intersections in the
network. Table 1-3 summarizes the LOS criteria for signalized and unsignalized intersections.
Table 1-3. Levels of Service Criteria for Signalized and Unsignalized Intersections
LOS Signalized Stopped Delay per Vehicle (seconds)
Unsignalized Average Total Delay per Vehicle (seconds)
Description
A 0-10 0-10 Little or no delay
B 10-20 10-15 Short delays
C 20-35 15-25 Average delays
D 35-55 25-35 Long delays
E 55-80 35-50 Very long delays
F >80 >50 Failure - extreme congestion
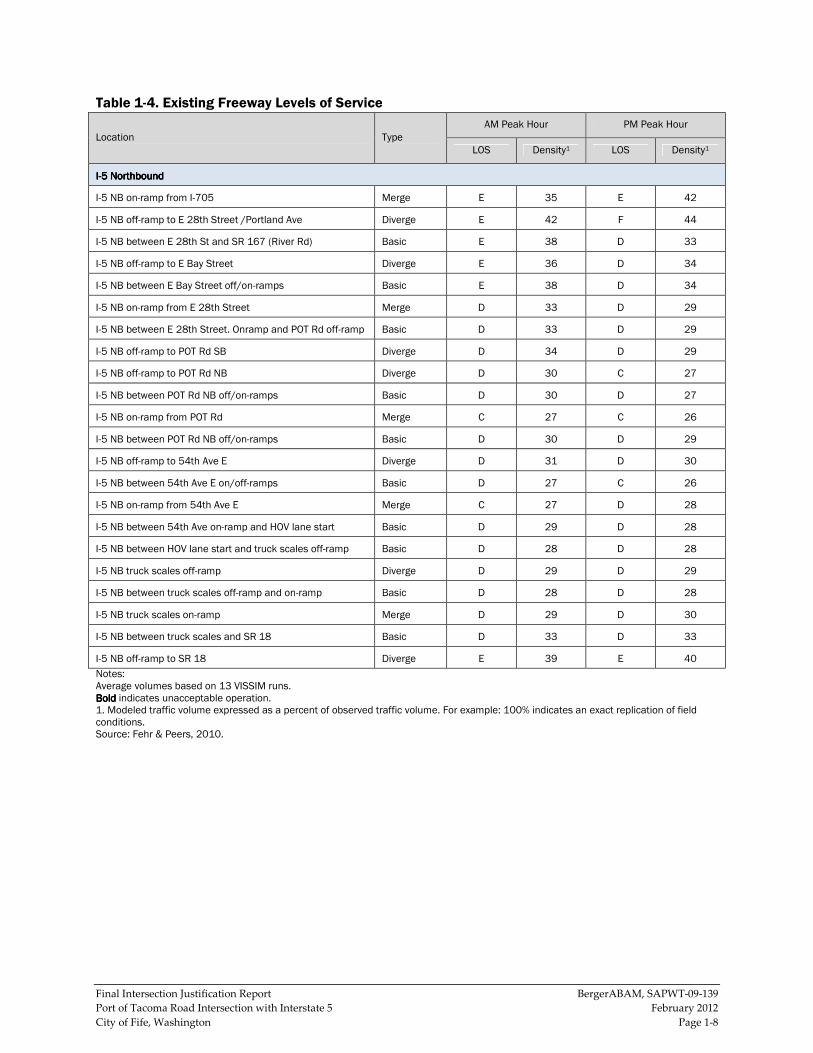
1.5.5.1 Freeway Operations
Table 1-4 summarizes the AM and PM peak hour results of the freeway LOS analysis for I-5.
Freeway LOS operations are measured by the density of traffic in passenger cars per mile per
lane during the AM and PM peak hours.
Final Intersection Justification Report BergerABAM, SAPWT-09-139
Port of Tacoma Road Intersection with Interstate 5 February 2012
City of Fife, Washington Page 1-8
Table 1-4. Existing Freeway Levels of Service
Location Type
AM Peak Hour PM Peak Hour
LOS Density1 LOS Density1
IIII----5 Northbound5 Northbound5 Northbound5 Northbound
I-5 NB on-ramp from I-705 Merge E 35 E 42
I-5 NB off-ramp to E 28th Street /Portland Ave Diverge E 42 F 44
I-5 NB between E 28th St and SR 167 (River Rd) Basic E 38 D 33
I-5 NB off-ramp to E Bay Street Diverge E 36 D 34
I-5 NB between E Bay Street off/on-ramps Basic E 38 D 34
I-5 NB on-ramp from E 28th Street Merge D 33 D 29
I-5 NB between E 28th Street. Onramp and POT Rd off-ramp Basic D 33 D 29
I-5 NB off-ramp to POT Rd SB Diverge D 34 D 29
I-5 NB off-ramp to POT Rd NB Diverge D 30 C 27
I-5 NB between POT Rd NB off/on-ramps Basic D 30 D 27
I-5 NB on-ramp from POT Rd Merge C 27 C 26
I-5 NB between POT Rd NB off/on-ramps Basic D 30 D 29
I-5 NB off-ramp to 54th Ave E Diverge D 31 D 30
I-5 NB between 54th Ave E on/off-ramps Basic D 27 C 26
I-5 NB on-ramp from 54th Ave E Merge C 27 D 28
I-5 NB between 54th Ave on-ramp and HOV lane start Basic D 29 D 28
I-5 NB between HOV lane start and truck scales off-ramp Basic D 28 D 28
I-5 NB truck scales off-ramp Diverge D 29 D 29
I-5 NB between truck scales off-ramp and on-ramp Basic D 28 D 28
I-5 NB truck scales on-ramp Merge D 29 D 30
I-5 NB between truck scales and SR 18 Basic D 33 D 33
I-5 NB off-ramp to SR 18 Diverge E 39 E 40
Notes: Average volumes based on 13 VISSIM runs. BoldBoldBoldBold indicates unacceptable operation. 1. Modeled traffic volume expressed as a percent of observed traffic volume. For example: 100% indicates an exact replication of field conditions. Source: Fehr & Peers, 2010.

Final Intersection Justification Report BergerABAM, SAPWT-09-139
Port of Tacoma Road Intersection with Interstate 5 February 2012
City of Fife, Washington Page 1-9
Table 1-4. Existing Freeway Levels of Service
(continued)
Type
AM Peak Hour PM Peak Hour
LOS Density1 LOS Density1
IIII----5 S5 S5 S5 Soutoutoutouthboundhboundhboundhbound
I-5 SB on-ramp from SR 18 Merge C 27 D 30
I-5 SB between SR 18 and truck scales Basic D 27 D 30
I-5 SB off-ramp to truck scales Diverge D 28 D 31
I-5 SB between truck scales off/on-ramps Basic D 27 D 30
I-5 SB on-ramp from truck scales Merge C 27 D 31
I-5 SB between truck scales and HOV lane end Basic D 29 D 34
I-5 SB between HOV lane end and lane drop Basic D 32 E 36
I-5 SB between lane drop and 54th Ave E Basic D 29 D 34
I-5 SB off-ramp to 54th Ave E Diverge D 33 E 38
I-5 SB between 54th Ave E on/off-ramps Basic D 30 E 43
I-5 SB on-ramp from 54th Ave E Merge C 27 D 29
I-5 SB between 54th Ave E and POT Rd Basic D 30 E 36
I-5 SB off-ramp to POT Rd Diverge D 31 E 41
I-5 SB between POT Rd off-/on-ramps Basic D 29 F 56
I-5 SB on-ramp from POT Rd Merge D 32 E 39
I-5 SB off-ramp to Bay Street Diverge D 34 F 44
I-5 SB between Bay Street off/on-ramps Basic D 28 D 30
I-5 SB on-ramp from Bay Street Merge D 33 D 34
I-5 SB between Bay St and E 27th St/Portland Ave Basic D 33 E 36
I-5 SB weave between E 27th St/Portland Ave and I-705 Weave D 33 D 30
Notes: Average volumes based on 13 VISSIM runs. 1. Modeled traffic volume expressed as a percent of observed traffic volume. For example: 100 % indicates an exact replication of field conditions. Source: Fehr & Peers, 2010.
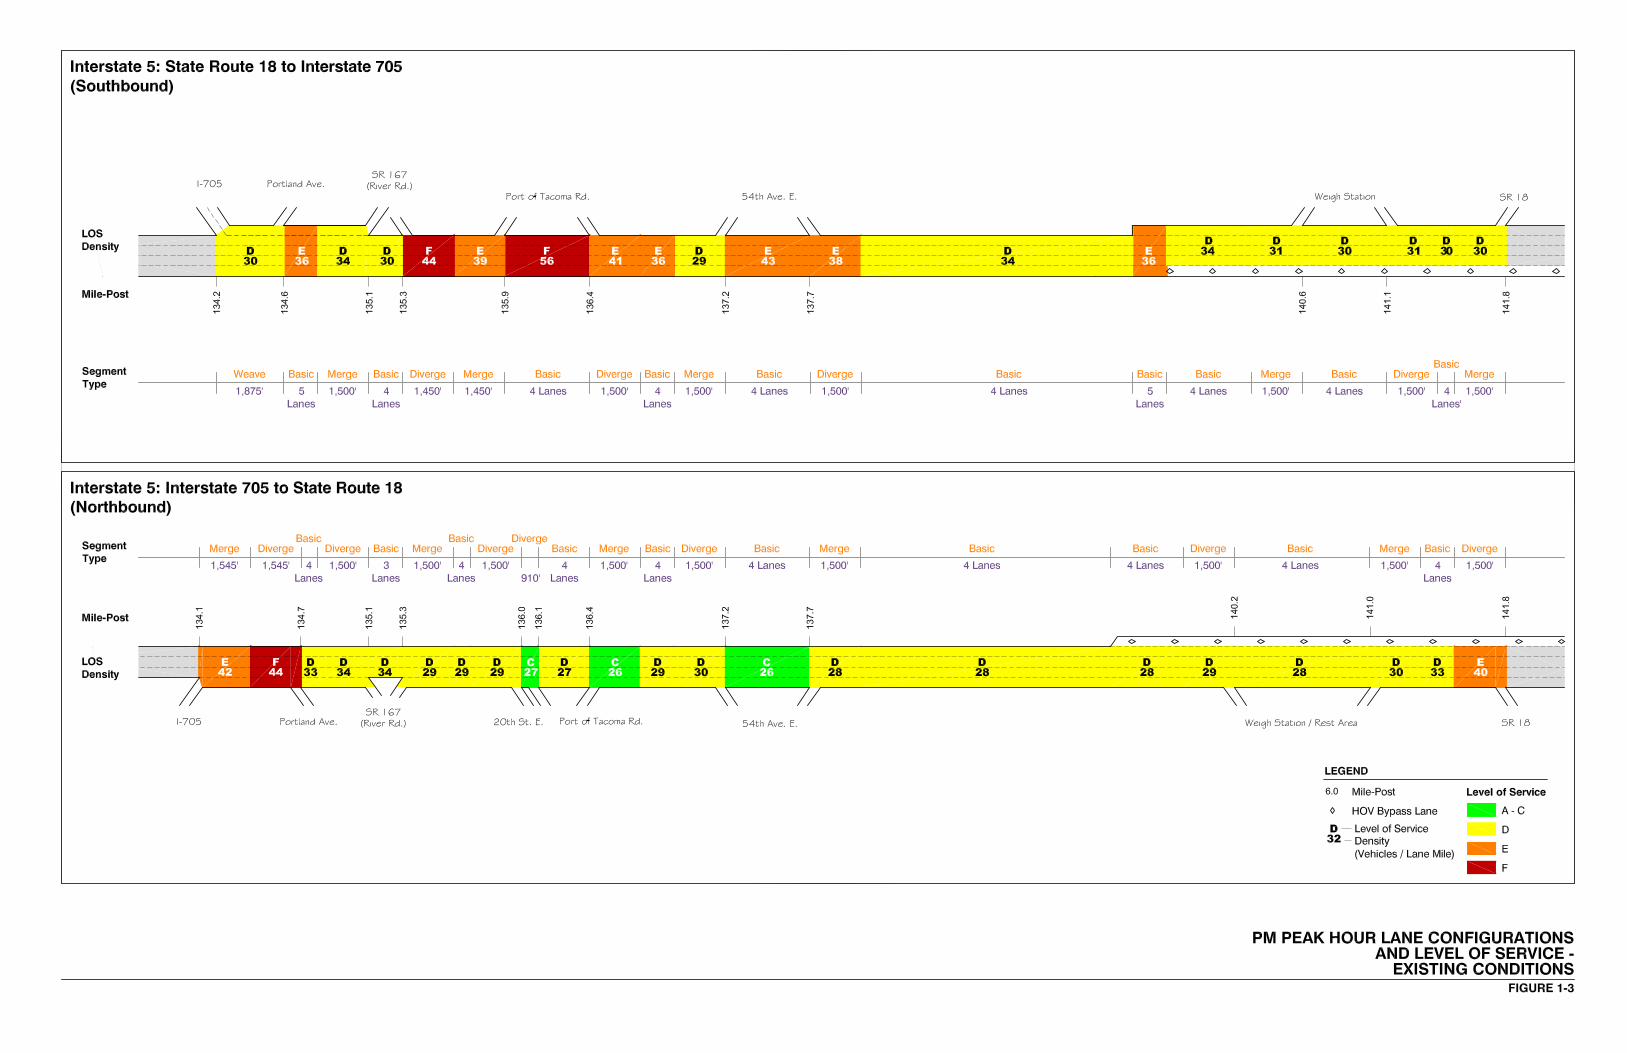
There are three interchanges on I-5 between I-705 and SR 18: (1) SR 167/Portland Avenue,
(2) Port of Tacoma Road, and (3) 54th Avenue East, as well as a set of northbound and
southbound truck scales. The three interchanges vary in configuration from a weaved set of
ramps at SR 167/Portland Avenue to modified diamonds at Port of Tacoma Road and 54th
Avenue East, where loop ramps serve one or more movements. Figures 1-2 and 1-3 provide a
schematic representation of the existing freeway lanes, density, and LOS operating conditions at
different freeway segments on the I-5 corridor within the study area.


Final Intersection Justification Report BergerABAM, SAPWT-09-139
Port of Tacoma Road Intersection with Interstate 5 February 2012
City of Fife, Washington Page 1-12
During the AM peak hour, all southbound freeway segments operate at LOS D or better,
however 6 of the 18 northbound freeway segments on I-5 operate at LOS E: the I-705 on-ramp,
off-ramp diverge to East 28th Street/Portland Avenue, the segment between Portland Avenue
and SR 167 (River Road), the SR 167 off-ramp diverge, the segment between SR 167 (River
Road) off/on-ramps, and the off-ramp to SR 18.
During the PM peak hour, three northbound and nine southbound freeway segments operate at
LOS E or LOS F. In the northbound direction, the I-705 merge, Portland Avenue diverge, and
the SR 18 diverge, operate at LOS E or LOS F. All other northbound segments operate at LOS D
or better.
In the southbound direction, all but one of the seven segments from the diverge at 54th Avenue
East to the diverge at SR 167 operates at LOS E or LOS F. In addition, the basic segments
approaching Portland Avenue and south of the HOV lane terminus operate at LOS E. The two
failing southbound segments are between the Port of Tacoma Road on/off-ramps, and the
diverge approaching SR 167.
Existing freeway volumes are directional, with higher northbound volumes in the AM peak
hour and higher southbound volumes in the PM peak hour. Total volumes on I-5 during the PM
peak hour are 10 to 20 percent higher than the AM peak hour volumes.
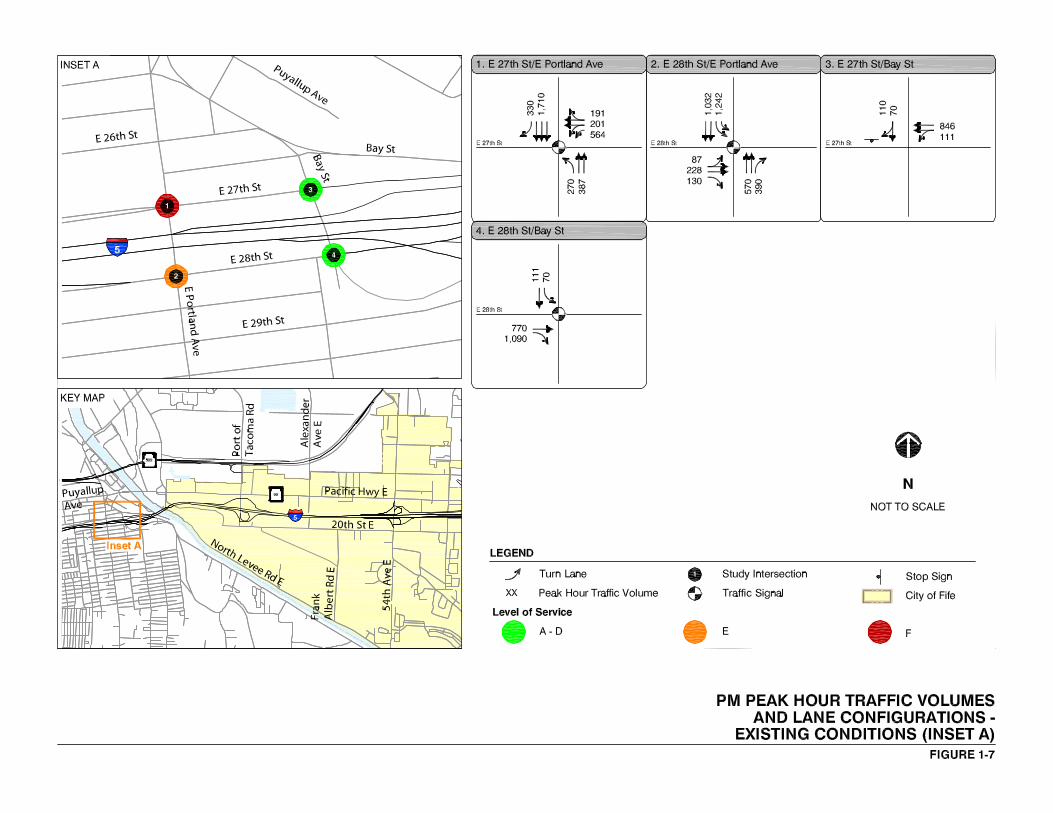
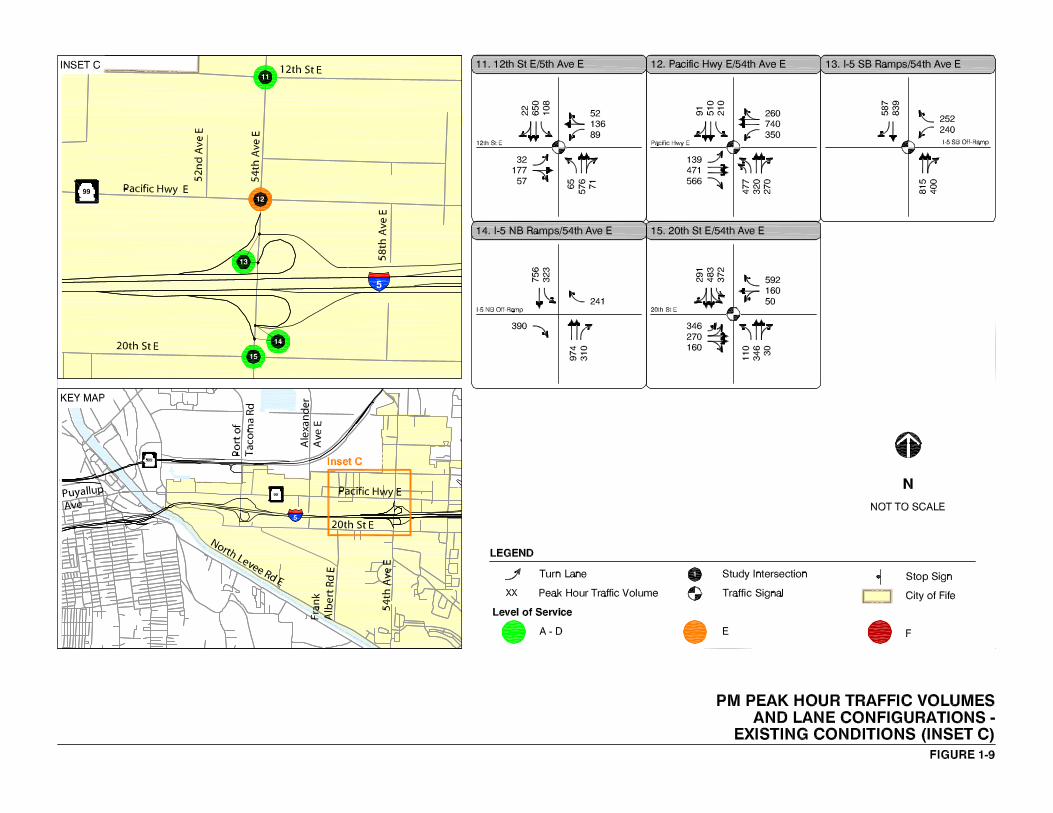
1.5.5.2 Intersections
The evaluation examined 15 intersections, including major intersections and ramp termini, in
the study area. Figures 1-4 to 1-9 show the AM or PM peak hour volumes by movement, the
overall LOS operation, and the intersection channelization and traffic controls for each
intersection. Table 1-5 summarizes the intersection control delay and LOS conditions for the
AM and PM peak hours. The LOS at each intersection is determined by average control and
queue delays per vehicle in seconds. Table 1-5 reports the LOS by individual approach and for
the overall intersection.
Three of the study intersections have minor street stop-controls and nine are signalized. Two
intersections are uncontrolled, with the intersection serving a freeway on-ramp. In the AM peak
hour, all intersections operate overall at LOS C or better. Of the individual approaches, the
westbound approach of the Port of Tacoma Road/I-5 southbound off-ramp operates at LOS E
during the AM peak hour.
In the PM peak hour, the signal at East Portland Avenue/East 27th Street operates at LOS F with
westbound and southbound failing approaches. The East Portland Avenue/East 28th Street
intersections operate at LOS E overall, with the northbound approach operating at LOS F. The
Port of Tacoma Road/Pacific Highway East/I-5 southbound ramps intersection has overall
operations of LOS E, with the I-5 southbound ramp westbound Pacific Highway South
approaches operating at LOS F. The intersection of 54th Avenue East/Pacific Highway East
operates at LOS E overall, with the eastbound and southbound approaches operating at LOS F.
All other intersections operate overall at LOS D or better in the PM peak hour.


Final Intersection Justification Report BergerABAM, SAPWT-09-139
Port of Tacoma Road Intersection with Interstate 5 February 2012
City of Fife, Washington Page 1-19
Table 1-5. Intersection Levels of Service - Existing Peak Hour Conditions
Intersection Traffic Control
AM Peak Hour PM Peak Hour
NB SB EB WB Total NB SB EB WB Total
1 E. Portland Ave/E. 27th St Signal B/12 B/12 B/19 B/14 D/36 F/182 F/97 F/133
2 E. Portland Ave/E. 28th St Signal B/14 C/22 D/36 C/21 F/94 C/28 D/49 E/56
3 E. Bay St/E. 27th St SSSC A/6 A/2 A/3 C/16 B/14 B/15
4 E. Bay St/E. 28th St Signal B/20 A/8 B/11 C/32 D/43 D/42
5 POT Rd/I-509 EB Ramps Signal B/13 B/13 B/17 A/1 B/13 B/10 A/9 B/15 A/2 B/10
6 POT Rd/Pacific Hwy Signal A/8 D/50 D/54 D/49 C/35 B/13 E/70 E/76 F/110 E/79
7 POT Rd/I-5 SB Ramps Signal D/39 A/1 E/64 C/33 D/48 A/1 F/91 C/25
8 POT Rd/I-5 NB Ramps Unct. A/0 A/7 A/2 A/3 A/0 C/30 A/2 A/10
9 POT Rd/20th St E SSSC A/6 A/1 B/13 B/13 A/6 B/14 A/1 B/14 A/7 A/6
10 Industry Dr. E/20th St E SSSC C/26 A/2 A/2 A/7 C/27 A/2 A/2 A/5
11 54th Ave E/12th St E Signal A/6 A/5 B/16 B/15 A/8 A/9 B/10 B/19 B/19 B/12
12 54th Ave E/Pacific Hwy Signal C/25 D/44 D/47 C/33 C/35 C/33 F/129 F/131 D/42 E/79
13 54th Ave E/I-5 SB Ramps Signal A/7 A/2 C/35 B/12 A/8 A/9 D/55 B/18
14 54th Ave E/I-5 NB Ramps Unct. A/0 B/12 A/9 A/5 A/1 E/66 D/47 C/32
15 54th Ave E/20th St E Signal D/42 C/21 D/42 C/23 C/30 D/52 C/24 D/46 C/30 D/35
Notes: SSSC = Side-Street Stop-Controlled. Unct. = Uncontrolled Source: Fehr & Peers, 2010.

Final Intersection Justification Report BergerABAM, SAPWT-09-139
Port of Tacoma Road Intersection with Interstate 5 February 2012
City of Fife, Washington Page 1-20
1.5.6 Safety
The safety analysis is based on historical accident data collected between 2002 and 2008 from
WSDOT and the City. The analysis looks at accident rates by facility type (freeway, ramp,
corridor, and intersection), by accident type, and severity. A review of historical accident data
provided an indication of the location and severity of incidents at intersections and along
corridors.
Historical analysis is useful in understanding the typical types of accidents that occur at a
particular location; however, the data may not be indicative of future accident rates or causes. A
number of factors can contribute to accidents, including
• Traffic congestion (ability to maneuver)
• Driver skills (driver age and experience)
• Driver behavior (speeding, aggressiveness, driving while intoxicated)
• Roadway geometrics (sight distance)
• Weather conditions (rain, glare, snow)
• Nature (animals, fallen trees)
• Vehicle condition, equipment, and maintenance (brakes, tires)
• Roadway condition (pavement condition)
Because multiple factors often are responsible for accidents, not all accidents are attributable to
a single cause. However, consistent trends in the frequency or type of accidents over time may
indicate issues related to geometrics of the facility.
1.5.6.1 Freeway Segments
Seven years (2002 to 2008) of freeway accident data are summarized in the following tables.
Reviewing the trends over the period for I-5 corridor, there were no significant changes in the
corridor frequency, type, or severity of accident. WSDOT uses accidents per million vehicle
miles (MVM) to calculate a rate that allows comparison between the segments of the freeway.
The formula for the accident rate is as follows.
Freeway Segment Accident Rate = (Total Accidents x 1 million)/( 7 x ADT x 365 x length)
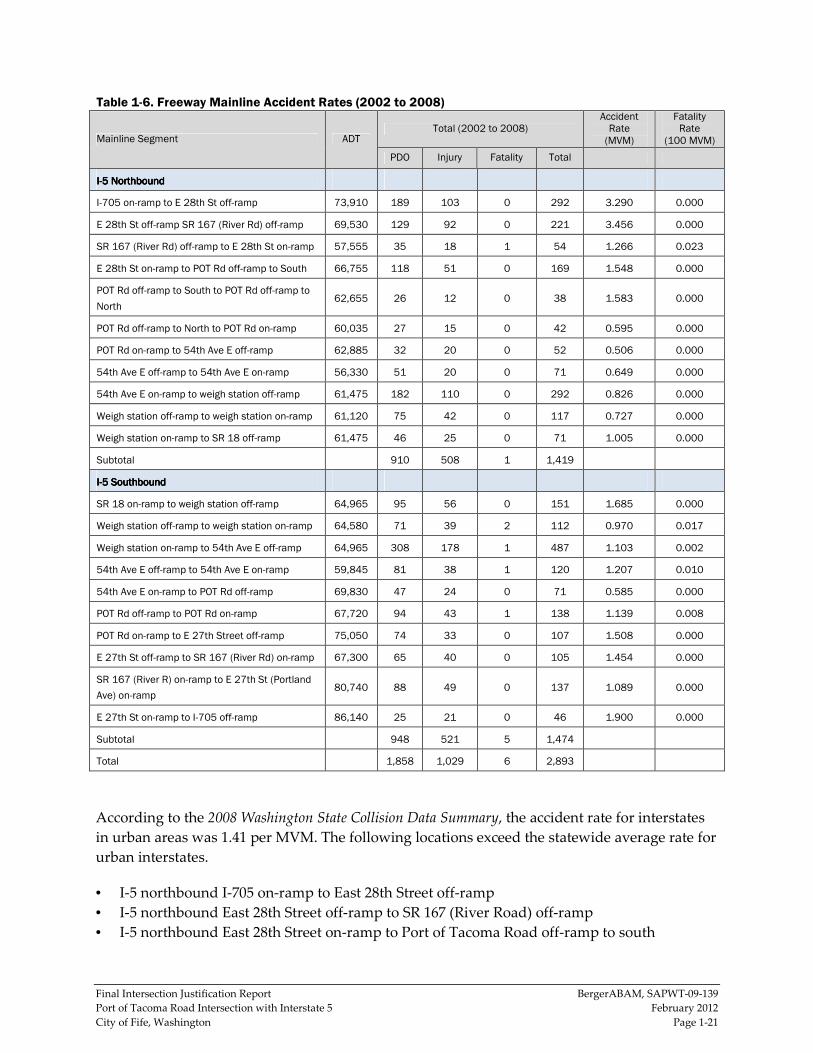
The freeway mainline accident analysis identifies the segment location, traffic volume, and
severity, as well as the accident and fatality rate. Within the project area, freeway mainline
accidents were highest northbound on I-5 between the East 28th Street off-ramp to the East Bay
Street/SR 167 off-ramp (3.4 accidents per MVM) and lowest at the Port of Tacoma Road on-ramp
to 54th Avenue East off-ramp segment. Injury accidents were more than one-third of the total,
and six fatalities were recorded over the 7-year period. Table 1-6 summarizes the results of the
freeway mainline accident rates for 2002 to 2008.
Final Intersection Justification Report BergerABAM, SAPWT-09-139
Port of Tacoma Road Intersection with Interstate 5 February 2012
City of Fife, Washington Page 1-21
Table 1-6. Freeway Mainline Accident Rates (2002 to 2008)
Mainline Segment ADT Total (2002 to 2008)
Accident Rate (MVM)
Fatality Rate
(100 MVM)
PDO Injury Fatality Total
IIII----5 Northbound5 Northbound5 Northbound5 Northbound
I-705 on-ramp to E 28th St off-ramp 73,910 189 103 0 292 3.290 0.000
E 28th St off-ramp SR 167 (River Rd) off-ramp 69,530 129 92 0 221 3.456 0.000
SR 167 (River Rd) off-ramp to E 28th St on-ramp 57,555 35 18 1 54 1.266 0.023
E 28th St on-ramp to POT Rd off-ramp to South 66,755 118 51 0 169 1.548 0.000
POT Rd off-ramp to South to POT Rd off-ramp to
North 62,655 26 12 0 38 1.583 0.000
POT Rd off-ramp to North to POT Rd on-ramp 60,035 27 15 0 42 0.595 0.000
POT Rd on-ramp to 54th Ave E off-ramp 62,885 32 20 0 52 0.506 0.000
54th Ave E off-ramp to 54th Ave E on-ramp 56,330 51 20 0 71 0.649 0.000
54th Ave E on-ramp to weigh station off-ramp 61,475 182 110 0 292 0.826 0.000
Weigh station off-ramp to weigh station on-ramp 61,120 75 42 0 117 0.727 0.000
Weigh station on-ramp to SR 18 off-ramp 61,475 46 25 0 71 1.005 0.000
Subtotal 910 508 1 1,419
IIII----5 Southbound5 Southbound5 Southbound5 Southbound
SR 18 on-ramp to weigh station off-ramp 64,965 95 56 0 151 1.685 0.000
Weigh station off-ramp to weigh station on-ramp 64,580 71 39 2 112 0.970 0.017
Weigh station on-ramp to 54th Ave E off-ramp 64,965 308 178 1 487 1.103 0.002
54th Ave E off-ramp to 54th Ave E on-ramp 59,845 81 38 1 120 1.207 0.010
54th Ave E on-ramp to POT Rd off-ramp 69,830 47 24 0 71 0.585 0.000
POT Rd off-ramp to POT Rd on-ramp 67,720 94 43 1 138 1.139 0.008
POT Rd on-ramp to E 27th Street off-ramp 75,050 74 33 0 107 1.508 0.000
E 27th St off-ramp to SR 167 (River Rd) on-ramp 67,300 65 40 0 105 1.454 0.000
SR 167 (River R) on-ramp to E 27th St (Portland
Ave) on-ramp 80,740 88 49 0 137 1.089 0.000
E 27th St on-ramp to I-705 off-ramp 86,140 25 21 0 46 1.900 0.000
Subtotal 948 521 5 1,474
Total 1,858 1,029 6 2,893
According to the 2008 Washington State Collision Data Summary, the accident rate for interstates
in urban areas was 1.41 per MVM. The following locations exceed the statewide average rate for
urban interstates.
• I-5 northbound I-705 on-ramp to East 28th Street off-ramp
• I-5 northbound East 28th Street off-ramp to SR 167 (River Road) off-ramp
• I-5 northbound East 28th Street on-ramp to Port of Tacoma Road off-ramp to south
Final Intersection Justification Report BergerABAM, SAPWT-09-139
Port of Tacoma Road Intersection with Interstate 5 February 2012
City of Fife, Washington Page 1-22
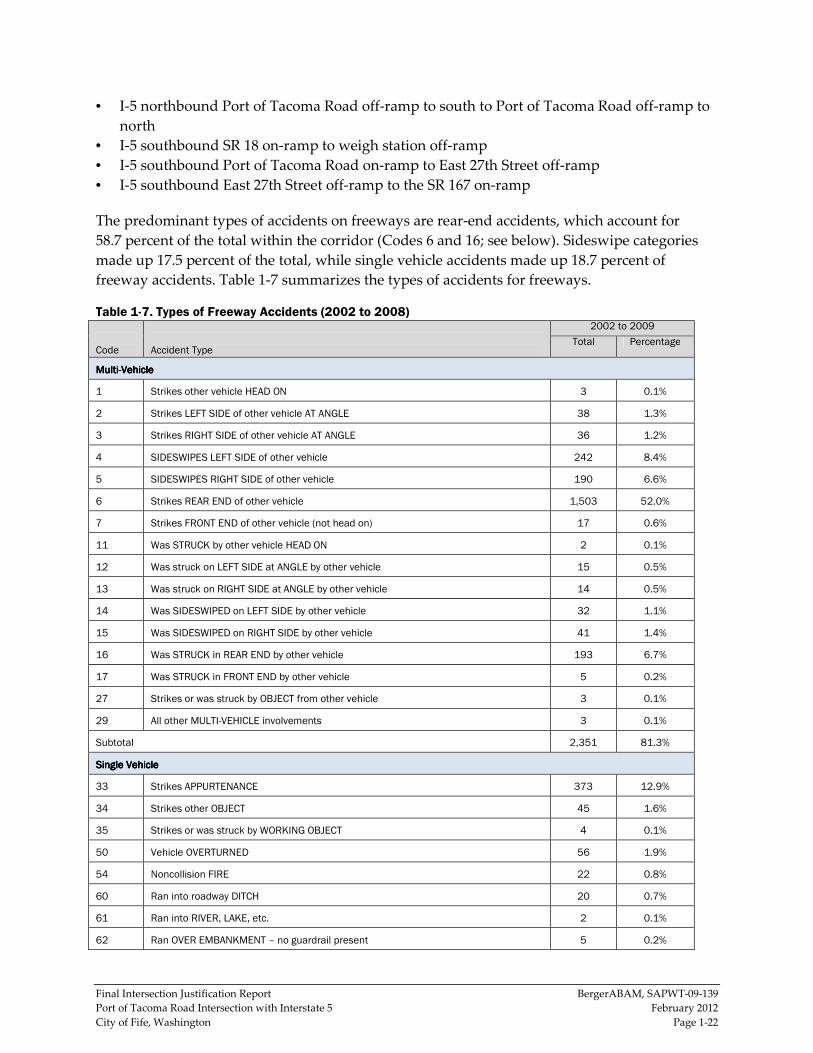
• I-5 northbound Port of Tacoma Road off-ramp to south to Port of Tacoma Road off-ramp to
north
• I-5 southbound SR 18 on-ramp to weigh station off-ramp
• I-5 southbound Port of Tacoma Road on-ramp to East 27th Street off-ramp
• I-5 southbound East 27th Street off-ramp to the SR 167 on-ramp
The predominant types of accidents on freeways are rear-end accidents, which account for
58.7 percent of the total within the corridor (Codes 6 and 16; see below). Sideswipe categories
made up 17.5 percent of the total, while single vehicle accidents made up 18.7 percent of
freeway accidents. Table 1-7 summarizes the types of accidents for freeways.
Table 1-7. Types of Freeway Accidents (2002 to 2008) Code
Accident Type
2002 to 2009
Total Percentage
MultiMultiMultiMulti----VehicleVehicleVehicleVehicle
1 Strikes other vehicle HEAD ON 3 0.1%
2 Strikes LEFT SIDE of other vehicle AT ANGLE 38 1.3%
3 Strikes RIGHT SIDE of other vehicle AT ANGLE 36 1.2%
4 SIDESWIPES LEFT SIDE of other vehicle 242 8.4%
5 SIDESWIPES RIGHT SIDE of other vehicle 190 6.6%
6 Strikes REAR END of other vehicle 1,503 52.0%
7 Strikes FRONT END of other vehicle (not head on) 17 0.6%
11 Was STRUCK by other vehicle HEAD ON 2 0.1%
12 Was struck on LEFT SIDE at ANGLE by other vehicle 15 0.5%
13 Was struck on RIGHT SIDE at ANGLE by other vehicle 14 0.5%
14 Was SIDESWIPED on LEFT SIDE by other vehicle 32 1.1%
15 Was SIDESWIPED on RIGHT SIDE by other vehicle 41 1.4%
16 Was STRUCK in REAR END by other vehicle 193 6.7%
17 Was STRUCK in FRONT END by other vehicle 5 0.2%
27 Strikes or was struck by OBJECT from other vehicle 3 0.1%
29 All other MULTI-VEHICLE involvements 3 0.1%
Subtotal 2,351 81.3%
Single VehicleSingle VehicleSingle VehicleSingle Vehicle
33 Strikes APPURTENANCE 373 12.9%
34 Strikes other OBJECT 45 1.6%
35 Strikes or was struck by WORKING OBJECT 4 0.1%
50 Vehicle OVERTURNED 56 1.9%
54 Noncollision FIRE 22 0.8%
60 Ran into roadway DITCH 20 0.7%
61 Ran into RIVER, LAKE, etc. 2 0.1%
62 Ran OVER EMBANKMENT – no guardrail present 5 0.2%
Final Intersection Justification Report BergerABAM, SAPWT-09-139
Port of Tacoma Road Intersection with Interstate 5 February 2012
City of Fife, Washington Page 1-23
Table 1-7. Types of Freeway Accidents (2002 to 2008) Code
Accident Type
2002 to 2009
Total Percentage
98 Jackknife trailer 4 0.1%
99 All other SINGLE VEHICLE involvements 11 0.4%
Subtotal 542 18.7%
Total 2893 100.0%
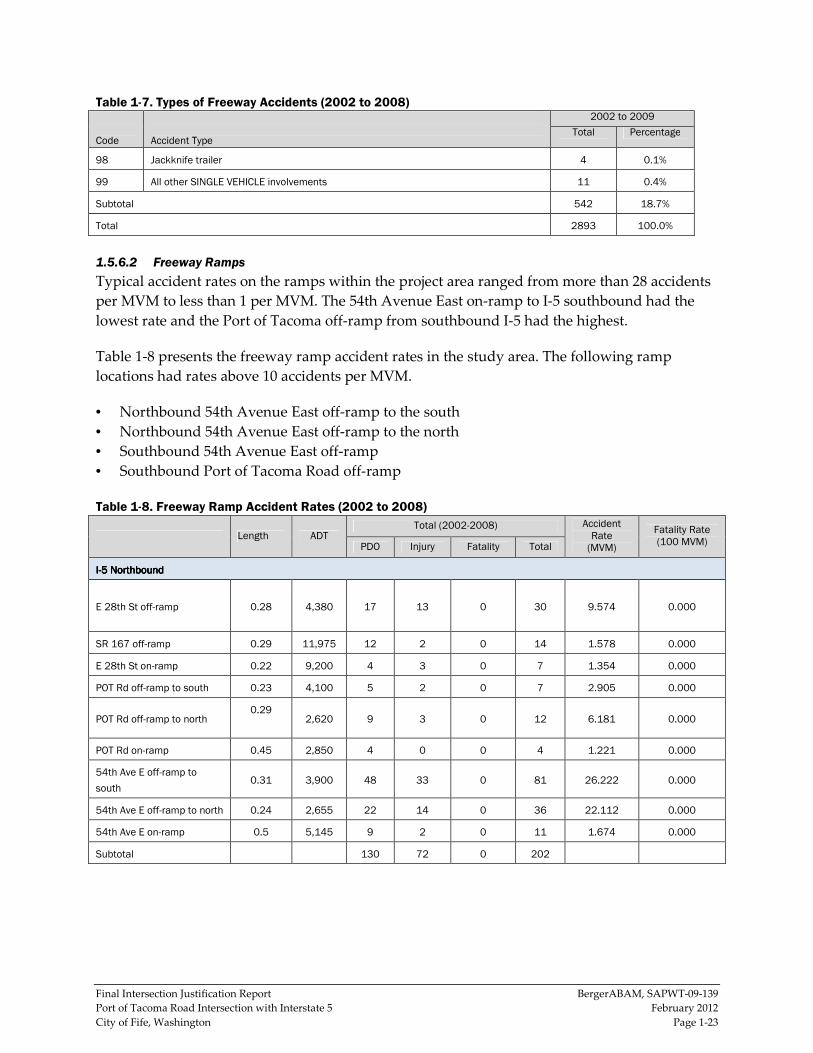
1.5.6.2 Freeway Ramps
Typical accident rates on the ramps within the project area ranged from more than 28 accidents
per MVM to less than 1 per MVM. The 54th Avenue East on-ramp to I-5 southbound had the
lowest rate and the Port of Tacoma off-ramp from southbound I-5 had the highest.
Table 1-8 presents the freeway ramp accident rates in the study area. The following ramp
locations had rates above 10 accidents per MVM.
• Northbound 54th Avenue East off-ramp to the south
• Northbound 54th Avenue East off-ramp to the north
• Southbound 54th Avenue East off-ramp
• Southbound Port of Tacoma Road off-ramp
Table 1-8. Freeway Ramp Accident Rates (2002 to 2008)
Length ADT Total (2002-2008) Accident
Rate (MVM)
Fatality Rate (100 MVM) PDO Injury Fatality Total
IIII----5 Northbound5 Northbound5 Northbound5 Northbound
E 28th St off-ramp 0.28 4,380 17 13 0 30 9.574 0.000
SR 167 off-ramp 0.29 11,975 12 2 0 14 1.578 0.000
E 28th St on-ramp 0.22 9,200 4 3 0 7 1.354 0.000
POT Rd off-ramp to south 0.23 4,100 5 2 0 7 2.905 0.000
POT Rd off-ramp to north 0.29
2,620 9 3 0 12 6.181 0.000
POT Rd on-ramp 0.45 2,850 4 0 0 4 1.221 0.000
54th Ave E off-ramp to
south 0.31 3,900 48 33 0 81 26.222 0.000
54th Ave E off-ramp to north 0.24 2,655 22 14 0 36 22.112 0.000
54th Ave E on-ramp 0.5 5,145 9 2 0 11 1.674 0.000
Subtotal 130 72 0 202

Final Intersection Justification Report BergerABAM, SAPWT-09-139
Port of Tacoma Road Intersection with Interstate 5 February 2012
City of Fife, Washington Page 1-24
Table 1-8. Freeway Ramp Accident Rates (2002 to 2008)
Length ADT Total (2002-2008) Accident
Rate (MVM)
Fatality Rate (100 MVM) PDO Injury Fatality Total
IIII----5 Southbound5 Southbound5 Southbound5 Southbound
54th Ave E off-ramp 0.29 5,120 23 16 0 39 10.280 0.000
54th Ave E on-ramp from
south 0.28 4,650 1 1 0 2 0.601 0.000
54th Ave E on-ramp from
north 0.41 5,335 8 6 0 14 2.505 0.000
POT Rd off-ramp 0.32 2,110 33 16 0 49 28.404 0.000
POT Rd on-ramp 0.41 7,330 16 5 0 21 2.735 0.000
E 27th St off-ramp 0.28 7,750 19 17 0 36 6.493 0.000
SR 167 on-ramp 0.38 13,440 17 9 0 26 1.993 0.000
E 27th St on-ramp 0.60 5,400 10 3 0 13 1.570 0.000
Subtotal 127 73 0 200
Total 257 145 0 402
Rear-end accidents dominated freeway ramp accidents, accounting for 47 percent of the total.
Single vehicle accidents made up 38.6 percent, with two-thirds of these accidents related to
striking a ramp appurtenance or other stationary object. Table 1-9 summarizes the types of
accidents occurring on freeway ramps.
1.5.6.3 Local Corridors
Local corridors were analyzed for the 7-year period between 2002 and 2008. Overall, more than
100 accidents occurred along the six major corridors within the study area, which include
12th Street East, Pacific Highway East, 20th Avenue East, Port of Tacoma Road, Alexander
Avenue East, and 54th Avenue East. Tables 1-10 and 1-11 summarize the local corridor results
for roadway segments and intersections, respectively.
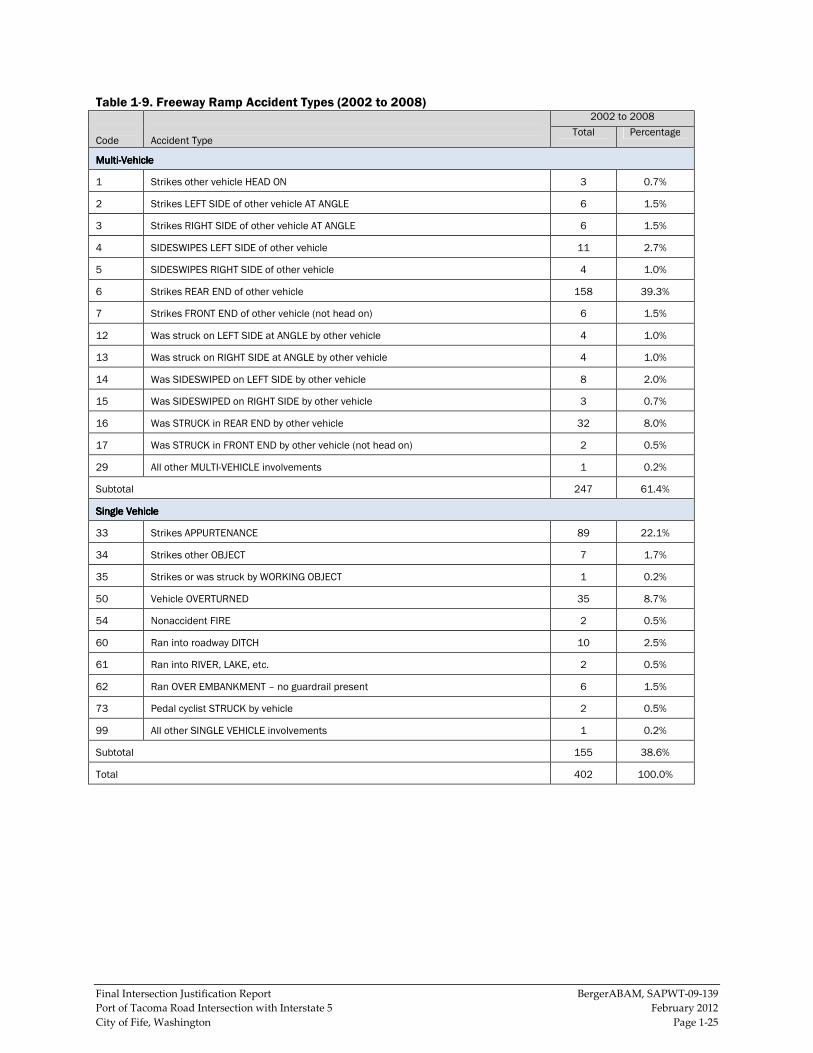
Final Intersection Justification Report BergerABAM, SAPWT-09-139
Port of Tacoma Road Intersection with Interstate 5 February 2012
City of Fife, Washington Page 1-25
Table 1-9. Freeway Ramp Accident Types (2002 to 2008) Code
Accident Type
2002 to 2008
Total Percentage
MultiMultiMultiMulti----VehicleVehicleVehicleVehicle
1 Strikes other vehicle HEAD ON 3 0.7%
2 Strikes LEFT SIDE of other vehicle AT ANGLE 6 1.5%
3 Strikes RIGHT SIDE of other vehicle AT ANGLE 6 1.5%
4 SIDESWIPES LEFT SIDE of other vehicle 11 2.7%
5 SIDESWIPES RIGHT SIDE of other vehicle 4 1.0%
6 Strikes REAR END of other vehicle 158 39.3%
7 Strikes FRONT END of other vehicle (not head on) 6 1.5%
12 Was struck on LEFT SIDE at ANGLE by other vehicle 4 1.0%
13 Was struck on RIGHT SIDE at ANGLE by other vehicle 4 1.0%
14 Was SIDESWIPED on LEFT SIDE by other vehicle 8 2.0%
15 Was SIDESWIPED on RIGHT SIDE by other vehicle 3 0.7%
16 Was STRUCK in REAR END by other vehicle 32 8.0%
17 Was STRUCK in FRONT END by other vehicle (not head on) 2 0.5%
29 All other MULTI-VEHICLE involvements 1 0.2%
Subtotal 247 61.4%
Single VehicleSingle VehicleSingle VehicleSingle Vehicle
33 Strikes APPURTENANCE 89 22.1%
34 Strikes other OBJECT 7 1.7%
35 Strikes or was struck by WORKING OBJECT 1 0.2%
50 Vehicle OVERTURNED 35 8.7%
54 Nonaccident FIRE 2 0.5%
60 Ran into roadway DITCH 10 2.5%
61 Ran into RIVER, LAKE, etc. 2 0.5%
62 Ran OVER EMBANKMENT – no guardrail present 6 1.5%
73 Pedal cyclist STRUCK by vehicle 2 0.5%
99 All other SINGLE VEHICLE involvements 1 0.2%
Subtotal 155 38.6%
Total 402 100.0%
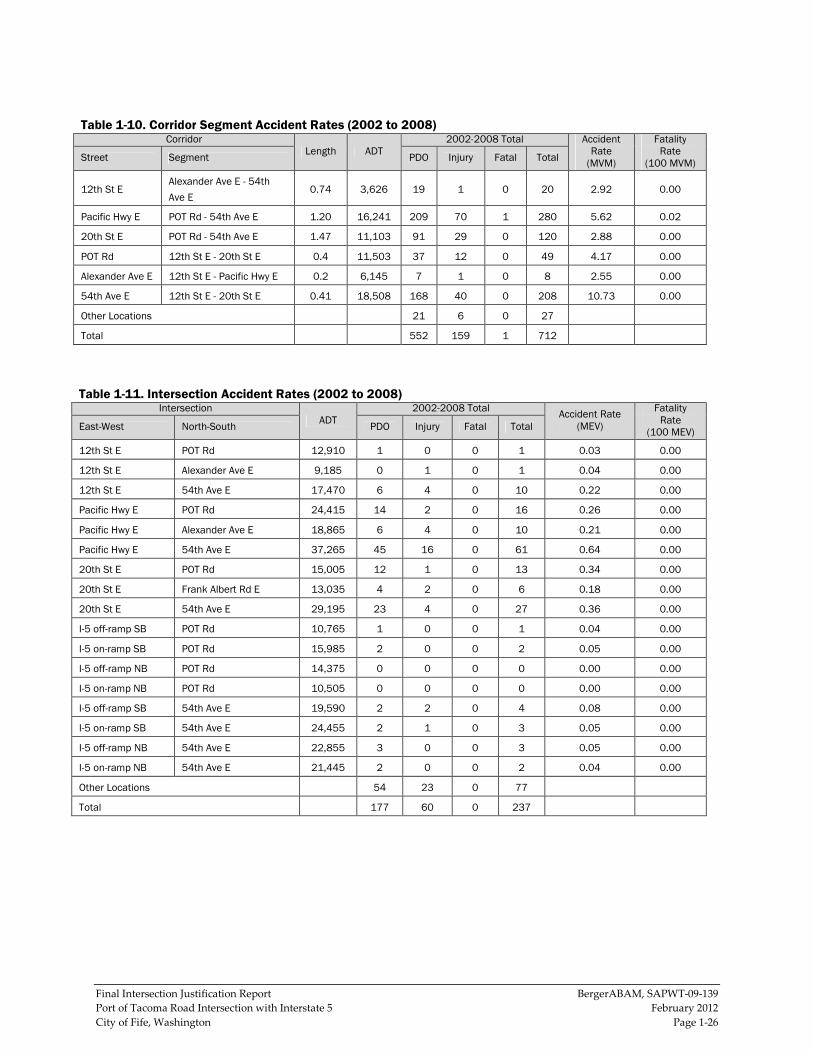
Final Intersection Justification Report BergerABAM, SAPWT-09-139
Port of Tacoma Road Intersection with Interstate 5 February 2012
City of Fife, Washington Page 1-26
Table 1-10. Corridor Segment Accident Rates (2002 to 2008) Corridor
Length ADT 2002-2008 Total Accident
Rate (MVM)
Fatality Rate
(100 MVM) Street Segment PDO Injury Fatal Total
12th St E Alexander Ave E - 54th
Ave E 0.74 3,626 19 1 0 20 2.92 0.00
Pacific Hwy E POT Rd - 54th Ave E 1.20 16,241 209 70 1 280 5.62 0.02
20th St E POT Rd - 54th Ave E 1.47 11,103 91 29 0 120 2.88 0.00
POT Rd 12th St E - 20th St E 0.4 11,503 37 12 0 49 4.17 0.00
Alexander Ave E 12th St E - Pacific Hwy E 0.2 6,145 7 1 0 8 2.55 0.00
54th Ave E 12th St E - 20th St E 0.41 18,508 168 40 0 208 10.73 0.00
Other Locations 21 6 0 27
Total 552 159 1 712
Table 1-11. Intersection Accident Rates (2002 to 2008) Intersection
ADT 2002-2008 Total
Accident Rate (MEV)
Fatality Rate
(100 MEV) East-West North-South PDO Injury Fatal Total
12th St E POT Rd 12,910 1 0 0 1 0.03 0.00
12th St E Alexander Ave E 9,185 0 1 0 1 0.04 0.00
12th St E 54th Ave E 17,470 6 4 0 10 0.22 0.00
Pacific Hwy E POT Rd 24,415 14 2 0 16 0.26 0.00
Pacific Hwy E Alexander Ave E 18,865 6 4 0 10 0.21 0.00
Pacific Hwy E 54th Ave E 37,265 45 16 0 61 0.64 0.00
20th St E POT Rd 15,005 12 1 0 13 0.34 0.00
20th St E Frank Albert Rd E 13,035 4 2 0 6 0.18 0.00
20th St E 54th Ave E 29,195 23 4 0 27 0.36 0.00
I-5 off-ramp SB POT Rd 10,765 1 0 0 1 0.04 0.00
I-5 on-ramp SB POT Rd 15,985 2 0 0 2 0.05 0.00
I-5 off-ramp NB POT Rd 14,375 0 0 0 0 0.00 0.00
I-5 on-ramp NB POT Rd 10,505 0 0 0 0 0.00 0.00
I-5 off-ramp SB 54th Ave E 19,590 2 2 0 4 0.08 0.00
I-5 on-ramp SB 54th Ave E 24,455 2 1 0 3 0.05 0.00
I-5 off-ramp NB 54th Ave E 22,855 3 0 0 3 0.05 0.00
I-5 on-ramp NB 54th Ave E 21,445 2 0 0 2 0.04 0.00
Other Locations 54 23 0 77
Total 177 60 0 237

Final Intersection Justification Report BergerABAM, SAPWT-09-139
Port of Tacoma Road Intersection with Interstate 5 February 2012
City of Fife, Washington Page 1-27
The analysis used the same segment methodology to calculate the accident rate for each
corridor. The formula for the accident rate for corridors is as follows.
Corridor Accident Rate = (Total Accidents x 1 million)/(7 x ADT x 365 x length)
Corridors accidents (Table 1-10) include collisions at driveways and minor intersections within
each segment, but do not include major intersections in the planning area; they were evaluated
separately. Accident rates for roadway segments ranged from a high of 10.73 accidents per
MVM on 54th Avenue East to 2.55 per MVM on Alexander Avenue East. Typical accident rates
(source: 2008 Washington State Collision Data Summary) for Puget Sound principal arterials
average 2.5 to 3.0 per MVM, while rates on minor arterials average 3.5 to 4.0 per MVM. On this
basis, most of the corridor segment accident rates are higher than average, notably along Pacific
Highway and 54th Avenue East.
1.5.6.4 Local Intersections
The analysis used the number of accidents and the annual daily traffic entering an intersection
to evaluate the rates of accidents at local intersections between 2002 and 2008. The formula for
the intersection accident rate is as follows.
Intersection Accident Rate = (Total Accidents x 1 million)/(7 years x ADT x 365)
The intersection accidents include all accidents occurring at intersections as identified by the
City. Average urban area signalized intersection accident rates are typically in the 0.7 to 0.9 per
million entering vehicles (MEV) range (source: King County collision records, 2008). The highest
accident rate occurred at Pacific Highway East/Port of Tacoma Road with 0.64 accident per
MEV. The I-5 northbound on- and off-ramps had no recorded accidents during this period.
1.6 No-Build Conditions for 2020 (Year of Opening)
The analysis of the No-Build alternative represents the operating conditions without the
construction of the Proposed Alternative. The no-build conditions for 2020 provide a
comparison for the Proposed Alternative at its year of opening. The No-Build condition
assumes no additional improvements to freeways, interchanges, arterials, or ramps within the
study area, other than those identified in local and regional planning documents. For 2020, the
No-Build analysis assumes that the SR 167 interchange and extension are not constructed.
Table 1-1 lists assumed improvements.
1.6.1 No-Build 2020 Traffic Operations
The evaluation analyzed traffic conditions for the 2020 AM and PM peak hours for freeways
and major intersections.
1.6.1.1 Freeway Operations (2020 No-Build)
The analysis of 2020 No-Build conditions included freeway basic mainline segments, merge and
diverge, and weaving segments.
The northbound I-5 mainline in the AM peak hour would generally operate at LOS E with
12 out of 20 mainline segments operating at LOS E during the AM peak hour. The LOS E

Final Intersection Justification Report BergerABAM, SAPWT-09-139
Port of Tacoma Road Intersection with Interstate 5 February 2012
City of Fife, Washington Page 1-28
segments extend from the 28th Street on-ramp to SR 18. While only six segments operate at LOS
E in the northbound direction in the AM peak hour under existing conditions, all of these
segments are south of the 28th Street on-ramp. The extension of the HOV lane through the
study area would shift the location of the freeway bottleneck to the north, improving segments
south of the 28th Street on-ramp to LOS D, but worsening segments further north to LOS E.
The southbound I-5 mainline in the AM peak hour would operate better than the northbound
mainline. In the 2020 No-Build conditions, only two southbound segments would operate at
LOS E and one would operate at LOS F. The diverge segment at the off-ramp to 54 Avenue East
would operate at LOS F due to queues extending back from the local street intersection. Under
existing conditions, all segments operate at LOS D or better.
During the PM peak hour, 3 of 20 northbound I-5 segments would operate at LOS E. These
segments include the diverge segment at the off-ramp to East 28th Street/Portland Avenue, the
basic segment between Port of Tacoma Road off- and on-ramps, and the merge segment at the
on-ramp from the truck scales. The analysis of existing conditions showed that two segments
currently operate at LOS E and one operates at LOS F.
Under 2020 No-Build conditions, fewer segments along the southbound I-5 mainline would
operate at LOS E or F during the PM peak hour than under existing conditions because the
assumed extension of the HOV lane south to Tacoma would remove the existing bottlenecks
and improve traffic operations.
Table 1-12 summarizes the I-5 mainline operations under 2020 No-Build conditions.
Figures 1-10 and 1-11 represent the 2020 No-Build freeway lanes, density, and LOS operating
conditions schematically at different freeway segments on the I-5 corridor within the study area.
Table 1-12. 2020 No-Build I-5 Mainline Freeway Operations Summary
Type
AM Peak Hour PM Peak Hour
LOS Density1 LOS Density1
IIII----5 Northbound5 Northbound5 Northbound5 Northbound
I-5 NB on-ramp from I-705 Merge D 29 D 35
I-5 NB off-ramp to E 28th Street/Portland Ave Diverge C 28 E 36
I-5 NB off-ramp to E Bay Street Diverge D 31 D 34
I-5 NB between E Bay Street off/on-ramps Basic D 33 D 27
I-5 NB on-ramp from E 28th Street Merge D 31 C 25
I-5 NB between E 28th Street. On-ramp and POT Rd off-ramp Basic E 35 D 29
I-5 NB off-ramp to POT Rd SB Diverge E 36 D 30
I-5 NB off-ramp to POT Rd NB Diverge E 41 D 33
I-5 NB between POT Rd NB off/on-ramps Basic E 41 E 35
I-5 NB on-ramp from POT Rd Merge C 27 C 24
I-5 NB between POT Rd and 54th Ave E Basic E 36 D 32

Final Intersection Justification Report BergerABAM, SAPWT-09-139
Port of Tacoma Road Intersection with Interstate 5 February 2012
City of Fife, Washington Page 1-29
Table 1-12. 2020 No-Build I-5 Mainline Freeway Operations Summary
Type
AM Peak Hour PM Peak Hour
LOS Density1 LOS Density1
I-5 NB off-ramp to 54th Ave E Diverge E 37 D 33
I-5 NB between 54th Ave E on/off-ramps Basic D 30 D 26
I-5 NB on-ramp from 54th Ave E Merge E 41 D 33
I-5 NB between 54th Ave E on-ramp and truck scales off-
ramp Basic E 37 D 32
I-5 NB off-ramp to truck scales Diverge E 37 D 33
I-5 NB between truck scales off/on-ramps Basic E 39 D 35
I-5 NB on-ramp from truck scales Merge E 43 E 40
I-5 NB between truck scales and SR 18 Basic E 39 D 35
I-5 NB off-ramp to SR 18 Diverge D 33 D 31
Notes: Average volumes based on 13 VISSIM runs. Bold indicates unacceptable operation. 1. Modeled traffic volume expressed as a percent of observed traffic volume. For example: 100% indicates an exact replication of field conditions. Source: Fehr & Peers, 2010.
IIII----5 Southbound5 Southbound5 Southbound5 Southbound
I-5 SB on-ramp from SR 18 Merge C 24 C 26
I-5 SB between SR 18 and truck scales Basic D 26 D 31
I-5 SB off-ramp to truck scales Diverge C 25 C 28
I-5 SB between truck scales off/on-ramps Basic D 26 D 30
I-5 SB on-ramp from truck scales Merge C 25 C 28
I-5 SB between truck scales and 54th Ave E off-ramp Basic D 27 D 30
I-5 SB off-ramp to 54th Ave E Diverge F 46 E 36
I-5 SB between 54th Ave E on/off-ramps Basic C 24 D 28
I-5 SB on-ramp from 54th Ave E Merge D 31 D 34
I-5 SB off-ramp to POT Rd Diverge D 32 D 34
I-5 SB between POT Rd off/on-ramps Basic D 29 D 32
I-5 SB on-ramp from POT Rd Merge D 28 D 34
I-5 SB off-ramp to Bay Street Diverge C 27 D 34
I-5 SB between Bay Street on/off-ramps Basic D 29 D 33
I-5 SB on-ramp from Bay Street Merge D 34 D 29
I-5 SB between Bay Street and E 27th Street/Portland Ave Basic E 38 D 32
I-5 SB weave between E 27th Street/Portland Ave and I-705 Weave E 40 D 35
Notes: Average volumes based on 13 VISSIM runs. 1. Modeled traffic volume expressed as a percent of observed traffic volume. For example: 100% indicates an exact replication of field conditions. Source: Fehr & Peers, 2010.


Final Intersection Justification Report BergerABAM, SAPWT-09-139
Port of Tacoma Road Intersection with Interstate 5 February 2012
City of Fife, Washington Page 1-32
Compared with the results for 2006, traffic volumes, density, and congestion increase
significantly under the 2020 No-Build condition in the AM peak hour in the northbound
direction and in the southbound direction during PM peak hour.
1.6.1.2 Intersections Operations (2020 No-Build)
The operational analysis of the 15 major intersections within the study area for the 2020 No-
Build condition considered the system improvements listed in Table 1-1. The evaluation
examined the traffic volumes and LOS for each of the study area intersections with these system
improvements. As part of corridor improvements, study intersections are planned to be
improved by 2020 with additional turn lanes or other traffic control improvements. The
20th Street East/Port of Tacoma Road and 20th Street East/Industry Drive stop-controlled
intersections are planned to be signalized during this period.
Under 2020 No-Build conditions, the Port of Tacoma Road/I-5 southbound ramps and
54th Avenue East/20th Street East intersections would operate at LOS E in the AM peak hour.
All other study intersections would operate at LOS D or better during this time period. During
the PM peak hour, six intersections would operate at LOS E or F. The longest delays would
occur at the 54th Avenue East/Pacific Highway East intersection. All other study intersections
would operate at LOS D or better in the PM peak hour
Table 1-13 summarizes the LOS operations and calculated delay at study intersections during
the AM and PM peak hours, as observed in the 2020 No-Build analysis. Figures 1-12 through
1-14 present intersection LOS, geometry, and volume for the AM peak hour and Figures 1-14
through 1-17 display the same information for the PM peak hour.
1.6.2 No-Build 2020 Safety
Increases in congestion can result in higher incidences of accidents on freeways and
intersections within the study area. Higher congestion levels can lead to higher levels of rear-
end and sideswipe accidents as periods of extreme traffic congestion become more common
throughout the day. Intersections without capacity improvements may have higher accident
rates as drivers become more aggressive and take more risks in congested conditions. Even if
accident rates remain the same, the total yearly accidents will likely increase due to the growth
in traffic volumes. Tables 1-14 to 1-17 show the accident forecast, including PDO, injury, and
fatality, on freeway mainline segments, ramps, local corridors, and intersections.
1.6.2.1 No-Build Conditions for 2040 (Design Year)
The No-Build analysis represents the operating conditions if the Proposed Alternative was not
constructed. The No-Build conditions for 2040 provides a comparison for the Proposed
Alternative for the design year. The No-Build condition assumes additional improvements to
freeways, interchanges, arterials, or ramps within the study area other than those identified in
local and regional planning documents, including the SR 167 interchange and extension. The
complete list of planned network improvements for 2040 is found in Table 1-1.
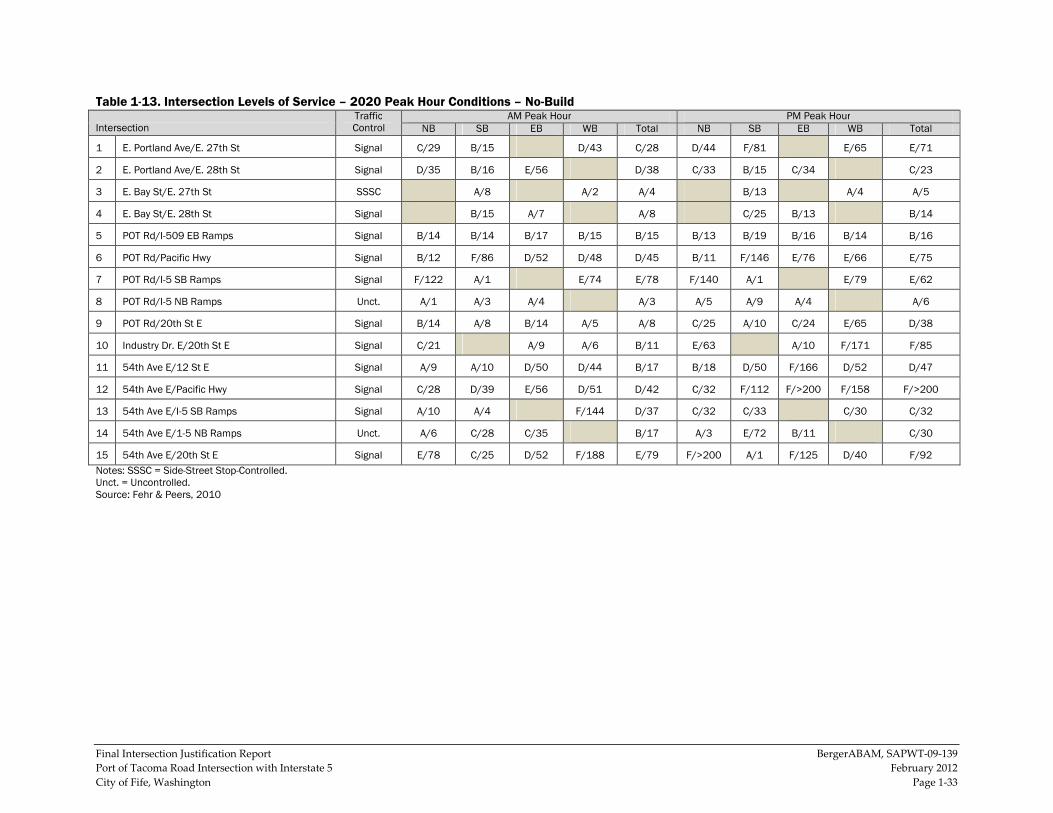
Final Intersection Justification Report BergerABAM, SAPWT-09-139
Port of Tacoma Road Intersection with Interstate 5 February 2012
City of Fife, Washington Page 1-33
Table 1-13. Intersection Levels of Service – 2020 Peak Hour Conditions – No-Build Intersection
Traffic Control
AM Peak Hour PM Peak Hour
NB SB EB WB Total NB SB EB WB Total
1 E. Portland Ave/E. 27th St Signal C/29 B/15 D/43 C/28 D/44 F/81 E/65 E/71
2 E. Portland Ave/E. 28th St Signal D/35 B/16 E/56 D/38 C/33 B/15 C/34 C/23
3 E. Bay St/E. 27th St SSSC A/8 A/2 A/4 B/13 A/4 A/5
4 E. Bay St/E. 28th St Signal B/15 A/7 A/8 C/25 B/13 B/14
5 POT Rd/I-509 EB Ramps Signal B/14 B/14 B/17 B/15 B/15 B/13 B/19 B/16 B/14 B/16
6 POT Rd/Pacific Hwy Signal B/12 F/86 D/52 D/48 D/45 B/11 F/146 E/76 E/66 E/75
7 POT Rd/I-5 SB Ramps Signal F/122 A/1 E/74 E/78 F/140 A/1 E/79 E/62
8 POT Rd/I-5 NB Ramps Unct. A/1 A/3 A/4 A/3 A/5 A/9 A/4 A/6
9 POT Rd/20th St E Signal B/14 A/8 B/14 A/5 A/8 C/25 A/10 C/24 E/65 D/38
10 Industry Dr. E/20th St E Signal C/21 A/9 A/6 B/11 E/63 A/10 F/171 F/85
11 54th Ave E/12 St E Signal A/9 A/10 D/50 D/44 B/17 B/18 D/50 F/166 D/52 D/47
12 54th Ave E/Pacific Hwy Signal C/28 D/39 E/56 D/51 D/42 C/32 F/112 F/>200 F/158 F/>200
13 54th Ave E/I-5 SB Ramps Signal A/10 A/4 F/144 D/37 C/32 C/33 C/30 C/32
14 54th Ave E/1-5 NB Ramps Unct. A/6 C/28 C/35 B/17 A/3 E/72 B/11 C/30
15 54th Ave E/20th St E Signal E/78 C/25 D/52 F/188 E/79 F/>200 A/1 F/125 D/40 F/92
Notes: SSSC = Side-Street Stop-Controlled. Unct. = Uncontrolled. Source: Fehr & Peers, 2010
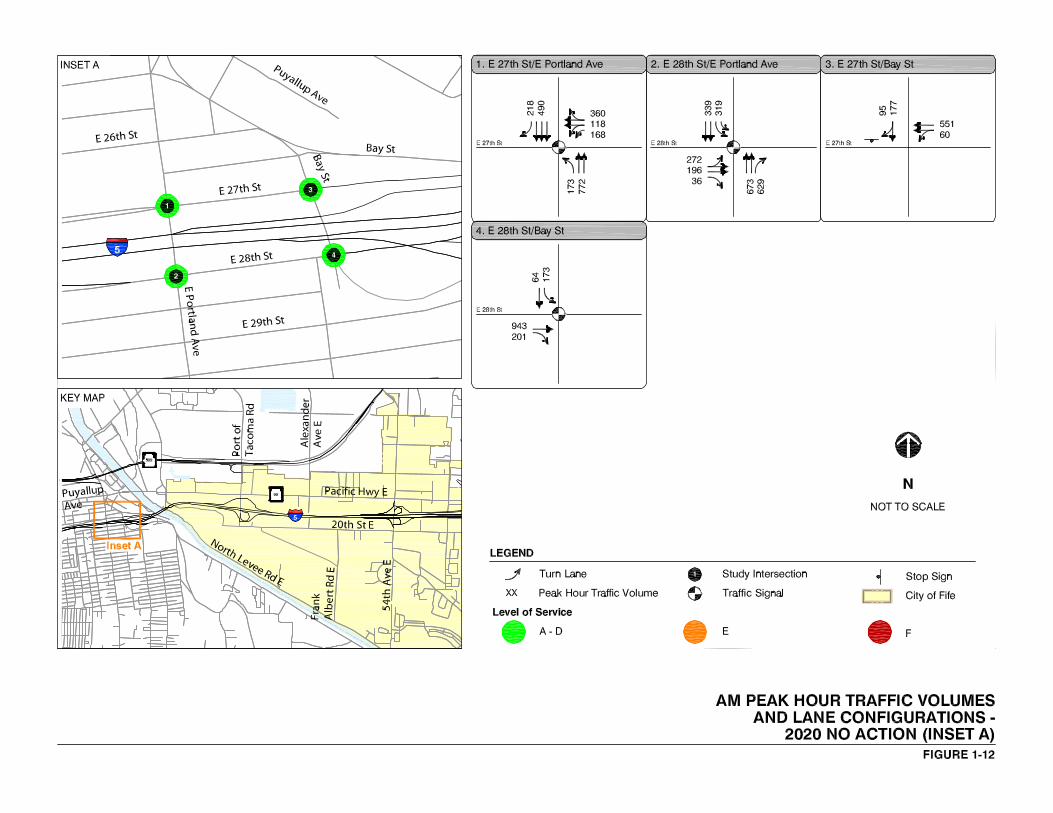

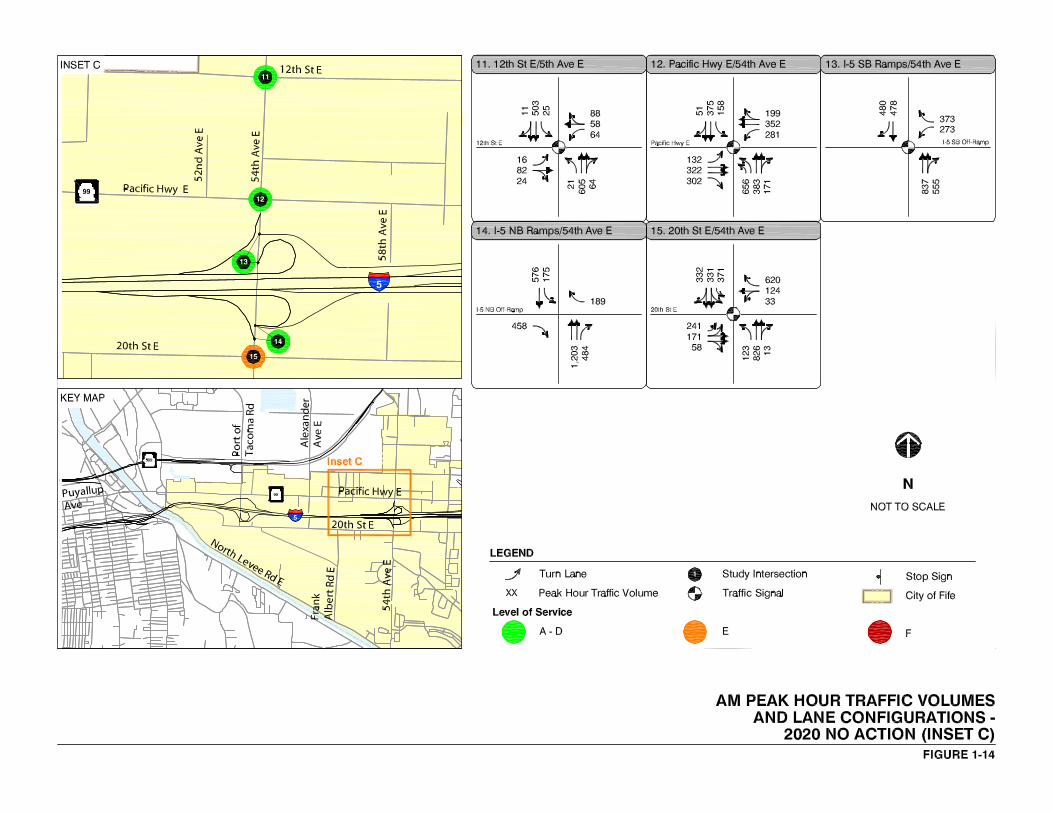

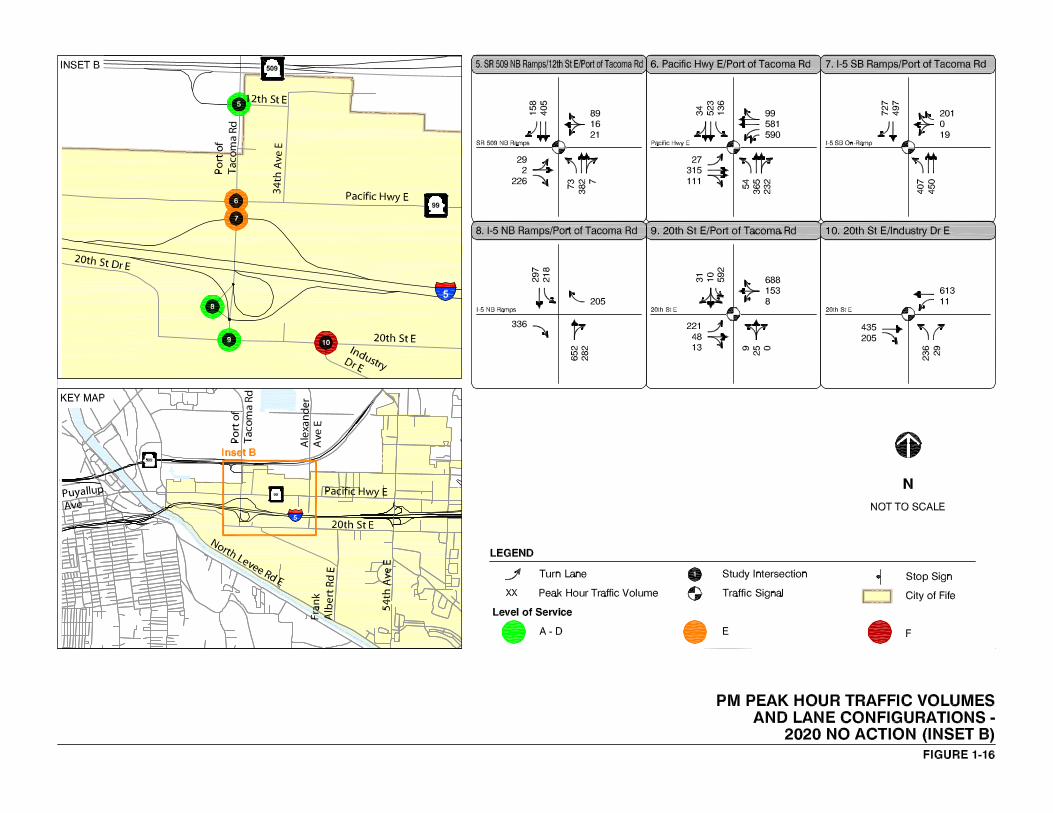


Final Intersection Justification Report BergerABAM, SAPWT-09-139
Port of Tacoma Road Intersection with Interstate 5 February 2012
City of Fife, Washington Page 1-40
Table 1-14. Freeway Mainline Accident Forecast (2020 No-Build)
Mainline Segment ADT Total (2020 No-Build) Accident
Rate (MVM)
Fatality Rate
(100 MVM) PDO Injury Fatality Total
I-5 Northbound
I-705 on-ramp to E 28th St off-ramp 80,335 205 112 0 317 3.290 0.000
E 28th St off-ramp SR 167 (River Rd) off-ramp 76,938 143 102 0 245 3.456 0.000
SR 167 (River Rd) off-ramp to E 28th St on-ramp 64,125 39 20 1 60 1.266 0.023
E 28th St on-ramp to POT Rd off-ramp to South 73,955 131 56 0 187 1.548 0.000
POT Rd off-ramp to South to POT Rd off-ramp to
North 69,482 29 13 0 42 1.583 0.000
POT Rd off-ramp to North to POT Rd on-ramp 66,489 30 17 0 47 0.595 0.000
POT Rd on-ramp to 54th Ave E off-ramp 70,426 36 22 0 58 0.506 0.000
54th Ave E off-ramp to 54th Ave E on-ramp 63,072 57 22 0 79 0.649 0.000
54th Ave E on-ramp to weigh station off-ramp 70,990 210 127 0 337 0.826 0.000
Weigh station off-ramp to Weigh station on-ramp 70,455 87 48 0 135 0.727 0.000
Weigh station on-ramp to SR 18 off-ramp 70,795 53 29 0 82 1.005 0.000
Subtotal 1,019 569 1 1,589
I-5 Southbound
SR 18 on-ramp to weigh station off-ramp 73,280 107 63 0 170 1.685 0.000
Weigh station off-ramp to Weigh station on-ramp 72,915 80 44 2 126 0.970 0.017
Weigh station on-ramp to 54th Ave E off-ramp 73,385 348 201 1 550 1.103 0.002
54th Ave E off-ramp to 54th Ave E on-ramp 66,720 90 42 1 134 1.207 0.010
54th Ave E on-ramp to POT Rd off-ramp 76,399 52 26 0 78 0.585 0.000
POT Rd off-ramp to POT Rd on-ramp 73,535 102 47 1 150 1.139 0.008
POT Rd on-ramp to E 27th Street off-ramp 81,370 80 36 0 116 1.508 0.000
E 27th Street off-ramp to SR 167 (River Rd) on-
ramp 72,985 71 43 0 114 1.454 0.000
SR 167 (River Rd) on-ramp to E 27th St (Portland
Ave) on-ramp 86,530 94 53 0 147 1.089 0.000
E 27th St on-ramp to I-705 off-ramp 92,295 27 22 0 49 1.900 0.000
Subtotal 1,051 578 6 1,634
Total 2,070 1,147 7 3,223

Final Intersection Justification Report BergerABAM, SAPWT-09-139
Port of Tacoma Road Intersection with Interstate 5 February 2012
City of Fife, Washington Page 1-41
Table 1-15. Freeway Ramp Accident Forecast (2020 No-Build)
Length ADT Total (2020 No-Build) Accident
Rate (MVM)
Fatality Rate (100 MVM) PDO Injury Fatality Total
IIII----5 Northbound5 Northbound5 Northbound5 Northbound
E 28th St off-ramp 0.28 3,397 13 10 0 23 9.574 0.000
SR 167 off-ramp 0.29 12,813 13 2 0 15 1.578 0.000
E 28th St on-ramp 0.22 9,830 4 3 0 7 1.354 0.000
POT Rd off-ramp to south 0.23 4,473 5 2 0 8 2.905 0.000
POT Rd off-ramp to north 0.29 2,993 10 3 0 14 6.181 0.000
POT Rd on-ramp 0.45 3,937 6 0 0 6 1.221 0.000
54th Ave E off-ramp to
south 0.31 5,162 64 44 0 107 26.222 0.000
54th Ave E off-ramp to north 0.24 2,192 18 12 0 30 22.112 0.000
54th Ave E on-ramp 0.5 7,918 14 3 0 17 1.674 0.000
Subtotal 147 79 0 226
IIII----5 Southbound5 Southbound5 Southbound5 Southbound
54th Ave E off-ramp 0.29 6,665 30 21 0 51 10.280 0.000
54th Ave E on-ramp from
south 0.28 4,745 1 1 0 2 0.601 0.000
54th Ave E on-ramp from
north 0.41 4,934 7 6 0 13 2.505 0.000
POT Rd off-ramp 0.32 2,864 45 22 0 67 28.404 0.000
POT Rd on-ramp 0.41 7,835 17 5 0 22 2.735 0.000
E 27th St off-ramp 0.28 8,385 21 18 0 39 6.493 0.000
SR 167 on-ramp 0.38 13,545 17 9 0 26 1.993 0.000
E 27th St on-ramp 0.60 5,765 11 3 0 14 1.570 0.000
Subtotal 149 85 0 234
Total 296 164 0 460
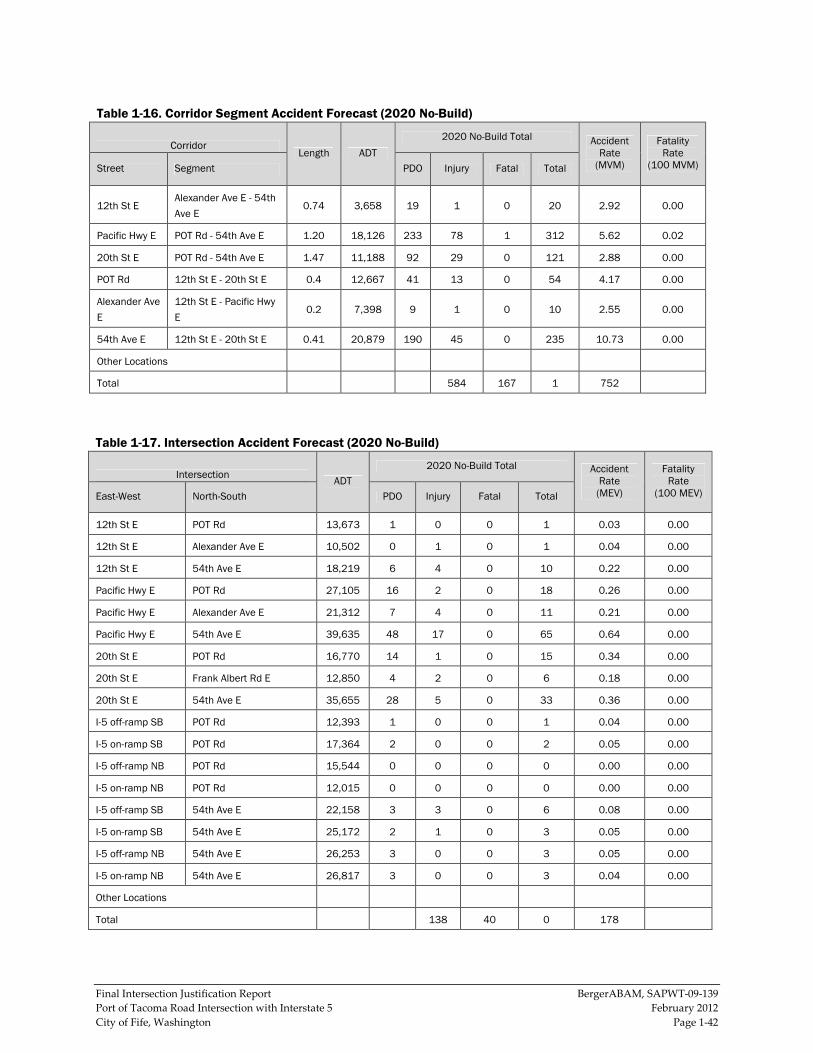
Final Intersection Justification Report BergerABAM, SAPWT-09-139
Port of Tacoma Road Intersection with Interstate 5 February 2012
City of Fife, Washington Page 1-42
Table 1-16. Corridor Segment Accident Forecast (2020 No-Build)
Corridor Length ADT
2020 No-Build Total Accident Rate (MVM)
Fatality Rate
(100 MVM) Street Segment PDO Injury Fatal Total
12th St E Alexander Ave E - 54th
Ave E 0.74 3,658 19 1 0 20 2.92 0.00
Pacific Hwy E POT Rd - 54th Ave E 1.20 18,126 233 78 1 312 5.62 0.02
20th St E POT Rd - 54th Ave E 1.47 11,188 92 29 0 121 2.88 0.00
POT Rd 12th St E - 20th St E 0.4 12,667 41 13 0 54 4.17 0.00
Alexander Ave
E
12th St E - Pacific Hwy
E 0.2 7,398 9 1 0 10 2.55 0.00
54th Ave E 12th St E - 20th St E 0.41 20,879 190 45 0 235 10.73 0.00
Other Locations
Total 584 167 1 752
Table 1-17. Intersection Accident Forecast (2020 No-Build)
Intersection ADT
2020 No-Build Total Accident Rate (MEV)
Fatality Rate
(100 MEV) East-West North-South PDO Injury Fatal Total
12th St E POT Rd 13,673 1 0 0 1 0.03 0.00
12th St E Alexander Ave E 10,502 0 1 0 1 0.04 0.00
12th St E 54th Ave E 18,219 6 4 0 10 0.22 0.00
Pacific Hwy E POT Rd 27,105 16 2 0 18 0.26 0.00
Pacific Hwy E Alexander Ave E 21,312 7 4 0 11 0.21 0.00
Pacific Hwy E 54th Ave E 39,635 48 17 0 65 0.64 0.00
20th St E POT Rd 16,770 14 1 0 15 0.34 0.00
20th St E Frank Albert Rd E 12,850 4 2 0 6 0.18 0.00
20th St E 54th Ave E 35,655 28 5 0 33 0.36 0.00
I-5 off-ramp SB POT Rd 12,393 1 0 0 1 0.04 0.00
I-5 on-ramp SB POT Rd 17,364 2 0 0 2 0.05 0.00
I-5 off-ramp NB POT Rd 15,544 0 0 0 0 0.00 0.00
I-5 on-ramp NB POT Rd 12,015 0 0 0 0 0.00 0.00
I-5 off-ramp SB 54th Ave E 22,158 3 3 0 6 0.08 0.00
I-5 on-ramp SB 54th Ave E 25,172 2 1 0 3 0.05 0.00
I-5 off-ramp NB 54th Ave E 26,253 3 0 0 3 0.05 0.00
I-5 on-ramp NB 54th Ave E 26,817 3 0 0 3 0.04 0.00
Other Locations
Total 138 40 0 178
Final Intersection Justification Report BergerABAM, SAPWT-09-139
Port of Tacoma Road Intersection with Interstate 5 February 2012
City of Fife, Washington Page 1-43
1.6.3 No-Build 2040 Traffic Operations (Design Year)
Traffic conditions were analyzed for the 2040 AM and PM peak hours for the freeway and
major intersections.
1.6.3.1 Freeway Operations (2040 No-Build)
For the freeway mainline, the basic, merge and diverge, and weaving segments were analyzed
for the 2040 No-Build conditions for comparison with the design year for the Proposed
Alternative. The 2040 analysis includes regional improvements to I-5, including the extension of
the HOV lanes through the study area and the construction of the SR 167 extension project.
Table 1-18 summarizes the LOS operation for the northbound and southbound directions for
the 2040 No-Build Alternative.
Under 2040 No-Build conditions, the northbound I-5 mainline in the AM peak hour would be
congested throughout almost the entire study corridor. Of the 27 mainline segments in the
northbound direction, 24 would operate at LOS E or F during the AM peak hour. Of the 16
merge/diverge/weave segments in the northbound direction, 14 would operate at either LOS E
or F. During the PM peak hour, the northbound I-5 mainline segments would have similarly
poor operations – 22 of 27 segments would operate at LOS E or F. The most congested segments
are the East 28th Street interchange in the AM peak hour and the truck scale interchange in the
PM peak hour.
In the southbound direction, 18 segments would operate at LOS E or F in the AM peak hour,
with 15 segments operating at LOS E or F in the PM peak hour. In the southbound direction, the
most congested segments are 54th Avenue East interchange in the AM peak hour and the truck
scale interchange in the PM peak hour.
By comparison to either existing or 2020 No-Build conditions, there would be substantially
more congestion under 2040 No-Build conditions.
Table 1-18 shows the 2040 No-Build I-5 mainline freeway LOS and density for all segments
within the study area. Figures 1-18 and 1-19 present a schematic representation of the 2040 No-
Build freeway lanes, density, and LOS operating conditions at different freeway segments on
the I-5 corridor within the study area.
1.6.3.2 Intersections Operations (2040 No-Build)
The operational analysis of the 15 intersections within the study area considers the system
improvements listed in Table 1-1 for the 2040 No-Build analysis. Assuming that these
improvements are in place by 2040, the traffic volumes and LOS operation were calculated for
each of the study area intersections.

Final Intersection Justification Report BergerABAM, SAPWT-09-139
Port of Tacoma Road Intersection with Interstate 5 February 2012
City of Fife, Washington Page 1-44
Table 1-18. 2040 No-Build I-5 Mainline Freeway Operations Summary
Type
AM Peak Hour PM Peak Hour
LOS Density1 LOS Density1
IIII----5 Northbound5 Northbound5 Northbound5 Northbound
I-5 NB on-ramp from I-705 Merge F 107 E 36
I-5 NB off-ramp to E 28th Street/Portland Ave Diverge F 100 E 37
I-5 NB off-ramp to E Bay Street Diverge F 104 E 38
I-5 NB between E Bay Street off/on-ramps Basic F 106 E 36
I-5 NB on-ramp from E 28th Street Merge F 110 D 31
I-5 NB between E 28th Street. On-ramp and POT Rd off-ramp Basic F 101 D 32
I-5 NB off-ramp to POT Rd SB Diverge F 100 E 41
I-5 NB off-ramp to POT Rd NB Diverge F 94 E 40
I-5 NB between POT Rd NB off-/on-ramps Basic F 66 E 37
I-5 NB on-ramp from POT Rd Merge F 75 E 39
I-5 NB between POT Rd and 54th Ave E Basic F 67 E 42
I-5 NB off-ramp to 54th Ave E Diverge F 70 F 50
I-5 NB off-ramp to SR 167 Diverge D 31 E 37
I-5 NB off-ramp to SR 167 HOV Diverge C 24 C 25
I-5 NB between SR 167 HOV and 54th Ave E on-ramps Basic D 31 D 28
I-5 NB on-ramp from 54th Ave E Merge E 39 E 37
I-5 NB between 54th Ave E and SR 167 HOV Basic F 47 E 41
I-5 NB on-ramp from SR 167 HOV Merge E 42 D 32
I-5 NB between SR 167 HOV and SR 167 Basic F 53 F 47
I-5 NB on-ramp from SR 167 Merge E 36 E 36
I-5 NB between SR 167 and 6-lane section ends Basic E 44 E 41
I-5 NB between 5-lane section and truck scales off-ramp Basic F 53 F 48
I-5 NB off-ramp to truck scales Diverge F 51 F 48
I-5 NB between truck scales off/on-ramps Basic F 49 F 50
I-5 NB on-ramp from truck scales Merge F 53 F 53
I-5 NB between truck scales and SR 18 Basic F 47 F 46
I-5 NB off-ramp to SR 18 Diverge E 39 E 40
Notes: Average volumes based on 13 VISSIM runs Bold indicates unacceptable operation. 1. Modeled traffic volume expressed as a percent of observed traffic volume. For example: 100% indicates an exact replication of field conditions. Source: Fehr & Peers, 2010.
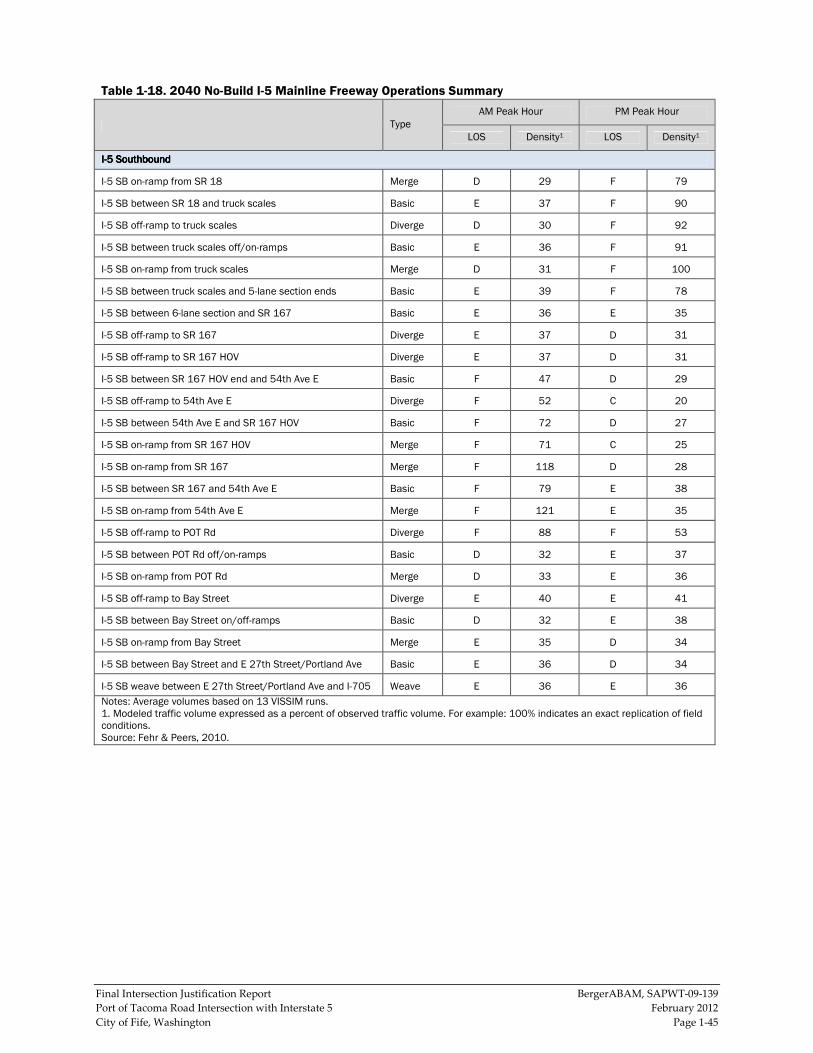
Final Intersection Justification Report BergerABAM, SAPWT-09-139
Port of Tacoma Road Intersection with Interstate 5 February 2012
City of Fife, Washington Page 1-45
Table 1-18. 2040 No-Build I-5 Mainline Freeway Operations Summary
Type
AM Peak Hour PM Peak Hour
LOS Density1 LOS Density1
IIII----5 Southbound5 Southbound5 Southbound5 Southbound
I-5 SB on-ramp from SR 18 Merge D 29 F 79
I-5 SB between SR 18 and truck scales Basic E 37 F 90
I-5 SB off-ramp to truck scales Diverge D 30 F 92
I-5 SB between truck scales off/on-ramps Basic E 36 F 91
I-5 SB on-ramp from truck scales Merge D 31 F 100
I-5 SB between truck scales and 5-lane section ends Basic E 39 F 78
I-5 SB between 6-lane section and SR 167 Basic E 36 E 35
I-5 SB off-ramp to SR 167 Diverge E 37 D 31
I-5 SB off-ramp to SR 167 HOV Diverge E 37 D 31
I-5 SB between SR 167 HOV end and 54th Ave E Basic F 47 D 29
I-5 SB off-ramp to 54th Ave E Diverge F 52 C 20
I-5 SB between 54th Ave E and SR 167 HOV Basic F 72 D 27
I-5 SB on-ramp from SR 167 HOV Merge F 71 C 25
I-5 SB on-ramp from SR 167 Merge F 118 D 28
I-5 SB between SR 167 and 54th Ave E Basic F 79 E 38
I-5 SB on-ramp from 54th Ave E Merge F 121 E 35
I-5 SB off-ramp to POT Rd Diverge F 88 F 53
I-5 SB between POT Rd off/on-ramps Basic D 32 E 37
I-5 SB on-ramp from POT Rd Merge D 33 E 36
I-5 SB off-ramp to Bay Street Diverge E 40 E 41
I-5 SB between Bay Street on/off-ramps Basic D 32 E 38
I-5 SB on-ramp from Bay Street Merge E 35 D 34
I-5 SB between Bay Street and E 27th Street/Portland Ave Basic E 36 D 34
I-5 SB weave between E 27th Street/Portland Ave and I-705 Weave E 36 E 36
Notes: Average volumes based on 13 VISSIM runs. 1. Modeled traffic volume expressed as a percent of observed traffic volume. For example: 100% indicates an exact replication of field conditions. Source: Fehr & Peers, 2010.
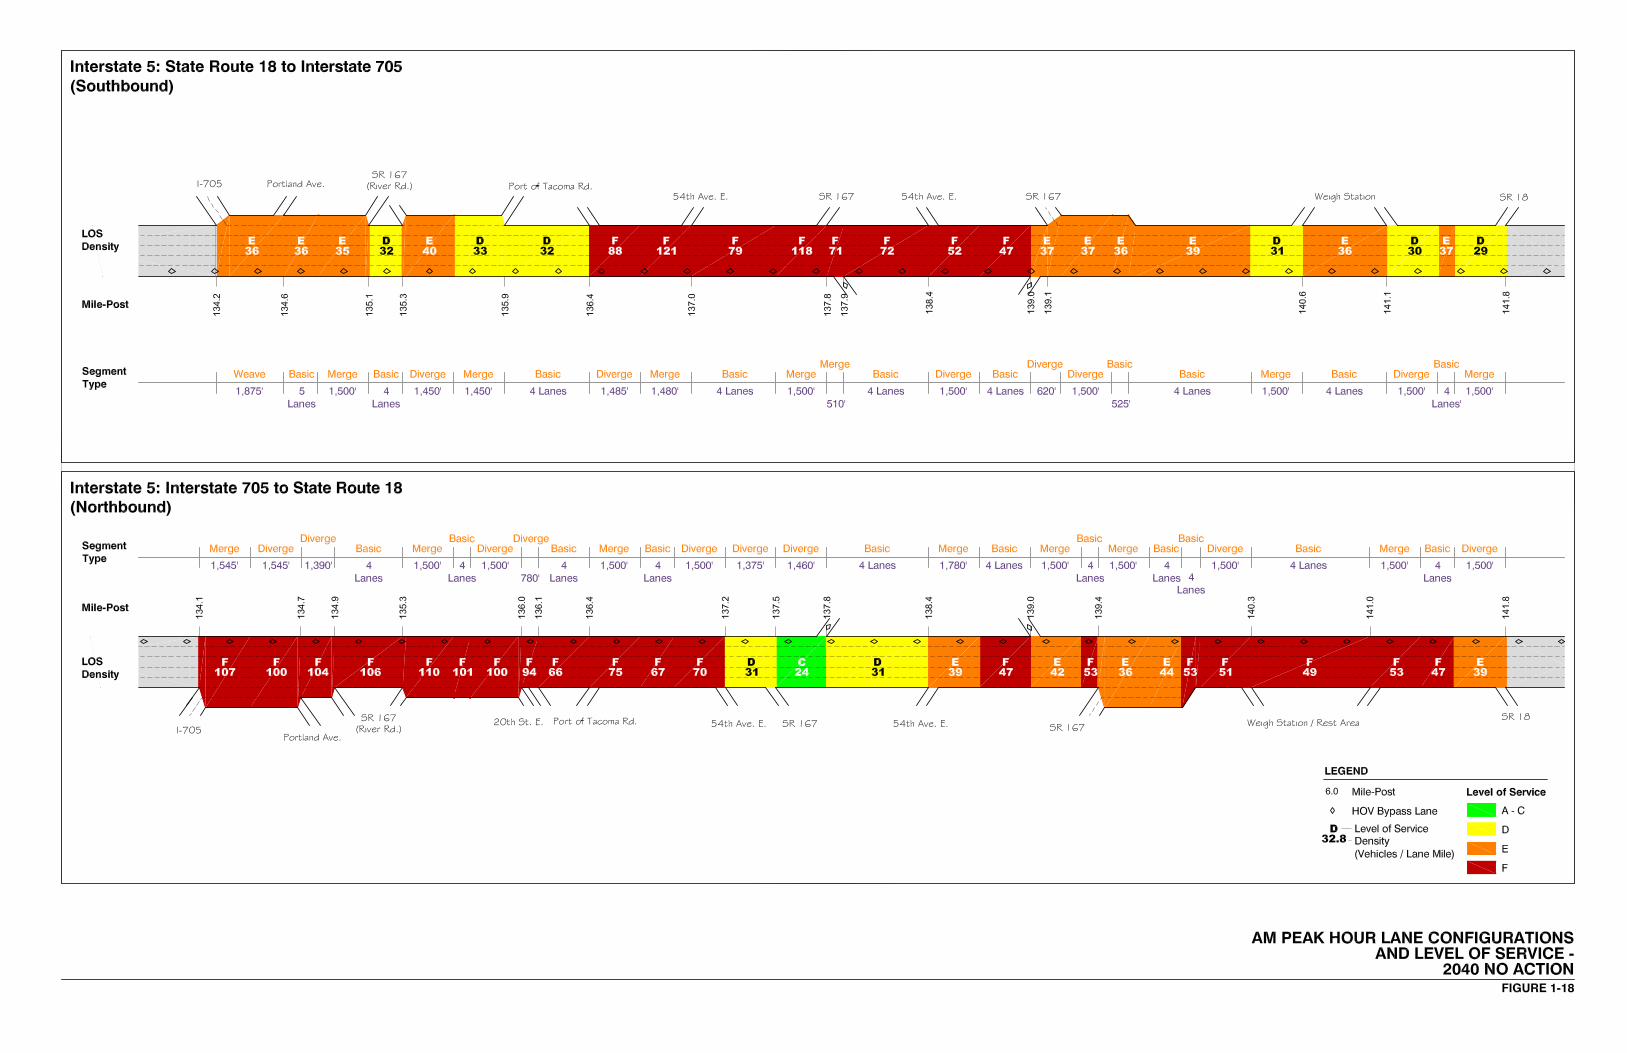
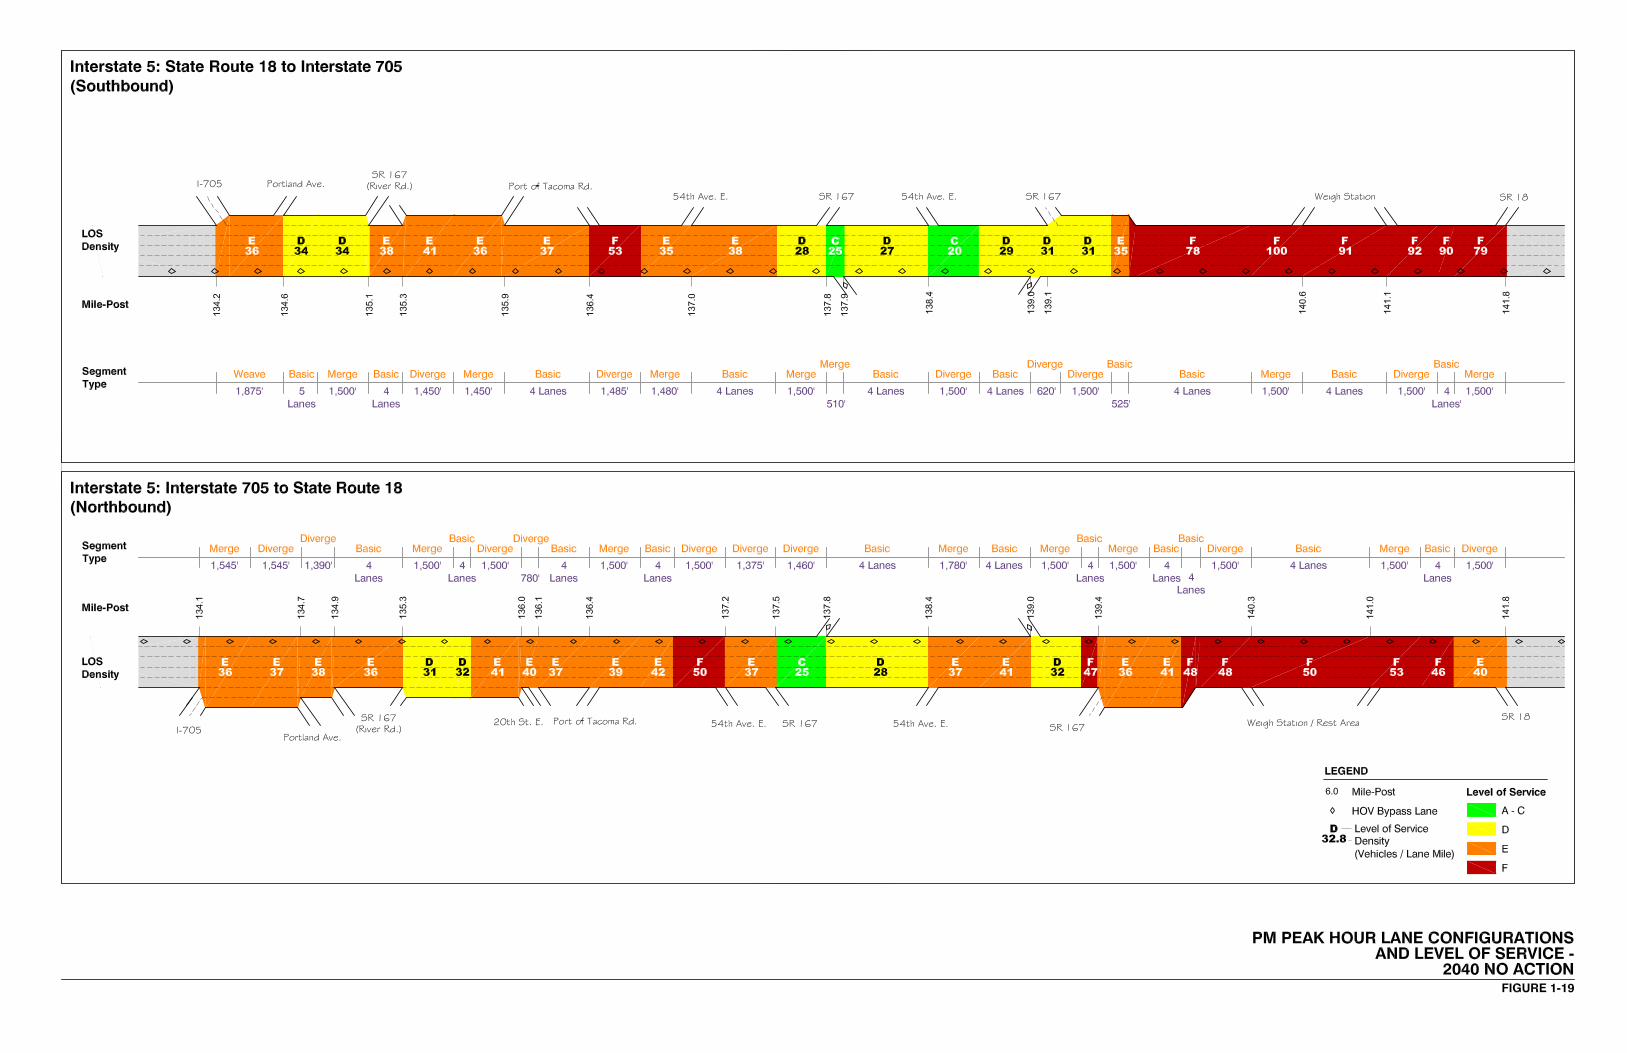

Final Intersection Justification Report BergerABAM, SAPWT-09-139
Port of Tacoma Road Intersection with Interstate 5 February 2012
City of Fife, Washington Page 1-48
Under the No-Build conditions, there would be significant congestion during the 2040 peak
periods. During the AM peak hour, six intersections would operate LOS F, including three
intersections along Port of Tacoma Road between the SR 509 ramps and the southbound I-5
ramps. Most of the intersections along 54th Avenue East would operate at LOS F during the
AM peak hour, with the exception of the ramp terminal intersections. The traffic volumes, lane
configurations, and LOS for the AM peak hour under 2040 No-Build conditions are presented in
Figures 1-20 through 1-22.
During the PM peak hour, 7 of the 15 intersections would operate at LOS F, including three
along Port of Tacoma Road: the I-509 ramps, Pacific Highway East, and the I-5 southbound
ramps. Other failing intersections in the study area would include East Portland Avenue/East
27th Street, 54th Avenue East/12th Street East, 54th Avenue East/Pacific Highway East, and
Industry Drive East/20th Street East. The remaining eight study intersections would operate at
LOS D or better. The traffic volumes, lane configurations, and LOS for the PM peak hour under
2040 No-Build conditions are presented in Figures 1-23 through 1-25.
Table 1-19 summarizes the LOS operation and calculated delay for the study intersections
during AM and PM peak hours, as observed in the 2040 No-Build analysis.
1.6.4 No-Build 2040 Safety (Design Year)
Increases in congestion could result in higher incidences of study area accidents on freeways
and intersections. Higher congestion levels could lead to increased levels of rear-end and
sideswipe accidents as extreme traffic congestion becomes more common throughout the day.
Intersections without capacity improvements may have higher accident rates as drivers become
more aggressive and take more risks. Even if accident rates remain the same, the number of
accidents per year will likely increase because of the growth in traffic volumes. Tables 1-20
through 1-23 show the accident forecast, including PDO, injury, and fatality, on freeway
mainline segments, ramps, local corridors, and intersections.
1.6.5 Transportation Demand Management
A broad range of transportation demand management (TDM) solutions was investigated to
assess whether their application could alleviate the need for the project. The TDM measures
examined included programs designed to lower single occupant automobile travel, such as
alternative work schedules, restrictions on parking supply, transit and ridesharing subsidies,
and targeted marketing activities. The TDM Effectiveness Estimation Methodology (TEEM 2.0)
model, a post-processing modeling software, was used to quantify the potential of TDM and
land-use strategies to change travel demand within the study area.


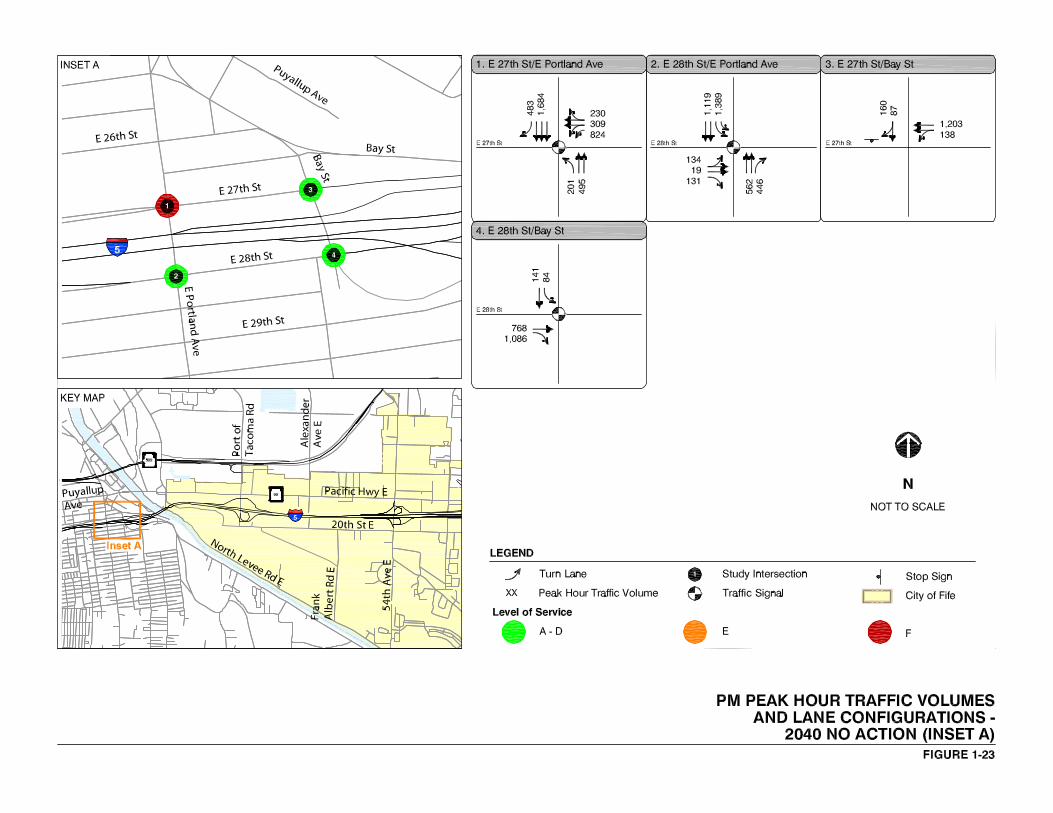


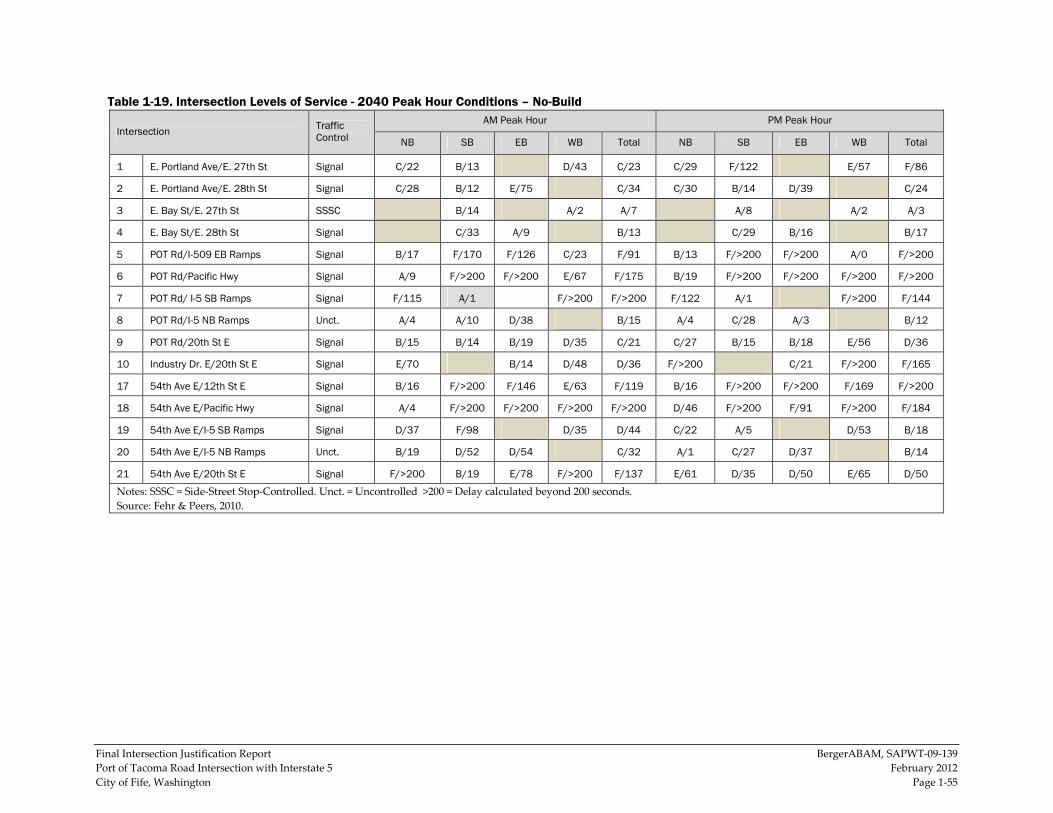
Final Intersection Justification Report BergerABAM, SAPWT-09-139
Port of Tacoma Road Intersection with Interstate 5 February 2012
City of Fife, Washington Page 1-55
Table 1-19. Intersection Levels of Service - 2040 Peak Hour Conditions – No-Build
Intersection Traffic Control
AM Peak Hour PM Peak Hour
NB SB EB WB Total NB SB EB WB Total
1 E. Portland Ave/E. 27th St Signal C/22 B/13 D/43 C/23 C/29 F/122 E/57 F/86
2 E. Portland Ave/E. 28th St Signal C/28 B/12 E/75 C/34 C/30 B/14 D/39 C/24
3 E. Bay St/E. 27th St SSSC B/14 A/2 A/7 A/8 A/2 A/3
4 E. Bay St/E. 28th St Signal C/33 A/9 B/13 C/29 B/16 B/17
5 POT Rd/I-509 EB Ramps Signal B/17 F/170 F/126 C/23 F/91 B/13 F/>200 F/>200 A/0 F/>200
6 POT Rd/Pacific Hwy Signal A/9 F/>200 F/>200 E/67 F/175 B/19 F/>200 F/>200 F/>200 F/>200
7 POT Rd/ I-5 SB Ramps Signal F/115 A/1 F/>200 F/>200 F/122 A/1 F/>200 F/144
8 POT Rd/I-5 NB Ramps Unct. A/4 A/10 D/38 B/15 A/4 C/28 A/3 B/12
9 POT Rd/20th St E Signal B/15 B/14 B/19 D/35 C/21 C/27 B/15 B/18 E/56 D/36
10 Industry Dr. E/20th St E Signal E/70 B/14 D/48 D/36 F/>200 C/21 F/>200 F/165
17 54th Ave E/12th St E Signal B/16 F/>200 F/146 E/63 F/119 B/16 F/>200 F/>200 F/169 F/>200
18 54th Ave E/Pacific Hwy Signal A/4 F/>200 F/>200 F/>200 F/>200 D/46 F/>200 F/91 F/>200 F/184
19 54th Ave E/I-5 SB Ramps Signal D/37 F/98 D/35 D/44 C/22 A/5 D/53 B/18
20 54th Ave E/I-5 NB Ramps Unct. B/19 D/52 D/54 C/32 A/1 C/27 D/37 B/14
21 54th Ave E/20th St E Signal F/>200 B/19 E/78 F/>200 F/137 E/61 D/35 D/50 E/65 D/50
Notes: SSSC = Side-Street Stop-Controlled. Unct. = Uncontrolled >200 = Delay calculated beyond 200 seconds.
Source: Fehr & Peers, 2010.
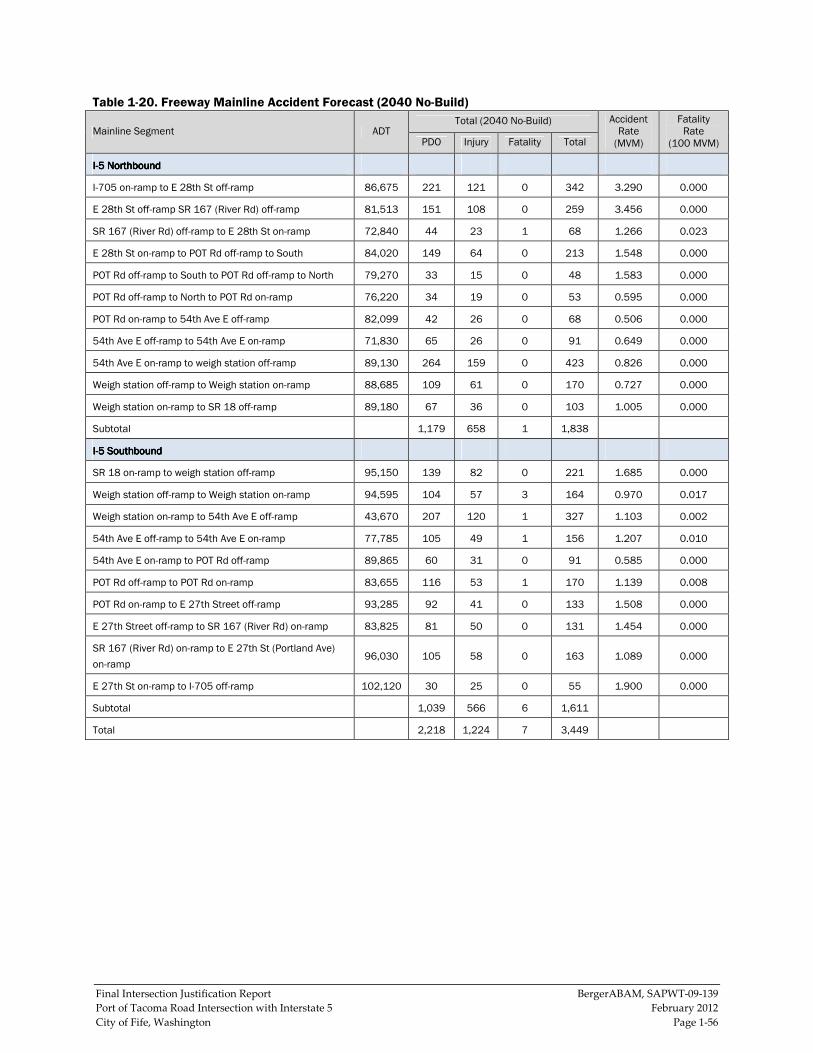
Final Intersection Justification Report BergerABAM, SAPWT-09-139
Port of Tacoma Road Intersection with Interstate 5 February 2012
City of Fife, Washington Page 1-56
Table 1-20. Freeway Mainline Accident Forecast (2040 No-Build)
Mainline Segment ADT Total (2040 No-Build) Accident
Rate (MVM)
Fatality Rate
(100 MVM) PDO Injury Fatality Total
IIII----5 Northbound5 Northbound5 Northbound5 Northbound
I-705 on-ramp to E 28th St off-ramp 86,675 221 121 0 342 3.290 0.000
E 28th St off-ramp SR 167 (River Rd) off-ramp 81,513 151 108 0 259 3.456 0.000
SR 167 (River Rd) off-ramp to E 28th St on-ramp 72,840 44 23 1 68 1.266 0.023
E 28th St on-ramp to POT Rd off-ramp to South 84,020 149 64 0 213 1.548 0.000
POT Rd off-ramp to South to POT Rd off-ramp to North 79,270 33 15 0 48 1.583 0.000
POT Rd off-ramp to North to POT Rd on-ramp 76,220 34 19 0 53 0.595 0.000
POT Rd on-ramp to 54th Ave E off-ramp 82,099 42 26 0 68 0.506 0.000
54th Ave E off-ramp to 54th Ave E on-ramp 71,830 65 26 0 91 0.649 0.000
54th Ave E on-ramp to weigh station off-ramp 89,130 264 159 0 423 0.826 0.000
Weigh station off-ramp to Weigh station on-ramp 88,685 109 61 0 170 0.727 0.000
Weigh station on-ramp to SR 18 off-ramp 89,180 67 36 0 103 1.005 0.000
Subtotal 1,179 658 1 1,838
IIII----5 Southbound5 Southbound5 Southbound5 Southbound
SR 18 on-ramp to weigh station off-ramp 95,150 139 82 0 221 1.685 0.000
Weigh station off-ramp to Weigh station on-ramp 94,595 104 57 3 164 0.970 0.017
Weigh station on-ramp to 54th Ave E off-ramp 43,670 207 120 1 327 1.103 0.002
54th Ave E off-ramp to 54th Ave E on-ramp 77,785 105 49 1 156 1.207 0.010
54th Ave E on-ramp to POT Rd off-ramp 89,865 60 31 0 91 0.585 0.000
POT Rd off-ramp to POT Rd on-ramp 83,655 116 53 1 170 1.139 0.008
POT Rd on-ramp to E 27th Street off-ramp 93,285 92 41 0 133 1.508 0.000
E 27th Street off-ramp to SR 167 (River Rd) on-ramp 83,825 81 50 0 131 1.454 0.000
SR 167 (River Rd) on-ramp to E 27th St (Portland Ave)
on-ramp 96,030 105 58 0 163 1.089 0.000
E 27th St on-ramp to I-705 off-ramp 102,120 30 25 0 55 1.900 0.000
Subtotal 1,039 566 6 1,611
Total 2,218 1,224 7 3,449

Final Intersection Justification Report BergerABAM, SAPWT-09-139
Port of Tacoma Road Intersection with Interstate 5 February 2012
City of Fife, Washington Page 1-57
Table 1-21. Freeway Ramp Accident Forecast (2040 No-Build)
Length ADT Total (2040 No-Build) Accident
Rate (MVM)
Fatality Rate
(100 MVM) PDO Injury Fatality Total
IIII----5 5 5 5 NorthboundNorthboundNorthboundNorthbound
E 28th St off-ramp 0.28 5,162 20 15 0 35 9.574 0.000
SR 167 off-ramp 0.29 8,673 9 1 0 10 1.578 0.000
E 28th St on-ramp 0.22 11,180 5 4 0 9 1.354 0.000
POT Rd off-ramp to south 0.23 4,745 6 2 0 8 2.905 0.000
POT Rd off-ramp to north 0.29
3,050 10 3 0 14 6.181 0.000
POT Rd on-ramp 0.45 5,879 8 0 0 8 1.221 0.000
54th Ave E off-ramp to
south 0.31 5,394 66 46 0 112 26.222 0.000
54th Ave E off-ramp to
north 0.24 4,880 40 26 0 66 22.112 0.000
54th Ave E on-ramp 0.5 0 0 0 0 0 1.674 0.000
Subtotal 165 98 0 263
IIII----5 Southbound5 Southbound5 Southbound5 Southbound
54th Ave E off-ramp 0.29 4,460 20 14 0 34 10.280 0.000
54th Ave E on-ramp from
south 0.28 4,815 1 1 0 2 0.601 0.000
54th Ave E on-ramp from
north 0.41 7,265 11 8 0 19 2.505 0.000
POT Rd off-ramp 0.32 6,211 97 47 0 144 28.404 0.000
POT Rd on-ramp 0.41 9,630 21 7 0 28 2.735 0.000
E 27th St off-ramp 0.28 9,460 23 21 0 44 6.493 0.000
SR 167 on-ramp 0.38 12,205 15 8 0 24 1.993 0.000
E 27th St on-ramp 0.60 6,090 11 3 0 15 1.570 0.000
Subtotal 200 109 0 309
Total 365 207 0 572

Final Intersection Justification Report BergerABAM, SAPWT-09-139
Port of Tacoma Road Intersection with Interstate 5 February 2012
City of Fife, Washington Page 1-58
Table 1-22. Corridor Segment Accident Forecast (2040 No-Build)
Corridor Length ADT
2040 No-Build Total Accident Rate (MVM)
Fatality Rate
(100 MVM) Street Segment PDO Injury Fatal Total
12th St E Alexander Ave E - 54th
Ave E 0.74 6,090 32 2 0 34 2.92 0.00
Pacific Hwy E POT Rd - 54th Ave E 1.20 32,887 423 142 2 567 5.62 0.02
20th St E POT Rd - 54th Ave E 1.47 15,690 129 41 0 170 2.88 0.00
POT Rd 12th St E - 20th St E 0.4 17,346 56 18 0 74 4.17 0.00
Alexander
Ave E 12th St E - Pacific Hwy E 0.2 10,298 11 2 0 13 2.55 0.00
54th Ave E 12th St E - 20th St E 0.41 23,287 212 50 0 262 10.73 0.00
Other Locations
Total 863 255 2 1,120
Table 1-23. Intersection Accident Forecast (2040 No-Build)
Intersection ADT
2040 No-Build Total Accident Rate (MEV)
Fatality Rate
(100 MEV) East-West North-South PDO Injury Fatal Total
12th St E POT Rd 20,490 2 0 0 2 0.03 0.00
12th St E Alexander Ave E 15,015 0 2 0 2 0.04 0.00
12th St E 54th Ave E 30,921 11 7 0 18 0.22 0.00
Pacific Hwy E POT Rd 47,134 27 4 0 31 0.26 0.00
Pacific Hwy E Alexander Ave E 38,182 12 8 0 20 0.21 0.00
Pacific Hwy E 54th Ave E 56,720 69 24 0 93 0.64 0.00
20th St E POT Rd 22,628 18 2 0 20 0.34 0.00
20th St E Frank Albert Rd E 17,217 5 3 0 8 0.18 0.00
20th St E 54th Ave E 37,302 29 5 0 34 0.36 0.00
I-5 off-ramp SB POT Rd 18,355 2 0 0 2 0.04 0.00
I-5 on-ramp SB POT Rd 21,775 3 0 0 3 0.05 0.00
I-5 off-ramp NB POT Rd 16,678 0 0 0 0 0.00 0.00
I-5 on-ramp NB POT Rd 14,762 0 0 0 0 0.00 0.00
I-5 off-ramp SB 54th Ave E 22,068 3 3 0 6 0.08 0.00
I-5 on-ramp SB 54th Ave E 29,688 3 1 0 4 0.05 0.00
I-5 off-ramp NB 54th Ave E 28,182 4 0 0 4 0.05 0.00
I-5 on-ramp NB 54th Ave E 22,833 2 0 0 2 0.04 0.00
Other Locations
Total 190 59 0 249

Final Intersection Justification Report BergerABAM, SAPWT-09-139
Port of Tacoma Road Intersection with Interstate 5 February 2012
City of Fife, Washington Page 1-59
The TEEM program can model the effectiveness of the following 20 TDM strategies either
individually or in combination.
• Vanpooling
• Alternative mode subsidy
• Flexpass/residential pass
• Vanshare
• Guaranteed ride home
• Restricted parking supply
• Parking pricing at employment sites
• Telecommuting
• Compressed work week
• Commute trip reduction (CTR)-type programs for smaller employers
• Transportation management associations
• Individualized marketing strategies
• Intensive marketing programs
• Improved bicycle access/facilities
• Improved pedestrian access/facilities
• Shopping trips
• Special events
• Infill and densification
• Increased mixed-use development
• Increased density near transit
The analysis used the TEEM program to test two options focused on TDM strategies. Option 1
increased density near transit and increased mixed-use development in the study area. Option 2
tested a combination of all strategies except for special events to assess a high level of TDM
measures. The analysis found an overall 4.9 percent reduction in daily trips and a 2.4 percent
reduction in PM peak hour trips within the study area—not beneficial enough for the wide-
scale application of TDM strategies to be seen as an effective alternative. Table 1-24 presents the
results of the TEEM analysis and the strategies assumed.
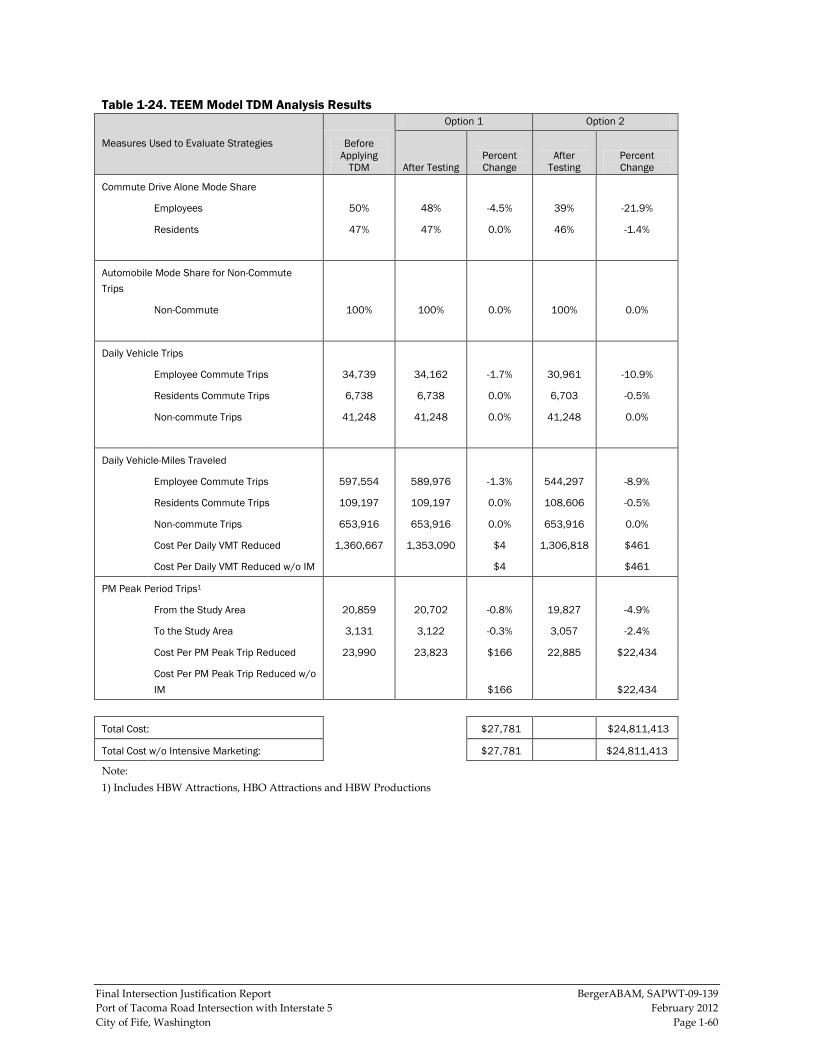
Final Intersection Justification Report BergerABAM, SAPWT-09-139
Port of Tacoma Road Intersection with Interstate 5 February 2012
City of Fife, Washington Page 1-60
Table 1-24. TEEM Model TDM Analysis Results
Measures Used to Evaluate Strategies
Option 1 Option 2
Before Applying TDM After Testing
Percent Change
After Testing
Percent Change
Commute Drive Alone Mode Share
Employees 50% 48% -4.5% 39% -21.9%
Residents 47% 47% 0.0% 46% -1.4%
Automobile Mode Share for Non-Commute
Trips
Non-Commute 100% 100% 0.0% 100% 0.0%
Daily Vehicle Trips
Employee Commute Trips 34,739 34,162 -1.7% 30,961 -10.9%
Residents Commute Trips 6,738 6,738 0.0% 6,703 -0.5%
Non-commute Trips 41,248 41,248 0.0% 41,248 0.0%
Daily Vehicle-Miles Traveled
Employee Commute Trips 597,554 589,976 -1.3% 544,297 -8.9%
Residents Commute Trips 109,197 109,197 0.0% 108,606 -0.5%
Non-commute Trips 653,916 653,916 0.0% 653,916 0.0%
Cost Per Daily VMT Reduced 1,360,667 1,353,090 $4 1,306,818 $461
Cost Per Daily VMT Reduced w/o IM $4 $461
PM Peak Period Trips1
From the Study Area 20,859 20,702 -0.8% 19,827 -4.9%
To the Study Area 3,131 3,122 -0.3% 3,057 -2.4%
Cost Per PM Peak Trip Reduced 23,990 23,823 $166 22,885 $22,434
Cost Per PM Peak Trip Reduced w/o
IM $166 $22,434
Total Cost: $27,781 $24,811,413
Total Cost w/o Intensive Marketing: $27,781 $24,811,413
Note: 1) Includes HBW Attractions, HBO Attractions and HBW Productions
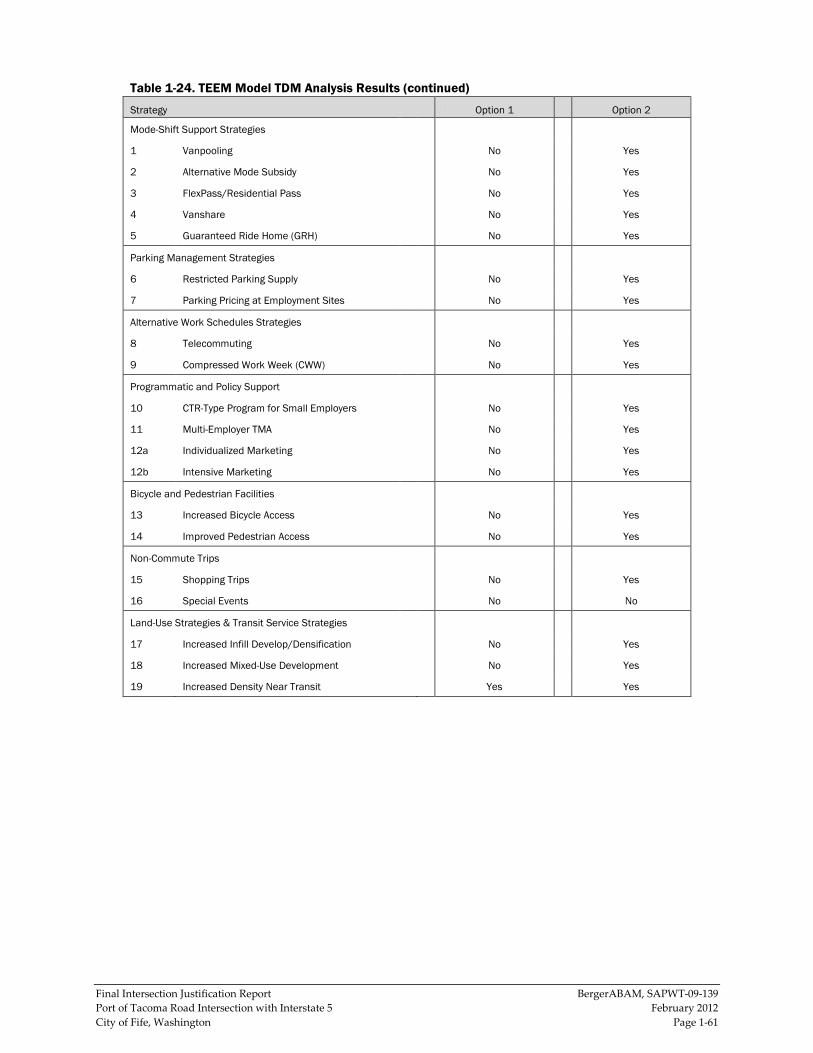
Final Intersection Justification Report BergerABAM, SAPWT-09-139
Port of Tacoma Road Intersection with Interstate 5 February 2012
City of Fife, Washington Page 1-61
Table 1-24. TEEM Model TDM Analysis Results (continued)
Strategy Option 1
Option 2
Mode-Shift Support Strategies
1 Vanpooling No Yes
2 Alternative Mode Subsidy No Yes
3 FlexPass/Residential Pass No Yes
4 Vanshare No Yes
5 Guaranteed Ride Home (GRH) No Yes
Parking Management Strategies
6 Restricted Parking Supply No Yes
7 Parking Pricing at Employment Sites No Yes
Alternative Work Schedules Strategies
8 Telecommuting No Yes
9 Compressed Work Week (CWW) No Yes
Programmatic and Policy Support
10 CTR-Type Program for Small Employers No Yes
11 Multi-Employer TMA No Yes
12a Individualized Marketing No Yes
12b Intensive Marketing No Yes
Bicycle and Pedestrian Facilities
13 Increased Bicycle Access No Yes
14 Improved Pedestrian Access No Yes
Non-Commute Trips
15 Shopping Trips No Yes
16 Special Events No No
Land-Use Strategies & Transit Service Strategies
17 Increased Infill Develop/Densification No Yes
18 Increased Mixed-Use Development No Yes
19 Increased Density Near Transit Yes Yes

Final Intersection Justification Report BergerABAM, SAPWT-09-139
Port of Tacoma Road Intersection with Interstate 5 February 2012
City of Fife, Washington Page 2-1
2 POLICY POINT 2: REASONABLE ALTERNATIVES
Describe the reasonable alternatives that have been evaluated.
2.1 Summary
Multiple alternatives were developed to improve safety and traffic circulation through the Port
of Tacoma Road interchange with I-5 project. The goal of the analysis was to identify a
Proposed Alternative that addresses the projected design year needs, is compatible with the
planned construction of other projects within the HSP, and minimizes impacts to the natural
and business environment.
A detailed screening process, which evaluated 12 alternatives, identified the Proposed
Alternative. The process included the development of alternatives, a three-level screening, a
value analysis (VA) study, and traffic modeling. Input from the project’s Technical Advisory
Committee (TAC) was considered at all levels of the screening and alternative selection process.
Alternative 6 was identified as the Proposed Alternative because the analysis showed it to be
the most efficient and cost-effective plan with the least social, economic, and environmental
impacts while possessing favorable conditions for phasing.
2.2 Alternatives Developed
Developing alternatives was the first step in the iterative identification and evaluation process .
Types of alternatives considered for the remediation of the Port of Tacoma Road interchange
with I-5 project included the following.
• No-build and limited construction
• Alternatives that “fixed” or revised the existing interchange
• Alternatives that improved the configuration of the local roadway network
• Alternatives that redesigned the interchange (blank slate approach)
2.2.1 No-Build Alternatives
According to FHWA Technical Advisory T 6640.8A, page 15, 20 no-build and/or limited
construction alternatives were considered for the Port of Tacoma Road interchange with I-5
project. As discussed in Section 1.6.5, the analysis showed that benefits from the no-build or
limited construction alternatives were not substantial enough for them to be considered
effective.
2.2.2 Build Alternatives
A May 2003 design charrette recommended an interchange revision alternative and a phased
approach to reconfiguring the Port of Tacoma Road interchange with I-5. This alternative
served as the baseline alternative or “original proposal” for the current work. Figures 2-1 and
2-2 show the 12 build alternatives analyzed in the screening process and they are described
below.
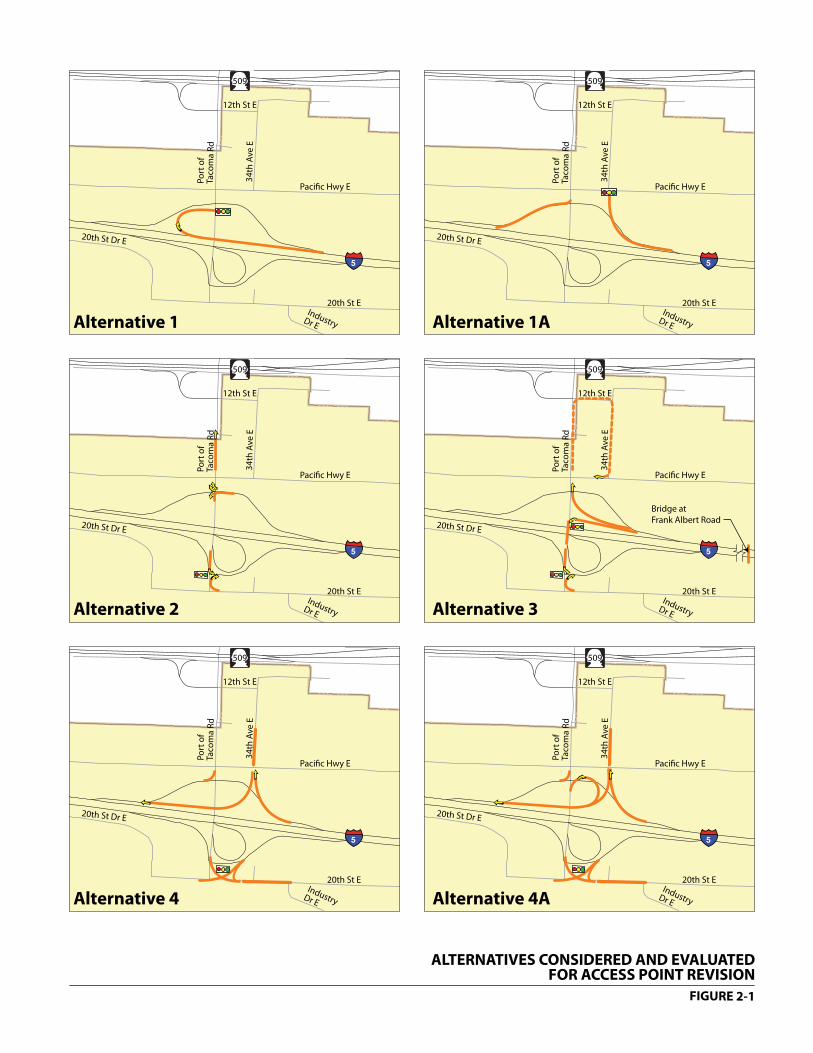
Pacific Hwy E
20th St EIndustryDr E
20th St Dr E
12th St E
34
th A
ve E
Po
rt o
fTa
com
a R
d
509
Pacific Hwy E
20th St EIndustryDr E
20th St Dr E
12th St E
34
th A
ve E
Po
rt o
fTa
com
a R
d
509
Pacific Hwy E
20th St EIndustryDr E
20th St Dr E
12th St E
34
th A
ve E
Po
rt o
fTa
com
a R
d
509
Pacific Hwy E
Bridge at
Frank Albert Road
20th St EIndustryDr E
20th St Dr E
12th St E
34
th A
ve E
Po
rt o
fTa
com
a R
d
509
Pacific Hwy E
20th St EIndustryDr E
20th St Dr E
12th St E
34
th A
ve E
Po
rt o
fTa
com
a R
d
509
Pacific Hwy E
20th St EIndustryDr E
20th St Dr E
12th St E
34
th A
ve E
Po
rt o
fTa
com
a R
d
509
Alternative 1 Alternative 1A
Alternative 2 Alternative 3
Alternative 4 Alternative 4A
ALTERNATIVES CONSIDERED AND EVALUATEDFOR ACCESS POINT REVISION
FIGURE 2-1

Pacific Hwy E
20th St EIndustryDr E
20th St Dr E
12th St E
34
th A
ve E
Po
rt o
fTa
com
a R
d
509
Pacific Hwy E
20th St EIndustryDr E
20th St Dr E
12th St E
34
th A
ve E
Po
rt o
fTa
com
a R
d
509
Pacific Hwy E
20th St EIndustryDr E
20th St Dr E
12th St E
34
th A
ve E
Po
rt o
fTa
com
a R
d
509
Pacific Hwy E
20th St EIndustryDr E
20th St Dr E
12th St E
34
th A
ve E
Po
rt o
fTa
com
a R
d
509
Pacific Hwy E
20th St EIndustryDr E
20th St Dr E
12th St E
34
th A
ve E
Po
rt o
fTa
com
a R
d
509
Pacific Hwy E
20th St EIndustryDr E
20th St Dr E
12th St E
34
th A
ve E
Po
rt o
fTa
com
a R
d
509
Alternative 5Diamond Interchange
Alternative 7Left Exit (Texas “T”)
Alternative 8ASingle Point Urban Interchange with 34th Ave E Ramps
Alternative 6Diamond Couplet
Alternative 8Single Point Urban Interchange
Alternative 9Revised Ramp at POT Road Plus Ramps at 34th Ave E
ALTERNATIVES CONSIDERED AND EVALUATEDFOR ACCESS POINT REVISION
FIGURE 2-2
Final Intersection Justification Report BergerABAM, SAPWT-09-139
Port of Tacoma Road Intersection with Interstate 5 February 2012
City of Fife, Washington Page 2-4
2.2.2.1 Alternative 1 - Revised Southbound Off-Ramp
Alternative 1 would revise the existing southbound off-ramp to terminate at Port of Tacoma
Road. The existing intersection for the southbound off-ramp would be revised as a new partial
loop relocated in the northwest quadrant of the interchange. Southbound off-ramp traffic
would have northbound and southbound access to the Port of Tacoma Road via a new traffic
signal at the end of the loop. This alternative would create more storage volume and an
additional intersection. Vehicles heading northbound on Port of Tacoma Road would still have
to make a left turn to access the southbound on-ramp.
2.2.2.2 Alternative 1A - Parclo B with 34th Avenue Off-Ramp
Alternative 1A would revise the southbound off-ramp by connecting it to Pacific Highway East
at 34th Avenue East with a traffic signal. This configuration would provide Port-bound vehicles
two ways to access Port of Tacoma Road. The I-5 southbound traffic would have access via 34th
Avenue East. The I-5 northbound traffic would have access via Port of Tacoma Road.
This alternative would decrease the length of queuing on the southbound off-ramp. Vehicles
heading southbound on Port of Tacoma Road would have to make two left turns instead of one.
2.2.2.3 Alternative 2 - Capacity Widening
Alternative 2 would add a left-turn only lane to the existing two lanes on the southbound off-
ramp to Port of Tacoma Road. The lane in the center (which now allows both left and right
turns) would become a right-turn only lane. This change would provide two right-turn lanes for
vehicles heading north on Port of Tacoma Road and a dedicated left-turn lane for vehicles
heading south on Port of Tacoma Road. An additional northbound lane, extending from Pacific
Highway East north to SR 509, would give vehicles turning right from Pacific Highway East a
dedicated lane to continue northbound on Port of Tacoma Road.
Another left-turn lane would be added to Port of Tacoma Road at the northbound on-ramp with
a new traffic signal. This would increase the storage capacity for the southbound Port of
Tacoma vehicles turning onto the I-5 northbound on-ramp.
A new right-turn only lane would be added from 20th Street East to the northbound on-ramp.
This addition would create a dedicated lane for the Port of Tacoma Road northbound traffic
from 20th Street East and eliminate delays caused by vehicles turning onto the northbound on-
ramp from 20th Street East (see Capacity Widening Drawings 1-4 in Appendix C).
2.2.2.4 Alternative 3 - Reconstructed Port of Tacoma Southbound Off-Ramp
Alternative 3 would revise the existing southbound off-ramp to Port of Tacoma Road with two
separate southbound off-ramps, one for each direction on Port of Tacoma Road. The off-ramp
for northbound traffic would tie in parallel to Port of Tacoma Road, revising the existing
intersection of the southbound off-ramps and Port of Tacoma Road. The off-ramp for traffic
heading southbound on Port of Tacoma Road would tie in closer to the bridge and add a new
intersection with a traffic signal. Alternative 3 also would add a bridge over I-5, connecting the
portions of Frank Albert Road on either side of I-5 and providing an additional route for
vehicles to cross I-5 from 20th Street East and Pacific Highway East.

Final Intersection Justification Report BergerABAM, SAPWT-09-139
Port of Tacoma Road Intersection with Interstate 5 February 2012
City of Fife, Washington Page 2-5
To eliminate vehicles crossing over two lanes of traffic in the very limited distance between the
interchange and the Port of Tacoma Road/Pacific Highway East intersection, the left-turn
movement from Port of Tacoma Road to Pacific Highway East would be eliminated. Vehicles
heading west on Pacific Highway East would have to go straight through the signal, turn right
on 12th Street East, turn right again on 34th Avenue East, and make a third right on Pacific
Highway East.
As with Alternative 2, Alternative 3 would add an additional left-turn lane to Port of Tacoma
Road to the northbound on-ramp and add a new right-turn only lane from 20th Street East to
the northbound on-ramp to I-5. The existing bridge would be widened to accommodate this
additional left-turn lane and the new southbound off-ramp.
2.2.2.5 Alternative 4 - Ramps at 34th Avenue East with a Revised Intersection at 20th Street East
Alternative 4 would eliminate the existing southbound off-ramp to Port of Tacoma Road and
replace it with a new southbound off-ramp that would tie into 34th Avenue East at Pacific
Avenue East. From the new off-ramp at 34th Avenue East, vehicles heading to the Port would
either go straight through the intersection and turn left on 12th Street East, or turn left on Pacific
Highway East to access northbound Port of Tacoma Road. Both 34th Avenue East and 12th
Street East would be widened and improved to accommodate the additional traffic attributable
to the revised off-ramp. However, vehicles heading south on Port of Tacoma Road from the off-
ramps at 34th Avenue East would no longer be able to access Port of Tacoma Road directly.
Instead, they would have to make two left turns, one on Pacific Highway East and another on
Port of Tacoma Road.
To increase storage capacity, the alternative would add a lane to the southbound on-ramp on
Port of Tacoma Road. To improve the efficiency of the intersection of Port of Tacoma Road and
the southbound on-ramp, the left-turn movement from northbound Port of Tacoma Road to the
southbound on-ramp to I-5 would be eliminated; vehicles would now access the southbound
on-ramp via the new ramp at 34th Avenue East.
On the south half of the interchange, the Port of Tacoma Road northbound on-ramp, Port of
Tacoma Road, and 20th Street East would be realigned and combined into one intersection with
a traffic signal. This would eliminate one intersection and provide better traffic flow. A right-
turn only lane from 20th Street East to the northbound on-ramp would be added; to
accommodate this right-turn only lane, 20th Street East would be widened (see Ramps at 34th
Avenue East with a Revised Intersection at 20th Street East Drawings 1-5 in Appendix C).
2.2.2.6 Alternative 4A - Parclo A/B
In Alternative 4, vehicles would have to make a right turn onto Pacific Highway East from Port
of Tacoma Road and another right onto the southbound on-ramp at 34th Avenue East.
Alternative 4A includes the same elements as Alternative 4, but would add a loop ramp from
Port of Tacoma Road to the new southbound on-ramp extending from 34th Avenue East. This
would allow easier access to the southbound on-ramp for vehicles traveling north on Port of
Tacoma Road (see Parclo A/B Drawings 1-5 in Appendix C).
Final Intersection Justification Report BergerABAM, SAPWT-09-139
Port of Tacoma Road Intersection with Interstate 5 February 2012
City of Fife, Washington Page 2-6
2.2.2.7 Alternative 5 - Directional Interchange plus Diamond Interchange
Alternative 5 would provide a directional interchange for trucks from I-5 to Port of Tacoma
Road. Additionally, a tight diamond interchange would be provided for local traffic to Port of
Tacoma Road. Essentially, the four ramps would parallel Pacific Highway East and I-5. Each
ramp would have a traffic signal and allow a right- and a left-turn movement onto Port of
Tacoma Road. (A “tight” diamond is used when space is limited and a traditional diamond
interchange cannot be used.)
Using directional and diamond interchanges would increase operational efficiency, capacity,
and safety. Intersection spacing would no longer be an issue. Trucks and local traffic would be
separated and, because traffic signals and left turns would be eliminated, trucks would
experience a free flow movement between I-5 and Port of Tacoma Road (see Directional
Interchange plus Diamond Interchange Drawings 1-5 in Appendix C).
2.2.2.8 Alternative 6 - Diamond Interchange with Couplet
Alternative 6 would modify the existing interchange into a split diamond interchange or
diamond interchange with a couplet. This interchange would provide access to both 34th
Avenue East and Port of Tacoma Road from both northbound and southbound on-ramps.
Vehicles exiting the southbound ramp would approach 34th Avenue East and could either turn
right on 34th Avenue East or continue straight to Port of Tacoma Road. Left turns onto 34th
Avenue East would be prohibited because 34th Avenue East would become a one-way
northbound street from 20th Street East to 12th Street East. Eliminating this left turn would
increase the efficiency of the intersection because it would reduce the number of approach legs.
Vehicles continuing straight through the signal would encounter another signal at Port of
Tacoma Road and could either continue straight to the southbound on-ramp or turn left on Port
of Tacoma Road. Port of Tacoma Road would become a one-way southbound street from 12th
Street East to 20th Street East.
Vehicles exiting the northbound off-ramp would approach a traffic signal at Port of Tacoma
Road and go straight to 34th Avenue East or turn right on Port of Tacoma Road. At 34th
Avenue East, there would be another traffic signal and vehicles could either continue straight to
the northbound on-ramp or turn left on 34th Avenue East.
Additional local road improvements would include widening 34th Avenue East with a bridge
over I-5, widening 20th Street East between Port of Tacoma Road and 34th Avenue East, and
widening 34th Avenue East between Pacific Highway East and 12th Street East (see Diamond
Interchange with Couplet Drawings 1-5 in Appendix C).
2.2.2.9 Alternative 7 - Left Exit
Alternative 7 assumes the existing interchange configuration would remain in place and a
truck-only left-turn exit would be added in both directions from I-5 to Port of Tacoma Road.
Although the left-turn exit would provide additional queuing storage for trucks, it would not
eliminate the closely spaced intersections and actually would add an intersection at the bridge
structure.

Final Intersection Justification Report BergerABAM, SAPWT-09-139
Port of Tacoma Road Intersection with Interstate 5 February 2012
City of Fife, Washington Page 2-7
2.2.2.10 Alternative 8 - Single Point Urban Interchange
A single point urban interchange (SPUI) is a modified diamond with the ramp terminals on the
crossroad combined into a single at-grade intersection. This single intersection accommodates
all interchange and through movements. When compared to a diamond interchange, a SPUI
would take up less ROW than a traditional diamond interchange. Intersection spacing would
not be a problem and there would be only one signalized intersection as opposed to two (see
SPUI Drawing 1 in Appendix C).
2.2.2.11 Alternative 8A - Single Point Urban Interchange with 34th Avenue Ramps
Alternative 8A would incorporate the SPUI from Alternative 8 and add additional on and off-
ramps at 34th Avenue East. The ramps at 34th Avenue East would allow additional access to
Port of Tacoma Road without adding an intersection. Traffic would either turn left on Pacific
Highway East or go straight through the signal on 34th Avenue East and turn left on 12th Street
East.
2.2.2.12 Alternative 9 – Revised Ramp at Port of Tacoma Road plus Ramps at 34th Avenue East
This alternative, the preferred configuration from the 2003 design charrette, was reevaluated as
part of the IJR. To eliminate the closely spaced intersection of the southbound off-ramp and Port
of Tacoma Road, the existing southbound off-ramp to Port of Tacoma Road and left turn from
Port of Tacoma Road to the southbound on-ramp will be eliminated. New southbound on- and
off-ramps would connect to 34th Avenue East with a traffic signal at Pacific Highway East and
provide access to Port of Tacoma Road via 12th Street East. An additional southbound off-ramp
would connect to Port of Tacoma Road closer to the bridge structure with a traffic signal and
provide additional north or southbound access to Port of Tacoma Road.
2.3 Alternative Screening
A three-tiered screening process analyzed the benefits and viability of each alternative.
Screening criteria were developed to address issues raised in the project’s purpose and need
statement and to measure each alternative’s ability to successfully go through the
environmental documenting process. The Level I screening identified and eliminated the fatally
flawed alternatives. The Level II screening evaluated the remaining alternatives on geometrics
and environmental issues. Finally, the Level III screening considered the alternative’s ability to
serve projected traffic volumes obtained from the PSRC travel demand forecasting. Table 2-1
describes each rejected alternative and the reasons for its rejection.
The three-tiered screening process identified two alternatives – Alternatives 6 and 8 – as viable
alternatives to improve the interchange and meet the stated project objectives. Screening results
were validated through WSDOT’s Value Matrix Analysis process, which concluded that
Alternatives 6 and 8 provided the greatest benefit to cost ratio of all the alternatives evaluated
in the Level III screening process.
At the request of the TAC, the operational attributes of Alternatives 6 and 8 were analyzed
through detailed VISSIM modeling. Its results showed that both Alternatives 6 and 8 provided
desired operational improvements for the interchange, but Alternative 6 provided slightly
greater improvements over Alternative 8. The two alternatives were reevaluated through a

Final Intersection Justification Report BergerABAM, SAPWT-09-139
Port of Tacoma Road Intersection with Interstate 5 February 2012
City of Fife, Washington Page 2-8
refinement of the Value Matrix Analysis, which showed that, compared with Alternative 8,
Alternative 6 could be constructed in phases and would require a limited amount of ROW to
widen Port of Tacoma Road and SR 99. With the inclusion of these two factors, Alternative 6
had the highest benefit to cost ratio.
Table 2-1. Alternative Screening Results Summary No. Alternative
Name Description Screening Level
Rejected Reason for Rejection
1 1 Revised southbound I-5 off -ramp Level I Doesn’t reduce number of
intersection points
2 1B Parclo B with southbound I-5 off-ramp to 34th
Ave E
Level I SB I-5 off-ramp decreased lane
storage and potential added left
turn at POT Rd
3 2 Capacity widening VISSIM Traffic
Modeling
Didn’t meet expected operational
improvements
4 3 Reconstructed POT Southbound Off Ramp Level I -Refinement Concept refined and incorporated
to a similar alternative
5 4 Ramps at 34th Ave E with a Revised Intersection
at 20th Street E
WSDOT’s value
matrix
Lower scoring in WSDOT’s value
matrix
6 4A Parclo A/B WSDOT’s values
matrix
Lower scoring in WSDOT’s value
matrix
7 5 Directional Interchange Plus Diamond
Interchange
Level 2(a) Exceeded maximum allowable
ramp grades
8 6 Diamond Interchange with couplet Proposed Alternative
9 7 Left exit Level I Didn’t address closely spaced
intersections and added a new
one.
10 8 SPUI VISSIM traffic
modeling
Challenging phasing and
constructability
11 8A SPUI with 34th Ave E ramps Level I - Refinement Concept refined and incorporated
to a similar alternative
12 9 Revised Ramp at POT Rd plus Ramps at 34th
Ave E
Level I - Refinement Concept refined and incorporated
to a similar alternative
Final Intersection Justification Report BergerABAM, SAPWT-09-139
Port of Tacoma Road Intersection with Interstate 5 February 2012
City of Fife, Washington Page 2-9
2.3.1 Recommended Alternative
The recommended alternative, Alternative 6 – Diamond Couplet Interchange, proposes the
reconfiguration of the existing One-Quad Parclo B interchange to a split diamond configuration
with the Port of Tacoma Road and 34th Avenue East operating as a one-way couplet. This
alternative was endorsed by the TAC on 20 January 2010 (see Appendix D). The other attributes
of the alternative include the following.
• Can be constructed in multiple phases
• Can be constructed under traffic
• Requires no widening of Port of Tacoma Road
• Requires minimal widening of SR 99 (eastbound right-turn pocket at Port of Tacoma Road
intersection)
• Entails least length of queuing of all alternatives
• Increases spacing between the intersections of Port of Tacoma Road with I-5 and SR 99
• Is consistent with Purpose and Need statement developed by project stakeholders because
of signalization and increased capacity for vehicles traveling southbound on Port of Tacoma
Road to northbound I-5
• Is consistent with needs identified in Policy Point 1
• Is consistent with design standards of Policy Point 4
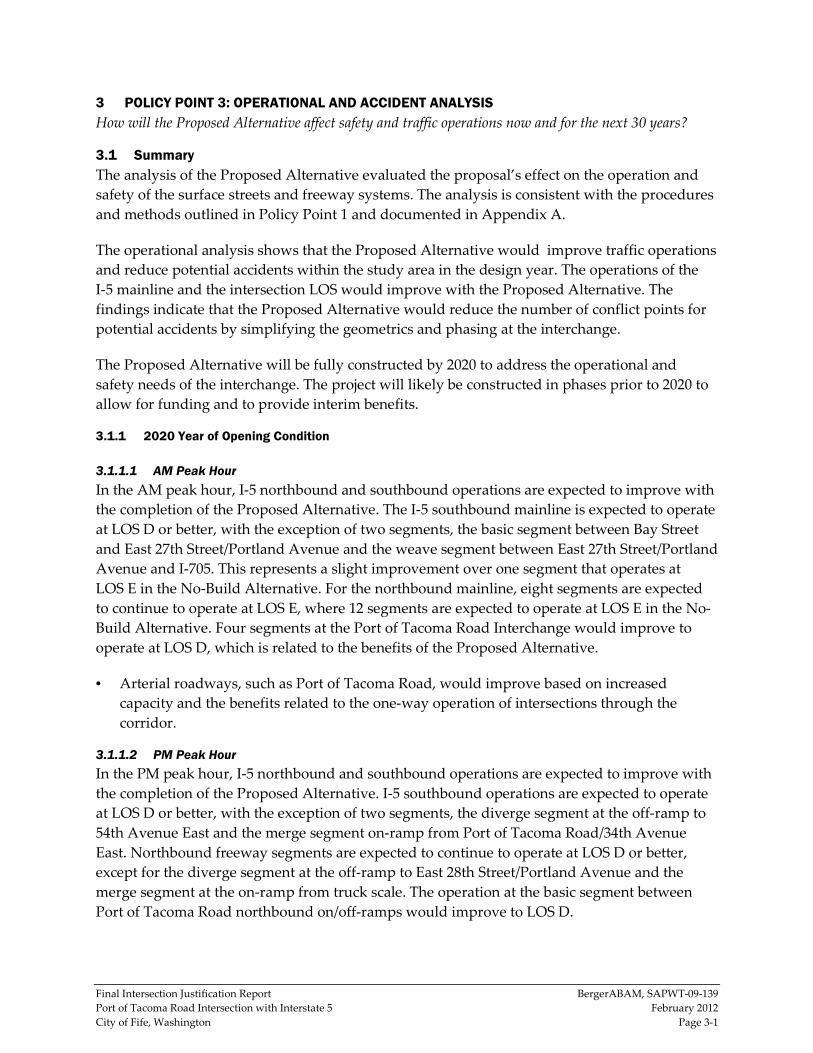
Final Intersection Justification Report BergerABAM, SAPWT-09-139
Port of Tacoma Road Intersection with Interstate 5 February 2012
City of Fife, Washington Page 3-1
3 POLICY POINT 3: OPERATIONAL AND ACCIDENT ANALYSIS
How will the Proposed Alternative affect safety and traffic operations now and for the next 30 years?
3.1 Summary
The analysis of the Proposed Alternative evaluated the proposal’s effect on the operation and
safety of the surface streets and freeway systems. The analysis is consistent with the procedures
and methods outlined in Policy Point 1 and documented in Appendix A.
The operational analysis shows that the Proposed Alternative would improve traffic operations
and reduce potential accidents within the study area in the design year. The operations of the
I-5 mainline and the intersection LOS would improve with the Proposed Alternative. The
findings indicate that the Proposed Alternative would reduce the number of conflict points for
potential accidents by simplifying the geometrics and phasing at the interchange.
The Proposed Alternative will be fully constructed by 2020 to address the operational and
safety needs of the interchange. The project will likely be constructed in phases prior to 2020 to
allow for funding and to provide interim benefits.
3.1.1 2020 Year of Opening Condition
3.1.1.1 AM Peak Hour
In the AM peak hour, I-5 northbound and southbound operations are expected to improve with
the completion of the Proposed Alternative. The I-5 southbound mainline is expected to operate
at LOS D or better, with the exception of two segments, the basic segment between Bay Street
and East 27th Street/Portland Avenue and the weave segment between East 27th Street/Portland
Avenue and I-705. This represents a slight improvement over one segment that operates at
LOS E in the No-Build Alternative. For the northbound mainline, eight segments are expected
to continue to operate at LOS E, where 12 segments are expected to operate at LOS E in the No-
Build Alternative. Four segments at the Port of Tacoma Road Interchange would improve to
operate at LOS D, which is related to the benefits of the Proposed Alternative.
• Arterial roadways, such as Port of Tacoma Road, would improve based on increased
capacity and the benefits related to the one-way operation of intersections through the
corridor.
3.1.1.2 PM Peak Hour
In the PM peak hour, I-5 northbound and southbound operations are expected to improve with
the completion of the Proposed Alternative. I-5 southbound operations are expected to operate
at LOS D or better, with the exception of two segments, the diverge segment at the off-ramp to
54th Avenue East and the merge segment on-ramp from Port of Tacoma Road/34th Avenue
East. Northbound freeway segments are expected to continue to operate at LOS D or better,
except for the diverge segment at the off-ramp to East 28th Street/Portland Avenue and the
merge segment at the on-ramp from truck scale. The operation at the basic segment between
Port of Tacoma Road northbound on/off-ramps would improve to LOS D.
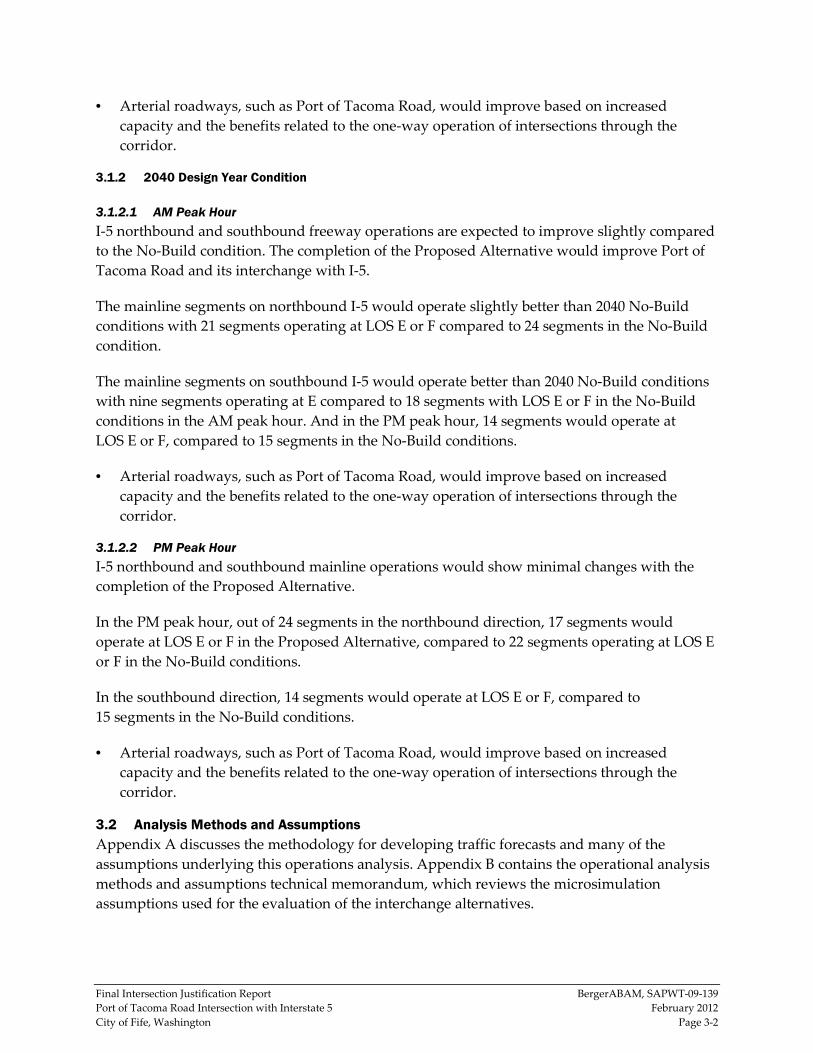
Final Intersection Justification Report BergerABAM, SAPWT-09-139
Port of Tacoma Road Intersection with Interstate 5 February 2012
City of Fife, Washington Page 3-2
• Arterial roadways, such as Port of Tacoma Road, would improve based on increased
capacity and the benefits related to the one-way operation of intersections through the
corridor.
3.1.2 2040 Design Year Condition
3.1.2.1 AM Peak Hour
I-5 northbound and southbound freeway operations are expected to improve slightly compared
to the No-Build condition. The completion of the Proposed Alternative would improve Port of
Tacoma Road and its interchange with I-5.
The mainline segments on northbound I-5 would operate slightly better than 2040 No-Build
conditions with 21 segments operating at LOS E or F compared to 24 segments in the No-Build
condition.
The mainline segments on southbound I-5 would operate better than 2040 No-Build conditions
with nine segments operating at E compared to 18 segments with LOS E or F in the No-Build
conditions in the AM peak hour. And in the PM peak hour, 14 segments would operate at
LOS E or F, compared to 15 segments in the No-Build conditions.
• Arterial roadways, such as Port of Tacoma Road, would improve based on increased
capacity and the benefits related to the one-way operation of intersections through the
corridor.
3.1.2.2 PM Peak Hour
I-5 northbound and southbound mainline operations would show minimal changes with the
completion of the Proposed Alternative.
In the PM peak hour, out of 24 segments in the northbound direction, 17 segments would
operate at LOS E or F in the Proposed Alternative, compared to 22 segments operating at LOS E
or F in the No-Build conditions.
In the southbound direction, 14 segments would operate at LOS E or F, compared to
15 segments in the No-Build conditions.
• Arterial roadways, such as Port of Tacoma Road, would improve based on increased
capacity and the benefits related to the one-way operation of intersections through the
corridor.
3.2 Analysis Methods and Assumptions
Appendix A discusses the methodology for developing traffic forecasts and many of the
assumptions underlying this operations analysis. Appendix B contains the operational analysis
methods and assumptions technical memorandum, which reviews the microsimulation
assumptions used for the evaluation of the interchange alternatives.

Final Intersection Justification Report BergerABAM, SAPWT-09-139
Port of Tacoma Road Intersection with Interstate 5 February 2012
City of Fife, Washington Page 3-3
3.2.1 Travel Demand Forecasting
The analysis used an enhanced version of the PSRC regional transportation model to develop
forecasts of future travel demand. The enhanced model used a finer land-use zone structure and
a more detailed transportation network to better reflect the I-5 corridor and the local streets
within the study area. Forecasts were developed for 2020 and 2040 based on PSRC data for
those years.
The 2020 and 2040 forecasts differ on the assumed completion of the SR 167 connection. This
connection provides a strong operational benefit to the study area. The 2020 year of opening
does not include the benefit of the SR 167 extension because the completion of the project by
2020 is unlikely because of funding and the lead time required for construction. Without the
SR 167 extension, congestion levels are forecasted to be so severe that there would be little or
only minor differentiation between the No-Build and Proposed alternatives. Appendix A
explains the future year traffic volume forecasting methodology.
3.2.2 Operational and Safety Analysis Methods and Assumptions
Appendix B explains the operational analysis methodology. The microsimulation model
(VISSIM) examines intersection performance by correlating the effect of intersection volumes,
roadway geometrics, and signal timing/phasing for a detail review of roadway operations. The
software reports a number of evaluation metrics, including travel time, delay, and intersection
LOS.
3.2.3 Potential Accident Forecast Methodology
The standard methodology for forecasting future accidents is to find an interchange location
with a similar geometry and to apply that accident rate to the forecasted volume. For the No-
Build analysis, as volumes increase, the accident rate is likely to increase. Even if the accident
rate remains the same, the total number of accidents would increase with growth in traffic on
area freeways, ramps, and at intersections. Moreover, actual accident rates are affected by a
number of factors, such as weather, driver behavior, and vehicle condition.
The Proposed Alternative would create four intersections made up of two one-way approaches.
Each of these intersections would have simple geometry and phasing, with only five conflict
points and two signal phases per intersection. In comparison, the No-Build Alternative has
11 conflict points and 5 signal phases for the southbound ramps’ intersection and 6 conflict
points for the northbound ramps. Generally, an intersection with fewer conflict points and
simpler signal phasing will have fewer accidents. Therefore, the Proposed Alternative would be
expected to have a lower accident rate overall than the No-Build Alternative.
3.3 Year of Opening Conditions (2020)
The Proposed Alternative’s year of opening is assumed to be 2020. The analysis assumes the
completion of the entire interchange project by 2020. However, funding and construction
schedules may result in phasing the project. This section describes the operation of freeways
and intersections at the year of opening and a safety analysis comparing the Proposed
Alternative to the No-Build Alternative. Both alternatives assume the additional improvements

Final Intersection Justification Report BergerABAM, SAPWT-09-139
Port of Tacoma Road Intersection with Interstate 5 February 2012
City of Fife, Washington Page 3-4
to freeways, interchanges, arterials, or ramps within the study area identified in local and
regional planning documents. The completion of the SR 167 Interchange and Extension project
is not assumed in 2020. The complete list of assumed improvements is found in Table 1-1.
3.3.1 3.1.1 Year of Opening (2020) Freeway Operations
The freeway mainline, merge and diverge points, and weaving segments were analyzed for the
Proposed and No-Build alternatives in the year of opening. Table 3-1 summarizes the I-5
mainline operations for the 2020 Proposed Alternative. Figures 3-1 and 3-2 present the results of
freeway segment LOS and lane configuration for the 2020 Proposed Alternative.
In the AM peak hour, 4 of the I-5 northbound and 1 of the I-5 southbound mainline segments
would improve to LOS D or better with the Proposed Alternative. However, 8 of the
19 mainline segments of the I-5 northbound direction would continue to operate at LOS E or F
under the 2020 Proposed Alternative. Of the 5 merge/diverge/weave segments in the
northbound direction, four would operate at LOS E. In the southbound direction, 1 mainline
segment and 1 merge/diverge/weave segment would operate at LOS E.
In the PM peak hour, I-5 southbound operations would improve to operate at LOS D or better,
with the exception of 2 segments, the diverge segment at the off-ramp to 54th Avenue East and
the merge segment on-ramp from Port of Tacoma Road/34th Avenue East. Northbound freeway
segments are expected to continue to operate at LOS D or better, except for the diverge segment
at the off-ramp to East 28th Street/Portland Avenue and the merge segment at the on-ramp from
the truck scale. The operation at the basic mainline segment between the Port of Tacoma Road
northbound on-/off-ramp would improve to LOS D.
3.3.2 Year of Opening (2020) Intersection Operations
The intersection analysis for the year of opening was based on the HCM2000 methods for
unsignalized and signalized intersections. Using the forecasted volumes for 2020, the analysis
evaluated study area intersections to calculate the performance of intersection operations
during the AM and PM peak hours. The analysis includes the intersections formed by the
Proposed Alternative. Table 3-2 presents the results of intersection analysis in 2020 for the
Proposed Alternative.
The Proposed Alternative changes the operation of intersections on Port of Tacoma Road,
creating a one-way couplet with southbound traffic traveling on Port of Tacoma Road and
northbound traffic on 34th Avenue East.

Final Intersection Justification Report BergerABAM, SAPWT-09-139
Port of Tacoma Road Intersection with Interstate 5 February 2012
City of Fife, Washington Page 3-5
Table 3-1. 2020 Proposed Alternative I-5 Mainline Freeway Operations Summary
Type
AM Peak Hour PM Peak Hour
LOS Density1 LOS Density1
IIII----5 Northbound5 Northbound5 Northbound5 Northbound
I-5 NB on-ramp from I-705 Merge C 28 D 35
I-5 NB off-ramp to E 28th Street/Portland Ave Diverge C 27 E 36
I-5 NB off-ramp to E Bay Street Diverge D 31 D 34
I-5 NB between E Bay Street off/on-ramps Basic D 32 D 28
I-5 NB on-ramp from E 28th Street Merge D 30 C 25
I-5 NB between E 28th Street. On-ramp and POT Rd off-ramp Basic D 31 D 26
I-5 NB off-ramp to POT Rd/34th Ave Diverge D 31 C 26
I-5 NB between POT Rd NB off/on-ramps Basic D 33 D 29
I-5 NB on-ramp from POT Rd/34th Ave Merge D 30 C 28
I-5 NB between POT Rd and 54th Ave E Basic E 35 D 32
I-5 NB off-ramp to 54th Ave E Diverge E 36 D 33
I-5 NB between 54th Ave E on/off ramps Basic D 29 D 26
I-5 NB on-ramp from 54th Ave E Merge E 35 D 32
I-5 NB between 54th Ave E on ramp and truck scales off
ramp Basic E 35 D 32
I-5 NB off-ramp to truck scales Diverge E 35 D 33
I-5 NB between truck scales off/on-ramps Basic E 37 D 34
I-5 NB on-ramp from truck scales Merge E 41 E 40
I-5 NB between truck scales and SR 18 Basic E 37 D 35
I-5 NB off-ramp to SR 18 Diverge D 31 D 31
Notes: Average volumes based on 13 VISSIM runs Bold indicates unacceptable operation. 1. Modeled traffic volume expressed as a percent of observed traffic volume. For example: 100% indicates an exact replication of field conditions. Source: Fehr & Peers, 2010.
IIII----5 Southbound5 Southbound5 Southbound5 Southbound
I-5 SB on-ramp from SR 18 Merge C 23 C 26
I-5 SB between SR 18 and truck scales Basic C 26 D 31
I-5 SB off-ramp to truck scales Diverge C 24 C 28
I-5 SB between truck scales off/on-ramps Basic C 25 D 30
I-5 SB on-ramp from truck scales Merge C 24 C 28
I-5 SB between truck scales on ramp and 54th Ave E off
ramp Basic C 26 D 31
I-5 SB off ramp to 54th Ave E Diverge D 32 E 38
I-5 SB between 54th Ave E on/off ramps Basic C 22 D 28
I-5 SB on-ramp from 54th Ave E Merge D 30 D 33
I-5 SB off-ramp to POT Rd/34th Ave Diverge D 31 D 34

Final Intersection Justification Report BergerABAM, SAPWT-09-139
Port of Tacoma Road Intersection with Interstate 5 February 2012
City of Fife, Washington Page 3-6
Table 3-1. 2020 Proposed Alternative I-5 Mainline Freeway Operations Summary
Type
AM Peak Hour PM Peak Hour
LOS Density1 LOS Density1
I-5 SB between POT Rd off/on-ramps Basic D 28 D 32
I-5 SB on-ramp from POT Rd/34th Ave Merge C 28 E 36
I-5 SB off-ramp to Bay Street Diverge C 27 D 34
I-5 SB between Bay Street on/off ramps Basic D 28 D 34
I-5 SB on-ramp from Bay Street Merge D 33 D 30
I-5 SB between Bay Street and E 27th Street/Portland Ave Basic E 36 D 33
I-5 SB weave between E 27th Street/Portland Ave and I-705 Weave E 36 D 35
Notes: Average volumes based on 13 VISSIM runs. 1. Modeled traffic volume expressed as a percent of observed traffic volume. For example: 100% indicates an exact replication of field conditions. Source: Fehr & Peers, 2010.
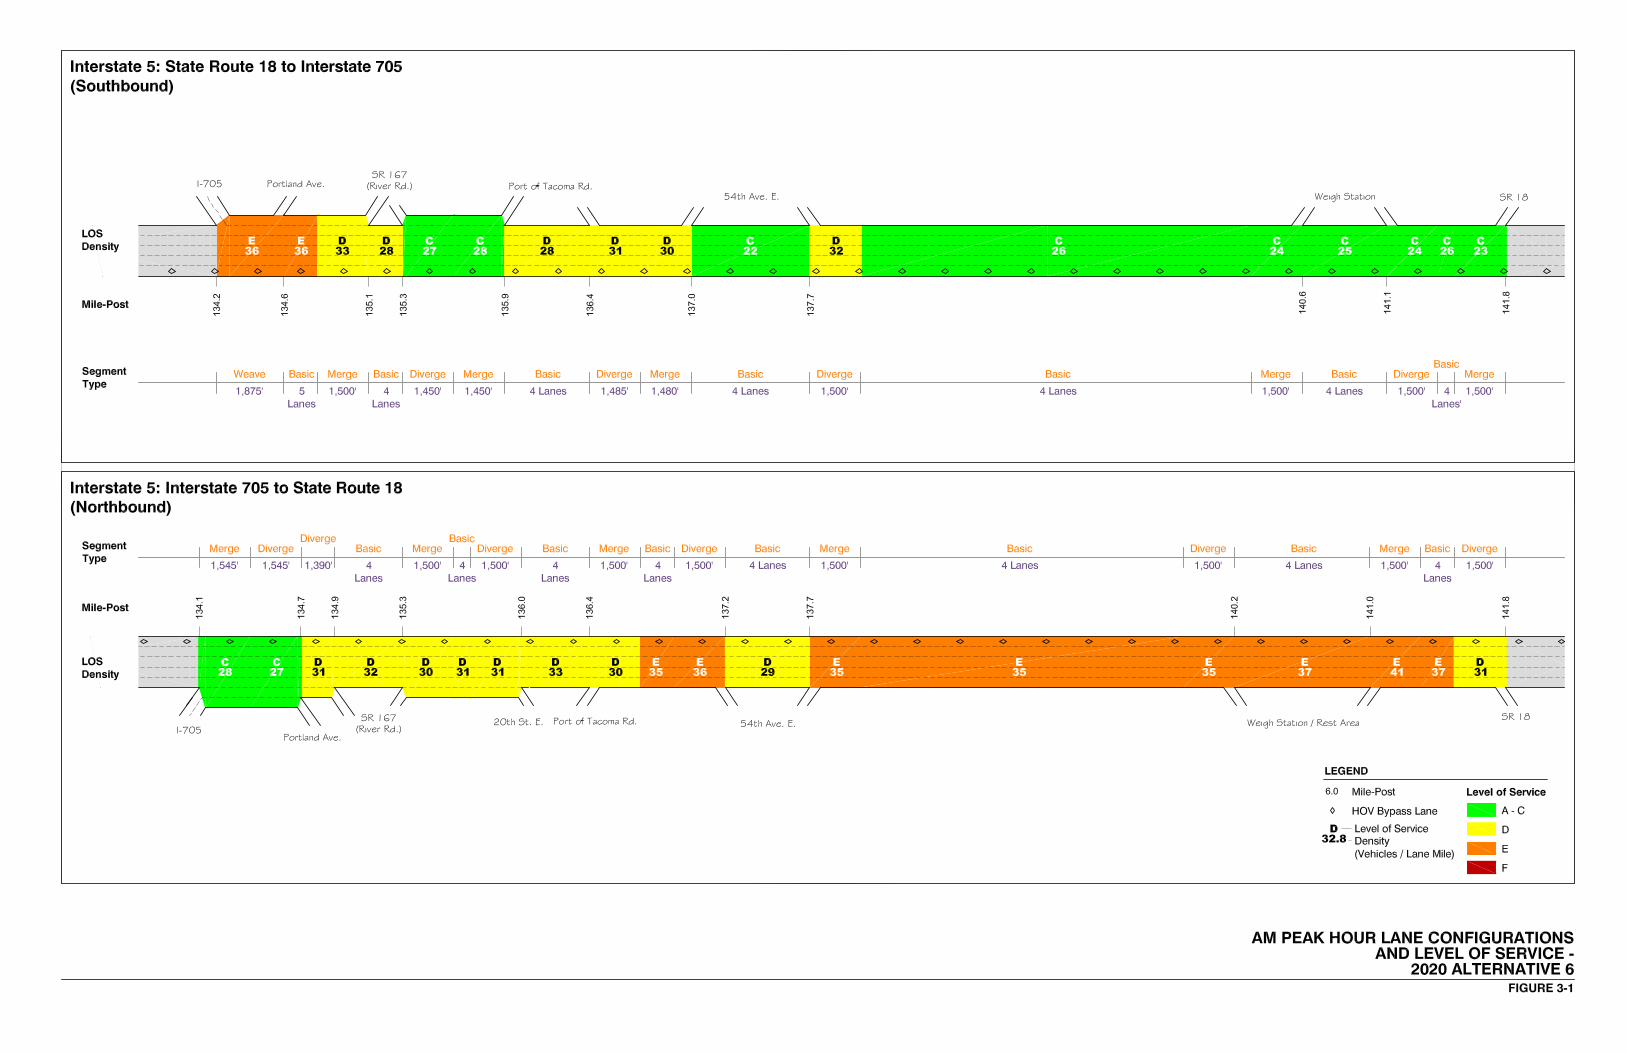


Final Intersection Justification Report BergerABAM, SAPWT-09-139
Port of Tacoma Road Intersection with Interstate 5 February 2012
City of Fife, Washington Page 3-9
Table 3-2. Intersection Levels of Service - 2020 Peak Hour Conditions – Proposed Alternative
Intersection Traffic Control
AM Peak Hour PM Peak Hour
NB SB EB WB Total NB SB EB WB Total
1 E Portland Ave/E 27th St Signal C/21 B/15 E/63 C/29 C/34 F/127 F/82 F/99
2 E Portland Ave/E 28th St Signal D/36 B/16 D/51 D/36 C/26 B/17 C/32 C/22
3 E Bay St/E 27th St SSSC A/10 A/2 A/5 C/15 A/4 A/6
4 E Bay St/E 28th St Signal B/15 A/7 A/9 C/23 B/12 B/13
5 POT Rd/SR-509 NB Ramps-12th Ave Signal A/10 C/24 B/18 B/18 A/8 B/17 B/17 B/13
6 POT Rd/Pacific Hwy Signal C/31 B/20 B/11 C/22 C/35 D/47 B/17 C/27
7 POT Rd/I-5 SB Ramps Signal A/1 C/32 B/12 A/4 C/33 B/11
8 POT Rd/I-5 NB Ramps Signal A/6 C/30 C/23 A/7 C/23 B/17
9 POT Rd/20th St Signal A/8 A/8 D/44 D/36 B/18 A/9 A/8 D/38 D/40 C/21
10 Industry Dr/20th St Signal D/44 A/5 A/6 B/13 D/43 A/2 A/8 B/11
17 54th Ave/12th St Signal B/15 B/12 D/48 D/42 B/19 B/18 E/80 F/>200 E/56 E/78
18 54th Ave/Pacific Hwy Signal C/27 F/103 E/56 E/56 D/54 C/26 F/188 F/>200 E/58 F/>200
19 54th Ave/I-5 SB Ramps Signal B/19 A/2 D/51 C/23 D/42 D/36 D/52 D/43
20 54th Ave/I-5 NB Ramps Signal A/2 D/36 C/24 B/15 A/3 E/76 B/16 C/31
21 54th Ave/20th St Signal E/60 C/27 D/45 D/44 D/43 F/>200 F */ F/146 D/39 F/96
22 34th Ave/Pacific Hwy Signal B/14 C/24 D/36 C/24 E/59 F/110 C/22 D/41
23 34th Ave/I-5 SB Ramps Signal A/7 D/46 B/12 A/6 D/46 B/12
24 34th Ave/I-5 NB Ramps Signal B/12 C/27 C/21 A/4 D/41 B/16
25 34th Ave/20th St Signal A/2 A/3 A/2 B/19 A/9 B/14
Notes: SSSC = side-street stop-controlled. Source: Fehr & Peers, 2010.
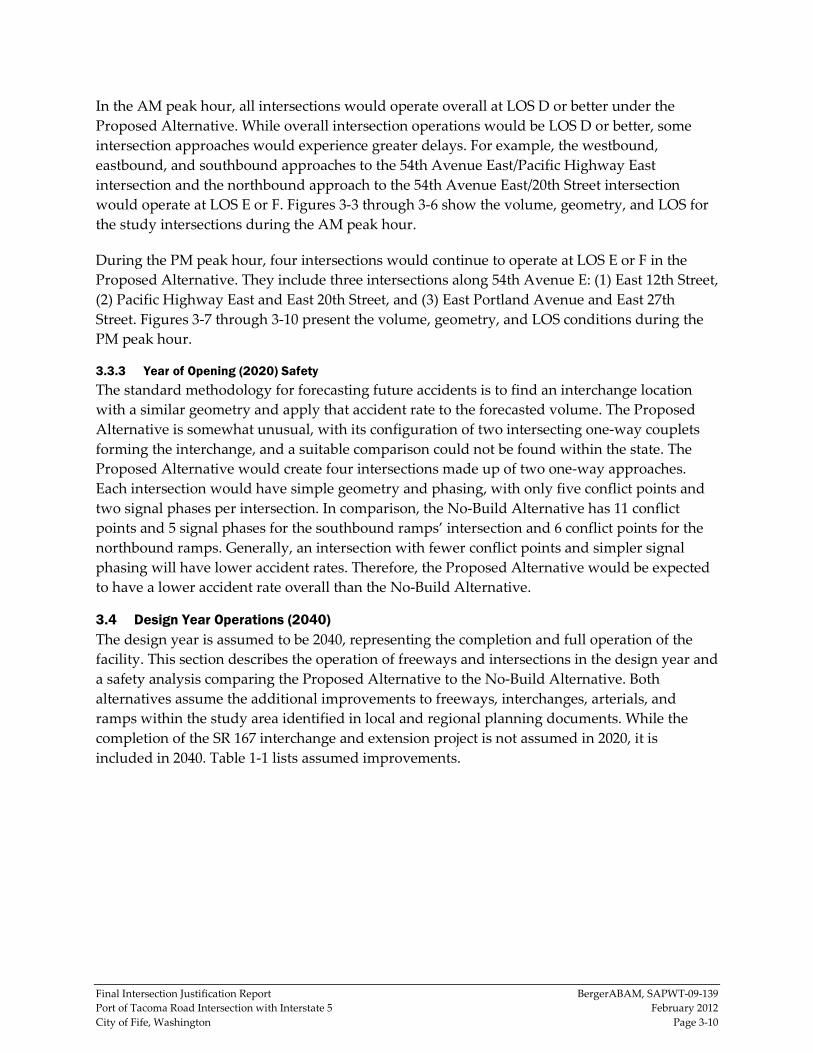
Final Intersection Justification Report BergerABAM, SAPWT-09-139
Port of Tacoma Road Intersection with Interstate 5 February 2012
City of Fife, Washington Page 3-10
In the AM peak hour, all intersections would operate overall at LOS D or better under the
Proposed Alternative. While overall intersection operations would be LOS D or better, some
intersection approaches would experience greater delays. For example, the westbound,
eastbound, and southbound approaches to the 54th Avenue East/Pacific Highway East
intersection and the northbound approach to the 54th Avenue East/20th Street intersection
would operate at LOS E or F. Figures 3-3 through 3-6 show the volume, geometry, and LOS for
the study intersections during the AM peak hour.
During the PM peak hour, four intersections would continue to operate at LOS E or F in the
Proposed Alternative. They include three intersections along 54th Avenue E: (1) East 12th Street,
(2) Pacific Highway East and East 20th Street, and (3) East Portland Avenue and East 27th
Street. Figures 3-7 through 3-10 present the volume, geometry, and LOS conditions during the
PM peak hour.
3.3.3 Year of Opening (2020) Safety
The standard methodology for forecasting future accidents is to find an interchange location
with a similar geometry and apply that accident rate to the forecasted volume. The Proposed
Alternative is somewhat unusual, with its configuration of two intersecting one-way couplets
forming the interchange, and a suitable comparison could not be found within the state. The
Proposed Alternative would create four intersections made up of two one-way approaches.
Each intersection would have simple geometry and phasing, with only five conflict points and
two signal phases per intersection. In comparison, the No-Build Alternative has 11 conflict
points and 5 signal phases for the southbound ramps’ intersection and 6 conflict points for the
northbound ramps. Generally, an intersection with fewer conflict points and simpler signal
phasing will have lower accident rates. Therefore, the Proposed Alternative would be expected
to have a lower accident rate overall than the No-Build Alternative.
3.4 Design Year Operations (2040)
The design year is assumed to be 2040, representing the completion and full operation of the
facility. This section describes the operation of freeways and intersections in the design year and
a safety analysis comparing the Proposed Alternative to the No-Build Alternative. Both
alternatives assume the additional improvements to freeways, interchanges, arterials, and
ramps within the study area identified in local and regional planning documents. While the
completion of the SR 167 interchange and extension project is not assumed in 2020, it is
included in 2040. Table 1-1 lists assumed improvements.

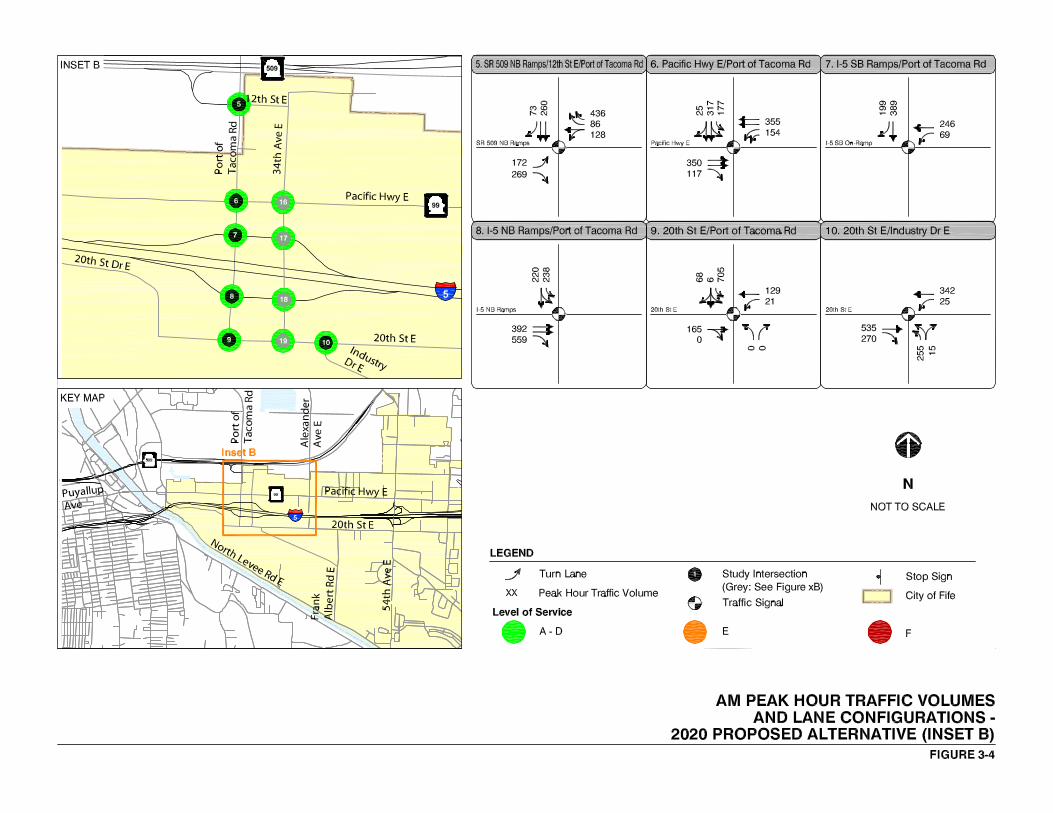


Final Intersection Justification Report BergerABAM, SAPWT-09-139
Port of Tacoma Road Intersection with Interstate 5 February 2012
City of Fife, Washington Page 3-19
3.4.1 Design Year (2040) Freeway Operations
The analysis evaluated freeway basic, merge, diverge, and weaving mainline segments for the
Proposed Alternative in the design year. Table 3-3 summarizes the I-5 mainline operations for
the 2040 Proposed Alternative. Figure 3-11 shows the results for 2040 conditions for freeway
operations in the AM peak hour and Figure 3-12 shows the PM peak hour results.
In the 2040 design year, most of the I-5 segments in the northbound direction would operate at
LOS E or F during the AM peak hour. Of the 26 freeway segments in the northbound direction,
17 would operate at LOS F and 5 would operate at LOS E during the AM peak hour under the
2040 Proposed Alternative. Of the 15 merge/diverge/weave segments in the northbound
direction, all but 3 would operate at LOS E or LOS F.
During the PM peak hour, all but nine I-5 mainline segments would operate at LOS E or F. Six
segments would operate at LOS F and 11 would operate at LOS E under the 2040 Proposed
Alternative. A comparison to the 2040 No-Build analysis reveals only slight improvement with
the Proposed Alternative. Because the objective of this project is improving the Port of Tacoma
Road with I-5 interchange, it is not surprising that freeway mainline operations are not expected
to improve with the project.
In the southbound direction, four basic segments and five merge/diverge/weave segments
would operate at LOS E during the AM peak hour for the 2040 Proposed Alternative. None of
the southbound freeway segments would operate at LOS F—a significant improvement
compared to the No-Build conditions, in which 18 segments operate at LOS E or F. During the
PM peak hour, seven basic segments and seven merge/diverge/weave segments would operate
at LOS E or F with the 2040 Proposed Alternative, compared to the improvement of only one
segment from LOS E to LOS D with the 2040 No-Build alternative.
3.4.2 Design Year (2040) Intersection Operations
The intersection analysis for the design year was based on the HCM2000 methods for
unsignalized and signalized intersections. Using the forecasted volumes for 2040, the analysis
evaluated the study area intersections to calculate the performance of intersection operations
during the AM and PM peak hours. The analysis includes four additional intersections along
the 34th Avenue East corridor formed by the Proposed Alternative.
The Proposed Alternative changes the operation of intersections on Port of Tacoma Road,
creating a one-way couplet with southbound traffic traveling on Port of Tacoma Road and
northbound traffic on 34th Avenue East. The Proposed Alternative includes the planned
improvements to the transportation system identified in Table 1-1.
The travel forecasting model was run to estimate the 2040 traffic volumes associated with the
Proposed Alternative. Figures 3-13 through 3-20 present the AM and PM peak hour volumes by
movement for each intersection.

Final Intersection Justification Report BergerABAM, SAPWT-09-139
Port of Tacoma Road Intersection with Interstate 5 February 2012
City of Fife, Washington Page 3-20
Table 3-3. 2040 Proposed Alternative I-5 Mainline Freeway Operations
Type
AM Peak Hour PM Peak Hour
LOS Density1 LOS Density1
IIII----5 Northbound5 Northbound5 Northbound5 Northbound
I-5 NB on-ramp from I-705 Merge D 33 D 34
I-5 NB off-ramp to E 28th Street/Portland Ave Diverge E 38 E 36
I-5 NB off-ramp to E Bay Street Diverge E 41 E 37
I-5 NB between E Bay Street off/on-ramps Basic E 42 E 35
I-5 NB on-ramp from E 28th Street Merge E 41 D 30
I-5 NB between E 28th Street. On-ramp and POT Rd off-ramp Basic F 45 D 31
I-5 NB off-ramp to POT Rd/34th Ave Diverge F 48 D 35
I-5 NB between POT Rd NB off/on-ramps Basic F 50 E 36
I-5 NB on-ramp from POT Rd/34th Ave Merge F 68 E 39
I-5 NB between POT Rd and 54th Ave E Basic F 58 E 41
I-5 NB off-ramp to 54th Ave E Diverge F 57 F 51
I-5 NB off-ramp to SR 167 Diverge D 32 E 37
I-5 NB off-ramp to SR 167 HOV Diverge C 23 C 23
I-5 NB between SR 167 HOV and 54th Ave E on-ramps Basic D 31 D 27
I-5 NB on-ramp from 54th Ave E Merge F 46 D 34
I-5 NB between 54th Ave E and SR 167 HOV Basic F 56 E 40
I-5 NB on-ramp from SR 167 HOV Merge F 58 D 32
I-5 NB between SR 167 HOV and SR 167 Basic F 61 F 46
I-5 NB on-ramp from SR 167 Merge F 56 D 34
I-5 NB between SR 167 and truck scales off-ramp Basic F 78 E 40
I-5 NB between SR 167 and truck scales off-ramp Basic F 72 F 46
I-5 NB off-ramp to truck scales Diverge F 73 F 44
I-5 NB between truck scales off/on-ramps Basic F 54 F 48
I-5 NB on-ramp from truck scales Merge F 55 F 51
I-5 NB between truck scales and SR 18 Basic F 50 E 44
I-5 NB off-ramp to SR 18 Diverge E 40 E 38
Notes: Average volumes based on 13 VISSIM runs. BoldBoldBoldBold indicates unacceptable operation. 1. Modeled traffic volume expressed as a percent of observed traffic volume. For example: 100% indicates an exact replication of field conditions. Source: Fehr & Peers, 2010.
IIII----5 Southbound5 Southbound5 Southbound5 Southbound
I-5 SB on-ramp from SR 18 Merge C 28 F 70
I-5 SB between SR 18 and truck scales Basic E 36 F 85
I-5 SB off-ramp to truck scales Diverge D 29 F 87
I-5 SB between truck scales off/on-ramps Basic D 35 F 87
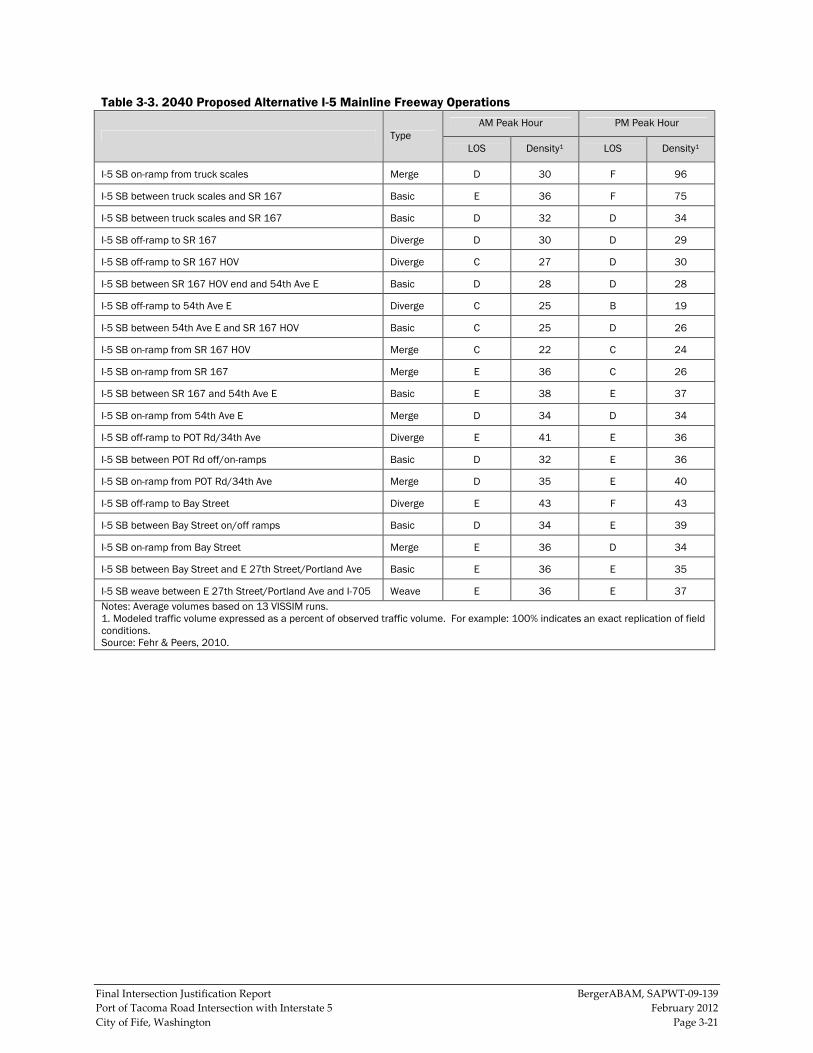
Final Intersection Justification Report BergerABAM, SAPWT-09-139
Port of Tacoma Road Intersection with Interstate 5 February 2012
City of Fife, Washington Page 3-21
Table 3-3. 2040 Proposed Alternative I-5 Mainline Freeway Operations
Type
AM Peak Hour PM Peak Hour
LOS Density1 LOS Density1
I-5 SB on-ramp from truck scales Merge D 30 F 96
I-5 SB between truck scales and SR 167 Basic E 36 F 75
I-5 SB between truck scales and SR 167 Basic D 32 D 34
I-5 SB off-ramp to SR 167 Diverge D 30 D 29
I-5 SB off-ramp to SR 167 HOV Diverge C 27 D 30
I-5 SB between SR 167 HOV end and 54th Ave E Basic D 28 D 28
I-5 SB off-ramp to 54th Ave E Diverge C 25 B 19
I-5 SB between 54th Ave E and SR 167 HOV Basic C 25 D 26
I-5 SB on-ramp from SR 167 HOV Merge C 22 C 24
I-5 SB on-ramp from SR 167 Merge E 36 C 26
I-5 SB between SR 167 and 54th Ave E Basic E 38 E 37
I-5 SB on-ramp from 54th Ave E Merge D 34 D 34
I-5 SB off-ramp to POT Rd/34th Ave Diverge E 41 E 36
I-5 SB between POT Rd off/on-ramps Basic D 32 E 36
I-5 SB on-ramp from POT Rd/34th Ave Merge D 35 E 40
I-5 SB off-ramp to Bay Street Diverge E 43 F 43
I-5 SB between Bay Street on/off ramps Basic D 34 E 39
I-5 SB on-ramp from Bay Street Merge E 36 D 34
I-5 SB between Bay Street and E 27th Street/Portland Ave Basic E 36 E 35
I-5 SB weave between E 27th Street/Portland Ave and I-705 Weave E 36 E 37
Notes: Average volumes based on 13 VISSIM runs. 1. Modeled traffic volume expressed as a percent of observed traffic volume. For example: 100% indicates an exact replication of field conditions. Source: Fehr & Peers, 2010.

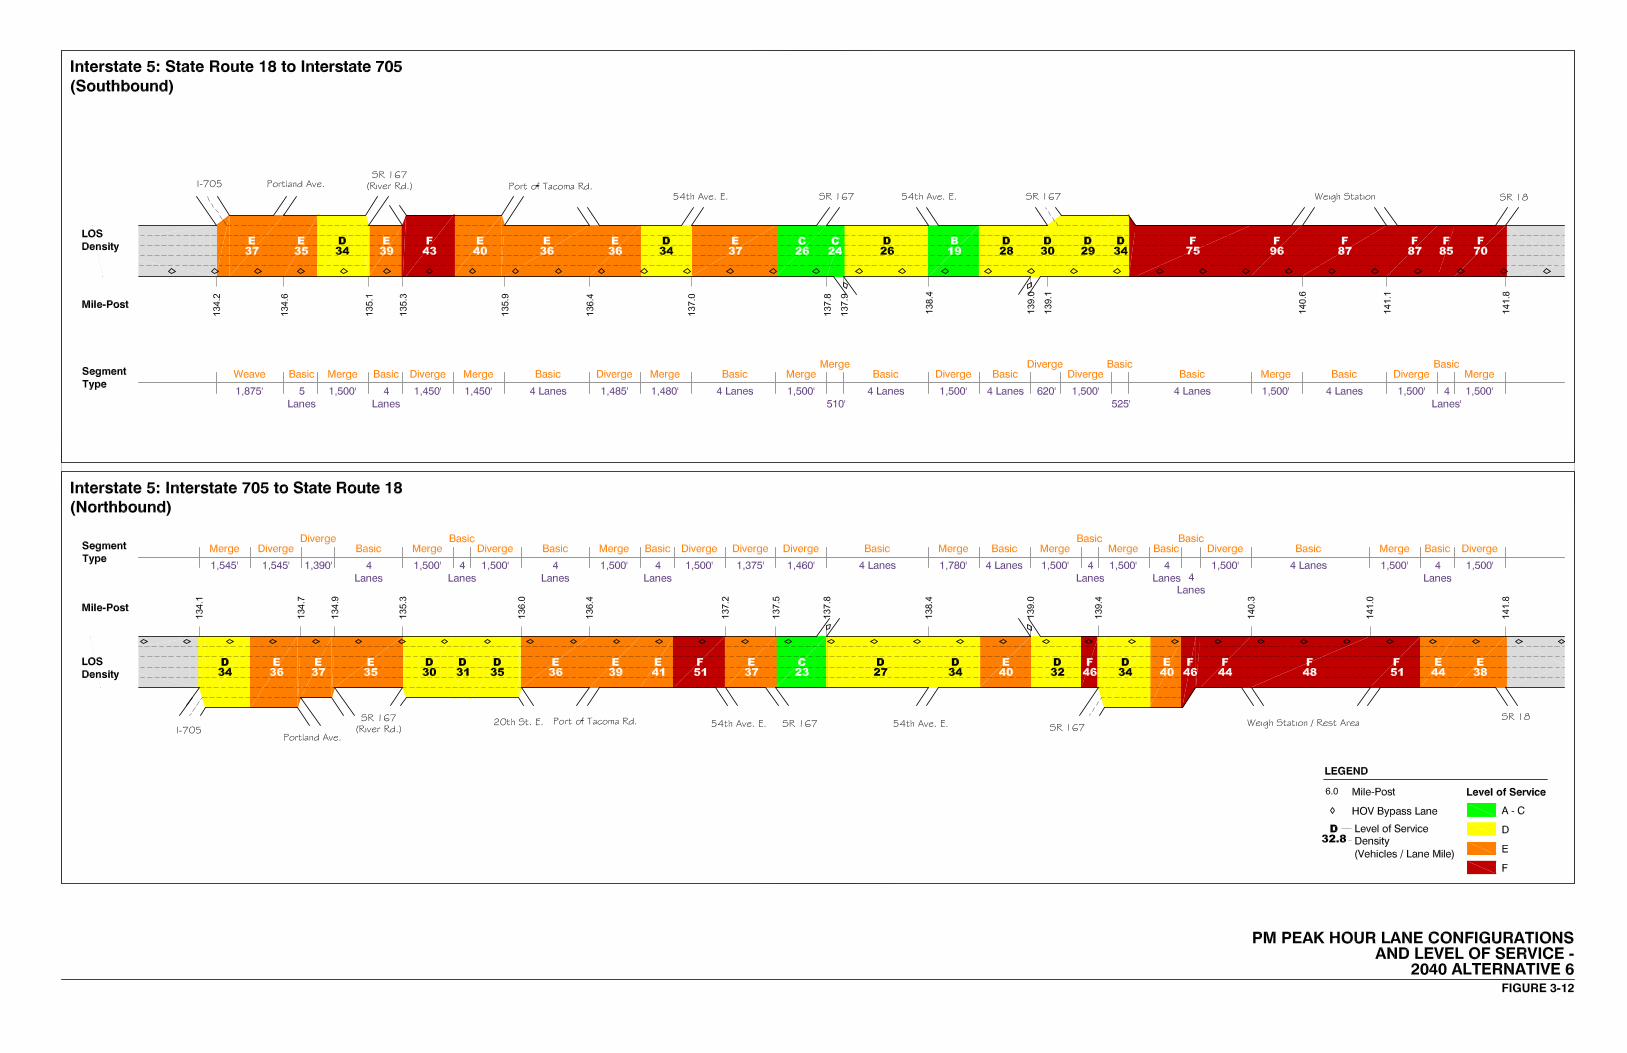

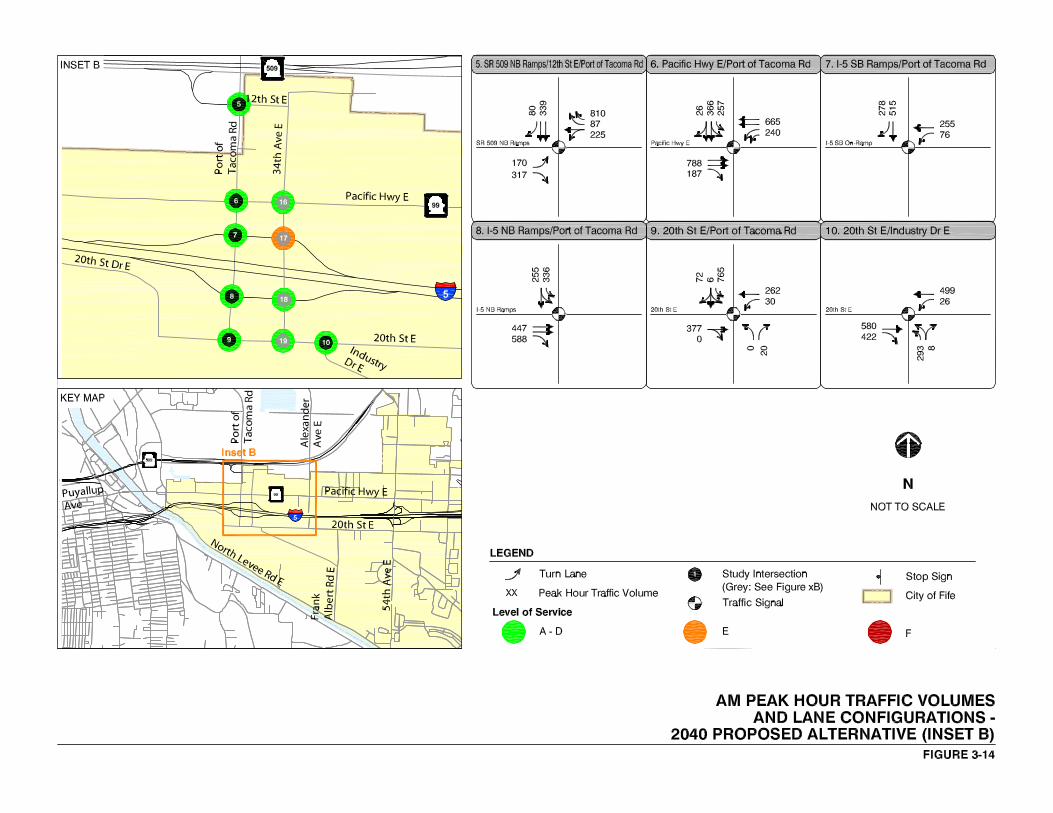


Final Intersection Justification Report BergerABAM, SAPWT-09-139
Port of Tacoma Road Intersection with Interstate 5 February 2012
City of Fife, Washington Page 3-32
As compared to the No-Build Alternative, the Proposed Alternative, by creating a north-south
couplet with 34th Avenue East, would improve peak hour LOS operations at all Port of Tacoma
Road intersections by simplifying signal phasing and increasing directional capacity. For
example, the intersection of Port of Tacoma Road/Pacific Highway East would change from an
eight-phase to a four-phase signal under the Proposed Alternative. Table 3-4 summarizes the
intersection control delay and LOS conditions for the AM and PM peak hours for the 2040
Proposed Alternative. The LOS is reported by individual approach and for the overall
intersection.
During the AM peak hour, the Proposed Alternative would improve the operation of the Port of
Tacoma Road interchange. Only the 34th Avenue East/I-5 southbound ramps intersection
would operate at LOS E during the AM peak hour, with all other interchange intersections
operating at LOS D or better. The intersections of 54th Avenue East/Pacific Highway East and
54th Avenue East/20th Street East would operate at LOS F due to westbound congestion related
to morning commute patterns and traffic volumes. All other study area intersections would
operate overall at LOS D or better during the AM peak hour.
During the PM peak hour, the Proposed Alternative would improve operations by simplifying
signal phasing and increasing directional capacity at Port of Tacoma Road intersections. For
example, the intersection of Port of Tacoma Road/Pacific Highway East would change from an
eight-phase to a four-phase signal, improving from LOS F under the 2040 No-Build Alternative
to LOS D with the Proposed Alternative. The Portland Avenue and 54th Avenue East
interchanges would continue to have intersections that operate at LOS F during the 2040 PM
peak hour. The signal at East Portland Avenue/East 27th Street would operate at LOS F overall
with failing approaches for the eastbound and southbound movements. Two intersections on
54th Avenue East, at Pacific Highway East and at 12th Street East, would operate at LOS F with
long delays during the evening commute. All other intersections would operate with the
Proposed Alternative at LOS D or better overall during the PM peak hour.
3.4.3 Design Year (2040) Safety
The standard methodology for forecasting future accidents is to find an interchange location
with a similar geometry and apply that accident rate to the forecasted volume. The Proposed
Alternative is somewhat unusual, with its configuration of two intersecting one-way couplets
forming the interchange, and a suitable comparison could not be found within the state.
The Proposed Alternative would create four intersections made up of two one-way approaches.
Each intersection would have simple geometry and phasing, with only five conflict points and
two signal phases per intersection. In comparison, the No-Build Alternative has 11 conflict
points and five signal phases for the southbound ramps intersection and six conflict points for
the northbound ramps. Generally, an intersection with fewer conflict points and simpler signal
phasing will have fewer accidents, and the Proposed Alternative would be expected to have a
lower accident rate overall than the No-Build Alternative.

Final Intersection Justification Report BergerABAM, SAPWT-09-139
Port of Tacoma Road Intersection with I-5 February 2012
City of Fife, Washington Page 3-33
Table 3-4. Intersection Levels of Service - 2040 Peak Hour Conditions – Proposed Alternative
Intersection Traffic Control
AM Peak Hour PM Peak Hour
NB SB EB WB Total NB SB EB WB Total
1 E. Portland Ave/E. 27th St Signal C/22 B/14 E/56 C/27 C/25 F/137 E/65 F/95
2 E. Portland Ave/E. 28th St Signal C/20 B/18 D/42 C/24 C/23 B/13 C/31 B/17
3 E. Bay St/E. 27th St SSSC B/13 A/2 A/7 A/9 A/3 A/5
4 E. Bay St/E. 28th St Signal B/17 A/8 A/10 C/29 B/15 B/17
5 POT Rd/I-509 EB Ramps Signal B/15 C/25 C/25 C/23 C/26 D/38 C/31 C/31
6 POT Rd/Pacific Hwy Signal C/34 C/26 B/10 C/24 F/82 C/30 B/17 D/42
7 POT Rd/I-5 SB Ramps Signal A/2 D/48 B/16 A/6 D/46 B/15
8 POT Rd/I-5 NB Ramps Signal B/15 E/61 D/48 A/8 C/27 B/16
9 POT Rd/20th St E Signal A/9 B/12 D/40 C/33 C/23 C/32 B/12 D/36 C/31 C/26
10 Industry Dr. E/20th St E Signal D/41 A/6 A/7 B/14 D/41 A/7 B/14 B/16
17 54th Ave E/12th St E Signal B/16 D/42 F/116 D/45 D/42 B/15 F/196 F/>20
0 F/133 F/191
18 54th Ave E/Pacific Hwy Signal F* / E/64 D/39 F/>200 F/122 D/35 F/88 F/81 F/>200 F/108
19 54th Ave E/I-5 SB Ramps Signal D/51 B/17 C/31 D/38 A/9 A/3 D/41 A/9
20 54th Ave E/I-5 NB Ramps None C/26 F/90 B/15 D/38 A/1 C/15 C/20 A/9
21 54th Ave E/20th St E Signal F/>200 B/14 E/64 F/>200 F/151 D/53 C/21 D/53 C/34 D/39
22 34th Ave/Pacific Hwy Signal C/30 C/20 D/36 C/28 D/36 B/18 C/32 C/29
23 34th Ave/I-5 SB Ramps Signal E/55 E/69 E/62 A/5 D/42 B/17
24 34th Ave/I-5 NB Ramps Signal D/39 E/64 D/53 A/8 D/44 C/25
25 34th Ave/20th St Signal A/4 A/5 A/4 A/4 A/9 A/7
Notes: SSSC = Side-Street Stop-Controlled. Unct. = Uncontrolled Source: Fehr & Peers, 2010.

Final Intersection Justification Report BergerABAM, SAPWT-09-139
Port of Tacoma Road Intersection with Interstate 5 February 2012
City of Fife, Washington Page 4-1
4 POLICY POINT 4: ACCESS CONNECTIONS AND DESIGN
Will the Proposed Alternative provide fully directional interchanges connected to public streets or roads,
spaced appropriately, and designed to full design level geometric control criteria?
4.1 Summary
The Proposed Alternative provides fully directional access between I-5 and other public roads
via interchange ramps and one-way arterials. The design of the Proposed Alternative
accommodates spacing requirements and constraints and meets current geometric standards.
4.2 Directionality
The Proposed Alternative features the reconstruction of an existing One Quad Parclo B
interchange at I-5 and Port of Tacoma Road into a diamond couplet interchange. Connections to
and from I-5 will be realigned to provide directional traffic movements to a new one-way
couplet arterial system between 12th Street East to 20th Street East. Port of Tacoma Road will
become one-way southbound, while an extension of 34th Avenue East will serve the one-way
northbound movement.
4.3 Access Connections to Public Roads
Proposed interchange connections are to public highways and roads. Modifications and
additions to the Port of Tacoma Road interchange with I-5 will provide connections to Port of
Tacoma Road and 34th Avenue East, eventually providing access to Pacific Highway East,
SR 509, 12th Street East, 20th Street East, and many local businesses.
The Proposed Alternative provides a new access point to the extension of 34th Avenue East
(northbound arterial) that will connect I-5 with Pacific Highway East. This arterial will now
serve as the main entrance to the Port and access to surrounding businesses.
4.4 Design Standards
The design of the proposed access revision follows the procedures outlined in the WSDOT DM,
and has been developed to meet or exceed current full design levels. Interchange and ramp
spacing is consistent with design standards, based on DM Chapter 1360, Exhibits 1360-2
(Interchange Spacing) and 1360-3 (Minimum Ramp Connection Spacing). Table 4-1 describes
milepost locations and relative spacing between the Proposed Alternative and the most
immediate interchanges and ramps.

Final Intersection Justification Report BergerABAM, SAPWT-09-139
Port of Tacoma Road Intersection with Interstate 5 February 2012
City of Fife, Washington Page 4-2
Table 4-1. Interchange Spacing Proposed Alternative POT Road Interchange with I-5
Milepost (MP)1 SRMP (ARM)
Interchange Spacing 2 (miles) Ramp Spacing 2, 5 (miles)
SR 167 Interchange with I-5 135.03 (135.07) 1.08 3 0.51 (+/-2718 ft)
SR 99 Interchange with I-5 137.45 (137.51) 1.27 4 0.90 (+/-4752 ft)
1 - WSDOT – State Highway Log, Planning Report 2009, Olympic Region
2 - All length measurements are calculated using the accumulated route MP (ARM) value
3 - Distance measured from SR 167 underpass to POT Road overpass (MP 136.09 - ARM 136.15)
4 - Distance measured from proposed 34th Ave E (MP 136.18 - ARM 136.24) to SR 99 overpass
5 - Shortest length measured between on-/off-ramps along either northbound or southbound I-5
The following design assumptions were made to establish the interchange geometry.
• I-5 (mainline) design speed of 70 mph, based on posted speed of 60 mph and DM Chapter
1140, Figure 1140-1 for Freeways
• Freeway ramp design speed between 25 and 60 mph, based on DM Chapter 1360,
Figure 1360-4, for 70 mph mainline design speed
• Maximum ramp and arterial grades are less than or equal to 7 percent for 25 to 30 mph
ramp design speed and less than or equal to 6 percent for 35 to 40 mph ramp design speed
based on DM Chapter 1360, Figure 1360-5
• Mainline lane widths are 12 feet with 10-foot right shoulder and 10-foot left shoulder, based
on DM Chapter 1140, Exhibit 1140-5 for interstate with six lanes or more
• Ramp width for one-lane ramps of 15-foot traveled way with 8-foot right shoulder and
4-foot left shoulder, and for two-lane ramps of 25-foot traveled way with 8-foot right
shoulder and 4-foot left shoulder. For any additional lanes, 12-foot traveled way width.
DM Chapter 1360, Exhibit 1360-6
Table 4-2 shows the number of lanes and traffic movements for the Proposed Alternative.
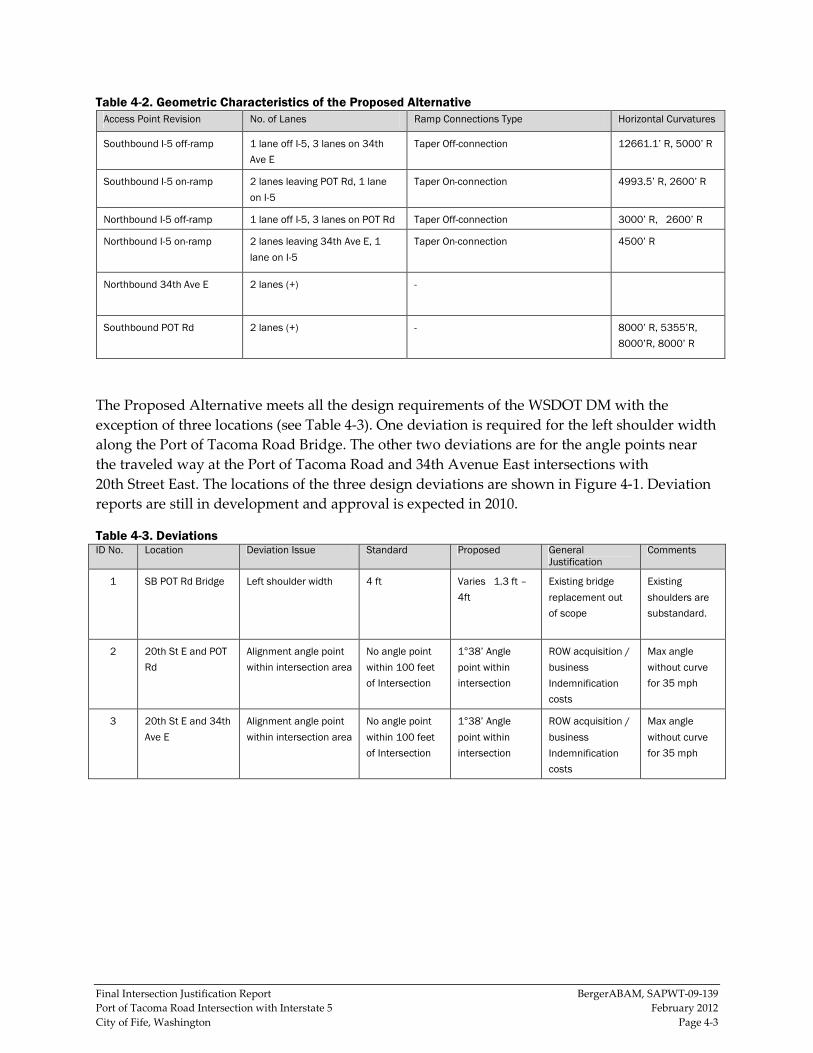
Final Intersection Justification Report BergerABAM, SAPWT-09-139
Port of Tacoma Road Intersection with Interstate 5 February 2012
City of Fife, Washington Page 4-3
Table 4-2. Geometric Characteristics of the Proposed Alternative
Access Point Revision No. of Lanes Ramp Connections Type Horizontal Curvatures
Southbound I-5 off-ramp 1 lane off I-5, 3 lanes on 34th
Ave E
Taper Off-connection 12661.1’ R, 5000’ R
Southbound I-5 on-ramp 2 lanes leaving POT Rd, 1 lane
on I-5
Taper On-connection 4993.5’ R, 2600’ R
Northbound I-5 off-ramp 1 lane off I-5, 3 lanes on POT Rd Taper Off-connection 3000’ R, 2600’ R
Northbound I-5 on-ramp 2 lanes leaving 34th Ave E, 1
lane on I-5
Taper On-connection 4500’ R
Northbound 34th Ave E 2 lanes (+) -
Southbound POT Rd 2 lanes (+) - 8000’ R, 5355’R,
8000’R, 8000’ R
The Proposed Alternative meets all the design requirements of the WSDOT DM with the
exception of three locations (see Table 4-3). One deviation is required for the left shoulder width
along the Port of Tacoma Road Bridge. The other two deviations are for the angle points near
the traveled way at the Port of Tacoma Road and 34th Avenue East intersections with
20th Street East. The locations of the three design deviations are shown in Figure 4-1. Deviation
reports are still in development and approval is expected in 2010.
Table 4-3. Deviations ID No. Location Deviation Issue Standard Proposed General
Justification Comments
1 SB POT Rd Bridge Left shoulder width 4 ft Varies 1.3 ft –
4ft
Existing bridge
replacement out
of scope
Existing
shoulders are
substandard.
2 20th St E and POT
Rd
Alignment angle point
within intersection area
No angle point
within 100 feet
of Intersection
1°38’ Angle point within
intersection
ROW acquisition /
business
Indemnification
costs
Max angle
without curve
for 35 mph
3 20th St E and 34th
Ave E
Alignment angle point
within intersection area
No angle point
within 100 feet
of Intersection
1°38’ Angle point within
intersection
ROW acquisition /
business
Indemnification
costs
Max angle
without curve
for 35 mph
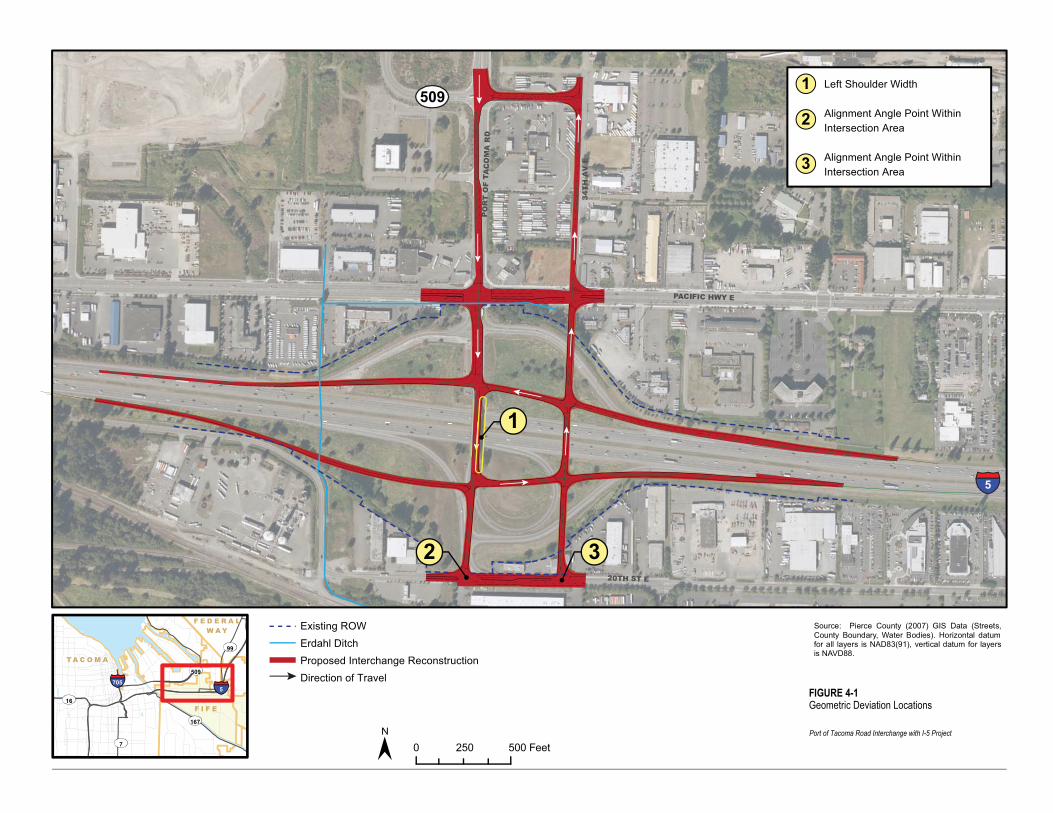
34T
H A
V E
PACIFIC HWY E
PO
RT
OF
T AC
OM
AR
D
20TH ST E
Existing ROWErdahl Ditch Proposed Interchange ReconstructionDirection of Travel
Left Shoulder Width
Alignment Angle Point Within Intersection Area
Alignment Angle Point Within Intersection Area
509
5
2 3
1
1
2
3
15
705
167
99
7
16
509
F I F E
T A C O M A
F E D E R A LW A Y
0 500 Feet250
FIGURE 4-1Geometric Deviation Locations
Port of Tacoma Road Interchange with I-5 Project
Source: Pierce County (2007) GIS Data (Streets,County Boundary, Water Bodies). Horizontal datumfor all layers is NAD83(91), vertical datum for layersis NAVD88.
Final Intersection Justification Report BergerABAM, SAPWT-09-139
Port of Tacoma Road Intersection with Interstate 5 February 2012
City of Fife, Washington Page 4-5
4.5 Ramp Terminals
Ramp terminals associated with the proposed modifications to access points meet current state
and local full design level geometric control criteria. On-connections are consistent with design
standards, based on DM Chapter 1360, Exhibit 1360-13a (Single-Lane, Tapered). Off-connections
are consistent with design standards, based on DM Chapter 1360, Exhibit 1360-14a (Single-Lane,
Tapered).

Final Intersection Justification Report BergerABAM, SAPWT-09-139
Port of Tacoma Road Intersection with Interstate 5 February 2012
City of Fife, Washington Page 5-1
5 POLICY POINT 5: LAND USE AND TRANSPORTATION PLANS
Is the proposed access point revision compatible with all land use and transportation plans for the area?
5.1 Summary
The planning process that led to the Proposed Alternative for the Port of Tacoma Road
Interchange with I-5 project considered land use and transportation plans and policies for the
area. The proposed access point revision is compatible with the adopted plans. Plans considered
include the following.
• Statewide: WTP and HSP
• Regional: PSRC Transportation Plan, Pierce County Comprehensive Plan, and Sound
Transit’s Sound Move
• Local: City of Tacoma Comprehensive Plan and City of Fife Comprehensive Plan
Detailed information on adopted plans is discussed in Sections 5.2 to 5.5 below. Where the
proposed access point revision is not specifically referenced in a planning document, its
consistency with that plan and the process for the appropriate agency to incorporate the project
into its plan is discussed.
The coordination and consistency of the proposed project with adopted statewide and
metropolitan plans is consistent with the processes prescribed in 23 CFR Part 450 (FHWA
Regulation), as well as the air quality conformity requirements of 40 CFR Parts 51 and 93 (EPA
Regulation).
5.2 Land Use
The City of Fife Comprehensive Plan identifies both current and future land uses for the City.
The land use element of the City’s Comprehensive Plan has been prepared in accordance with
the requirements of the state Growth Management Act (GMA), countywide planning policies
for Pierce County, and other mandates. The primary intent of the land use element is to guide
local decision-making to allow the growth and development of the community.
5.2.1 Current Land Use
The current land uses adjacent to the I-5 corridor are described as commercial and industrial.
The City’s primary business district runs east and west along Pacific Highway East north of I-5.
South of the Port of Tacoma Road interchange and I-5, the area along 20th Street East is also
developed as heavy commercial with some industrial uses.
5.2.2 Future Land Use
Future land uses adjacent to I-5 will continue to be commercial and industrial with some high-
density residential, consisting primarily of apartment buildings located to take advantage of
nearby commercial areas and arterials served by public transit.
5.2.3 Land Use Impacts
No impacts have been identified in the Port of Tacoma Road Interchange with I-5 project that
would affect the goals and objectives of the City’s Comprehensive Plan.

Final Intersection Justification Report BergerABAM, SAPWT-09-139
Port of Tacoma Road Intersection with Interstate 5 February 2012
City of Fife, Washington Page 5-2
5.3 Statewide Transportation Plans
5.3.1 Washington Transportation Plan
The WTP is the statewide, strategic 20-year plan for transportation modes, both state-owned
and of state interest. The current WTP, which covers 2007 to 2026, was adopted in February
2002. The WTP is the WSDOT decision tool that links state and regional transportation plans to
provide strategies for transportation investments. The HSP, described below, is an element of
the WTP that addresses planning and programming of highway projects.
5.3.2 WSDOT State Highway System Plan
The HSP is the state highway element of the WTP. The HSP identifies state highway needs for a
20-year planning horizon and conceptual solutions (including conceptual cost estimates) for
those needs. The HSP contains general information on Washington’s highway programs and
how they are balanced with funding projections. Appendix N (2007 to 2026) of the HSP, in
conjunction with the WTP, identifies the Port of Tacoma Road interchange with I-5 as a truck
bottleneck location (2005).
5.4 Regional Transportation Plans
5.4.1 PSRC Transportation 2040 Plan
Transportation 2040, the transportation plan developed by the PSRC, is a long-range plan for
transportation in the Puget Sound region. The plan sets regional transportation policies, lists
regional transportation needs in the form of programs and projects, describes a financial
strategy to meet those needs, and discusses implementation and monitoring strategies.
Transportation 2040 is an extensive revision to PSRC’s Destination 2030 transportation plan that
addresses new emerging transportation trends and enhances aspects that deal with the safety,
security, and special needs of transportation. The Port of Tacoma Road Interchange with I-5
project is listed in the list of Transportation 2040 State Route Investments.
5.4.2 Pierce County Comprehensive Plan
The transportation element of the Pierce County Comprehensive Plan describes policies and
recommends strategies that will help meet future demands for transportation services and
infrastructure in Pierce County. Additional goals include improving the Port’s accessibility to
the freight market. The Port is among the largest container ports in North America and serves
local, regional, national, and international markets. The Port of Tacoma Road Interchange with
I-5 project is consistent with the Pierce County Comprehensive Plan as the project will improve
mobility in the area, especially the ability of shippers to move freight to and from the Port.
5.4.3 Sound Transit
Sound Transit’s regional transit plan, Sound Move, plans to create a comprehensive, regional
high-capacity travel network that is dependable and helps maintain the region’s economic
strength. The plan’s goal of connecting major economic focal points in the region depends on
the travel corridors that link these locations. I-5 in the north-south direction is an example.
Within the study area, I-5 experiences traffic congestion during AM and PM peak hours and
heavy traffic volumes during midday. Traffic is expected to increase significantly in the area

Final Intersection Justification Report BergerABAM, SAPWT-09-139
Port of Tacoma Road Intersection with Interstate 5 February 2012
City of Fife, Washington Page 5-3
over the next few years, causing the Port of Tacoma Road with I-5 interchange to operate at
unacceptable service levels and worsening congestion on mainline I-5. The proposed access
revision will satisfy the current and future remand for travel in the study area and help relieve
congestion on I-5 consistent with the goal of Sound Move—keeping the region moving in a
dependable and efficient manner.
5.5 Local Transportation Plans
5.5.1 City of Tacoma Comprehensive Plan
The City of Tacoma’s Comprehensive Plan was adopted in 1993 to set goals and policies to
protect the health, welfare, safety, and quality of life of Tacoma's residents over the next
20 years. It was last updated in 2009, continuing the original 1993 plan vision. The plan contains
five primary elements mandated by the state GMA: land use, transportation, housing, capital
facilities, and utilities.
The goal of the plan’s transportation element is to “achieve a multimodal transportation system
that efficiently moves people and goods with optimum safety and speed, maximizes the
conservation of energy, and minimally disrupts the desirable features of the environment.” The
proposed Port of Tacoma Road Interchange with I-5 project will provide additional roadway
capacity and more efficient access for general traffic into the city’s residential and business areas
and improve freight mobility in and out of the Port, thus meeting the goal of the City of
Tacoma’s Comprehensive Plan.
5.5.2 City of Fife Comprehensive Plan
The City of Fife’s Comprehensive Plan was adopted in 1996 to serve as the community’s policy
plan for growth and development over the next 20 years. It was last updated in 2005, continuing
the original 1996 plan vision. The plan contains policies concerning land use, transportation,
housing, utilities, parks and recreation, capital facilities, and economic development.
The transportation element of this plan was updated through a supplemental study in 2002. It
reflects the City’s goal of reducing congestion on local streets, addressing environmental
concerns, and strengthening residential areas. This plan defines expected deficiencies as growth
occurs and provides strategies and means to overcome these issues. The plan indicates that
most of the arterial roads in the proposed project area will be operating at LOS D by 2012.
The City of Fife lies in one of the busiest transportation areas in Washington State. I-5, the
state’s major north-south arterial, travels through the northern portion of the city and the Port,
one of the fastest growing ports in the nation, is situated just north of the interstate. The
presence of I-5, the Port, and multiple railroad lines causes congestion in this area of the city.
The proposed Port of Tacoma Road Interchange with I-5 project is congruent with the City’s
comprehensive plan because the project will improve interchange spacing, give general and
truck traffic more efficient access to the City’s residential and business areas, and improve
freight mobility in and out of the Port.

Final Intersection Justification Report BergerABAM, SAPWT-09-139
Port of Tacoma Road Intersection with Interstate 5 February 2012
City of Fife, Washington Page 6-1
6 POLICY POINT 6: FUTURE INTERCHANGES
Is the proposed access point revision compatible with a comprehensive network plan? Is the proposal
compatible with other known new access points and known revisions to existing points?
6.1 Summary
The revision of the access point of the interchange at I-5 and Port of Tacoma Road is compatible
with the comprehensive transportation network in the region.
The development of the Proposed Alternative considered other access point revisions planned
in the vicinity of the project area. Other than the access point revisions listed below, no
additional proposed revisions are expected for the area.
• SR 167 Extension I-5/SR 167 Interchange
• I-5, SR 161/SR 18 Interchange Improvements
• Tacoma/Pierce County HOV Program
The Port of Tacoma Road with I-5 Interchange project will operate with or without the
construction of these other projects.
6.2 Previous Planning for Revised Port of Tacoma Road Interchange with I-5
In 2003, a design charrette confirmed the need for improvements and identified a preferred
configuration for the Port of Tacoma Road interchange. The 2003 preferred configuration would
have removed the existing southbound off-ramp to Port of Tacoma Road; replaced it with new
southbound on- and off-ramps connecting to 34th Avenue East, with a traffic signal at Pacific
Highway East; and provided access to Port of Tacoma Road via 12th Street East. An additional
southbound off-ramp would have connected to Port of Tacoma Road closer to the bridge
structure with a traffic signal and provided additional north or southbound access to Port of
Tacoma Road. Finally, the existing southbound on-ramp from Port of Tacoma Road would have
been realigned to be closer to the bridge structure to increase the intersection spacing between
the on ramp and Pacific Highway East.
The 2003 preferred configuration was included as Alternative 9 of this study and was described
in Policy Point 2. The alternative was eliminated during the first stage of screening, but several
of its main components – new southbound I-5 exit at 34th Avenue East, reconstruction of 34th
Avenue East, reconstruction of 12th Street East, and a signal at the intersection of 34th Avenue
East and Pacific Highway East – are incorporated in the Preferred Configuration.
6.3 Other Proposed Projects Considered
Within the study area, a number of additional improvements are planned. These improvements
have been considered in the development and evaluation of this interchange revision.

Final Intersection Justification Report BergerABAM, SAPWT-09-139
Port of Tacoma Road Intersection with Interstate 5 February 2012
City of Fife, Washington Page 6-2
6.3.1 SR 167 Extension Program
As mentioned above, the project is currently not fully funded and failure to construct the
proposed SR 167 extension project will lessen the potential effects on the Port of Tacoma Road
interchange area.
The SR 167 extension project is a 6-mile-long, limited access highway ultimately connecting
SR 509 to SR 161 and SR 167 near Puyallup. The Port of Tacoma Road Interchange with I-5
project only included the section of SR 167 from Puyallup to I-5 in 2040. The northern section of
SR 167 from I-5 to SR 509 was assumed to be completed after 2040. The analyzed project
includes new freeway-to-freeway I-5 and new interchanges at Valley Avenue, and SR 161.
Operational analysis for the Port of Tacoma Road Interchange with I-5 project, which assumed
the partial completion of the SR 167 extension project by 2040, produced acceptable results for
I-5 and the Port of Tacoma Road interchange. In the event that the SR 167 extension and I-5/
SR 167 interchange is not constructed, traffic volumes would likely increase the effects on the
Port of Tacoma Road interchange area.
The project is in the final design phase and partial funding has been secured. Until additional
funding is identified, construction dates will remain undetermined.
6.3.2 I-5/SR 161/SR 18 Interchange Improvements
The I-5/SR 161/SR 18 Interchange improvements project (Triangle project) is a regional priority
project designed to reduce congestion, improve safety, and increase freight mobility in the
South King County area. It features the reconstruction of an existing cloverleaf interchange to a
Parclo B with directional ramps for westbound SR 18 to southbound I-5 traffic and for
eastbound SR 18 to northbound I-5 traffic. It also proposes access to SR 161 via two new
southbound I-5 exit ramps to South 356th Street and South 359th Street. While funding for the
entire project has not yet been obtained, funding has been secured for the first phase, which is
scheduled for completion in 2012.
Located adjacent to the Pierce County border, the Triangle project will have a positive effect on
the Proposed Alternative because it will improve circulation on I-5. Operational analysis for the
Port of Tacoma Road Interchange with I-5 project produced acceptable results with the
inclusion of the Triangle project improvements. The Proposed Alternative is compatible with
the Triangle project access points.
6.3.3 Tacoma/Pierce County HOV Program
The state plans to implement HOV lanes along the I-5 corridor in an attempt to increase the
efficiency of its road network. The goal is emphasize the movement of people and goods rather
than automobiles. The Tacoma/Pierce County HOV program includes several projects in the
vicinity of the Port of Tacoma Road Interchange with I-5 project that have been taken into
consideration. The I-5: Port of Tacoma to King County Line - HOV project began construction in
fall 2009 and the lanes are now open to traffic. The I-5: Portland Avenue to Port of Tacoma Road
(northbound and southbound) HOV projects are currently under active design and are fully

Final Intersection Justification Report BergerABAM, SAPWT-09-139
Port of Tacoma Road Intersection with Interstate 5 February 2012
City of Fife, Washington Page 6-3
funded. The new HOV lanes extending from Portland Avenue to the King County line will
assist the Proposed Alternative because the lanes will improve traffic mobility through the area.
The Port of Tacoma Road Interchange with I-5 project is consistent with the Tacoma/ Pierce
HOV program, being accounted for in the operational models for opening year (2020) and
design year (2040).

Final Intersection Justification Report BergerABAM, SAPWT-09-139
Port of Tacoma Road Intersection with Interstate 5 February 2012
City of Fife, Washington Page 7-1
7 POLICY POINT 7: COORDINATION
Are all coordinating projects and actions programmed and funded?
7.1 Summary
As discussed in Policy Point 1, the traffic analysis for the Port of Tacoma Road with I-5
Interchange project showed that the completion of the SR 167 Extension project by year 2040
will be needed to maintain sufficient operation through the I-5 corridor within the study area.
Both projects POT Road with I-5 Interchange and SR 167 Extension are partially funded.
7.2 SR 167 Extension Program
The SR 167 Extension program consists of two projects – the SR 167 Extension Puyallup to SR
509 and the I-5/SR 167 Interchange. These are described below.
7.2.1 SR 167 Extension Puyallup to SR 509
The realignment and expansion of SR 167 from SR 161 to SR 509 has long been identified in the
state system plan. Design and environmental work on the project has been ongoing since the
1980s and includes development of a new system interchange on I-5. A separate interchange
justification report has been developed for this project (WSDOT 2007).
7.2.2 I-5/SR 167 Interchange
The proposed I-5/SR 167 interchange is part of the SR 167 Extension project. The interchange is
located in the vicinity of the existing 70th Avenue undercrossing, near I-5 MP 138.4. The
interchange timeline and funding are the same as those of the SR 167 Extension project.
7.3 Project Funding
Funding for the POT Road with I-5 Interchange project and the SR 167 Extension Program is
described below.
7.3.1 Port of Tacoma Road Interchange with I-5
Funding for the Port of Tacoma Road Interchange with I-5 project currently consists of
$1.7 million from the City of Fife, $16 million from the Washington State Freight Mobility
Strategic Investment Board (FMSIB), and commitments from the Port and WSDOT. The first
phase of the project is funded through design and construction. The 18-month construction of
the first phase is scheduled to begin in 2013
7.3.2 SR 167 Extension Program
Currently, funding for the SR 167 Extension project consists of $126 thousand from the 2003-
2005 Gas Tax, $9 thousand from pre-existing funds, $20 thousand from the City of Fife, $45
thousand from the City of Tacoma, $55 thousand from Pierce County, $365 thousand from the
Port of Tacoma, $8.55 million from SAFETEA-LU, $1.8 million from the Puget Sound Regional
Council, $7.57 million from a Non-Demonstration Grant, and $2.22 million from High Priority
Demonstration. The total amount still unfunded is $2.01 billion

Final Intersection Justification Report BergerABAM, SAPWT-09-139
Port of Tacoma Road Intersection with Interstate 5 February 2012
City of Fife, Washington Page 8-1
8 POLICY POINT 8: ENVIRONMENTAL PROCESSES
What is the status of the proposal’s environmental processes?
8.1 Summary
The Port of Tacoma Road Interchange with I-5 project has been identified as a transportation
priority at the regional and local planning levels. Project and environmental planning over the
past year have resulted in significant progress in determining interchange layout and assessing
environmental effects.
8.2 Planning Requirements
The WTP is the state’s blueprint for implementing transportation projects and programs over
the next 20 years. The WSP is prepared in accordance with Title 23, USC 135, (e)(1). The
following list addresses federal (Title 23, USC 111) requirements.
1. The Port of Tacoma Road Interchange with I-5 project supports economic vitality and
encourages global competitiveness, productivity, and efficiency by improving safety and
traffic circulation for freight and people in the vicinity of the interchange. Traffic
volumes in the project area are expected to increase over the next 20 years as growth
occurs in the Port, trade increases, and overall regional growth continues. The
interchange improvements will help reduce congestion due to increased traffic volumes
in the project area.
2. The Port of Tacoma Road Interchange with I-5 project increases mobility for freight by
reducing congestion on the roadways.
3. The Port of Tacoma Road Interchange with I-5 project preserves and enhances the
existing transportation system by providing a more effective interchange to connect to
the existing roadways.
8.3 Schedule of Environmental and IJR Decision
The physical, cultural, and economic elements of the environment were evaluated in a series of
discipline reports to determine the potential adverse effects of the project. These reports
concluded that the Proposed Alternative will not pose significant deleterious effects to the
human or natural environments. WSDOT has determined that this project is anticipated to be
processed as NEPA DCE and does not require the preparation of an EIS.
Applicable permits will not be determined until an environmental review is substantially
complete and the IJR has been reviewed. The IJR will serve as a companion document to each
environmental document, providing review of the policy points for the entire project. Many
environmental permits and required approvals will be determined when the environmental
review is substantially complete and the IJR has been reviewed by FHWA.
Environmental clearance for the project is expected between 2012 and 2013. An initial finding of
engineering and operational acceptability by FHWA is expected in 2012. IJR approval for the
Port of Tacoma Road Interchange with I-5 project is expected when the environmental
permitting is complete.