final mile aaa final mile ldc703 2015
TRANSCRIPT

Whirlpool – Final Mile Richmond L703Annual Account AssessmentSeptember 2015Prepared by: Christopher Miller

2
LDC’S DRIVERS, MH, AND BRIGHT SKY EMPLOYEE
Nick Schurb, Ron Jackson, Anthony Davis, Royce Cotman, Ernest Astre, Russell Gist
LDC OFFICE STAFF AND DELIVERY PERSONNEL

3
Tameka Scott: Ops. Admin. Assistant IV
LDC PHOTOS

4
Budget Assumptions versus Actual: Assets
Weekly Totals Annual Totals Weekly Average Annual Total Number Percentage
Number of Daycabs 2 No Fill 2 No Fill 0 0.00%
Number of Straight Trucks 3 No Fill 3 No Fill 0 0.00%
Number of Sleepers 0 No Fill 0 No Fill 0 0.00%
Total Trucks 5 No Fill 5 No Fill 0 0.00%
Number of 53' Trailers 0 No Fill 0 No Fill 0 0.00%
Number of 45' Trailers 1 No Fill 1 No Fill 0 0.00%
Number of 28' Trailers (Pup) 2 No Fill 2 No Fill 0 0.00%
Total Trailers 3 No Fill 3 No Fill 0 0.00%
Number of Class A Drivers 2 No Fill 2 No Fill 0 0.00%
Number of Class B / C Drivers 4 No Fill 3 No Fill (1) -25.00%
Total Drivers 6 No Fill 5 No Fill (1) -16.67%
Temp Helpers (Non Driving) 2 No Fill 2 No Fill 0 0.00%
2015 YTD Actual Numbers - 2015 YTD Weekly Variance

5
Budget Assumptions versus Actual: Activity
Weekly Totals Annual Totals Weekly Average Annual Total Number Percentage
Total Miles 4,958 257,835 4,706 244,702 (253) -5.09%
Total Unit Count Less Will Calls 528 27,466 529.5 27,533 1 0.24%
Total Installation SKUs 130 6,742 93.1 4,840 (37) -28.21%
Builder Direct Stops 27 1,378 22 1,128 (5) -18.15%
Builder Direct Stops per Truck 5.3 276 4.3 226 (1) -18.11%
Home Delivery Stops 25 1,290 23 1,193 (2) -7.50%
Home Delivery Stops per Truck 5.0 258 4.6 239 (0) -7.46%
Builder Indirect Stops 9 484 9 481 (0) -0.54%
Builder Indirect Stops per Truck 1.9 97 1.9 96 (0) -0.54%
Retail Stops 40 2,085 40 2,056 (1) -1.40%
Retail Stops per Truck 8.0 417 7.9 411 (0) -1.50%
Total Stops 113 5,897 99 5,143 (15) -12.79%
Total Stops per Truck 22.7 1,179 19.8 1,029 (3) -12.79%
2014 YTD Actual Numbers - 2015 YTD Weekly Variance

6
Budget Assumptions versus Actual: Revenue and Cost
4 Saving over 8% thus far this year on labor in relation to revenue compared to 2014
4 MF site (MGT Cons't) from Feb-July 2014
Weekly Totals Annual Totals Weekly Average Annual Total Number Percentage
Customer Revenue Less Fuel $20,867.19 $1,085,093.88 $18,357.10 $954,569.20 ($2,510.09) -12.03%
Driver Labor Expense $4,703.12 $244,562.24 $4,679.33 $243,325.16 ($23.79) -0.51%
Helper Labor Expense $2,428.96 $126,305.92 $1,623.46 $84,419.92 ($805.50) -33.16%
Total Labor Expense $8,094.79 $420,929.08 $7,147.87 $371,689.24 ($946.92) -11.70%
Miles Per Stop 43.88 43.72 47.54 47.58 4 8.34%
Unit's Per Stop 4.67 4.66 5.35 5.35 1 14.56%
Revenue Per Stop $229.85 $184.01 $244.22 $185.61 $14.37 6.25%
Labor Expense Per Stop $73.91 $71.38 $72.20 $72.27 ($1.71) -2.31%
Total Labor % to Rev 32.16% 38.79% 29.56% 38.94% -2.60% -8.08%
2014 YTD Actual Numbers - 2015 YTD Weekly Variance

7
Co Mingle Customers
4 ABF, CORF, COZZ, KITH, EURO, JOYB – Not budgetted
Weekly Totals Annual Totals Weekly Average Annual Total Number Percentage
Budget / 2015 Totals Actual Numbers YTD Weekly Variance
ABF Stops 0 5 0 5 0 0.00%
ABF Revenue 27 781 27 781 0 0.00%
Cornerstone Stops 33 991 35 1,027 2 7.21%
Cornerstone Revenue 2,313 69,388 3,059 88,711 746 32.26%
Corsicana Stops 0 4 0 4 0 0.00%
Corsicana Revenue 22 631 22 631 0 0.00%
Cozzia Stops 0 7 0 7 0 0.00%
Cozzia Revenue 43 1,233 43 1,233 0 0.00%
Door Components Stops 0 6 0 6 0 0.00%
Door Components Revenue 74 2,143 74 2,143 0 0.00%
Eurotec Stops 0 11 0 11 0 0.00%
Eurotec Revenue 64 1,870 64 1,870 0 0.00%
Joybird Stops 0 14 0 14 0 0.00%
Joybird Revenue 0 9 263 9 0.00%

8
Co Mingle Customers (con’t)
4 TMPR – Not budgetted
Weekly Totals Annual Totals Weekly Average Annual Total Number Percentage
Budget / 2015 Totals Actual Numbers YTD Weekly Variance
Nautilus Stops 1 23 2 44 1 97.90%
Nautilus Revenue 34 1,026 176 5,109 142 415.12%
SHOS Stops 19 563 13 363 (6) -33.30%
SHOS Revenue 2,488 74,645 1,561 45,259 (928) -37.28%
Tacony Stops 1 32 0 14 (1) -54.74%
Tacony Revenue 186 5,585 134 3,899 (52) -27.78%
Tempur Pedic Stops 0 3 0 3 0 0.00%
Tempur Pedic Revenue 53 1,548 53 1,548 0 0.00%

9
CO-MINGLE EXCEPTIONSDATE No Call Attempt Unreceived Unappointed Undelivered Aging Returns Total
5/2/2015 2 2 1 0 0 55/9/2015 11 4 3 0 1 19
5/16/2015 0 5 2 1 3 115/23/2015 1 1 2 1 4 95/30/2015 3 0 1 23 1 286/6/2015 0 0 1 12 5 18
6/13/2015 1 3 5 0 5 146/20/2015 0 0 0 40 6 466/27/2015 0 2 2 30 3 377/4/2015 8 4 3 55 7 77
7/11/2015 9 5 4 25 10 537/18/2015 0 1 2 37 11 517/25/2015 0 2 0 15 6 23
Weekly Avg. 1.9 1.6 1.4 13.3 3.4 21.7
• Out for Military training in May, Undelivered is all SHOS not scanned correctly into warehouse.

10
CVD – VDA Log
4 Over 13 combined shuttles since started practice of utilizing our shuttles in this way. We continue to combine shuttles and have much better communication between us and RDC / Penske.
Customer Savings Amount VDA Type CommentsWhirlpool $350 Utilization L703 & L702 combined ShuttleWhirlpool $350 Utilization L703 & L702 combined ShuttleWhirlpool $350 Utilization L703 & L702 combined ShuttleWhirlpool $350 Utilization L703 & L702 combined ShuttleWhirlpool $350 Utilization L703 & L702 combined ShuttleWhirlpool $350 Utilization L703 & L702 combined ShuttleWhirlpool $350 Utilization L703 & L702 combined ShuttleWhirlpool $350 Utilization L703 & L702 combined ShuttleWhirlpool $350 Utilization L703 & L702 combined ShuttleWhirlpool $350 Utilization L703 & L702 combined ShuttleWhirlpool $350 Utilization L703 & L702 combined ShuttleWhirlpool $350 Utilization L703 & L702 combined ShuttleWhirlpool $350 Utilization L703 & L702 combined ShuttleYTD LDC Total $4,550

11
Controllable Variable Costs versus BudgetBudget % Actual % Actual
of Rev YTD Budget $ YTD of Rev YTD $ YTD
Driver Pay 19.20% $153,972.00 19.50% $140,380.00 0.30% -$13,592.00
Non-driver Pay 7.60% $61,083.00 6.70% $48,704.00 -0.90% -$12,379.00
Total Direct Labor 30.10% $241,159.00 29.70% $214,436.00 -0.40% -$26,723.00
Taxes & Benefits 3.30% $26,105.00 3.50% $25,351.00 0.20% -$754.00
Workers Comp 4.60% $36,545.00 3.10% $22,244.00 -1.50% -$14,301.00
Fuel 10.40% $83,768.00 6.60% $47,290.00 -3.80% -$36,478.00
Maint & Wages (inc tires) 3.20% $25,695.00 2.70% $19,178.00 -0.50% -$6,517.00
Depreciation Expense 4.20% $33,475.00 4.40% $32,072.00 0.20% -$1,403.00
Insurance & Claims 2.20% $17,986.00 1.20% $8,338.00 -1.00% -$9,648.00
Salaries & Wages 9.70% $77,705.00 9.90% $71,085.00 0.20% -$6,620.00
Communication & Utilities 0.50% $4,268.00 0.60% $4,519.00 0.10% $251.00
G&A 5.30% $42,193.00 6.40% $46,407.00 1.10% $4,214.00
Profit Before Overheads 23.80% $201,849.00 26.90% $199,898.00 3.10% -$1,951.00
% Difference Difference

12
Invoice AuditCustomer Contract Rate Actual Rate Comments
ABF - Threshold 85.00$ 85.00$ Sole Fitness ROC DeliveryABF - White Glove 191.00$ 191.00$ Sole Fitness Move Floor - $25Cornerstone - Threshold 86.75$ 86.75$ Ballard Upholstery Activity - $99 ThresholdCornerstone - White Glove 96.75$ 96.75$ Ballard Upholstery Activity - $109 White GloveCorsicana - Threshold 66.50$ 66.50$ Beyond Charges - $2.50/miCorsicana - White Glove 86.50$ 86.50$ Multiple Level Charges - $15/levelCozzia - White Glove 90.81$ 90.81$ Pieces > 1 - $10.20/eachCozzia - Assembly Charge 51.02$ 51.20$ Door Components - Threshold NA NA Beyond Charge - $3.04/pcDoor Components - White Glove 108.90$ 108.90$ Room of Choice Pieces - $5.91Eurotec - Room of Choice 89.00$ 89.00$ Room of Choice Pieces > 1 - $15/pcEurotec - White Glove NA NA Move to Floor - $6.25Joybird - Threshold NA NA Beyond Miles Charge - $2.59/miJoybird - White Glove 95.00$ 95.00$ White Glove Pieces >1 - $15/pcNautilus - Threshold 94.94$ 94.94$ Nautilus - White Glove NA NASHOS - Retail Pickups 79.49$ 79.49$ SHOS - Extra Pieces 10.09$ 10.09$ $10.09/pc after 8pcs.SHOS - ORDC Linehaul Charge 412.00$ 412.00$ Often run by ICSTacony - Threshold NA NA All deliveries are completed as uncrate, assemble, haul trashTacony - White Glove Various Various $1/mile rate for delivery charge? DOE Fuel Surcharge per Stop+rate% = Invoice totalTempur Pedic - Threshold NA NA Not a common customer for usTempur Pedic - White Glove 195.00$ 195.00$ Foundation deliveries to Macy's / SEARSWhirpool - Retail 104.94$ 104.94$ Per Unit - $1.04Whirpool - Builder Indirect 101.44$ 101.44$ Per Unit - $1.04Whirpool - Home Delivery 108.81$ 108.81$ Service charges vary according to productWhirpool - Builder Direct 139.99$ 139.99$ Service charges vary according to productWhirpool - Will Call Pick Ups 3.89$ 3.89$ $3.89/pcWhirpool - Return Pickups 10.62$ 10.62$ $10.62 for processing / PGI'ingWhirpool - Stops Return 104.94$ 104.94$
13
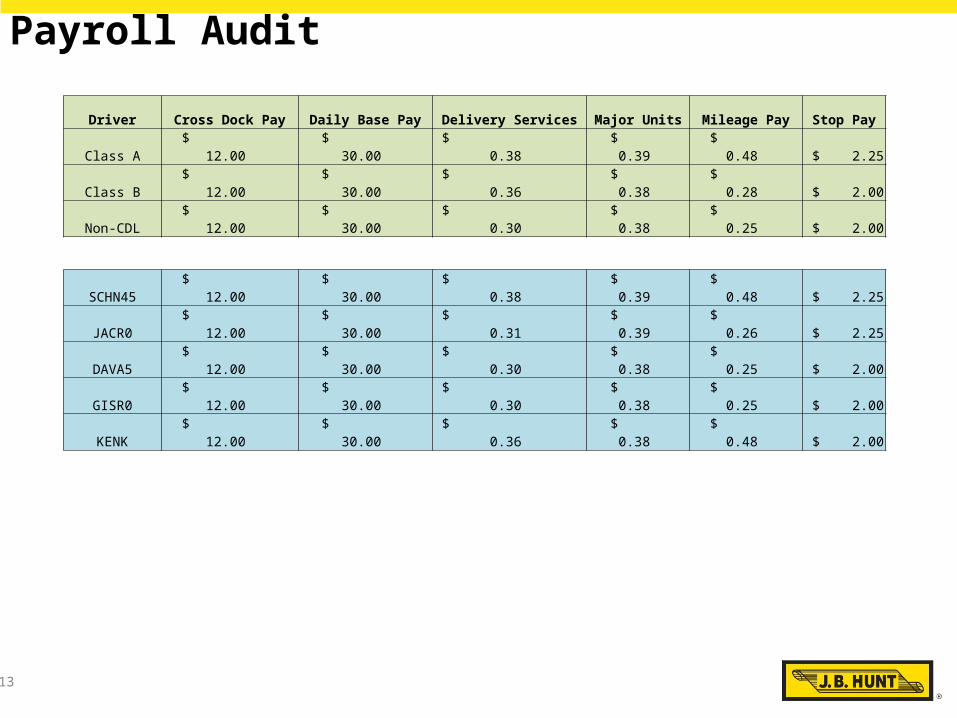
Payroll Audit
Driver Cross Dock Pay Daily Base Pay Delivery Services Major Units Mileage Pay Stop Pay
Class A $ 12.00 $ 30.00 $ 0.38 $ 0.39 $ 0.48 $ 2.25
Class B $ 12.00 $ 30.00 $ 0.36 $ 0.38 $ 0.28 $ 2.00
Non-CDL $ 12.00 $ 30.00 $ 0.30 $ 0.38 $ 0.25 $ 2.00
SCHN45 $ 12.00 $ 30.00 $ 0.38 $ 0.39 $ 0.48 $ 2.25
JACR0 $ 12.00 $ 30.00 $ 0.31 $ 0.39 $ 0.26 $ 2.25
DAVA5 $ 12.00 $ 30.00 $ 0.30 $ 0.38 $ 0.25 $ 2.00
GISR0 $ 12.00 $ 30.00 $ 0.30 $ 0.38 $ 0.25 $ 2.00
KENK $ 12.00 $ 30.00 $ 0.36 $ 0.38 $ 0.48 $ 2.00

14
Payroll Audit
16-Jul 23-Jul 30-Jul 6-Aug 13-Aug 20-Aug Avg. 52 week
SCHN45 $1,178.45 $1,007.93 $713.63 $1,222.07 $1,184.13 $1,208.24 $ 56,458.57
JACR0 $ 804.65 $ 867.27 $789.58 $ 834.30 $ 796.92 $ 768.78 $ 42,133.00
DAVA5 $ 731.47 $ 798.79 $794.15 $ 688.53 $ 617.70 $ 728.81 $ 37,781.90
GISR0 $ 767.74 $ 795.74 $817.40 $ 697.69 $ 639.13 $ 769.50 $ 38,889.07
KENK $ - $ - $ - $ - $ 954.52 $ 917.88 $ 16,227.47

15
Driver / License / Turnover Expectations
4 We plan on adding a 6th driver, more than likely a Non-CDL.
SCHN45 A-CLASS A-CLASSJACR0 B-CLASS NON CDLDAVA5 B-CLASS NON CDLGISR0 B-CLASS NON CDLKENK A-CLASS A-CLASS
CommentsDriver Alpha Hire Date A/B Position License Held
16
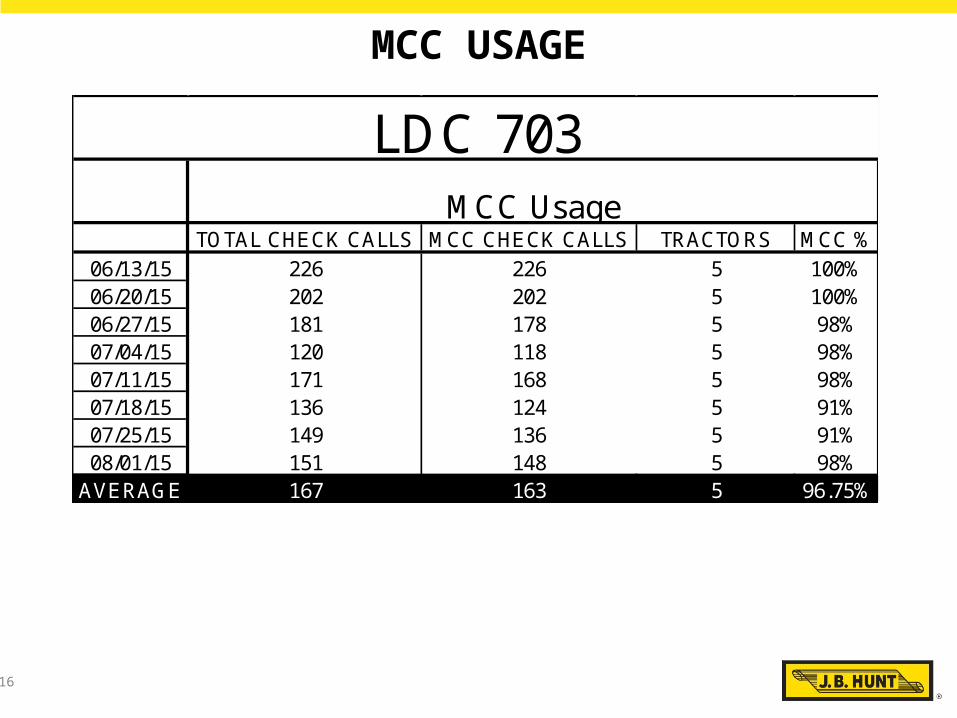
MCC USAGE
TOTAL CHECK CALLS MCC CHECK CALLS TRACTORS MCC %06/13/15 226 226 5 100%06/20/15 202 202 5 100%06/27/15 181 178 5 98%07/04/15 120 118 5 98%07/11/15 171 168 5 98%07/18/15 136 124 5 91%07/25/15 149 136 5 91%08/01/15 151 148 5 98%
AVERAGE 167 163 5 96.75%
LDC 703MCC Usage
17
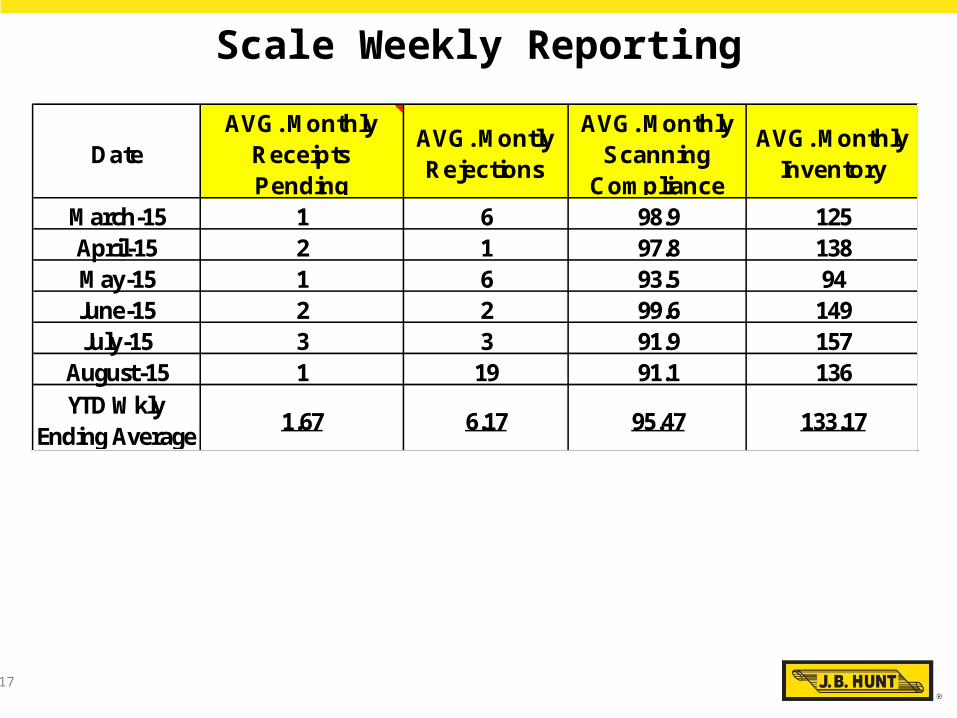
Scale Weekly Reporting
DateAVG. Monthly
Receipts Pending
AVG. Montly Rejections
AVG. Monthly Scanning
Compliance
AVG. Monthly Inventory
March-15 1 6 98.9 125April-15 2 1 97.8 138May-15 1 6 93.5 94June-15 2 2 99.6 149July-15 3 3 91.9 157
August-15 1 19 91.1 136YTD Wkly
Ending Average 1.67 6.17 95.47 133.17

18
Cycle Counting
06/27/15 07/11/15 07/25/1515
25
35
45
55
65
75
85
95
105
Wkly Inventory Counted
Weekly Inventory Counted S AverageFMS Average
LDA
e06/27/15 30.8 # #07/04/15 0.0 # #07/11/15 35.2 # #07/18/15 100.0 # #07/25/15 100.0 # #08/01/15 0.0 # #
FMS Average 79.1S Average 75.9
LDC 703Weekly
Inventory Counted
SE Av
4 Cycle counting has continued to get better this year, and will continue until we’re able to be 100% every week.

19
Productivity – Stops/Driver/Day
05/16/15
05/30/15
06/13/15
06/27/15
07/11/15
07/25/15
5.0
5.5
6.0
6.5
7.0
7.5
8.0
8.5
9.0
9.5
10.0
10.5
11.0
11.5
12.0
Stops/Dispatched Driver/Day
LDC SE Average LDC Average
LDC AverageSE Average05/16/15 # #05/23/15 # #05/30/15 # #06/06/15 # #06/13/15 # #06/20/15 # #06/27/15 # #07/04/15 # #07/11/15 # #07/18/15 # #07/25/15 # #08/01/15 # #
AverageFMS Average 8.3
7.7
8.5
7.67.7
Stops/Dispatched driver/day
LDC
6.8
7.37.66.87.68.88.08.27.5
20
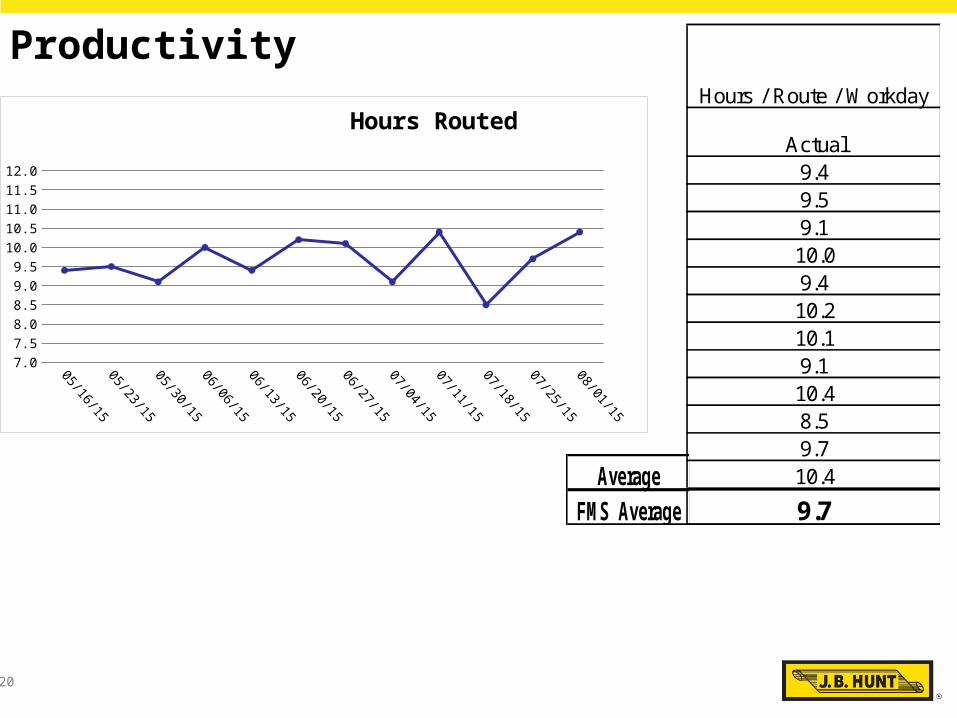
Productivity
05/16/15
05/30/15
06/13/15
06/27/15
07/11/15
07/25/15
7.0
7.5
8.0
8.5
9.0
9.5
10.0
10.5
11.0
11.5
12.0
Hours RoutedHours / Route / Workday
Actual9.49.59.110.09.410.210.19.110.48.59.710.4
9.7Average
FMS Average
21
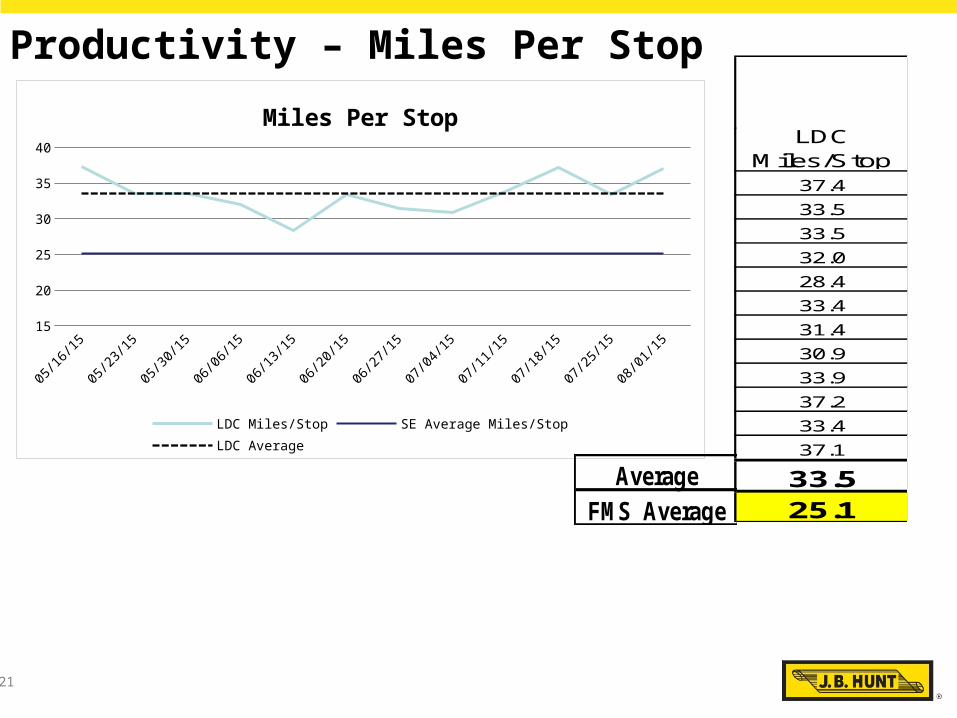
Productivity – Miles Per Stop
05/16/15 05/30/15 06/13/15 06/27/15 07/11/15 07/25/1515
20
25
30
35
40
Miles Per Stop
LDC Miles/Stop SE Average Miles/Stop LDC Average
37.433.533.532.028.433.431.430.933.937.233.437.1
33.525.1
LDC Miles/Stop
AverageFMS Average
22
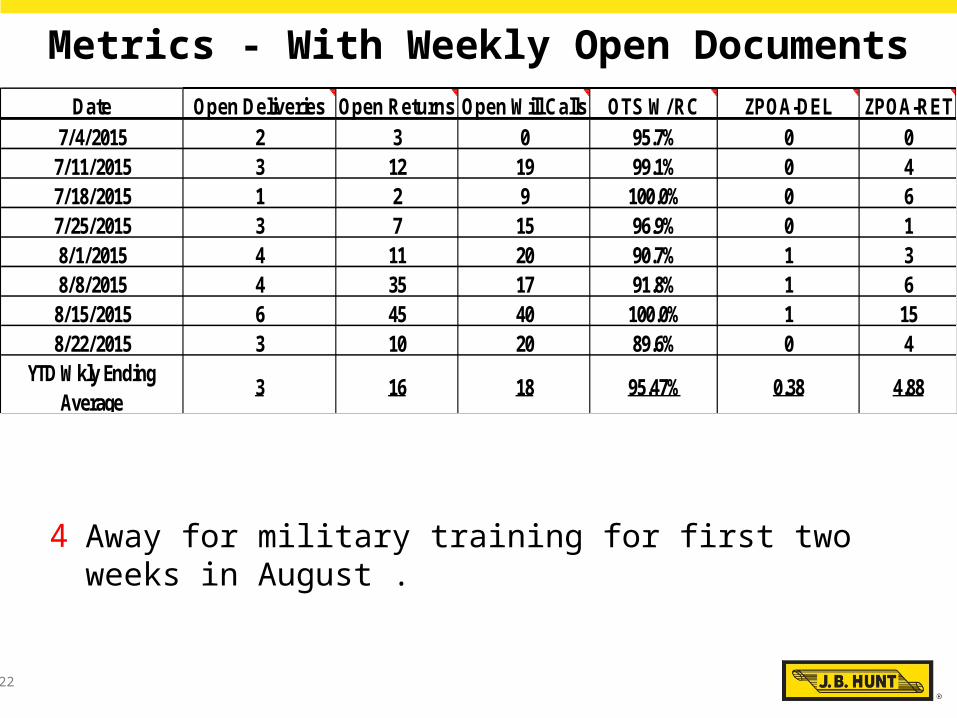
Metrics - With Weekly Open Documents
4 Away for military training for first two weeks in August .
Date Open Deliveries Open Returns Open Will Calls OTS W/ RC ZPOA-DEL ZPOA-RET7/4/2015 2 3 0 95.7% 0 0
7/11/2015 3 12 19 99.1% 0 47/18/2015 1 2 9 100.0% 0 67/25/2015 3 7 15 96.9% 0 18/1/2015 4 11 20 90.7% 1 38/8/2015 4 35 17 91.8% 1 6
8/15/2015 6 45 40 100.0% 1 158/22/2015 3 10 20 89.6% 0 4
YTD Wkly Ending Average
3 16 18 95.47% 0.38 4.88

23
LDC Home Delivery Performance
4 Surveys above Network Average
4 2 drivers with perfect scores, KENK & DAVA5
Care Given Appearance Same Person
Courtesy Overall Average
8.008.208.408.608.809.009.209.409.609.80
10.00
9.69 9.56 9.72 9.68 9.66
Rolling 12 Month Performance
Enti...
Care Given Appearance Same Person
Courtesy Overall Average
8.008.208.408.608.809.009.209.409.609.80
10.00
9.72 9.54 9.73 9.68 9.66
Year-to-Date
En-tir...
24
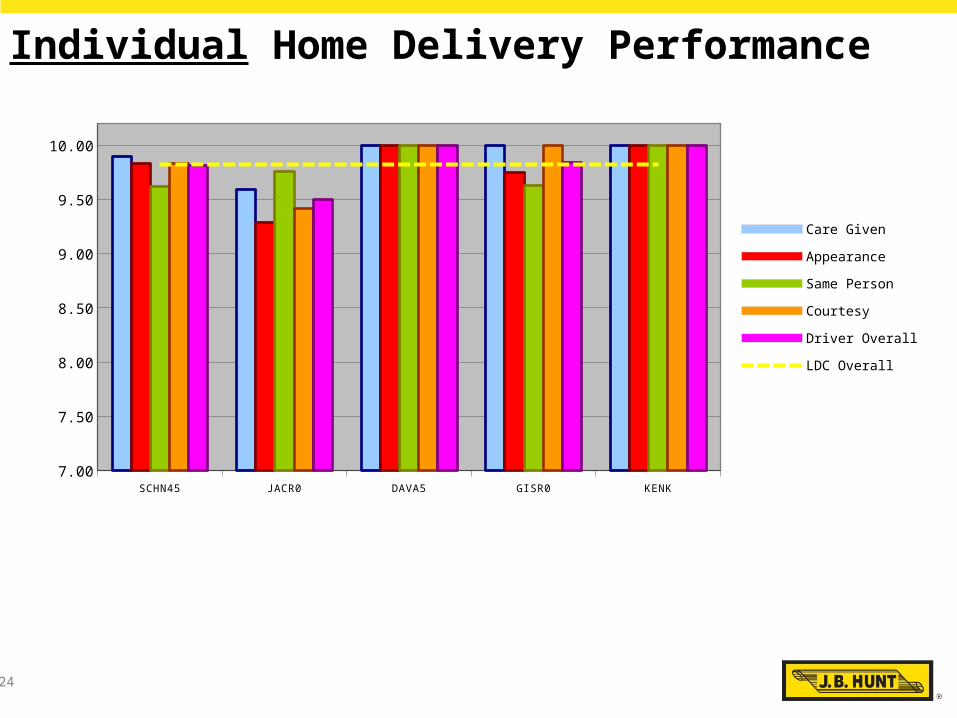
Individual Home Delivery Performance
SCHN45 JACR0 DAVA5 GISR0 KENK7.00
7.50
8.00
8.50
9.00
9.50
10.00
Care Given
Appearance
Same Person
Courtesy
Driver Overall
LDC Overall

25
Turnover
4 4 terminations from July 2014 - Aug 20154 2 A-class driver quite, citing age and difficulty of work.4 2 B-class/Non-CDL sought other jobs. (BELD62 & SIMS41)
Class A Class B/C Installer / Material Handler Labor Ready Total0.00%
10.00%
20.00%
30.00%
40.00%
50.00%
60.00%
70.00%
80.00%
90.00%
100.00%
66.67% 66.67%
0.00% 0.00%
57.14%
Annualized Turnover
26
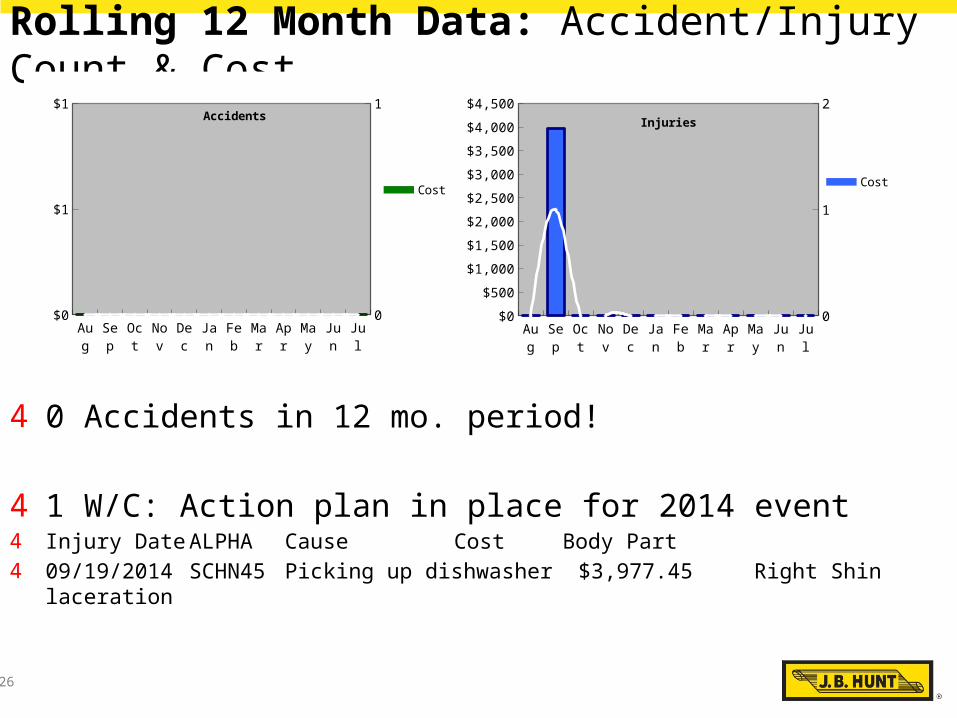
Rolling 12 Month Data: Accident/Injury Count & Cost
4 0 Accidents in 12 mo. period!
4 1 W/C: Action plan in place for 2014 event4 Injury DateALPHA Cause Cost Body Part4 09/19/2014 SCHN45 Picking up dishwasher $3,977.45 Right Shin laceration
Aug Sep Oct Nov Dec Jan Feb Mar Apr May Jun Jul$0
$1
$1
0
1Accidents
CostFre-quency
Aug Sep Oct Nov Dec Jan Feb Mar Apr May Jun Jul$0
$500
$1,000
$1,500
$2,000
$2,500
$3,000
$3,500
$4,000
$4,500
0
1
2Injuries
CostFre-quency

27
Rolling 12 Month Data: Property Damage (non-moving)
4 Event ID Date OPR_CD Driver Name Cost Event ID Date OPR_CD Driver Name Co4 I1438568 8/8/2014 JACR0 Jackson, Ronald $04 I1426532 8/27/2014 JACR0 Jackson, Ronald $432.004 I1430298 9/30/2014 SIMS41 Simmons, Steve $3354 I1507377 3/5/2015 JACR9 Jackson, Ronald $268.24
Aug Sep Oct Nov Dec Jan Feb Mar Apr May Jun Jul$0
$200
$400
$600
$800
$1,000
$1,200
$1,400
$1,600
0
1
2
3
Property Damages
Cost Frequency
28
Inventory Discrepancies
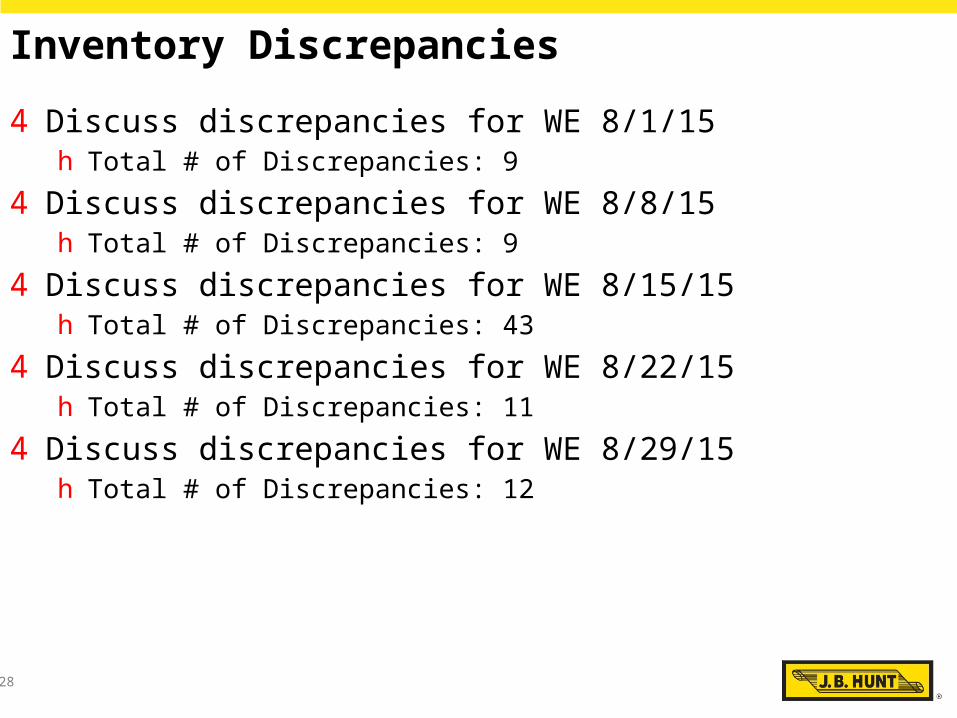
4 Discuss discrepancies for WE 8/1/15h Total # of Discrepancies: 9
4 Discuss discrepancies for WE 8/8/15h Total # of Discrepancies: 9
4 Discuss discrepancies for WE 8/15/15h Total # of Discrepancies: 43
4 Discuss discrepancies for WE 8/22/15h Total # of Discrepancies: 11
4 Discuss discrepancies for WE 8/29/15h Total # of Discrepancies: 12

29
SAP/ZPOA Aging Documents – Current Snapshot
4 Aging Deliveriesh Number: 0h Comments:
4 Aging Will Callsh Number: 16h Comments: High volume, customers are great at picking up on time, and we
dummy load several times/week.4 Aging Returns
h Number: 26h Comments: HDA returns not yet processed. Will have processed and closed out
by Monday/Tuesday
30
Reclassification and Second Channel Sales
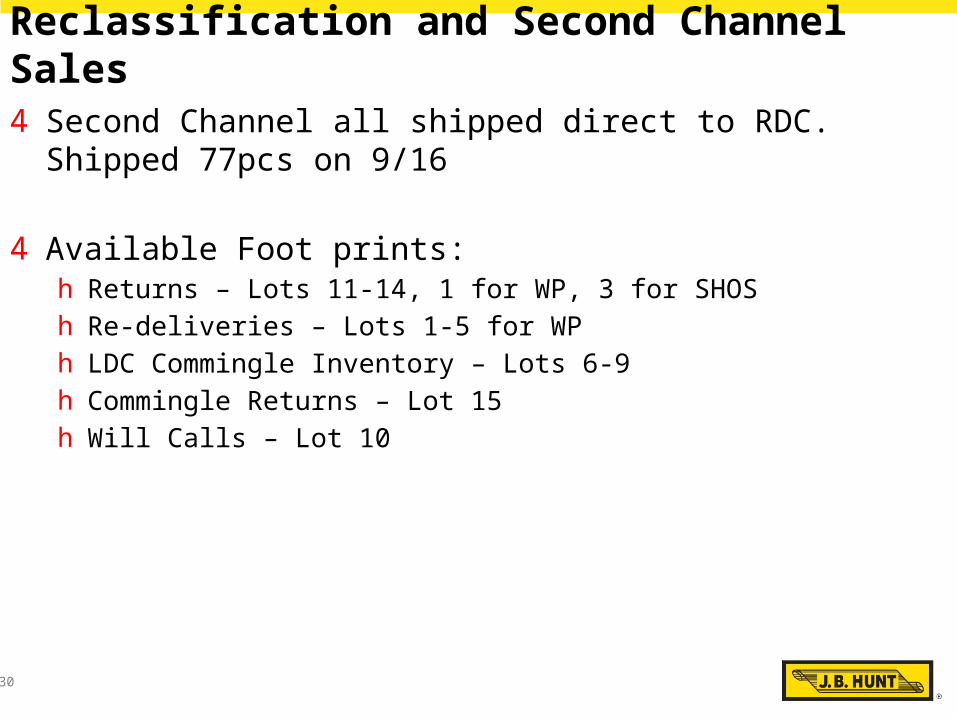
4 Second Channel all shipped direct to RDC. Shipped 77pcs on 9/16
4 Available Foot prints:h Returns – Lots 11-14, 1 for WP, 3 for SHOSh Re-deliveries – Lots 1-5 for WPh LDC Commingle Inventory – Lots 6-9h Commingle Returns – Lot 15h Will Calls – Lot 10

31
Whirlpool 7 Keys Audits4 Q1 Results – 59 / 60, completed 3/18 by Acct. Mgr.
h Comments - Handling according to carton graphics should be observed - loading, staging, foot prints – Not dollying refers with back coils from the sides.
4 Q2 Results – Completed by Amber Whittington on 5/2
h Comments -
4 Q3 Results – Completed by Warren Shrum.
h Comments -

32
Builder Specialist or Account Manager Audit Results
4 Builder Specialisth Number of audits completed: h Pass / Fail: h Failures?
4 Areas of Concernh Recent trend of DIS turn over

33
OSHA Audit
4 Last OSHA Inspection Date: 8/26/20154 Last OSHA Inspection Completed By: Louis Quick4 Findings
4 2 Warehouse lights out4 Broken/Missing Emergency light in office hallway
4 Last OSHA Binder Inspection Date: 8/26/20154 Last OSHA Binder Inspection Completed By: Louis Quick

34
Builder Sites4 2013 Current and Notable Builders
h Pulte Celebrate4 Number of units: Single Family4 Start date: 20124 Projected end date: Unknown4 Significance: Single Family4 AM and/or BS visit frequency: Quarterly
h Drees Town Homes4 Number of units: Towne Homes4 Start date: 20144 Projected end date: Unknown4 Significance: 3rd floor laundries, 2nd floor kitchens4 AM and/or BS visit frequency: Quarterly
h Beezer Single Family4 Number of units: Single Family4 Start date: 20144 Projected end date: Unknown4 Significance: Single Family4 AM and/or BS visit frequency: Quarterly