final presentation_final
TRANSCRIPT

Hop on Top Launching Space Dust in Pursuit of the Uptown
Individual
FAM Initiative Consumer Target States Strategy Risks
Why reinvent the wheel?

Hop on Top Launching Space Dust in Pursuit of the Uptown
Individual

FAM Initiative Consumer Target States Strategy Risks
Replicate Space Dust’s home market success
Leverage unique packaging to a1ract target consumers
Promote the taste to capitalize on the high conversion rate
Communicate Elysian’s strong sense of community
New Markets
IRR: 26% NPV: $1.2 million
FAM Initiative

FAM Initiative Consumer Target States Strategy Risks
Continue success with target consumer
+ 326% Growth YOY
-‐
500
1,000
1,500
2,000
2,500
3,000
3,500
4,000
4,500
Number of US Breweries
US Breweries have grown dramaTcally
Consumer Consumer

FAM Initiative Consumer Target States Strategy Risks
Meet the target Elysian consumer
Consumer
Hi! I’m Jonah
Consumer

FAM Initiative Consumer Target States Strategy Risks Consumer
Meet the target Elysian consumer
Hi! I’m Jonah Hi! I’m Jonah
Consumer

FAM Initiative Consumer Target States Strategy Risks
Space Dust resonates with Seattle consumer
Consumer
98101 98104
61% Uptown Individual
41% Uptown Individual
65% Uptown Individual
68% Uptown Individual
Tangletown Capitol Hill
Elysian Bar
98122 98103
Elysian Fields
Consumer

FAM Initiative Consumer Target States Strategy Risks
Consumer
Uptown Individual drives Space Dust growth
Hi! I’m Jonah
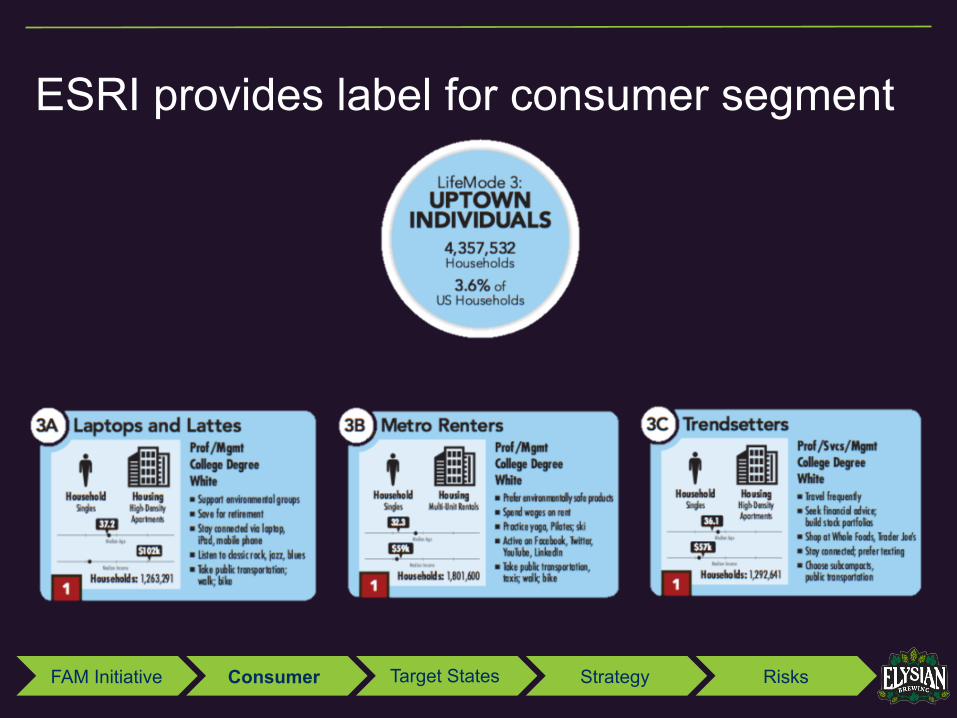
The Uptown Individual
3.6% of US
Households
~12MM In US
PopulaTon
Consumer

FAM Initiative Consumer Target States Strategy Risks
Criteria used to determine expansion
Target States
1. Education 2. Income
3. Apartment dwelling 4. Entertainment 5. City growth
Target States

FAM Initiative Consumer Target States Strategy Risks
Where is the Uptown Individual?
Target States
Current distribution states
1
2 3
4
7
5
6
9
Target States
8 10

FAM Initiative Consumer Target States Strategy Risks
Criteria used to narrow down top 6 states
Target States
Market SaturaTon Elysian distribuTon presence
CraX beer market growth
1 2 3
Target States

FAM Initiative Consumer Target States Strategy Risks
Increase availability to FAM states
Target States
Top 6 ranked states
FAM Initiative
Target States

FAM Initiative Consumer Target States Strategy Risks
Top 5 Cities in FAM
Riverview
Miami
Miami Beach
Doral
Orlando
Lawrence Somerville
Cambridge
Newton
Brookline
Goodyear
Casa Grande
Gilbert Surprise
Tucson
Target States Target States

FAM Initiative Consumer Target States Strategy Risks
Expansion Strategy in FAM States
Vendor Allowances
Redesigned Tap Handle
Tap Takeovers
Barside Chats
1 2 3
Strategy Strategy

FAM Initiative Consumer Target States Strategy Risks
Vendor allowances influence Uptown Individuals at point of sale
• 82% of purchase decisions are made in store
• Appeals to adventurous consumers
Strategy Strategy

FAM Initiative Consumer Target States Strategy Risks
Upgrade tap handle to attract Uptown Individuals in bars
Strategy Strategy

FAM Initiative Consumer Target States Strategy Risks
Tap Takeovers capitalize on conversion rate
Strategy
• Helps build an Elysian community
• Brings visibility to other Elysian brands
• Takes advantage of 60% conversion rate
Strategy

FAM Initiative Consumer Target States Strategy Risks
Reach Uptown Individuals via social media
Strategy Strategy

FAM Initiative Consumer Target States Strategy Risks
Elysian must communicate its unique culture
Strategy Strategy

FAM Initiative Consumer Target States Strategy Risks
Build the Elysian community through Barside Chats
Strategy Strategy
FAM Initiative Consumer Target States Strategy Risks Strategy
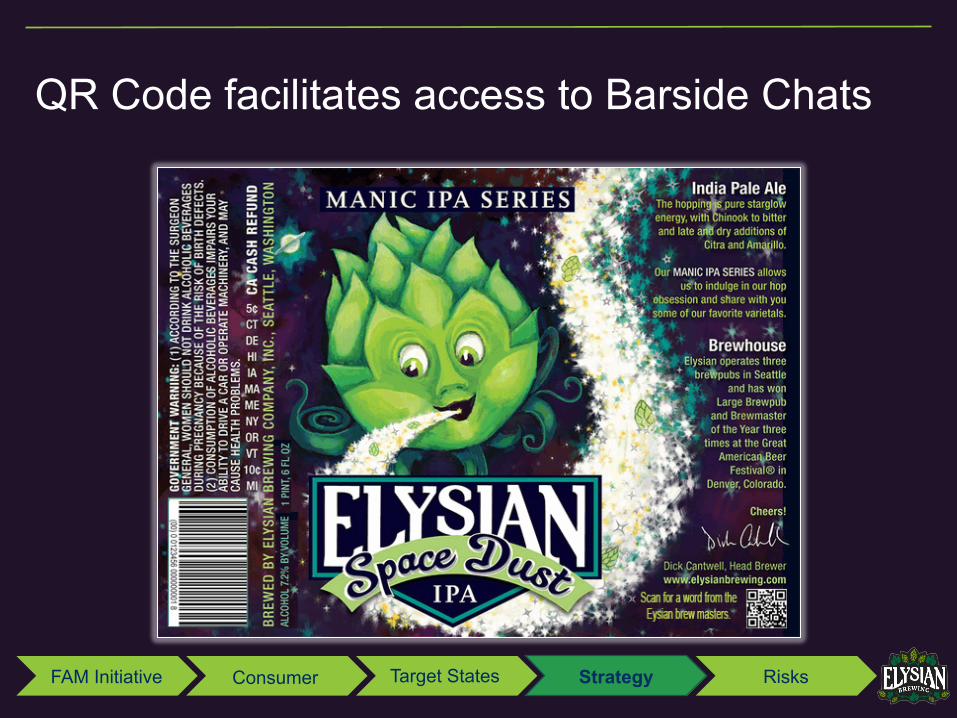
QR Code facilitates access to Barside Chats
Strategy

FAM Initiative Consumer Target States Strategy Risks
New markets present new competition
Risks
Florida Arizona Massachusetts
Risks

FAM Initiative Consumer Target States Strategy Risks
Higher purchase point may alienate other consumers
Risks
• A1racts non-‐uptown individual consumers
• Eliminates iniTal purchase hesitaTon
Risks
FAM Initiative Consumer Target States Strategy Risks
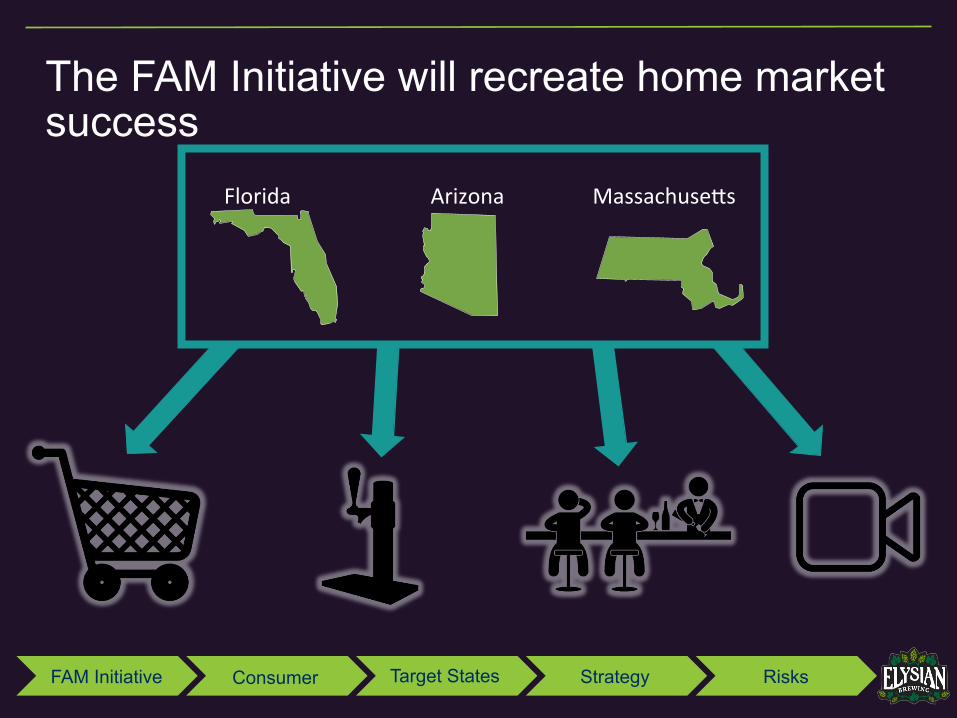
The FAM Initiative will recreate home market success
Florida Arizona Massachuse1s

FAM Initiative Consumer Target States Strategy Risks
Q&A
AusTn CurTs
Maria Reyes-‐Chian
Chad Metzger Sarika Pawar
Pak Hin Luu

FAM Initiative Consumer Target States Strategy Risks
Appendix
• Scoring System Top 30 • Scoring System to arrive at FAM States • Overall FAM Model • Packaging Model Component • Tap Takeover Model Component • Barside Chats Model Component • Uptown Individual Breakdown
FAM Initiative Consumer Target States Strategy Risks

FAM Initiative Consumer Target States Strategy Risks
Initial Scoring System Top 30 States State Total Score Percentile %Uptown
CA 4,465 100% 23.5% TX 2,755 98% 22.4% FL 2,448 96% 21.3% NJ 1,436 94% 20.3% AZ 1,036 92% 19.4% MA 987 90% 18.4% WA 958 88% 17.9% UT 880 86% 16.4% MD 836 84% 15.6% IN 815 82% 15.2% NY 785 80% 14.7% VA 734 78% 13.7% NC 640 76% 12.0% NV 584 73% 10.9% CO 554 71% 10.4% GA 502 69% 9.4% IL 485 67% 9.1%
MN 410 65% 7.7% IA 341 63% 6.4% CT 300 61% 5.6% MI 267 59% 5.0% MO 232 57% 4.3% OR 231 55% 4.3% LA 226 53% 4.2% KS 215 51% 4.0% OK 198 49% 3.7% ID 182 47% 3.5% KY 157 45% 3.4% SC 154 43% 3.2% MS 142 41% 3.1%
States with Elysian Distribution
FAM Initiative States
FAM Initiative Consumer Target States Strategy Risks
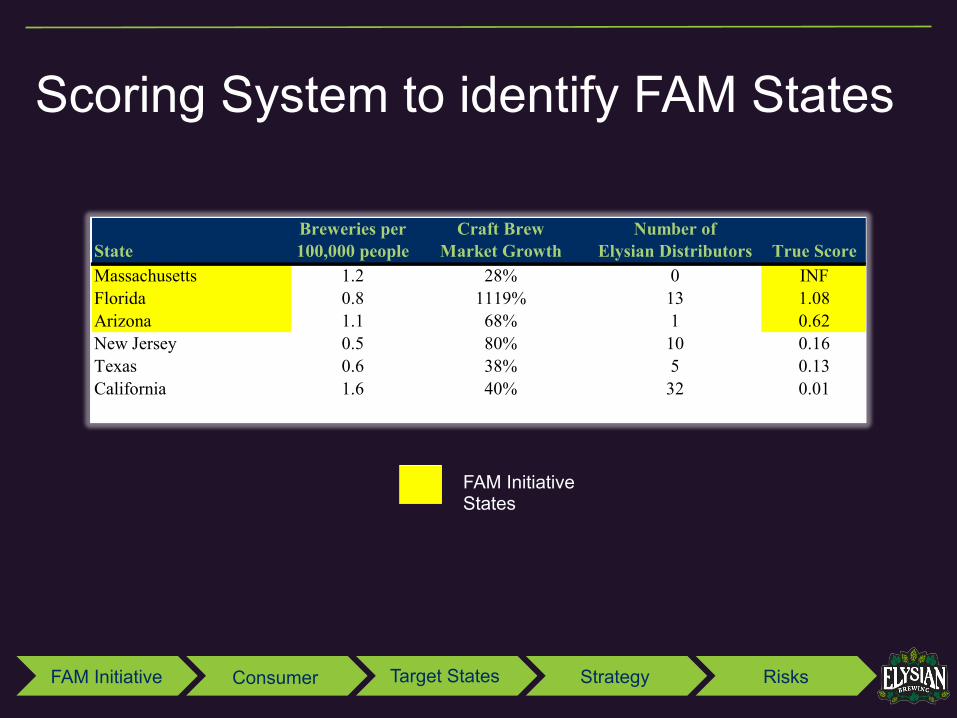
Breweries per Craft Brew Number ofState 100,000 people Market Growth Elysian Distributors True ScoreMassachusetts 1.2 28% 0 INFFlorida 0.8 1119% 13 1.08Arizona 1.1 68% 1 0.62New Jersey 0.5 80% 10 0.16Texas 0.6 38% 5 0.13California 1.6 40% 32 0.01
Scoring System to identify FAM States
FAM Initiative States

FAM Initiative Consumer Target States Strategy Risks
FAM Initiative presents positive returns
Investment in Cross Brewing Initial OutlaysInitial Price $1,500 Year 0Depreciable Life 10 FAM Initiative $1,939Terminal Book Value - Barside Chats 83 Terminal Scrap Value - Year 0 Total Outlay $2,021Terminal Tax Effect 30.00%
Year 1Tap Takeovers $300
Year 1 Total Outlay $300
Year 0 Year 1 Year 2 Year 3 Year 4 Year 5Depreciation Year 0 Year 1 Year 2 Year 3 Year 4 Year 5Cross Brewing Depreciation $150 $150 $150 $150 $150Total Depreciation $150 $150 $150 $150 $150
Incremental Cash Flows Year 1 Year 2 Year 3 Year 4 Year 5
RevenuesExpansion to New Markets $3,664 $3,847 $4,039 $4,241 $4,453Barside Chats 294 309 324 340 357Tap Takeover - 1,973 1,993 2,013 2,033
Total Revenue $3,958 $6,129 $6,356 $6,594 $6,843
Operating ExpensesExpansion to New Markets ($2,606) ($2,737) ($2,874) ($3,017) ($3,168)Barside Chats (176) (185) (194) (204) (214)Tap Takeover - (1,784) (1,796) (1,808) (1,820)
Total Operating Expenses ($2,783) ($4,706) ($4,864) ($5,029) ($5,202)
EBITDA $1,175 $1,423 $1,492 $1,565 $1,641Less: Depreciation (150) (150) (150) (150) (150)EBIT $1,025 $1,273 $1,342 $1,415 $1,491Less: Taxes (359) (445) (470) (495) (522)After-Tax EBIT $666 $827 $873 $920 $969Add: Depreciation 150 150 150 150 150Less: Capital Expenditures (105) (105) (105) (105) (105)Operating Cash Flow $711 $872 $918 $965 $1,014
Initial Outlay ($2,021) (300) - - - -
Terminal Value
Free Cash Flow ($2,021) $411 $872 $918 $965 $1,014
PV of FCF $380 $746 $725 $705 $685
Discount Rate 8.15%
NPV $1,220IRR 26.3%

FAM Initiative Consumer Target States Strategy Risks
FAM Initiative Initial Outlay Investment in Cross Brewing Initial OutlaysInitial Price $1,500 Year 0Depreciable Life 10 FAM Initiative $1,939Terminal Book Value - Barside Chats 83 Terminal Scrap Value - Year 0 Total Outlay $2,021Terminal Tax Effect 30.00%
Year 1Tap Takeovers $300
Year 1 Total Outlay $300
Year 0 Year 1 Year 2 Year 3 Year 4 Year 5Depreciation Year 0 Year 1 Year 2 Year 3 Year 4 Year 5Cross Brewing Depreciation $150 $150 $150 $150 $150Total Depreciation $150 $150 $150 $150 $150
Incremental Cash Flows Year 1 Year 2 Year 3 Year 4 Year 5
RevenuesExpansion to New Markets $3,664 $3,847 $4,039 $4,241 $4,453Barside Chats 294 309 324 340 357Tap Takeover - 1,973 1,993 2,013 2,033
Total Revenue $3,958 $6,129 $6,356 $6,594 $6,843
Operating ExpensesExpansion to New Markets ($2,606) ($2,737) ($2,874) ($3,017) ($3,168)Barside Chats (176) (185) (194) (204) (214)Tap Takeover - (1,784) (1,796) (1,808) (1,820)
Total Operating Expenses ($2,783) ($4,706) ($4,864) ($5,029) ($5,202)
EBITDA $1,175 $1,423 $1,492 $1,565 $1,641Less: Depreciation (150) (150) (150) (150) (150)EBIT $1,025 $1,273 $1,342 $1,415 $1,491Less: Taxes (359) (445) (470) (495) (522)After-Tax EBIT $666 $827 $873 $920 $969Add: Depreciation 150 150 150 150 150Less: Capital Expenditures (105) (105) (105) (105) (105)Operating Cash Flow $711 $872 $918 $965 $1,014
Initial Outlay ($2,021) (300) - - - -
Terminal Value
Free Cash Flow ($2,021) $411 $872 $918 $965 $1,014
PV of FCF $380 $746 $725 $705 $685
Discount Rate 8.15%
NPV $1,220IRR 26.3%
Investment in Cross Brewing Initial OutlaysInitial Price $1,500 Year 0Depreciable Life 10 FAM Initiative $1,939Terminal Book Value - Barside Chats 83 Terminal Scrap Value - Year 0 Total Outlay $2,021Terminal Tax Effect 30.00%
Year 1Tap Takeovers $300
Year 1 Total Outlay $300
Year 0 Year 1 Year 2 Year 3 Year 4 Year 5Depreciation Year 0 Year 1 Year 2 Year 3 Year 4 Year 5Cross Brewing Depreciation $150 $150 $150 $150 $150Total Depreciation $150 $150 $150 $150 $150
Incremental Cash Flows Year 1 Year 2 Year 3 Year 4 Year 5
RevenuesExpansion to New Markets $3,664 $3,847 $4,039 $4,241 $4,453Barside Chats 294 309 324 340 357Tap Takeover - 1,973 1,993 2,013 2,033
Total Revenue $3,958 $6,129 $6,356 $6,594 $6,843
Operating ExpensesExpansion to New Markets ($2,606) ($2,737) ($2,874) ($3,017) ($3,168)Barside Chats (176) (185) (194) (204) (214)Tap Takeover - (1,784) (1,796) (1,808) (1,820)
Total Operating Expenses ($2,783) ($4,706) ($4,864) ($5,029) ($5,202)
EBITDA $1,175 $1,423 $1,492 $1,565 $1,641Less: Depreciation (150) (150) (150) (150) (150)EBIT $1,025 $1,273 $1,342 $1,415 $1,491Less: Taxes (359) (445) (470) (495) (522)After-Tax EBIT $666 $827 $873 $920 $969Add: Depreciation 150 150 150 150 150Less: Capital Expenditures (105) (105) (105) (105) (105)Operating Cash Flow $711 $872 $918 $965 $1,014
Initial Outlay ($2,021) (300) - - - -
Terminal Value
Free Cash Flow ($2,021) $411 $872 $918 $965 $1,014
PV of FCF $380 $746 $725 $705 $685
Discount Rate 8.15%
NPV $1,220IRR 26.3%
FAM Initiative Consumer Target States Strategy Risks
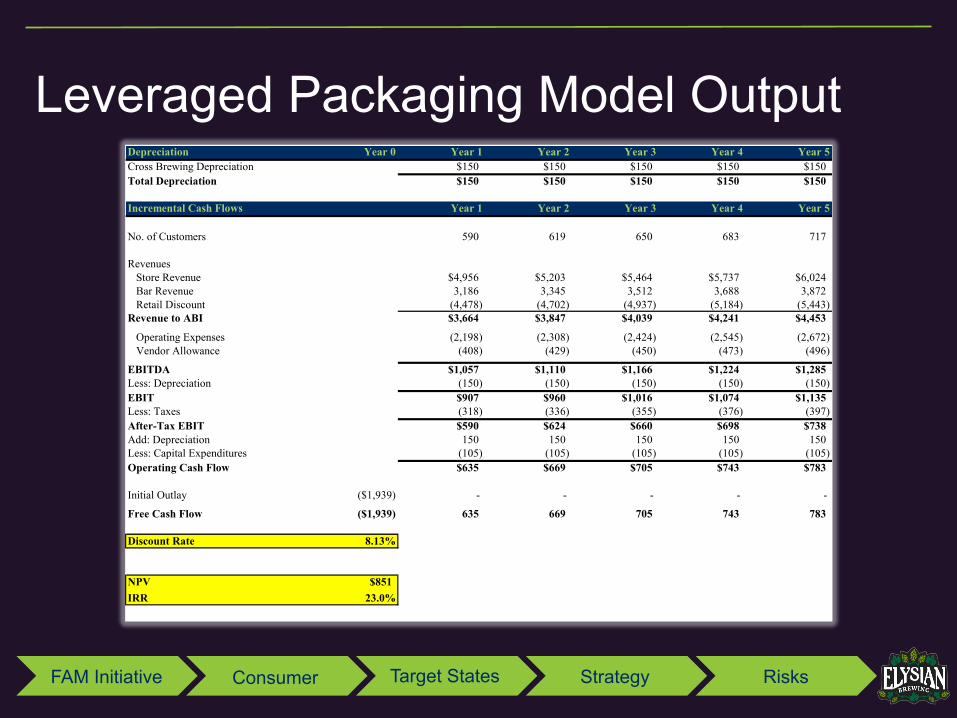
Leveraged Packaging Model Output Depreciation Year 0 Year 1 Year 2 Year 3 Year 4 Year 5Cross Brewing Depreciation $150 $150 $150 $150 $150Total Depreciation $150 $150 $150 $150 $150
Incremental Cash Flows Year 1 Year 2 Year 3 Year 4 Year 5
No. of Customers 590 619 650 683 717
RevenuesStore Revenue $4,956 $5,203 $5,464 $5,737 $6,024Bar Revenue 3,186 3,345 3,512 3,688 3,872Retail Discount (4,478) (4,702) (4,937) (5,184) (5,443)
Revenue to ABI $3,664 $3,847 $4,039 $4,241 $4,453
Operating Expenses (2,198) (2,308) (2,424) (2,545) (2,672)Vendor Allowance (408) (429) (450) (473) (496)
EBITDA $1,057 $1,110 $1,166 $1,224 $1,285Less: Depreciation (150) (150) (150) (150) (150)EBIT $907 $960 $1,016 $1,074 $1,135Less: Taxes (318) (336) (355) (376) (397)After-Tax EBIT $590 $624 $660 $698 $738Add: Depreciation 150 150 150 150 150Less: Capital Expenditures (105) (105) (105) (105) (105)Operating Cash Flow $635 $669 $705 $743 $783
Initial Outlay ($1,939) - - - - -
Free Cash Flow ($1,939) 635 669 705 743 783
Discount Rate 8.13%
NPV $851IRR 23.0%

FAM Initiative Consumer Target States Strategy Risks
Leveraged Packaging Model Assumptions
Investment in Cross BrewingInitial Price $1,500Depreciable Life 10 Terminal Book Value - Terminal Scrap Value - Terminal Tax Effect 30.00%
Operating Assumptions: FAM InitiativeAnnualized Growth Assumption (%) 5%Retail Discount (% of Sales) 55%Operating Expenses (% of Sales) 60%Vendor Allowance Growth Assumption (%) 5%Average Tax Rate 35%Capital Expenditures (% of Depreciation) 70%
In-Store Purchase Assumptions (on an Average basis)Beer Purchases in Grocery Store (%) 60%Grocery Store Purchases per Year 10Units Purchased per Visit 1Purchase Price $14Yearly Purchases of Space Dust (%) 10%
Bar Purchase Assumptions (on an Average basis)Beer Purchases in Bar (%) 40%Bar Trips per Year 15Units Purchased per Visit 2Purchase Price $4.5Yearly Purchases of Space Dust (%) 10%
Initial OutlayCross Brewing Production Expansion $1,500Manufacturing New Tap Handles 50Year 1 Vendor Allowance 389Total Outlay $1,939

FAM Initiative Consumer Target States Strategy Risks
Tap Takeover Model Output Incremental Cash Flows Year 0 Year 1 Year 2 Year 3 Year 4 Year 5
Number of Converted Customers 1,008 1,018 1,028 1,039 1,049Consumer Growth - 1.0% 1.0% 1.0% 1.0%
RevenuesStore Revenue $2,752 $2,779 $2,807 $2,835 $2,864Bar Revenue 1,633 1,649 1,666 1,682 1,699Retail Discount (2,412) (2,436) (2,460) (2,485) (2,510)
Revenue to ABI $1,973 $1,993 $2,013 $2,033 $2,053Operating Expenses-Regular (1,184) (1,196) (1,208) (1,220) (1,232)Operating Expenses-Tap Takeover (600) (600) (600) (600) (600)EBITDA $189 $197 $205 $213 $221Depreciation - - - - - EBIT $189 $197 $205 $213 $221Less: Taxes (66) (69) (72) (75) (77)After-Tax EBIT $123 $128 $133 $139 $144Add: Depreciation - - - - - Less: Capital Expenditures - - - - - Operating Cash Flow $123 $128 $133 $139 $144
Initial Outlay ($300) - - - - -
Free Cash Flow ($300) $123 $128 $133 $139 $144
Discount Rate 8.13%
NPV $227.56IRR 33.1%

FAM Initiative Consumer Target States Strategy Risks
Tap Takeover Model Assumptions Initial OutlayMarketing Materials $300
Total Outlay $300
Operating Assumptions: Tap TakeoverAnnualized Growth Assumption (%) 1%Retail Discount (% of Sales) 55%Operating Expenses (% of Sales) 60%Vendor Allowance Growth Assumption (%) 5%Average Tax Rate 35%
In-Store Purchase Assumptions (on an Average basis)Beer Purchases in Grocery Store (%) 60%Grocery Store Purchases per Year 6.5Units Purchased per Visit 1Purchase Price $14Yearly Purchases of Space Dust (%) 5%
Bar Purchase Assumptions (on an Average basis)Beer Purchases in Bar (%) 40%Bar Trips per Year 9Units Purchased per Visit 2Purchase Price $4.5Yearly Purchases of Space Dust (%) 5%
Tap Takeover Event AssumptionsNumber of events per year 6Number of Customers per event 280Conversion of Attending Customers 60%Cost per Event $100

FAM Initiative Consumer Target States Strategy Risks
Barside Chats Model Output Incremental Cash Flows Year 0 Year 1 Year 2 Year 3 Year 4 Year 5No. of Customers 590 619 650 683 717No. of Customers to watch Barside Chats 177 186 195 205 215No. of Customers to purchase Elysian products 53 56 59 61 65
RevenuesStore Revenue $223 $234 $246 $258 $271Bar Revenue 430 452 474 498 523Retail Discount (359) (377) (396) (416) (437)
Revenue to ABI $294 $309 $324 $340 $357
Operating Expenses (176) (185) (194) (204) (214)Video Expense (83) (83) (83) (83) (83)EBITDA $35 $41 $47 $53 $60Less: Depreciation - - - - - EBIT 35 41 47 53 60Less: Taxes (12) (14) (16) (19) (21)After-Tax EBIT $23 $27 $31 $35 $39Add: Depreciation - - - - - Less: Capital Expenditures - - - - - Operating Cash Flow $23 $27 $31 $35 $39
Initial Outlay ($83) - - - - -
Free Cash Flow ($83) $23 $27 $31 $35 $39
Discount Rate 8.13%
NPV $37IRR 22.4%

FAM Initiative Consumer Target States Strategy Risks
Barside Chats Initial Outlay
Barside Chats Cost BreakdownCost per Hour Amt. of Human Capital Amt. of Hours Total Costs
Corporate Video Production Expertise $250 2 people 10 hours $5,000Concept/Script/Storyboard 150 1 person 2 hours 300 Editing/Graphics 175 2 people 3 hours 1,050 Camera 1000 1 person 1 hour 1,000 Equipment 500 3 people 1 hour 1,500 Crew 125 2 people 10 hours 2,500 Studio Shooting 400 1 person 1 hour 400 Audio Files 50 1 person 2 hours 100 Teleprompter 400 1 person 3 hours 1,200 Digitizing, Transfers, Rendering, and Uploading 75 1 person 3 hours 225 Other Costs 500 1 person 1 hour 500 TOTAL COST PER VIDEO $13,775
Initial OutlayYear 1 Video Costs $83
Total Outlay $83

FAM Initiative Consumer Target States Strategy Risks
Barside Chats Model Assumptions
Operating Assumptions: Barside ChatsAnnualized Growth Assumption (%) 5%Retail Discount (% of Sales) 55%Operating Expenses (% of Sales) 60%Average Tax Rate 35%
In-Store Purchase Assumptions (on an Average basis)Beer Purchases in Grocery Store (%) 60%Grocery Store Purchases per Year 10Units Purchased per Visit 1Purchase Price $14Yearly Purchases of Space Dust (%) 5%
Bar Purchase Assumptions (on an Average basis)Beer Purchases in Bar (%) 40%Bar Trips per Year 15Units Purchased per Visit 2Purchase Price $4.5Yearly Purchases of Space Dust (%) 15%
Video Market Penetration Assumptions% of Customers Watching Barside Chats 30%% of Barside Chats Watchers Purchasing Elysian 30%
FAM Initiative Consumer Target States Strategy Risks
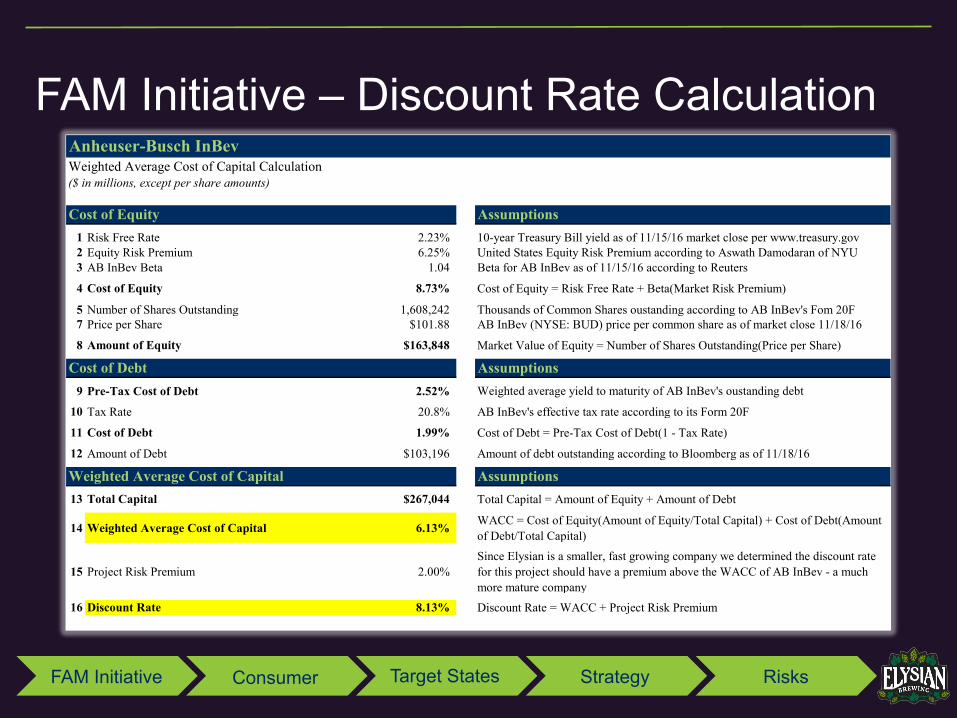
FAM Initiative – Discount Rate Calculation Anheuser-Busch InBevWeighted Average Cost of Capital Calculation($ in millions, except per share amounts)
Cost of Equity Assumptions1 Risk Free Rate 2.23% 10-year Treasury Bill yield as of 11/15/16 market close per www.treasury.gov 2 Equity Risk Premium 6.25% United States Equity Risk Premium according to Aswath Damodaran of NYU3 AB InBev Beta 1.04 Beta for AB InBev as of 11/15/16 according to Reuters
4 Cost of Equity 8.73% Cost of Equity = Risk Free Rate + Beta(Market Risk Premium)
5 Number of Shares Outstanding 1,608,242 Thousands of Common Shares oustanding according to AB InBev's Fom 20F 7 Price per Share $101.88 AB InBev (NYSE: BUD) price per common share as of market close 11/18/16
8 Amount of Equity $163,848 Market Value of Equity = Number of Shares Outstanding(Price per Share)
Cost of Debt Assumptions9 Pre-Tax Cost of Debt 2.52% Weighted average yield to maturity of AB InBev's oustanding debt
10 Tax Rate 20.8% AB InBev's effective tax rate according to its Form 20F
11 Cost of Debt 1.99% Cost of Debt = Pre-Tax Cost of Debt(1 - Tax Rate)
12 Amount of Debt $103,196 Amount of debt outstanding according to Bloomberg as of 11/18/16
Weighted Average Cost of Capital Assumptions13 Total Capital $267,044 Total Capital = Amount of Equity + Amount of Debt
14 Weighted Average Cost of Capital 6.13% WACC = Cost of Equity(Amount of Equity/Total Capital) + Cost of Debt(Amount of Debt/Total Capital)
15 Project Risk Premium 2.00%Since Elysian is a smaller, fast growing company we determined the discount rate for this project should have a premium above the WACC of AB InBev - a much more mature company
16 Discount Rate 8.13% Discount Rate = WACC + Project Risk Premium
FAM Initiative Consumer Target States Strategy Risks
ESRI provides label for consumer segment
Consumer