final publishable summary report - cordis · the tool aims to display the different layers of...
TRANSCRIPT

FINAL PUBLISHABLE SUMMARY REPORT
Grant Agreement number: 285501
Project acronym: GE2O
Project title: Geo-clustering to deploy the potential of Energy efficient Buildings across EU
Funding Scheme: EeB.NMP.2011-4 Coordination and support action
Period covered: from 01/01/2013 to 31/12/2013 Name, title and organisation of the scientific representative of the project's coordinator:
Co-ordinator: Dr. Dominique Caccavelli Head of RES division Dept. Energy and Environment Centre Scientifique et Technique du Bâtiment, CSTB 290 route des Lucioles, 06904 Sophia Antipolis Cedex www.cstb.fr email: [email protected] phone: +33 4 93 95 64 01 fax: +33 4 93 95 64 31
Project website address: http://www.geocluster.eu/

2
Content
1 Executive summary .................................................................................................................................... 3
2 Summary description of project context and objectives .......................................................................... 4
2.1 Concept .................................................................................................................................................... 5
2.2 Objectives ................................................................................................................................................ 6
3 Description of the main S&T results/foregrounds .................................................................................... 8
3.1 WP1: Consortium Management .............................................................................................................. 9
3.2 WP2: Geocluster Elaboration .................................................................................................................. 9
3.2.1 Task 2.1: Detailed analysis of available knowledge and information ............................................... 9
3.2.2 Task 2.2: Structuring Knowledge and Information of geo-referenced data layers ........................ 12
3.2.3 Task 2.3: Development of a correlation methodology across geo-referenced layers ................... 14
3.3 WP3: Geocluster Validation ................................................................................................................... 15
3.3.1 Task 3.1: Engagement of Stakeholders for validation .................................................................... 15
3.3.2 Task 3.2: Application of the methodology and detailed analysis of the pilot cases ...................... 17
3.4 WP4: Knowledge Management and Sharing ......................................................................................... 23
3.4.1 Task 4.1: Development of a knowledge repository ........................................................................ 23
3.4.2 Task 4.2: Development of a Geo-cluster Mapping Tool ................................................................. 23
3.5 WP5: Exploitation and Dissemination ................................................................................................... 25
3.5.1 Task 5.1: Dissemination and consensus building across stakeholders communities ..................... 25
3.5.2 Task 5.2: Exploitation routes for the geo-cluster concept ............................................................. 27
4 Potential impacts ..................................................................................................................................... 29
4.1 Project impacts ...................................................................................................................................... 29
4.2 Dissemination activities ......................................................................................................................... 33
4.3 Exploitation strategy .............................................................................................................................. 34
5 Project logo .............................................................................................................................................. 35
6 List of all beneficiaries with the corresponding contact names .............................................................. 36

3
1 Executive summary Firstly introduced by E2BA in its “Scope and Vision” document, Geo-clusters are virtual trans-national areas where strong similarities are found in terms of climate, culture and behaviour, construction typologies, economy, energy price and policies, gross domestic product…..
This results in similarities concerning the promotion and use of different types of technological solutions or building materials across European regions. Geo-clusters will therefore support the definition of a coherent set of solutions in energy efficiency, tackling both technological and non-technological barriers and maximising the business potentials.
The GE2O project aims to develop a proof-of-concept of a geo-cluster approach by means of a tool: geo-cluster mapping tool. The geo-cluster mapping tool provides, based on similarities across Europe, relevant information about:
- Where and how a product/system/service/programme can be implemented/applied - Which product/system/service can be used in a specific situation - Where are opportunities to develop a new product/system/service/programme
The geo-cluster mapping tool is not based on fixed geographic regions but is to be considered as a dynamic tool combining single or multiple parameters and indicators organised in homogeneous layers and sub-layers.
MAIN OBJECTIVES
• Analysis of existing clusters and initiatives available at European, national and local scale.
• Identification and characterisation of best practices, lessons learnt and potential barriers.
• Identification and characterisation of a first set of layers gathering homogeneous indicators and parameters identified during the analysis.
• Definition of a methodology to correlate the different layers to enable the definition of multidimensional geo-referenced maps.
• Validation of the methodology with two pilot clusters: “Mediterranean Arc” and “Benelux cluster”
ACHIEVEMENTS
• Validation of the concept of a geo-cluster approach by means of a tool. • Establishment of stakeholders communities across the European geo cluster interested
in the continuous grow and exchange of structured information. • Development of an extensive shared Workspace and a knowledge repository to support
networking of the above community. • Development of a comprehensive Web Portal, serving as reference dissemination tool
to all interested stakeholders, with an on-line geo-cluster mapping tool for project partners and members of the established community.

4
2 Summary description of project context and objectives
Experts acknowledge that energy efficiency in the built environment, including a large deployment of Renewable Energy Sources in districts, would require the definition of holistic solutions which are optimised at European (even global) scale but adapted to local and regional conditions and specificities.
This requires research in systemic approaches, flexible and modular solutions which necessarily involve large industrial players in close cooperation with SMEs and research centres, as well as other relevant stakeholders as promoters, investors and users, covering multi-disciplinarily from basic to applied and pre-normative research, demonstration and training. The present lack of such approaches and solutions form a major bottleneck for massive application of novel solutions and the creation of knowledge based jobs.
It is clear that energy efficiency in buildings will play a major role in responding to climate change and energy issues, if we are able to trigger large scale actions involving EU, all Member States and their regional and local authorities. In this framework, the concept of “Geo-clusters” firstly introduced by E2BA is highly relevant, being virtual trans-national areas where strong similarities are found in terms of climate, culture and behaviour, construction typologies, economy, energy price and policies and gross domestic product, to name a few.
This results in similarities concerning the promotion and use of different types of technological solutions or building materials across European regions. Geo-clusters will therefore support the definition of a coherent set of solutions in energy efficiency, tackling both technological and non-technological barriers and maximising the business potentials. The process of geo-clustering would strengthen a common energy-efficiency strategy to be pursued on a Pan-European level with regards to policies, decisions and measures, fully leveraging on similarities and value networks at cluster level.
Once the political and socio-economic drivers, market approaches and value networks, regulations and financial facilities as well as behavioural and cultural aspects are duly characterised and similarities identified, this will allow developing appropriate solutions and approaches according to the specific needs of different EU regions beyond geographical proximity. Indeed several stakeholders would benefit from the availability of Geo-clusters. For instance Public programme Owners could better design their Energy Efficient Buildings support initiatives by benchmarking similarities in other regions. Promoters and investors can take advantage of similar business experiences. On the other side, industry, in particular SMEs, could more easily identify Lead Markets where entrance barriers are lower for their innovative products or services, by identifying those geoclusters which share similarities from the point of view of financial incentives or loan schemes, climatic conditions, etc. Concerning the users, it could contribute to improve technology adoption and acceptance processes. In this framework, it is clear that the geo-cluster map will not be based on fixed geographic regions, but is to be considered as a multi-dimensional and dynamic tool.

5
2.1 Concept
The concept behind the GE2O project is based on the possibility to locate similarities across enlarged EU by combining single or multiple parameters and indicators organised in homogeneous layers and sub-layers such as for instance:
- a Technological layer consisting of building typologies, technologies and technical solutions, to name a few;
- a Context layer consisting of climatic conditions (i.e. temperature, solar radiation, wind speed and direction, rain, humidity, pollution, etc.), types of area (i.e. seaside, mountains, etc.), raw materials availability (including for instance kind of waste streams), etc.
- a Socio-economic layer consisting of macroeconomic indicators (energy price incentives and energy policies, ….), living habits and behavioural aspects (i.e. countryside, cities…), construction business process (i.e. stakeholder roles, procurements rules and typical models), etc.
- a Political-strategic layer consisting of applicable building directives and laws, standards and regulations, energy policies, etc.
This concept is schematically presented in Figure 2.1.
Socio-economic layer
Context layer
Political – strategic layer
………….…..
Technological layer
……Other layers …..
Figure 2.1 - Overall geo-cluster concept
The different layers can be analysed using a single descriptor, to identify for instance geographical areas which share similarities in climatic conditions or financial incentives, or they can be analysed based on several layers and their corresponding descriptors for more complex investigations. For instance we may want to locate those areas which share similarities from the climate point of view but at the same type sharing common financial incentives or standards/regulations. Once these

6
descriptors have been defined across the layers, a simple and open source state of the art engine would allow to dynamically enquiry the knowledge repository where structured information are available in order to identify similarities. A schematic view is provided Figure 2.2.
Figure 2.2 - Schematic view of the operating principles
As an example, a Local Government wishing to design an Energy efficient programme could locate similarities with other EU regions and could access the knowledge repository to acquire basic and public information concerning programmes, lessons learnt, best practices, failures modes. On the other side, a company having developed an innovative product or service could enquiry the geo-cluster knowledge repository to locate areas which share similarities concerning those parameters that they identified as critical for market take-up, for instance climate conditions and building typologies.
2.2 Objectives
The GE2O project aims to develop a proof-of-concept of a geo-cluster approach by means of a tool: GeoCluster Mapping Tool (Ge2O). The main project objectives are:
• Coordination of the existing clusters and initiatives available at European, national and local scale dealing with energy efficiency in the built environment, reachable directly through the partners and indirectly through their wide networks mobilised within this project.
• Identification and characterisation of best practices, lessons learnt and potential barriers as well as tools and services already in use, as emerging from the analysis of the initiatives under coordination.
• Analysis of existing knowledge and information gathered during this coordinated effort in order to identify a set of quali-quantitive parameters and indicators addressing both technological and non-technological aspects.
• Identification and characterisation of a first set of layers gathering homogeneous indicators and parameters identified during the analysis. These layers will represent the basis to compare the main features of geo-clusters and they will be the pillars of the multi-dimensional maps.
• Definition of a methodology to correlate the different layers to enable the definition of multidimensional geo-referenced maps which can vary upon the selection of

7
different sets of layers (dynamic concept of the geo-clusters). The methodology will allow to map the technologies in the geoclusters as well as reference indicators to measure the potential impact per cluster, giving also the possibility for policy makers to compare different initiatives and associated benefits.
• Development of the GeoCluster Mapping Tool (Ge2O) as an Open Source tool based on international standards in the GIS. The tool aims to display the different layers of multi-dimensional maps regarding EE issues in a platform for easy P2P (peer to peer) communication, information sharing and as support to management of data and their geographical reference (SDI).
• Development of the Ge2O Knowledge Repository (Ge2O-KR) as an Open Source tools based on REST services. The Ge2O-KR tool aims to collect the data used by Ge2O tool to display the maps.
• Engagement of stakeholders in the pilot clusters for validation and consensus building.
• Validation of the methodology within the two pilot clusters, namely “Mediterranean arc” and “Benelux cluster”.
• Dissemination of the project outcome to business, designers and relevant stakeholders identified.

8
3 Description of the main S&T results/foregrounds
In order to reach these goals, a project work plan was defined. This work plan has been split up into 5 Work Packages. Each WP is a well-delineated cluster of research activities:
WP 1: Consortium Management
WP 2: Geocluster Elaboration
WP 3: Geocluster Validation
WP 4: Knowledge Management and Sharing
WP 5: Exploitation and Dissemination
The interaction between the various WP’s is given in Figure 3.1.
Figure 3.1 – Interaction between workpackages.

9
3.1 WP1: Consortium Management All meetings of project-steering bodies have been held regularly as planned. The project management board (PMB) met every 6 months in order to monitor the progress of the project. CSTB with the administrational help of D’APPOLONIA dealt with the day-to-day management of the project. The project management website for the internal communication is up and running since the start of the project. The project advisory committee provides very helpful comments for the steering of the project. The periodic reports have been submitted to and accepted by the EC.
3.2 WP2: Geocluster Elaboration The main objectives of WP2 are:
• Identification and characterisation of best practices, lessons learnt and potential barriers as well as tools and services already in use, as emerging from the analysis of the initiatives under coordination.
• Analysis of existing knowledge and information gathered during this coordinated effort in order to identify a set of quali-quantitative parameters and indicators addressing both technological and non-technological aspects.
• Identification and characterisation of a first set of layers gathering homogeneous indicators and parameters identified during the analysis. These layers will represent the basis to compare the main features of geo-clusters and they will be the pillars of the multi-dimensional maps.
• Definition of a methodology to correlate the different layers to enable the definition of multidimensional geo-referenced maps which can vary upon the selection of different sets of layer.
3.2.1 Task 2.1: Detailed analysis of available knowledge and information Intensive work on existing clusters related to energy efficiency has been done (see D2.1). The aim is to show the importance of these initiatives in Europe and to detect important stakeholders, not only as potential users but also as interesting information to geo-referenced data.
To provide information on that topic a specific data sheet was elaborated in order to compile information of these initiatives, for further analysis, in homogeneous format (see D2.1_Annex I).
Between April and June 2012, a survey was performed and 68 datasheets were collected for countries given in Table 3.1 (in most cases, direct contacts were made with the concerned clusters). Among them, 56 were considered to meet the definition of a cluster as per the agreed definition of a cluster for this project (see D2.1_Annex II). The coverage of the European area is given Figure 3.2 in which a red dot identifies a cluster with a well-defined geographical area (generally a region), while a green dot represents a cluster with a rather national dimension.

10
Country GE2O partner # clusters
Belgium BBRI 4
Czech Rep. TZUS 3
France CSTB 9
Greece E2BA 2
Italy D’APPOLONIA 5
Luxemburg ARCELOR 1
Netherlands TNO 5
Poland ASM 8
Portugal ACCIONA 1
Slovenia ZAG 3
Spain ACCIONA 3
United Kingdom IFS 12
Table 3.1 - Survey
Figure 3.2 - Map of cluster initiatives in Europe (Source: BBRI)

11
Based on the analysis of these datasheets, the following lessons were learnt:
• Although the geographical spread of the investigated clusters covers more or less the half of the Europe, the total number of members is quite high (more than 12500). It is estimated that 90% of these are companies. Most of these companies are SME’s.
• The number of different regions (or well defined geographic zones) covered by this set of
clusters is nearly 40. • Among the 56 valid clusters, 38 have declared also dealing with research activities. These
can be official “competitiveness clusters” as in France or Belgium, or simply involved in research projects as a partner.
• Concerning the technological focus, 12 clusters can be considered as “generic” or
“umbrella” clusters, as they address all the aspects of EEB. On the other side, 14 are considered as focused on one specific technology (renewable energy sources being the most frequent). The rest is dealing with a set of diverse technology.
• The global spread of technological focus among all the 56 clusters is given Figure 3.3. Even
if it looks more or less well balanced, it may be interesting to quote that:
The “top 3” are composed of renewable energy sources (frequent in regions of the South of Europe), control systems and prefabricated elements (mainly timber work)
At the bottom of the list are lighting, glazing and ventilation systems
0
5
10
15
20
25
30
35
40
Figure 3.3 - Technological focus relevance of analysed cluster initiatives (Source: BBRI)

12
Other focus areas were also mentioned by some clusters: • Management on sustainable construction
• Development of labels and certification (national GBC committees)
• Sustainable cities, eco-districts, mobility, ...
• Smart grids
• Refurbishment of heritage/historical buildings
• Green roofs & facades
• Social Housing
• Although they are not directly linked to EEB, they will be kept in the database as additional information on some specific clusters.
This survey on cluster initiatives in Europe has been a valuable input for the rest of tasks in WP2 and essential to build the network of involved stakeholders in WP3, as it was an important starting point for contacts and project presentation outside the consortium.
3.2.2 Task 2.2: Structuring Knowledge and Information of geo-referenced data layers In Task 2.2, the following activities were performed:
• Analysis of existing knowledge and information gathered during this coordinated effort in order to identify a set of qualitative-quantitative parameters and indicators addressing both technological and non-technological aspects.
• Identification and characterization of a first set of layers gathering homogeneous indicators and parameters identified during the analysis (see D2.2). These layers will represent the basis to compare the main features of geo-clusters and they will be the pillars of the multi-dimensional maps.
The following layers and sub-layers were identified:
• Technological layer, consisting of energy-efficient technologies. 28 different energy-efficient technologies related to the building sector have been analysed and described (see Table 3.2) by project partners. These technologies represent existing market solutions although some of them are not widely spread. Innovative solutions that are at their early stage of market development have not been considered. Relationship between technology performance indicators and others descriptors has been established. For each technology, examples are given to illustrate the technology in its geo context (see D2.2).
• Context layer, consisting, for instance, of climatic conditions, building typologies, raw materials availability, etc.
• Socio-economic layer consisting for instance of macroeconomic indicators, living habits and behaviour aspects, construction business process, etc.

13
• Political-strategic layer consisting of applicable building directives and laws, standards and regulation, energy policies, etc.
For each layer, indicators, geo-descriptors, descriptors and parameters have been defined addressing both technological and non-technological aspects. Data and information which are needed for the creation of the multi-dimensional maps were collected across European regions based on EU wide data repositories and documents/reports publicly available. This information was complemented by other qualitative and quantitative data identified in Task 2.1. Further knowledge and information have been mobilized within the pilot clusters.
After a discussion with all the partners and the EC and due to the difficulties to gather all reliable information within the short duration of the project, it was decided that only two predefined key technologies will be specifically investigated during the development of the Geocluster mapping tool. These two technologies are:
1. Thermal insulation 2. Solar Cooling
Beside the fact that these two technologies were explicitly mentioned in the DOW in relation with the two pilot clusters (Benelux and Mediterranean arc), there are many reasons that can explain this choice:
• One technology lies on building envelope, the other one on energy systems; • One technology is mostly favourable to northern countries, the other one to southern
countries; • One technology is very mature, the other one is just emerging; • Thermal insulation is “ready to install”, solar cooling is linked to another technology (solar
collector); • Thermal insulation is “easy to design”, solar cooling is quite difficult to design, requiring
different skill background.

14
Category Application Technology Partner responsible for
Passive demand
reduction
Thermal insulation
Panel, roll CSTB / POLIMI Foam
Multi layers
Window & glazing
Double glazing CSTB Triple glazing Vacuum glazing POLIMI
Building envelope
Mono skin façade systems
ARCELLORMITTAL Double skin façade system Mono skin and Double skin windows systems
Heat / cool storage Phase change materials IFS
Active demand reduction
Artificial lighting
Fluorescent lamps TZUS Solid state lamps
Heat recovery Ventilation
Air to air heat exchanger
CSTB / BBRI Rotary heat exchanger Heat pipe heat exchanger
Building automation
control system
Heating / cooling control
CSTB / ACCIONA Lighting control Ventilation control Blind control
Active generation and
storage
Cooling
Earth sheltering
ZAG Evaporative cooling Desiccant cooling Solar absorption cooling
Heating and DHW
Solar water heaters
CSTB Ground, air, water source heat pumps High efficiency boilers District heating ASM
Electricity production
systems
PV panels CSTB Cogeneration (CHP)
Table 3.2 - Non exhaustive list of energy-efficient technologies analysed in the GE2O project
3.2.3 Task 2.3: Development of a correlation methodology across geo-referenced layers The main aim of the Task 2.3 was to define a correlation methodology able to (1) identify geographical areas which share similarities in terms of climatic conditions, building typologies, socio-economic aspects regulations and financial incentives and (2) build up geographic clusters that would deploy energy efficiency market potential across Europe.
The approach of cluster analysis has been introduced to correlate and integrate available EU data within Geographic Information System (GIS), in order to map the information within a geospatial framework. In order to cluster and analyze the main and possible correlations of Energy efficiency

15
(EE) technologies related to the building sector, the research methodology has considered a non-exhaustive list of EE technologies and to classify the technological layers (X layers), into 4 main categories and their respective applications. In particular, 28 EE technologies were identified and analysed (see D2.2), while innovative solutions that are at their early stage of market development were not considered. Two significant X layers – thermal insulation (X.1 layer) and solar cooling (X.2 layer) – were chosen and specifically examined during the development of the methodology correlation and of the Geocluster mapping Tool (WP4), respectively for two pilot clusters: Mediterranean arc and Western Central and Northern Europe with a focus on Benelux.
Due to a significant heterogeneity among available EE data across Europe (numerical values range, attributes, statements, units, limits, targets, in function of the field of interest), the proposed Geocluster data model was based on a 3D correlation matrix, defined by XYZ layers where: X layer was considered for EE technologies, Y layer was attributed to indicators of X and Z layer stands for all geo-descriptors i.e. parameters and indicators depending on geographical context (see D2.3).
During the data collection and methodology development, several barriers and limitations have been encountered, due to scattered knowledge, specific needs, failure modes and bottlenecks, as well as the weakness and threats experienced by running clusters dealing with energy efficiency in the built environment across Europe. The main limitation encountered refer to data quality, precision and scale; to address this barrier, the Task has conducted a coordinated work among partners of the project (industry, public authorities and academic/research institutions) that have pooled resources and developed indications for a knowledge-based repository (WP4) with a common geographic reference measure defined as Nomenclature of Territorial Units for Statistics (NUTS3). The methodology has addressed exchange, sharing, access and use of interoperable geo-spatial data, as requested by the EU Directive INSPIRE (2006). In conclusion, the Geocluster methodology was developed in a flexible manner in order to address these limits, to ensure the replicability of the process for other significant EE technologies and to foster their deployment within an integrated European Framework.
3.3 WP3: Geocluster Validation The main objectives of WP3 are:
• Identification of key stakeholder communities in the two pilot clusters, based on the extended networks of the partners and members of the Advisory Board
• Engagement of stakeholders in the pilot clusters for validation and consensus building.
• Validation of the methodology within the two pilot clusters already identified at proposal stage, namely Mediterranean arc and Benelux cluster
• Definition of Technology Maps for the relevant challenges in the two pilot clusters.
3.3.1 Task 3.1: Engagement of Stakeholders for validation The aim of Task 3.1 is to support the analysis of data collected for the different layers and validate the GeoCluster Mapping Tool. This has been ensured through the engagement of stakeholders in the pilot projects.

16
The feedback of the different stakeholders gives some valuable results to identify the different progress tracks for the future development of the tool. The two official European workshops were a success; several participants were enthusiastic for concept behind the tool and expressed their interest to use the tool once it is operational. Furthermore, the project and the tool were also presented in meetings and conferences hosted by some partners of the project with also good feedback from participants. Different questionnaires were also used to record the expectations of potential end-users and collect the proposals to improve the tool. The exploitation of theses questionnaires is not straightforward since many proposals or wishes are very hard to implement in the future version of the tool but as a general rule, the interest showed by those who responded was very high.
The feedback collection process was organized in order to meet the following objectives:
• To identify the needs of potential end-users
To meet this objective, two official European workshops were held in the two pilot areas of the project: the BENELUX area with the workshop in Luxembourg on June 2013 dedicated to Thermal Insulation and the Mediterranean area with the workshop on October 2013 dedicated to Solar Cooling. Additionally to these European workshops, national workshops and conferences were organized to demonstrate the mapping tool and validate the potential of the geocluster concept.
Different stakeholders (decision-makers, researchers, developers, manufacturers, architects, etc…) were invited to attend these workshops and give their comments. Some of their proposals are described below and had already been included in the last version of the tool.
Some participants expressed their wishes to customize the tool for their own needs. Most of them stressed out the necessity to match financial data (material cost, labour cost, maintenance cost …) with technical data such as energy performance indicators. Two recurrent demands were suggested:
to deploy a quality management process in data collection and analysis due to the wide heterogeneity of existing databases throughout Europe. Ideally, all data implemented in the software should be certified.
to insure that data are permanently updated. This is an absolute condition to make the tool marketable.
• To validate if the mapping tool can fulfill the expectations of potential end users
As a general rule, the demonstration of the tool was favourably perceived by the audience and positive feedback was given. Participants appreciated the innovative character of this tool and the possibility offered to technology suppliers to assess the market potential of their products with just some clicks (few parameters to be introduced). They also appreciated the local/regional dimension of the tool even if only some countries are covered so far. However, the fact that only two key-technologies were available at this stage was a major barrier to catch the attention of a larger audience.
Two categories of stakeholder are emerging as the targeted audience for the tool:

17
1. Manufacturers and technology providers
2. Public authorities
The other categories of potential end-users seem to be less interested by the tool or the tool is less adapted to their needs.
• To elaborate some proposals in order to improve the tool
One common suggestion is to aggregate to the web page where the software tool is hosted a small guidance or user manual to facilitate its use. Especially if the user is not familiar with the tool before (like surveys and questionnaires showed) it is quite complicated to understand all the capabilities and the options of the correlations and different layers.
As seen before, the maintenance of the tool when the project is over, especially with the actualization of the data is a key issue. The database should be reviewed and updated periodically or the tool will lose part of its attractiveness.
As commented above, end-users are a little bit frustrated just to play with two-predefined technologies. They would expect to compare technologies together or to play with other technologies. As it was said at the beginning of the project, the main objective is to prove that the concept of geocluster is relevant, not to develop fully operational software. During the frame of the project, 24 innovative energy-efficient technologies have been investigated and energy performance indicators have been identified for each technology. It is expected that each technology will be implemented in a future step, after the end of the project.
During the two European workshops dedicated to thermal insulation and solar cooling, many suggestions to improve the tool were made. Comments and suggestions are described in the minutes of the different meetings in D3.1. Some of them (e.g. financial indicators for thermal insulation, market indicators for solar cooling) were implemented in the last release of the tool (see annex 1 of D3.2). Others are areas of progress that will be useful for new developments of the tool but beyond the project duration.
3.3.2 Task 3.2: Application of the methodology and detailed analysis of the pilot cases To test the tool and prove the relevance of the geo-cluster approach, 11 cases studies have been performed combining:
different end-user profiles;
different countries/ scopes (national/regional…);
the two-predefined technologies (see limitation above)
with the following objectives:
Identification of barriers
Selected technology potential
Associated business models

18
Readiness for technology innovation, transfer and adoption.
Time to market
Replication potential
Case study carried out for scenario 7 is given below. The remaining scenarios are described in D3.2.
SCENARIO nº7 End-user profile: MANUFACTURER Responsible Partner: TNO Technology: THERMAL INSULATION
1. Story board:
[PUSH] A producer of innovative extra high insulating material (glass wool) wants to implement his product on the European market on a large scale. A comprehensive market investigation is needed in order to select the most successful markets. The innovative glass wool is especially developed for houses with pitched roofs, where the space under the rafter is used as living space. The success factor of the product is the fact that the material achieves a higher insulating value (lower U-value) with the same thickness and for the same price than other insulating materials.
2. List of queries / needed information: About the building typology:
GENERAL REMARK: These questions are different for each insulation material and application area of an insulation material. It will not be possible to include all data that could be of interest in the tool. Maybe we can help the user by making a wizard which helps him/her to define which information is needed (a first example for this is given in the annex).
Question: In which areas do they have a high percentage of dwellings with a pitched roof which is not yet insulated? And where do people use the space under the rafter / attic as a living space? In the map you will need several filters:
a) Percentage (and absolute number) of dwellings with pitched roof (probably this information is not available, maybe information if dwellings with a pitched roof are built in a certain region gives already enough information)
b) Percentage (and absolute number) of dwellings without insulation in the roof (or insulation below a certain level, e.g. U>1 W/m2K). At the moment only the average U-value is available in the tool. We think this is not the only information needed.
c) Percentage of dwellings where the attic (or space under the rafter) is used as a living space (probably this information is not available; maybe you can make an estimation).
--> This results in a number of dwellings which are suitable for using the insulation material. For the producers it is interesting to know the characteristics of these dwellings (construction age, type of dwelling, etc.)

19
REMARKS: Most of the information about building typology will be only available for the total building stock and not for subpopulations of the building stock (there is no relation between the different filters). Actually you would like to have information about the number of dwellings with a pitched roof without insulation, where the attic is used as living space. In the tool there will be the following filters: - the number of dwellings in the total building stock with a pitched roof - The percentage of dwellings without roof insulation. However, it could be that all dwellings with a pitched roof are not insulated; while on average for the region 30% of the roofs are not insulated (the other 70% of insulated roofs are of dwellings without a pitched roof). If this is the case the tool will give wrong information. We should make a remark about this in the tool.
About the climate:
Question: In which areas is it useful to insulate the roof of dwellings?
In the map you will need several filters:
1. For heating a. Heating degree days per area: in areas above a certain number of heating
degree days it is useful to apply insulation material. REMARK: It will be difficult for stakeholders (especially producers) to decide what the minimum number of heating degree days for a useful application of insulating material is.
b. U-value of existing building stock with a pitched roof / Percentage of
dwellings with a pitched roof without insulation in the roof (or insulation below a certain level, e.g. U>1 W/m2K). In combination with the heating degree days this will show if there is potential for insulation.
REMARK: it is difficult to decide when (at which values) there is potential
c. Target U-value according to the building regulation (or regulation for the
energy efficiency as a whole). We have to differentiate this in regulation for existing and for new dwellings. If there is tight regulation and there is a large percentage of dwellings without roof insulation, there is potential for insulation.
REMARK: it is difficult to decide when (at which values) there is potential
2. For cooling (of less importance than heating):
a. Cooling degree days per area b. U-value of existing building stock / Percentage of dwellings without
insulation in the roof (or insulation below a certain level, e.g. U>1 W/m2K).
c. Target U-value according to the building regulation (or regulation for the energy efficiency as a whole).

20
REMARK: See the remarks for heating Interest in insulation: Question: In which regions are people interested to insulate their roof?
In the map you will need several filters:
a. Financial incentives for insulation If people get an incentive they are probably more willing to invest in insulation (also because the payback time will be shorter).
b. Percentage of income spent on energy use
If people spent a big part of their income on energy use they are probably more willing to invest in insulation (the payback time is shorter). At the moment only the gas-/electricity price is included in the tool, but this aspect alone doesn’t say anything.
c. Regulation regarding energy efficiency of dwellings
If there is a lot of regulation about energy efficiency there is probably more attention for energy efficiency in a region and people are more willing to invest in insulation.
d. Attitude of people regarding energy efficiency
If people care about energy efficiency they are probably more willing to invest in insulating their dwelling. This aspect is not yet included in the tool and will be difficult to include in future.
e. Economic climate in a region
If there is a lot of economic growth and a low unemployment rate, people are probably more willing to invest in insulation.
f. The percentage of buildings that is renovated in the last years
If renovation is popular, probably more people are willing to invest in insulation. This aspect is not yet included in the tool.
g. Ownership of the dwelling
This aspect determines the target group for the insulation material producer. If the residents are the owners of the dwelling, he has to focus on them. If the residents only rent the dwelling, he has to focus on the housing corporation. This aspect is not yet included in the tool.
h. Probably there are more aspects that we forgot to mention here…
REMARK: it is difficult to set the boundaries for these aspects (when people are willing or not willing to invest). All these aspects together determine if people are willing to invest.

21
3. Possible cross relations Not identified. 4. How the GE2O mapping tool satisfy my needs as a potential user
(according to the guidelines given above)? To what extend the tool provides me with the required information?
The current version of the tool doesn’t give enough detailed information about the building typology (in this case information about the type of roof, use of the attic, and presence of insulation material is needed). For each type of insulation material the building specific information needed will be a little bit different (i.e. in the case of cavity wall insulation information is needed about the percentage of dwellings with cavity walls, the percentage of cavity walls without insulation etc.). We think it is not possible to adapt the tool in a way that it will include all information possibly needed, but we can try to include the most commonly needed information (as far as this information is available for the different countries, i.e. there is probably no information about use of the attic, but we can make a rough estimation for this). It would also be good if stakeholders can add their own information to the tool. There is information available in the tool about climate, but it is difficult to define the boundaries for the different parameters. E.g. for the heating degree days it is not clear for the stakeholder at what number of heating degree days it will be useful to insulate the roof. This also depends on other aspects. For the more social aspects (like economics, financial incentives etc.) the user needs to interpret himself how all these aspects have a positive or negative effect on the applicability of roof insulation. It is impossible to give a single objective answer to the user related on this topic (the user should define the boundaries himself).
From these case studies, some preliminary conclusions can be drawn. The general first impression is positive. The user-friendliness of the tool is appreciated and there is a strong agreement about the relevance and quality of climate data, which is very well valuated by most of participants. However, the actual level of development of the tool is not enough to demonstrate the full potential of the tool. The lack of some key information does not allow achieving a complete analysis and the tool seems to be quite far from real market.
A SWOT analysis (see Table 3.3) has been performed that reflects Strengths and Weaknesses of the current version of the tool (prototype development and proved concept) and Opportunities and Threats for the tool beyond the project duration (future needs and tool potential).
.

22
POSITIVE
NEGATIVE
PRESENT SITUATION
STRENGTHS (S) User-friendly visual tool with intuitive operation Provision of extensive climate data Flexibility to develop user’s own queries, with adjustable parameter searches Professional experience and knowledge provided by consortium partners from complementary organisations in a wide range of countries General agreement on the perceived potential for market development Errors and corrections completed within project time.
WEAKNESSES (W) Final version is still a prototype. Several EU countries with significant market opportunities are missing Existing information doesn´t yet reflect the real market conditions or regional/national specificities for some of the layers. Key indicators are missing: financial incentives; cost analysis and LCA data; legal framework. High level of expertise is required to interpret information
FUTURE EXPECTATIONS
OPPORTUNITIES (O) The project proves the importance and usefulness of aggregating technical information across Europe. The tool could be developed and implemented for a wider range of technological and socio-economic variables Further requirements of potential users could be included
THREATS (T)
Great difficulty involved on data management when reflecting a wide range of regional/national realities.
Quality control & Independence of the tool (technical rigour)
Table 3.3 – SWOT analysis
23
3.4 WP4: Knowledge Management and Sharing The main objectives of WP4 are:
• Development of a repository to store the knowledge and information gathered and structured during WP2 and WP3.
• Development of a mapping tool which implement the methodology developed in WP3.
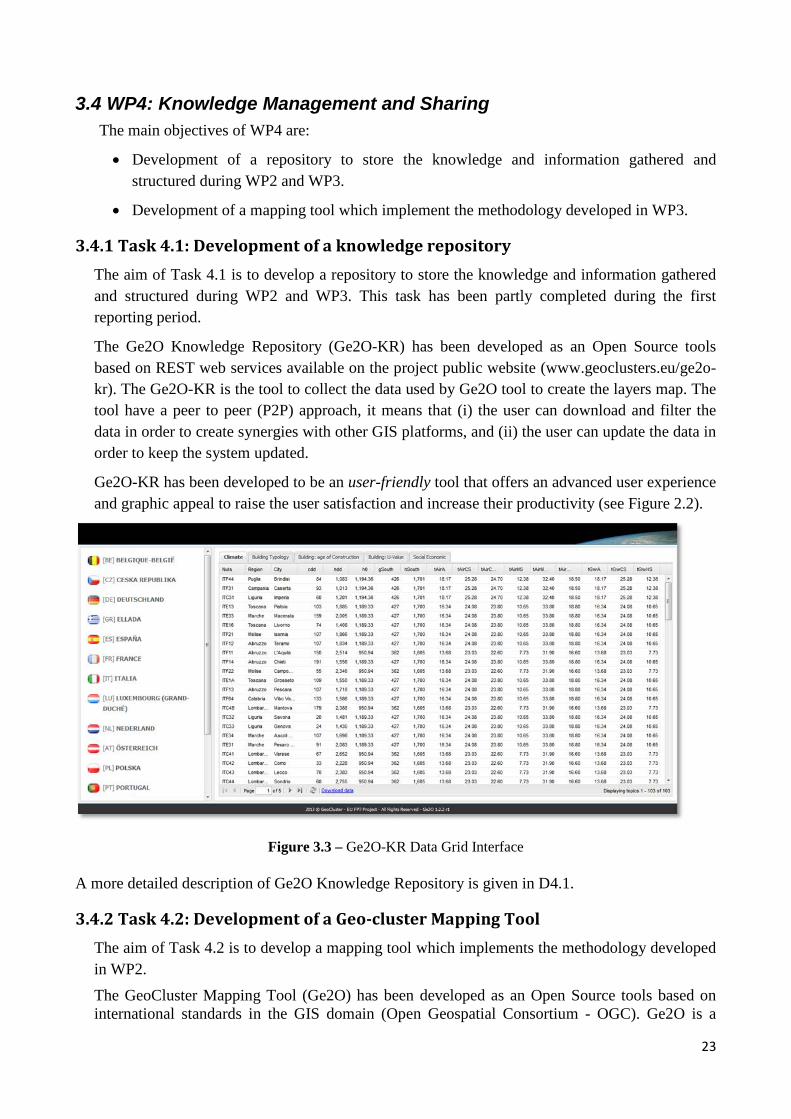
3.4.1 Task 4.1: Development of a knowledge repository The aim of Task 4.1 is to develop a repository to store the knowledge and information gathered and structured during WP2 and WP3. This task has been partly completed during the first reporting period.
The Ge2O Knowledge Repository (Ge2O-KR) has been developed as an Open Source tools based on REST web services available on the project public website (www.geoclusters.eu/ge2o-kr). The Ge2O-KR is the tool to collect the data used by Ge2O tool to create the layers map. The tool have a peer to peer (P2P) approach, it means that (i) the user can download and filter the data in order to create synergies with other GIS platforms, and (ii) the user can update the data in order to keep the system updated.
Ge2O-KR has been developed to be an user-friendly tool that offers an advanced user experience and graphic appeal to raise the user satisfaction and increase their productivity (see Figure 2.2).
Figure 3.3 – Ge2O-KR Data Grid Interface
A more detailed description of Ge2O Knowledge Repository is given in D4.1.
3.4.2 Task 4.2: Development of a Geo-cluster Mapping Tool The aim of Task 4.2 is to develop a mapping tool which implements the methodology developed in WP2. The GeoCluster Mapping Tool (Ge2O) has been developed as an Open Source tools based on international standards in the GIS domain (Open Geospatial Consortium - OGC). Ge2O is a

24
public web application available at URL http://www.geocluster.eu/ge2O. The tool (see Figure 3.4) aims to display the different layers of bi-dimensional maps regarding EE issues in a platform for easy P2P (peer to peer) communication, information sharing and as support to management of data and their geographical reference (SDI).
Figure 3.4 – GeoCluster Mapping Tool Screenshot
Ge2O has been developed to be an user-friendly tool able to define multi-dimensional maps and to give access to this information at several levels of complexity and granularity. The Ge2O tool is equipped with an online tutorial that is automatically shown at the first access. It appears as a wizard that conducts in 9 steps the user in the discovery of the tool components and its functionalities. The tutorial is designed to be interactive intact the user is taken to carry out some actions on the tool during the learning process. When the user completes the online tutorial, the Ge2O application will not show this tutorial, but anyway the user, in any time, is able to perform again this tutorial by clicking the “Help button” on the toolbar, more detail are available in D4.1. Figure 3.5 shows some tutorial steps provided as example.
Online Tutorial Step 1/9
Ge2O Mapping Tool
The proposed geo-cluster concept is based on the possibility to locate similarities across European regions by correlating single or multiple parameters organized in homogeneous layers and sub-layers. This tutorial show how to use the Geo Mapping Tool.

25
Online Tutorial Step 4/9
Filter Panel
This panel allows to filter data on the map and manipulate the layer with parameters set in real time by the users. Try changing the parameters of maximum and minimum, respectively, 1295 and 3695 and see how you change the map. Press button to reset the filter values.
Online Tutorial Step 6/9
Filter Box Panel
In this panel it is possible to add filter parameters to refine the map in real time, to suit your needs.
When you have finished click on “Apply and close” button, and automatically the map will be reloaded with your preferences.
Figure 3.5 – Online tutorial - Example
3.5 WP5: Exploitation and Dissemination The main objectives of WP5 are:
• Definition of the exploitation strategy for the project outcome
• Dissemination of the project results to business, designers and relevant stakeholders identified
3.5.1 Task 5.1: Dissemination and consensus building across stakeholders communities The project dissemination activities were carried out by all partners and helped to promote the project specifications as well as to ensure the widest use of knowledge derived from its results. The vast majority of these activities were performed during the second reporting period. Dissemination material
The project website and the project brochures/poster are two of the vehicles that were used to diffuse the project activities and reach out to the wide range of identified stakeholders. The project website (http://www.geoclusters.eu/) was developed at the early stage of the project and regularly updated by D’Appolonia (see Figure 3.6)

26
Figure 3.6 – The project website
Different brochures and posters were edited and published all along the project duration (see Figure 3.7). Brochures were distributed to participants prior to European workshops.
Figure 3.7 – Poster used at the Workshop held in Luxembourg

27
Dissemination efforts
A short overview of the common efforts carried out between 12-24 months is listed down below:
• Two international workshops (the project was presented in Luxembourg and Madrid)
• Press releases (6 press releases have been prepared in 2013)
• Scientific papers published in journals (POLIMI have published 2 scientific papers in journals)
• Scientific papers presented in conferences (POLIMI have prepared 4 scientific papers for conferences)
• Survey sent to EEB project coordinators (ArcelorMittal sent a survey to EEB project coordinators)
• Other workshops and similar events (the project was also presented in Genoa, Brussels, London, Seville and Ljubljana)
• Other dissemination activities amongst external stakeholders (TNO have participated in 3 dissemination activities of this type)
• Dissemination amongst internal stakeholders (TNO, ZAG, TZUS, ACCIONA and E2BA have disseminated the project internally)
• Other dissemination activities (POLIMI, E2BA, D’Appolonia, ASM and IFS have participated in a total of 12 other dissemination activities in 2013).
A more complete description of dissemination activities is reported in D5.2.
3.5.2 Task 5.2: Exploitation routes for the geo-cluster concept Owned by the whole consortium, the tool is currently open-source, thus all partners have the possibility to use it. However different options must be considered in order to ensure the use of the methodology and tools beyond the project duration. Five possible exploitation (scenarios 1, 2, 3, 4 and 5) routes were identified in 2013 and all the partners were invited to express their wishes by voting for one of those options (see D5.3 for a more detailed description of these scenarios). During the final Steering committee meeting that took place in Brussels, all partners showed great interest in maintaining the network running and were challenged to create a new scenario as a consensual decision had not be reached before. Resulting from the combination of scenarios 1, 4 and 5, a new scenario was defined and adopted. The agreed scenario is described as follows:
• The platform will be maintained by D'Appolonia beyond the end of the project for a period of 2 years as open-source;
• All GE20 partners will sign a Letter of Intent under which they commit to keep the platform alive;
• All GE20 partners will constitute a Group of Work that will be steered and coordinated by E2BA;
• E2BA will also act as the vehicle between the Group of Work and the European Commission;

28
• Partners can focus on the aspects that they are interested in (e.g. specific systems, stakeholders or countries) and develop the Tool accordingly. The system will therefore adopt an umbrella configuration: the “Mother Platform” (see Figure 3.8). The work of individual partners will result in branches, which can be integrated in the Mother Platform to make it grow;
• The Group of Work will be responsible for the update and refinement of the Mother Platform;
• With regard to software aspects, the Mother Platform will be managed by D’Appolonia;
• Partners can run the Mother Platform on their own servers for internal research for free and make their own adjustments to the Tool (create new branches). They can make the results publicly available;
• When a partner wishes to integrate a branch (which may be a new correlation, a new indicator, refined data, etc.) into the Mother Platform, an agreement should be reached with the Group of Work;
• When a partner exploits the Mother Platform or any of its branches commercially, making profit out of it, an agreement should be reached with the Group of Work about a financial compensation for each partner;
• E2BA members (industry, research organizations, SMEs and public promoters and agencies) will be invited to refine the Tool (new data collection, new indicators, constructive comments and feedback, new dissemination strategies…) on a voluntary way;
• All other GE20 partners will be requested to use their networks to address stakeholders potentially interested in the development of the Tool.
Figure 3.8 – Concept of Mother Platform

29
4 Potential impacts
4.1 Project impacts
We have identified all key stakeholders and users that could be impacted by the GE2O project , as represented in Table 4.1.
Main GE2O Stakeholders/Users Benefits
European Commission Community instruments facilitating trans-national cluster policy cooperation will offer strong benefits avoiding for instance scattering of public subsidies. Geo-clustering will be a key pillar of any future large public-private initiative at EU level tackling research and demonstration across the whole stakeholder community for more energy efficient buildings and districts.
Local government /authorities
Locate peers which have similarities in tackling local challenges when developing energy policies, lunching research and demonstration programmes, financial schemes and incentives, to name a few. Geo-clusters provide a framework for formulating and implementing effective public policies and making public investments to foster economic development. EU regions with many strong clusters are among top performers with respect to patents. Economic prosperity among the regions of Europe is linked to the degree of cluster strength.
Local clusters active in Energy efficient Buildings
Identification of peers which share similarities and therefore favouring networking and benchmarking to optimize local efforts and increase internationalisation of SMEs.
Standard and Regulatory Bodies Improve the effectiveness by fine tuning them towards areas which share similarities, avoiding inconsistencies or introducing barrier for effective exploitation of novel technologies and solutions. The geo-clustering mechanism will facilitate the integration and definition of standard protocols to make it possible to analyse energy behaviour on the same terms in all EU countries and regions, better understanding energy aspects from building

30
experts to end-users.
Research and Training Institutes Foster the exchange of best practices and best available technologies, adapting training packages to the specific local environmental-socio-economic conditions and building typologies. Impact on final take-up of innovative approaches will then drastically improved.
Construction Industries (both LE and SMEs, including architects and designers)
Access a knowledge repository which allow proper direction of R&D investments avoiding replication of failures, share design strategies based on local specifities thus better exploiting global solutions which are locally adapted for enhanced impact. Development of energy-efficient solutions in the building industry makes it necessary to have industrialized solutions and products, capable of being adapted to virtual trans-national areas/markets where strong similarities are found.
Supply industries (LE, SMEs) Locate partners and lead markets for their technologies and solutions, identify key areas for their introduction beyond the current marketing approaches clustering markets based on geographical proximity. Geo-clusters will stimulate innovative activity by promoting intensive interactions, sharing of facilities and exchange of knowledge and expertise and by contributing effectively to technology transfer, networking and information dissemination.
Banks and Financial institutions Benchmark successful schemes and models, help in defining replication strategies guided by parameters which goes beyond current macro-economics or cultural aspects. Structured information at the European level will contribute to reducing the potential associated investment (about € 70 billion/year) needed by the construction sector to accomplish the 20/20/20 mandate, leveraging on private investments and providing effective financing schemes.

31
NGOs Focus efforts and resources to accelerating action by local governments in energy efficiency and climate change, grouping those areas which share similarities from a broader point of view, fully exploiting the multi-dimension of our approach. Geo-clusters will improve the international cooperation with the industrial and developing countries to jointly tackle future grand social challenges as climate change.
Higher Education Institutions Geo-Cluster will enable developing the “triple helix relationship” between firms, research centers and higher education institutions by sharing common programmes and creating critical mass of resources around common education themes, more relevant to the similarities in a given cluster.
Table 4.1 – How stakeholders and users could be impacted by the GE2O project
Although it is very difficult to provide quantitative estimates of the impact associated to these specific benefits we may expect that the implementation of GE2O would support the achievements of the long term targets identified in the Multi-annual Roadmap of the EeB PPP as identified by E2BA1. If we stick to the energy, environmental, social and economic objectives they are reported Table 4.2.
ENERGY
Energy Use for Heating and Cooling and Total Primary Energy Use (including lighting, appliances,…) (kWh/m2 )
New Buildings: Cost Effective Zero Energy or Energy +
Renovated Buildings: (beyond Passive House)
<15 kWh/m2 for Heating and cooling and < 40 kWh/m2 for the total energy use equivalent to <120 kWh/m2 for total primary energy
GE2O will support the target reduction of the energy use of 26.4 – 33 Mtoe
Energy Generation with RES from the Building Sector
• Higher rate of RES instalments efficiently integrated in building structures able to generate as much energy as the
1 http://www.e2b-ei.eu/documents/EeB%20PPP%20Multiannual%20Roadmap%2018%20jan%202010%20last.pdf

32
20% obligation for RES applied for the building sector • The long term implementation of the strategy facilitated by GE2O could contribute to this obligation with 8.37-10 Mtoe2, big share of this for electricity generation.
Energy imports & security of energy supply
The contribution to reduce the energy use of the building sector (main responsible of the energy use) as well as the integration of RES will contribute to reduce the energy dependence of the EU.
ENVIRONMENTAL
CO2 Emissions (CO2 equivalent) (Tonnes per year) and Global warming potential (GWP)
The long term implementation of the strategy facilitated by GE2O would facilitate to go much beyond the 30% reduction of GHG emissions in line with the EU proposal if there is an International agreement. This will also facilitate cost effective technologies to reduce about 65 million tonnes of CO2 per year
Land Use and Soil sealing • The long term strategy supported by the GE2O availability addresses urban environment/energy strategies, planning, methodologies and new tools that would partially compensate at urban level the energy and emissions generated by this current scenario. • Additionally, the impact on soil sealing would be reduced.
Ozone depletion potential (ODP)
The long term implementation of the strategy facilitated by GE2O will promote the use of chemical products with zero ozone depletion potential for heating, ventilation, air conditioning and refrigeration
SOCIAL
Employment (Number of jobs/year)
The recast EPBD representing about 50% of the total expected employment, and the long term strategy that GE2O will support and representing about 16% of the total associate investment and employment, the impact would be from 90.000 to 150.000 jobs.
Thermal Comfort and Indoor air quality (CO2 levels (ppm)/ ventilation controls and Humidity)
Ventilation conditions (Litre of fresh air/ second /person)
As the EeB PPP main objective is the reduction of energy use while improving the quality of life of EU citizens including health at home and work, comfort aspects are the main consideration and indeed this is in line with GE2O targets. Materials and products to improve comfort and increased ventilation will allow to decrease the CO2 content 400 ppm CO2 and improve humidity to 30-50%
Lighting comfort - The long term implementation of the strategy supported by 2 50 Mtoe x 16,74% (see total energy calculation)= 8,37 Mtoe; 50 Mtoe*20% = 10 Mtoe

33
Recommended maintained lighting levels (lux). Provision of daylight (average daylight factor)
GE2O will promote the use of the best lighting and ICT technologies to improve both lighting comfort and reduce energy use.
ECONOMIC
Competitiveness, productivity and sustainable economic growth
The investment induced in much more efficient and clean technologies estimated within the long term strategy would be about 17 – 25 % of the associated investment, that means an induced investment of € 12 and € 17 billion/per year. These figures would represent approximately between 1 and 1.4% of the total outcome of the building sector that is about € 1,200 billion annually. Additionally, the joint action of the construction industry would lead to a relevant cost reduction of around 10/15% of the above induced investment. This would mean (taking the averages) to around € 1,6/1,8 billion/year. So, each Euro invested in the implementation of the long term programme will save costs of minimum 8/9 Euros.
Shorter time to market by 5 years, the development of cost-effective solutions and the adoption of sustainable practices in the sector will derive in an increase competitiveness of the industry, increase private associated investment in energy efficiency, and better and more quality, services and business models for the customers. Furthermore, the implementation of buildings of higher efficiency and comfort will increase the productivity of the employees by 3 to 5%.
Table 4.2 – Contribution to the targets by GE2O
4.2 Dissemination activities
The dissemination activities started since the early stage of the project but have been mostly concentrated on the second year of the project. They are of three types:
1. Development of marketing materials to support any communication through different media 2. Promotion of the GE2O cluster mapping tool through different media:
• Printed articles published in professional magazines and newspapers
• Electronic articles for publication on the Partners’ websites and newsletters
• Participation in workshops and conferences. A precise description of all attended events is given in D5.2.

34
3. A project website: http://www.geocluster.eu/. The website has a public part, used for disseminating the project to a wider audience and hosting the geocluster mapping tool, and a private section, accessible only by registered partners and used for internal coordination as well as document repository.
4.3 Exploitation strategy
See § 3.5.2

35
5 Project logo

36
6 List of all beneficiaries with the corresponding contact names
Name Short name
Country Logo Contact person
CENTRE SCIENTIFIQUE ET TECHNIQUE DU BATIMENT
CSTB France
Dominique Caccavelli
Charly Gay
Franck Cheutin
NEDERLANDSE ORGANISATIE VOOR TOEGEPAST NATUURWETENSCHAPPELIJK ONDERZOEK
TNO Netherlands
Linda van Oeffelen
Kim van Zundert
ZAVOD ZA GRADBENISTVO SLOVENIJE
ZAG Slovenia
Friderik Knez
TECHNICKY A ZKUSEBNI USTAV STAVEBNI PRAHA S. P.
TZUS Czech Republic
Konstantinovic Dragana
CENTRE SCIENTIFIQUE ET TECHNIQUE DE LA CONSTRUCTION
CSTC/BBRI
Belgium
Fabrice De Barquin
POLITECNICO DI MILANO
POLIMI Italy
Raffaella Brumana
Branka Cuca
Marta Maria Sesana
Giuliana Iannaccone
INSTITUTE FOR SUSTAINABILITY
IFS United Kingdom
Ed Metcalfe
Tereza Kadlecova

37
ACCIONA INFRAESTRUCTURAS S.A.
ACCIONA Spain
Elena Méndez Bértolo
ARCELORMITTAL BELVAL & DIFFERDANGE SA
ARCELORMITTAL
Luxembourg
Olivier Vassart
Luc Chefneux
Didier Bridoux
D'APPOLONIA SPA DAPP Italy
Margherita Scotto
Samuele Ambrosetti
Giammario Incao
Alberto Musetti
ASM CENTRUM BADAN I ANALIZ RYNKU SP. Z O O
ASM Poland
Katarzyna Stachurska
ENERGY EFFICIENT BUILDINGS AISBL
E2BA Belgium
Joao Moreira
Silvia Zinetti
Luc Bourdeau
For further information, please contact Dominique Caccavelli from CSTB ([email protected]) or visit the project website: http://www.geocluster.eu/

38