final publishable summary report - europa · installation of the components onboard the oe buoy...
TRANSCRIPT

Final Publishable Summary Report
CORES - 213633

CORES 213633 – Final Publishable Summary Report
2
Contents
1 EXECUTIVE SUMMARY .................................................................................................... 3
2 SUMMARY DESCRIPTION OF THE PROJECT CONTEXT AND THE MAIN OBJECTIVES .............................................................................................................................. 4
3 MAIN SCIENTIFIC &TECHNICAL RESULTS/FOREGROUNDS ...................................... 6
3.1 CORES PROJECT OVERVIEW ........................................................................................... 6 3.1.1 Introduction ............................................................................................................. 6 3.1.2 Project Summary ..................................................................................................... 6
3.2 CORES SYSTEM DESCRIPTION AND RESULTS ................................................................. 12 3.2.1 Introduction ........................................................................................................... 12 3.2.2 CORES Impulse Air Turbine with moveable guide vanes .................................... 12 3.2.3 Electrical Power System ....................................................................................... 16 3.2.4 Control System ...................................................................................................... 17 3.2.5 Sensors and Cameras .......................................................................................... 19 3.2.6 Remote Control and Communications .................................................................. 21 3.2.7 Moorings ............................................................................................................... 22
3.3 DEPLOYMENT AND SEA TRIALS RESULTS AND FOREGROUNDS .......................................... 23 3.3.1 Introduction ........................................................................................................... 23 3.3.2 Project Management ............................................................................................. 23 3.3.3 Risk Management ................................................................................................. 25
4 POTENTIAL IMPACT, MAIN DISSEMINATION ACTIVITIES, EXPLOITATION OF RESULTS .................................................................................................................................. 27
4.1 POTENTIAL IMPACT .......................................................................................................... 27 4.1.1 Background ........................................................................................................... 27 4.1.2 Impact Summary ................................................................................................... 27
4.2 IMPACT OF WORK PACKAGES .......................................................................................... 28 4.2.1 WP1 Impact – Air Turbines ................................................................................... 28 4.2.2 WP2 Impact - Electrical and Control ..................................................................... 30 4.2.3 WP3 Impact – Moorings Risers and deployment .................................................. 33 4.2.4 WP4 Impact - Modelling, System Integration and Field Trials .............................. 36 4.2.5 Generic Impacts .................................................................................................... 36
4.3 DISSEMINATION ACTIVITIES .............................................................................................. 36 4.3.1 Dissemination Plan from Annex 1 ......................................................................... 36 4.3.2 Local Level Dissemination .................................................................................... 37 4.3.3 International Level Dissemination ......................................................................... 38

CORES 213633 – Final Publishable Summary Report
3
1 Executive Summary The CORES (Components for Ocean Renewable Energy Systems) Project was a three year EU FP7 project running from 2008 to 2011. It brought together 13 partners from research and development centres and small and medium enterprises from across the EU. The aim of the CORES project was to develop new concepts and components for power take off, control, moorings, risers, data acquisition and instrumentation for floating wave energy devices. Once developed, these components were tested on a floating oscillating water column (OWC) test platform at sea at the Galway Bay Intermediate Wave Energy Test Site. A flow chart showing the various stages of the CORES project is shown in Figure 1.1.
Figure 1.1: Flow chart of CORES Project
The sea trials of the CORES project were completed successfully within budget and on time. Thorough test planning ensured that a complete data set was collected during sea trials. Valuable experience was gained in the design and development of systems for wave energy converters and in the deployment of wave energy converters. The research and deliverables from the CORES project have been disseminated widely both locally, in the countries of respective CORES partners and internationally through journal and conference papers and a showcase event. Information from the project has been made available to academia and the ocean energy industry.
Design, model and
development of
components by
different partners
Integration and
testing of equipment
at HMRC
Installation of
components on
OE Buoy in
Galway
Dry
Dock
Testing
Sea
Trials
Recovery
and
Decommissioning
Launch
and
Deployment
DATA
INTEGRATION
INTO WAVE TO
WIRE MODEL
Marshal
equipment
to Galway

CORES 213633 – Final Publishable Summary Report
4
2 Summary description of the project context and the main objectives
Wave Energy Converters are at an early stage of development. In order for first generation devices systems to progress towards full commercial realisation they must develop into units suited to mass production. The FP7 CORES project set out to address particular issues resulting from the development of Oscillating Water Column Wave Energy Converters (OWC WECs). Until recently these devices were primarily fixed shoreline devices. These have evolved into floating devices, in deeper water and further offshore. Consequently new concepts and components need to be developed, and the CORES project addresses this need.
Figure 2.1 CORES project logo
The concepts and components developed in this project cover aspects such as power take-off, control, moorings, risers, data acquisition and instrumentation. Once developed and tested through simulation and small scale tank tests in both 2D and 3D ocean wave basins, these will be optimised and fitted onto a floating sea based platform for sea trials. This will enable the integration of the resulting real, validated and verified results into a holistic system model. This model will, in turn, provide a Toolbox for wave to wire simulations of complete WEC systems. The primary objective of the CORES project was to create this wave to wire modelling “Toolbox”, which would allow developers to evaluate the effect of changes in device components on the performance and economics of their devices. This Toolbox was to consist of a number of numerical models or “tools” developed within individual Work Packages and validated at bench scale and through laboratory scale testing at sea.
Figure 2.2 CORES Work Package Summary
The project is broken into four work packages which represent a fully operational system:

CORES 213633 – Final Publishable Summary Report
5
Work Package 1: Air Turbines This focuses on the design and manufacture of an alternative to the traditional, but limited, Wells air turbine system for OWC WECs. The Air turbine is a key element in the power conversion chain as it is the primary converter from pneumatic power to mechanical power. Work Package 2: Electrical & Controls This looks at all electrical components for the system, concentrating in particular on the power take off (PTO) system. The objective is to look at how power electronics can improve the behaviour of an OWC WEC. Work Package 3: Mooring, Risers & Deployment This investigates the design of moorings that are robust yet cost effective and easily deployed. Mooring systems can directly affect device performance as well as overall project costs. Work Package 4: Modelling, System Integration & Field Trials This is designed to integrate the outputs from the previous three Work Packages, developing an integrated modular wave to wire model toolbox. During work packages 1, 2 and 3 concepts for various components of floating OWCs were designed, modelled and developed. In work package 4, these components were integrated together on the Ocean Energy Buoy (the OE Buoy) floating OWC platform for three months of sea trials for testing. Some of the main achievements of the CORES project include the following:
Successful deployment of a real wave energy device at sea for 3 months
A validated turbine design methodology
An improved air turbine design for OWCs
Demonstration of a robust electrical system over three months of sea trials
Improved mooring design methods The research and results from the CORES project have been disseminated to the wave energy industry and to academia. These results will contribute to overcoming some of the barriers that exist to the commercialisation of wave energy converters.

CORES 213633 – Final Publishable Summary Report
6
3 Main Scientific &Technical results/foregrounds
3.1 CORES Project Overview
3.1.1 Introduction
The CORES (Components for Ocean Renewable Energy Systems) Project was a three year EU FP7 project running from 2008 to 2011. It brought together 13 partners from research and development centres and small and medium enterprises from across the EU. The aim of the CORES project was to develop new concepts and components for power take off, control, moorings, risers, data acquisition and instrumentation for floating wave energy devices. Once developed, these components were tested on a floating oscillating water column (OWC) test platform at sea at the Galway Bay Intermediate Wave Energy Test Site. This report gives the main scientific and technical results and foregrounds of the CORES project and of the sea trials of the different components that made up the CORES system.
3.1.2 Project Summary
There were four work packages in the CORES project WP1 – Air Turbines WP2 – Electrical and Controls WP3 – Moorings, Risers and Deployment WP4 – Modelling, System Integration and Field Trials – Concepts and Objectives During work packages 1, 2 and 3 concepts for various components of floating OWCs were designed, modelled and developed. In work package 4, these components were integrated together on the Ocean Energy Buoy (the OE Buoy) floating OWC platform for three months of sea trials. A flow diagram of the CORES project is shown in Figure 3.1.
Figure 3.1: Flow chart of CORES Project
Design, model and
development of
components by
different partners
Integration and
testing of equipment
at HMRC
Installation of
components on
OE Buoy in
Galway
Dry
Dock
Testing
Sea
Trials
Recovery
and
Decommissioning
Launch
and
Deployment
DATA
INTEGRATION
INTO WAVE TO
WIRE MODEL
Marshal
equipment
to Galway

CORES 213633 – Final Publishable Summary Report
7
3.1.2.1 Installation of components on OE Buoy and Testing
Installation of the components onboard the OE Buoy began in January 2011 at a dock yard storage site in Galway Harbour. This included mounting the new air turbine designed for the CORES project, installing the CORES electrical system, an array of sensors and cameras, the data acquisition system, the mooring data acquisition system and remote access and communications. All of the system was tested in the Galway dock yard to minimise the risks of problems occurring once the OE Buoy was launched at the Galway Bay Intermediate Wave Energy Test Site. Some of the activities undertaken in this period are shown in Figure 3.2 to Figure 3.4.
Figure 3.2: Installation of CORES Air Turbine onboard OE Buoy
Figure 3.3: Testing of air turbine by manually spinning

CORES 213633 – Final Publishable Summary Report
8
Figure 3.4: OE Buoy Control Room fitted out with CORES electrical system
3.1.2.2 Launch and deployment of CORES System onboard OE Buoy
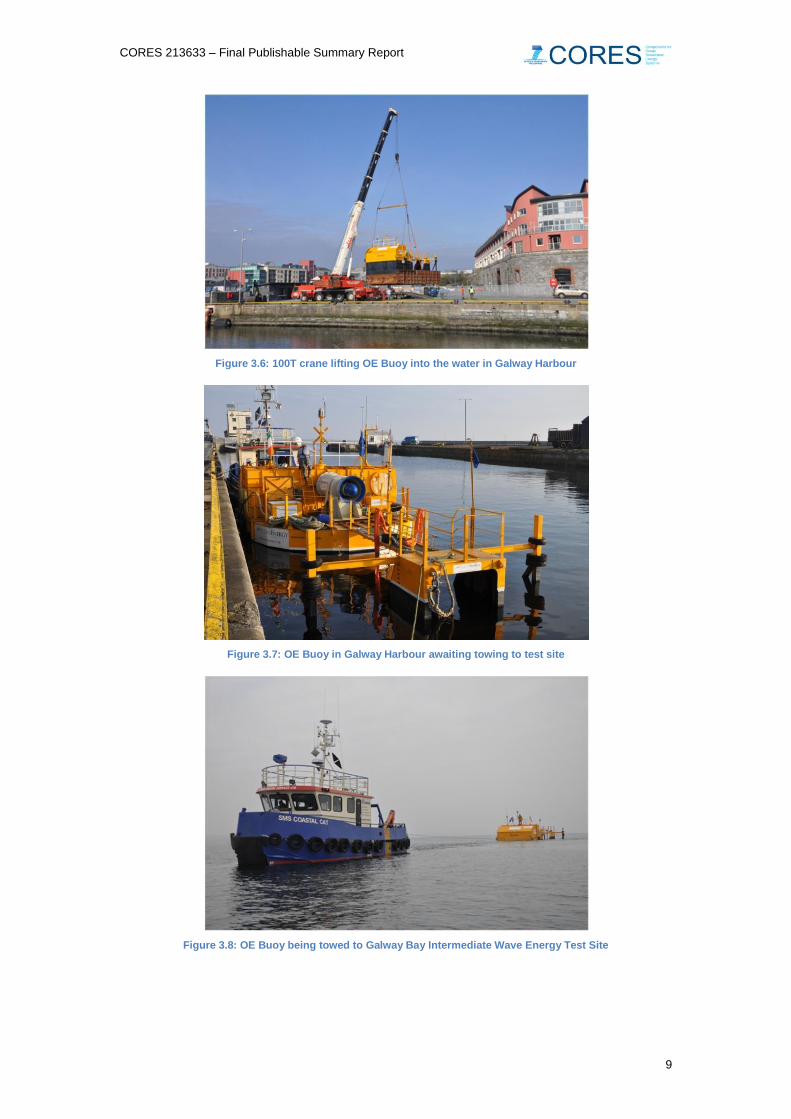
Fit out and testing of the CORES System onboard the OE Buoy was completed by the beginning of March 2011. After this the OE Buoy could be deployed at the Galway Bay Intermediate Wave Energy Test Site. This involved moving the OE Buoy from the Galway Bay dock yard to the launch site in Galway Harbour. Here the OE Buoy was lowered into the water by a 100T crane. From here it was towed to wave energy test site by a tug boat and installed at the test site for testing. This operation is shown in Figure 3.5 to Figure 3.8. The OE Buoy installed at the Galway Bay Intermediate Wave Energy Test Site is shown in Figure 3.9.
Figure 3.5: OE Buoy en route from Galway Bay dock yard to launch site in Galway Harbour
CORES 213633 – Final Publishable Summary Report
9
Figure 3.6: 100T crane lifting OE Buoy into the water in Galway Harbour
Figure 3.7: OE Buoy in Galway Harbour awaiting towing to test site
Figure 3.8: OE Buoy being towed to Galway Bay Intermediate Wave Energy Test Site

CORES 213633 – Final Publishable Summary Report
10
Figure 3.9: OE Buoy installed at Galway Bay Intermediate Wave Energy Test Site
3.1.2.3 CORES Sea Trials
Tests of the CORES system onboard the OE Buoy were undertaken from the beginning of March to the end of May 2011. These test followed a testing programme that had been planned prior to the launch of the OE Buoy. The device experienced a number of storms during the testing period (See Figure 3.10). A full set of data was collected within schedule. This data is now stored in 2 databases and includes the following parameters:
Mooring loads
All air and water pressure sensors
Hull motions
Weather parameters
Island grid electrical characteristics (power consumption, system status, battery state of charge, etc.)
Wave characteristics
Vibration
Temperature in generator, nacelle, guide vanes oil tank and control room
Humidity in control room
Safety parameters in use
Active errors
Figure 3.10: View of the turbine looking towards the bow of the OE Bout during turbine operational period

CORES 213633 – Final Publishable Summary Report
11
Figure 3.11: View of the CORES turbine looking towards the stern of the OE Buoy during turbine operational period
Once the full test programme had been completed the OE Buoy was recovered from the test site and brought back to shore. Components that had been onboard the OE Buoy were recovered. A large amount of data had been collected which required analysis. The main results and foregrounds from the CORES project are given in Section 0.
CORES 213633 – Final Publishable Summary Report
12
3.2 CORES System Description and Results
3.2.1 Introduction
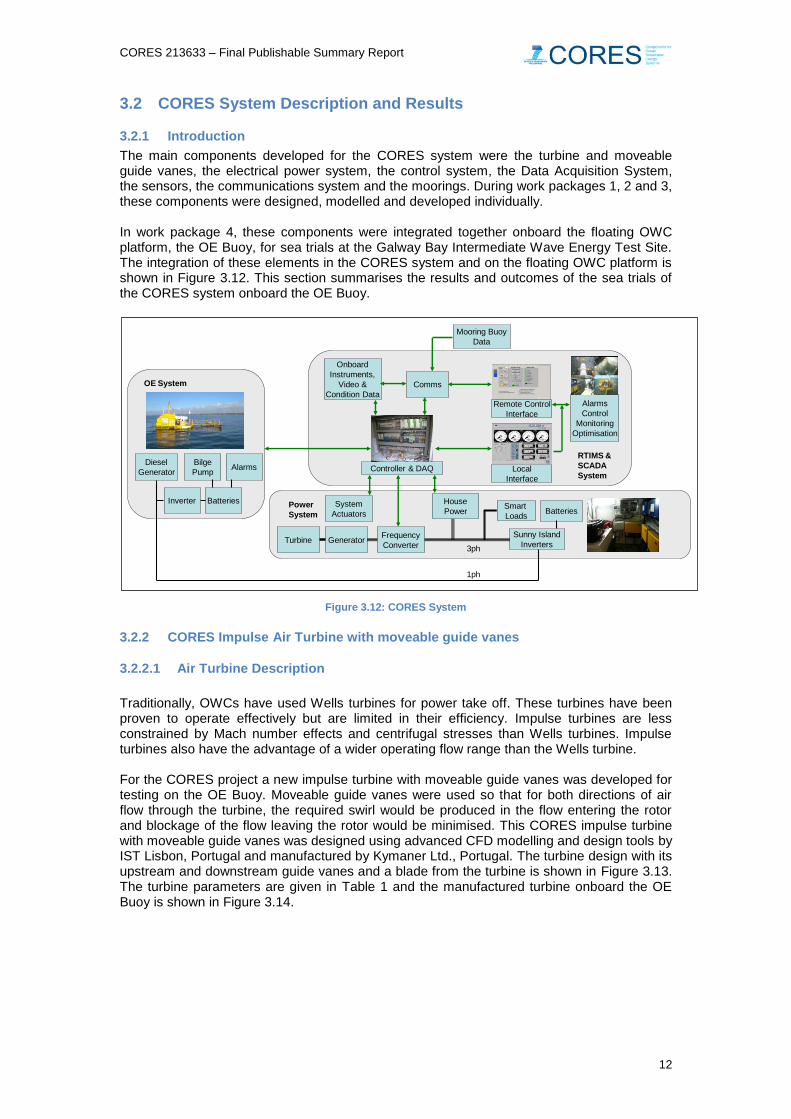
The main components developed for the CORES system were the turbine and moveable guide vanes, the electrical power system, the control system, the Data Acquisition System, the sensors, the communications system and the moorings. During work packages 1, 2 and 3, these components were designed, modelled and developed individually. In work package 4, these components were integrated together onboard the floating OWC platform, the OE Buoy, for sea trials at the Galway Bay Intermediate Wave Energy Test Site. The integration of these elements in the CORES system and on the floating OWC platform is shown in Figure 3.12. This section summarises the results and outcomes of the sea trials of the CORES system onboard the OE Buoy.
Figure 3.12: CORES System
3.2.2 CORES Impulse Air Turbine with moveable guide vanes
3.2.2.1 Air Turbine Description
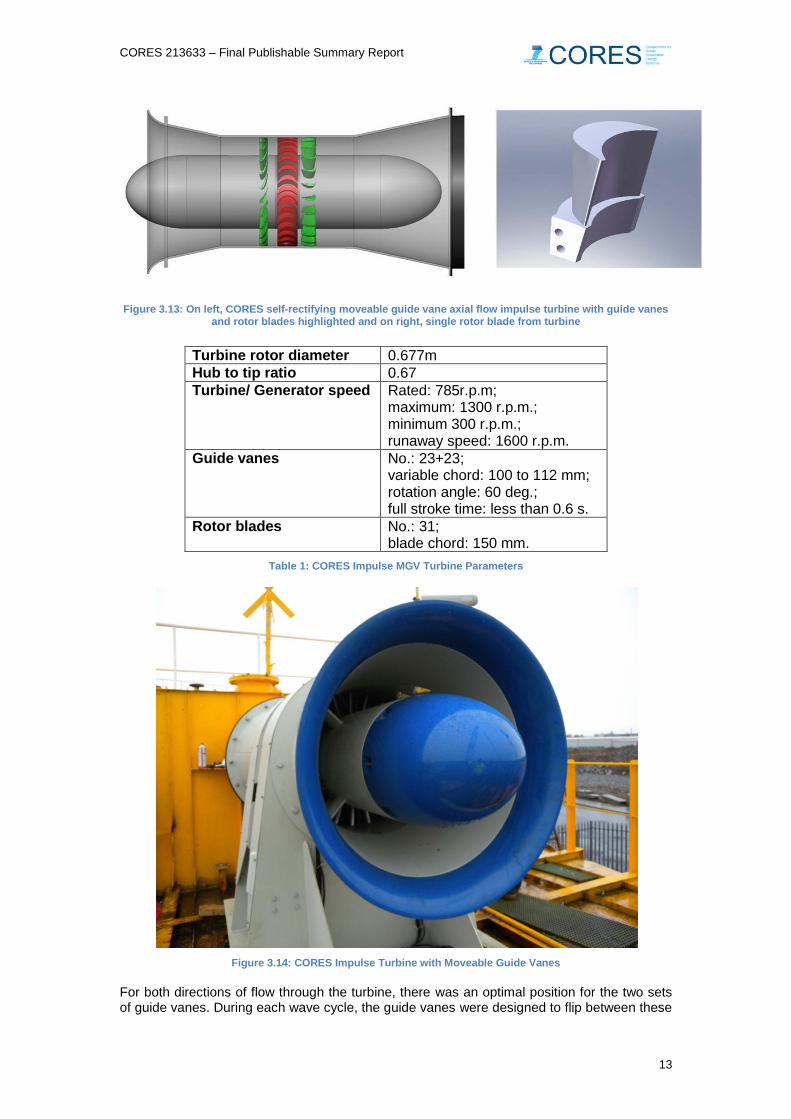
Traditionally, OWCs have used Wells turbines for power take off. These turbines have been proven to operate effectively but are limited in their efficiency. Impulse turbines are less constrained by Mach number effects and centrifugal stresses than Wells turbines. Impulse turbines also have the advantage of a wider operating flow range than the Wells turbine. For the CORES project a new impulse turbine with moveable guide vanes was developed for testing on the OE Buoy. Moveable guide vanes were used so that for both directions of air flow through the turbine, the required swirl would be produced in the flow entering the rotor and blockage of the flow leaving the rotor would be minimised. This CORES impulse turbine with moveable guide vanes was designed using advanced CFD modelling and design tools by IST Lisbon, Portugal and manufactured by Kymaner Ltd., Portugal. The turbine design with its upstream and downstream guide vanes and a blade from the turbine is shown in Figure 3.13. The turbine parameters are given in Table 1 and the manufactured turbine onboard the OE Buoy is shown in Figure 3.14.
Generator
Comms
Frequency
Converter
House
Power
Onboard
Instruments,
Video &
Condition Data
System
Actuators
Alarms
Control
Monitoring
Optimisation
Mooring Buoy
Data
Power
System
RTIMS &
SCADA
System
OE System
Diesel
Generator
Bilge
PumpAlarms Controller & DAQ
Batteries
Sunny Island
Inverters
Smart
Loads
Local
Interface
Remote Control
Interface
Inverter Batteries
1ph
3phTurbine
CORES 213633 – Final Publishable Summary Report
13
Figure 3.13: On left, CORES self-rectifying moveable guide vane axial flow impulse turbine with guide vanes and rotor blades highlighted and on right, single rotor blade from turbine
Turbine rotor diameter 0.677m
Hub to tip ratio 0.67
Turbine/ Generator speed Rated: 785r.p.m; maximum: 1300 r.p.m.; minimum 300 r.p.m.; runaway speed: 1600 r.p.m.
Guide vanes No.: 23+23; variable chord: 100 to 112 mm; rotation angle: 60 deg.; full stroke time: less than 0.6 s.
Rotor blades No.: 31; blade chord: 150 mm.
Table 1: CORES Impulse MGV Turbine Parameters
Figure 3.14: CORES Impulse Turbine with Moveable Guide Vanes
For both directions of flow through the turbine, there was an optimal position for the two sets of guide vanes. During each wave cycle, the guide vanes were designed to flip between these
CORES 213633 – Final Publishable Summary Report
14
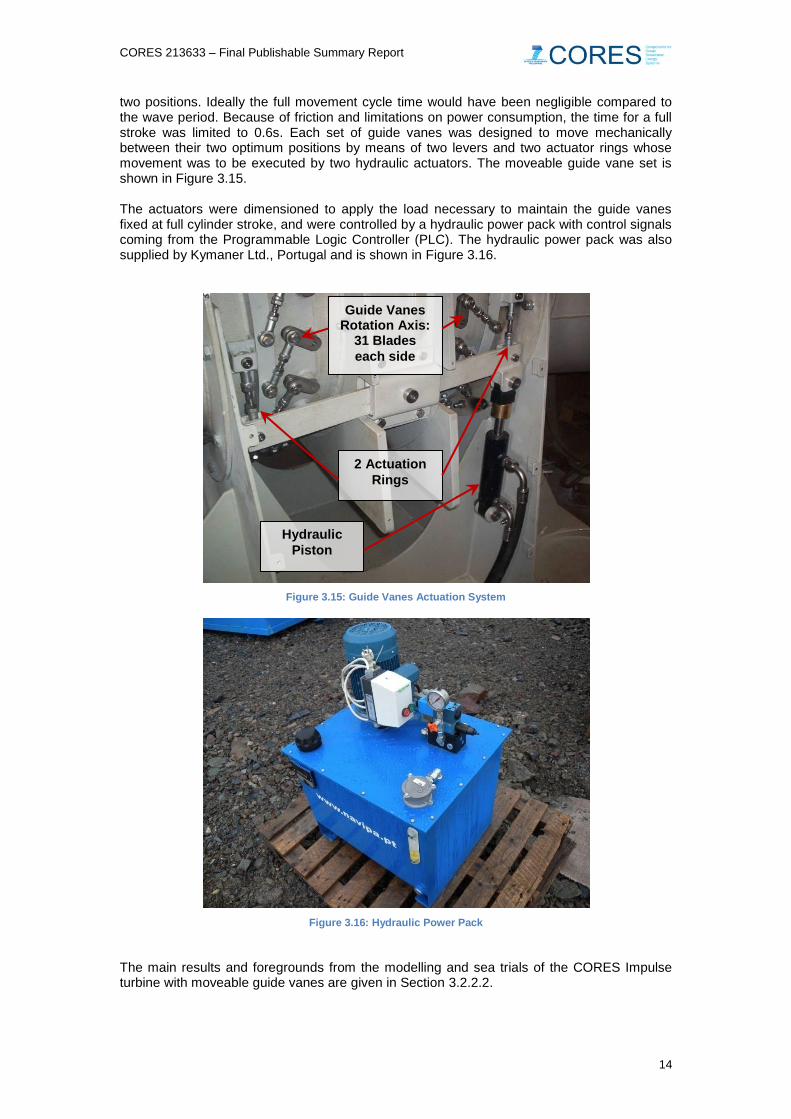
two positions. Ideally the full movement cycle time would have been negligible compared to the wave period. Because of friction and limitations on power consumption, the time for a full stroke was limited to 0.6s. Each set of guide vanes was designed to move mechanically between their two optimum positions by means of two levers and two actuator rings whose movement was to be executed by two hydraulic actuators. The moveable guide vane set is shown in Figure 3.15. The actuators were dimensioned to apply the load necessary to maintain the guide vanes fixed at full cylinder stroke, and were controlled by a hydraulic power pack with control signals coming from the Programmable Logic Controller (PLC). The hydraulic power pack was also supplied by Kymaner Ltd., Portugal and is shown in Figure 3.16.
Figure 3.15: Guide Vanes Actuation System
Figure 3.16: Hydraulic Power Pack
The main results and foregrounds from the modelling and sea trials of the CORES Impulse turbine with moveable guide vanes are given in Section 3.2.2.2.
2 Actuation
Rings
Guide Vanes Rotation Axis:
31 Blades
each side
Hydraulic
Piston

CORES 213633 – Final Publishable Summary Report
15
3.2.2.2 Air Turbine Results and Foregrounds
The turbine and guide vane system was mechanically well designed, robust and stood up well to three months of sea trials. The guide vanes worked well mechanically throughout the deployment and moved all the time as per their design. Performance data from the turbine during the sea trials was compared with that predicted from lab test results of a 0.6m diameter model of the turbine at IST in Portugal. The comparison of turbine efficiency is shown in Figure 3.17.
Figure 3.17: Averaged turbine efficiency versus rms flow rate coefficient calculated from model testing at IST turbine test rig and measured at OE Buoy sea trials at Galway Bay.
Figure 3.17 shows that the sea trials of the CORES impulse turbine exceeded expectations. The turbine tested at sea was slightly more efficient than that predicted by model testing, especially for higher rotational speeds. In fact the CORES produced the most efficient air turbine to date with average cycle efficiencies up to 65%. The peak efficiency of the impulse turbine tested is similar to a Wells turbine but the efficiency improves in higher flow coefficients. The average power output is therefore significantly higher. It also has the advantage of being self starting. One issue with the turbine and guide vane design was the large power consumption of the hydraulic guide vanes. The power required to move the guide vanes (2.2kW) was very high in comparison with the rating of the turbine (13kW). The result of this was that even during times of generation by the turbine, the onboard diesel generator was required to run to power onboard auxiliary systems and charge the batteries. This resulted in a high run time of the onboard diesel generator. This however does not rule out the use of hydraulics or other system to control guide vanes for future OWCs, given the high improvement in turbine efficiency. Optimisation can be done on the guide vanes control system to reduce power consumption and the power requirement does not scale with other parameters for a full scale device

CORES 213633 – Final Publishable Summary Report
16
3.2.3 Electrical Power System
3.2.3.1 Electrical Power System Description
The design process of the electrical system for the OWC was driven by two major requirements of the OWC test plant. The first requirement was to design a generator system, which met both the characteristics of the turbine (rated speed, power, etc.) and to fulfil general criteria such as high full and part load efficiency, low cost, high reliability etc. The second requirement arose from the decision to install a 3- phase on-board grid on the buoy, which controlled the energy flux of the system and simulated a normal grid connection, enabling the generator system to be operated and tested, as if it were connected to a normal local grid. Furthermore there was a requirement to provide on-board power to the control and communications system and to safety-critical loads such as bilge pumps during periods with low sea states or during maintenance. The CORES electrical power system that was designed is depicted in Figure 3.18.
Figure 3.18: CORES Electrical Power System
The generator chosen for the OWC turbine was an 8-pole marinised asynchronous generator with a rated speed of 769 rpm and a power rating of 11kW. To maximise power output in different sea states, variable speed operation was allowed by using a standard back-to-back frequency converter which matched the power characteristics of the generator. The island grid was created by inverters from the 24V backup batteries. The grid side of the frequency converter synchronised to the island grid.
In case of extended periods with low production, it was planned to use the diesel generator onboard the OE Buoy to recharge the batteries. In the opposite situation, when the power production was high and the batteries were fully charged, the excess power would be dissipated in a controllable dump load. As there was to be no direct communication between the island grid inverters and the dump load, the island grid inverters were to control the intelligent dump loads by increasing the grid frequency – the grid frequency would be continuously evaluated by the dump loads, and loading power increase in proportion to grid frequency.
3.2.3.2 Electrical Power System Results and Foregrounds
The main components (generator and 3 phase grid) of the electrical system worked well throughout the sea trials. It was fully adapted for the requirement of the tests and accessible remotely when power was available. The only major problem with the CORES electrical system was the repeated failure of the OE Buoy onboard diesel generator. This caused a number of interruptions to the sea trials of the CORES system. The diesel generator failed repeatedly because it was pushed beyond the limits of its operational capacity during sea trials. There are a number of reasons for this:
Due to the limited amount of time available for the sea trials (3 months) and the desire to get as much data as possible during this time, the CORES system was required to operate in sea states above a low threshold (Hs > 0.8m). There was not much power available to the turbine when running in such low sea states and so the

CORES 213633 – Final Publishable Summary Report
17
turbine was not always able to recharge the batteries in the CORES grid when generating.
The power requirement to move the hydraulic guide vanes (2.2kW) was large in comparison with the turbine rating (13kW). Once this requirement plus the other auxiliary power requirements were met (e.g. cameras, PLC etc), the power generated by the turbine was generally not enough to charge the batteries in the 3 phase grid.
3.2.4 Control System
3.2.4.1 Control System Description
3.2.4.1.1 Generator control
The generator control algorithms set the generator torque and speed references. These controllers were dependent on the turbine power take-off characteristics. Therefore specific control laws to maximize the turbine energy production were developed in the project. The control laws were programmed into the PLC state machine in order to calculate at each sample time the desired torque reference to be sent to the generator. Five different control laws were implemented. These control laws could be classified into two groups, one controlling the generator speed and one controlling the torque. Two control laws controlled the turbine speed by using a feedback loop on the speed value. A proportional controller and a proportional-integral (PI) controller with anti-windup were used. These control laws allowed the turbine speed to be controlled to a constant value, both with and without motoring action from the generator. Therefore, it was possible to measure the power generated by the turbine as a function of the sea conditions at a given speed. These control laws were useful for analysis of the turbine behaviour and comparison with the lab tests. Three other control laws control the torque; see Equation (1), Equation (2) and Equation (3). As a consequence of the reference torque variations the turbine speed was also to vary according to the sea conditions and the efficiency of the turbine improve.
)(:)3(
:)2(
:)1(
4433
2
32
3
31
2423
2
22
3
21
1413
2
12
3
11
chchchchchref
chchchref
ref
PPKPKPKPKTEquation
KPKPKPKTEquation
KnKnKnKTEquation
In Equation (1) the torque reference is calculated as a function of the turbine speed (n). The turbine speed increases as the power captured by the turbine increases and vice versa. The amplitude of the speed excursions depend on the turbine inertia. In Equation (2) the torque reference is a function of the mean chamber pressure. This control law results in a quasi-constant torque reference which slowly changes as the mean chamber pressure changes. The rapid fluctuations in power capture are momentarily stored in turbine inertia. The control law in Equation (3) includes the difference between mean and instantaneous chamber pressure as an additional term. This tends to increase the torque reference during pressure peaks and reduces it during pressure troughs. The net effect was intended to reduce the turbine speed excursions compared to Equation (2). The coefficients for these control laws were calculated in order to maximize the turbine energy production over all the possible sea states. These coefficients were calculated through simulations over sea states appropriate to the location using a Simulink model with pneumatic data from tank testing and turbine characteristics from laboratory testing. The control laws are described below:

CORES 213633 – Final Publishable Summary Report
18
CORES Control Laws
No. Description
1 Controls torque as a function of speed
2 Controls torque as a function of 10minute mean chamber pressure
3 Control Law 2 with the addition of feed forward signal
4 Proportional Speed Control with no motoring torque allowed
5 Proportional-Integral speed control including anti-wind-up with no motoring torque allowed
6 Speed control with motoring torque allowed
3.2.4.1.2 System Supervisory Control
In order to implement supervisory control of the PTO, the state machine represented in Table 2 was implemented in the PLC controller. The low and high priority error given in the table corresponds to the level of emergency. For low priority errors, it was designed that there was no emergency and the system was to go to a normal shut down, state S5. For high priority errors, there was a risk of rapid damage of a component (high speed, vibration, etc.), hence the system needed to stop immediately and it was designed that the brake would be directly applied, state S6. In both cases, once the turbine was stopped, the state machine was designed to go back to the state S2 and wait for a reset command.
Current state Actions Transition conditions to other states:
S1 Boot System initialisation, all equipment in stand-by position
To S2: Boot time elapsed
S2 Standby Turbine brake applied PTO and Guide vanes control OFF
To S3: Standby time elapsed and mean chamber pressure > lower limit
S3 Run-Up Run Up algorithm, release brake and switching on equipment
To S4: turbine speed > production speed limit To S5: Low priority error To S6: High priority error
S4 Normal operation
Production mode following turbine control algorithm.
To S5: Low priority error To S5: Turbine speed < limit T0 S5: Chamber pressure > higher limit To S6: high priority error
S5 Run down Controlled run down algorithm To S6: high priority error To S6: turbine speed < braking limit
S6 Brake Apply brake to the turbine To S2: turbine speed < standby
Table 2: States used in PLC State Machine
A general scheme of the control hardware can be seen in Figure 3.19. All of the data collected from the different sensors were fed into a PLC by means of several analogue input terminals. The PLC read this data and executed a state machine that handled the possible situations and controlled the system through digital or analogue outputs signals.

CORES 213633 – Final Publishable Summary Report
19
Figure 3.19: Plant control system layout
3.2.4.2 Control System Results and Foregrounds
The control algorithm was well thought out and performed exceptionally well. It was designed by 3 teams (UCC, Tecnalia, IWES) which had its difficulties but overall was very positive as different perspectives were brought to play. A wide range of control algorithm options were built into the code. This proved very useful in the testing phase as it maximised the value of the test program. This was an improvement on the previous OE Buoy sea trials. The tests gave more understanding on the controls strategy of an impulse turbine that give at the same time a high efficiency, a reduced fluctuation of the power output and a higher protection of the power take off from over speeding. Control algorithms giving an averaged power output had a good behaviour until a high wave series created over speeding. Fixed speed tests were safe but created a high fluctuation in power production.
3.2.5 Sensors and Cameras
3.2.5.1 Sensors and Cameras Description
A large array of sensors were required to measure the electrical parameters of the generator, hydraulic and pneumatic parameters in the chamber and duct, environmental parameters and electrical system parameters. This was to allow for the measurement and comparison of the power characteristics of the complete power chain from the water column to the grid. It was also to monitor the safe operation of the device. The locations of the sensors are shown in Figure 3.20. Four cameras were also required to allow remote visuals of the OWC water chamber, the control room, the turbine and the stern of the OE Buoy. The view from these cameras during the sea trials is shown in Figure 3.21.
Control Hardware PLC
Analog/ digital signal from sensors
Control Software:•State machine•Error handler•Speed control laws
Converter control signals and torque reference
Grid Generator
Brake control signalsGuide vanes

CORES 213633 – Final Publishable Summary Report
20
Figure 3.20: Locations of the sensors used during the CORES sea trials
Figure 3.21: View from cameras onboard OE Buoy during CORES sea trials
3.2.5.2 Sensors and Cameras Results
The choice of sensors for the CORES sea trials ensured that a comprehensive and validated set of data was collected from the sea trials. The sensors also allowed real time monitoring of the device and components to ensure that they were operating safely which helped protect them. These considerations are important in the choice of sensors for any sea trials. Redundancy of sensors proved to be very important. During the testing one of the speed sensors lost track but the second sensor was still able to provide protection to the turbine. For future sea trials of similar systems, a brake temperature sensor and a pressure sensor in the hydraulic system would have been useful.
1
3 Underwater Pressure Sensors in Oscillating Water Chamber
Weather Station
2 Air Pressure Sensors in Chamber
Hull Motion Centre near Centre of Gravity
Mooring Load
Mooring Load
Sensors in Duct : See below
Atmosphere Chamber
Sensors in Duct:•4 x Differential Pressure Transducers (PTD)•Turbine Speed and Vibration•Guide Vane Position Sensors•Generator Rotation and TemperaturePTD01 PTD02PTD04 PTD03
Generator Guide Vanes
CORES 213633 – Final Publishable Summary Report
21
3.2.6 Remote Control and Communications
3.2.6.1 Remote Control and Communications Description
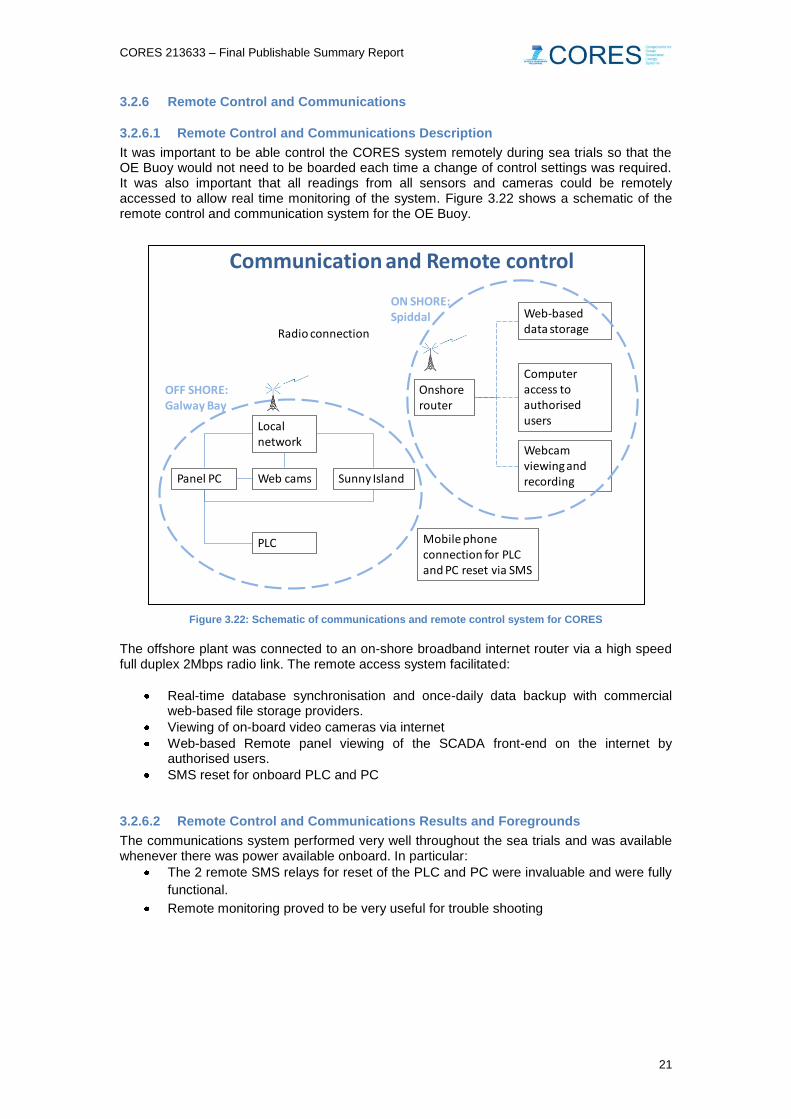
It was important to be able control the CORES system remotely during sea trials so that the OE Buoy would not need to be boarded each time a change of control settings was required. It was also important that all readings from all sensors and cameras could be remotely accessed to allow real time monitoring of the system. Figure 3.22 shows a schematic of the remote control and communication system for the OE Buoy.
Figure 3.22: Schematic of communications and remote control system for CORES
The offshore plant was connected to an on-shore broadband internet router via a high speed full duplex 2Mbps radio link. The remote access system facilitated:
Real-time database synchronisation and once-daily data backup with commercial web-based file storage providers.
Viewing of on-board video cameras via internet
Web-based Remote panel viewing of the SCADA front-end on the internet by authorised users.
SMS reset for onboard PLC and PC
3.2.6.2 Remote Control and Communications Results and Foregrounds
The communications system performed very well throughout the sea trials and was available whenever there was power available onboard. In particular:
The 2 remote SMS relays for reset of the PLC and PC were invaluable and were fully
functional.
Remote monitoring proved to be very useful for trouble shooting
Communication and Remote control
18
Panel PC Web cams Sunny Island
Local network
Radio connection
Onshore router
Web-based data storage
Computer access to authorised users
Webcam viewing and recording
OFF SHORE:Galway Bay
ON SHORE:Spiddal
PLC Mobile phone connection for PLC and PC reset via SMS

CORES 213633 – Final Publishable Summary Report
22
3.2.7 Moorings
3.2.7.1 Moorings Description
The mooring system and the power umbilical can have considerable effect on the overall cost of any proposed wave farm. The CORES project aimed to produce improved design methods and an improved design for moorings systems and umbilicals. This was to reduce the uncertainty in their design and to reduce their overall cost. Numerical methods and physical modelling were used to provide a design for these systems. Physical modelling was done through 2D tests in Bologna and 3D tests in HMRC. Results of this testing were then to be validated using a new mooring buoy design, attached to the OE Buoy, with mooring load shackles at the Galway Bay Intermediate Wave Energy Test Site. The deployment of this mooring buoy is shown in Figure 3.23.
Figure 3.23: Mooring Buoy being deployed at Galway Bay Test Site
as to how current design methods should be applied. This is a key block to reducing capital and operating costs. The strategic objective to reduce cost of production was achieved with the Work Package’s principle aimed to minimize and quantify where possible these uncertainties.
3.2.7.2 Moorings Results and Foregrounds
The main results of the moorings work package were to reduce technical uncertainty in moorings. This has been done by improving design methods, development of new mooring and umbilical system and physical modelling and sea trials of new mooring components. Verification of design data with field data during the CORES project has resulted in greater certainty in the engineering science to reduce the need for large factors of safety, making the systems more cost effective.
CORES 213633 – Final Publishable Summary Report
23
3.3 Deployment and Sea Trials Results and Foregrounds
3.3.1 Introduction
There were a number of elements which made the integration of the CORES system on the OE Buoy and the deployment of the OE Buoy with the CORES system onboard a very challenging project. The main challenges were:
There have been relatively few real sea trials of wave energy devices and even fewer successful real sea trials of wave energy devices. There is still limited ‘best practice’ or examples to follow when deploying devices for testing. This leaves a lot of potential for pitfalls.
The CORES project brought together 13 partners from across the EU. The different partners were responsible for different elements of the CORES system design. Each of these elements had to be integrated so that they would all work together in the CORES system on the OE Buoy during deployment at sea.
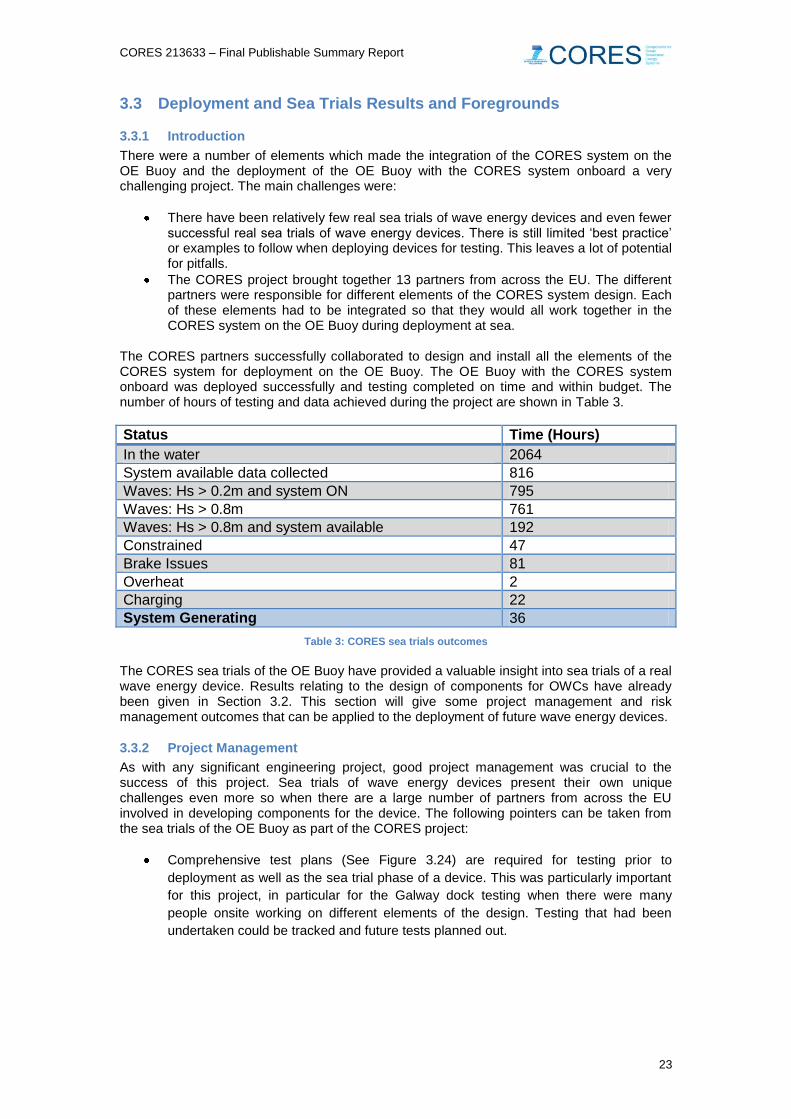
The CORES partners successfully collaborated to design and install all the elements of the CORES system for deployment on the OE Buoy. The OE Buoy with the CORES system onboard was deployed successfully and testing completed on time and within budget. The number of hours of testing and data achieved during the project are shown in Table 3.
Status Time (Hours)
In the water 2064
System available data collected 816
Waves: Hs > 0.2m and system ON 795
Waves: Hs > 0.8m 761
Waves: Hs > 0.8m and system available 192
Constrained 47
Brake Issues 81
Overheat 2
Charging 22
System Generating 36
Table 3: CORES sea trials outcomes
The CORES sea trials of the OE Buoy have provided a valuable insight into sea trials of a real wave energy device. Results relating to the design of components for OWCs have already been given in Section 3.2. This section will give some project management and risk management outcomes that can be applied to the deployment of future wave energy devices.
3.3.2 Project Management
As with any significant engineering project, good project management was crucial to the success of this project. Sea trials of wave energy devices present their own unique challenges even more so when there are a large number of partners from across the EU involved in developing components for the device. The following pointers can be taken from the sea trials of the OE Buoy as part of the CORES project:
Comprehensive test plans (See Figure 3.24) are required for testing prior to
deployment as well as the sea trial phase of a device. This was particularly important
for this project, in particular for the Galway dock testing when there were many
people onsite working on different elements of the design. Testing that had been
undertaken could be tracked and future tests planned out.

CORES 213633 – Final Publishable Summary Report
24
Figure 3.24: CORES testing plans for Galway docks and offshore testing
All equipment was marshalled successfully at Galway for installation on the buoy.
Thorough planning was required to make this happen because a large amount of
equipment (mechanical, electrical, sensors, DAQ etc.) needed to arrive in Galway
within a short time period.
The wired up portacabin at the dock yard in Galway provided an important base
during installation and testing of the CORES components on the OE Buoy. This
phase of the project involved long days on site during which the portacabin was able
to provide an internet connection and phone charging facilities to maintain
communications and an area on site to plan and review work.
The launch of the OE Buoy, towing it to the Galway Bay test site and installing it and
the subsequent recovery were difficult tasks. The previous experience and knowledge
that OE Ltd. had of Galway Bay were invaluable to ensuring that these tasks were
completed without any problems. In addition, Galway Harbour had a good supply of
lifting equipment that may not be available in other harbours.
The knowledge of OE Ltd. of the sea conditions in Galway Bay were valuable in
ensuring that all trips to the OE Buoy were completed safely. Project safety was also
helped by the provision of sea survival training to members of HMRC staff involved in
visits to the test site.
The Galway Bay test site is relatively conveniently located in comparison to some
other test sites. Difficulties that were not encountered there may be encountered at
more isolated test sites like Belmullet where electrical supplies and accommodation
may not be as readily available and weather windows for deployment and access to
devices may be shorter.
HMRC, QUB and Fh-IWES staff were willing to work through the night, work long
days and be on phone standby at different stages during the sea trials. HMRC staff
and Cuan were willing to travel to Galway at short notice in order to rectify problems
that occurred during the sea trials.
During the sea trials, a plan and rota was required for the monitoring of the device
within HMRC and with Fh-IWES and QUB. This monitoring plan worked very well, in
particular during periods when 24 hour monitoring was required.
Certain aspects of the CORES project management could have been improved and the following should be considered for future sea trials of wave energy devices:

CORES 213633 – Final Publishable Summary Report
25
With so many partners involved and with those working on the project so busy at
certain times, it was at times difficult to keep all partners up to date with the progress
of the project and to share data with all partners. A public HMI that all users would
have access to without disrupting those monitoring the buoy would have been a
useful addition.
While using OE to arrange boat trips to the test site was good in terms of safety and
their local knowledge, at times it left HMRC unable to get out to the test site when it
was required by them. This may have been overcome if another local boat could have
been used for some of the boat trips.
During the dockside testing period, overall project management was difficult at certain
times when there were large numbers of people on site from different project
partners, many of who were undertaking different tasks. This may have led to delays
at times (e.g. when external hydraulic consultants were onsite to deal with the
hydraulic power pack issues). The delegation of an overall project manager may have
helped during the onshore installation and testing even though this may have been
difficult given the wide range of partners and tasks involved.
There were constraints on the launch and tow-out times at Galway Harbour as the
gates can only be opened at high tide level. These constraints had to be kept in mind
when looking at weather windows suitable for towing out in Galway. There were also
constraints on the tow-out date due to the availability of tug boats suitable for towing
the device. This equipment needs to be arranged well in advance and influences
deadlines for work necessary prior to device deployment.
3.3.3 Risk Management
3.3.3.1 Introduction
Due to the hostile nature of the environment that WECs are designed to operate in, there is lots of potential for problems occurring during a three month sea trial, many of which can be terminal for the project. The chances of such problems occurring during sea trials can be greatly reduced by risk management and planning. Apart from the onboard diesel generator and the turbine brake, the CORES system survived the hostile environment and functioned as planned during the sea trials. This was done by identifying areas where there was a risk of problems occurring offshore. This risk of the potential problem occurring was then mitigated or the impact of the potential problem reduced. Areas where this was done are described in the rest of this section.
3.3.3.2 Floating OWC Hull
As with all vessels deployed at sea, there was a risk of water breach which could have resulted in damage or loss of the equipment onboard the device or sinking of the device. Under Marine Institute rules the hull had to be inspected for sea worthiness to be allowed to be deployed at the Galway Bay test site. The inspection deemed the hull worthy to be deployed. A bilge pump had been installed as part of the original trials of the OE Buoy as the first line of defence against leaks. A bilge alarm was continuously monitored for water ingress and leaks or changes in draft could also have been spotted using the webcams. This meant it was possible to react to leaks in the hull at the earliest possible opportunity.
3.3.3.3 Turbine
Damage to the turbine would have been very difficult or impossible to rectify once the OE Buoy had been deployed. Problems that could have resulted in significant damage to the turbine included over speed or bearing failure. To mitigate this, a large margin of safety was incorporated into the turbine’s design. The hydraulic guide vane system was also designed for robustness. Vibration sensors and speed sensors, including redundant sensors were installed in the turbine to continuously monitor its operation. A detailed testing plan for the

CORES 213633 – Final Publishable Summary Report
26
turbine and guide vanes was implemented onshore prior to deployment so that potential problems could be flagged and rectified. The area that was most overlooked in the turbine risk assessment was the design of the brake which was the only element of the turbine that caused problems once the sea trials commenced.
3.3.3.4 Electrical System
The electrical system (the generator and onboard 3 phase grid) had to be designed to be robust and reliable so that the turbine test plan could be run when required and to provide auxiliary power onboard (control, communications, bilge pump etc.). A robust induction generator was chosen for the sea trials. The 3-phase grid was thoroughly tested prior to being installed on the OE Buoy and a thorough test plan was implemented once it was installed on the OE Buoy at the Galway dock yard. There were minimal problems with the electrical system during testing apart from with the onboard diesel generator which was the only part of the electrical system which had not been subject to thorough testing prior to deployment.
3.3.3.5 Sensors
Loss of individual sensors during sea trials would not be terminal for WEC sea trials. However, the loss could result in incomplete and unsatisfactory data sets. Loss of other sensors could result in the risk of damage to certain components (e.g. turbine speed sensors). Due to their location most of the sensors used in this project could not have been replaced once the OE Buoy was launched. To mitigate this, there was multiple redundancy in the sensors to reduce the impact of problems with individual ones. This also validated readings for individual sensors.

CORES 213633 – Final Publishable Summary Report
27
4 Potential impact, main dissemination activities, exploitation of results
4.1 Potential impact
4.1.1 Background
The publication in 2006 of the Green Paper on the EU Strategy for a Sustainable and Secure Energy Supply increased targets for renewable energy above that laid down in the Renewable Energy Directive 2001/77. The new Energy and Climate Change Package announced after the January Council meeting in 2007 introduced even more ambitious targets, with 20% of energy supply from renewables projected by the year 2020. Renewable energy development has a direct relevance at the European level to the commitment for reducing the emissions levels imposed under the Kyoto Treaty and the January 2007 Council also committed to a target of 20% reduction in CO2 emissions by 2020. Estimates show that there could also be a requirement for an investment of up to €20 billion in new electricity generation plant by the year 2020 to satisfy the projections in consumption. The resource available for wave power convertors in Europe is large and therefore not a barrier to potential development. It has been estimated that the total wave energy resource for all European coastlines is around 1000 TWh per annum. In view of the White Paper projections for other Renewable Energy Technologies and the time scales involved it might be reasonable to set a target for installed ocean energy systems to be 2,000 MW by 2020. This represents only about 15% of the practical resource available. For comparison, the Irish Government recently published an Energy White Paper setting a target of 500 MW by 2020 for Ocean energy systems. All EU members now have submitted their National Renewable Energy Action Plans (NREAPs) and these in most cases include firm commitments to ocean energy generation. The main barriers to this development are still related to the cost and reliability of wave energy convertors. Very few full scale devices have been tested at sea for any length of time and no commercial machines are available at this time for grid based electricity production. If ocean energy is to make a significant contribution to the renewable energy targets these barriers must be removed or the associated risks reduced. A number of device concepts are under Demonstration or Development at this time with support from the European Commission. There are however, a significant number of uncertainties associated with the assessment of performance of these systems. If they are to evolve into fully commercial products then they must be adapted to become capable of mass production and be site independent. These products must be cost competitive and the direct impact of this project will be in the area of lower costs and risk reduction.
4.1.2 Impact Summary
The project has been focused and planned around the impacts that it will deliver related specifically to the context of the Call Work Programme. This focus is applied right across the project, from the integrated output of all work packages, to the smallest of sub-tasks. The focus is to
Improve the cost competitiveness of ocean energy
Reduce risks, both technical and non-technical for deployment in the marine environment

CORES 213633 – Final Publishable Summary Report
28
This will be done through a process of design, modelling, testing and validation in real conditions. The outcomes will be directly applicable across the entire ocean energy industry and will be relevant due to developer involvement. Risk and cost reduction will come via
Better models for understanding systems
Better methods from design stage through to deployment
Better materials and manufacturing processes
Better instruments and data acquisition
Better techniques for analysis and interpretation
Validation and verification through a series of real world trials in the marine environment
As has been shown throughout this project, the expertise to achieve such relevant impacts is found in specialist knowledge centres throughout the European Community. The consortium was chosen for its diverse range of complementary expertise and past experience because the very nature of an ocean energy project is multidisciplinary. The skills were found in various sectors and no single country had the required mix of high level expertise in order to meet the demanding requirements of the expected impacts. Each partner in the consortium was chosen for their track record and expertise in their respective disciplines. This project leveraged extra value from these partners as their expertise has been built through their own national research programs and international collaborations. Each partner was also current and up to date in their discipline (mainly because they are leading the field) so that the impact of the project will be relevant.
4.2 Impact of Work Packages
4.2.1 WP1 Impact – Air Turbines
In an oscillating water column system, the Air Turbine is the primary element in the power conversion chain. If the turbine is not correctly matched to the chamber or to the electrical machine then the overall power conversion efficiency will suffer. A number of benefits will come from the work package whose impacts will either reduce cost, risk or both. These are shown
Improvement of average efficiency over conventional designs leading to lower cost/kwh. In fact the CORES produced the most efficient air turbine to date with average cycle efficiencies up to 65% when tested in both laboratory and real world conditions. This is shown in Figure 4.1.

CORES 213633 – Final Publishable Summary Report
29
Figure 4.1: Average efficiency of CORES air turbine
Testing and validation of mechanical design methods leading to reduced risk. Again, the methodology shown below combined with the results above confirms the validation of the mechanical design and test methodology.
Figure 4.2: Design methodology for reduced risk
New concepts in design consideration including gyroscopic loading and noise fingerprint.
Creation and validation of time domain models. This was done both in wave to wire modelling and in the Hardware-in-the-loop testing at HMRC and Tecnalia in order to test the control systems before deployment at sea.
CORES 213633 – Final Publishable Summary Report
30
Figure 4.3
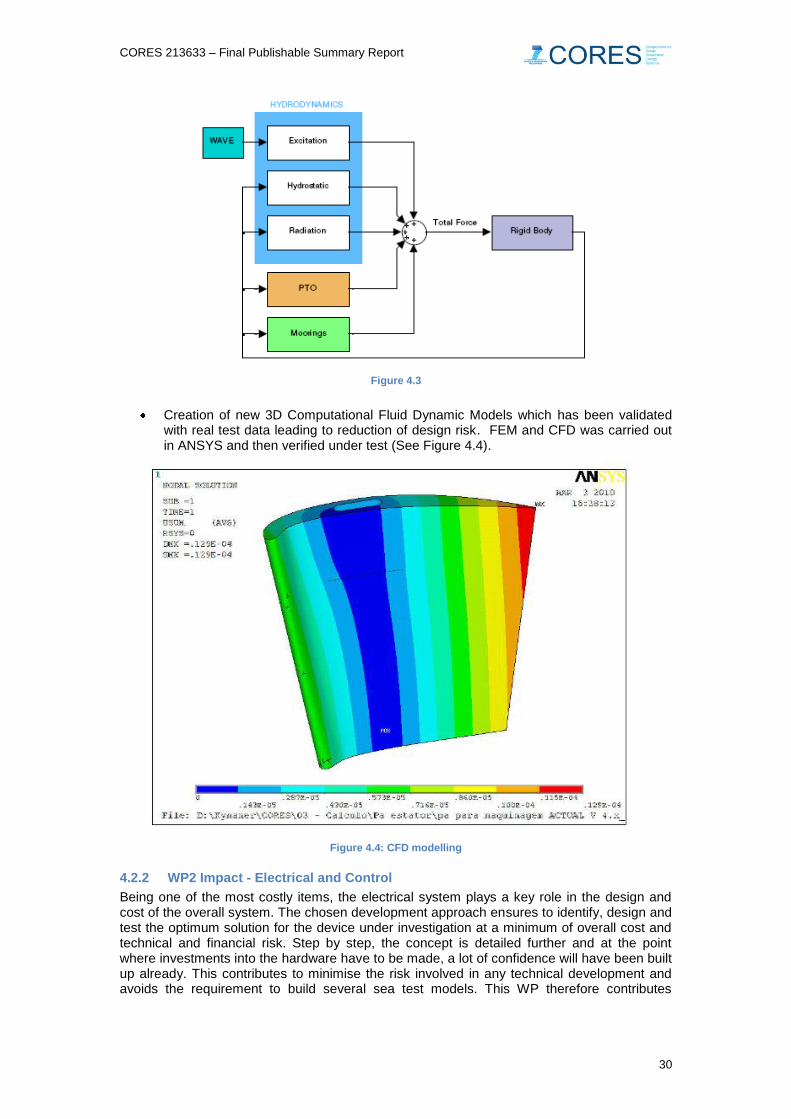
Creation of new 3D Computational Fluid Dynamic Models which has been validated with real test data leading to reduction of design risk. FEM and CFD was carried out in ANSYS and then verified under test (See Figure 4.4).
Figure 4.4: CFD modelling
4.2.2 WP2 Impact - Electrical and Control
Being one of the most costly items, the electrical system plays a key role in the design and cost of the overall system. The chosen development approach ensures to identify, design and test the optimum solution for the device under investigation at a minimum of overall cost and technical and financial risk. Step by step, the concept is detailed further and at the point where investments into the hardware have to be made, a lot of confidence will have been built up already. This contributes to minimise the risk involved in any technical development and avoids the requirement to build several sea test models. This WP therefore contributes
CORES 213633 – Final Publishable Summary Report
31
significantly to reduce the technical and non-technical risks associated with deployment in the marine environment.
Development of appropriate control algorithms also benefits system performance. These benefits are listed below. Each one of these benefits either reduces cost, risk or both
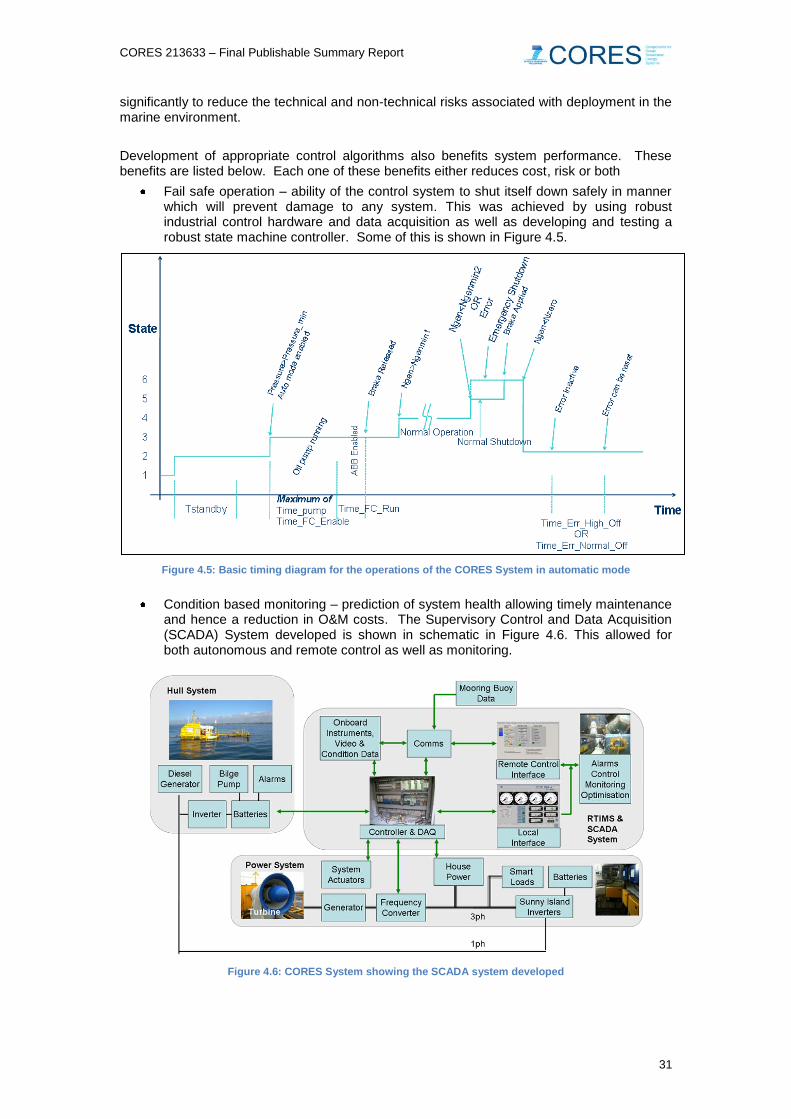
Fail safe operation – ability of the control system to shut itself down safely in manner which will prevent damage to any system. This was achieved by using robust industrial control hardware and data acquisition as well as developing and testing a robust state machine controller. Some of this is shown in Figure 4.5.
Figure 4.5: Basic timing diagram for the operations of the CORES System in automatic mode
Condition based monitoring – prediction of system health allowing timely maintenance and hence a reduction in O&M costs. The Supervisory Control and Data Acquisition (SCADA) System developed is shown in schematic in Figure 4.6. This allowed for both autonomous and remote control as well as monitoring.
Figure 4.6: CORES System showing the SCADA system developed

CORES 213633 – Final Publishable Summary Report
32
Predictability – Control algorithms can take current and past data along with forecast information to accurately predict output. This was done in the wave to wire modelling but Hardware-in-the-loop testing also proved useful. This is shown in Figure 4.7.
Figure 4.7: Hardware-in-the-loop testing at Tecnalia
Tunability – the control system can tune the power take off to a range of sea states which increases the performance envelope allowing efficient operation more often and hence a higher annualised power output
Power smoothing – power smoothing algorithms can allow the devices to be connected to weak grids which will greatly increase market potential for the devices. Shown below is an example from CORES power output using a control algorithm that did not smooth the power.
Figure 4.8: CORES power output using a control algorithm that did not smooth the power output

CORES 213633 – Final Publishable Summary Report
33
4.2.3 WP3 Impact – Moorings Risers and deployment
One of the stated principle aims of the Ocean Energy program is to reduce the cost of electricity to around 0.05 €/kWh by 2020. Both the mooring system and the power umbilical can have considerable effect on the overall cost of any proposed wave farm. The capital cost of the mooring system is dominated by the number, length and material of the lines. During the operation of the farm, inspection, maintenance and replacement of the lines will contribute an appreciable amount to the operating costs. The power umbilical is a key component linking an individual device into the array and then to the grid. Loss of this link will severely affect the revenue of the farm. At this stage in the development of floating wave energy devices there is still technical and economic uncertainty as to how current design methods should be applied. This is a key block to reducing capital and operating costs. The strategic objective to reduce cost of production was achieved with the Work Package’s principle aimed to minimize and quantify where possible these uncertainties. This key aim, to reduce technical uncertainty was achieved through
(i) Improved design methods – Using a series of physical and numerical methods
Figure 4.9: Coupled RAOs comparison

CORES 213633 – Final Publishable Summary Report
34
(ii) Development of suitable new mooring and umbilical systems designs
Figure 4.10
(iii) Better physical modelling – This was achieved through 2d tests in Bologna and 3D
tests in HMRC, as well as with integration into the numerical system. All partners witnessed this for the first time together.
Figure 4.11
(iv) Appropriate methods for risk assessment, reliability and operations. Any estimation of
the cost of a project must include the capital and running costs associated with the mooring line and power umbilical. The costs of large scale moorings (within a farm) can form a substantial fraction of the capital expenditure for materials and installation and the operating cost for inspection and maintenance of these components. This is
CORES 213633 – Final Publishable Summary Report
35
made worse by the over design for redundancy and survivability if one uses conventional offshore codes of practice.
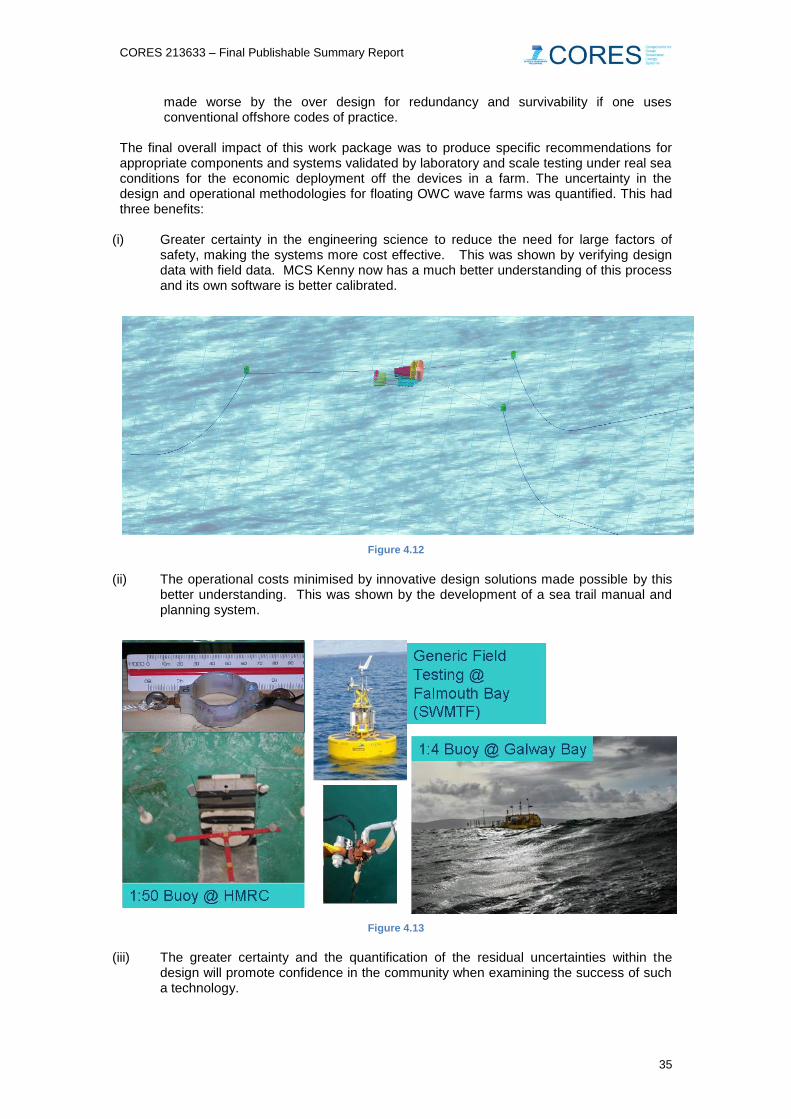
The final overall impact of this work package was to produce specific recommendations for appropriate components and systems validated by laboratory and scale testing under real sea conditions for the economic deployment off the devices in a farm. The uncertainty in the design and operational methodologies for floating OWC wave farms was quantified. This had three benefits:
(i) Greater certainty in the engineering science to reduce the need for large factors of safety, making the systems more cost effective. This was shown by verifying design data with field data. MCS Kenny now has a much better understanding of this process and its own software is better calibrated.
Figure 4.12
(ii) The operational costs minimised by innovative design solutions made possible by this
better understanding. This was shown by the development of a sea trail manual and planning system.
Figure 4.13
(iii) The greater certainty and the quantification of the residual uncertainties within the
design will promote confidence in the community when examining the success of such a technology.

CORES 213633 – Final Publishable Summary Report
36
4.2.4 WP4 Impact - Modelling, System Integration and Field Trials
The impact of the deliverables from Work Package 4 primarily relate to the ability to reduce the uncertainties associated with modelling the overall WEC system from wave to wire. This will allow developers to investigate the improvements in performance resulting from changes in device specification with confidence. This should accelerate the development path towards fully commercial devices within the time-frame of the requirements stated in the European Strategy. The overall objective of reducing risks associated with development was realised with the completion of this Work Package. The three primary actions which lead to these impacts are:
Low Risk system integration – components were sub-assembled, integrated and FULLY tested in laboratory and at dockside before ever being taken to sea.
Testing Components at “laboratory scale” in real sea conditions.
Validation of Wave to Wire Models using “real sea” data. The deliverables from this Work Package were disseminated directly to the Industry through a showcase event at EWTEC so the impact will be immediate for them. See Section 4.3.3 for the details.
4.2.5 Generic Impacts
The components of the “toolkit” comprise elements of the power conversion train which are generic to all wave energy converters. These elements are
The prime mover hydrodynamic module. This is specific to OWC’s but will have potential to adapt to other systems as the development methodology, testing and validation is compatible with other systems.
The mooring system work has generic use for all floating wave energy systems.
The Air turbine module is specific to OWC’s but could be adapted for any other reciprocating flow application.
The electrical generator/power quality system is generic and the modelling tools developed have a wide application to other wave energy converters. This module could also be adapted for any other application with stochastic prime mover input interfaced to grid.
The field operational experience has fed directly into IEC standard 114 (Marine Energy – Wave and Tidal Energy Converters) and will have generic use to all ocean energy developers. Many of the CORES partners now sit on their respective countries mirror group of TC114 and feed their CORES experience into this process. Examples would be HMRC, QUB, IWES and Tecnalia.
4.3 Dissemination Activities
4.3.1 Dissemination Plan from Annex 1
Another barrier to the development of the wave energy industry has been identified as the lack of knowledge amongst decision makers and the general public. The fact that key decision makers are still relatively unfamiliar with the technologies slows down development possibilities. Lack of public knowledge might become a public barrier in relation to social acceptance as technologies need to be known and their underlying rationale understood in order to be accepted.

CORES 213633 – Final Publishable Summary Report
37
The dissemination plan for the CORES project described in Annex 1 aimed to tackle the barrier of lack of knowledge through “local level” and “international level” dissemination. This plan has been followed and executed while there were also some additions to the dissemination plan.
4.3.2 Local Level Dissemination
Local dissemination dealt mainly with the promotion of the project as a whole, in particular with the aspect of the integration of the parts, its impact in the field of wave energy in general and general achievements. Local dissemination was on partners’ websites, national press and through national organisations. Examples of local dissemination are shown in Figure 4.14 and Figure 4.15.
Figure 4.14: Details of the CORES project on CORES Partner WavEC's website
Figure 4.15: Irish newspaper reports featuring CORES project and the visit of EU Commissioner Maire Geoghegan Quinn to the CORES project

CORES 213633 – Final Publishable Summary Report
38
4.3.3 International Level Dissemination
International level dissemination involved a website, brochures, conference and journal papers, some workshops and input into IEC TC114. The CORES project was also fortunate to attract the attention of Máire Geoghegan-Quinn, the EU Commissioner for Research, Innovation and Science who visited the site in Galway docks during fit-out (Also Figure 4.15).
The public website dedicated to the CORES project can be viewed at http://www.fp7-cores.eu/. The purpose of this website is to disseminate project information to the community at large. Brochures and posters were published for distribution at international conferences, workshops exhibitions etc. Examples of these are shown in Figure 4.16. Examples of conference and journal papers relating to CORES are shown in.
Figure 4.16: CORES Brochures
Figure 4.17: Examples of journal and conference papers produced as part of CORES dissemination
In addition to this, the European Wave and Tidal Conference (EWTEC), 2011 in Southampton was targeted for dissemination of research and activities from the CORES project. This is the main industry conference for wave and tidal energy in Europe and was attended by over 600 delegates from industry, academia and government. The CORES team disseminated information in the following ways:
A Technical Exhibition with equipment on display, manned full time by CORES participants (Figure 4.18)
A 90min open special session on CORES with an Industry panel and presentations from CORES participants (Figure 4.18)

CORES 213633 – Final Publishable Summary Report
39
Informational exhibition manned fulltime by CORES Participants with brochures and other media
A number of CORES related papers and posters throughout the main technical sessions
A write up in EU Magazine
Figure 4.18: CORES Technical Exhibition at EWTEC
Figure 4.19: CORES showcase event at EWTEC