final report a transit methodology using six sigma … six sigma for 2009 final report ... a transit...
TRANSCRIPT

A Transit Methodology Using Six Sigma For
2009 Final Report
Prepared by Kenneth R. Cook, Ph.D. Wendy Tyson‐Wood
New England Professionals Transportation - Research, Technology, and Management "Innovative Client-Focus Solutions" Waterbury, CT August 31, 2009
Heavy Rail Vehicle Maintenance Programs
Prepared for
U. S. DEPARTMENT OF TRANSPORTATION FEDERAL TRANSIT ADMINISTRATION
Office of Research, Demonstration, and Innovation
In Association With
Transit State of Good Repair

Technical Report Documentation Page Report No.
2. Government Accession No. 3. Recipient’s Catalog No.
4. Title and Subtitle A Transit Methodology
Using Six Sigma For Heavy Rail Vehicle Maintenance Programs
5. Report Date August 31, 2009 6. Performing Organization Code
7. Author(s): Kenneth R. Cook, Ph.D.; Wendy Tyson-Wood with Contributions from Edward L. Thomas; and A Siranjan Kulatilake
8. Performing Organization Report No.
9. Performing Organization Name and Address New England Professionals, LLC P.O. Box 11403 Waterbury, Connecticut 06703
10. Work Unit No. 11. Contact or Grant No. CT-26-7009
12. Sponsoring Agency Name and Address U.S. DEPARTMENT OF TRANSPORTATION Federal Transit Administration Office of Research, Demonstration, and Innovation 1200 New Jersey Avenue, SE Washington, DC 20590
13. Type of Report and Period Covered Final Report 14. Sponsoring Agency Code
15. Supplementary Notes This project was funded using the Federal Transit Administration’s discretionary funds, FY 2008.
16. Abstract – This research central purpose was to develop a methodology for determining how substantial public resources should be invested so that rail transit operations can be improved relative to capital and operating efficiencies. However, the goal was to use a proven methodology tool (Six Sigma) for increasing productivity and apply it in a transit environment to improve and sustain capital and operating efficiencies. Application of the transit methodology using Six Sigma was accomplished by conducting a Case Study of Miami-Dade Transit Process Improvement and the Six Sigma Initiative, with emphasis on rail car maintenance.
17. Key Words: A Transit Methodology Using Six Sigma; Heavy Rail Maintenance; Kenneth R. Cook, Ph.D.; New England Professionals LLC;
18. Distribution Statement No restriction.
19. Security Classification (of this report)
Unclassified
20. Security Classification (of this page)
Unclassified
21. No. of Pages
129
22. Price

ACKNOWLEDGMENTS This research project was commissioned by the Federal Transit Administration (FTA) - Office of Research, Demonstration, and Innovation to address FTA’s Third Strategic Research Goal – Improve Capital and Operating Efficiencies. Completion of this research could not have been possible without the contributions of many individuals from several entities:
Federal Transit Administration We would like to thank Terrell Williams, Project Manager, for his support in the completion of this National Research Project. In addition, we want to thank Vincent Valdes, Associate Administrator for Research, Demonstration, and Innovation, for issuing the invitation to all thirteen heavy rail transit agencies to participate in this National Research Project.
Transit Agencies Transit Agency Name Title Miami-Dade Transit (MDT)
Harpal S. Kapoor Director Lazaro R. Palenzuela Chief – Office of Quality Assurance Jerry Blackman General Superintendent – Rail Vehicle Maintenance
Chicago Transit Authority (CTA)
Ronald Huberman President (former CTA) Maggie Schilling Project Consultant – Performance Management Ralph E. Malec General Manager – Rail Engineering and Technical
Services Philip Lamont General Manager – Rail Car Heavy Maintenance
Massachusetts Bay Transportation Authority (MBTA)
Daniel Grabauskas General Manager Paul Rosie Deputy Director Chief Maintenance – Subway
Operations Paul K. Miner Supervisor – Subway Operations
Metropolitan Atlanta Rapid Transit Authority (MARTA)
Beverly A. Scott, Ph.D. General Manager/Chief Executive Officer Joseph Erves Director – Rail Car Maintenance Jhonnita Williams Operations Administrator – Rail Car Maintenance Randy Mooreland General Superintendent – Rail Car Maintenance
Southeastern Pennsylvania Transportation Authority (SEPTA)
Joseph M. Casey General Manager John Jamison Director – Administration and Finance – Vehicle
Engineering/Maintenance Dept. Luther Diggs Chief Officer – Vehicle Engineering and
Maintenance
New England Professionals LLC Page i August 31, 2009

TABLE OF CONTENTS
ACKNOWLEDGMENTS ............................................................................................I
FEDERAL TRANSIT ADMINISTRATION ................................................................................. I TRANSIT AGENCIES ............................................................................................................ I
ACRONYM AND ABBREVIATION LIST ............................................................... II
EXECUTIVE SUMMARY .......................................................................................... 1
RESEARCH PROBLEM AND PLAN ...................................................................................... 1 TRANSIT AGENCIES SITE VISITS AND ANALYSIS .............................................................. 3 KEY FINDINGS BEFORE CASE STUDY ............................................................................... 6 CASE STUDY – MIAMI-DADE TRANSIT ............................................................................. 7 TRANSIT SIX SIGMA METHODOLOGY ............................................................................. 10 TRANSIT SIX SIGMA NEXT STEP ..................................................................................... 12
INTRODUCTION ..................................................................................................... 13
PROBLEM STATEMENT .................................................................................................... 13 PURPOSE, GOAL, AND OBJECTIVE ................................................................................... 13 BENEFICIARIES AND BENEFITS ....................................................................................... 14 STRATEGIC MANDATE .................................................................................................... 14 CONTEXT STATEMENT .................................................................................................... 15 PROJECT PARAMETERS ................................................................................................... 17
Project Understanding ........................................................................................................... 17
Transit Agency Participation ................................................................................................. 18
Technical Issues .................................................................................................................... 18
Limitations ............................................................................................................................. 18
Primary Deliverables ............................................................................................................. 18
SYNOPSIS OF SIX SIGMA ...................................................................................... 18
SIX SIGMA ORIGIN .......................................................................................................... 19 SIX SIGMA EXECUTION ................................................................................................... 19 SIX SIGMA IMPLEMENTATION ......................................................................................... 25
PROJECT IMPLEMENTATION ............................................................................. 28
RESEARCH DESIGN ......................................................................................................... 29 RESEARCH METHODOLOGY ............................................................................................ 30 PROJECT MANAGEMENT ................................................................................................. 31 WORK PLAN ................................................................................................................... 32 STRATEGIC MILESTONES ................................................................................................ 33
TRANSIT AGENCIES SITE VISITS ....................................................................... 34
New England Professionals LLC August 31, 2009

SITE VISITS FRAMEWORK ............................................................................................... 34 Rail Car Maintenance ............................................................................................................ 35
Performance Measures .......................................................................................................... 37
Site Visits .............................................................................................................................. 40
MIAMI-DADE TRANSIT (MDT) ....................................................................................... 40 CHICAGO TRANSIT AUTHORITY (CTA) .......................................................................... 45 MASSACHUSETTS BAY TRANSPORTATION AUTHORITY (MBTA) ................................... 48 METROPOLITAN ATLANTA RAPID TRANSIT AUTHORITY (MARTA) .............................. 50 SOUTHEASTERN PENNSYLVANIA TRANSPORTATION AUTHORITY (SEPTA) ................... 51
KEY FINDINGS BEFORE CASE STUDY .............................................................. 52
CASE STUDY – MIAMI-DADE TRANSIT ............................................................. 54
CASE STUDY LOGIC ........................................................................................................ 54 Transit State of Good Repair ................................................................................................. 54
Strategic Research Mandate .................................................................................................. 58
FTA Strategic Research Goal ................................................................................................ 58
FTA Research Concern ......................................................................................................... 58
FTA Reason for Concern and Background Statement .......................................................... 60
FTA Research Intent.............................................................................................................. 60
New England Professionals (NEP) Summary Research Context .......................................... 60
NEP Research Solution ......................................................................................................... 61
NEP Suggested Primary Benefits .......................................................................................... 61
NEP Suggested Research Questions ..................................................................................... 61
NEP Suggested Rail Car Maintenance Logic Model ............................................................ 61
CASE STUDY METHODOLOGY ......................................................................................... 66 Case Study Work Plan ........................................................................................................... 66
Case Study Program .............................................................................................................. 69
THE CASE STUDY ........................................................................................................... 72 MDT Metrorail System and Fleet Profile .............................................................................. 72
Six Sigma Origin and Development ...................................................................................... 73
Rail Car Maintenance Operations ......................................................................................... 86
Functional Area Support and Rail Car Maintenance ............................................................. 94
Process Mapping ................................................................................................................. 103
CASE STUDY ANALYSIS ................................................................................................ 107 Rail Car Maintenance .......................................................................................................... 107
New England Professionals LLC August 31, 2009

CASE STUDY OBSERVATIONS ....................................................................................... 114 Rail Car Maintenance .......................................................................................................... 114
TRANSIT SIX SIGMA METHODOLOGY ........................................................... 116
SIX SIGMA INITIATION .................................................................................................. 116 SIX SIGMA EXECUTION ................................................................................................. 117 SIX SIGMA DEPLOYMENT ............................................................................................. 118
TRANSIT SIX SIGMA – NEXT STEP ................................................................... 121
APPENDIX A .......................................................................................................... 123
INITIAL SITE VISIT SIGN IN SHEETS .............................................................................. 123 Miami-Dade Transit (MDT) ................................................................................................ 123
Chicago Transit Authority (CTA) ....................................................................................... 123
Massachusetts Bay Transportation Authority (MBTA) ...................................................... 124
Metropolitan Atlanta Rapid Transit Authority (MARTA) .................................................. 124
Southeastern Pennsylvania Transportation Authority (SEPTA) ......................................... 125
APPENDIX B .......................................................................................................... 126
MIAMI-DADE TRANSIT CORE VALUES ......................................................................... 126
APPENDIX C .......................................................................................................... 127
GREATER MIAMI CHAMBER OF COMMERCE ................................................................. 127
APPENDIX D .......................................................................................................... 128
MDT STERLING QUALITY ACHIEVEMENT RECOGNITION AWARD ................................ 128
APPENDIX E .......................................................................................................... 129
ABOUT THE PROJECT TEAM .......................................................................................... 129
New England Professionals LLC August 31, 2009

LISTS OF TABLES TABLE 1 - RAIL CAR MAINTENANCE KEY QUESTIONS .................................................................................. 17 TABLE 2 - NEP TEAM MEMBER .................................................................................................................... 32 TABLE 3 - NEP STRATEGIC MILESTONES ...................................................................................................... 33 TABLE 4 - RAIL SYSTEM CHARACTERISTICS11 ............................................................................................... 52 TABLE 5 – BASED OF STATE OF GOOD REPAIR OCTOBER 2008: AGENCY AND DEFINITIONS ........................ 55 TABLE 6 - VEHICLE AGE IN YEARS ............................................................................................................... 56 TABLE 7 - SOURCE: THE SIX SIGMA WAY – TEAM FIELDBOOK .................................................................... 62 TABLE 8 - SIGN IN SHEET MAY 4, 2009 @ 9:45PM ........................................................................................ 74 TABLE 9- SIGN IN SHEET: DATE: MAY 4, 2009 @ 1:30 PM ............................................................................ 79 TABLE 10 - SOURCE: MDT ORGANIZATION FTE DATA - 2006 THRU 2009 ................................................... 80 TABLE 11 - SIGN IN SHEET DATE: MAY 5, 2009 @ 10 PM ............................................................................. 81 TABLE 12 - SIGN IN SHEET DATE: MAY 5, 2009 @ 2PM ................................................................................ 83 TABLE 13 - SIGN IN SHEET DATE: MAY 6, 2009 @ 10 AM ............................................................................. 86 TABLE 14 - MDT'S TYPES OF INSPECTIONS ................................................................................................... 90 TABLE 15 - SIGN IN SHEET DATE: MAY 8, 2009 @ 10 AM ............................................................................. 91 TABLE 16 - FLEET AVAILABILITY BASED ON REVENUE VEHICLE DEMAND AND SUPPLY .............................. 91 TABLE 17 - SIGN IN SHEET DATE: MAY 8, 2009 @ 3 PM ............................................................................... 92 TABLE 18 - SIGN IN SHEET DATE: MAY 11, 2009 @ 10 AM ........................................................................... 94 TABLE 19 - SIGN IN SHEET DATE: MAY 11, 2009 @ 3 PM ............................................................................. 97 TABLE 20- SIGN IN SHEET DATE: MAY 12, 2009 @ 1 PM .............................................................................. 98 TABLE 21 - SIGN IN SHEET DATE: MAY 12, 2009 @ 2 PM ............................................................................. 99 TABLE 22 - SIGN IN SHEET DATE: MAY 12, 2009 @ 3 PM ............................................................................100 TABLE 23 - BI-WEEKLY PROJECT STATUS CUSTOMER COMPLAINT REPORT ...............................................101 TABLE 24 - SIGN IN SHEET DATE: MAY 13, 2009 @ 2 PM ............................................................................102 TABLE 25 - SIGN IN SHEET DATE: MAY 14, 2009 @ 3 PM ............................................................................104 TABLE 26 - SIGN IN SHEET DATE: MAY 15, 2009 @ 2 PM ............................................................................105 TABLE 27 -SIGN IN SHEET DATE: MAY 16, 2009 @ 10 AM ..........................................................................106 TABLE 28 - SUPPORTING FUNCTIONAL AREA/OFFICE (E) ............................................................................109 TABLE 29 - PREVENTIVE MAINTENANCE COST DRIVER BY MAJOR SYSTEM: IN HOUSE LABOR ..................110 TABLE 30 - PREVENTIVE MAINTENANCE COST DRIVER BY MAJOR SYSTEM: MATERIALS ...........................111 TABLE 31 - PREVENTIVE MAINTENANCE COST DRIVER BY MAJOR SYSTEM: OVERTIME .............................112 TABLE 32 - PREVENTIVE MAINTENANCE COST DRIVER BY MAJOR SYSTEM: AGING COST ..........................113 TABLE 33 - PREVENTIVE MAINTENANCE COST DRIVER BY MAJOR SYSTEM: CONTRACTING .......................114 TABLE 34 - PROCESS MAPS THAT IMPACT RAIL CAR MAINTENANCE ..........................................................121 TABLE 35 - MDT INITIAL SITE VISIT ...........................................................................................................123 TABLE 36 - CTA INITIAL SITE VISIT ............................................................................................................124 TABLE 37 - MBTA INITIAL SITE VISIT .........................................................................................................124 TABLE 38 - MARTA INITIAL SITE VISIT ......................................................................................................125 TABLE 39 - SEPTA INITIAL SITE VISIT ........................................................................................................125
New England Professionals LLC August 31, 2009

New England Professionals LLC August 31, 2009
LISTS OF FIGURES FIGURE 1 - OVER AGE ASSETS BY TYPE ........................................................................................................ 34 FIGURE 2 - A VEXING PERFORMANCE CHALLENGE ....................................................................................... 34 FIGURE 3 - FUNCTIONAL AFFINITY MAP ....................................................................................................... 36 FIGURE 4 - CONDITIONS OF HEAVY RAIL ASSETS ......................................................................................... 39 FIGURE 5 – MEAN DISTANCE BETWEEN FAILURES (MDBF) RAIL VEHICLES ............................................... 40 FIGURE 6 – MDT: MEANS DISTANCE BETWEEN FAILURE ............................................................................. 41 FIGURE 7 - METRORAIL MDBF ..................................................................................................................... 43 FIGURE 8 - MEAN DISTANCE BETWEEN MAINLINE FAILURE ......................................................................... 43 FIGURE 9 - SUBSYSTEM MAINLINE FAILURES ............................................................................................... 44 FIGURE 10 - MEANS DISTANCE BETWEEN SUBSYSTEM ................................................................................. 44 FIGURE 11 - METRORAIL MEAN DISTANCE BETWEEN FAILURES .................................................................. 45 FIGURE 12 - CTA: MEANS DISTANCE BETWEEN FAILURE ............................................................................ 46 FIGURE 13 - CTA-MMBRD - AUG 2007 TO AUG 2008 ................................................................................. 48 FIGURE 14 - MBTA: MEANS DISTANCE BETWEEN FAILURES ....................................................................... 49 FIGURE 15 - MARTA: MEANS DISTANCE BETWEEN FAILURES .................................................................... 50 FIGURE 16 - SEPTA: MEANS DISTANCE BETWEEN FAILURES ...................................................................... 52 FIGURE 17 - FEDERAL TRANSIT ADMINISTRATION’S VISION .......................................................... 59 FIGURE 18 - TRANSIT METHODOLOGY SIX SIGMA MODEL ............................................................................ 62 FIGURE 19 – FTA SIX SIGMA CASE STUDY KICK-OFF MEETING MAY 4, 2009 @MDT ................................ 74 FIGURE 20 - LAZARO PALENZUELA REVIEWS MDT ACCOUNTS PAYABLE DISBURSEMENT PROCESS MAP ... 77 FIGURE 21 - FTA SIX SIGMA CASE STUDY –SIX SIGMA HISTORY @MDT MAY 4, 2009 .............................. 78 FIGURE 22 - MDT TRANSIT BUSINESS PLAN FISCAL YEARS: 2009 AND 2010 – EXECUTIVE SUMMARY ....... 80 FIGURE 23 - TABLE OF ORGANIZATION (FTE CHANGE BY DEPARTMENT) ..................................................... 80 FIGURE 24 - THE DATA COLLECTION MEETING ............................................................................................ 81 FIGURE 25 - MDT-050509-TASK 2 RE-CAP WITH DIRECTOR KAPOOR – MAY 5, 2009 ................................. 82 FIGURE 26 - RAIL CARE MAINTENANCE OPERATIONS MEETING MAY 6TH AND 7TH 2009 ............................ 86 FIGURE 27 - SIGN IN SHEET DATE: MAY 7, 2009 @ 10 AM LEHMAN CENTER ............................................... 89 FIGURE 28 - FTA SIX SIGMA CASE STUDY – LEADERSHIP PERSPECTIVE MEETING ....................................... 92 FIGURE 29 - THE PROCUREMENT MEETING MAY 11, 2009 ............................................................................. 94 FIGURE 30 - FIELD ENGINEERING (QC, QA AND DESIGN) ............................................................................. 96 FIGURE 31 - CAPITAL PROGRAMMING, BUDGETING, AND ACCOUNTING MEETING ........................................ 96 FIGURE 32 – MDT OPERATION SUPPORT MEETING MAY 12, 2009 ................................................................ 98 FIGURE 33 - SAFETY SUPPORT MEETING MAY 12, 2009 ............................................................................... 99 FIGURE 34 - CUSTOMER SERVICE SUPPORT MEETING MAY 12, 2009 ...........................................................100 FIGURE 35 - STRATEGIC PLANNING AND INFORMATION TECHNOLOGY MEETING MAY 13, 2009 .................102 FIGURE 36 - PROCESS MAPPING MEETING MAY 14, 2009 ............................................................................103 FIGURE 37 - PROCESS MAPPING MEETING MAY 15, 2009 ............................................................................104 FIGURE 38 - QUALITY ASSURANCE RECAP EXIT MAY 16, 2009 ...................................................................106

Acronym and Abbreviation List
Acronym/Abbreviation Full Name DescriptionsASE Active Strategy EnterpriseATC Automatic Train ControlATO Automatic Train OperationBART San Francisco Bay Area Rapid Transit DistrictC&P Report Condition and Performance of ReportCBM Condition-Based MaintenanceCTA Chicago Transit AuthorityDMAIC Define-Measure-Analysis-Improve-ControlFHWA Federal Highway AdministrationFTA Federal Transit AdministrationFTE Full Time EquivalentIT Information TechnologyKPI Key Performance IndicatorMARTA Metropolitan Atlanta Rapid Transit AuthorityMBTA Massachusetts Bay Transportation AuthorityMDBD Mean Distance Between DisruptionMDBF Mean Distance Between FailureMDT Miami-Dade TransitMMBD Mean Miles Between Reported Rail Vehicle Defects MOVE Making Operations Very EfficientMTA Maryland Transit AdministrationMTA Los Angeles County Metropolitan Transportation AuthorityNEP New England ProfessionalsNTD National Transit DatabaseNYCT MTA New York City TransitOSR Operating Spar RatioPATCO Port Authority Transit Corporation of PA & NJPATH Port Authority Trans-HudsonPDCA Plan-Do-Check-ActPTP People Transportation PlanPVR Peak Vehicle RequirementQA Quality AssuranceQC Quality ControlRCM Reliability-Centered MaintenanceRTA Greater Cleveland Regional Transit AuthoritySEPTA Southeastern Pennsylvania Transportation AuthoritySGR State of Good RepairTCRP Transit Cooperative Research Program TEA-21 Transportation Equity Act for the 21st CenturyTERM Transit Economic Requirements ModelVCP Value Creation ProcessWMATA Washington Metropolitan Area Transit Authority
New England Professionals LLC Page ii August 31, 2009

A Transit Methodologoy Using Six Simga for Heavy Rail Vehicle Maintenance Programs – Executive Summary
EXECUTIVE SUMMARY
Research Problem And Plan
Research Problem The guiding document behind this research is Federal Transit Administration’s (FTA) Strategic Research Plan for FY2006 – FY2010, dated September 30, 2005. The particular impetus is the Strategic Research Plan’s Third Research Goal - Improve Capital and Operating Efficiencies. The underlining focus of this research is to develop or produce a method, system, or technical solution for improving the effectiveness of rail transit operations. This focus suggests that investment of public resources for every transit project should yield a good return. That is, Federal transit programs have $45.3 billion of guaranteed funding for FY 2005 through FY 2009, which represent a 46 percent increase over the Transportation Equity Act for the 21st Century (TEA-21) funding. As such, the purpose of this research was to develop a methodology for determining how substantial public resources should be invested so that rail transit operations can be improved relative to capital and operating efficiencies. However, the goal
was to use a proven methodology for increasing productivity in a transit environment to improve and sustain capital and operating efficiencies. But, the objective was to develop a Transit Methodology Using Six Sigma For Heavy Rail Vehicle Maintenance Programs. The Methodology focused on heavy rail vehicle maintenance using a sample of the existing 13 US Heavy Rail Transit System; the sample culminated with a case study of the appropriate sample transit agency. The 13 agencies invited to participate included: (1) MARTA - Metropolitan Atlanta Rapid Transit Authority; (2) MTA - Maryland Transit Administration; (3) MBTA – Massachusetts Bay Transportation Authority; (4) CTA – Chicago Transit Authority; (5) RTA – Greater Cleveland Regional Transit Authority; (6) PATH – Port Authority Trans-Hudson; (7) PATCO – Port Authority Transit Corporation of PA & NJ; (8) MTA – Los Angeles County Metropolitan Transportation Authority; (9) MDT – Miami-Dade Transit; (10) NYCT – MTA New York City Transit; (11) BART – San Francisco Bay Area Rapid Transit District; (12) SEPTA – Southeastern Pennsylvania Transportation Authority; and (13) METRO – Washington Metropolitan Area Transit Authority. Today, heavy rail operators across the nation are experiencing 2% to 5% increases in ridership per year. These ridership gains are straining their ability to provide the necessary vehicle capacity. As ridership grows, rail vehicle maintenance programs are seeing increases in the malfunction of rail car
New England Professionals LLC Page 1 August 31, 2009

A Transit Methodologoy Using Six Simga for Heavy Rail Vehicle Maintenance Programs – Executive Summary
systems and corresponding components such as doors, climate control systems, brakes, communication systems, and vehicle computer systems. Nevertheless, previous research shows that “the maintenance function is one of the few areas in transit operations where effective management can have a direct impact on the monthly operating statement and the capital budget.” Therefore, our tenet is that rail car maintenance is at the heart of the transit planning, operations, and management. Specifically, transit operations (commuter, heavy, and light rail) comprise over 50% percent of transit service and represent a much larger component of capital expenditures and operating costs. As so, a holistic approach to rail car maintenance must be developed that links transit agencies’ departmental functions with organizational processes to achieve FTA’s Third Strategic Goal with subsequent customer satisfaction. Research Plan The Research Plan consisted of five major tasks. Step One required analysis of the National Transit Database to determine the state of rail car maintenance from 2003 to 2006 for the five participating transit agencies: (1) MARTA - Metropolitan Atlanta Rapid Transit Authority; (2) MBTA – Massachusetts Bay Transportation Authority; (3) CTA – Chicago Transit Authority; (4) MDT – Miami-Dade Transit; and (5) SEPTA – Southeastern Pennsylvania Transportation Authority. The focus was on service supplied and consumed as well as revenue vehicle maintenance performance. Special emphasis was placed on Mean Distance
Between Failure (MDBF) for the years between 2003 to 2006. Step Two involved conducting a site visit of the five participating transit agencies with concurrence of each agency that follow-up data requests would be complied with but sensitive to availability of senior staff time. During the site visits, formal and informal interviews were conducted in structured and unstructured manners through one-on-one communication as well as group. Direct observations were made of rail car maintenance facilities along with exploring official data and records such as transit service reports, capital investment program, fleet management plan, operations performance indicators, budget plan, and rail maintenance performance management. In conjunction, requests were made for data and information (such as the systems that comprise a rail car) without asking direct questions. Step Three entailed using the key findings from the site visits to determine which transit agency should be the preferred Case Study. Examples of the key findings included average annual ridership, fleet size, average car age, and MDBF. With a selection having been made a Pre-post Case Study was conducted. The categorical format of the Case Study will be: (1) Research Phase; (2) Analysis Phase; and (3) Actual Writing. Of equal import, the Case Study will emphasize Rail Car Maintenance (i.e., cost, improvements, efficiency, and management). Step Four used the results of the Pre-post Case Study and site visits findings along with trend analysis with supporting analytical techniques to
New England Professionals LLC Page 2 August 31, 2009
A Transit Methodologoy Using Six Simga for Heavy Rail Vehicle Maintenance Programs – Executive Summary
develop a Transit Methodology Using Six Sigma For Heavy Rail Vehicle Maintenance Programs. Step Five was the preparation of a schematic proposal for the Next Step effort to determine how the a Transit Methodology Using Six Sigma For Heavy Rail Vehicle Maintenance Programs can be further validated, implemented, and evaluated for FTA use and the transit industry.
Transit Agencies Site Visits and Analysis
Rail car maintenance is a significant and complex activity because it has to deliver high levels of customer satisfaction while executing a rail car maintenance program that has to be effective and efficient. In other words, each transit agency must have a certain number of rail cars available per day to service its known ridership. If the rail cars are not maintained properly one or two basic situation occurs: (1) the system will not have enough trains with rail cars to service the known ridership; and (2) there are enough trains with rail cars to service the known ridership but some cars being used have unresolved problems that make riders unhappy or cause some trains to be taken out of service or have trains operating with some cars not usable for patrons. According to FTA State of Good Repair Report, rail cars typically exceed their useful life by approximately 25%. Unfortunately, a recent FTA report shows that investment in maintaining transit systems in a state of good repair is not adequate to meet the needs. More specifically, current investment rates meet only 60% - 80% of the backlog of normal replacement needs. With this
type of investment shortfall and the extended life of rail cars, it is critical that rail car maintenance program be closely assessed to determine how they can be used to aid in improving capital and operating efficiencies for rail transit operations. With this framework, each site visit of the participating transit agencies was guided by MDBF. Miami-Dade Transit (MDT) According to the National Transit Database, MDT operates a multi-modal system including heavy rail (Metrorail), people mover (Metromover), bus (Metrobus), and paratransit in a service area of 306 miles. The heavy rail fleet has 136 rail cars with an average age of 25 years and operates over 22.6 miles of track. In 2007, the operating cost per rail car revenue mile increased while the operating costs per passenger mile remained at 2006 levels. Between 2003 and 2005, MDT saw its MDBF for its heavy rail cars declining as the rail cars aged. However, a turnaround in rail car maintenance performance occurred in 2005 as the organization placed more emphasis on preventive maintenance. MDT is well on its way towards achieving its rail service performance goals in general and rail car maintenance performance goals in particular. MDT defines mean distance in three ways: Mean Distance Between All Failures, Mean Distance Between Mainline Failures (synonymous with the definition derived from the NTD tables), and Mean Distance Between Disruptions. Mean Distance Between All Failures showed significant improvement over 2006 and 2007 levels. Mean Distance Between Mainline Failures in 2008 is on a trajectory to out-
New England Professionals LLC Page 3 August 31, 2009

A Transit Methodologoy Using Six Simga for Heavy Rail Vehicle Maintenance Programs – Executive Summary
perform 2006 and 2007. Mean Distance Between Mainline Failures for 2008 was on track to return to the 2006 level. MDT’s aggressive door campaign accounts for much of the improvements. Mean Distance Between Disruptions has remained constant. MDT is the most advanced in the use of Six Sigma among the five heavy rail transit agencies participating in this research project. Current Director, Harpal Kapoor, is the guiding force behind MDT Six Sigma effort and he created the Office of Strategic Planning and Performance to steward the beginning efforts. Since the beginning efforts, responsibility for Six Sigma efforts has been assigned to Office of Quality Assurance (QA), which report directly to Mr. Kapoor. As a result, QA Divisional Business Plan for Fiscal Years 2009 and 2010 expressly states that Six Sigma will be fully deployed throughout the organization.
Chicago Transit Authority (CTA) CTA operates buses, heavy rail and paratransit in a service area of 327 square miles. The heavy rail fleet has 1,190 rail cars with an average age of 24 years and operated over 207.8 miles of track. In 2007, the operating cost per rail car revenue mile and costs per passenger mile declined as compared to 2006 levels. The average age of this fleet is 24 years compared to an FTA recommended car life of 25 years. CTA experienced a major decline in its MDBF based on information from NTD. The declines were related to the aging of CTA’s rail fleet. CTA is progressing in rail car maintenance performance. A key
vehicle maintenance performance measure used by the CTA is Mean Miles Between Reported Rail Vehicle Defects (MMBD) which is similar to NTD derived MDBF. By August 2007, CTA MMBD had fallen to its lowest level of 2,373 miles. By August 2008, MMBD had increased to 3,962 miles about 67% improvement in performance over the 2007 level; exceeding the established 3,500 mile goal and above the 2006 level of 3,486 calculated from the NTD data. This progress can be attributed to the emphasis on program management put in place by President Ron Huberman in 2007. However, based on available data we cannot determine the impact of seasonal variation on 2008 performance that is the impact of 2008 autumn and winter season. CTA has developed and implemented an impressive Performance Management System, but unlike Miami Dade Transit had not decided to formally implement Six Sigma. In 2007, CTA President, Ron Huberman started implementation of a CTA Performance Management System with rail car maintenance being a key area of focus and by May 2007, a Performance Management Department was created. As a result, rail car maintenance tracks it performance through: 1) monthly scorecard of key performance measures, 2) monthly maintenance manager meetings on maintenance issues, policy changes and new initiatives; 3) performance management session every 6 weeks with CTA President and executive staff, 4) bi-weekly Rail Service Quality Meeting to identify maintenance issues affecting service reliability; and 5) daily flash reports on key metrics across the department each morning. Recording failures and issuing correction work
New England Professionals LLC Page 4 August 31, 2009

A Transit Methodologoy Using Six Simga for Heavy Rail Vehicle Maintenance Programs – Executive Summary
orders are the responsibility of the operations control center.
Massachusetts Bay Transportation Authority (MBTA)
MBTA operates buses, light rail, heavy rail, commuter rail, and paratransit in a service area of 3,244 square miles. The heavy rail fleet has 408 rail cars and operated over 73 miles of track while generating 32% of the total system’s fare revenue and accounting for 28.5% of its operating expenses. Subway operations subscribe to a philosophy of preventive maintenance, utilizing mileage and time-based inspection, annual services and component overhauls. Vehicle performance is tracked by measuring mean distance between failures and vehicle availability. Since 2004, MBTA was able to stem the decline in its MDBF according to the NTD. A heavy overhaul and routine replacement program played a role in the performance of rail car maintenance. Over the past few years, MBTA has worked to incorporate preventive maintenance of its rail cars into the 3C Capital Planning and Programming process. Additionally, according to FTA July 2009 Report to Congress about the Rail Modernization Study, MBTA has a State of Good Repair database which can be a solid foundation to institute Six Sigma for Rail Car Maintenance.
Metropolitan Atlanta Rapid Transit Authority (MARTA)
MARTA operates buses, heavy rail and paratransit in a service area of 489 square miles. The heavy rail fleet had 264 rail cars and operated over 96.1
miles of track while generating 49.4% of the total system’s fare revenue and accounting for 28.5% of its operating expenses. MARTA’s MDBF fell from a high of 16,000 miles in 2003 to below 2,000 miles in 2006. This decline in cost efficiency continued in 2007. MARTA heavy rail cost efficiency measured by operating costs per rail car revenue mile climbed to $8.00 per mile in 2007 from $6.00 per mile in 2006. In addition, cost effectiveness or customer effectiveness measured by operating costs per passenger mile fell below the 2006 levels. MARTA is using a combination of strategic planning and engineering management approaches to respond to its challenges in operating efficiency and effectiveness. The General Manager - Beverly Scott, Ph.D. - initiated a systems re-engineering and optimization study called MOVE, Making Operations Very Efficient, which is operations and customer focused. Furthermore, MARTA Balanced Scorecard contains 100 key performance indicators, which provide a basis for a performance management system. Rail Car Maintenance is one of the MOVE emphasis areas. With support from the Engineering Department, MARTA is presently involved in heavy maintenance rebuilds. This effort is reflective of the 17 year average age of their vehicles. MARTA is using state-of-the-art analytical tools to conduct failure analysis with its Enterprise Asset Management System. In addition MARTA, like BART and WMATA, is using the information from its asset management system and train control
New England Professionals LLC Page 5 August 31, 2009

A Transit Methodologoy Using Six Simga for Heavy Rail Vehicle Maintenance Programs – Executive Summary
system to predict the likelihood when vehicle and wayside failures will occur. MARTA has not made a formal decision to adopt Six Sigma. However, several staff in the Rail Car Maintenance Department has taken it upon themselves to become trained in Six Sigma and MARTA’s leadership is well aware of the Six Sigma methodology.
Southeastern Pennsylvania Transportation Authority (SEPTA)
The Southeastern Pennsylvania Transportation Authority (SEPTA) operates buses, light rail, heavy rail, commuter rail and paratransit in a service area of 831 square miles. The heavy rail fleet has 369 rail cars and operated over 74.5 miles of track while generating 21% of the total system’s fare revenue and accounting for 28.5% of its operating expenses. According to the NTD, the MDBF trends in SEPTA rail maintenance between 2003 and 2004 showed improvement but from 2004 to 2006 it experience significant decline. SEPTA Vehicle Engineering and Maintenance Department have not implemented a formal Six Sigma methodology. It is, however, implementing functional aspects of Six Sigma. Rail Car Maintenance, Rail Equipment Engineering and Rail Quality Assurance (QA) and Quality Control (QC) work as a team. Rail Equipment Engineering used Lean Six Sigma to refine work standards for rail car maintenance. The engineering department follows the DMAIC approach. In summary, Miami Dade Transit (MDT) is the most advanced in the use of Six Sigma among the five heavy rail
transit agencies participating in this research project. Chicago Transit Authority (CTA) has developed and implemented an impressive Performance Management System, but unlike Miami-Dade Transit has not decided to formally implement Six Sigma. Massachusetts Bay Transportation Authority (MBTA) uses the 3C (Continuing, Comprehensive, and Cooperative) Planning Process for its rail car maintenance program. Metropolitan Atlanta Rapid Transit Authority (MARTA) is using a combination of strategic and engineering management approaches to respond to its challenges in operating efficiency and effectiveness. Southeastern Pennsylvania Transportation Authority (SEPTA) Vehicle Engineering and Maintenance Department have not implemented a formal Six Sigma methodology; however, functional aspects of Six Sigma have been implemented. Particularly, Rail Equipment Engineering uses Lean Six Sigma to refine work standards for rail car maintenance following the Six Sigma DMAIC Approach. Hence, it was concluded that MDT should be the Case Study for validating a Transit Methodology using Six Sigma for Heavy Rail Vehicle Maintenance Programs. This position is further supported by MDT Business Plan for Fiscal Years 2009 and 2010 that shows commitment to organization-wide full deployment of Six Sigma in Section 1.7.a – Continued Improvement of Business Systems and Work Processes.
Key Findings Before Case Study Miami-Dade Transit is the most advanced in the use of Six Sigma
New England Professionals LLC Page 6 August 31, 2009

A Transit Methodologoy Using Six Simga for Heavy Rail Vehicle Maintenance Programs – Executive Summary
because it has been officially implemented organization-wide. Chicago Transit Authority has developed and implemented an impressive Performance Management System but has not officially implemented Six Sigma. MBTA emphasis has been preventive rail car maintenance using the 3C (continuing, comprehensive, and cooperative) Planning process. MARTA focus is a combination of strategic planning and engineering management but some of the rail maintenance staff are certified at different levels of Six Sigma Training. SEPTA has not officially implemented Six Sigma but some functional aspects of it is being used. That is, Rail Equipment Engineering uses Lean Six Sigma to refine work standards for rail car maintenance, using the Six Sigma DMAIC (Define, Measure, Analyze, Improve, and Control) Approach.
Case Study – Miami-Dade Transit
MDT Case Study was conducted in five sequential steps: Logic, Methodology, The Case, Case Analysis, and Case Observations. The Case Study Logic answered two questions: (1) Why was this National Research Study funded?; (2) What was the Expected Outcome? The Case Study Methodology consisted of two parts: Case Study Work Plan and Case Study Program. The Work Plan covered purpose, goal, and objectives along with a description of the four core tasks: Six Sigma Origin and Development, Rail Car Maintenance Operations, Function Support Area and Rail Car Maintenance, and Process Mapping. The Case Study Program emphasis was
the establishment of an eleven-day agenda to execute the Case Study. The Case Study was conducted of an eleven-day period by four major tasks: (1) Six Sigma Origin and Development – Days 1 and 2; (2) Rail Car Maintenance Operations – Days 3, 4, and 5; (3) Function Support Area and Rail Car Maintenance – Days 6,7, and 8; and (4) Process Mapping – Days 9 and 10. On the eleventh day, a Case Summary Exit Meeting was held with the Case Study coordinator and facilitator – Office of Quality Assurance Chief, Lazaro R. Palenzuela. Miami-Dade Transit’s Case Study Analysis was conducted from five perspectives: (1) cost drivers/types for rail car maintenance; (2) cost performance measures for rail car maintenance; (3) impact of supporting functional areas/offices for rail car maintenance; (4) major rail car systems; and (5) a suggested Rail Car Maintenance Cost Formula. A Rail Car Maintenance Cost Formula was constructed, in concurrence with senior MDT Rail Maintenance staff:
Rail Car Maintenance Cost Formula: (Top Level)
f(x) = [Ox1 + RRx2 + PMx3 ]+ E
Whereas, O = Overhaul, RR = Repair and Replacement
PM = Preventive Maintenance, and E =Supporting Functional Areas
With the above formula, two matrices were constructed: (1) Cost impact of each rail car system on the types of rail car maintenance by cost performance measures; and (2) Cost impact of supporting functional area/office on the types of rail car maintenance. Three impact level were used; (1) High Impact
New England Professionals LLC Page 7 August 31, 2009

A Transit Methodologoy Using Six Simga for Heavy Rail Vehicle Maintenance Programs – Executive Summary
- suggests significant cash outlay or equivalent; (2) Medium Impact - suggests reasonable cash outlay or equivalent; and (3) Low Impact - suggests marginal cash outlay or equivalent. In terms of the matrix for cost impact of supporting functional areas/offices, sixteen areas/offices were identified. Ten (62.5%) of the 16 Support Areas have a high cost impact on the Overhaul cost drivers for cost of rail car maintenance. Fourteen (87.5%) of the Support areas have a high impact on the Repair and Replacement condition for cost of rail car maintenance. Twelve (75%) of the Support Areas have a high cost impact on the Preventive Maintenance cost drivers for cost of rail car maintenance. Lastly, nine (56.3%) Support Areas have high cost impact on all three cost variables. Using the matrix for cost impact of each rail car major systems (10) on the types of rail car maintenance by five cost performance measures, it was determined that for In-House Labor that all ten rail car major systems impact both Overhaul and Repair and Replacement cost drivers identically. Whereas, the Preventive Maintenance cost variable has a mixture of cost impacts that suggests two rail car systems required close monitoring: Propulsion System and HVAC System. Comparing rail car major system across the three cost drivers, close attention should be paid to the both Propulsion and HVAC Systems with concern for: Door, Trucks, and Friction Brake/Air Systems. Then, some focus should be dedicated to Couplers and Drafts Gears.
For the Materials cost performance measure, all ten rail car major systems impact both Overhaul and Repair and Replacement cost drivers identically. Whereas, the Preventive Maintenance cost driver has a mixture of cost impacts that suggests two rail car major systems required close monitoring: Electronic and HVAC Systems. Comparing rail car major system across the three cost drivers, close attention should be paid to the both Electronic and HVAC Systems with concern for: Doors, Trucks, and Car Body. Then, some time should be dedicated to Couplers and Drafts Gears. Relative to the Overtime cost performance measure, eight of the ten rail car major systems impact both Overhaul and Repair and Replacement cost drivers identically with the ATO and Friction Brakes/Air Systems differing. While, the Preventive Maintenance cost driver has no rail car major systems designated with high cost impact; seven rail car major systems have low cost impact assignments and three rail car systems have medium cost impact. Comparing rail car major system across the three cost drivers, close attention should be paid to: Trucks, HVAC System, and Propulsion System. Then, some time should be dedicated to Friction Brake /Air System. For the Aging cost performance measure and comparing rail car major systems across the three cost drivers, close attention should be paid to: Electronic System, HVAC System and Friction Brake/Air System. Then, there should be close monitoring of: ATO System, Doors, Couplers and Draft Gears, Lighting, and Propulsion System.
New England Professionals LLC Page 8 August 31, 2009

A Transit Methodologoy Using Six Simga for Heavy Rail Vehicle Maintenance Programs – Executive Summary
The contracting cost performance measure is applicable only to two cost drivers: Overhaul and Repair and Replacement. Seven of the ten rail car systems have a high impact on both cost drivers: Couplers and Draft Gears, Electronics, Propulsion System, HVAC, Trucks, Car Body, and Friction Brake/Air System. Case Study Observations were as follows:
Supporting Functional Areas/Offices have a high impact on the three cost drivers for rail car maintenance.
For the five cost performance measures, rail car major systems cost impact on Overhaul as well as Repair and Replacement cost drivers are the same.
For the five cost performance measures, rail car major systems cost impact varies across the Preventive Maintenance cost driver.
For the In-House Labor cost performance measure, six rail car major systems should be of high cost concern for Overhaul as well as Repair and Replacement cost drivers: Couplers and Draft Gears, Doors, Friction Brake/Air System, Propulsion System, HVAC, and Trucks.
For the In-House Labor cost performance measure, two rail car major systems should be of high cost concern for Preventive Maintenance cost drivers: Propulsion System and HVAC.
For the Materials cost performance measure, seven rail car major systems should be of high cost concern for Overhaul as well as Repair and Replacement cost drivers: Electronics, Doors, Friction Brake/Air System, Propulsion System, HVAC, Trucks, and Car Body.
For the Materials cost performance measure, two rail car major systems should be of high cost concern for Preventive Maintenance cost drivers: Electronics and HVAC.
For the Overtime cost performance measure, three rail car major systems should be of high cost concern for Overhaul as well as Repair and Replacement cost drivers: Propulsion System, HVAC, and Trucks.
For the Overtime cost performance measure, two rail car major systems should be of high cost concern for Preventive Maintenance cost drivers: Electronics and HVAC.
For the Aging cost performance measure, three rail car major systems should be of high cost concern for Overhaul as well as Repair and Replacement cost drivers: Electronics, HVAC, and Friction Brake/Air System.
For the Aging cost performance measure, two rail car major systems should be of high cost concern for Preventive Maintenance cost drivers: Electronics and HVAC.
For the Contracting cost performance measure, seven rail car major systems should be of high cost concern for Overhaul as well as Repair and Replacement cost drivers: Couplers and Draft Gears, Electronics, Propulsion System, HVAC, Trucks, Car Body, and Friction Brake/Air System.
Expansion of the abovementioned observations by the five cost performance measures will require:
1. Specifying the various labor classifications contributing to the high cost impact rail car major systems relative to the three cost drivers.
2. Specifying the various materials cost and level of inventory contributing to the high cost impact rail car major systems relative to the three cost drivers.
3. Specifying the amount of overtime being assigned to the high cost impact rail car systems relative to the three cost drivers.
4. Specifying the types of contract and amount for the high cost impact rail car systems relative to the three cost drivers.
New England Professionals LLC Page 9 August 31, 2009

A Transit Methodologoy Using Six Simga for Heavy Rail Vehicle Maintenance Programs – Executive Summary
5. Specifying the cost incurred by rail car maintenance when supporting functional areas/offices do not provide the require assistance when needed.
Transit Six Sigma Methodology “Transit Six Sigma (T6σ)” is a philosophy about how to link transit agencies intra-departmental processes with inter-departmental processes to execute organizational functions that enable a transit agency to provide effective and efficient customer-focus transit services in a cost-effective manner that maximize return on capital employed and return on investment of public dollars provide by FTA. This philosophy is rooted in FTA Research Intent for this project to develop a method, system, or technical solution to improve rail transit operations. Toward that end, New England Professionals proposed to design a Transit Methodology Using Six Sigma For Heavy Rail Vehicle Maintenance Programs, using Miami-Dade Transit (MDT) Process Improvement and Six Sigma Initiative as the basis. Therefore, the construct for a Transit Methodology Using Six Sigma For Heavy Rail Vehicle Maintenance Programs was divided into three parts: (1) Six Sigma Initiation – Cultural Change; (2) Six Sigma Execution – Planning; and (3) Six Sigma Deployment – Project Implementation. Six Sigma Initiation begins with a transit agency leader issuing a Policy Directive that signals a cultural change in the direction of Business Process Management. The Policy Directive crux should be used to realign the organization so that a link can be made between its vertical process functional
structure and its horizontal process structure to be more result-oriented and customer-focus. This requires establishing a clear relationship between an agency’s divisional business plans, process maps, and scorecards. In MDT’s case, their Process Improvement and Six Sigma Initiative emanated from Miami-Dade County policy directive about a first ever Strategic Plan for result-oriented government which was carried out, in part, through an Active Strategy Enterprise (ASE) System, an online performance management system. However, MDT success should be attributed to Director Kapoor commitment to process management which is evident in his past experience and expertise in improvements concerning efficiency, particularly when he was employed by Washington Metropolitan Area Transit Authority. Six Sigma Execution begins with the transit agency leader assigning a division the responsibility for its planning, management, and deployment, which should be the Office of Quality Assurance. Office of Quality Assurance first task is to create a Strategy that outlines what should be done to plan, manage, and deploy the methodology. The primary components should include: (1) Policy and Procedure Manual; (2) Staffing Plan; (3) Audit Process; (4) Training Program Plan; (5) Process Management Structure; (6) Process Ownership Tracking System; (7) Performance Measurement Plan; (8) Six Sigma Toolbox Manual; (9) Culture Transformation Plan; (10) Project Selection Plan; and (11) Data Collection Plan. In MDT’s case, the Office of Quality Assurance has been assigned the responsibility for instituting Six Sigma organization-wide and this responsibility
New England Professionals LLC Page 10 August 31, 2009

A Transit Methodologoy Using Six Simga for Heavy Rail Vehicle Maintenance Programs – Executive Summary
is part of QA Divisional Business Plan. All of the aforementioned components of QA Strategy are underway. Six Sigma Deployment of a Transit Methodology Using Six Sigma For Heavy Rail Vehicle Maintenance Programs starts by explaining the Fleet Management Plan to the Office of Quality Assurance. The Fleet Management Plan is a working document which necessitates annual review and updates for recent conditions and operating plans. The plan should present fleet requirements with details regarding as prescribed by MBTA and MDT: Current Fleet Profile and Plan –
Descriptions of Fleet, Fleet Management Strategies and objectives, and Fleet Plans through a specific future year;
Operational Policies – level of service requirements (peak and off-peak), load factors, schedules, headways, failure-in-service criteria, and failure resolutions;
Spare Ratio and Justification – preventive
and corrective maintenance, holds, long-term repair cars, spare train sets, procurement, and scrapping policies;
Maintenance and Capital Reinvestment
Programs; Operating Environment – weather, right-of-
way, track configuration, and signal systems.
With an understanding of the Fleet requirements, operations performance measures/indicators needs to be delineated. Then, the transactions that occur to determine outputs, outcomes, and impacts resulting from the definition, calculation, analysis, and interpretation of the operations performance measures/indicators must be documented. Key performance
measures/indicators should at least include such as MBTA: Ridership, Vehicle Availability, Mean Distance Between Failures, Mean Distance Between Disruptions, On-time Performance, Speed Restrictions, Overtime, and Customer Service Initiatives. The next task is to identify and understand the Maintenance Management Information System to determine how it is used for managing inventory, purchasing, creating and tracking work orders, labor allocation and other maintenance as well as materials management functions. The fourth task is for rail services to have a full-time Quality Manager on staff and to have an ASQ Certified Six Sigma Black Belt or Green Belt on staff for rail car maintenance with Six Sigma project implementation experience. Using the Fleet Management Plan, a fifth task is to determine maintenance approach currently being used or a combination of approaches for rail maintenance, such as: Condition-Based, Traditional, or Reliability-Centered. Whatever approach is used the key factors should be time, miles, and condition on a relational basis in terms of standards for rail car maintenance. Value Streaming Mapping should be a consideration in developing the appropriate relational basis for selecting a rail car maintenance approach. The sixth task deals with determining what entity or combination is used to set the standards for rail car maintenance, such as: Original Equipment Manufacturer, Rail Car Vendors,
New England Professionals LLC Page 11 August 31, 2009

A Transit Methodologoy Using Six Simga for Heavy Rail Vehicle Maintenance Programs – Executive Summary
New England Professionals LLC Page 12 August 31, 2009
Industry-wide Sources, and Rail Maintenance staff and technicians. The seventh task is to specify all functional support areas/offices that affect rail car maintenance and at what level, using discrete categories. Task eight involves preparing process maps for all rail car processes that impact the cost of rail car maintenance. In conjunction, Quality Assurance should prepare process maps of each process in the functional support areas/offices that affect the cost of rail car maintenance. Task nine is to construct a Rail Car Maintenance Cost Formula. This formula should show the cost of rail car maintenance as a function of its top level cost drivers plus the collective impact of functional support areas/offices that affect the cost of rail car maintenance. Then list the cost performance measures associated with each cost drivers. The tenth task requires constructing a set of matrices to determine discrete impact levels Major Rail Car Systems have on top level Cost Drivers by each cost top level performance measure. Task eleven is to use the Six Sigma tool (DMAIC) to address rail components of the Rail Car Maintenance Cost Formula and the Lean Six Sigma tool to address the supporting functional areas/offices of the Rail Car Maintenance Cost Formula. It should be noted that the DMA part of the Six Sigma tool is about process characterization and the IC part focuses on process optimization.
Transit Six Sigma Next Step New England Professionals (NEP) is
recommending that the next level of the proposed Transit Methodology Using Six Sigma for Heavy Rail Vehicle Maintenance be conducted by holding a one-day workshop for approximately twenty participants from the five transit agencies that participated in this National Research Project. The objective is to present the Transit Methodology Using Six Sigma For Heavy Rail Vehicle Maintenance Programs construct developed from the Miami-Dade Transit Case Study. It is an opportunity to create an agency-driven Transit Six Sigma focus group to share between agencies Transit Six Sigma Projects and Best Practices in support of the State of Good Repair for Rail Car Maintenance. The workshop format will include two sessions: σ Session One will have two
components: (1) Synopsis of MDT Six Sigma Initiative presented by MDT senior staff; and (2) Demonstration of MDT Six Sigma Rail Propulsion Project by MDT Quality Assurance Chief.
σ Session Two will focus exclusively
on the Transit Methodology Using Six Sigma For Heavy Rail Vehicle Maintenance Programs construct developed from MDT Case Study. Specifically, the Transit Six Sigma Methodology construct will focus on process characterization (define, measure, and analysis) with limited attention to process optimization (improve and control) because our focus at this point was on process characterization of rail car maintenance cost. Ultimately, a MDT deployment/how to manual will be outlined and discussed.

A Transit Methodologoy Using Six Simga for Heavy Rail Vehicle Maintenance Programs - INTRODUCTION
INTRODUCTION
Problem Statement The underlining focus of this research is to develop or produce a method, system, or technical solution for improving the effectiveness of rail transit operations. This focus suggests that investment of public resources for every transit project should yield a good return. That is, Federal transit programs have $45.3 billion of guaranteed funding for FY 2005 through FY 2009, which represent a 46 percent increase over the Transportation Equity Act for the 21st Century (TEA-21) funding. A good return on the aforementioned guaranteed funding ($45.3 Billion) is necessary in part because of information and data specified in the Strategic Research Plan. First, transit capital expenses spent in 2003 totaled $13.2 billion and nearly 40 percent was provided by the Federal Government. In addition, the average cost for a 40’ transit vehicle increased by $54,000 ($287,000 to $341,000) from 1999/2000 to 2004/2005. Second, the operating expenses for all modes, except heavy and commuter rail, have increased greater than inflation – according to FTA Strategic Research Plan (September 30, 2005). For example, between 1999 and 2003, inflation rate was 34.3 percent whereas operating expenses for unlinked passenger trips increased 37 percent. Third, Fifty-four (54%) percent of vehicle miles for transit services is generated by bus operations but the share of revenue miles has decreased from 64 to 54 percent. Fourth, it is estimated that an annual capital investment of over $9.1 billion in transit infrastructure would be needed to maintain current condition and performance of public transit assets, according to the 2002 Conditions & Performance Report. Sixty-four (64% $5.8 billion) percent of the $9.1 billion will be required to rehabilitate and replace rail assets; whereas, thirty-six (36%-$3.3 billion) will be necessary to rehabilitate and replace non-rail assets. Fifth, Ninety-six (96%-338,000) percent of the estimated 351,000 transit workers are involved in transit operations but there are cited problems by transit agencies in recruiting and retaining a skilled workforce. In conjunction, 2,000 agencies provide bus service but only 3,200 buses were built in 2004 and 2,500 were on order in January 2005 from about 15 manufacturers. Certainly, workforce development is needed and the domestic transit industry’s suppliers and manufacturers require help to be strengthened.
Purpose, Goal, and Objective The purpose of this research was to develop a methodology for determining how substantial public resources should be invested so that rail transit operations can be improved relative to capital and operating efficiencies. However, the goal was to use a proven methodology (Six Sigma) for increasing productivity and apply it in a transit environment to improve and sustain capital and operating efficiencies. Six Sigma is a disciplined data-driven approach and methodology for eliminating defects in any process.
New England Professionals LLC Page 13 August 31, 2009

A Transit Methodologoy Using Six Simga for Heavy Rail Vehicle Maintenance Programs - INTRODUCTION
But, the objective was to develop a Transit Methodology Using Six Sigma For Heavy Rail Vehicle Maintenance Programs that address transactional concerns and based on heavy rail vehicle maintenance using a sample of the existing thirteen U.S. Heavy Rail Transit Agencies that culminates with a Case Study of the most appropriate sample transit agency. The 13 agencies invited to participate included: (1) MARTA - Metropolitan Atlanta Rapid Transit Authority; (2) MTA - Maryland Transit Administration; (3) MBTA – Massachusetts Bay Transportation Authority; (4) CTA – Chicago Transit Authority; (5) RTA – Greater Cleveland Regional Transit Authority; (6) PATH – Port Authority Trans-Hudson; (7) PATCO – Port Authority Transit Corporation of PA & NJ; (8) MTA – Los Angeles County Metropolitan Transportation Authority; (9) MDT – Miami-Dade Transit; (10) NYCT – MTA New York City Transit; (11) BART – San Francisco Bay Area Rapid Transit District; (12) SEPTA – Southeastern Pennsylvania Transportation Authority; and (13) METRO – Washington Metropolitan Area Transit Authority.
Beneficiaries and Benefits Since rail operations (commuter, heavy, and light rail) comprise over 50% of transit service and represent a much larger component of capital expenditures and operating costs, the primary beneficiaries will be public transportation agencies that provide one of the aforementioned services or any combination thereof. The primary benefits include: (1) Standardize a methodology for public transportation agencies to identify and implement solutions to improve and sustain effective rail transit operations; (2) Establish cost performance measures to augment operations performance measures e.g. return on capital employed; and (3) Formulate a comparative criteria for determining how public dollars should be invested based on operations cost performance measures in conjunction with service performance measures.
Strategic Mandate The strategic framework for this research was the Federal Transit Administration’s (FTA) Strategic Research Plan for FY2006 – FY2010, dated September 30, 2005. It builds on the Strategic Research Plan set forth in October 2004 to establish FTA’s research priorities. Of equal import, it serves as the benchmark for determining how limited public funds should be invested in research projects for improving our Nation’s public transportation systems. FTA’s Vision to “Make Public Transportation the Mode of Choice in America” is the foundation for this strategic plan and the resulting Research Strategic Mission is to “Deliver Solutions that Improve Public Transportation”. As such, five Strategic Research Goals with corresponding objectives were formulated: (1) Provide Transit Research Leadership: (2) Increase Transit Ridership; (3) Improve Capital and Operating Efficiencies; (4) Improve Safety and Emergency Preparedness; and (5) Protect the environment and promote energy independence.
New England Professionals LLC Page 14 August 31, 2009

A Transit Methodologoy Using Six Simga for Heavy Rail Vehicle Maintenance Programs - INTRODUCTION
The Third Strategic Research Goal - Improve Capital and Operating Efficiencies – is the impetus for this research project. This goal consists of five objectives. Objective One involves identifying methods to control capital cost. Objective Two entails identifying solutions that will control operating costs. Objective Three encompasses identifying ways to improve transit operational efficiency, especially for bus, heavy rail, and demand response operations. Objective Four focuses on methods to facilitate and improve the monitoring as well as maintenance of transit infrastructure. Lastly, Objective Five deals with improving the capacity of domestic transit industry and workforce.
Context Statement Today, heavy rail operators across the nation are experiencing 2% to 5% increases in ridership per year. These ridership gains are straining their ability to provide the necessary vehicle capacity. As ridership grows, rail vehicle maintenance programs are seeing increases in the malfunction of rail car systems and corresponding components such as doors, climate control systems, brakes, communication systems, and vehicle computer systems. Nevertheless, previous research shows that “the maintenance function is one of the few areas in transit operations where effective management can have a direct impact on the monthly operating statement and the capital budget.” Sadly, research further indicates that “the maintenance function is viewed as an operating function which mysteriously works by itself.” However, we know that this perception is not true because financial management, capital programming, control center operations, facility management, and customer service are other functions in a transit agency that also play very critical roles in rail car maintenance, beside the most visible links to rail car maintenance - the supply of parts and qualified technicians. Rail car maintenance is a significant and complex activity because it has to deliver high levels of customer satisfaction while executing a rail car maintenance program that has to be effective and efficient. In other words, each transit agency must have a certain number of rail cars available per day to service its known ridership. If the rail cars are not maintained properly one or two basic situation occurs: (1) the system will not have enough trains with rail cars to service the known ridership; and (2) there are enough trains with rail cars to service the known ridership but some cars being used have unresolved problems that make riders unhappy or cause some trains to be taken out of service or have trains operating with some cars no usable to the ridership. Either one of the aforementioned situations will negatively impact customer satisfaction. That is, transit operational efficiency can be achieved by controlling operating and capital costs through the facilitation and improvement of the monitoring as well as maintenance of transit infrastructure while improving workforce capacity. This requires leadership that can make the links between a transit agency’s functional structure and its process structure. A few examples should shed light on the above-mentioned point. Clearly, management of the supply chain is essential to the overall performance of rail car maintenance. Parts ordered should reflect the maintenance problems identified and the parts should be easily accessible to the maintenance staff as well as be delivered in a timely manner without driving up the cost of inventory. Maintenance staff should be available and be well
New England Professionals LLC Page 15 August 31, 2009

A Transit Methodologoy Using Six Simga for Heavy Rail Vehicle Maintenance Programs - INTRODUCTION
trained in the areas of needs. Supplier invoices should not spend unnecessary time in the financial management offices. Heavy rail transit agencies around the nation are facing billions of dollars in unfunded maintenance needs. This suggests that capital programming should give priority to these sorts of expenditures in order to keep the systems in a state of good repair while also responding to growing and changing customer demands. Transit operations control centers play a critical role in operating safe and secure systems, especially those that operate in subways. Unnecessary offloads (unscheduled removal of all passengers) can create additional maintenance demands and cause travel time delays for customers. Working conditions in rail yards and shops can impact the quality of work produced by workers in those facilities. Finally, customer service agents can assist rail car maintenance through critical reviews of customer complaints and communication of the results to the maintenance departments. It is clear that transit agencies are seeking ways to improve cost efficiency and customer effectiveness through rail car maintenance. Many recognize that as rail car performance, measured by mean distance between failures (MDBF), goes down, customer satisfaction follows. In response, some transit agencies have developed composite performance measures like service reliability indices which might account for vehicle maintenance, customer satisfaction, system safety and system security. Some agencies are establishing new training programs for mechanics through vocational school, community college, and military partnerships. New business information technology (IT) systems are being installed, such as procurement management and inventory management systems. A number of control centers are being reconfigured along functional lines. In essence, transit agencies are recognizing that a more holistic approach is needed for rail car maintenance. As transit agencies are beginning to recognize the need for a holistic approach for rail car maintenance, Six Sigma process management is becoming a viable option, as evident by the U.S. Department of Defense recently establishing Six Sigma as their primary process management methodology. Six Sigma will enable managers to identify, define, improve, and manage the operational performance metrics that correlates most strongly to customer satisfaction and operational as well as capital cost efficiency. It will further enable managers to investigate specific performance components in a disaggregate manner, such as mean distance between failures (MDBF), to determine which specific process steps create the most value for the customer and deliver capital cost efficiency. Also, functional maps that identify agency-wide process links to different departments will enable managers and executives alike to identify an agency-wide critical path for delivering capital cost efficiency and customer satisfaction. The resulting increased transparency will improve the speed and quality of operational decisions, and inform the strategic shifts that will be required of a transit agency as the needs, challenges, and new opportunities of public transportation evolve, guided through rail car maintenance. Some of the key questions that can be addressed by using Six Sigma as a Transit Methodology For Heavy Rail Vehicle Maintenance Programs include: (As shown here in Table 1 - Rail Car Maintenance Key Questions):
New England Professionals LLC Page 16 August 31, 2009

A Transit Methodologoy Using Six Simga for Heavy Rail Vehicle Maintenance Programs - INTRODUCTION
How should an agency determine what is to be measured? How should customer requirements be used to plan and measure performance? What are the appropriate uses of these measures within operational and strategic contexts? What are the realistic performance expectations for what is measured? What are the credible baselines and legitimate sources of benchmarks?
Table 1 ‐ Rail Car Maintenance Key Questions
Most important of all, how will all these measures deliver customer satisfaction, which is ultimately the fundamental mandate of a public transit agency? Customer satisfaction surveys have shown that many factors correlate to customer satisfaction, including but not limited to: safety and security concerns, access to timely transit information, overcrowding in rail cars, schedule convenience, access to mobile communications, fully functioning infrastructure such as ticket machines, escalators and elevators, and on-time service. We therefore need a composite measure of customer satisfaction, a strategic key performance indicator (KPI) that will account for the full range of customer satisfaction requirements. As customer demographics and psychographics change, correlates and correlations will change. Demand and usage patterns will change, making the task of delivering customer satisfaction ever challenging. Addressing the challenges and seizing new opportunities will require shifts in agency-wide strategic and operational thinking, planning and execution, informed by a customer satisfaction KPI. An agency will have to develop a leadership bench that can make the link between a functional structure and a process structure, which understands the need to translate process to performance to transformation that understands the need for data driven procedural, methodological and behavioral interventions. Therefore, our tenet is that rail car maintenance is at the heart of transit planning, operations, and management. Specifically, transit operations (commuter, heavy, and light rail) comprise over 50% percent of transit service and represent a much larger component of capital expenditures and operating costs. As so, a holistic approach to rail car maintenance must be developed that links transit agencies’ departmental functions with organizational processes to achieve FTA’s Third Strategic Goal with subsequent customer satisfaction.
Project Parameters
Project Understanding The intent of this research project was to select a particular methodology and determine how it should increase the operational efficiency of rail transit systems. To do so, the focus was on one area of rail transit operations for a set of transit agencies. Then, the selected methodology was use to delineate the operational issues as they relate to the area under investigation. Furthermore, the investigation was viewed in relationship to how other transit agencies apply the selected methodology. Additionally, the selected methodology will be modified for application to the area under investigation. In doing so, a determination was made as to how success shall be evaluated and why it is significant to rail operations at the national level.
New England Professionals LLC Page 17 August 31, 2009

A Transit Methodologoy Using Six Simga for Heavy Rail Vehicle Maintenance Programs - INTRODUCTION
Transit Agency Participation Although all 13 existing U.S. Heavy Rail Transit Agencies were invited to participate in this research project, only five agreed: (1) MARTA - Metropolitan Atlanta Rapid Transit Authority; (2) MBTA – Massachusetts Bay Transportation Authority; (3) CTA – Chicago Transit Authority; (4) MDT – Miami-Dade Transit; and (5) SEPTA – Southeastern Pennsylvania Transportation Authority.
Technical Issues
• Definition of performance measurements. • Calculation of performance measurements. • Data collection and storage techniques. • Data analysis techniques. • Interpretation of data.
Limitations
• The level of detail was affected by the limited budget. • The quality of data will be affected by access to primary data sources of
participating transit agencies. • The use of secondary data and information sources, such as the National Transit
Database and American Public Transportation Association Fact Book, served as surrogates for inaccessible primary data sources, from the participating transit agencies.
Primary Deliverables The primary project deliverables were:
1. Site Visit Results 2. Case Study 3. Transit Methodology Using Six Sigma For Heavy Rail Vehicle Maintenance Programs 4. Schematic Proposal – Next Step
SYNOPSIS OF SIX SIGMA Six Sigma is one of many performance management methodologies used for building and sustaining business success as well as keeping the business customer-focused. However, research suggests that Six Sigma should serve transit agencies well in achieving effectiveness and efficiency organization-wide with particular success for rail car maintenance. This belief is grounded in the fact the most people – today - provide services rather than making goods and products. As so, transit agencies are clearly
New England Professionals LLC Page 18 August 31, 2009

A Transit Methodologoy Using Six Simga for Heavy Rail Vehicle Maintenance Programs - INTRODUCTION
primary service providers. But of equal importance and as pointed out by Peter S. Pande, Six Sigma is guided by the DMAIC model (Define, Measure, Analyze, Improve, and Control) that allow it to combine some of the best techniques of the past with recent breakthroughs in management thinking as well as plain old common sense. Therefore, it is continuously evolving and provides flexibility that can serve transit agencies well, considering the variance in the types of transit agencies that must address varying and changing customer requirements and demands.
Six Sigma Origin Using research conducted by George Eckes, Six Sigma originally a set of disciplined quality tools to reduce defect rates at Motorola; Six Sigma continued to evolve both within Motorola and later at AlliedSignal and General Electric. At Allied Signal it was used as a strategic enabler to achieving business objectives through a focus on managing by process rather than by functional area. Business leaders and managers played pivotal roles in selecting strategically important projects. General Electric developed Six Sigma into a management philosophy and cultural phenomenon by modifying organizational systems, structures and mechanisms, mandating involvement in Six Sigma a condition of promotion and earning bonuses, and increasing the focus on customers in selecting projects. Six Sigma revolves around a few key customer-centered concepts: • Critical to Quality: Attributes most important to the customer. • Defect: Failing to deliver what the customer want. • Process Capability: What your process can deliver to the customer. • Variation: What the customer sees and feels. • Stable Operations: Ensuring consistent, predictable processes to improve what the
customer sees and feels. • Design for Six Sigma: Designing to meet customer needs and process capability. These key concepts are supported by the following elements: • Mobilizing teams to attack high impact projects. • Utilizing rigorous data analysis to minimize variation in those project processes. • Driving rapid and sustainable improvement to business processes. • Developing organizational development and governance efforts to ensure
improvements are sustained.
Six Sigma Execution Research by George Eckes suggests that Six Sigma Execution consist of three components: Strategy, Tactics, and Culture. Strategy
New England Professionals LLC Page 19 August 31, 2009

A Transit Methodologoy Using Six Simga for Heavy Rail Vehicle Maintenance Programs - INTRODUCTION
The strategy has to be a clear delineation of the strategic business objectives of the organization. These objectives set the tone and guide the behavior of those in the organization and create a focus for resource and infrastructure issues. As such, there are eight steps to executing the Six Sigma Strategy:
Creation and management of strategic business objectives. Creation of core and key sub-processes. Identification of process owners. Creation and validation of measurement dashboards. Data collection on agreed dashboards. Creation of project selection criteria. Choosing first projects. Maintaining and managing the business process management system.
The creation and management of strategic business objectives deals with what needs to be done as opposed to how something is done - “whats” vs. “hows”. This is achieved by: (1) starting with the Mission of an organization and if necessary revisit/reformulate it; (2) creating a consensus, providing clarity and buy-in about how best to satisfy the mission; and (3) creating appropriate ways of measuring whether the mission is being fulfilled. The creation of core and key sub-processes centers on transforming vertical function-based thinking to horizontal process-based thinking. In short, it is a process management structure that can ensure that the right core processes have been identified and aligned to support the right strategic objective. This begins with selecting a core process and determining the start and stops points for the core process and determines the primary customer that goes through this core process. Then, the key measures of efficiency and effectiveness are defined for this core processes by drilling down to create the detailed sub-processes. Identification of process owners is important because a process owner’s responsibility is to ensure that the process measures of efficiency and effectiveness are done completely and that the process is improved upon. Process owners can go on to become project sponsors, known as Project Champions in Six Sigma. Characteristics of a good process owner are:
Must be a subject matter expert. Must be the individual that experiences the most gain or pain from performing
this process. Should have stature and respect within an organization. Should have an aptitude and attitude for process-based thinking and improvement.
Creation and validation of measurement dashboards is a report of the measures for a key process efficiency and effectiveness. Effectiveness measures refer to those elements that measure how well the sub-process meets and preferably exceeds the customer’s
New England Professionals LLC Page 20 August 31, 2009

A Transit Methodologoy Using Six Simga for Heavy Rail Vehicle Maintenance Programs - INTRODUCTION
needs and requirements. Efficiency measures refer to those measures that tap into the resources consumed in achieving their goals. Data collection on agreed dashboards is accomplished by using techniques such as one-on-one interviews, focus groups, and surveys. They are used to collect data to create the agreed to dashboards. There are three considerations for the creation of project selection criteria: (1) Resource constraints – direct resources to support Six Sigma interventions; (2) Infrastructure constraints – the organizational structures and governance mechanisms required to execute and implement Six Sigma organization wide; (3) Early success – ensures buy-in to Six Sigma within the organization. Two highly recommended selection criteria are:
Current performance – the more broken a process, the easier it is to improve, leading to a quick win and ensuring future buy-in to Six Sigma.
Impact on strategic business objectives - the bigger the impact on the strategic business objective the greater the chance of buy-in.
Choosing first projects involves rating sub-process according to: impact on strategic business objective, current performance, impact on resources, potential cost savings, and chance for success. There are three key considerations to maintaining and managing the business process management system:
• Expanding beyond process improvement projects (DMAIC) and into process design projects (DMADV) and Lean Six Sigma projects.
• Modifying the organization’s systems, structures, and governance to make Six Sigma the default way of doing business in the organization.
• Promoting and managing the resistance to Six Sigma as a management philosophy.
Tactics The key elements of tactics are sponsorship and tactical execution. But, tactical execution is divided into two parts: (1) Team Dynamics, Define, and Measure; and (2) Analyze, Improve, and Control. Sponsorship – The Project Champion - A primary cause of project failure is poor sponsorship of the Six Sigma team due to inadequate levels of organization involvement. A strong project sponsor is required to ensure that the Six Sigma team achieves its goals and objectives. In Six Sigma this sponsor is called the Project Champion or just the Champion. The Project Champion has responsibility for creating a preliminary project charter with the following key elements:
Selecting the team.
New England Professionals LLC Page 21 August 31, 2009

A Transit Methodologoy Using Six Simga for Heavy Rail Vehicle Maintenance Programs - INTRODUCTION
Choosing a Team Leader. Creating a business case. Creating the preliminary problem statement. Defining the scope of the project. Identifying the team’s goals and objectives. Allocating resources. Setting the project timeline. Communicating the business case to the team. Agreeing on decisions that the team can make autonomously and those that
should involve the Champion.
The criteria for selecting the team consist of five elements:
Select those that have the greatest subject matter expertise and hands-on experience in the process targeted for improvement.
Select for diversity within the organizational structure, vertical and horizontal – individual contributors and a strong manager typically make the best teams.
Create a full time, dedicated team that can, if required, be augmented in an ad hoc manner, with specialized expertise.
Membership of multiple teams is to be discouraged and a business leader should ultimately make an allocation decision.
It may be appropriate to include a stakeholder, external and/or internal, on the team. A stakeholder may bring a perspective that could be valuable to the process improvement effort while building strong stakeholder buy-in and cooperation.
Choosing a Team Leader – The team leader should be accomplished at project management and should be respected by the other team members and the Champion. Typically, the Team Leader is a Black Belt or Green Belt. Creating a business case - A business case is a qualitative statement about why a project exists and how it impacts the organization. It should be clear and concise. It should create motivation for the team’s emotion and behavior, and ultimately establish the work focus for the team. Creating the preliminary problem statement - The preliminary problem statement is a quantitative statement of the problem that specifies a time frame, determines the gap between the current state and the desired state, describes the impacts to the organization, is specific and measurable, and is stated in neutral terms, neither jumping ahead to root causation nor stating an implied solution. Defining the scope of the project - Scope creep is a challenge for all projects. The most important responsibility of the Champion is to identify and manage the scope of the project. The Champion should define the boundaries of what the team should work on by clarifying the elements of work that should and should not be addressed.
New England Professionals LLC Page 22 August 31, 2009

A Transit Methodologoy Using Six Simga for Heavy Rail Vehicle Maintenance Programs - INTRODUCTION
Identifying the team’s goals and objectives - It is accepted by most experts that until data are collected in the Define stage of DMAIC, setting a target of 50% improvement in baseline performance is recommended. It is the responsibility of the Champion to adjust the success level to a suitable level once data has been collected. Allocating resources - Adequate resources, generic and specialized, must be allocated so that the scope of work can be fulfilled. Setting the project timeline - The timeline will be determined primarily by resource and infrastructure constraints, and the evolving experience, accomplishments and confidence of the team. Communicating the business case to the team - The Champion needs to develop a communication plan to sell the project to the team. It should motivate the project team to support and involve themselves in the project. The business case should address the following key points:
What the business case is for the project. Briefly describe what Six Sigma is as it relates to the project. Describe how and why the team was selected. Describe the expected outcomes from the team. Describe the benefits of participation to the organization and individual team
members. Agreeing on decisions that the team can make alone and those that should involve the Champion - The sub-elements or tollgates of DMAIC should be approved by the Champion, as should the criteria the team should apply to the proposed solutions. Tactical Execution (Part 1) – Team Dynamics, Define and Measure Team Dynamics – Team Dynamics are made up of a variety of elements that contribute to successful completion of the DMAIC methodology. They include but are not limited to:
Creation and utilization of vibrant agendas - A detailed agenda is imperative and it should include: (1) the desired outcome for each meeting; (2) the item(s) to be covered in a meeting; (3) the method/tool to address the item; (4) the person(s) responsible for the item; and (5) the amount of time needed to complete the item.
Agreement on a primary and secondary decision-making method – It is recommended that consensus be the primary decision-making method and 2/3 majority as the secondary method when consensus cannot be reached.
Establish ground rules for meetings – Operating agreements must be established prior to the meeting so that a meeting stays on track.
New England Professionals LLC Page 23 August 31, 2009

A Transit Methodologoy Using Six Simga for Heavy Rail Vehicle Maintenance Programs - INTRODUCTION
Dealing with maladaptive behaviors – There are a host of maladaptive behaviors that can derail a team, if allowed to fester. Some are: coming late and leaving meeting early, one person dominating the discussions, and excessive clowning.
Dealing with team member resistance – It can be expected that among a six to eight team members, resistance to will occur. Thus, the team leader and/or Champion must intervene to prevent the team from failing.
Define – To soundly define a problem three actions must be achieved: completion of a preliminary project charter, determination of customer needs and requirements, and creation of a high-level process map. These outputs must meet with the Champion’s approval. Measure – To clearly measure the problem, a data collection plan must be created and implemented and it must meet with the Champion’s approval. There are three areas for data collection:
1. The measures important to the customer. 2. The measures of effectiveness emanating from the supplier - the inputs to the
process. 3. The measures of efficiency within the process - the outputs from the process.
Tactical Execution (Part 2) – Analysis, Improve and Control Analysis – This is the most important element of DMAIC and it is the key element of most successful project teams. It consists of three activities: data analysis, process analysis and root cause analysis. Improve – Improvement can be accomplished by generating/selecting solutions and gaining buy-in to those solutions. It can be the easiest element of DMAIC to master if the team does a good job of data analysis and root cause analysis. Control - The team must find a technical control tool to monitor a new process. The type of tool will be determined by the standardization of the new process and the amount of throughput of services or products through the process. Culture To make Six Sigma a cultural phenomenon in the organization, the following must occur:
1. Close the loop of the completed DMAIC project. 2. Manage process dashboards from completed projects. 3. Choose new projects for improvement. 4. Create a detailed second-year deployment plan that includes a strong
communication vehicle, and further training and succession. 5. Become self-sufficient in terms of DMAIC and project coaching.
New England Professionals LLC Page 24 August 31, 2009

A Transit Methodologoy Using Six Simga for Heavy Rail Vehicle Maintenance Programs - INTRODUCTION
6. Expand beyond process improvement projects into process design projects (DMADV) and Lean Six Sigma projects.
7. Alter organizational systems, structures and mechanisms to institutionalize Six Sigma as a natural and holistic way of doing business in the organization.
8. Make the concept of Six Sigma an everyday event for employees. 9. Manage the resistance to Six Sigma as a management philosophy.
Six Sigma Implementation According to Peter S. Pande, there are three basic elements to implementing Six Sigma: 1. Process improvement. 2. Process design/re-design. 3. Process management. Process improvement - The purpose of process improvement is to eliminate the root causes of performance deficiencies in processes that already exist in the organization. These performance deficiencies may be causing real problems for the organization or may be preventing it from working as efficiently and effectively as it could. To eliminate these deficiencies a five-step approach is used:
1. Define – a serious problem is identified and a project team is formed and given the responsibility and resources for solving the problem
2. Measure – data that describes accurately how the process is working currently is gathered and analyzed in order to produce some preliminary ideas about what might be causing the problem.
3. Analyze – based upon these preliminary ideas, theories are generated as to what might be causing the problem and, by testing these theories, root causes are identified.
4. Improve – root causes are removed by means of designing and implementing changes to the offending process.
5. Control – new controls are designed and implemented to prevent the original problem from returning and to hold the gains made by the improvement.
Process Design/Redesign - Sometimes simply improving existing processes is not enough; therefore, new processes will need to be designed or existing processes will need to be re-designed. There are several reasons why this could be necessary:
• An organization may choose to replace, rather than repair, one or more of its core processes.
• An organization discovers, during an improvement project, that simply improving an existing process will never deliver the level of quality its customers are demanding.
• An organization identifies an opportunity to offer an entirely new product or service.
New England Professionals LLC Page 25 August 31, 2009

A Transit Methodologoy Using Six Simga for Heavy Rail Vehicle Maintenance Programs - INTRODUCTION
As with process improvement, a five-step approach is used to design/re-design a process:
• Define – identify the goals for the new process, taking into account the customer requirements.
• Match and Measure – develop a set of performance requirements for the new process that match these goals.
• Analyze – carry out an analysis of these performance requirements for the new process, and based upon this produce an outline design for the new process.
• Design & Implement – work this outline design up into a detailed design for the new process, and then implement it.
• Verify – make sure the new process performs as required and introduce controls to ensure it keeps performing that way.
Process management - Because process management requires a fundamental change in the way an organization is structured and managed, it is often the most challenging and time-consuming part of Six Sigma. In general, process management consists of:
• Defining processes, key customer requirements, and process owners. • Measuring performance against customer requirements and key performance
indicators. • Analyzing data to enhance measures and refine the process management
mechanisms. • Controlling process performance by monitoring process inputs, process operation,
and process outputs, and responding quickly to problems and process variations. PROCESS IMPROVEMENT IN DETAIL Step 1 – Define Having identified the improvement project to be carried out, the project needs to be established by carrying out the following activities:
• Prepare A Problem Statement - this statement must describe the problem in specific terms that identify: what is wrong; what is the visible evidence of the problem – the symptoms; how serious is the problem, expressed in quantifiable and measurable terms; how large is the problem – can it be addressed by a single, manageable size improvement project or will it need to be sub-divided into several smaller, manageable projects.
• Prepare A Mission Statement - this statement must describe what is going to be done about the problem, i.e., the objective of the improvement project. The mission statement should contain the same variable and unit of measure as does the problem statement.
• Select A Project Team - the project team selected should be a cross-functional team that spans all functions upon which the improvement project will have an impact, both direct and indirect.
New England Professionals LLC Page 26 August 31, 2009

A Transit Methodologoy Using Six Simga for Heavy Rail Vehicle Maintenance Programs - INTRODUCTION
Step 2 – Measure During the “Measure” step, symptoms of the problem that exists are identified and a baseline measurement of current and recent performance is established. Also, a map of how the process that is producing the problem operates is developed. However, the real purpose of this step is to analyze the symptoms and then to confirm, or modify, the mission statement based upon the results of this analysis. In Six Sigma a symptom is defined as the outward, observable evidence of a problem. It is an output of the process that is producing the problem. If a symptom like this occurs on an ongoing basis, it signals a chronic, underlying quality problem that needs to be addressed. To address such a problem, first of all, the symptom needs to be analyzed in the following manner:
• Develop operational definitions. • Measure the symptom. • Define the boundaries – that is, the scope of the improvement project. • Concentrate on the vital few – those sources of error thought to be largely
responsible for the problem. It is time consuming to attempt to tackle all possible sources, and the result may not justify the effort.
Once the above analysis of the symptoms has been completed, the mission statement should be revisited to confirm that it is still applicable, or to modify it to make it applicable. The results of the analysis may reveal that the problem is somewhat different from the one that was originally described; or that the improvement project is too large and needs to be broken down into more manageable parts. Step 3 – Analyze During the “Analyze” step, theories about the causes of the problem are formulated, these theories are tested and finally the root causes of the problem are identified:
• Formulating The Theories – the project team brainstorms possible theories, documents them, and then organizes them in the form of a cause-and-effect diagram.
• Testing The Theories – before any theory can be accepted as true, it must be systematically tested. Any data required to test a particular theory, which is not available, must first be collected. If the data collected demonstrates that a particular theory is clearly not important, then that theory can be eliminated.
• Identifying The Root Cause(s) – once testing has been completed, the root cause(s) of the problem should be able to be determined. Once found, the removal of the real root cause(s) will sharply reduce or eliminate the problem/deficiency.
Step 4 – Improve
New England Professionals LLC Page 27 August 31, 2009

A Transit Methodologoy Using Six Simga for Heavy Rail Vehicle Maintenance Programs - INTRODUCTION
During the “Improve” step, several sequential activities are performed:
• Evaluation Of Alternatives – Alternative Improvement methods are evaluated to determine which method will best removed or reduced the effect of the root cause(s) of the problem. This evaluation is carried out using a set of evaluation criteria such as cost, impact, cost/benefit ratio, cultural impact etc.
• Design Of The Improvement – An improvement method has been selected, the improvement process is designed by confirm that the improvement achieves the project goals; determining the required resources; specify the procedures and the other changes required; assessing human resource requirements to determine whether any training/re-training is required.
• Plan For Cultural Resistance– By their very nature, improvement efforts create change in an organization and cultural resistance is a natural consequence of change. Therefore, dealing with this potential cultural resistance needs to be factored into the improvement project plan.
• Prove Effectiveness – Before an improvement is finally adopted, it must be proven effective under operating conditions. This could be done with a pilot test; a dry run, which doesn’t involve delivery to the customer; an acceptance test; a simulation
• Implement – This involves introducing the proposed change to the people that will make it work. This demands that: a clear plan; a description of the change; an explanation indicating why the change is necessary; involvement of those affected; the change. The most important parts of implementation, though, are good planning, good preparation, and good cooperation between all of the individuals concerned.
Step 5 – Control During the “Control” step, controls are put in place to ensure that the gains that have been achieved will continue and the problem will not recur. To do this the following activities need to be carried out:
• Design effective quality controls. • Foolproof the improvement. • Audit the controls
PROJECT IMPLEMENTATION Project Implementation was guided by a Case Study research design that aimed to provide insight into a particular situation and often stresses the experiences as well as interpretations of those involved. New understandings, explanations, and hypotheses were generated with a keen sensitivity to representation and generalizations. Furthermore it provided an evaluation of organizational change from a formative and summative perspective. A formative perspective is designed to inform the process development;
New England Professionals LLC Page 28 August 31, 2009

A Transit Methodologoy Using Six Simga for Heavy Rail Vehicle Maintenance Programs - INTRODUCTION
whereas, a summative perspective is designed to judge the effects. In this research, both methods were used to complement and supplement one another.
Research Design Selection of Case Study Type This research project was conducted using a non-experimental design – Case Study. Previous research indicates that it is a time-honored and traditional approach for studying social science and management topics; furthermore, it allows for the discovery of more critical variables because only one or a few entities or situations are being studied. More specifically, pervious research further points out that a Case Study approach enables the researcher to uncover causal paths and mechanisms as well as identify – through richness of detail – causal influences and interaction effects which might not be treated as operationalized variables in a statistical study. As such, it may be particularly helpful in generating hypotheses and theories in developing fields of inquiry. However, although case study research may be used in its own right, it is more often recommended as part of a multi-method approach in which the entity of interest is investigated using multiple procedures. Based on the aforementioned statement, our first decision was to select the appropriate type of Case Study. As such, the Pre-post Case Study type was selected and it is designed to study one research entity at two time points separated by a critical event. The Pre-post Case Study design will be guided by explanation-building. Under Explanation-building, the case researcher does not start out with a theory to be investigated. Rather, the researcher attempts to induce theory from the case example chosen to represent diversity on some dependent variable. A list of possible causes of the dependent variable is constructed through literature review and brainstorming, and information is gathered on each cause for the selected case. The researcher then inventories causal attributes which are common to the selected case. The researcher comes to a provisional conclusion that the differentiating attributes are the significant causes. Explanation-building is particularly compelling when there are plausible rival explanations which can be rebutted by this method. Supporting Procedures The second decision was to select supporting procedures for the above-mentioned Case Study Design – Pre-Post. The supporting procedures include: Content Analysis, Narrative Analysis, and Participant Observation augmented with non-participant observation; however, it should be noted that the supporting procedures used both quantitative and qualitative analysis separately as well as together. Content Analysis is the manual or automated coding of documents, transcripts, newspapers, or even of audio of video media to obtain counts of words, phrases, or word-phrase clusters for purposes of statistical analysis. While content analysis is normally
New England Professionals LLC Page 29 August 31, 2009

A Transit Methodologoy Using Six Simga for Heavy Rail Vehicle Maintenance Programs - INTRODUCTION
focused on the analysis of print media and media transcripts, it is applicable to any form of communication. Narrative analysis is analysis of a chronologically told story, with a focus on how elements are sequenced, why some elements are evaluated differently from others, how the past shapes perceptions of the present, how the present shapes perceptions of the past, and how both shape perceptions of the future. Participant observation is a straightforward technique that allows the researcher to be immersed into the subject being studied. This technique enables the researcher a greater understanding of the subject by obtaining first-hand information and data. In short the researcher can reflect on their experiences with the subject in order to improve the organization through the action of one individual, group of individuals, or a collegial team approach.
Research Methodology This research methodology has two purposes: (1) explain how the data was collected or generated; and (2) explain how the data was analyzed. Data collection was accomplished using interviews, direct observation, unobtrusive method (such as exploring official data and records as well as organizational data), and reporting (requiring information to be provided without asking direct questions). It should be noted that data collection was in a number of manners: (1) formal to informal; (2) structured to unstructured; (3) participant and non-participant; (4) candid to covert; and (5) one- on-one or group. Data analysis was primarily conducted using trend analysis to determine patterns for predicting or forecasting future direction of events; however, a combination of data collection methods were used which required employing other analytical techniques. Execution of data collection and analysis involved five steps: Step One required analysis of the National Transit Database to determine the state of rail car maintenance from 2003 to 2006 for the five participating transit agencies: (1) MARTA - Metropolitan Atlanta Rapid Transit Authority; (2) MBTA – Massachusetts Bay Transportation Authority; (3) CTA – Chicago Transit Authority; (4) MDT – Miami-Dade Transit; and (5) SEPTA – Southeastern Pennsylvania Transportation Authority. The focus was on service supplied and consumed as well as revenue vehicle maintenance performance. Special emphasis was placed on Mean Distance Between Failure (MDBF) for the years between 2003 to 2006. Step Two involved conducting a site visit of the five participating transit agencies with concurrence of each agency that follow-up data requests would be complied with but sensitive to availability of senior staff time. During the site visits, formal and informal interviews were conducted in structured and unstructured manners through one-on-one communication as well as group. Direct observations were made of rail car maintenance facilities along with exploring official data and records such as transit service reports, capital investment program, fleet management plan, operations performance indicators,
New England Professionals LLC Page 30 August 31, 2009

A Transit Methodologoy Using Six Simga for Heavy Rail Vehicle Maintenance Programs - INTRODUCTION
budget plan, and rail maintenance performance management. In conjunction, requests were made for data and information (such as the systems that comprise a rail car) without asking direct questions. Step Three entailed using the key findings from the site visits to determine which transit agency should be the preferred Case Study. Examples of the key findings included average annual ridership, fleet size, average car age, and MDBF. With a selection having been made a Pre-post Case Study was conducted. The categorical format of the Case Study will be: (1) Research Phase; (2) Analysis Phase; and (3) Actual Writing. Of equal import, the Case Study will emphasis Rail Car Maintenance (i.e., cost, improvements, efficiency, and management). Step Four used the results of the Pre-post Case Study and site visits findings along with trend analysis with supporting analytical techniques to develop a Transit Methodology Using Six Sigma For Heavy Rail Vehicle Maintenance Programs. Step Five was the preparation of a schematic proposal for the Next Step effort to determine how a Transit Methodology Using Six Sigma For Heavy Rail Vehicle Maintenance Programs can be further validated, implemented, and evaluated for FTA use and the transit industry.
Project Management The objectives of project management were to: (1) ensure that the project stays on schedule; (2) complete the project within budget and on schedule; (3) produce quality products; and (4) provide open lines of communication among the project team members and with FTA staff. To do so, an integrated and cross utilization staffing scheme was used to produce and control the completion of this project. Characteristics of this scheme are as follows: • A Project Principal is responsibility for assuring that the corporate commitment of
professional staffing and technical support is made available for the project. • A Project Manager is assigned to the project with overall responsibility for the
contract, including scheduling, day-to-day client contact, technical direction and administration.
• A Technical Manager is assigned to the project and is responsible for technical
oversight of project activities. • A Technical Advisor is responsible for providing complementary technical guidance
in the development and implementation of the project tasks. • Core Team Members are assigned based on their demonstrated experience on this
type of project, availability and professional interest in the project.
New England Professionals LLC Page 31 August 31, 2009

A Transit Methodologoy Using Six Simga for Heavy Rail Vehicle Maintenance Programs - INTRODUCTION
• Clerical Support Personnel will assist in document processing, graphics, and other
technical support services. Collectively, the project team members have, on average, 25 years of experience and their primary roles and responsibilities are listed below in Table 2 ‐ NEP Team Member:
Team Member Position Primary Responsibilities Wendy Tyson-Wood Project
Administrator Project oversight, report preparation, Database development and analysis, methodology development, and data collection
Kenneth R. Cook, Ph.D. Project Manager Project planning, scheduling, administration, coordination, methodology development, report preparation, and data analysis and interpretation
Edward L. Thomas Technical Manager
Process design and development, data analysis - interpretation, methodology development, and database development for Site Visits
A Siranjan Kulatilake
Technical Advisor/ Quality Control
Report preparation for Site Visits
Clerical/Administrative Assistant
Core Team Member Project Assistance as assigned and needed
Table 2 ‐ NEP Team Member
Work Plan The research work plan began with a project mobilization meeting to reach a consensus about project goals, establish the basic context within which the project will be completed, delineate project team assignments, provide any clarification about the statement of work, and specific any project expectations implicit in the statement of work. After the project mobilization meeting, a draft notification letter for inviting the 13 transit agencies to participate in this national research was submitted to FTA for final approval with subsequent mailing to the transit agencies by FTA Associate Administrator. In tandem, work implementation plan was prepare and submitted to FTA. Once which transit agencies accepted the invitation to participate, a project context statement and agenda was prepared to brief the contact person for the participating agencies so that the site visit could be scheduled and conducted. Completion of the site visits culminated with: (1) submittal of a thank you letter to the General Manager of each participating agency; and (2) an annotated profile of each agency with emphasis on rail car maintenance along with key findings used to select which transit agency should be the preferred Case Study. Then, a working draft report was prepared for submittal to FTA. At his point, the case study was scheduled and conducted with the selected transit agency. The case study was then used to develop a Transit Methodology Using Six Sigma For Heavy Rail Vehicle Maintenance Programs and prepare a schematic proposal to determine how the Transit Methodology Using Six Sigma For Heavy Rail Vehicle Maintenance Programs can be further validated, implemented, and evaluated for FTA use and the transit industry. Finally, the Draft Report was prepared and submitted to FTA for written and oral
New England Professionals LLC Page 32 August 31, 2009

A Transit Methodologoy Using Six Simga for Heavy Rail Vehicle Maintenance Programs - INTRODUCTION
New England Professionals LLC Page 33 August 31, 2009
comments, changes, and edits. Using FTA written and oral response to the Draft Report, a Final Report was submitted.
Strategic Milestones The strategic milestones were within the sequence of the Work Plan.
Milestones Completion Period Begin/End Period
Quarters
Project Mobilization Scoping Meeting Work Implementation Plan Confirmation of Host Agencies
May 1, 2008 /July 31, 2008 First Quarter
Site Visits, Annotated Profiles, and Working Draft MDT – September3, 2008 CTA – September 23, 2008 MBTA – October 8, 2008 MARTA – October 27, 2008 SEPTA – November 6, 2008
August 1, 2008 / Feb. 28, 2009
Second QuarterThird Quarter Fourth Quarter
Case Study Case Study Research Case Study Analysis Case Study Write-up
Feb. 1, 2009 / May 31, 2009 Fourth Quarter Fifth Quarter
A Transit Methodology Using Six Sigma For Heavy Rail Vehicle Maintenance Programs and Next Step Future Validation Future Implementation Future Evaluation
May 1, 2009 / June 30, 2009
Fifth Quarter
Final Report May 1, 2009 / July 31, 2009 Fifth Quarter Table 3 ‐ NEP Strategic Milestones

A Transit Methodologoy Using Six Simga for Heavy Rail Vehicle Maintenance Programs – TRANSIT AGENCY SITE VISITS
TRANSIT AGENCIES SITE VISITS
Site Visits Framework Transit agencies, like most other organizations that provide service, are confronted each day with a vast array of challenges. Rail car maintenance is one of those challenging areas. According to an FTA Report on State of Good Repair and as presented in Figure 1 ‐ Over Age Assets by Type, rail cars typically exceed their useful life. Of the ten classes of transit assets shown, rail cars and signals are two classes that typically exceed their useful lives by as much as 25% to 30%.1
Figure 1 ‐ Over Age Assets by Type
Older assets generally require greater maintenance which in turn increases the costs of providing service; furthermore, as costs increase, customer satisfaction e.g. as measured by service reliability decreases, as conceptualized in Figure 2 ‐ A Vexing Performance Challenge. Such trends are symptomatic of existing or impending problems in vehicle performance.
Figure 2 ‐ A Vexing Performance Challenge
1 State of Good Repair: Beginning the Dialogue, Federal Transit Administration, October 2008.
New England Professionals LLC Page 34 August 31, 2009

A Transit Methodologoy Using Six Simga for Heavy Rail Vehicle Maintenance Programs – TRANSIT AGENCY SITE VISITS
Source: Transforming a 100 Year Old Transit Agency, Ron Huberman, President, CTA , 2008
The objective in solving this vexing problem is becoming more cost efficient and customer effective at the same time. Meeting such a challenge strategically means keeping one foot squarely in the matters of today while stepping confidently with the other foot towards the risks and uncertainties of the future.
This research argues for greater use of performance management tools in general and the Six Sigma Process Management Improvement Methodology in particular. According to CTA, a Performance Management System for transit agencies should have the following objectives:
Establish accountability
Ensure customer focus
Align services with other strategic goals
Analyze and evaluate service delivery Take corrective actions to solve deficiencies Monitor and provide feedback on performance Communicate whether high-quality efficient and effective service is being
provided.
Six Sigma defines performance management as defining, measuring, analyzing, improving and controlling (DMAIC) performance.
The purpose of this section is to define the rail car maintenance function, discuss performance measurement in the context of this function and summarize how 5 heavy rail transit agencies can improve their rail car maintenance processes through the use of Six Sigma or other performance management approaches.
Rail Car Maintenance Like most functions in a transit agency, rail car maintenance is not an island unto itself. Its performance is dependent upon many other functions as noted in Figure 3 - Functional Affinity Map. The essence of a Six Sigma Process Management Improvement Methodology is to foster organizational ownership and cooperation, to define and analyze problems, to identify solutions, and to track solution implementation and performance. In a Rail Car Maintenance Six Sigma effort, one of the first steps is to develop a functional affinity map of the interdepartmental relationships similar to what is shown in Figure 3 ‐ Functional Affinity Map.
The key point to this figure is that it takes an enterprise to produce a high performing Rail Car Maintenance Program. Procurement must provide the right parts at the right time for the right price. Accounting must pay parts vendors promptly. IT must provide state-of-the-art, user friendly parts management systems. Engineering assures the adequacy of
New England Professionals LLC Page 35 August 31, 2009

A Transit Methodologoy Using Six Simga for Heavy Rail Vehicle Maintenance Programs – TRANSIT AGENCY SITE VISITS
designs and quality of the parts. Human resources must provide maintainers with training on new technology, customer service provides customer feedback and operations can help pinpoint failure problems. An affinity map is typically followed by a process functional flowchart which shows the inputs, outputs, functions and decision points in the rail car maintenance process. Specifically, an affinity map is the result of a brainstorming process whereby participants organize their ideas by grouping them along a set of descriptive pairs. The affinity map below is an example provided by the project team Technical Manager as a result of his experience at Washington Metropolitan Area Transit Authority.
Figure 3 ‐ Functional Affinity Map
Rail car maintenance is critical in achieving cost efficiency and cost effectiveness strategic goals. Unfortunately, a recent FTA report shows that investment in maintaining transit systems in a state of good repair is not adequate to meet the needs. More specifically, current investment rates meet only 60% - 80% of the backlog of normal replacement needs. In addition, transit agencies continue to be hit with double digit rates of increase in energy and health care costs. These situations are occurring at a time when transit agencies are experiencing record increases in ridership. Nationwide growth rates range from 3% to 6%. Contributing factors include the expanding capacity of the 1990’s, more transit oriented development (TOD) and auto cost increases. In heavy rail metropolitan areas, more efficient rail car maintenance is critical towards meeting the increasing customer demands.
A typical Rail Car Maintenance Program includes daily servicing, scheduled maintenance, overhauls and unscheduled maintenance. Daily servicing involves routine
New England Professionals LLC Page 36 August 31, 2009

A Transit Methodologoy Using Six Simga for Heavy Rail Vehicle Maintenance Programs – TRANSIT AGENCY SITE VISITS
inspections and cleaning. Scheduled maintenance is usually in accordance with manufacturer’s recommendation, failure history, and failure analysis.
Overhauls are normally based on useful life of components and may occur in phases. The overhaul phases are based on miles operated or years operated whichever occurs first. For example, hydraulic components and systems and electrical systems and components may be rebuilt or overhauled occur every two years. Motor truck assemblies, track motors, suspension systems, and doors may be rebuilt or overhaul every 5 - 10 years. The replacement of electrical systems (climate control, communication, and power) and external and internal refinishing and painting is normally every 10 -15 years.
Rail car overhauls are usually planned. They are accounted for in fleet management plans, capital plans and programs, and multi-year operating budgets. In addition, customers can be informed in advance to consider alternatives like supplemental bus service or carpools.
While overhauls may pose minor capacity challenges, unscheduled maintenance or failures can cause customer service havoc in a transit system. They may produce the off-loading of passengers onto crowded platforms, service delays, ricocheting impacts on other lines, and safety challenges. Unscheduled maintenance results from a variety of causes: dysfunctional brakes, doors, climate control systems, communication systems, propulsion system, electrical systems, and signaling systems. Transit customers normally rank service reliability as the most important factor in transit service delivery. Consequently, minimizing failures is a primary objective of heavy rail transit agencies.
Performance Measures Performance measurement sits between organizational transformation activities like strategic planning and performance management. Strategic planning identifies an organization’s challenges and opportunities, lays out strategic goals for the future, formulates solution strategies and presents performance measures to track progress. Performance measures are usually extensions of strategic goals. They are the metrics for determining whether goals are being achieved and ensures accountability.
“Performance measures for the sake of measurement do not lead to solutions to problems.”
Six Sigma promotes consideration of both cost efficiency and customer effectiveness performance measures because cost efficiency is for the purpose of increasing customer effectiveness. As noted above, Six Sigma started out as an approach for reducing defects in manufactured products. However, the early users led by GE quickly recognize the need to add a customer focus.
Numerous measures are available for determining the performance of rail car maintenance. Measurement areas include: reliability, capacity, quality, condition, and
New England Professionals LLC Page 37 August 31, 2009

A Transit Methodologoy Using Six Simga for Heavy Rail Vehicle Maintenance Programs – TRANSIT AGENCY SITE VISITS
repairs. Reliability measures day-to-day availability of rail cars typical measured in minutes of delay or percentage of on-time delivery and is a primary measure of customer satisfaction. Capacity is a measure of capability and is measure by trains operated per line and space per customer. Quality is a measure of the ambiance of the traveling environment (e.g. cleanliness of rail cars). Condition is a measure of the state of good repair to ensure reasonable life expectancy. Repair is a measure of faults in the equipment. These latter measures are more reflective of the cost efficiency of a maintenance program.
Customer satisfaction raises a number of important questions. How should customer requirements be measured? What are the appropriate measures of customer satisfaction? What are the credible baselines and legitimate sources of benchmarks? Customer surveys have shown that many factors correlate to customer satisfaction, including but not limited to: service reliability, safety and security concerns, access to timely information, overcrowding in stations, and a fully functional infrastructure such as ticket machines, escalators and elevators.
According to the Six Sigma Methodology, one of the first steps toward performance improvement is to build an Affinity Map to sort out leading and lagging indicators of performance. For rail car maintenance, typical leading indicators include off-loadings, service delays, bunching of service, and customer complaints about smells and temperatures. Lagging indicators include mechanical and electrical failures with doors, breaks, engines, communication, and climate control systems. A Transit Cooperative Research Program (TCRP) study on train door systems stated that “Failures of train doors are the biggest single cause of delay and distribution of rail transit service.”2
Given the scope of the current research effort and availability of data, the research team decided to focus on Mean Distance Between Failures (MDBF) as a measure of rail car maintenance performance. The analysis reviews trends in MDBF and discusses key causal variables. Again, the purpose of the analysis is to illustrate the critical role of performance measurement and analysis in applying Six Sigma to transit. When the condition of heavy rail cars is compared to other assets like stations, guideway, and systems, we see in Figure 4 ‐ Conditions of Heavy Rail Assets that more of them are in marginal condition.
2 Train Door Systems Analysis, TCRP Research Results Digest 74, February 2006
New England Professionals LLC Page 38 August 31, 2009

A Transit Methodologoy Using Six Simga for Heavy Rail Vehicle Maintenance Programs – TRANSIT AGENCY SITE VISITS
Figure 4 ‐ Conditions of Heavy Rail Assets
Source: State of Good Repair Summit Proceedings, December 2008, FTA
In addition, as rail cars exceed their useful life, MDBF declines rapidly as shown in Figure 5 – Mean Distance Between Failures (MDBF) Rail Vehicles. Failures are caused by a number of electro-mechanical components. The most troublesome components are:
Doors Coup/Draft Gear Truck and Suspension Lighting Communication Brakes Power Collection Electrical HVAC ATC Power and Traction
New England Professionals LLC Page 39 August 31, 2009

A Transit Methodologoy Using Six Simga for Heavy Rail Vehicle Maintenance Programs – TRANSIT AGENCY SITE VISITS
Figure 5 – Mean Distance Between Failures (MDBF) Rail Vehicles Source: State of Good Repair Summit Proceedings, December 2008, FTA
Given the breathe of these components and the essentiality of having high performing rail cars, it is crucial for transit agencies to have rail car maintenance programs designed to diagnosis these failures, respond quickly to disruptions involving component failures and produce high quality, long lasting solutions.
Site Visits Site visits were arranged for each of the five participating heavy rail transit agencies. In preparation for the visits, the FTA National Transit Database (NTD) was used to gain insight on MDBF trends. MDBF calculations were derived from two NTD tables: “Revenue Vehicle Maintenance Performance Table” and “Service Supplied and Consumed Table”. The Revenue Vehicle Maintenance Table provides information on revenue service interruptions including major mechanical failures and other failures. The Service Supplied and Consumed Table presents data on vehicle miles and hours operated and unlinked passengers and passenger miles. Trends in MDBF are presented for the five agencies.
In the spirit of Six Sigma, kick-off meetings were scheduled with all agency departments that played a role in rail car maintenance. Normally, attendees performed the functions identified in Figure 5.3. At the meetings, additional data and information on rail car maintenance were collected from the agencies. They provided data on organizational arrangement, maintenance facility management, failures, performance measures, reporting systems, and campaigns to solve problems. The five agencies varied in their development and use of performance measures and application of Six Sigma to their Rail Car Maintenance Program.
Miami-Dade Transit (MDT) MDT operates a multi-modal system including heavy rail (Metrorail), people mover (Metromover), bus (Metrobus) and paratransit. It provides service in a service area of
New England Professionals LLC Page 40 August 31, 2009

A Transit Methodologoy Using Six Simga for Heavy Rail Vehicle Maintenance Programs – TRANSIT AGENCY SITE VISITS
306 square miles with a population 2,402,208 people.3 In 2007, the MDT system carried 111,263,859 trips, operated 58,892,504 revenue miles, expended $463,156,120 in operating costs, and earned $88,860,741 in fares. The heavy rail fleet had 136 rail cars with an average age of 25 years and operated over 22.6 miles of track. Heavy rail carried 15.7% of the annual trips, operated 14.2% of the annual revenue miles, accounted for 17.4% of the operating expenses, and produced 15.1% of the fare revenue. In 2007, heavy rail cost efficiency (operating costs per rail car revenue mile) jumped and cost effectiveness (operating costs per passenger mile) remained at 2006 levels.
Metrorail operates from 5 a.m. to midnight, seven days a week, including holidays. On weekdays, trains arrive every 7-8 minutes during morning and afternoon peak hours, every 15 minutes during weekday midday hours, and every 30 minutes from about 7:30 p.m. until closing. Weekend service runs every 30 minutes.
MDT purchased its rail cars in a joint procurement with the Baltimore Mass Transit Administration in 1978. Between 2003 and 2005, MDT saw its MDBF for its heavy rail cars declining as the rail cars aged (see Figure 6 – MDT: Means Distance Between Failure). However, a turnaround in rail car maintenance performance occurred in 2005 as the organization placed more emphasis on preventive maintenance.
Figure 6 – MDT: Means Distance Between Failure
Miami Dade Transit (MDT) is the most advanced in the use of Six Sigma among the five heavy rail transit agencies participating in this research project. It has all of the elements of a Performance Management System including the Six Sigma process management improvement approach. The Six Sigma methodology driven by customer focused strategic goals, inter-department teams with charters, detailed variance analysis of rail car failures, consensus on impediments in processes, a number of specific campaigns to solve problems, performance measures to evaluate progress, regularly scheduled meetings to oversee progress and a balanced score card to report results. The current director, Harpal Kapoor, is the force behind the MDT
3 Transit Profiles: Top 50 Agencies, NTD, FTA, 2007
New England Professionals LLC Page 41 August 31, 2009

A Transit Methodologoy Using Six Simga for Heavy Rail Vehicle Maintenance Programs – TRANSIT AGENCY SITE VISITS
Six Sigma effort. He created an Office of Strategic Planning and Performance Management to steward the process, which reports directly to him. The Strategic Planning and Performance Management Office developed a Six Sigma Implementation Plan for the entire enterprise. The Implementation Plan included the following elements:
1. Process Mapping Training 2. Plan-Do-Check-Act (PDCA) Training 3. Data Analysis Training 4. Adopt/Implement PDCA 5. Six Sigma Green Belt Training for Executives 6. Six Sigma Green Belt Training for Managers 7. Adopt/Implement Six Sigma 8. Showcase Six Sigma Projects
One hundred percent of the desired employees have completed the process mapping and PDCA courses and progress is being made on the other courses in the training program. Items 5 through 8 are pending availability of funding. As a result of the total cost of ownership analysis within the mind-set of Six Sigma effort, MDT has decided to replace its entire rail car fleet rather than invest in a major overhaul of the heavy rail cars. Specifically, Six Sigma was initiated in fall of 2006 and the relationship between Six Sigma and customer service will be discussed in the Case Study section. MDT is not sitting around waiting for funding. An Intranet website keeps all MDT staff informed about the Six Sigma Program, Business Plans, system performance, training opportunities and other matters relevant to their jobs. Inter-departmental teams are aggressively diagnosing problems and responding to unscheduled maintenance incidents. An Enterprise Asset Management System provides the IT infrastructure for data collection and analysis for rail car maintenance. The Enterprise Asset Management not only accounts for all assets, their value and condition but provides the inputs for several critical rail car maintenance reports. An Action Matrix keeps track of all rail vehicle maintenance actions. Rail operations maintain a Calibration Schedule Compliance Report which tracks equipment sent, received and at the maintenance facility. Invoices, for each job, are tracked as well and identifies whether they are paid or outstanding on a monthly basis. Quality assurance and procurement work together in maintain a Warranty Component Failures Monthly Report for each series of rail cars. MDT is well on its way towards achieving its rail service performance goals in general and rail car maintenance performance goals in particular. MDT defines mean distance in three ways: Mean Distance Between All Failures, Mean Distance Between Mainline Failures (synonymous with the definition derived from the NTD tables), and Mean Distance Between Disruptions. Mean Distance Between All Failures shown significant improvement over 2006 and 2007 levels (see Figure 7 -
New England Professionals LLC Page 42 August 31, 2009

A Transit Methodologoy Using Six Simga for Heavy Rail Vehicle Maintenance Programs – TRANSIT AGENCY SITE VISITS
Metrorail MDBF and Figure 8 - Mean Distance Between Mainline Failure). Mean Distance Between Mainline Failures in 2008 is on a trajectory to out-perform 2006 and 2007. Mean Distance Between Mainline Failures for 2008 was on track to return to the 2006 level.
Figure 7 ‐ Metrorail MDBF
Source: Transit Services Monthly Report, Miami Dade Transit, July 2008
Figure 8 ‐ Mean Distance Between Mainline Failure
Source: Transit Services Monthly Report, Miami Dade Transit, July 2008 MDT’s aggressive door campaign, as shown in Figure 9 ‐ Subsystem Mainline Failures and Figure 10 ‐ Means Distance Between Subsystem, accounts for much of the improvements.
New England Professionals LLC Page 43 August 31, 2009

A Transit Methodologoy Using Six Simga for Heavy Rail Vehicle Maintenance Programs – TRANSIT AGENCY SITE VISITS
Figure 9 ‐ Subsystem Mainline Failures
Source: Transit Services Monthly Report, Miami Dade Transit, July 2008
Figure 10 ‐ Means Distance Between Subsystem
Source: Transit Services Monthly Report, Miami Dade Transit, July 2008
Mean Distance Between Disruptions has remained constant as shown in Figure 11 ‐ Metrorail Mean Distance Between Failures.
New England Professionals LLC Page 44 August 31, 2009
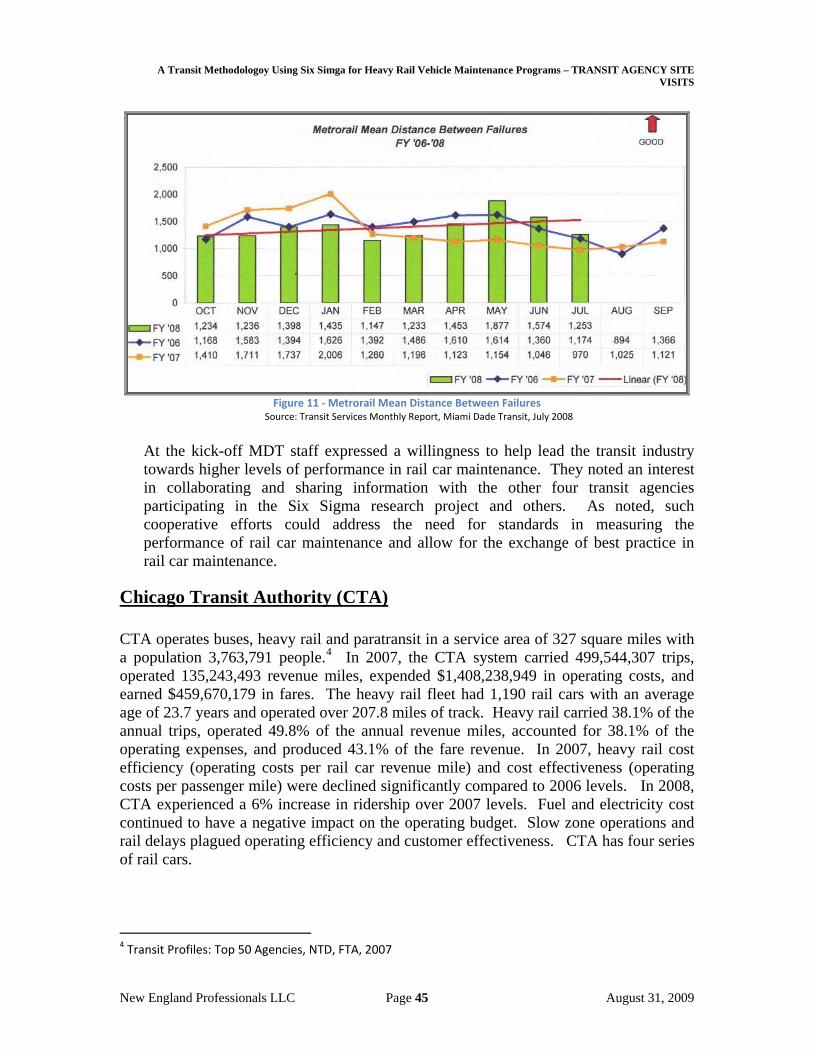
A Transit Methodologoy Using Six Simga for Heavy Rail Vehicle Maintenance Programs – TRANSIT AGENCY SITE VISITS
Figure 11 ‐ Metrorail Mean Distance Between Failures
Source: Transit Services Monthly Report, Miami Dade Transit, July 2008
At the kick-off MDT staff expressed a willingness to help lead the transit industry towards higher levels of performance in rail car maintenance. They noted an interest in collaborating and sharing information with the other four transit agencies participating in the Six Sigma research project and others. As noted, such cooperative efforts could address the need for standards in measuring the performance of rail car maintenance and allow for the exchange of best practice in rail car maintenance.
Chicago Transit Authority (CTA) CTA operates buses, heavy rail and paratransit in a service area of 327 square miles with a population 3,763,791 people.4 In 2007, the CTA system carried 499,544,307 trips, operated 135,243,493 revenue miles, expended $1,408,238,949 in operating costs, and earned $459,670,179 in fares. The heavy rail fleet had 1,190 rail cars with an average age of 23.7 years and operated over 207.8 miles of track. Heavy rail carried 38.1% of the annual trips, operated 49.8% of the annual revenue miles, accounted for 38.1% of the operating expenses, and produced 43.1% of the fare revenue. In 2007, heavy rail cost efficiency (operating costs per rail car revenue mile) and cost effectiveness (operating costs per passenger mile) were declined significantly compared to 2006 levels. In 2008, CTA experienced a 6% increase in ridership over 2007 levels. Fuel and electricity cost continued to have a negative impact on the operating budget. Slow zone operations and rail delays plagued operating efficiency and customer effectiveness. CTA has four series of rail cars.
4 Transit Profiles: Top 50 Agencies, NTD, FTA, 2007
New England Professionals LLC Page 45 August 31, 2009

A Transit Methodologoy Using Six Simga for Heavy Rail Vehicle Maintenance Programs – TRANSIT AGENCY SITE VISITS
1. 2220 Series cars built in 1969-70, rehabbed by CTA’s Skokie Shop 2005-
2008 – 142 vehicles 2. 2400 Series cars built in 1976-77, rehabbed by CTA’s Skokie Shop 2005-
2008 – 194 vehicles 3. 2600 Series cars built in 1981-1986, built by Alstom 1999-2002 – 597
vehicles 4. 3200 Series cars built in 1991-93
The average age of this fleet is 24 years compared to an FTA recommended car life of 25 years. CTA experienced a major decline in its MDBF based on information from NTD, as show in Figure 12 ‐ CTA: Means Distance Between Failure. The declines were related to the aging of CTA’s rail fleet. CTA has developed and implemented an impressive Performance Management System, but unlike Miami Dade Transit had not decided to formally implement Six Sigma. In 2007, CTA President, Ron Huberman started implementation of a CTA Performance Management System with rail car maintenance being a key area of focus. A Performance Management Department was created in May 2007. This new department was charged with ensuring that CTA is achieving its safety, cleanliness, on-time service, courteous and efficiency goals. CTA performance management evolved from a set of basic performance measures which were reviewed weekly. A customer
Figure 12 ‐ CTA: Means Distance Between Failure
focused was added with deep-dives of in-depth analysis of problems and solutions, and managers were essentially immersed in performance management by providing line staff with automated updates on customer experience and system performance. The specific steps are as follows:
1. Identify existing data sources for developing performance measures
focusing on safe, clean, on-time, courteous and efficient service.
New England Professionals LLC Page 46 August 31, 2009

A Transit Methodologoy Using Six Simga for Heavy Rail Vehicle Maintenance Programs – TRANSIT AGENCY SITE VISITS
2. Acquire and report data 3. Analyze data and plan strategies
a. Process analysis b. Service mapping c. Productivity analysis d. Analysis of departmental performance
4. Meet regularly (weekly) a. Address action items from last session b. Highlight measures identified by each department c. Address issues presented by the metrics d. Look at trends e. Remedy obstacles action departments face with bureaucracy
5. Fine Tune Performance Measures a. Identify missing information to answer new questions b. Develop new data collection methods c. Continuously test for the customer’s experience
6. Audit a. Verify the data b. Audit the use of data systems c. Verify the right internal controls are in place to ensure compliance
with policies and procedures d. Continually improve processes as a result of audit findings.
Rail Car Maintenance implemented a matching performance management system. It tracks performance through: 1) monthly scorecard of key performance measures, 2) monthly maintenance manager meetings on maintenance issues, policy changes and new initiatives; 3) performance management session every 6 weeks with CTA President and executive staff, 4) bi-weekly Rail Service Quality Meeting to identify maintenance issues affecting service reliability; and 5) daily flash reports on key metrics across the department each morning. Recording failures and issuing correction work orders are the responsibility of the operations control center. CTA is progressing in rail car maintenance performance. A key vehicle maintenance performance measure used by the CTA is Mean Miles Between Reported Rail Vehicle Defects (MMBD) which is similar to NTD derived MDBF. By August 2007, CTA MMBD had fallen to its lowest level of 2,373 miles. By August 2008, MMBD had increased to 3,962 miles about 67% improvement in performance over the 2007 level; exceeding the established 3,500 mile goal and above the 2006 level of 3,486 calculated from the NTD data (see Figure 13 ‐ CTA‐MMBRD ‐ Aug 2007 to Aug 2008). This progress can be attributed to the emphasis on program management put in place by President Ron Huberman in 2007. However, based on available data we cannot determine the impact of seasonal variation on 2008 performance that is the impact of 2008 autumn and winter season.
New England Professionals LLC Page 47 August 31, 2009

A Transit Methodologoy Using Six Simga for Heavy Rail Vehicle Maintenance Programs – TRANSIT AGENCY SITE VISITS
Figure 13 ‐ CTA‐MMBRD ‐ Aug 2007 to Aug 2008
Source: Rail Maintenance Performance Management, Jack Hruby‐ Vice President Transit Operation, CTA September 23, 2008
Massachusetts Bay Transportation Authority (MBTA) MBTA operates buses, light rail, heavy rail, commuter rail, and paratransit in a service area of 3,244 square miles with a population 4,510,000 people.5 In 2007, the MBTA system carried 357,578,991 trips, operated 90,266,118 revenue miles, expended $987,148,623 in operating costs, and earned $395,876,376 in fares. The heavy rail fleet had 408 rail cars and operated over 73 miles of track. Heavy rail carried 40% of the annual trips, operated 23% of the annual revenue miles, accounted for 28.5% of the operating expenses, and produced 32% of the fare revenue.
Over the past few years, MBTA has worked to incorporate preventive maintenance of its rail cars into the 3C Capital Planning and Programming process. Since 2004, MBTA was able to stem the decline in its MDBF according to the NTD and as shown in Figure 14 - MBTA: Means Distance Between Failures. A heavy overhaul and routine replacement program played a role in the performance of rail car maintenance.
5 Transit Profiles: Top 50 Agencies, NTD, FTA, 2007
New England Professionals LLC Page 48 August 31, 2009

A Transit Methodologoy Using Six Simga for Heavy Rail Vehicle Maintenance Programs – TRANSIT AGENCY SITE VISITS
0
5000
10000
15000
20000
25000
30000
35000
40000
2003 2004 2005 2006
MDBF
Years
Massachusetts Bay Transportation Authority (MBTA)Means Distance Between Failure (MDBF) 2003 ‐ 2006
Figure 14 ‐ MBTA: Means Distance Between Failures
Vehicle performance is tracked by measuring mean distance between failures and vehicle availability. Maintenance personnel perform trend analysis to identify failures and develop appropriate courses of action. Specific goals are established for vehicle performance, these goals are determined by Operations. Goals take into consideration the age of the fleet, operating conditions, and maintenance capabilities. The Operations Performance Indicators include: ridership, vehicle availability, and mean miles between failures, dropped trips, on-time performance, speed restrictions, overtime, and customer service initiatives. Subway operations subscribe to a philosophy of preventive maintenance, utilizing mileage and time-based inspection, annual services and component overhauls. Capital funds must be programmed to overhaul or replace major components or to perform vehicle overhauls. One of the highest priorities in MBTA’s Capital Investment Program is the pursuit of a “State of Good Repair.” The Authority needs to spend approximately $470 million per year to maintain the current “State of Good Repair” backlog which is approximately $2.7 billion. MBTA has developed a comprehensive decision support tool. The MBTA’s “SGR Database” tool allows the agency to assess its unconstrained reinvestment needs, but also to realistically simulate the results of a budget constraint. Under limited budgets, the tool prioritizes SGR activities based on three factors: the degree to which the asset has exceeded its useful life (i.e., age), the asset’s relative importance to core operations and the number of riders affected by the asset. The model captures the very real dynamic facing transit capital planners: if an asset is not replaced in a given year, it becomes an even higher priority in the next year. This decision support tool can show which specific projects should be prioritized for capital funds, and can determine the total time required to attain a complete state of good repair under alternative funding levels. According to FTA July 2009 Report to Congress about the Rail Modernization Study:
The MBTA’s “State of Good Repair (SGR) Database” tool allows the agency to assess its unconstrained reinvestment needs, but also to realistically simulate the results of a budget constraint.
New England Professionals LLC Page 49 August 31, 2009

A Transit Methodologoy Using Six Simga for Heavy Rail Vehicle Maintenance Programs – TRANSIT AGENCY SITE VISITS
This SGR Database can be a solid foundation to institute Six Sigma for rail car maintenance.
Metropolitan Atlanta Rapid Transit Authority (MARTA) MARTA operates buses, heavy rail and paratransit in a service area of 489 square miles with a population 1,574,600 people.6 In 2007, the MARTA system carried 147,523,544 trips, operated 50,092,790 revenue miles, expended $373,519,151 in operating costs, and earned $102,141,681in fares. The heavy rail fleet had 264 rail cars with average age of 17.5 years and operated over 96.1 miles of track. Heavy rail carried 52.6% of the annual trips, operated 43.9% of the annual revenue miles, accounted for 28.5% of the operating expenses, and produced 49.4% of the fare revenue.
Figure 15 ‐ MARTA: Means Distance Between Failures provides a glimpse into the efficiency and effectiveness of MARTA between 2003 and 2007. MARTA’s MDBF fell from a high of 16,000 miles in 2003 to below 2,000 miles in 2006. This decline in cost efficiency continued in 2007. MARTA heavy rail cost efficiency measured by operating costs per rail car revenue mile climbed to $8.00 per mile in 2007 from $6.00 per mile in 2006. In addition, cost effectiveness or customer effectiveness measured by operating costs per passenger mile fell below the 2006 levels.
Figure 15 ‐ MARTA: Means Distance Between Failures
MARTA is using a combination of strategic planning and engineering management approaches to respond to its challenges in operating efficiency and effectiveness. The General Manager - Beverly Scott, Ph.D. - initiated a systems re-engineering and optimization study called MOVE, Making Operations Very Efficient. It assessed the existing operations and recommend changes to improve the overall experience of customers in the system. MOVE was designed to assist MARTA in making the most of its existing resources while at the same time planning for the future. As a result, elements of a performance management system have been implemented. An enterprise
6 Transit Profiles: Top 50 Agencies, NTD, FTA, 2007
New England Professionals LLC Page 50 August 31, 2009

A Transit Methodologoy Using Six Simga for Heavy Rail Vehicle Maintenance Programs – TRANSIT AGENCY SITE VISITS
asset management system has been installed. The outputs help to support a MARTA Balanced Scorecard which contains 100 key performance indicators. As noted above, MARTA continues to experience growth in its operational efficiency and customer effectiveness based on the NTD information. However, MARTA has put an organization infrastructure in place that will no doubt lead to improvements in rail car maintenance.
Southeastern Pennsylvania Transportation Authority (SEPTA)
The Southeastern Pennsylvania Transportation Authority (SEPTA) operates buses, light rail, heavy rail, commuter rail and paratransit in a service area of 831 square miles with a population 3,317,418 people. In 2007, the SEPTA system carried 321,839,783 trips, operated 84,998,485 revenue miles, expended $916,470,647 in operating costs, and earned $351,416,545 in fares. The heavy rail fleet had 369 rail cars with average age of 14.7 years and operated over 74.5 miles of track. Heavy rail carried 27.5% of the annual trips, operated 18.6% of the annual revenue miles, accounted for 28.5% of the operating expenses, and produced 21% of the fare revenue.
Figure 16 ‐ SEPTA: Means Distance Between Failures shows the MDBF performance trends in SEPTA’s rail maintenance between 2003 and 2006. Improvements made between 2003 and 2004 were followed by a significant decline in MDBF. SEPTA Vehicle Engineering and Maintenance Department have not implemented a formal Six Sigma methodology. It is, however, implementing functional aspects of Six Sigma. Rail Car Maintenance, Rail Equipment Engineering and Rail Quality Assurance (QA) and Quality Control (QC) work as a team. Rail Equipment Engineering used Lean Six Sigma to refine work standards for rail car maintenance. The engineering department follows the DMAIC approach.
1. Defines QA/OC and engineering inspections and audit activities
through a set of documented procedures 2. Measures quality of materials received and procedures followed 3. Analyzes the results of inspections 4. Improves the delivery of parts supplied 5. Controls work completed with follow-up actions.
The QA/QC group is placing a higher level of oversight on the supply of rail car parts for rail cars to ensure quality in light of excessive low bidding. SEPTA is moving towards implementation of an enterprise asset management system. Like CTA, SEPTA’s Operations Control Center plays a very important role in the rail car maintenance program.
New England Professionals LLC Page 51 August 31, 2009

A Transit Methodologoy Using Six Simga for Heavy Rail Vehicle Maintenance Programs – TRANSIT AGENCY SITE VISITS
0
10000
20000
30000
40000
50000
60000
2003 2004 2005 2006
MDBF
Years
Southeastern Pennsylvania Transportation Authority (SEPTA)Means Distance Between Failure (MDBF) 2003 ‐ 2006
Figure 16 ‐ SEPTA: Means Distance Between Failures
In 2007, growth in heavy rail cost efficiency (operating costs per rail car revenue mile) and cost effectiveness (operating costs per passenger mile) remained roughly at 2006 levels. The new trend is indicative of some of the organizational improvements that SEPTA has made in rail car maintenance.
KEY FINDINGS BEFORE CASE STUDY Table 4 ‐ Rail System Characteristics11 summarizes key characteristics of the heavy rail systems participating in the Six Sigma research. Miami Dade Transit (MDT) is the most advanced in the use of Six Sigma among the five heavy rail transit agencies participating in this research project. The progress MDT has made in rail car maintenance can be traced to the introduction of Six Sigma. CTA has developed and implemented an impressive Performance Management System, but unlike Miami-Dade Transit has not decided to formally implement Six Sigma. Over the past few years, MBTA has worked incorporating its preventive rail car maintenance program using the 3C Planning and Programming process. MARTA is using a combination of strategic and engineering management approaches to respond to its challenges in operating efficiency and effectiveness. Southeastern Pennsylvania Transportation Authority (SEPTA) Vehicle Engineering and Maintenance Department have not implemented a formal Six Sigma methodology; however, functional aspects of Six Sigma have been implemented. Particularly, Rail Equipment Engineering uses Lean Six Sigma to refine work standards for rail car maintenance following the Six Sigma DMAIC Approach.
Transit Agencies
Rail Ridership (Avg. Annual)
Heavy Rail Fleet
Average Age
MDBF-20067
MDT 17,504,736 136 25.0 5,408 CTA 190,272,996 1,190 24.0 3,486 MBTA 143,666,785 408 25.0 29,337 MARTA 77,685,887 276 17.5 1,509 SEPTA 88,461,397 369 14.7 12,513
7 2006 MDBF based on National Transit Database so as to have some normalization in the measure. The subject transit agencies use slight variations in the definition.
New England Professionals LLC Page 52 August 31, 2009

A Transit Methodologoy Using Six Simga for Heavy Rail Vehicle Maintenance Programs – TRANSIT AGENCY SITE VISITS
New England Professionals LLC Page 53 August 31, 2009
Table 4 ‐ Rail System Characteristics11
Although, Six Sigma has not been formally adopted by four of the five transit agencies, a variety of performance management tools are being used. In each instance, a new or upgraded enterprise asset management system is an essential element to the rail car maintenance program and measurement of performance. Each agency has a set of key performance indicators for evaluating the performance of their rail car programs. Inter-department teams were found in each of the agencies. The Rail Car Maintenance Department was supported by engineering, capital planning, procurement, information technology, operations and finance. From an organizational perspective, MDT and CTA went beyond the other agencies when they created executive level offices responsible for performance management. As owners of the performance management process, these offices, ensured the integrity of the performance data through their data auditing responsibilities. MARTA has developed a predictive maintenance planning model similar to what is being used at BART and WMATA. Based on evidence gather so far, we know that there are external factors that impact rail car performance and a number of internal as well. An example of external is seasonal variations and examples of endogenous factors are roles of other departments and variation in failure rate in different rail car subsystems. In Chicago we found that it cannot determine the impact of seasonal variation on 2008 performance that is the impact of 2008 autumn and winter season. MDT appears to be validating the assumption that Six Sigma not only leads to better MDBF but also produces gains in customer satisfaction measured by cost per passenger mile and passenger trips per vehicle revenue mile. However before this finding can be confirmed, more in-depth analysis is needed on variances in the causes of rail car failures and their impact on service reliability.

A Transit Methodologoy Using Six Simga for Heavy Rail Vehicle Maintenance Programs – CASE STUDY - MDT
CASE STUDY – MIAMI-DADE TRANSIT
Case Study Logic The Miami-Dade Transit (MDT) Case Study Logic hinged on the current FTA’s Strategic Research Plan and a recent report about Transit State of Good Repair (SGR): Beginning the Dialogue. The SGR Report focused on seven topics: (1) Current Conditions of the Nation’s Transit Infrastructure; (2) Defining and Measuring State of Good Repair; (3) Transit Asset Management; (4) Standards for Preventive Maintenance; (5) Core Capacity of a Transit System; (6) Alternative Approaches to Financing; and (7) Research Needs. The Strategic Research Plan focused on five strategic goals with corresponding objectives that serve as a framework for how FTA will measure its success.
Transit State of Good Repair The Federal Transit Administration, as of October 2008, published a report that begins the dialogue about “Transit State of Good Repair”. This report is the result of FTA’s two-day State of Good Repair (SGR) Workshop that brought together representatives from 14 public transportation providers and State Departments of Transportation. The primary concern was the state of repair for our Nation’s Transit Inventory. To do so, the participants discussed, among other things, transit recapitalization and maintenance issues, asset management practices, and innovative financing strategies. In conjunction, the participants explored issues such as measuring the conditions of transit capital assets, prioritizing local transit re-investment decisions, and preventive maintenance practices. Furthermore, participants discussed research needs and potential tools for helping agencies to cope with this growing problem of maintaining the condition of our transit infrastructure. While this report focuses on the overall condition of the nation’s transit assets, our emphasis will be on the transit assets as related to rail car maintenance for heavy rail. The SGR Workshop key observations were relative to rail car maintenance: (1) Funding Gap; (2) Investment Prioritization; (3) Preventive Maintenance Practices; (4) Betterments and Standards Requirements; (5) Measurement of SGR; (6) Data; and (7) SGR Research. It should be noted that there is no industry accepted definition of “state of good repair,” but FTA will work with the industry to help define what is meant by “state of good repair” and how best to measure it. Examples of transit agencies definition of State of Good Repair are:
Agency and Definition Chicago Transit Authority (CTA) - CTA defines SGR primarily in terms of standards: (1) Rail lines should be free of slow zones and have reliable signals; (2) Buses should be rehabbed at 6 years and replaced at 12 years; (3) Rail cars should be rehabbed at quarter- and half-life intervals and replaced at 25 years; and (4) Maintenance facilities should be replaced at 40 years (70 years if rehabbed).
New England Professionals LLC Page 54 August 31, 2009

A Transit Methodologoy Using Six Simga for Heavy Rail Vehicle Maintenance Programs – CASE STUDY - MDT
Agency and Definition Massachusetts Bay Transportation Authority (MBTA) - A state of good repair standard [is where] all capital assets are functioning at their ideal capacity within their design life.Southeastern Pennsylvania Transportation Authority (SEPTA) An asset or system is in a state of good repair when no backlog of needs exists and no component is beyond its useful life. State of good repair projects correct past deferred maintenance, or replace capital assets that have exceeded their useful life. Cleveland RTA - CTA defines SGR primarily in terms of standards: (1) Rail lines should be free of slow zones and have reliable signals; (2) Buses should be rehabbed at 6 years and replaced at 12 years; (3) Rail cars should be rehabbed at quarter- and half-life intervals and replaced at 25 years; and (4) Maintenance facilities should be replaced at 40 years (70 years if rehabbed).New Jersey Transit (NJT) - State of good repair projects are those needed to bring the system to a consistent, high quality condition system-wide.New York City Transit (NYCT) Investments that address deteriorated conditions and make up for past disinvestment.
Table 5 – Based of State of Good Repair October 2008: Agency and Definitions
These six definitions center on the basic theme that assets are in a “state of good repair” when all life cycle investments needs have been addressed. This includes preventive maintenance, rehabilitations, and scheduled replacement needs, resulting in the general absence of deferred investment needs. However, these definitions do not provide an objective investment target as well as a standard against which current conditions can be measured. In this instance, the following operational definition of SGR will be used for a starting point for dialogue: An asset or system is in a state of good repair when no backlog of capital needs exist – hence all asset life cycle investment needs (preventive maintenance and rehabilitation) have been addressed and no capital asset exceeds its useful life. The ultimate utility of this operational definition should hinge on common industry standards for asset useful life. In consonance with the dialogue operational definition for SGR, four different measures of SGR should be considered:
Percent of Assets in SGR – In practice this percentage measure can be based either on (i) the proportion of assets (by count or value) that do not exceed their expected useful life or (ii) based on engineering assessments of the proportion of assets that are in “good working order”.
Percent of Service Life Remaining – Distributions of percent of service life remaining show the proportions
of transit assets at different stages during their service life cycle based on their expected useful life.
Asset Condition Ratings - While the percent of service life age provides a good understanding of the proportions of assets in varying conditions, the practice of using quarter-life age groupings is arbitrary. Specifically, these age groupings may not provide a good representation of the differing phases of asset conditions an asset will experience throughout the full life cycle. To address this issue, many transit agencies, state DOTs and engineering firms utilize four- or five-point condition rating scales to assess the condition of capital assets: excellent, good, adequate, marginal, and poor. The key value of condition rating system is that all assets, regardless of type, can be rated using the same condition ratings.
Asset Specific Condition Measures - Agencies can also develop and utilize SGR measures that are specific to
individual asset types such as mean distance between failures.
New England Professionals LLC Page 55 August 31, 2009

A Transit Methodologoy Using Six Simga for Heavy Rail Vehicle Maintenance Programs – CASE STUDY - MDT
Overall workshop participants believed that condition is the ideal measure for SGR and age (useful life) is a “second-best” measure of condition with performance-based measures such as mean distance between failures as indirect measures of SGR. This report points out that the overall condition of the nation’s transit assets is severely hampered by the scarcity of reliable and consistent information sources and the broad range of assumptions used by transit agencies in determining their needs such as useful life and preventive maintenance practices. Nonetheless, FTA and Federal Highway Administration (FHWA) jointly submit a Condition and Performance of Report (C&P Report) about the nation’s surface transportation capital assets. The comprehensive assessment of transit assets physical condition and investment needs is developed by using FTA’s Transit Economic Requirements Model (TERM). The condition ratings used by TERM include:
• Excellent – New or like new assets with no visible defects; • Good – Asset showing minimal signs of wear; some (slightly) defective or deteriorated component(s); • Adequate – Asset has reached its mid-life; some moderately defective or deteriorated component(s); • Marginal – Asset reaching or just past its useful life; increasing number of deteriorated component(s); and • Poor – Asset past its useful life; in need of replacement; may have critically damaged components
Based on TERM assessment, up to one-third of heavy rail assets have either exceeded or are close to the end of their useful life. Specifically, the approximate replacement value of heavy rail transit assets in billion dollars ($2006) by TERM condition ratings is: (1) Poor – $ 8 Billion; (2) Marginal - $52 Billion; (3) Adequate - $40 Billion; and (4) Good - $20 Billion. The approximate replacement value of heavy rail vehicles in billion dollars ($2006) by TERM condition ratings is: (1) Marginal - $11 Billion; (2) Adequate - $22 Billion; and (3) Good - $2 Billion. The average annual reinvestment needs estimate for heavy rail vehicles for a twenty year period of the useful life is 1.5 Billion dollars in 2006 funds. The question then becomes: How do current transit conditions impact service performance such as service reliability, mean time/distance between failures, track operating speed? Likewise, another question is: How would attaining a state of good repair improve service performance and/or reduce operating and maintenance costs? These questions lead to known relationship between transit conditions and the following quality service measures: Maintenance Costs, Service Disruptions, Slow Speed Zones, and Other Service Quality Measures (e.g., on-time performance and number of customer complaints relating to asset conditions/deterioration). The primary concern, in this case is vehicle maintenance costs and service disruptions. In turns of operating and maintenance cost for transit fleets, both agency reports and cost research support the position that aging fleets suggest increasing maintenance and repair costs. Relative to service disruptions, rail vehicles’ mean distance between failures (MDBF) in miles decreases considerably as a rail vehicle ages. More specifically, research shows the following:
MDBF (Approx. Miles) Vehicle Age in Years
0 10 20 30 40 13,000 6,000 3,000 1,800 1,000
Table 6 ‐ Vehicle Age in Years
New England Professionals LLC Page 56 August 31, 2009

A Transit Methodologoy Using Six Simga for Heavy Rail Vehicle Maintenance Programs – CASE STUDY - MDT
The ability to assess current asset conditions and reinvestment needs of the transit industry is hampered by a variety of factors: At the Local Level:
Few agencies perform detailed condition assessments on a regular basis; Most agencies do not maintain comprehensive asset inventories for the purpose of asset condition
monitoring and replacement needs assessments); Most agencies do not conduct unconstrained long-term state of good repair needs estimates on a
regular basis. At the Federal Level:
Absence of a national asset condition or inventory reporting requirement; Absence of a standardized condition reporting system Assumptions regarding asset useful lives and the time period to address the investment backlog
vary widely across agencies. In sum and based on TERM 2006 analysis, roughly one-quarter of the nation’s rail assets are in marginal or poor condition. Rail yards and shops assets exceed their useful life by approximately 15%. This situation exists in spite of the fact that since 1991, funding resources (Federal, State, and Local) have invested $165 billion in the preservation and expansion of the nation’s rolling stock and infrastructure. This decline will be difficult to stop because current capital reinvestment rates are only 60% to 80% of the required funds needed to address existing backlog and normal replacement needs. As such, there are six questions to be addressed relative to current conditions of the nation’s transit assets and overall state of good repair; in consonance, there are six questions to be addressed relative to defining and measuring SGR: Transit Infrastructure Condition
Is the assessment of needs and conditions presented above reasonably accurate? For example, are asset conditions poorest and investment needs most significant for bus and heavy rail? Within these two modes, are the highest reinvestment needs for stations and vehicles (heavy rail) and vehicles and maintenance facilities (bus)?
What are the biggest investment needs in terms of investment dollars (i.e., where are the largest
deferred needs) by mode and asset type?
How are local agencies addressing their reinvestment needs given the gap between needs and available funding?
Where are the most significant sources of potential risk to local agencies if current outstanding
needs are not addressed (e.g., in terms of safety, potential for extended service disruptions, or other risks)? Is there a specific asset type most associated with risk?
How would attaining full SGR impact national transit performance in terms of: throughput, reliability, operating speed, maintenance costs, and overall quality of service?
How significant is the gap between available resources and local agency state of good repair needs? Do local agencies have reliable estimates of the size of that gap?
Defining and Measuring SGR
New England Professionals LLC Page 57 August 31, 2009

A Transit Methodologoy Using Six Simga for Heavy Rail Vehicle Maintenance Programs – CASE STUDY - MDT
Should the industry develop a common definition of “state of good repair”?
Are agencies developing clear life expectancy targets for all major transit asset types (e.g., trackwork, structures, stations, bus and rail vehicles, systems and facilities)?
Are there specific measures of SGR the industry should adopt?
What specific measures are in use by U.S. agencies? Are they age, value or condition based? Are agencies conducting asset condition assessments? When conducted, are these assessments
periodic or regularly scheduled events?
Would the transit industry benefit from development of a standardized set of useful life values for major transit asset types?
Strategic Research Mandate The framework for this research was Federal Transit Administration’s (FTA) Strategic Research Plan for FY2006 – FY2010, dated September 30, 2005. It builds on the Strategic Research Plan set forth in October 2004 to establish FTA’s research priorities. Of equal import, it serves as a guiding document for determining how limited public funds should be invested in research projects to improve our Nation’s public transportation systems.
FTA Strategic Research Goal The Third Strategic Research Goal - Improve Capital and Operating Efficiencies – is the impetus for this research project. This goal consists of five objectives. Objective One involves identifying methods to control capital cost. Objective Two entails identifying solutions that will control operating costs. Objective Three encompasses identifying ways to improve transit operational efficiency, especially for bus, heavy rail, and demand response operations. Objective Four focuses on methods to facilitate and improve the monitoring as well as maintenance of transit infrastructure. Lastly, Objective Five deals with improving the capacity of domestic transit industry and workforce.
FTA Research Concern The baseline research concern is improving rail transit operations’ effectiveness. Rail transit operations include: commuter rail operations, metro or subway operations, streetcars and light rail transit operations. It does not include freight rail operations.
New England Professionals LLC Page 58 August 31, 2009
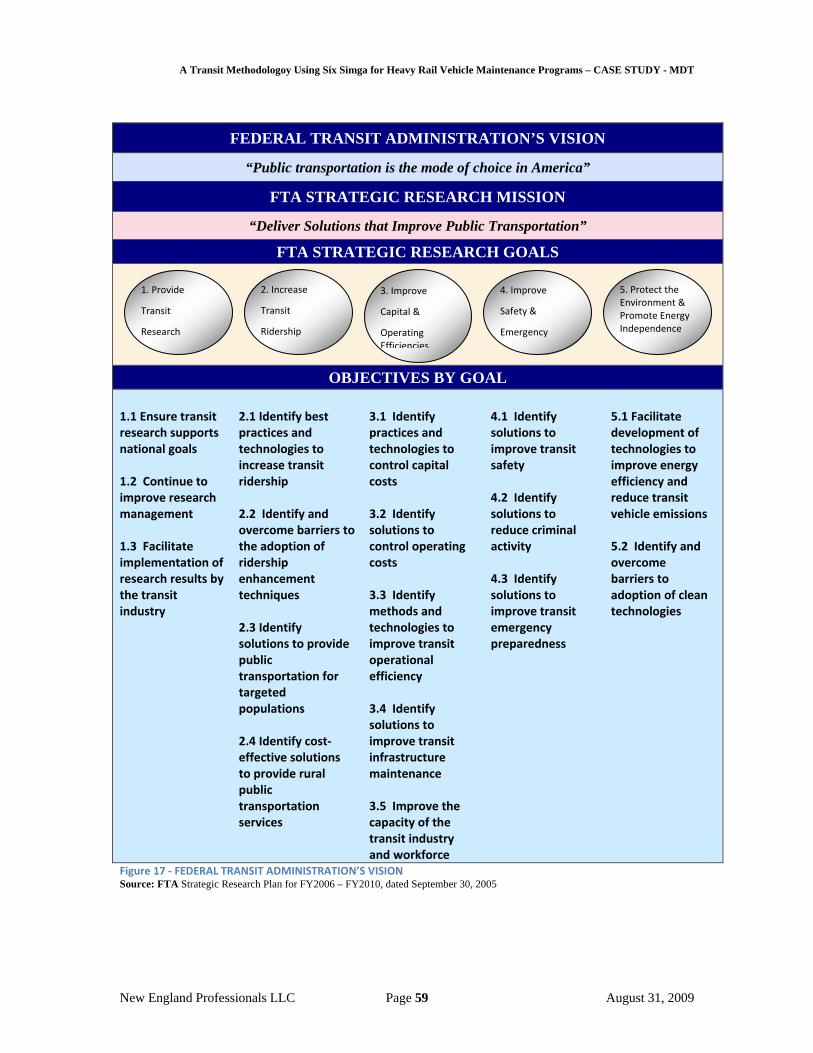
A Transit Methodologoy Using Six Simga for Heavy Rail Vehicle Maintenance Programs – CASE STUDY - MDT
FEDERAL TRANSIT ADMINISTRATION’S VISION
“Public transportation is the mode of choice in America”
FTA STRATEGIC RESEARCH MISSION
“Deliver Solutions that Improve Public Transportation”
FTA STRATEGIC RESEARCH GOALS
OBJECTIVES BY GOAL 1.1 Ensure transit research supports national goals 1.2 Continue to improve research management 1.3 Facilitate implementation of research results by the transit industry
2.1 Identify best practices and technologies to increase transit ridership 2.2 Identify and overcome barriers to the adoption of ridership enhancement techniques 2.3 Identify solutions to provide public transportation for targeted populations 2.4 Identify cost‐effective solutions to provide rural public transportation services
3.1 Identify practices and technologies to control capital costs 3.2 Identify solutions to control operating costs 3.3 Identify methods and technologies to improve transit operational efficiency 3.4 Identify solutions to improve transit infrastructure maintenance 3.5 Improve the capacity of the transit industry and workforce
4.1 Identify solutions to improve transit safety 4.2 Identify solutions to reduce criminal activity 4.3 Identify solutions to improve transit emergency preparedness
5.1 Facilitate development of technologies to improve energy efficiency and reduce transit vehicle emissions 5.2 Identify and overcome barriers to adoption of clean technologies
Figure 17 ‐ FEDERAL TRANSIT ADMINISTRATION’S VISION
3. Improve
Capital &
Operating Efficiencies
2. Increase
Transit
Ridership
1. Provide
Transit
Research
4. Improve
Safety &
Emergency
5. Protect the Environment & Promote Energy Independence
Source: FTA Strategic Research Plan for FY2006 – FY2010, dated September 30, 2005
New England Professionals LLC Page 59 August 31, 2009

A Transit Methodologoy Using Six Simga for Heavy Rail Vehicle Maintenance Programs – CASE STUDY - MDT
FTA Reason for Concern and Background Statement Rail transit operations (commuter, heavy, and light rail) comprise over 50% of transit service and represent a much larger component of capital expenditures and operating costs. Many transit agencies are challenged with improving the operations of their rail service, making rail transit more efficient and effective for passengers will ultimately attract additional riders and help relieve traffic congestion. Adding more trains and extending rail lines are often cost prohibitive and can take several years to plan, develop and move through the New Starts process. Therefore, finding solutions that stimulate rail transit operation improvements is important to FTA and the transit industry.
FTA Research Intent This research intent is to develop a method, system, or technical solution to improve rail transit operations.
New England Professionals (NEP) Summary Research Context Today, heavy rail operators across the nation are experiencing 2% to 5% increases in ridership per year. These ridership gains are straining their ability to provide the necessary vehicle capacity. As ridership grows, rail vehicle maintenance programs are seeing increases in the malfunction of rail car systems and corresponding components such as doors, climate control systems, brakes, communication systems, and vehicle computer systems. Nevertheless, previous research shows that “the maintenance function is one of the few areas in transit operations where effective management can have a direct impact on the monthly operating statement and the capital budget.” Sadly, research further indicates that “the maintenance function is viewed as an operating function which mysteriously works by itself.” However, we know that this perception is not true because financial management, capital programming, control center operations, facility management, and customer service are other functions in a transit agency that also play very critical roles in rail car maintenance, beside the most visible links to rail car maintenance - the supply of parts and qualified mechanics. Rail car maintenance is a significant and complex activity because it has to deliver high levels of customer satisfaction while executing a rail car maintenance program that has to be effective and efficient. That is, transit operational efficiency can be achieved by controlling operating and capital costs through the facilitation and improvement of the monitoring as well as maintenance of transit infrastructure while improving workforce capacity. This requires leadership that can make the links between a transit agency’s functional structure and its process structure.
New England Professionals LLC Page 60 August 31, 2009

A Transit Methodologoy Using Six Simga for Heavy Rail Vehicle Maintenance Programs – CASE STUDY - MDT
NEP Research Solution NEP’s proposed solution was to conduct a case study of Miami-Dade Transit to design and develop a Transit Methodology Using Six Sigma For Heavy Rail Vehicle Maintenance Programs.
NEP Suggested Primary Benefits
The primary benefits include: (1) Standardization of a methodology for public transportation agencies to identify and implement solutions to improve and sustain effective rail transit operations; (2) Establishment of cost-saving performance measures to augment operations performance measures e.g. return on capital employed; and (3) Formulation of a comparative criteria for determining how public dollars should be invested based on operations cost performance measures in conjunction with service performance measures.
NEP Suggested Research Questions The suggested research questions included:
• How should an agency determine what is to be measured? • How should customer requirements be used to plan and measure performance? • What are the appropriate uses of these measures within operational and strategic contexts? • What are the realistic performance expectations for what is measured? • What are the credible baselines and legitimate sources of benchmarks?
NEP Suggested Rail Car Maintenance Logic Model The development of our proposed Logic Model for a Rail Car Maintenance Cost Formula was based on a core research tool and associating research tools, key rail maintenance performance measures, cost performance measures, and sources for perspectives about rail car function and performance standards. The Core Research Tool is Six Sigma and it has been discussed in the section titled: Synopsis of Six Sigma. Figure 18 - Transit Methodology Six Sigma Model on the next page is a pictorial of the Six Sigma (6σ) Model and the three basic elements (process improvement, process design/re-design, and process management) for implementing Six Sigma which is designed to address both internal and external customer. That is, when process improvement is no longer effective in finding solutions to eliminate the root causes of performance problems in existing processes within an entity, it is time to proceed to process design/re-design. This element is, typically, used because: (1) an entity chooses to replace one or more core processes rather than repair them; (2) leadership determines that improving an existing process will never yield the level of quality the customer demands; and (3) an entity identifies an opportunity to offer an entirely new product or service. When the aforementioned element is no longer effective or appropriate, process management should be employed; however, it is the most
New England Professionals LLC Page 61 August 31, 2009

A Transit Methodologoy Using Six Simga for Heavy Rail Vehicle Maintenance Programs – CASE STUDY - MDT
challenging. This element involves changing the culture and management throughout an entity such that changes
1.Define
2. Measure
3. Analyze
4. Improve
5. Control
ProcessManagement
Process Improvement
Customer
ProcessDesign/
Re-Design
Figure 18 ‐ Transit Methodology Six Sigma Model
must accompany Six Sigma efforts to realize their full power. Process Management, in short, focuses on managing processes across an entity to replace managing individual functions by different and sometimes competing internal departments. In comparison, these elements consist of the following steps: PROCESS IMPROVEMENT
PROCESS DESIGN/REDESIGN PROCESS MANAGEMENT
Define the problem and what the customers require.
Define customer requirements and goals for the process, product, or service.
Define processes, key customer requirements and process owners.
Measure the defects and process operation.
Measure and match performance to customer requirements.
Measure performance to customer requirements and key process indicators.
Analyze the data and discover causes of the problem.
Analyze and assess process, product, or service design
Analyze data to enhance measures and refine the process management mechanisms
Improve the process to remove causes of defects.
Design and implement new processes, products, or services.
Control performance through ongoing monitoring of inputs, operations, outputs, and
sponding quickly to problems and process variations. reControl the process to make
sure defects do not recur. Verify results and maintain performance.
Table 7 ‐ Source: The Six Sigma Way – Team FieldBook
New England Professionals LLC Page 62 August 31, 2009

A Transit Methodologoy Using Six Simga for Heavy Rail Vehicle Maintenance Programs – CASE STUDY - MDT
For the construct of a rail car maintenance formula, our focus will be on the three steps common to each element Define, Measure, and Analysis with emphasis on Analysis. These three steps will be the basis for establishing the transit philosophy term “Transit Six Sigma (T6σ).” Authors, Peter S. Pande along with Robert P. Neuman, and Roland R. Cavanagh, suggested that Analysis should be viewed from two approaches which can be conducted independently or simultaneously: Data Analysis and Process Analysis. Data Analysis enables a researcher to identify patterns, trends, and differences that suggest, support, or reject theories about causes of defects. Process Analysis provides a detailed look at how key processes that supply customer requirements to determine which steps do not add value for the customer. Regardless of which analysis approach being used, three Phases of Root Cause Analysis must be adhered to, although reality may not allow these phase to occur in a sequential manner:
Exploring—Investigation of data and/or process with open mind Hypotheses/Causes – Using new-found knowledge to identify most likely causes of defects Verifying/Eliminating Causes – Data/Process Analysis to verify which of the potential causes
significantly contributes to the problem
The Associating Research Tools are RCM 3 (Reliability-Centered Maintenance), Traditional Maintenance Approach, Value Streaming Mapping, and Lean Six Sigma.
According to John Moubray, Maintenance is ensuring that physical assets continue to full fill their intended functions. The evolution of maintenance can be traced through three generations which began in the 1930’s and was developed over 30 years. The First Generation emphasis was to fix it when it is broken; Second Generation centered on scheduled overhauls, systems for planning and controlling work, and big slow computers; Third Generation expanded the focus to: (1)
Reliability-Centered Maintenance (RCM), according to John Moubray, has become the cornerstone of the Third Generation of maintenance but in the perspective of two previous generations. RCM is a process used to determine the maintenance requirements of any physical asset in its operating context. With this in mind, analysis of identified assets should begin with answering seven basic asset questions:
* What are the functions and associated performance standards of the asset in its present operating context?
* In what ways does it fail to fulfill its functions? * What causes each functional failure? * What happens when each failure occurs? * In what way does each failure matter? * What can be done if a suitable preventive task cannot be found? * What should be done if a suitable preventive task cannot be found?
Furthermore and in reference to the abovementioned questions, the objectives of maintenance with respect to any asset are defined by the functions of the asset and its
New England Professionals LLC Page 63 August 31, 2009

A Transit Methodologoy Using Six Simga for Heavy Rail Vehicle Maintenance Programs – CASE STUDY - MDT
associated desired standards of performance. Accordingly, RCM process starts with defining the functions and performance standards of each asset in its operating context. Then, the functional failures must be identified before any plausible blend of failure management tools can be used by asking two questions: how an asset can fail to meet its function and what can cause the possible loss of function. Functional Failures are defined as the inability of an asset to meet a desired standard of performance. Knowing the functional failures, the next step is to identify failure modes – reasonable cause of function loss and not symptoms. Afterwards, failure effects must be recorded, which describes what would happen if failure mode did occur. With the recording of failure effects comes specifying four categorical Failure Consequences:
Hidden Failure Consequences – these failures have no direct impact but they expose the organization to other serious failures with serious if not catastrophic consequences;
Safety and Environmental – safety failures result in someone being hurt or killed and environmental failures involves a breach of standards;
Operational Consequences impact production such as – customer service and operating costs; and Non-operational Consequences involve only the direct cost of repair.
Having grouped the failure consequences, attention should be turned to Preventive Tasks; that is, some kind of preventive maintenance should occur on a routine basis and it should consist of overhauls or components replacements at fixed intervals; furthermore, potential failures must be addressed because they are identifiable physical conditions which indicate that a functional failure is about to occur or is in the process of occurring. If a preventive task cannot be found, Default Tasks must be undertaken for failure consequences:
* Failure-finding Task must be performed to check hidden functions periodically to determine whether they have failed.
* Asset Redesign or Process Change must occur to bring safety or environmental consequences to an acceptable low level.
* No scheduled Maintenance for operational consequences happen when the task cannot be justified on economic grounds; then, the default decision is to redesign.
* No scheduled Maintenance for non-operational consequences happen when he task cannot be justified on economic grounds; then, the default decision is to redesign.
Although all the above-mentioned information reflects how to address the seven basic RCM questions, the answers require input from other organizational members beyond maintenance staff. In short, RCM implementation should be conducted by a small team that, at a minimum, includes one person from maintenance and one person from operations, regardless of seniority but with emphasis on knowledge of asset under review. The small team should lead by highly trained specialists in RCM, known as Facilitators. They are responsible for: (1) correct application of RCM; (2) group members achieving a reasonable consensus about answers for the seven basic questions; (3) no significant equipment or component being overlooked; (4) review meetings to progress reasonably quickly; and (5) all RCM documents are completed correctly. The work completed under the guidance of the Facilitator will be reviewed under the guidance of Auditors – senior manager with overall responsibility for the reviewed equipment.
New England Professionals LLC Page 64 August 31, 2009

A Transit Methodologoy Using Six Simga for Heavy Rail Vehicle Maintenance Programs – CASE STUDY - MDT
Finally, what are the outcomes and benefits of RCM? Outcomes: (1) Enhanced understanding of how the asset works; (2) A better understanding of how the asset can fail together with the root causes of each failure; (3) Lists of proposed tasks designed to ensure that the asset continues to operate at the desired level of performance; and (4) Greatly improved teamwork. Benefits: (1) Greater safety and environmental protection; (2) Improved operating performance; (3) Greater maintenance cost-effectiveness; (4) Longer useful life of expensive items; (5) Comprehensive maintenance database; and (6) Greater motivation of individuals; and (7) Better teamwork. Condition-based maintenance (CBM) was introduced to try to maintain the correct equipment at the right time. CBM is based on using real-time data to prioritize and optimize maintenance resources. Observing the state of the system is known as condition monitoring. Such a system will determine the equipment's health, and act only when maintenance is actually necessary. Development in recent years have allowed extensive instrumentation of equipment, and together with better tools for analyzing condition data, the maintenance personnel of today are more than ever able to decide what is the right time to perform maintenance on some piece of equipment. Ideally condition-based maintenance will allow the maintenance personnel to do only the right things, minimizing spare parts cost, system downtime and time spent on maintenance.
Traditional Maintenance Approach – The traditional approach to scheduled maintenance programs was based on the concept that every item on a piece of complex equipment has a “right age” at which complete overhaul is necessary to ensure safety and operating reliability. In short, it is believed that length of time between successive overhauls of an item was an important factor in controlling its failure rate. However, over time, research has revealed a lot about the conditions that must exist for scheduled maintenance to be effective. Two surprising discoveries are: (1) Scheduled overhaul has little effect on the overall reliability of a complex item unless the item has a dominant failure mode; and (2) There are many items for which there is no effective form of scheduled maintenance.
Value Streaming Mapping (improving the whole and not just optimizing the parts) – According to Dan Jones and Jim Womack, value stream mapping is “the simple process of directly observing the flows of information and materials as they now occur, summarizing them visually, and then envisioning a future state with much better performance.”
Lean Six Sigma is business improvement methodology that maximizes value by achieving the fastest rate of improvement in customer satisfaction, cost, quality, process speed, and invested capital.
With a summary explanation of the core and supporting research tools, the focal point became the Logic Model remaining three elements. It was agreed that key rail maintenance performance measures are Mean Distance Between Failure (MDBF) and
New England Professionals LLC Page 65 August 31, 2009

A Transit Methodologoy Using Six Simga for Heavy Rail Vehicle Maintenance Programs – CASE STUDY - MDT
Mean Distance Between Disruption (MDBD). MDBF is a cost factor whereas MDBD is a ridership factor; together, they have a significant impact on customer satisfaction, rail service. In consonance, key corresponding rail maintenance cost performance measures were specified: (1) Material Cost Per Rail Car; (2) Contracting Cost Per Rail Car; (3) Labor Cost Per Rail Car; (4) Overtime Cost Per Rail Car; (5) Productive Hours Cost Per Rail Car; and (6) Aging Cost Per Rail Car. Finally, four basic sources for establishing perspectives about standards for rail car function and performance were listed: (1) Original Equipment Manufacturers; (2) Rail Car Vendors; (3) Rail Industry at Large; and (4) Rail Maintenance Personnel and Staff.
Case Study Methodology The Case Study Methodology consists of two parts: Case Study Work Plan and Case Study Program. The Case Study Work Plan focused on context and approach; whereas, the Case Study Program emphasis was the establishment of a daily agenda to execute the Case Study.
Case Study Work Plan The Context for this Case Study addressed purpose, goal, and objectives. The purpose is to conduct a study of Miami-Dade Transit’s (MDT) implementation of Six Sigma with special emphasis on rail car maintenance. There are nine or more rail car systems that have been identified for data analysis and process analysis. In addition, this index study will document other steps in the MDT Six Sigma Process. The goal is to develop a Transit Methodology Using Six Sigma For Heavy Rail Vehicle Maintenance Programs with MDT serving as the best practice for implementation of Six Sigma with special emphasis on rail car maintenance. The objectives included:
Develop a detailed description of MDT’s initiation, execution, and implementation of Six Sigma with an intent to develop a cost efficiency and customer effectiveness measures to gage the performance of MDT’s Six Sigma Program on rail car maintenance;
Develop a detailed description of MDT’s rail car maintenance operations;
Develop a detailed description of how MDT’s other functional areas interact with
and support rail car maintenance; and
Construct a process map for rail car maintenance that integrates critical links to other MDT functional areas.
New England Professionals LLC Page 66 August 31, 2009

A Transit Methodologoy Using Six Simga for Heavy Rail Vehicle Maintenance Programs – CASE STUDY - MDT
The Approach for this Case Study addressed four tasks: Six Sigma Origin and Development, Rail Car Maintenance Operations, Functional Area Support and Rail Car Maintenance, and Process Mapping. Task 1 – Six Sigma Origin and Development Task Purpose The project team was interested in understanding and documenting MDT’s strategy and tactics to establish Six Sigma as the means of changing organizational culture and management from function-based to process-based. Sample Baseline Questions
What was the problem statement? Who was involved in the initiation of Six Sigma? How was the business case established i.e., reformulating the mission, creating
consensus, providing clarity and buy-in? What were the organizational objectives? What directives were issued? How was success going to be measured? How data were needs defined, collected, stored, retrieved, warehoused, and
reported along with software program used? What resources were allocated?
Sample Baseline Information and Data Collection
* Organization Chart Before and After Six Sigma Implementation * Six Sigma Implementation Plan * List of Six Sigma Planning Team Members * List of Resources required for implementation * Implementation Budget * Copy of Business Case for Six Sigma
Task 2 – Rail Car Maintenance Operations Task Purpose The project team was interested in documenting the rail car maintenance process according to the following rail car systems: (1) Air System; (2) Automatic Train Operation (A.T.O.) System; (3) Couplers and Draft Gear; (4) Doors; (5) Electric and Lighting; (6) Engine System; (7) H.V.A.C.; (8) Trucks; (9) Vehicle Body and Frame; and (10) Other. In short, how are rail car maintained on a day-to-day basis? Sample Baseline Questions
New England Professionals LLC Page 67 August 31, 2009

A Transit Methodologoy Using Six Simga for Heavy Rail Vehicle Maintenance Programs – CASE STUDY - MDT
What are the objectives of the maintenance program? – (safety, reliability, cost,
and supply) What are the elements of scheduled maintenance? (Daily servicing, inspections,
preventive parts replacement) What are the elements of unscheduled maintenance? (repairs and preventive
maintenance) What are the key maintenance indicators? How does vehicle design and technology impact the Mean Distance Between
Failures (MBDF)? How does operating conditions impact MDBF? (Weather, per vehicle, per train) What are the life cycles of parts and systems? What is the maintenance information system? What are the categories of performance measures?
Sample Baseline Information and Data Collection
* Mean Distance Between Failure * Fleet Availability * Maintenance cost or productivity * Definition and Calculation of Maintenance Indicators * Spare Ratio * Maintenance Unit Cost – per vehicle-hour, per vehicle-mile, per vehicle * Cost Allocation * Failure Mode by Technology
Task 3 – Functional Area Support and Rail Car Maintenance Task Purpose The project team was interested in documenting how other functional areas interact with and support rail car maintenance according to the following functions: (1) Procurement (Parts); (2) Capital Programming-Budgeting-Accounting; (3) Vehicle Engineering (Quality Control, Quality Assurance, and Design); (4) Safety; (5) Operations (Control Center and Emergency Repairs); (6) Customer Service (Complaints and Satisfaction Surveys); (7) Strategic Planning; and (8) Information Technology. In short, how do other functional areas work together to support rail car maintenance? Sample Baseline Questions
What are the day-to-day operations for non-rail car maintenance functional areas? How do the non-rail car maintenance functional areas link to rail car
maintenance? How do the operations of non-rail car maintenance functional areas impact rail car
maintenance? What are the performance measures for the non-rail car maintenance functions?
New England Professionals LLC Page 68 August 31, 2009

A Transit Methodologoy Using Six Simga for Heavy Rail Vehicle Maintenance Programs – CASE STUDY - MDT
Sample Baseline Information and Data Collection
* Functional Area performance indicators * Functional Areas’ Process Maps/Flowcharts * Cross-Functional or Deployment Process Map * Relations Diagram
Task 4 – Process Mapping Task Purpose The project team was interested in constructing a process map that integrates rail car maintenance with other functional areas to design a Transit Six Sigma Methodology that specifies key cost-saving and service performance measures. Sample Baseline Questions
What steps of other functional areas process are considered to be value-adding to rail car maintenance?
What steps of other functional areas process are considered to be value-enabling to rail car maintenance?
What steps of other functional areas process are considered to be non-value adding to rail car maintenance?
How do the critical phases for root cause analysis (exploring, generating hypotheses about causes, and verifying or eliminating causes) relative to data and process analysis work for rail car maintenance?
Sample Baseline Information and Data Collection
* Core Processes/Key Sub-processes * List of Process Owners * Process Measures and Data Collection Methods * Cost-saving performance measures * Service performance measures * Cause and Effect Diagram * Detailed Process Maps or Flowcharts * Cross-Functional or Deployment Process Map
Case Study Program The Case Study Program execution was based on four tasks delineated in the Case Study Work Plan. These tasks were achieved over a fifteen-day period that required 21 half-day meetings. All meetings were scheduled and attended by MDT Quality Assurance Chief. Task 1 – Six Sigma Origin and Development
New England Professionals LLC Page 69 August 31, 2009

A Transit Methodologoy Using Six Simga for Heavy Rail Vehicle Maintenance Programs – CASE STUDY - MDT
Case Study Kick-Off Meeting Day One - The morning meeting began with an introduction of Miami-Dade Transit (MDT) Rail Vehicle Propulsion System Six Sigma Process Improvement Project Team, summary of MDT Six Sigma Initiative, and two power-point presentations about one completed Six Sigma Project and another in the process of being conducted. These meetings were facilitated by MDT Quality Assurance Chief. MDT Six Sigma History Day One - The afternoon meeting covered a synopsis of how the Six Sigma organization-wide initiative was executed by MDT Manager of the Office of Strategic Planning and Performance. Six Sigma Information / Data Collection Day Two morning meeting was guided by MDT Chief of Knowledge Management, subject matter expert and senior staff. This meeting focused on how data needs were defined, collected, stored, retrieve, warehoused, and reported along with the software program being used. Six Sigma Implementation Plan Day Two evening meeting was centered on the development of a Six Sigma Implementation Plan for Rail Services which was presented by the Quality Assurance Team. Task 2 – Rail Car Maintenance Operations Rail Car Maintenance Operations – Overview Day Three meeting was designed to establish an overview of twelve (12) factors: (1) maintenance program objectives (e.g., safety, reliability, cost, and supply); (2) elements of scheduled maintenance (e.g., daily service, inspections, and preventive parts replacements); (3) elements of unscheduled maintenance (e.g., repairs and preventive maintenance); (4) key maintenance indicators; (5) vehicle and technology impact on Mean Distance Between Failures (MDBF); (6) operating conditions impact on MDBF, such as weather; (7) life cycles of parts and systems; (8) maintenance information system; (9) categories of performance measures; (10) maintenance unit cost relative to rail vehicles; (11) cost allocation; and (12) failure modes. Rail Car Maintenance Operations by Systems Day Four meeting concentrated on four factors: (1) rail maintenance standard operating procedures; (2) rail maintenance control procedures; (3) process map for rail maintenance
New England Professionals LLC Page 70 August 31, 2009

A Transit Methodologoy Using Six Simga for Heavy Rail Vehicle Maintenance Programs – CASE STUDY - MDT
repair; and (4) process map for rail maintenance scheduled preventive maintenance and inspection. Rail Car Maintenance Operations – Data/ Leadership Perspective Day Five meeting addressed four data factors: (1) mean distance between failure; (2) fleet availability; (3) maintenance cost and productivity; (4) definition and calculation of maintenance indicators; and (5) leadership perspective of rail car maintenance operations. Task 3 – Functional Area Support and Rail Car Maintenance Parts Procurement / Vehicle Engineering / Capital Programming –Budgeting-Accounting Day Six meetings covered the above functional areas sequentially and concentrated on three questions: (1) How do the non-rail car maintenance functional areas link to rail car maintenance?; (2) How do the operations of non-rail car maintenance functional areas impact rail car maintenance?; and (3) What are the performance measures for the non-rail car maintenance? Safety / Operations (Control Center and Emergency Repairs) / Customer Service Day Seven meetings covered the above functional areas sequentially and concentrated on three questions: (1) How do the non-rail car maintenance functional areas link to rail car maintenance?; (2) How do the operations of non-rail car maintenance functional areas impact rail car maintenance?; and (3) What are the performance measures for the non-rail car maintenance? Strategic Planning / Information Technology Day Eight meeting covered the above functional areas together and concentrated on three questions: (1) How do the non-rail car maintenance functional areas link to rail car maintenance?; (2) How do the operations of non-rail car maintenance functional areas impact rail car maintenance?; and (3) What are the performance measures for the non-rail car maintenance? Task 4 – Process Mapping Rail Car Maintenance Day Nine meeting focus on understanding the cross-functional process map and the day-to-day operations for non-rail car maintenance functional areas, relative to rail car maintenance.
New England Professionals LLC Page 71 August 31, 2009

A Transit Methodologoy Using Six Simga for Heavy Rail Vehicle Maintenance Programs – CASE STUDY - MDT
Day Ten meeting involved obtaining concurrence on the case study logic, rail maintenance cost formula and the development of two matrices. The two matrices were: cost of rail car maintenance formula drivers and supporting functional area relative to variables for the rail maintenance cost formula. Quality Assurance Day Eleven meeting was a recap of submitted documents and additional documents to be submitted along with a brief exit meeting with MDT Director.
The Case Study
MDT Metrorail System and Fleet Profile Metrorail System Miami-Dade Transit Metrorail began service in May 1984 at cost of $1.03 billion and is an electrically powered single line elevated rapid transit system that currently has 22 stations located along a 22.6 mile double track which can be traveled by a customer in 48 minutes - one-way; but the average passenger trip length is 7.7 miles. Metrorail connects five municipalities: Medley, Hialeah, Miami, Coral Gables, and South Miami. Passenger service operates between the hours of 5:00 a.m. – 12:00 a.m. on weekdays and from 5:10 a.m. to 12:00 a.m. on weekends and holidays. Some holidays require normal weekday service. During AM and PM Periods, trains arrive at stations every 7-8 minutes. Trains consist of 1 to 4 married pairs but only 3 of the 22 stations can accommodate an 8 car train (4 married pair). All station platforms are capable of handling 6-car trains (3 married pairs) which is the current capacity at which Metrorail operates. Unlinked passenger trips, during Fiscal Year (FY) 2007, totaled 17,504,736 with an average weekday ridership of 68,903 passengers; but, 18.4% of Metrorail total boardings were from Metrobus transfers. It should be noted that the percentage of Metrorail-only riders designated as transit-dependent dropped from 41% to 22% between 2003 and 2007. This suggests that a larger percent of customers are “choice” riders because they can choose between Metrorail and their personal vehicles. Nonetheless, the transit-dependent passengers who use both Metrorail and Metrobus, called “dual’ riders, was 54% in 2007 as well as 2003. Facilities system maintenance and other non-revenue activities can occur 24 hours a day, 7 days a week. However, Central Control operates 24 hours a day, 7 days a week; in consonance, the William Lehman Center (WLC) Yard Tower is staffed 24 hours a day, 7 days a week. WLC is where heavy, preventive, and running maintenance occur along with cleaning and vehicle storage. Future System Development is the result of voters approving a half-cent tax to fund public transportation improvements called the People’s Transportation Plan (PTP). As a
New England Professionals LLC Page 72 August 31, 2009

A Transit Methodologoy Using Six Simga for Heavy Rail Vehicle Maintenance Programs – CASE STUDY - MDT
result of the PTP, the Metrorail system will be extended by 22 miles. This includes three phased extensions with the following completion dates, according to MDT Fleet Management Plan (June26, 2008) in Expansion Plans section: (1) Phase 1, MIC-Earlington Heights Connector – 2012 (groundbreaking occurred in May 2009); (2) Phase 2, North Corridor Metrorail Extension – 2016; and (3) Phase 3, East-West Metrorail Extension – 2019. It should be noted that Phase 2 and 3 are in the modal analysis stage with Car Fleet MDT’s Metrorail revenue car fleet consists of 136 Miami/Baltimore Transit vehicles manufactured by the Budd Company between 1982 and 1985. The Peak Vehicle Requirement (PVR) is 84 vehicles or 14 six-car trains with 7.5 minute headway and an Operating Spare Ratio (OSR) of 47.6%. The revenue fleet entered service beginning in April 1984 with the last married pair received in April 1986. These cars are constructed with a stainless steel body, fiberglass “F” End (Front End) Cap. Each car is 75 feet in length and 10 feet 2.5 inches in width with the height being 12 feet 3.5 inches from top of the running rails. The empty weight of the A-Car and B-Car varies respectively -75,847 and 75,536 pounds. Full passenger load for each vehicle is 166 riders. Seated passenger load equals 74 riders and the “crush” passenger load established by the original vehicle manufacturer is 275. Because certain types of equipment are shared between the cars, the cars must be operated in pairs of one car A and one car B. The A car contains communications/public address equipment and the air compressor unit. The B car contains the automatic train control (ATC) system equipment, automatic train operation (ATO) system equipment, a battery, and a low voltage power distribution system. The primary propulsion for the vehicles is a 700-volt Direct Current (DC) third rail system. While Metrorail has a design capacity of 70 miles per hour (mph) maximum speed and a maximum acceleration of 3.0 miles per hour per second (mphps) with maximum deceleration of 3.2 mphps, it currently operates at a top speed of 58 mph to enhance savings through reduced energy consumption but the current average speed is maintained at 31 mph.
Six Sigma Origin and Development DAY ONE - AM The Case Study Kick-Off Meeting was attended by the individuals shown in the photo below.
New England Professionals LLC Page 73 August 31, 2009

A Transit Methodologoy Using Six Simga for Heavy Rail Vehicle Maintenance Programs – CASE STUDY - MDT
Figure 19 – FTA Six Sigma Case Study Kick‐Off Meeting May 4, 2009 @MDT Back Row Left - Rene A. Henriquez, Richard Snedden, Lazaro R. Palenzuela, Jerry Blackman Front row Left Zoila Badulesca, Harpal S. Kapoor (Director), Robert Dyck, and Kaushik N. Parekh (not shown Wendy Tyson-Wood and Kenneth R. Cook) Subject: FTA Six Sigma Case Study – Kick=Off Meeting Name Title Kaushik N. Parekh MDT - Quality Assurance Engineer Zoila Badulesca MDT - CQA, CQE - Quality Manager, Rail Services Rene A. Henriquez MDT - QA/QC Engineer Lazaro R. Palenzuela MDT - Chief – Office of Quality Assurance Jerry Blackman MDT - General Superintendent – Rail Vehicle Maintenance Harpal S. Kapoor MDT - Director Richard Snedden MDT - Assistant Director – Rail Services Robert Dyck Lead Engineer, IE&M Wendy Tyson - Wood New England Professionals Kenneth R. Cook, Ph.D. New England Professionals Table 8 ‐ Sign In Sheet May 4, 2009 @ 9:45pm Day One first morning meeting began with a brief introduction of each attendee on the above sign-in sheet. Afterwards, MDT Quality Assurance Chief, Lazaro R. Palenzuela, gave a power-point presentation that chronicled the MDT Process Improvement and Six Sigma Initiative. It should be noted that MDT is a department within Miami-Dade County organizational structure. MDT Process Improvement and Six Sigma Initiative is a product of Miami-Dade County launching its first ever Strategic Plan - September 21, 2004 – which was the County’s effort to build a Result Oriented Government. The plan serves as a community’ roadmap and it sets forth the goals, strategies, and performance measures at the County level with subsequent cascading to individual County Departments such as MDT. By April 12, 2005, the County Manager announced the establishment of the “Active Strategy Enterprise (ASE) which is the County’s online performance management system. It is used by MDT and all county departments as part of their annual Business Plan Development. The plan reflects each department objectives, key performance measures and initiatives that supports the County’s Strategic Plan Outcomes and Goals.
New England Professionals LLC Page 74 August 31, 2009

A Transit Methodologoy Using Six Simga for Heavy Rail Vehicle Maintenance Programs – CASE STUDY - MDT
At MDT, ASE meetings are held on monthly bases by the Management Team to review the results of key performance indicators. As part of this Case Study the following Business Plans were reviewed: (1) MDT Business Plan (2) Office of Strategic Planning and Performance Management; and (3) Office of Quality Assurance; (4) Rail Maintenance; and (5) Infrastructure Engineering and Maintenance. On November 30, 2005, MDT submitted its Governor’s Sterling Challenge application and by March 17, 2006, MDT’s Florida Sterling Site Visit was completed with a preliminary feedback report. Two month later, May 2006, MDT received its final feedback from the Florida Sterling and MDT received recognition at the Sterling Conference for completing the Challenge. MDT submitted it final Governor’s Sterling Award Application on November 17, 2006. Finally, on June1, 2007, MDT received the Sterling Quality Achievement Recognition Award for their Preventive Maintenance Program. The Plan-Do-Check-Act (PDCA) problem solving methodology was first introduced on October 1, 2006 in the FY 06/07 MDT Business Plan by the Deputy Director of Operations to improve reliability of the fleet. PDCA was popularized by Dr. W. Edwards Deming, who is considered by many to be the father of modern quality control; but, he later changed PDCA to PDSA (Plan-Do-Study-Act) to better explain recommendations. Specifically, PDCA is: (1) Plan - Establish the objectives and processes necessary to deliver results in accordance with the expected output. By making the expected output the focus, it differs from other techniques in that the completeness and accuracy of the specification is also part of the improvement; (2) Do - Implement the new processes. Often on a small scale if possible; (3) Check - Measure the new processes and compare the results against the expected results to ascertain any differences; and (4) Act - Analyze the differences to determine their cause. Each will be part of either one or more of the P-D-C-A steps. Determine where to apply changes that will include improvement. When a pass through these four steps does not result in the need to improve, refine the scope to which PDCA is applied until there is a plan that involves improvement. Conjunctively, root cause analysis and PDCA training through MDT Deputy Director of Operations Office were planned and 102 MDT employees, mostly management, successfully completed both types of training. As of May 16, 2007, the first set of Six Sigma (Define Stage) Process Mapping Initiatives was developed at MDT; they included four major Value Creation Processes (VCP): (1) Bus Services; (2) Rail Services; (3) Metromover Services; and (4) Para-transit Services. Under the current MDT Director, Harpal Kapoor, a full range of process maps has been developed for the divisional levels, as of March 2009. As a result, process mapping efforts have helped reduce operational costs by approximately $20 million in savings. As part of this Case Study the following Process Maps were reviewed: (1) Warranty; (2) Rail Maintenance Repair; (3) Rail Maintenance Scheduled Preventive Maintenance (PM) Inspection; (4) Customer Service Incidents; (5) Monthly Operating Budget Management; (6) Account Payable; (7) Procurement and Contract Administration; (8) Contract Monitoring and Reconciliation; (9) Quality Assurance Auditing; (10) RM Safety Critical Item Inspection; and (11) Campaign. The Process Maps were produced using MDT
New England Professionals LLC Page 75 August 31, 2009

A Transit Methodologoy Using Six Simga for Heavy Rail Vehicle Maintenance Programs – CASE STUDY - MDT
Process Mapping Guidelines Checklist. The Checklist consists of five sections: (1) Gathering Preliminary Information; (2) Process Mapping Steps on Current Process; (3) Process Improvement Steps; (4) List of Deliverables; and (5) Implementation Plan and Follow-Up. As of October 18, 2007, several members of the MDT Quality Assurance Division completed Six Sigma Black Belt training, administrated by the American Society for Quality (ASQ) – local section 1510. On March 13, 2008, MDT Office of Strategic Management began the cascading efforts to Divisional Levels for Active Strategy Enterprise (ASE) Cards. Also, a Six Sigma website was launched on MDT Transitnet. On March 30, 2008, MDT initiated its first documented Six Sigma Project – Accounts Payable Disbursement Process. The goal was to improve on the percentage of invoices paid within 30 days from its current average of 36%. The Six Sigma project was completed in May 2008 and the new process achieved a record level of invoices paid within 30 days for August 2008 – 96%. On August 8, 2008, data analysis with Pivot Tables training began with 50 students completing the class. In September 2008, New England Professionals (NEP) held its first of five site visits at MDT, concerning FTA Six Sigma National Research Project. NEP provided an overview of the project which focused on Rail Car Maintenance; afterward, NEP toured the Rail Services Control Center and Maintenance Facility. On February 13, 2009, NEP on behalf of FTA notified MDT that they had been selected and approved to be the Case Study for Transit Six Methodology concerning Heavy Rail Vehicle Maintenance Programs. By February 27, 2009, MDT initiated a Six Sigma project on Rail Vehicle MDBF with primary focus on propulsion failures. On May 4, 2009, NEP began the site visit Case Study which lasted until May19, 2009. Day One second morning meeting was focused on Lazaro R. Palenzuela presenting a power-point presentation of the Accounts Payable Disbursement Six Sigma Project, using the Six Sigma DMAIC (Define, Measure, Analysis, Improve, and Control) model. Also, some discussion was had about the in-progress Six Sigma Rail Propulsion Project but it is not cover in this Case Study.
New England Professionals LLC Page 76 August 31, 2009

A Transit Methodologoy Using Six Simga for Heavy Rail Vehicle Maintenance Programs – CASE STUDY - MDT
Figure 20 ‐ Lazaro Palenzuela reviews MDT Accounts Payable Disbursement Process Map
The Define Phase included: (1) Project Objective and Benefit; (2) Project Charter; (3) Is and Is not Matrix; (3) SIPOC Diagram; (4) Process Map; and (5) Histogram. Project Objective was to increase the percentage of invoices paid within 30 days aging and the Benefit was improvement made in the Accounts Payable process shall lead to an increase in vendor confidence Miami- Dade Transit ability to pay in a timely accurate manner. Part one of the Project Charter fundamentally specified start and finish dates, project champion, subject matter expert, and the service being impacted. Part two of the Project Charter addressed: (1) Process under investigation – Accounts Payable Disbursement Process; (2) Project Description – problem paying vendor on time at a targeted rate of 85% and goals were to increase invoices paid within 30 above the average rate of 63% as well as establish a more realistic and achievable target rate based on process capabilities; (3) Objective – what improvement targeted and what will be it impact on the business – increase percentage of invoices paid within 30 days from 63% to 70% and reduce aging average number days from 29 to 25; (4) Business Case – comply with MDT Prompt Payment Administrative Order and improve efficiency of operation as well as payment to vendors; (5) Team members – six sigma green belt, champion, process owner, account payable expert, and information technology services representative; (6) External Customer Benefit – receive on-time payment for services rendered; and (7) Milestones – identify tasks and corresponding completion date for each DMAIC Phase. The “Is and Is Not” Matrix addressed five points: what is the problem, who was complaining, where was the problem found or noticed, when first noticed, and how much of a problem is it. The SIPOC Diagram showed an at-a-glance perspective of the process steps for Accounts Payable Disbursement Process, which included: suppliers, required inputs, four part process flow, outputs, and customers. A detailed Process Map was prepared that show the Accounts Payable Disbursement Process deployment steps as related to the functional areas involved along with required records, procedures, and performance indicators. Lastly, a Histogram was produced to graphical show variance in invoice payments The Measure Stage only used a Control Chart to detect abnormal variation in the payment of invoices and it was determine the process was unstable.
New England Professionals LLC Page 77 August 31, 2009

A Transit Methodologoy Using Six Simga for Heavy Rail Vehicle Maintenance Programs – CASE STUDY - MDT
The Analysis Stage included: Pareto Analysis, Root Cause Analysis (Ishikawa’s Fishbone Diagram), and Design of Experiments (DOE). Pareto Analysis revealed that the “Need Packing Slip” had the biggest impact on invoice process delays, so “Reason for Delay” data was collected to do an analysis. Root Cause Analysis showed that the packing slip was not available because people were slow to inspect and verify merchandise, lack of standard method among Materials Management staff, and process cycle time is not set to critical activities. DOE determined that the delivery method had a significant impact of cycle time. The Improve Stage, using a Contour Plot, discovered that for 4-6 merchandise needing inspection at least 2-2.5 people are required. Hence, Confirmation Runs indicated that the Delivery Method should be electronic and more people need to be trained for performing materials inspections so that the cycle time can be one day. As a result, the Control Stage, through a process performance history chart, clearly illustrated that the average percentage of invoices paid within 30 days was 93% which exceeded the target of 85%. The Six Sigma History Meeting was attended by the individuals shown in the photo below. Day One PM Meeting – Six Sigma History @ MDT
Figure 21 ‐ FTA Six Sigma Case Study –Six Sigma History @MDT May 4, 2009 Standing Row: Byron Peres, Sandy Amores, Manny Castillo, Rene A. Henriquez, and Robert Dyck Sitting Row: Kelly Cooper, Susanna Guzman-Arean, Lazaro R. Palenzuela (not shown Wendy Tyson-Wood and Kenneth R. Cook) Subject: FTA Six Sigma Case Study – Six Sigma History @ MDT Name Title Lazaro R. Palenzuela Chief – Office of Quality Assurance Dwight Baldwin Lead Transit Maintenance Production Coordinator Susanna Guzman-Arean Chief Strategic Planning and Performance Management Rene A. Henriquez MDT - QA/QC Engineer Kelly Cooper Manager Performance Reporting Byron Peres MDT - Intern
New England Professionals LLC Page 78 August 31, 2009

A Transit Methodologoy Using Six Simga for Heavy Rail Vehicle Maintenance Programs – CASE STUDY - MDT
Sandy Amores Chief Knowledge Management Manny Castillo 6 Sigma Efficiency / Performance Management Robert Dyck Lead Engineer, IE&M Wendy Tyson - Wood New England Professionals Kenneth R. Cook, Ph.D. New England Professionals Table 9‐ Sign In Sheet: Date: May 4, 2009 @ 1:30 pm Day One afternoon meeting began with a brief introduction of each attendee on the above sign-in sheet. Even though a chronological profile of MDT Process Improvement and Six Sigma (PI & SS) Initiative had been provided in the morning meetings, it was critical to understand specific start-up actions. The PI & SS Initiative began in March of 2007 with a Task Memo for Miami-Dade County Manager’s requesting a 90-Day Plan from MDT to address the first ever Strategic Plan for a Result Oriented Government. Completion of this plan was assigned to the Office of Strategic Planning and Performance Management by then interim Director, Harpal Kapoor. Although it was not specifically stated or suggested by the County Manager, this plan was a key determinant of the Director’s final appointment 90 days later, June 2007. Susanna Guzman-Arean was assigned the responsibility for managing the 90-Day Plan completion. The task was especially challenging because of budgetary constraints; thusly, she was expected to use existing resources for facilitating cultural change to be: (1) proactive versus reactive management; (2) customer focus; (3) process-oriented; and (4) strategic-minded in planning. To do so, the Enterprise Strategy Execution, in part, was used to guide her efforts which consisted of three factors. The Prioritize Factor included obtaining executive buy-in and support, using strategic planning and mapping, instituting top level scorecards, and supporting cascading scorecards. The Improve Factor entailed performance improvement and scorecard business reviews. The Control Factor covered process management, employee goal and compensation alignment, and budget integration. Hence, the underlying theme was “what get measured get managed” as stated by Sandy Amores – Chief of Knowledge Management in the Office Strategic Planning and Performance Management. As such, performance gaps were identified to address: alignment of departmental plans, alignment of budget to business priorities, alignment of resources to business priorities, alignment of grant funding to business priorities, business priorities communication gaps, accountability, and development of formalized process to prioritize objectives. Consequently, weekly accomplishments were documented with subsequent bi-weekly briefing reports that deal with project progress, milestone activities, and project issues. Additionally, quarterly meetings were held with five having been conducted at the time of this Case Study. But of equal importance, the organizational chart was changed three times to align departmental functions with organizational processes. (see Figure 22 ‐ MDT Transit Business Plan Fiscal Years: 2009 and 2010 – Executive Summary)
New England Professionals LLC Page 79 August 31, 2009

A Transit Methodologoy Using Six Simga for Heavy Rail Vehicle Maintenance Programs – CASE STUDY - MDT
Figure 22 ‐ MDT Transit Business Plan Fiscal Years: 2009 and 2010 – Executive Summary
Ultimately the Full Time Equivalent (FTE) count was reduced as shown below.
YEAR FTE FTE Δ % Δ 2008-2009 3301 419 11% 2007-2008 3720 156 4% 2006-2007 3876 -- --
Table 10 ‐ Source: MDT Organization FTE Data ‐ 2006 thru 2009
A breakdown of the above table concerning change in FTE is shown below:
Figure 23 ‐ Table of Organization (FTE change by Department) Source: Miami-Dade Transit Business Plan Fiscal Years: 2009 and 2010 (10/1/08 through 9/30/10) Plan Date: 21, 2008 –
New England Professionals LLC Page 80 August 31, 2009

A Transit Methodologoy Using Six Simga for Heavy Rail Vehicle Maintenance Programs – CASE STUDY - MDT
The Data Collection Meeting was attended by the individuals shown in the photo below. DAY TWO - AM
Figure 24 ‐ The Data Collection Meeting Standing: Kenneth Cook, Rene A. Henriquez, Lazaro R. Palenzuela and Kaushik Parekh Sitting: Sandy Amores, Marlon Beckford (not shown Wendy Tyson-Wood and Edward Thomas)- Subject: FTA Six Sigma Case Study – Data Collection Name Title Lazaro R. Palenzuela Chief – Office of Quality Assurance Marlon Beckford Transit Maintenance Production Coordinator Sandy Amores Chief Knowledge Management Rene A. Henriquez MDT - QA/QC Engineer Kaushik Parekh MDT - QA/QC Engineer Edward Thomas New England Professionals Wendy Tyson - Wood New England Professionals Kenneth R. Cook, Ph.D. New England Professionals Table 11 ‐ Sign In Sheet Date: May 5, 2009 @ 10 pm
Day Two morning meeting began with a brief introduction of the attendees on the above sign-in sheet that had not been previously introduced at another meeting. Information and Data collection, storage, retrieval, warehousing, and reporting
New England Professionals LLC Page 81 August 31, 2009

A Transit Methodologoy Using Six Simga for Heavy Rail Vehicle Maintenance Programs – CASE STUDY - MDT
responsibility fall under the Knowledge Management Section of the Office of Strategic Planning and Performance Management (OSPPM); this section is managed by Sandy Amores – Knowledge Management Chief. As pointed out in the OSPPM Business Plan, this Section is responsible for directing and establishing plans, programs and policies designed to provide effective and efficient maintenance for the Metrobus, Metrorail and Metromover systems. Achievement of this responsibility requires 41 FTE’s across five subsections: (1) Rail Maintenance – 15 Control Clerks; (2) Transit Maintenance – 12 Production Coordinators; (3) Bus Maintenance – 4 Control Clerks; (4) Facilities Maintenance – 5 Control Clerks; and (5) Warranty, Reliability, and Analysis – 5 staff persons. Collectively, these sections provide input for: (1) meeting current and future technical training needs of OSPPM; and (2) assuring adequate control measures are established and maintained for repair process; and (3) developing and implementing reliability and maintainability programs required to monitor, evaluate and maintain the established performance of the transit system. Additionally, this unit is responsible for: (1) tracking of warrantable components effectively; (2) ensuring that warranty data is registered, implemented and tracked; (3) evaluating the validity of failed parts with existing warranties; (4) validating and authorizing expenditure of unwarrantable repairs; and (5) investigating and resolving claim disputes. Execution of the above-mentioned responsibilities is conducted with the assistance of a central database system called Enterprise Asset Management System (EAMS) which is geared towards achieving greater accuracy and timeliness in knowledge management reporting. EAMS enables MDT to save time and money optimizing maintenance resources, improving equipment and staff productivity, increasing inventory efficiency and strengthening the ability to collect on warranty-related claims. This database system produces real time reports – daily, weekly, monthly, quarterly. Finally, it is estimated that by 2010 all MDT assets will be catalogued. The Six Sigma Implementation Plan meeting was attended by the individuals shown in the photo below, except Director Kapoor. He made a brief visit at the end to assess how the meetings were progressing. DAY TWO – PM
Figure 25 ‐ MDT‐050509‐Task 2 Re‐Cap with Director Kapoor – May 5, 2009 Manny Castillo, Harpal Kapoor (Director), Lazaro R. Palenzuela, and Kenneth Cook
New England Professionals LLC Page 82 August 31, 2009

A Transit Methodologoy Using Six Simga for Heavy Rail Vehicle Maintenance Programs – CASE STUDY - MDT
Subject: FTA Six Sigma Case Study – Six Sigma Implementation Plan Name Title Lazaro R. Palenzuela Chief – Office of Quality Assurance Manny Castillo 6 Sigma Efficiency / Performance Management Rene A. Henriquez MDT - QA/QC Engineer Wendy Tyson - Wood New England Professionals Kenneth R. Cook, Ph.D. New England Professionals Table 12 ‐ Sign In Sheet Date: May 5, 2009 @ 2pm
Responsibility of the Six Sigma Implementation was assigned to the Office of Quality Assurance which is responsible for the overall quality assurance oversight of all MDT’s major projects, internal processes, and process improvement initiatives through the use of Six Sigma methodology and related tools.
Lazaro R. Palenzuela, who reports directly to MDT Director, was appointed Chief of Quality Assurance for MDT in June 2008 but had previously been a Quality Assurance Engineer at MDT since 2004. He has over 20 years of Quality Assurance and Quality Control (QA/QC) experience in both the aviation and transportation industry combined. His key experience was serving as Quality Assurance Supervisor at Goodrich Aerospace, provider of heavy maintenance and repair services for major commercial air carriers throughout the world. In that capacity, he was responsible for providing guidelines in repairing aircraft components and for managing the QA/QC department which included four main functional areas; receiving inspection, in-process inspection, final inspection, and QA auditing. Palenzuela holds the following degrees: (1) Master of Business Administration; (2) Bachelor of Science in Management of Technical Operations and Engineering from Embry-Riddle Aeronautical University; and (3) Associate of Science in Mechanical and Industrial Engineering from Miami Dade College. Furthermore, he is Certified Quality Auditor (CAN) and Certified Machinist along with having completed Six Sigma Black Belt training administered by the American Society of Quality (ASQ). Professional affiliation includes: American Society for Quality and Society of Automotive Engineers (SAE). Lazaro has two key assistants relative to Six Sigma Implementation Plan. Rene A. Henriquez is a QA/QC Engineer that is currently serving as a Quality Engineer Consultant for MDT’s Office of Quality Assurance. He has a wealth of QA/QC experience dealing with transportation projects, sophisticated electronic systems, and mass transit vehicles over 13 years of experience. Specifically, Rene applied the Six Sigma improvement methodology, DMAIC, to reduce the cycle time of MDT Accounts Payable Disbursement Process, which improved the average percentage of invoices paid within 30 days from 63% to 93%. Previous employment included: Quality Assurance Manager – Sumitomo Corporation of America; Advanced Manufacturing Engineer – SPX Corporation; Manufacturing/Quality Engineer – Equitrac Corporation; Commodity Quality Engineer – IBM Corporation; and Inspector/Test Engineer – MED-Craft Inc. Henriquez holds the following degrees: Master of Business Administration – University of Miami, Coral Gables Florida; and Bachelor of Science Electrical Engineering - Florida
New England Professionals LLC Page 83 August 31, 2009

A Transit Methodologoy Using Six Simga for Heavy Rail Vehicle Maintenance Programs – CASE STUDY - MDT
International University, Miami Florida. Professional certification and training includes: (1) ASQ – Certified Quality Auditor; (2) ASQ – Six Sigma Green Belt Certification Training; and (3) ASQ Six Sigma Black Belt Certification, in progress. Second key assistant, Manny Castillo is a Quality Assurance Engineer that is currently serving as a Process Management and Quality Consultant for MDT’s Office Quality Assurance with 13 years of experience. Specifically, Manny implemented and developed a plan to standardize process mapping as a process improvement tool, developed and published MDT Six Sigma website on Transitnet, internal to MDT, and developed as well as instructed three classes for business problem solving – PDCA, Pivot Tables, and Process Mapping. Previous employment included: General Manager – Cotecna Quality Resources; Quality Consultant – Lucent Technology; Project Manager – AT&T; and Electro-Mechanical Engineer – IBM Corporation. Castillo holds the following degrees: Master of Business Administration – New York Institute of Technology; and Bachelor of Science Electro-Mechanical Engineering Technology – City University of New York. Professional certifications and training: (1) ASQ – Certified Six Sigma Green Belt; (2) Six Sigma Black Belt – Sixsigma.us Institute (72-hour training class); and (3) ASQ – Certified Quality Manager. In addition to key assistants, Palenzuela rail maintenance contact relative to Six Sigma Implementation is Zoila Badulescu – Rail Services Quality Manager. She is responsible for quality oversight, monitoring, and support of Rail Services that include but not limited to activities related to vehicle and rail maintenance, operations, and procurement of goods and services. Furthermore, Zoila was the Acting Chief of Quality Assurance for MDT from 2003 to 2006. She holds the following degrees: Master of Public Administration – Florida International University; and Bachelor of Science in Petroleum Engineering, Oil, and Gas Institute – Bucharest Rumania. Certification and training includes: (1) ASQ – Certified Quality Engineer; (2) Certified Quality Auditor –ASQ; (3) ISO 9001 2000 Lead Assessor Certification – STAT-AMAATRIX Institute; and (4) Six Sigma Black Belt Training – ASQ. Six Sigma Implementation Six Sigma Implementation is rooted in the Office of Quality Assurance Business Plan goal for implementing and maintaining a quality assurance program that ensures continuous improvement of MDT processes and services. Success requires a commitment to continuous quality improvement that is maintained throughout all levels of MDT management and workforce. This commitment applies as well to contracted consultants, program management groups, suppliers of products, services and vehicles. Six Sigma has not been fully implemented but a sound foundation has been set as identified in the Process Improvement and Six Sigma Initiative Timeline described in Day One morning meeting. In support of that timeline, full deployment of the Six Sigma methodology has been designated as one of the four significant programs and initiatives for Fiscal Years 2009 and 2010 in Business Plan.
New England Professionals LLC Page 84 August 31, 2009

A Transit Methodologoy Using Six Simga for Heavy Rail Vehicle Maintenance Programs – CASE STUDY - MDT
Implementing Six Sigma is a two-fold approach with three phases. Six Sigma implementation focuses on quality culture building, methodology, tools training, and key project application. Approach One is fostering an excellent quality culture in the entire value chain, from supplier operation to customer services, to improve fundamental levels by using ‘common language and behavior” for standardization. Approach Two is using nurturing experts on six sigma implementation to provide leadership for executing key business projects with breakthrough improvements. The corresponding three phases are: Phase One: Communication/Planning
Communicate six sigma initiative as a common language; Plan goal targets and setup a measurement system to evaluate the performance; Create training and project plans.
Phase Two: Action and Monitor
Track the progress of the training course and trained people; Track the progress of the project number and status.
Phase Three: Review and Recognition
Review performance with matrix and document lesions learned; Recognize successful teams.
The baseline steps taken and being taken for full deployment of Six Sigma at MDT are:
• Establishment of a MDT Six Sigma Policy that explains and outlines the use of Six Sigma in a common language.
• Staff the Office of Quality Assurance with six Quality Assurance Engineers and one Quality Assurance Engineer II, to serve as the supervisor.
• Documentation of a Quality Management System guided by ISO 9000 (International Organization of Standardization)
• Process Mapping Guidelines and Process Mapping • Six Sigma Website • Execution of Accounts Payable Disbursement Six Sigma Project • Execution of Six Sigma Rail Propulsion Project - in progress Process Improvement Training • Process Mapping with Viso • Data Analysis with Pivot Tables • Root Cause Analysis • Problem Solving and Decision Making • Six Sigma Green Belt (2-Day)
New England Professionals LLC Page 85 August 31, 2009

A Transit Methodologoy Using Six Simga for Heavy Rail Vehicle Maintenance Programs – CASE STUDY - MDT
Rail Car Maintenance Operations DAY THREE Rail Care Maintenance Operations meeting was attended by the individuals in the photo below.
Figure 26 ‐ Rail Care Maintenance Operations meeting May 6th and 7th 2009 Robert Dyck, Jerry Blackman, Dwight Baldwin, Rene Henriquez, Kenneth Cook, and Lazaro Palenzuela (not shown Wendy Tyson-Wood) Subject: FTA Six Sigma Case Study – Rail Car Maintenance Operations - Overview Name Title Lazaro R. Palenzuela MDT - Chief – Office of Quality Assurance Rene A. Henriquez MDT - QA/QC Engineer Jerry Blackman MDT – MDT/Rail Vehicle Maintenance – General Superintendent Dwight Baldwin Lead Transit Maintenance Production Coordinator Robert Dyck Lead Engineer, IE&M Wendy Tyson - Wood New England Professionals Kenneth R. Cook, Ph.D. New England Professionals Table 13 ‐ Sign In Sheet Date: May 6, 2009 @ 10 am
Day Three meeting began with a brief introduction of each attendee on the above sign-in sheet and summary explanation meeting intent, which was to gain an overall understanding of how rail vehicle maintenance operates. Rail Vehicle Maintenance is the largest Division within Rail Services. The main product or service Rail Maintenance provides is the delivery of public transit service via the Metrorail transportation mode. MDT’s Metrorail currently has 22 stations located on the 22.6 mile, double track, single line, electrically powered system and makes 182 trips daily. Rail Maintenance personnel
New England Professionals LLC Page 86 August 31, 2009

A Transit Methodologoy Using Six Simga for Heavy Rail Vehicle Maintenance Programs – CASE STUDY - MDT
total 185 employees over three eight-hour shifts; they perform heavy maintenance, preventive maintenance, running maintenance, and cleaning of railcars at a single facility, William Lehman Center, located near the northern terminus of the system. Rail Vehicle Maintenance includes four sections: Division Office, Vehicle Maintenance, Train Control, and Traction Power Systems. The Division Office establishes the sections mission and objectives and enforces safety policies and emergency procedures. Vehicle Maintenance Section is responsible for the major overhaul inspection, wheel truing, wheel replacement, and in-house repairs of vehicle components on a fleet of 136 rail cars. Furthermore, Vehicle Maintenance monitors equipment on areas exhibiting potential for failure and conveys this information to engineering for analysis and makes the necessary changes to the operating equipment as required by the engineering staff. Train Control Section is responsible for all preventive and corrective maintenance of all Train Control rooms, Central Control facility, and wayside equipment on the mainline and the Palmetto Yard. The Traction Power Section is responsible for the performance of routine and corrective maintenance on traction power equipment as dictated by approved maintenance procedures and schedules. Additionally, Traction Power Section investigates and collects information on areas exhibiting potential trouble and conveys this information to engineering for analysis. The primary objectives of Rail Vehicle Maintenance are:
Maintain rail vehicles in pursuit of aggressive on-time performance; Optimize parts availability and effectively administer contracts – Rail Vehicle Maintenance; Maintain advancement of capital projects for Rail Vehicle Maintenance; Utilize technology to improve business processes of Rail Vehicle Maintenance; Minimize vacant positions in MDT Rail Vehicle Maintenance; Improve the technical and professional skill levels of Rail Vehicle Maintenance employees; Enhance customer satisfaction related to Rail Vehicle Maintenance; Maximize reliability of rail vehicles; Decrease the amount of unanticipated absenteeism in Rail Vehicle Maintenance; and Ensure qualified employees are available to fill mission-critical positions.
The key performance measures are: (1) On-Time Performance; (2) Total number of Service Disruptions; (3) Mean Distance Between Disruptions; (4) Mean Distance Between Mainline Failures; (5) Preventive Maintenance Completion Adherence; (6) Peak Vehicle Requirement – Weekday; and (7) Rail Vehicle Cleaning.
The primary functional support areas are: (1) Office of Strategic Business Management; (2) Procurement Management (timely and quality execution of key milestones such as Notice to Proceed); (3) Human Resources; (4) Office of Capital Improvement; (5) Information Technology; (6) Knowledge Management; (7) Infrastructure Engineering and Maintenance; (8) Customer Service; (9) Quality Assurance; (10) Office of Civil Rights and Labor Relations; (11) Department of Procurement Management (solicitation and contract award processes); and (12) County Attorney (legal issues in the solicitation and contract).
New England Professionals LLC Page 87 August 31, 2009

A Transit Methodologoy Using Six Simga for Heavy Rail Vehicle Maintenance Programs – CASE STUDY - MDT
The Maintenance Management Information System is Enterprise Asset Management System (EAMS). It is being instituted because MDT had a variety of both manual and automated systems used for managing inventory, purchasing, creating and tracking work orders, labor allocation, and other maintenance as well as materials management functions. These systems were not interfaced or could not communicate with one another. Consequently, EAMS is designed to address all facets of scheduled and unscheduled maintenance related to Rail. It is a fully integrated system that will consolidate both maintenance and materials management functions into one comprehensive system; however, it has not been implemented for rail maintenance. Two Types of maintenance are performed on the rail car fleet at MDT:
Operating Maintenance: Scheduled (preventive) maintenance involves replacement of specific components and/or systems to improve the reliability of the rail car; Unscheduled (corrective) maintenance entails vehicle services needed as result of in service failures.
Car Renovation: This involves complete overhaul of the vehicle and replacement of obsolete components to extend the life of the vehicle. This is performed when vehicles reach one million miles or after 15 years of service.
Maintenance assigned vehicles are those vehicles out of service for “scheduled” preventive maintenance and “unscheduled” corrective maintenance. The number of married pairs in this category is determined by historic experience as reflected in records and in the Preventive Maintenance (PM) Program specifications. The daily average of maintenance assigned vehicles is less than 22 pairs or 44 cars. In term of train malfunctions, a number of safety-related conditions and equipment –related malfunctions can require that a train be removed from service. Subsystems where these failures are likely to occur include: Automatic Train Control, Automatic Train Protection, Propulsion, Brakes, Headlights and Taillights, Passenger Door problems, Cracked or shattered passenger windows, and Communications. As of FY 2007, Metrorail Fleet Repairs total 10,676. Majority of the repairs occurred as follows: (1) Friction Brakes – 19.7%; (2) Power and Traction – 17.3%; (3) Miscellaneous Electrical – 11.7%; and (4) Car Body -10.2%. The first three systems contain most of the electrical, mechanical, and pneumatic components as well as account for nearly half of all repairs. In addition to safety-related conditions, MDT removes trains from service that could have an adverse effect on passengers, such as:
• Trains experiencing air-conditioning problems are removed from service at the earliest convenience.
• Metrorail trains have six (60 sets of passenger door panels per car. More than one single panel cut-out on the same side of the car renders the car unserviceable for passenger use.
New England Professionals LLC Page 88 August 31, 2009

A Transit Methodologoy Using Six Simga for Heavy Rail Vehicle Maintenance Programs – CASE STUDY - MDT
• A train, which experiences major vandalism involving graffiti, is removed from
service. • When the passenger on-board intercom system between individual cars and the
operator’s cab fails (i.e., passengers cannot communicate with Train Operators and vice versa), the train is removed from service.
Finally, the philosophy and goals of the Metrorail Maintenance Program Policy are to maximize cost-effectiveness of maintenance efforts consistent with safe operations through a proper balance of preventive maintenance, corrective maintenance, and system improvements. Correspondingly, the Maintenance Program Mission is accomplished through the following objectives:
Eliminate increases in component failures rates due to equipment age Increase reliability of components and subsystems through identification and
modification of existing design Improve efficiency of maintenance operations through:
- Productivity-enhancing capital investments - Re-design of shop processes - Enhancement of the skills of the workforce - Application of state-of-the-art repair techniques and test equipment
DAY FOUR Subject: FTA Six Sigma Case Study – Rail Car Maintenance Operations by Systems Name Title Lazaro R. Palenzuela MDT - Chief – Office of Quality Assurance Dwight Baldwin Lead Transit Maintenance Production Coordinator Rene A. Henriquez MDT - QA/QC Engineer Robert Dyck Lead Engineer, IE&M Jerry Blackman MDT – MDT/Rail Vehicle Maintenance – General Superintendent Wendy Tyson - Wood New England Professionals Kenneth R. Cook, Ph.D. New England Professionals Figure 27 ‐ Sign In Sheet Date: May 7, 2009 @ 10 am Lehman Center
Day Four meeting was continuation of Rail Car Maintenance Operations with the individuals on the above sign-in sheet. A review of the Rail Maintenance Repair Process Map revealed that six stakeholders are necessary with Rail Vehicle Maintenance responsible for eleven of the required 17 steps. The stakeholders are in sequential order: (1) Rail Supervisor/ Rail Operator; (2) Central Control; (3) Rail Yard Dispatcher; (4) Rail Maintenance Control; (5) Rail Vehicle Maintenance; and (6) Materials Management. Records required to construct the process map were Vehicle Malfunction Report and Defect Tags and key performance measures are Peak Vehicle Requirement, Mean Distance Between Failures, and Mean Distance Between Service Disruption. Reference Documents include: Rail Maintenance Control Procedures, Standard Operating Procedures, and FTA Maintenance Requirements.
New England Professionals LLC Page 89 August 31, 2009

A Transit Methodologoy Using Six Simga for Heavy Rail Vehicle Maintenance Programs – CASE STUDY - MDT
Review of the Rail Maintenance Scheduled Preventive Maintenance (PM) Inspection Process Map revealed that four stakeholders are necessary with Rail Vehicle Maintenance and Rail Maintenance Control constitutes 23 of the required 26 steps. The stakeholders are in sequential order: Rail Maintenance Control, Rail Vehicle Maintenance, Central Control Yard, and Material Management. Records required to construct this process map were: Preventive Maintenance Performed, Work Orders, and Defect Tags. Key performance measures included: Compliance with PM Requirement, Mean Distance Between Failure, and Mean Distance Between Service Disruptions. Reference documents were FTA PM Requirements and Standard Operating Procedures. The types of inspections include the following classifications: Inspection Type
Inspection Interval
Interval Mileage
Labor Time (Hours) Per Pair
Basic Description
Daily 24 Hrs 0.6 Visual inspection of car interior and exterior – Functional test of safety- critical and passenger convenience components
A 60 Days 18,500 36.0 Base level PM aimed at preventing the most common problems
B 120 Days 32,000 40.0 Type A + tasks aimed at more in-depth checks of the components
C 180 Days 48,000 59.2 Type A + Type B + more detailed checks of the traction motor, coupler, friction brakes, gear unit, and electrical systems
D 360 Days 96,000 67.9 Type A + Type B + Type C F 4-5 Years 200,000 420.0 Long range component overhaul G 8-10 Years 400,000 816.0 Type F + other long range
component overhaul requirements S Removed from storage and returned to service – functional check of all
components and systems Table 14 ‐ MDT's Types of Inspections
Nearly 45% of the PM tasks are Type A tasks and 5% are Type B task involving routine inspection, cleaning, and minor adjustments. The mechanical and electrical items inspected include contact condition, fluid levels, grease lubrication, motor brush wear, and car body components that do not change rapidly. Most of these items remain in acceptable condition well beyond inspection intervals and it is unnecessary to change component wear-out criteria for replacement as specified in the PM. Feedback from maintenance personnel is used to review the revised schedule and adjustments are made when necessary.
New England Professionals LLC Page 90 August 31, 2009

A Transit Methodologoy Using Six Simga for Heavy Rail Vehicle Maintenance Programs – CASE STUDY - MDT
DAY FIVE Subject: FTA Six Sigma Case Study – Rail Car Maintenance Operations – Data Name Title Lazaro R. Palenzuela MDT - Chief – Office of Quality Assurance Rene A. Henriquez MDT - QA/QC Engineer Marlon Beckford Transit Maintenance Production Coordinator Clara Ferrin MDT Wendy Tyson - Wood New England Professionals Kenneth R. Cook, Ph.D. New England Professionals Table 15 ‐ Sign In Sheet Date: May 8, 2009 @ 10 am
Day Five AM meeting was continuation of Rail Car Maintenance Operations with the individuals on the above sign-in sheet. Most of the meeting time was spent on a demonstration of EAMS to better understand how it works. Afterward some discussion was dedicated to Maintenance Cost. That is maintenance planning for long-term overhaul requirements began in 1987 only three years in advance of the Original Equipment Manufacturer recommended intervals. Unfortunately, the lack of adequate funding hindered maintenance in reaching component and subsystem rebuilding goals. Additionally, staff was allocated to operate a variety of component shops and perform G-Inspections; however, the expanded Peak Vehicle Requirements (PVR) and vacancies in critical positions redirected MDT personnel efforts from component overhaul to running repair. Component overhaul is currently accomplished on contract by certified vendors. A major concern was developing a work plan to improve the Mean Miles Between Service Failure (MMBSF). The plan called for additional allocation of manpower for vehicle repair and maintenance to reduce in-service failures, changes in rail car PM schedule to provide additional labor hours to address repair of G-Inspections components rated “bad” or “poor.” The plan further addressed correcting mean miles/time methodology, defining “failure,” establishing an efficient and accurate methodology to measure on-time performance, and recalculation of service disruptions. Failure was defined, before October 2001, as ratio of married pair vehicle miles operated to the number of vehicle mainline hardware failures that resulted in a service interruption. In short this ratio did measure Metrorail performance effectively from a passenger perspective. As such, the revised methodology for Mean Miles Between Service Disruption (MMBSD) performance is a ratio of vehicle miles operated to the number of vehicle mainline failures during revenue service that result in a delay that is greater than or equal to 3 minutes. Fleet Availability based on Revenue Vehicle Demand and Supply for FY 2009 to FY 2020 is as follows: FY 2009 2010 2011 2012 2013 2014 2015 2016 2017 2018 2019 2020PVR 90 90 104 104 104 104 104 156 156 156 172 172 Availability 124 124 136 136 136 136 144 180 180 180 198 198 Table 16 ‐ Fleet Availability based on Revenue Vehicle Demand and Supply
New England Professionals LLC Page 91 August 31, 2009

A Transit Methodologoy Using Six Simga for Heavy Rail Vehicle Maintenance Programs – CASE STUDY - MDT
Figure 28 ‐ FTA Six Sigma Case Study – Leadership Perspective Meeting Lazaro Palenzuela, Edward Thomas, Harpal S. Kapoor (MDT Director), and Kenneth Cook Ph.D., (not shown Wendy Tyson-Wood) May 8, 2009 3pm Meeting May 8th Subject: FTA Six Sigma Case Study – Leadership Perspective Name Title Lazaro R. Palenzuela MDT - Chief – Office of Quality Assurance Harpal Kapoor MDT – Director Edward Thomas New England Professionals Wendy Tyson - Wood New England Professionals Kenneth R. Cook, Ph.D. New England Professionals Table 17 ‐ Sign In Sheet Date: May 8, 2009 @ 3 pm
Day Five PM meeting was continuation of Rail Car Maintenance Operations but from the leadership perspective of MDT Director, Harpal S. Kapoor. Harpal has more than 28 years of professional experience of which 22 years have been in public transportation and 15 years with MDT. Kapoor is a member of the Society of Automotive Engineers (SAE) and the American Public Transportation Association (APTA), where he sits on committees dealing with developing brake, undercarriage and climate control standards and diesel hybrid-electric bus specifications. He holds a bachelor's degree in mechanical engineering from Kurukshetra University in India, as well as a degree in business administration. His expertise in heavy rail entails development of technical specifications for buses and direct maintenance operations. He first joined MDT in 1985 as a Rail Vehicle Electronic
New England Professionals LLC Page 92 August 31, 2009
A Transit Methodologoy Using Six Simga for Heavy Rail Vehicle Maintenance Programs – CASE STUDY - MDT
Technician and rose through the ranks to Assistant General Superintendent of Bus Maintenance. He left the department in 1999 to join Washington Metropolitan Area Transit Authority (WMATA). He returned to MDT in February 2006 and held the position of MDT’s Deputy of Operations after serving as Assistant Manager of Bus Engineering at WMATA for six years, where he was credited with enhancing the system's performance and reliability and saving millions of dollars through improvements in efficiency. Harpal was appointed Director of Miami-Dade Transit in June 2007 and he has a good to great mind-set for MDT, as reflected in his delineation of Miami-Dade Transit Core Values (Appendix B). Kapoor has been charged with the creation of a proactive environment in all elements of his administration, with the goal of achieving departmental budget savings by improving administrative and operations efficiencies while continuing to enhance customer service. His immediate objectives include optimizing resources through adjustments in bus routes, completing an overhaul of Metromover vehicles, improving on-time bus and rail reliability and aggressively implementing the People's Transportation Plan - the multibillion-dollar transportation improvement plan funded by the voter-approved half-penny sales surtax. Harpal’s achievement of the above-mentioned charge is guided by his leadership perspective. He believes that agencies transition from good to great by making Cultural Changes through setting standards that promote shared success. This requires mentoring and coaching to develop trustful relationships. In that context, he realigned MDT organizational so that the business drives the departments to successfully align organizational processes with departmental functions. As such, Harpal is the guiding force behind the current Process Improvement and Six Sigma Initiative. His role is not limited to executive management but it is not uncommon for him to visit various operations at unusual time and participate in the work as well as check record to determine if the work is getting done correctly and timely. Particularly, Kapoor is adamant that data should drive decisions, planning, budgets, and implementation actions for continuous process improvement, design and redesign, and management. One clear example is MDT Preventive Maintenance Award. Finally, the Director’s current objectives are:
• Increase Customer Satisfaction with Transit Service • Maximize reliability of transit system vehicles and infrastructure • Ensure transit system is safe and secure • Provide excellent riding environment for transit passengers • Meet Budget Targets MDT • Pursue financing and funding alternatives • Align departmental priorities and deliverables with funding and resources • Emphasize performance accountability among workforce and partners • Continue improvement of business systems and work processes • Enhance public perception of MDT through outreach and community
involvement efforts
New England Professionals LLC Page 93 August 31, 2009

A Transit Methodologoy Using Six Simga for Heavy Rail Vehicle Maintenance Programs – CASE STUDY - MDT
• Evaluate and measure employee performance consistently and effectively • Ensure qualified employees are available to fill mission-critical positions • Develop effective and capable workforce
Functional Area Support and Rail Car Maintenance DAY SIX - AM The Procurement meeting was attended by the individuals in the photo below. The following photo shows the representatives for Vehicle Engineering Meeting.
Figure 29 ‐ The Procurement meeting May 11, 2009 Freeman Wright, Kenneth Cook, Rene Henriquez, and Lazaro Palenzuela (Not Shown are Robert Dyck, Jerry Blackman, and Wendy Tyson-Wood) Subject: FTA Six Sigma Case Study – Parts Procurement and Field Engineering Name Title Lazaro R. Palenzuela MDT - Chief – Office of Quality Assurance Rene A. Henriquez MDT - QA/QC Engineer Freeman Wright MDT – Warehouse and Store Superintendent Robert Dyck Lead Engineer, IE&M Jerry Blackman MDT – MDT/Rail Vehicle Maintenance – General Superintendent Wendy Tyson - Wood New England Professionals Kenneth R. Cook, Ph.D. New England Professionals Table 18 ‐ Sign In Sheet Date: May 11, 2009 @ 10 am
New England Professionals LLC Page 94 August 31, 2009

A Transit Methodologoy Using Six Simga for Heavy Rail Vehicle Maintenance Programs – CASE STUDY - MDT
Day Six AM first meeting focused on Material Management. Material Management reports directly to the Operations Deputy Director and has a staff of 90 individuals. The total inventory value is slightly over $35 million and the primary objectives are: (1) meet parts budget targets; (2) ensure timely payment to vendors and contractors; (3) minimize materials procurement requisition backlog; (4) maximize parts availability at MDT stockroom locations; (5) ensure that vendor contracts are administered effectively to support operations; and (6) ensure qualified employees are available for Materials Management mission-critical positions. The primary process maps for Materials Management are: (1) Contract Monitoring and Reconciliation; and (2) Procurement and Contract Administration. Review of Procurement and Contract Process Map revealed that seven stakeholders are necessary for this process to execute 39 steps. The stakeholders are in sequential order: End User, Warehousing and Stores, Budget, Inventory and Purchasing, MDT Contracts, Department of Procurement Management, and Legislative Committees. Key performance measure is contracts past due. Records required to construct this process map were: Work Order, Part Availability, Manual Stock-out Ticket, Store to Store Requisition, Receive Part, Price Quote, Purchase Requisition, and Requisition and Contract Follow-up. Review of Contract Monitoring and Reconciliation Process Map revealed that five stakeholders are necessary for this process to execute 24 steps. The stakeholders are in sequential order: Materials Management (Contract/Procurement), Budget, End User, Vendor, and Accounts Payable. Records required to construct this process map were: Requisition in EAMS, Service/Goods Documentation, and Service/Good Invoice. Issues with this process are: (1) Challenge of reconciling service provided versus service documentation; (2) Review of service documentation prior to signing or approving it; (3) No Tracking of contract expense; (4) Reconciling is not defined nor performed; (5) Reject requisition and inform the End User when fund are not available; and (6) End User does not ensure funds availability. Day Six AM second meeting focused on Field Engineering as a division of Infrastructure Engineering and Maintenance. The Infrastructure Engineering & Maintenance (IEM) Division is comprised of the Facilities Maintenance Division, Field Engineering & Systems Maintenance Division and the Structural Inspection & Analysis Division. IEM is responsible for the maintenance, repair and Infrastructure Renewal Program of the facilities and electronic equipment to support the operating divisions of the Miami-Dade Transit Department. This includes the physical plants at the three bus maintenance garages, the supporting administration buildings, the busway, Metrorail and Metromover Stations, the Metrorail Maintenance Facility and the Metromover Maintenance Facility, the management of contracted services for the repair and maintenance of Elevators/Escalators, janitorial, waste collection, landscape and extermination, and the cleaning of all of the Transit Facilities. In addition, IEM handles the installation and maintenance of over 8700 bus stop signs located throughout the county. IEM is responsible for the maintenance, repair and upgrades of the electronic support equipment used throughout the Transit system, which includes the installation
New England Professionals LLC Page 95 August 31, 2009

A Transit Methodologoy Using Six Simga for Heavy Rail Vehicle Maintenance Programs – CASE STUDY - MDT
and maintenance of the farebox equipment and revenue island equipment at three of the operations garages; Station Fare Collection systems for Metrorail and Metromover, the destination signs, the radio-communications equipment, all mobile and fixed video equipment and the Rail infrastructure equipment. Engineering support is provided to all other divisions through the Field Engineering Section, and the inspection and compliance for the Bridge and Structural Analysis program for the Metrorail and Metromover Superstructures are facilitated through Structural Analysis & Inspection Division to determine structural soundness and safety thereof for the passage of traffic.
Figure 30 ‐ Field Engineering (QC, QA and Design) Robert Dyck, Jerry Blackman – May 11, 2009 AM Field Engineering is the primary link to Rail Car Maintenance. DAY SIX - PM The Capital Programming, Budgeting, and Accounting meeting were attended by the individuals in the photo below.
Figure 31 ‐ Capital Programming, Budgeting, and Accounting meeting
Rene Henriquez, Vontressia Young, Joelle Janvier, Lazaro Palenzuela, and Kenneth Cook (not shown Wendy Tyson-Wood) - May 11, 2009
New England Professionals LLC Page 96 August 31, 2009

A Transit Methodologoy Using Six Simga for Heavy Rail Vehicle Maintenance Programs – CASE STUDY - MDT
Subject: FTA Six Sigma Case Study – Capital Programming Budgeting and Accounting Name Title Lazaro R. Palenzuela MDT - Chief – Office of Quality Assurance Rene A. Henriquez MDT - QA/QC Engineer Wendy Tyson - Wood New England Professionals Kenneth R. Cook, Ph.D. New England Professionals Vontressia Young MDT – Administrative Officer 3
Joelle Janvier MDT - Controller Table 19 ‐ Sign In Sheet Date: May 11, 2009 @ 3 pm
Day Six PM first meeting focused on Financial Services. At this meeting, Budget was represented by Vontressia Young and Finance was represented by Joelle Janvier. Both Finance and Budget are important to rail car maintenance. Finance is critical for rail maintenance to meet it targets for expenses, revenues, and filling full-time positions. Also, Finance is paramount in improving accounts payable backlog such that invoices are paid 85% of the time within 30 days. The Office of Quality Assurance worked with Finance to successfully implement a Six Sigma Project for Accounts Payable Disbursement Process that yielded an average payment of invoices 93% of the time within 30 days. Furthermore, the same project discovered that for every 4 to 6 invoice material needing inspection 2 to 2.5 personnel are needed; therefore, more personnel are being trained to conduct material inspections. The discovery is directly linked to Finance objective to improve technical and professional skill levels among MDT Finance and Budget employees. In consonance, the process will be converted from manual to electronic. Budget is important to rail because its focus is resource allocation. Particularly, the Grants Division is responsible for two FTA funding sources that directly impact rail maintenance. That is, FTA Section 5307 Formula funds provide around $45 million annually to cover capital projects. Most of MDT’s formula funding goes for capitalization of preventive maintenance, with 1% requirement for Security and 1% for Transit Enhancements also mandated. Other funds may be used for administrative expenses, contingencies, purchase of tools and equipment, planning support, and miscellaneous capital projects as needed, depending on the amount available after preventive maintenance. Conjunctively, FTA Section 5309 Fixed Guideway Modernization funds provide around $15 million annually for rail-related projects. As with 5307, most of this funding each year goes for capitalization of preventive maintenance, which is identified as “all scheduled periodic rail car preventive maintenance inspections and corrective maintenance.” Furthermore, rail maintenance campaigns must be first approved by Budget. DAY SEVEN – 1 PM The Operation Support meeting was attended by the individuals in the photo below. MDT Operation Support to Rail
New England Professionals LLC Page 97 August 31, 2009

A Transit Methodologoy Using Six Simga for Heavy Rail Vehicle Maintenance Programs – CASE STUDY - MDT
Figure 32 – MDT Operation Support Meeting May 12, 2009
Rene Henriquez, Lazaro Palenzuela, Gregory Robinson, and Kenneth Cook (not shown Wendy Tyson-Wood)
Subject: FTA Six Sigma Case Study – MDT Operation Support to Rail Name Title Lazaro R. Palenzuela MDT - Chief – Office of Quality Assurance Rene A. Henriquez MDT - QA/QC Engineer Wendy Tyson - Wood New England Professionals Kenneth R. Cook, Ph.D. New England Professionals Gregory Robinson MDT – General Superintendent Rail Transportation Table 20‐ Sign In Sheet Date: May 12, 2009 @ 1 pm
Day Seven first PM meeting was with MDT Operation Support, represented by Gregory Robinson. Operation has a direct link to rail vehicle maintenance based on rail car availability. In other words, Operations is responsible for making sure there are enough vehicles to meet daily service demand, especially AM and PM Peak Vehicle Requirement. During the AM Peak Period (6:30 am to 9:30 am) and PM Peak Period (3:30 pm to 6:30 pm), a total of 84 vehicles or 14 six-car trains are required; however, if the load factor increases more vehicles will be needed to meet service demand. The load factor typically changes as the number of passengers in the car increases or decreases as related to seat capacity, 74 seated passengers per car; but a rail car can accommodate 150 to 200 passengers though the typical passenger number range from 24 to 123. In addition to car availability, Operations must be responsible making decisions about removing trains and vehicles out of service along with addressing customer complaints. Specifically, Operations must: implement customer service standards, customer service training and passenger sensitivity awareness, monitor customer complaints, and provide timely response to complaint. DAY SEVEN – 2 PM The Safety Support meeting was attended by the individuals in the photo below. MDT Safety Support to Rail Maintenance
New England Professionals LLC Page 98 August 31, 2009

A Transit Methodologoy Using Six Simga for Heavy Rail Vehicle Maintenance Programs – CASE STUDY - MDT
Figure 33 ‐ Safety Support Meeting May 12, 2009
Rene Henriquez, Lazaro Palenzuela, Barry Smerling, and Kenneth Cook (not shown Wendy Tyson-Wood) Subject: FTA Six Sigma Case Study – MDT Safety Support to Rail Maintenance Name Title Lazaro R. Palenzuela MDT - Chief – Office of Quality Assurance Barry Smerling MDT –Transit Safety Officer Rene A. Henriquez MDT - QA/QC Engineer Wendy Tyson - Wood New England Professionals Kenneth R. Cook, Ph.D. New England Professionals Table 21 ‐ Sign In Sheet Date: May 12, 2009 @ 2 pm
Day Seven second PM meeting was with MDT Safety Support, represented by Barry Smerling. Safety does not have a direct impact on rail vehicle maintenance because rail maintenance has its own rules and procedures for safety-related conditions and equipment-related malfunctions. Nevertheless, Safety and Security do perform tasks that can impact rail maintenance such as employee safety in the workplace and in revenue service. Twice a year formal and informal facility inspections are conducted. Employee training requirements are reviewed as well as the conduct of Job Safety Analysis and Job Hazard Analysis. In addition, a Supervisory Report of Injury is maintained and maintenance issues are reviewed through the Union Management Safety Committee. Safety and Security objectives include:
Ensure optimum performance of Security Services Contract Implement training to support Homeland Security issues Improve the customer service aspect of the MDT security program Conduct and follow-up Safety Internal Audits and Contractor Inspections
New England Professionals LLC Page 99 August 31, 2009

A Transit Methodologoy Using Six Simga for Heavy Rail Vehicle Maintenance Programs – CASE STUDY - MDT
Policy and actions to ensure Employee Safety in Workplace and Revenue Service Ensure transit system is safe and secure Reduce counterfeited passes Reduce petty and serious crimes, vandalism and assaults
DAY SEVEN – 3 PM The Customer Service Support meeting was attended by the individuals in the photo below. MDT Customer Service Support to Rail
Figure 34 ‐ Customer Service Support Meeting May 12, 2009
Wendy Tyson-Wood, Jackie Bailey, Lazaro Palenzuela, and Kenneth Cook (not shown Rene Henriquez) May 12, 2009 Subject: FTA Six Sigma Case Study – MDT Customer Service Support to Rail Maintenance Name Title Lazaro R. Palenzuela MDT - Chief – Office of Quality Assurance Jackie Bailey MDT – Special Project Administrator – External Affairs Rene A. Henriquez MDT - QA/QC Engineer Wendy Tyson - Wood New England Professionals Kenneth R. Cook, Ph.D. New England Professionals Table 22 ‐ Sign In Sheet Date: May 12, 2009 @ 3 pm
New England Professionals LLC Page 100 August 31, 2009

A Transit Methodologoy Using Six Simga for Heavy Rail Vehicle Maintenance Programs – CASE STUDY - MDT
Day Seven third PM meeting was with MDT Customer Service, represented by Jackie Bailey. Customer Service has a direct impact on rail vehicle maintenance because vital customer information can be shared to assist in improving rail vehicle performance. All of MDT Customer Service functional requirements have been moved to the Miami-Dade County Government. This means that Customer Service role is primary reporting information through monthly and Bi-weekly reports, using a database called InfoCom. InfoCom is a computerized Trapeze application used to document and track transit customer comments as well as complaints received via a variety of contact modes: 311 Call Center, transit website, comment cards, mailed/faxed correspondence, and other phone calls along with emails at MDT. The 311 Call Center provides the primary intake function for transit customer issues and concerns. A Feedback Number is issued when a complaint, commendation, or service request is entered into InfoCom. Data inputted into InfoCom is used to assess MDT’s performance in several key areas. The Bi-Weekly Project Status Report for the reporting period of April 25 to May 8, 2009 revealed that the total complaints were equaled 361, four over the targeted 356. The primary complaints were:
Type of Complaint Number Target Difference Other Service Delivery e.g., failure to stop for pick-up
92 81 Upward Trend
On-Time Performance 82 102 Downward Trend Operator Behavior 66 55 Upward Trend Driving Safety 42 43 Downward Trend
Table 23 ‐ Bi‐Weekly Project Status Customer Complaint Report
The Monthly Customer Feedback Report includes 27 tables that describes the documentation of compliants, commendations, and service request by contact mode such as: Top Passenger Feedback, On-time Performance Complaints, Metrorail Operation Complaints, and Metrorail Maintenanace Compliants. The Key Peformance Indicators, either type of incident (commendation, complaint, and service request), are:
• Completion of Incidents - 70% of incidents closed within 30 days - 80% of incidents closed within 60 days - 90% of incidents closed within 90 days - 100% of incidents closed within 120 days
• Manage through InfoCom 100% of the Incidents reported • Report monthly on analsis of Incidents (categorically) data to identify the root
cause of compliants and apply effective corrective action. DAY EIGHT – 2 PM The Strategic Planning and Information Technology meeting was attended by the individuals in the photo below.
New England Professionals LLC Page 101 August 31, 2009

A Transit Methodologoy Using Six Simga for Heavy Rail Vehicle Maintenance Programs – CASE STUDY - MDT
MDT - Strategic Planning & Information Technology Support to Rail
Figure 35 ‐ Strategic Planning and Information Technology Meeting May 13, 2009
Wendy Tyson-Wood, Sandy Amores, Lazaro Palenzuela Kenneth Cook, Rawle Griffith, and Aaron Melean Subject: FTA Six Sigma Case Study – Strategic Planning & Information Name Title Lazaro R. Palenzuela MDT - Chief – Office of Quality Assurance Rawle Griffin MDT – System Analyst Programmer 2 Rene A. Henriquez MDT - QA/QC Engineer Wendy Tyson - Wood New England Professionals Kenneth R. Cook, Ph.D. New England Professionals Aaron Melean MDT – Sr. System Analyst Programmer Sandy Amores MDT – Chief Knowledge Management Table 24 ‐ Sign In Sheet Date: May 13, 2009 @ 2 pm
Day Eight PM meeting the relationship between Strategic Planning and Information Technology in support of Rail Vehicle Maintenance. The Knowledge Management Division of Strategic Planning is the Maintenance Control source for the various maintenance divisions in MDT, using EAMS. With EAMS in place, Knowledge Management can provide data and management analysis such as scheduling preventive maintenance, monitor adherence to preventive maintenance, analysis repair failures, provide on-demand reports, and schedule maintenance. Knowledge Management objectives for Maintenance Control are:
Improve Maintenance Control Business process through the use of Technology Ensure Maintenance Control Employees meet Technical & Analytical skill levels
New England Professionals LLC Page 102 August 31, 2009

A Transit Methodologoy Using Six Simga for Heavy Rail Vehicle Maintenance Programs – CASE STUDY - MDT
Provide data and management analysis to the various maintenance divisions
within MDT Meet Budget Targets for Maintenance Control Division Ensure qualified employees are available to fill mission-critical Maintenance
Control positions In conjunction with Knowledge Management, Information Technology (IT) serves as the system builders for EAMS. EAMS started in 2005 and three years of parts information has been inputted; Metrobus information has been entered into EAMS and Metrorail information will be entered last. Furthermore, Information Technology will be developing dashboard to better make use of key performance indicators. Information Technology objectives are:
Enhance Safety and Security through Technology Enhanced Customer Information through Technology for increased satisfaction Maximize internal customer satisfaction with IT Improve MDT Services and Operating Efficiency through the Use of Technology Upgraded, Standardized and maintained Transit’s Information Technology
Environment Utilize technology to improve business processes Improved Management of IT Resources, Processes and communication Improve Skills and Effectiveness of Staff through Technology and Training
Programs
Process Mapping DAY NINE – 3 PM The Process Mapping meeting was attended by the individuals in the photo below.
Figure 36 ‐ Process Mapping Meeting May 14, 2009
New England Professionals LLC Page 103 August 31, 2009

A Transit Methodologoy Using Six Simga for Heavy Rail Vehicle Maintenance Programs – CASE STUDY - MDT
Rene Henriquez, Gregory Robinson, Robert Dyck, Lazaro Palenzuela, Kenneth Cook, Jerry Blackman, and Dwight Baldwin (not shown Wendy Tyson-Wood) Subject: FTA Six Sigma Case Study – Process Mapping Name Title Lazaro R. Palenzuela MDT - Chief – Office of Quality Assurance Rene A. Henriquez MDT - QA/QC Engineer Wendy Tyson - Wood New England Professionals Kenneth R. Cook, Ph.D. New England Professionals Gregory Robinson MDT – General Superintendent Rail Transportation
Jerry Blackman MDT – General Superintendent Rail Vehicle Maintenance Dwight Baldwin MDT – Lead Transit Maintenance Production Coordinator Robert Dyck MDT – Lead Engineer IE&M Table 25 ‐ Sign In Sheet Date: May 14, 2009 @ 3 pm
Day Nine PM meeting focus was to have a brainstorming session to discuss the connection between rail vehicle maintenance processes, rail car systems, supporting functional areas processes, and six sigma methodology to construct a rail maintenance cost formula. It was suggested that the construct of a rail maintenance cost formula should, at least, involve: a maintenance approach, identification of cost performance measures, identification of a standard perspective about rail vehicle maintenance, baseline phases of rail vehicle maintenance, and measurement of supporting functional areas influence on rail maintenance. At the brainstorming session conclusion, the New England Professionals suggest that an approach, using the aforementioned factors, would be constructed and distributed for discussion at the next day meeting. Furthermore, Robert Dyck provided some background documentation to assist in develop an approach for a working rail maintenance cost formula; the background documentation covered rail overhaul plans and reliability-centered maintenance. DAY TEN – 2 PM The Process Mapping meeting was attended by the individuals in the photo below. Process Mapping
Figure 37 ‐ Process Mapping Meeting May 15, 2009
Rene Henriquez, Robert Dyck, Lazaro Palenzuela, Kenneth Cook, Wendy Tyson-Wood, and Zoila Badulesca
New England Professionals LLC Page 104 August 31, 2009

A Transit Methodologoy Using Six Simga for Heavy Rail Vehicle Maintenance Programs – CASE STUDY - MDT
Subject: FTA Six Sigma Case Study – Process Mapping Name Title Lazaro R. Palenzuela MDT - Chief – Office of Quality Assurance Rene A. Henriquez MDT - QA/QC Engineer Wendy Tyson - Wood New England Professionals Kenneth R. Cook, Ph.D. New England Professionals Gregory Robinson MDT – General Superintendent Rail Transportation
Jerry Blackman MDT – MDT/RM Dwight Baldwin MDT – Lead Transit Maintenance Production Coordinator Robert Dyck MDT – Lead IE&M Zoila Badulesca MDT - CQA, CQE - Quality Manager, Rail Services Table 26 ‐ Sign In Sheet Date: May 15, 2009 @ 2 pm
Day Ten PM meeting focus was to present and discuss a working rail maintenance cost formula based on suggestions from Day Nine PM meeting. In order to have a holistic discussion, New England Professionals prepared a MDT Case Study Logic which was divided into two parts: Six Sigma Research Project Synopsis and a suggested Logic Model for Rail Car Maintenance Cost Formula. Six Sigma Research Project Synopsis began with a summary description of FTA’s Strategic Research Mandate with emphasis on the strategic goal relevant to this research project and the underlying research concern for that strategic goal. Then, reasoning behind the underlying research concern was explained with subsequent delineation of FTA research intent for this project. Next, the research context for this project was summarized to describe how rail car maintenance should be the primary focal point. Lastly, NEP proposed solution for FTA’s research intent was specified along with its primary benefits and suggested questions to begin researching the solution, using this Case Study. The Logic Model basis for a Rail Car Maintenance Cost Formula began with describing and explaining the core research tool and supporting research tools for formulating, developing and implementing the suggested cost formula. Rail Maintenance key performance measures were then specified in terms of cost and ridership along with a list of cost performance measures, having some consideration for performing overhauls versus modernization to address obsolete technology. Conjunctively, three typical sources were listed for establishing function and performance standard perspectives, relative to rail car maintenance. In the main, cost of maintenance should be guided by return on capital employed and return on investment. As such, using the abovementioned basis, a Rail Car Maintenance Cost Formula was designed. First, cost of maintenance should be considered in terms of rate and amount and viewed from the rail car by systems and subsystems according to maintenance phase and corresponding steps, with concern for the transition of maintenance from a fleet approach to car approach relative to time, miles, and condition. Second, three maintenance phases were identified and assigned its related cost as either capital or operating. Third, ten car systems were listed and eight supporting functional
New England Professionals LLC Page 105 August 31, 2009

A Transit Methodologoy Using Six Simga for Heavy Rail Vehicle Maintenance Programs – CASE STUDY - MDT
areas were listed with a designated impact on rail car maintenance as high, medium, or low. Fifth, the cost of rail car maintenance was determine to be a function of the three maintenance phases plus the cost of supporting functional support areas. Lastly, a matrix was developed that showed five cost performance measures in relationship to the rail car major systems and the three cost drivers of the rail car maintenance cost formula. DAY ELEVEN Quality Assurance Recap Exit
Figure 38 ‐ Quality Assurance Recap Exit May 16, 2009
Harpal Kapoor (Director), Lazaro Palenzuela, and Kenneth Cook Subject: FTA Six Sigma Case Study – MDT Case Study Exit and Next Steps Name Title Lazaro R. Palenzuela MDT - Chief – Office of Quality Assurance Wendy Tyson - Wood New England Professionals Kenneth R. Cook, Ph.D. New England Professionals Table 27 ‐Sign In Sheet Date: May 16, 2009 @ 10 am
Day Eleven meeting was a recap of submitted documents and additional documents to be submitted along with a brief exit meeting with MDT Director.
New England Professionals LLC Page 106 August 31, 2009

A Transit Methodologoy Using Six Simga for Heavy Rail Vehicle Maintenance Programs – CASE STUDY - MDT
Case Study Analysis Miami-Dade Transit’s Case Study was analyzed from the perspective of: (1) cost drivers for rail car maintenance; (2) cost performance measures for rail car maintenance; and (3) supporting functional areas/offices for rail car maintenance. These are the primary factors for the construct of a suggested Rail Car Maintenance Cost Formula.
Rail Car Maintenance
The Cost of Rail Car Maintenance should be viewed in terms of rate and amount relative to: (1) cost performance measures; (2) rail car systems; (3) types of maintenance performed on rail car fleet – Phases/Cost Drivers; and (4) impact of supporting functional areas. Agreed upon cost performance measures included:
• Material Cost per rail car; • Contracting Cost per rail car; • Labor Cost per rail car; • Overtime Cost per rail car; and • Aging Cost per rail car.
The identified systems for MDT Rail Cars included: Air System, Automatic Train Operation, Couplers and Draft Gears, Doors, Electric and Lighting, Propulsion System, HVAC, Trucks, Car Body, and Brakes. The types of maintenance performed on the rail car fleet at MDT are Operating and Car Renovation:
Operating Maintenance: Scheduled (preventive) maintenance involves
replacement of specific components and/or systems to improve the reliability of the rail car; Unscheduled (corrective) maintenance entails vehicle services needed as result of in service failures.
Car Renovation: This involves complete overhaul of the vehicle and replacement of obsolete components to extend the life of the vehicle. This is performed when vehicles reach one million miles or after 15 years of service.
These two types of maintenance, with concurrence of senior MDT Rail Maintenance staff, were converted to three rail maintenance phases with each phase designated as cost driver: Overhaul (capital cost), Repair and Replacement (capital cost), and Preventive Maintenance (operating cost). A fourth cost variable to be included in formulating Rail Car Maintenance Cost Formula is the impact of supporting functional areas interviewed during this Case Study. They were: Quality Assurance, Strategic Planning and Performance Management, Knowledge Management (Section of Strategic Planning), Procurement (Materials Management), Budget and Finance (Financial Services), Vehicle Engineering (Infrastructure Engineering and Maintenance), Safety and Security,
New England Professionals LLC Page 107 August 31, 2009

A Transit Methodologoy Using Six Simga for Heavy Rail Vehicle Maintenance Programs – CASE STUDY - MDT
Operations (Rail Transportation), Customer Service (External Affairs), and Information Technology (Support Services).
The abovementioned cost drivers were used to construct the following Rail Car Maintenance Cost Formula in concurrence with senior MDT Rail Maintenance staff:
With the above formula, two matrices were constructed: (1) Cost impact of each rail car major system on the phases of rail car maintenance by cost performance measures; and (2) Cost impact of supporting functional area/office on the phases of rail car maintenance.
In reviewing the table below, several observations were made about the impact of rail car maintenance; high impact suggests significant cash outlay or equivalent; medium impact suggests reasonable cash outlay or equivalent; low impact suggests marginal cash outlay or equivalent.
First, ten (62.5%) of the 16 Support Areas have a high cost impact on the Overhaul variable for cost of rail car maintenance; the remaining 6 Support Areas either have a low or media cost impact, excepting Test Equipment. Second, only Safety and Budget/Accounting Support Areas have a low cost impact on the Repair and Replacement variable for cost of rail car maintenance; the remaining 14 areas have a high impact. Third, twelve (75%) of the Support Areas have a high cost impact on the Preventive Maintenance variable for cost of rail car maintenance; three of the remaining four Support Areas have a low cost impact.
From another perspective, nine (56.3%) Support Areas have high cost impact on all three cost variables; whereas, only one Support Area has a low cost impact on all three cost variables for cost of rail car maintenance. Also, it can be suggested the Safety Support Area has marginal impact on all three cost variables because it has low cost impact on both Repair and Replacement as well as Preventive Maintenance cost variables.
Supporting Functional Area/Office (E) Overhaul Repair and Replacement
Preventive Maintenance
1. Quality Assurance High High High 2. Material Management (Procurement/Parts) High High High
3. Capital Programming High High High
Rail Car Maintenance Cost Formula: (Top Level)
f(x) = [Ox1 + RRx2 + PMx3 ]+ E
Whereas, O = Overhaul, RR = Repair and Replacement PM = Preventive Maintenance, and E =Supporting Functional Areas
New England Professionals LLC Page 108 August 31, 2009

A Transit Methodologoy Using Six Simga for Heavy Rail Vehicle Maintenance Programs – CASE STUDY - MDT
Supporting Functional Area/Office (E) Overhaul Repair and Replacement
Preventive Maintenance
4. Budget and Accounting Low Low Low 5. Vehicle Engineering High High High 6. Safety Med Low Low 7. Operations – Control Center High High High 8.Customer Service High High High9.Maintenance Control (MDT Knowledge Management) High High High
10.Training High High High11.Test Equipment Med/Low High High12. Fix Facilities Equipment Medium High High13.Communication (MDT i.e., radio) Low High High14.Information Technology High High High15.Wayside Maintenance Low High Low 16.Collective Bargaining High High Med/Low Table 28 ‐ Supporting Functional Area/Office (E)
In reviewing the table below that deal with Cost impact of each ail car major system on the phases of rail car maintenance by cost performance measures, several observations were made about the impact of rail car maintenance; high impact suggest significant cash outlay or equivalent; medium impact suggest reasonable cash outlay or equivalent; low impact suggest marginal cash outlay or equivalent. In-House Labor Six of the ten rail car major systems have a high cost impact on the Overhaul cost driver for cost of rail car maintenance; conversely, three of the ten rail car major systems have a low cost impact on the Overhaul cost driver for costs of rail car maintenance and one rail car system has a medium cost impact. Six of the ten rail car major systems have a high cost impact on the Repair and Replacement cost driver for cost of rail car maintenance; conversely, three of the ten rail car major systems have a low cost impact on the Repair and Replacement cost driver for costs of rail car maintenance and one rail car system has a medium cost impact. Two of the ten rail car major systems have a high cost impact on the Preventive Maintenance cost driver for cost of rail car maintenance; on the other hand, four of the ten rail car systems have a medium cost impact on the Preventive Maintenance cost driver for costs of rail car maintenance; equally, four rail car system have a low cost impact on the Preventive Maintenance cost driver.
New England Professionals LLC Page 109 August 31, 2009

A Transit Methodologoy Using Six Simga for Heavy Rail Vehicle Maintenance Programs – CASE STUDY - MDT
O = Overhaul RR = Repair and Replacement PM = Preventive Maintenance
Ox1 RRx2 PMx3
ATO LOW LOW LOWCouplers and Draft Gears HIGH HIGH LOWDoors HIGH HIGH MEDElectronics MED MED MEDLighting LOW LOW LOWPropulsion System HIGH HIGH HIGHHVAC HIGH HIGH HIGHTrucks HIGH HIGH MEDCar Body LOW LOW LOWFriction Brake / Air System HIGH HIGH MED
Cost Drivers by Major System
In House Labor
Table 29 ‐ Preventive Maintenance Cost Driver by Major System: In House Labor From another view, three of ten rail car major systems have a low cost impact on all three cost drivers; while, only two of the ten rail car major systems have a high cost impact on all three cost drivers and one rail car major system have a medium cost impact on all three cost drivers. Three rail car major systems have a high cost impact on two of the three cost drivers with the third cost driver having a medium cost impact designation. One rail car system has a high cost impact on two of the three cost drivers with the third cost driver having a low cost impact designation. In sum, all ten rail car major systems impact both Overhaul and Repair and Replacement cost drivers identically. Whereas, the Preventive Maintenance cost variable has a mixture of cost impacts that suggests two rail car systems required close monitoring: Propulsion System and HVAC System. Comparing rail car major system across the three cost drivers, close attention should be paid to the both Propulsion and HVAC Systems with concern for: Door, Trucks, and Friction Brake/Air Systems. Then, some time should be dedicated to Couplers and Drafts Gears. Materials Seven of the ten rail car systems have a high cost impact on the Overhaul cost driver for cost of rail car maintenance; conversely, two of the ten rail car major systems have a low cost impact on the Overhaul cost driver for cost of rail car maintenance and one rail car system has a medium cost impact. Seven of the ten rail car major systems have a high cost impact on the Repair and Replacement cost driver for cost of rail car maintenance; conversely, two of the ten rail car major systems have a low cost impact on the Repair and Replacement cost driver for costs of rail car maintenance and one rail car major system has a medium cost impact. Two of the ten rail car systems have a high cost impact on the Preventive Maintenance cost driver for cost of rail car maintenance; on the other hand, three of the ten rail car major systems have a medium cost impact on the Preventive Maintenance cost driver for cost of rail car maintenance; but, five rail car systems have a low cost impact on the Preventive Maintenance cost driver.
New England Professionals LLC Page 110 August 31, 2009

A Transit Methodologoy Using Six Simga for Heavy Rail Vehicle Maintenance Programs – CASE STUDY - MDT
O = Overhaul RR = Repair and Replacement PM = Preventive Maintenance
Ox1 RRx2 PMx3
ATO LOW LOW LOWCouplers and Draft Gears MED MED MEDDoors HIGH HIGH LOWElectronics HIGH HIGH HIGHLighting LOW LOW LOWPropulsion System HIGH HIGH MEDHVAC HIGH HIGH HIGHTrucks HIGH HIGH LOWCar Body HIGH HIGH LOWFriction Brake / Air System HIGH HIGH MED
Cost Drivers by Major System
Materials
Table 30 ‐ Preventive Maintenance Cost Driver by Major System: Materials An alternative perspective shows that two of ten rail car major systems have a low cost impact on all three cost drivers; equally, two of the ten rail car systems have a high cost impact on all three cost drivers and one rail car major system has a medium cost impact on all three cost drivers. Three rail car systems have a high cost impact on two of the three cost drivers with the third cost driver having a low cost impact designation. Two rail car major systems have a high cost impact on two of the three cost drivers with the third cost driver having a medium cost impact designation. In sum, all ten rail car systems impact both Overhaul and Repair and Replacement cost drivers identically. Whereas, the Preventive Maintenance cost driver has a mixture of cost impacts that suggests two rail car major systems required close monitoring: Electronic and HVAC Systems. Comparing rail car system across the three cost drivers, close attention should be paid to the both Electronic and HVAC Systems with concern for: Doors, Trucks, and Car Body. Then, some time should be dedicated to Couplers and Drafts Gears. Overtime Three of the ten rail car major systems have a high cost impact on the Overhaul cost driver for cost of rail car maintenance; conversely, three of the ten rail car systems have a low cost impact on the Overhaul cost driver for cost of rail car maintenance and three rail car major systems have a medium cost impact. Three of the ten rail car major systems have a high cost impact on the Repair and Replacement cost driver for cost of rail car maintenance; equally, three of the ten rail car systems have a low cost impact on the Repair and Replacement cost driver for costs of rail car maintenance and three rail car major systems have a medium cost impact. None of the ten rail car major systems have a high cost impact on the Preventive Maintenance cost driver for cost of rail car maintenance; on the other hand, three of the ten rail car major systems have a medium cost impact on the Preventive Maintenance cost driver for cost of rail car maintenance; but, seven rail car major systems have a low cost impact on the Preventive Maintenance cost driver.
New England Professionals LLC Page 111 August 31, 2009

A Transit Methodologoy Using Six Simga for Heavy Rail Vehicle Maintenance Programs – CASE STUDY - MDT
O = Overhaul RR = Repair and Replacement PM = Preventive Maintenance
Ox1 RRx2 PMx3
ATO LOW LOW LOWCouplers and Draft Gears MED MED MEDDoors LOW MED LOWElectronics MED MED MEDLighting LOW LOW LOWPropulsion System HIGH HIGH LOWHVAC HIGH HIGH LOWTrucks HIGH HIGH MEDCar Body LOW LOW LOWFriction Brake / Air System MED HIGH LOW
Cost Drivers by Major System
Overtime
Table 31 ‐ Preventive Maintenance Cost Driver by Major System: Overtime Another viewpoint shows that three of ten rail car major systems have a low cost impact on all three cost drivers; but, none of the ten rail car major systems have a high cost impact on all three cost drivers and two rail car systems have a medium cost impact on all three cost drivers. Two rail car major systems have a high cost impact on two of the three cost drivers with the third cost driver having a low cost impact designation. Two rail car major systems have a high cost impact on two of the three cost drivers with the third cost driver having a medium cost impact designation. One rail car major system has a low cost impact on two of three cost drivers with the third cost driver having a medium cost impact assignment. One rail car major system has a different cost impact for each of the three cost drivers. Collectively, eight of the ten rail car major systems impact both Overhaul and Repair and Replacement cost drivers identically with the ATO and Friction Brakes/Air Systems differing. While, the Preventive Maintenance cost driver has no rail car major systems designated with high cost impact; seven rail car systems have low cost impact assignments and three rail car major systems have medium cost impact. Comparing rail car system across the three cost drivers, close attention should be paid to: Trucks, HVAC System, and Propulsion System. Then, some time should be dedicated to Friction Brake /Air System. Aging Cost Three of the ten rail car major systems have a high cost impact on the Overhaul cost driver for cost of rail car maintenance; but, two of the ten rail car systems have a low cost impact on the Overhaul cost driver for cost of rail car maintenance and five rail car major systems have a medium cost impact. Three of the ten rail car major systems have a high cost impact on the Repair and Replacement cost driver for cost of rail car maintenance; however, two of the ten rail car major systems have a low cost impact on the Repair and Replacement cost driver for costs of rail car maintenance and five rail car major systems have a medium cost impact. One of the ten rail car major systems has a high cost impact on the Preventive Maintenance cost driver for cost of rail car maintenance; on the other hand, seven of the ten rail car major systems have a medium cost impact on the
New England Professionals LLC Page 112 August 31, 2009

A Transit Methodologoy Using Six Simga for Heavy Rail Vehicle Maintenance Programs – CASE STUDY - MDT
Preventive Maintenance cost driver for cost of rail car maintenance; but, two rail car major systems have a low cost impact on the Preventive Maintenance cost driver.
O = Overhaul RR = Repair and Replacement PM = Preventive Maintenance
Ox1 RRx2 PMx3
ATO MED MED MEDCouplers and Draft Gears MED MED MEDDoors MED MED MEDElectronics HIGH HIGH HIGHLighting MED MED MEDPropulsion System MED MED MEDHVAC HIGH HIGH MEDTrucks LOW LOW LOWCar Body LOW LOW LOWFriction Brake / Air System HIGH HIGH MED
Cost Drivers by Major System
Aging Cost
Table 32 ‐ Preventive Maintenance Cost Driver by Major System: Aging Cost From another viewpoint, all ten rail car major systems impact both Overhaul and Repair and Replacement cost drivers identically. While, the Preventive Maintenance cost driver has one rail car major system designated with high cost impact; seven rail car major systems have medium cost impact assignments and two rail car major system having low cost impact. Comparing rail car major system across the three cost drivers, close attention should be paid to: Electronic System, HVAC System and Friction Brake/Air System. Then, there should be close monitoring of: ATO System, Doors, Couplers and Draft Gears, Lighting, and Propulsion System. Contracting Seven of the ten rail car major systems have a high cost impact on the Overhaul cost driver for cost of rail car maintenance; the remaining three rail car major systems are not applicable for this cost performance measure. Likewise, seven of the ten rail car major systems have a high cost impact on the Repair and Replacement cost driver for cost of rail car maintenance; the remaining three rail car major systems are not applicable for this cost performance measure. Preventive Maintenance is not applicable for this cost performance measure. Together, the seven applicable rail car major systems impact both Overhaul and Repair and Replacement cost drivers identically.
New England Professionals LLC Page 113 August 31, 2009

A Transit Methodologoy Using Six Simga for Heavy Rail Vehicle Maintenance Programs – CASE STUDY - MDT
O = Overhaul RR = Repair and Replacement PM = Preventive Maintenance
Ox1 RRx2 PMx3
ATO N/A N/A N/ACouplers and Draft Gears HIGH HIGH N/ADoors N/A N/A N/AElectronics HIGH HIGH N/ALighting N/A N/A N/APropulsion System HIGH HIGH N/AHVAC HIGH HIGH N/ATrucks HIGH HIGH N/ACar Body HIGH HIGH N/AFriction Brake / Air System HIGH HIGH N/A
Cost Drivers by Major System
Contracting
Table 33 ‐ Preventive Maintenance Cost Driver by Major System: Contracting
Case Study Observations Case Study Observations were made within the purview of three case analysis factors for rail car maintenance: (1) cost drivers for rail car maintenance; (2) cost performance measures for rail car maintenance; and (3) supporting functional areas/offices for rail car maintenance. However, the observations are delineated from an interactive perspective of the case analysis factors, relative to the baseline research concern for improving rail transit operations’ effectiveness – particularly rail car maintenance. Furthermore, these observations are formulated to provide insight into the selection and prioritization of rail car maintenance possible six sigma projects with subsequent categorization as: process improvement, process design/re-design, and process management. Process improvement is the elimination of root causes of performance deficiencies in processes that already exist in an organization. Process Design/Re-Design occurs when simply improving existing processes is not enough; therefore, new processes will need to be designed or existing processes will need to be re-designed. Process Management requires a fundamental change in the way an organization is structured and managed; it is often the most challenging and time-consuming.
Rail Car Maintenance
Supporting Functional Areas/Offices have a high impact on the three cost drivers for rail car maintenance.
For the five cost performance measures, rail car major systems cost impact on Overhaul as well as Repair and Replacement cost drivers are the same.
For the five cost performance measures, rail car major systems cost impact varies across the Preventive Maintenance cost driver.
For the In-House Labor cost performance measure, six rail car major systems should be of high cost concerns for Overhaul as well as Repair and Replacement
New England Professionals LLC Page 114 August 31, 2009

A Transit Methodologoy Using Six Simga for Heavy Rail Vehicle Maintenance Programs – CASE STUDY - MDT
cost drivers: Couplers and Draft Gears, Doors, Friction Brake/Air System, Propulsion System, HVAC, and Trucks.
For the In-House Labor cost performance measure, two rail car major systems should be of high cost concerns for Preventive Maintenance cost drivers: Propulsion System and HVAC.
For the Materials cost performance measure, seven rail car major systems should be of high cost concerns for Overhaul as well as Repair and Replacement cost drivers: Electronics, Doors, Friction Brake/Air System, Propulsion System, HVAC, Trucks, and Car Body.
For the Materials cost performance measure, two rail car major systems should be of high cost concerns for Preventive Maintenance cost drivers: Electronics and HVAC.
For the Overtime cost performance measure, three rail car major systems should be of high cost concerns for Overhaul as well as Repair and Replacement cost drivers: Propulsion System, HVAC, and Trucks.
For the Overtime cost performance measure, two rail car major systems should be of high cost concerns for Preventive Maintenance cost drivers: Electronics and HVAC.
For the Aging cost performance measure, three rail car major systems should be of high cost concerns for Overhaul as well as Repair and Replacement cost drivers: Electronics, HVAC, and Friction Brake/Air System.
For the Aging cost performance measure, two rail car major systems should be of high cost concerns for Preventive Maintenance cost drivers: Electronics and HVAC.
For the Contracting cost performance measure, seven rail car major systems should be of high cost concerns for Overhaul as well as Repair and Replacement cost drivers: Couplers and Draft Gears, Electronics, Propulsion System, HVAC, Trucks, Car Body, and Friction Brake/Air System.
Expansion of the abovementioned observations by the five cost performance measures will require:
Specifying the various labor classifications contributing to the high cost impact rail car major systems relative to the three cost drivers.
Specifying the various materials cost and level of inventory contributing to the high cost impact rail car major systems relative to the three cost drivers.
Specifying the amount of overtime being assigned to the high cost impact rail car systems relative to the three cost drivers.
New England Professionals LLC Page 115 August 31, 2009

A Transit Methodologoy Using Six Simga for Heavy Rail Vehicle Maintenance Programs – CASE STUDY - MDT
Specifying the types of contract and amount for the high cost impact rail car
systems relative to the three cost drivers.
Specifying the cost incurred by rail car maintenance when supporting functional areas/offices do not provide the require assistance when needed.
TRANSIT SIX SIGMA METHODOLOGY “Transit Six Sigma (T6σ)” is a philosophy about how to link transit agencies intra-departmental processes with inter-departmental processes to execute organizational functions that enable a transit agency to provide effective and efficient customer-focus transit services in a cost-effective manner that maximize return on capital employed and return on investment of public dollars provide by FTA. This philosophy is rooted in FTA Research Intent for this project to develop a method, system, or technical solution to improve rail transit operations. Toward that end, New England Professionals proposed to design a Transit Methodology Using Six Sigma For Heavy Rail Vehicle Maintenance Programs, based on Miami-Dade Transit (MDT) Process Improvement and Six Sigma Initiative as the basis. Therefore, the construct for a Transit Methodology Using Six Sigma For Heavy Rail Vehicle Maintenance Programs was divided into three parts: (1) Six Sigma Initiation – Cultural Change; (2) Six Sigma Execution – Planning; and (3) Six Sigma Deployment – Project Implementation.
Six Sigma Initiation Initiation of a Transit Methodology Using Six Sigma For Heavy Rail Vehicle Maintenance Programs begins with the active involvement of management in the form of a Policy Directive from an agency’s leader. This Policy Directive is a signal that a cultural change is about to occur in the direction of Business Process Management which means an agency will be strategically aligned by processes that impact strategic business objectives; in short, committed leadership will make the link between its vertical functional structure and its horizontal process structure to keep the agency result-oriented and customer-focused, using key performance measures/indicators. This achievement, basically, requires establishing a clear relationship between an agency’s divisional business plans, process maps, and scorecards. MDT Initiation In MDT’s case, their Process Improvement and Six Sigma Initiative emanated from Miami-Dade County policy directive for a first ever Strategic Plan for result-oriented government which was carried out through an Active Strategy Enterprise (ASE) System. ASE is an online performance management system and MDT uses it as part of their annual Business Plan development. Operating from Miami-Dade County policy directive, MDT Director reorganized the agency’s organizational chart to reflect the link between MDT’s vertical functional structure and its horizontal process structure. This aided in
New England Professionals LLC Page 116 August 31, 2009

A Transit Methodologoy Using Six Simga for Heavy Rail Vehicle Maintenance Programs – CASE STUDY - MDT
creating a framework for establishing between a link divisional business plans, process maps, and scorecards. In spite of the County mandate, MDT success was guided by MDT Director’s commitment to process improvement. This evident by has past experience and expertise in direct maintenance as well as being credited with enhancing Washington Area Metropolitan Transit Authority’s system performance and reliability along with saving millions of dollars through improvements in efficiency.
Six Sigma Execution A Transit Methodology Using Six Sigma For Heavy Rail Vehicle Maintenance Programs actually begins with assigning a division of a transit agency the responsible for its planning, management, and deployment. The division should be Quality Assurance. Office of Quality Assurance first task is to create a Strategy that outlines what should be done to plan, manage, and deploy the methodology. The primary components should: (1) Policy and Procedure Manual; (2) Staffing Plan; (3) Audit Process; (4) Training Program Plan; (5) Process Management Structure; (6) Process Ownership Tracking System; (7) Performance Measurement Plan; (8) Six Sigma Toolbox Manual; (9) Culture Transformation Plan; (10) Project Selection Plan; and (11) Data Collection Plan. The Policy and Procedure Manual will specify the overall regulations that govern the application of Six Sigma (i.e., why and what questions concerning people, money, facilities and equipment, and activities as well as programs) and outline how regulations are done. The Staffing Plan will determine the minimum and maximum of yellow, green, black belt will be need. An Audit Process will be used ensure the integrity of Six Sigma application. A Training Program Plan will address initial and continuing development in applying Six Sigma. Process Management Structure deals with the development and continuing updating of key process maps along with monitoring process capability. Process Ownership Tracking System will allow Quality Assurance to have a contact person for continued updating of key process maps. Performance Measurement Plan fundamental purpose is to: define key performance measures, measure performance baseline, and establish performance measures governance structure. Six Sigma Toolbox Manual will serve as comprehensive self-help set of documents and templates for adapting and using the methodology under various conditions. Culture Transformation Plan is about devising ways to make Six Sigma an everyday event for employees such as linking it to rewards and reviews. Project Selection Plan is simply about choosing the first of projects. Data Collection Plan will focus on knowledge management as defined: systematic means of capturing, organizing, retrieving, sharing, and generating knowledge. MDT Execution In MDT’s case, several actions have been executed by Office of Quality Assurance. First, a Policy and Procedure Manual is being prepared. Second, Staffing Plan has been included in the Quality Assurance Business Plan; it has seven FTE positions of which three are vacant but there are two Six Sigma consultants. One has American Society of
New England Professionals LLC Page 117 August 31, 2009

A Transit Methodologoy Using Six Simga for Heavy Rail Vehicle Maintenance Programs – CASE STUDY - MDT
Quality (ASQ) Six Sigma Green Belt Certification Training and he is pursuing ASQ Six Sigma Black Belt Certification; the other consultant has ASQ Six Sigma Green Belt Certification Training and has completed 72-hour training course for Six Sigma Black Belt Certification. Third, an ISO (International Organization for Standardization) 9000 based Quality Management System (QMS) is currently in development for Executive Management along with a quality assurance Audit Process. Fourth, Quality Control Training has been instituted for QMS Fundamentals and Process Management Fundamentals. Also, fifty (50) individuals have completed data analysis training tables Pivot Tables. Additionally, Root Cause Analysis and Problem Solving (PDCA) training has been completed by 102 individuals, mostly management personnel. A total of 11 Process Maps have completed with each identifying the process owners and performance measures. A Six Sigma website has been added to MDT Transitnet, an in-house intranet system. One Six Sigma project has been successful completed for Accounts Payable Disbursement Process. Office of Quality Assurance works very closely with the Knowledge Management Section of Strategic Planning and Performance Management.
Six Sigma Deployment Six Sigma Deployment of a Transit Methodology Using Six Sigma For Heavy Rail Vehicle Maintenance Programs starts with Rail Maintenance explaining the Fleet Management Plan to Office of Quality Assurance. The Fleet Management Plan is a working document which necessitates annual review and updates for recent conditions and operating plans. The plan should present fleet requirements with details regarding and as prescribed by MBTA: Current Fleet Profile and Plan – Descriptions of Fleet, Fleet Management Strategies
and objectives, and Fleet Plans through a specific future year; Operational Policies – level of service requirements (peak and off-peak), load factors,
schedules, headways, failure-in-service criteria, and failure resolutions; Spare Ratio and Justification – preventive and corrective maintenance, holds, long-
term repair cars, spare train sets, procurement, and scrapping policies; Maintenance and Capital Reinvestment Programs; Operating Environment – weather, right-of-way, track configuration, and signal
systems. With an understanding of the Fleet requirements, operations performance measures/indicators needs to be delineated. Then, the transactions that occur to determine outputs, outcomes, and impacts resulting from the definition, calculation, analysis, and interpretation of the operations performance measures/indicators must be documented. Key performance measures/indicators, as those used MBTA, should at least include: Ridership, Vehicle Availability, Mean Distance Between Failures, Mean Distance Between Disruptions, On-time Performance, Speed Restrictions, Overtime, and Customer Service Initiatives. The next task is to identify and understand the Maintenance Management Information System to determine how it is used for managing inventory, purchasing, creating and
New England Professionals LLC Page 118 August 31, 2009

A Transit Methodologoy Using Six Simga for Heavy Rail Vehicle Maintenance Programs – CASE STUDY - MDT
tracking work orders, labor allocation and other maintenance as well as materials management functions. The fourth task is for rail services to have a full-time Quality Manager on staff and to have an ASQ Certified Six Sigma Black Belt or Green Belt on staff for rail car maintenance with Six Sigma project implementation experience. Using the Fleet Management Plan, a fifth task is to determine maintenance approach currently being used or a combination of approaches for rail maintenance, such as: Condition-Based, Traditional, or Reliability-Centered. Whatever approach is used the key factors should be time, miles, and condition on a relational basis in terms of standards for rail car maintenance (see next task). Value Streaming Mapping should be a consideration in developing the appropriate relational basis for selecting a rail car maintenance approach. The sixth task deals with determining what entity or combination is used to set the standards for rail car maintenance, such as: Original Equipment Manufacturer, Rail Car Vendors, Industry-wide Sources, and Rail Maintenance staff and technicians. The seventh task is to specify all functional support areas/offices that affect rail car maintenance and at what level, using discrete categories. Task eight involves preparing process maps for all rail car maintenance processes that impact the cost of rail car maintenance. In conjunction, Quality Assurance should prepare process maps of each process in the functional support areas/offices that affect the cost of rail car maintenance. Task nine is to construct a Rail Car Maintenance Cost Formula. This formula should show the cost of rail car maintenance as a function of its top level cost drivers plus the collective impact of functional support areas/offices that affect the cost of rail car maintenance. Then list the cost performance measures associated with each cost drivers. The tenth task requires constructing a set of matrices to determine discrete impact levels Major Rail Car Systems have on top level Cost Drivers by each cost top level performance measure. Task eleven is to use the Six Sigma tool (DMAIC) to address rail components of the Rail Car Maintenance Cost Formula and the Lean Six Sigma tool to address the supporting functional areas/offices of the Rail Car Maintenance Cost Formula. It should be noted that the DMA part of the Six Sigma tool is about process characterization and the IC part focuses on process optimization. MDT Deployment
According MDT Divisional Business Plan for the Office of Quality Assurance (QA), QA has been given the responsibility for full deployment of the Six Sigma methodology
New England Professionals LLC Page 119 August 31, 2009

A Transit Methodologoy Using Six Simga for Heavy Rail Vehicle Maintenance Programs – CASE STUDY - MDT
throughout the organization. As such, Quality Assurance has successfully completed a number of Six Sigma Execution activities, which have been discussed throughout the Case Study. But of greater import, one Six Sigma Project has been successfully completed and a second one is underway. The completed project was for MDT Financial Services Division – Budgeting; both of these projects can be designated as process improvement efforts. Specifically, the Budget project dealt with MDT Accounts Payable Disbursement Process and it has been described in the section covering MDT Case Study Site Visit meetings - Day One second morning meeting. The second Six Sigma project underway is about the propulsion system for MDT rail cars. In conducting the Propulsion System Six Sigma Project, a number of the proposed Transit Methodology Using Six Sigma For Heavy Rail Vehicle Maintenance Programs tasks have been conducted. First the Fleet Management Plan has been reviewed. Second, the centralized MDT Maintenance Management Information System, EAMS, is clearly understood; however, rail service data is not completely entered into the database. A full-time Quality Manager is on staff with MDT Rail Service Division. Although an ASQ Certified Six Sigma Black Belt or Green Belt is not on staff for rail car maintenance, there are several individuals in MDT Rail Services Division that can perform the Black/Green Belt role because of their appropriate education, experience, expertise, and training of required in the Six Sigma tool. As so and based on limited assessment time, Jerry Blackman, Gregory Robinson, and Robert Dyck appear to be likely choices for QA sponsored-driven training to become an ASQ Certified Six Sigma Black Belt or Green Belt. They seem like plausible choices because of their current roles at MDT, as related to rail car maintenance. QA current consultants with ASQ Certified Six Sigma Green Belt, in the interim, will have a critical role in the Propulsion System Six Sigma Project. In terms of MDT rail car maintenance program approach, it appears that the traditional approach being used has limited value under the current situation; so, it was observed that some thought should be given to viewing the situation from a car instead fleet perspective. QA, also, has a list of supporting functional areas/offices that affect rail car maintenance; they are listed in the Analysis section. At this point, QA has prepared eleven process maps that impact rail car maintenance. These process maps show interdependence needs for rail car maintenance.
New England Professionals LLC Page 120 August 31, 2009

A Transit Methodologoy Using Six Simga for Heavy Rail Vehicle Maintenance Programs – CASE STUDY - MDT
PROCESS MAPS APPROVED BY STAKEHOLDERS
Warranty Knowledge Mgt. ChiefRail Technican -Materials Management Stock Clerk - Warranty Administration - Vendor/Supplier
Rail Maintenance RepairRail Maintenance General Superintendent
Rail Supervisor/Rail Operator - Control Center - Rail Yard Dispactor - Knowledge Management - Rail Vehicle Maintenance - Materials Management
Rail Maintenance Preventive Maintenance Inspection
Rail Maintenance General Superintendent
Knowledge Management - Rail Vehicle Maintenance - Central Control Yard Tower - Materials Management
Customer Service Incidents MDT Manager 311 Transit/MDT Customer Service - Investigator - MDT Director Office
Monthly Operating Budget Management Performance Management Chief
MDC Budget - Budget Analyst - Budget Manager - Division Chief/Section Head/Budget Administrator - Office of Strategic Planning and Performance Managemenet
Accounts Payable Disbursement MDT Controller
Vendor/Consultant/Contractor - MDT Project Manager - Budget - EP&D Operations - Accounts Payable Secertary - Service Administrators - Account Clerks - Transit Purchasing and Store Divisions - Materials Manager Buyer and Dept. of Procurement Management - Account Payabe Supervisor - Lead Account Clerk - Accountant III (Contracts Payable) - MDT Finance Finance Department
Procurement and Contract Administration Materials Management Chief
End User - Warehousing and Stores - Budget - Inventory and Purchasing -Contracts/B&F - Dept. of Procurement Management - Legislative Committees
Contract Monitoring and Reconcilation Materials Management ChiefMaterials Management (Contract/Procurement) - Budget - End User - Vendor - Accounts Payable
Quality Assurance Auditing Quality Assurance ChiefMDT Director - QA Chief - Lead Auditor - Audit Team - Auditee Management
Rail Maintenance Critical Item InspectionRail Maintenance General Superintendent Receiving Clerk - Stock Clerk - Rail Vehicle Maintenance Supervisor
Special Projects/Campaign Control Rail Assistant Director
Campaign Initiator - FESM MDT - Finance (Budget/Accounting) - Maintenance Chief Supervisor/Campaign Executor - Materials Management /Stock Room - Transit Maintenance Control - Campaign Responsible Authorities - Information Technology -
Table 34 ‐ Process Maps that Impact Rail Car Maintenance
TRANSIT SIX SIGMA – NEXT STEP New England Professionals (NEP) is recommending that the next level of the proposed Transit Methodology Using Six Sigma for Heavy Rail Vehicle Maintenance be conducted by holding a one-day workshop for approximately twenty participants from the five transit agencies that participated in this National Research Project. Rationale Five site visits were conducted to establish baseline knowledge about rail car maintenance relative to improving capital and operating efficiencies - Federal Transit Administration’s (FTA) Third Strategic Research Goal. Miami-Dade Transit was the first site visit and upon completion MDT staff recommended that the five participating agencies come together to establish consensus about the construct of a Transit Methodology Using Six Sigma For Heavy Rail Vehicle Maintenance Programs. This recommendation was proposed to the other four transit agencies during the respective site visits and each transit agency agreed to participate.
New England Professionals LLC Page 121 August 31, 2009

A Transit Methodologoy Using Six Simga for Heavy Rail Vehicle Maintenance Programs – CASE STUDY - MDT
New England Professionals LLC Page 122 August 31, 2009
WORKSHOP SUMMARY DESCRIPTION Workshop Objective The objective is to present the Transit Methodology Using Six Sigma For Heavy Rail Vehicle Maintenance Programs construct developed from the Miami-Dade Transit Case Study. This is an opportunity to create an agency-driven Transit Six Sigma focus group to share between agencies Transit Six Sigma Projects and Best Practices in support of the State of Good Repair, focusing on Rail Car Maintenance. Workshop Focus The workshop will be discussion-oriented and guided by a set of key questions with strong emphasis on interaction between the attendees - participating transit agencies’ rail car maintenance senior staff and FTA staff. The workshop primary focus will be the Transit Methodology Using Six Sigma For Heavy Rail Vehicle Maintenance Programs construct, relative to the FTA’s State of Good Repair (SGR) report, as of October 2008. This report begins the dialogue about “Transit State of Good Repair” and it is the result of FTA’s two-day SGR Workshop that brought together representatives from 14 public transportation providers and State Departments of Transportation. The primary concern was the state of repair for our Nation’s Transit Inventory. To do so, the participants discussed, among other things, transit recapitalization and maintenance issues, asset management practices, and innovative financing strategies. In conjunction, the participants explored issues such as measuring the conditions of transit capital assets, prioritizing local transit re-investment decisions, and preventive maintenance practices. Furthermore, participants discussed research needs and potential tools for helping agencies to cope with this growing problem of maintaining the condition of our transit infrastructure. Workshop Format The workshop format will include two sessions:
Session One will have two components: (1) Synopsis of MDT Six Sigma Initiative presented by MDT senior staff; and (2) Demonstration of MDT Six Sigma Rail Propulsion Project by MDT Quality Assurance Chief.
Session Two will focus exclusive on the Transit Methodology using Six Sigma,
developed from MDT Case Study. Specifically, the Transit Methodology using Six Sigma construct will focus on process characterization (define, measure, and analysis) with limited attention to process optimization (improve and control) because our focus at this point was on process characterization of rail car maintenance cost. Ultimately, a MDT deployment/how to manual will be outlined and discussed.

APPENDIX A
Initial Site Visit Sign In Sheets
Miami-Dade Transit (MDT) Initial Site Visit Sign In Sheet on 09/03/2008 & * Case Study Participants May 4-15, 2009 Name Title Harpal S. Kapoor * Director Susanna Guzman-Arean* Chief – Strategic Planning and Performance Management Gregory N. Robinson* General Superintendent – Rail Transportation Sandy Amores * Chief - Knowledge Management Lazaro R. Palenzuela * Chief – Office of Quality Assurance Ivor Myers Rail/Mover New Vehicles – Acting Chief Rene A. Henriquez * QA/QC Engineer Jerry Blackman * General Superintendent – Rail Vehicle Maintenance Richard Snedden * Assistant Director – Rail Services Genaro Alvarez Chief Supervisor – Metromover Maintenance Jackie Bailey * Special Project Administrator – External Affairs Freeman Wright* Warehouse and Store Superintendent Eric Muntan Chief – Office of Safety and Security Noel Flores Chief – Materials Management Manny Castillo* 6 Sigma Efficiency / Performance Management Marlon Beckford* Transit Maintenance Production Coordinator Carie Stern Grant Accountant – Finance Joelle Janvier * Controller Denese Waiters Program Manager – Customer Service Robert Dyck* Lead Engineer – IE&M Dwight Baldwin* Lead Transit Maintenance Production Coordinator Ruby Hemingway-Adams Assistant Director – Customer Service Kelly Cooper Manager – Performance Reporting Vontressia Young * Administrative Officer 3 Rawle Griffith* System Analyst Programmer 2 David Clodfelter Chief – Budget and Performance Reporting Lucious C. Williams CQA - Quality Assurance Engineer Zoila Badulescu * CQA, CQE - Quality Manager, Rail Services Kaushik N. Parekh * Quality Assurance Engineer Barry C. Smerling * Transit Safety Officer Table 35 ‐ MDT Initial Site Visit
Chicago Transit Authority (CTA) Initial Site Visit Sign In Sheet on 09/23/2008 Name Title Ronald Huberman President (former) Maggie Schilling Project Consultant – Performance Management William Mooney Sr. Chief Operating Officer – Transit Operations Ralph E. Malec General Manager – Rail Engineering and Technical Services Philip Lamont General Manager – Rail Car Heavy Maintenance
Confidential Page 123 9/1/2009
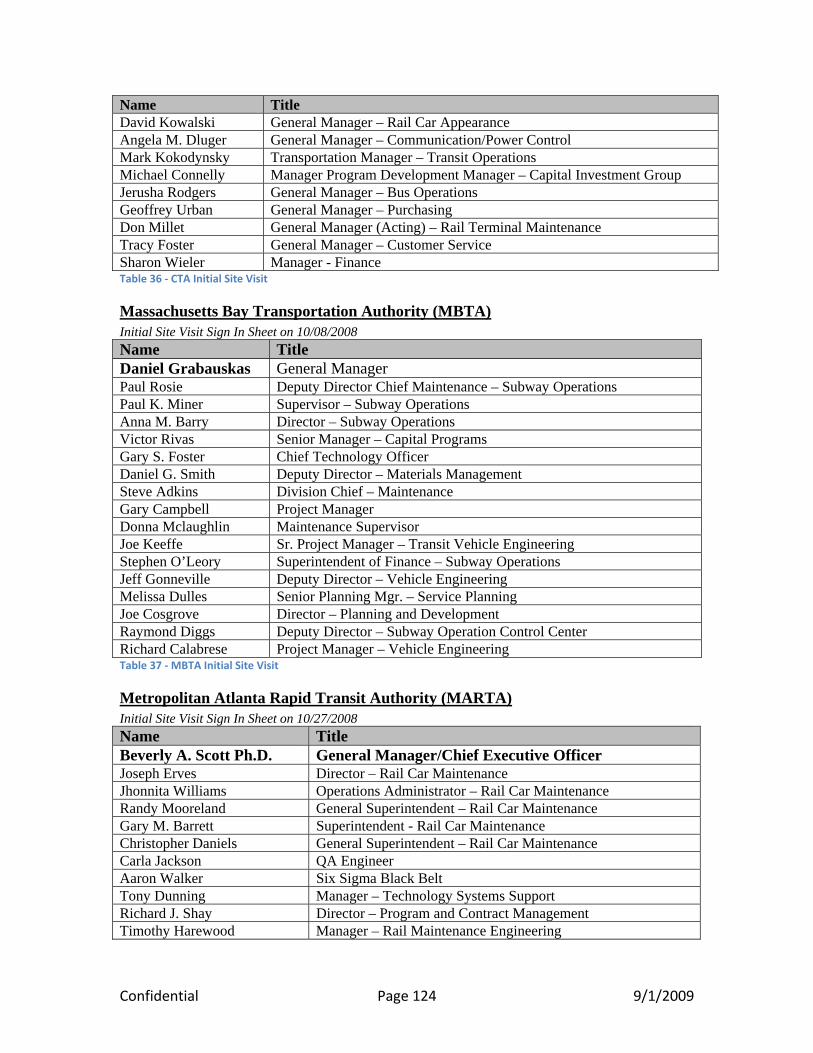
Name Title David Kowalski General Manager – Rail Car Appearance Angela M. Dluger General Manager – Communication/Power Control Mark Kokodynsky Transportation Manager – Transit Operations Michael Connelly Manager Program Development Manager – Capital Investment Group Jerusha Rodgers General Manager – Bus Operations Geoffrey Urban General Manager – Purchasing Don Millet General Manager (Acting) – Rail Terminal Maintenance Tracy Foster General Manager – Customer Service Sharon Wieler Manager - Finance Table 36 ‐ CTA Initial Site Visit
Massachusetts Bay Transportation Authority (MBTA) Initial Site Visit Sign In Sheet on 10/08/2008 Name Title Daniel Grabauskas General Manager Paul Rosie Deputy Director Chief Maintenance – Subway Operations Paul K. Miner Supervisor – Subway Operations Anna M. Barry Director – Subway Operations Victor Rivas Senior Manager – Capital Programs Gary S. Foster Chief Technology Officer Daniel G. Smith Deputy Director – Materials Management Steve Adkins Division Chief – Maintenance Gary Campbell Project Manager Donna Mclaughlin Maintenance Supervisor Joe Keeffe Sr. Project Manager – Transit Vehicle Engineering Stephen O’Leory Superintendent of Finance – Subway Operations Jeff Gonneville Deputy Director – Vehicle Engineering Melissa Dulles Senior Planning Mgr. – Service Planning Joe Cosgrove Director – Planning and Development Raymond Diggs Deputy Director – Subway Operation Control Center Richard Calabrese Project Manager – Vehicle Engineering Table 37 ‐ MBTA Initial Site Visit
Metropolitan Atlanta Rapid Transit Authority (MARTA) Initial Site Visit Sign In Sheet on 10/27/2008 Name Title Beverly A. Scott Ph.D. General Manager/Chief Executive Officer Joseph Erves Director – Rail Car Maintenance Jhonnita Williams Operations Administrator – Rail Car Maintenance Randy Mooreland General Superintendent – Rail Car Maintenance Gary M. Barrett Superintendent - Rail Car Maintenance Christopher Daniels General Superintendent – Rail Car Maintenance Carla Jackson QA Engineer Aaron Walker Six Sigma Black Belt Tony Dunning Manager – Technology Systems Support Richard J. Shay Director – Program and Contract Management Timothy Harewood Manager – Rail Maintenance Engineering
Confidential Page 124 9/1/2009

Name Title Johnny Dunning Jr. Director – Transit Systems Planning Rick Shay Director – Contract and Procurement Management Janet Mays Manager of Accounting – Finance Tim White Executive Director – Safety and Quality Assurance Carol J. Smith Director – Research and Analysis John M. Weber Director – Rail Transportation Gregory Snyderman Finance Table 38 ‐ MARTA Initial Site Visit
Southeastern Pennsylvania Transportation Authority (SEPTA) Initial Site Visit Sign In Sheet on 11/06/2008 Name Title Joseph M. Casey General Manager Stephen E. Schilckman Executive Director John Jamison Director – Administration and Finance – Vehicle
Engineering/Maintenance Dept. Luther Diggs Chief Officer – Vehicle Engineering and Maintenance Raelund J. Dickerson Management Analyst – Vehicle Engineering and Maintenance Joseph D. Barttelli Chief Mechanical Officer – Rolling Stock Engineering and Shops Stephen H. Pettersen P.E. Assist. Chief Mechanical Officer – Rail Equipment Eng. and Maint. Paul Jurklewicz Head – Rail Quality Assurance Bob Landgraf Director – Supply Chain Ron Hopkins Chief Control Center Bruce McKenzie Chief Information Officer Alex Flemming Senior Long-Range Planner Kim Scott Heinie Customer Service Table 39 ‐ SEPTA Initial Site Visit
Confidential Page 125 9/1/2009

APPENDIX B
Miami-Dade Transit Core Values
Confidential Page 126 9/1/2009

APPENDIX C
Greater Miami Chamber of Commerce Greater Miami Chamber of Commerce pertaining to the half-cent transit surtax
Confidential Page 127 9/1/2009

APPENDIX D
MDT Sterling Quality Achievement Recognition Award Miami-Dade Transit Department -Preventive Maintenance Program, June 1, 2007
Confidential Page 128 9/1/2009

Confidential Page 129 9/1/2009
APPENDIX E
About the Project Team Kenneth R. Cook, Ph.D. professional career and experience spans over 30 years and covers work performed for such entities as the City of Chicago, City of Buffalo, Federal Transit Administration, Chicago City Colleges, City of Harvey Illinois, Carter and Burgess, Inc. (Engineers and Planners), and Texas Southern University. He has a Ph.D. – Policy Studies (Transportation) School of Management - State University of New York, Buffalo - Sc, M.C.P. (Master in City Planning) from Howard University, B.S. in Civil Engineering Technology from the University of Houston. Conjunctively, Mr. Cook has successfully completed a FTA funded comprehensive eight week workshop to develop research management skills held at State University of New York – Buffalo. In terms of professional organizations, Kenneth has been a member of the National Institute for Certification in Engineering Technologies, American Planning Association, the High Speed Rail Association, and the Conference of Minority Transportation Officials. He currently resides in Connecticut with his wife Wendy Tyson-Wood. Wendy Tyson-Wood is the founder and owner of New England Professionals, L.L.C. (NEP) with over 25 years of experience in project management/administration, financial analysis, and management information systems. Her leadership affords NEP the ability to concurrently deliberate tactically and execute optimally. She holds a Bachelor of Science in Accounting which is augmented with Project Management certificates as well as in-depth education and training in Oracle Financials, Programming, and Reporting. Mrs. Tyson-Wood has held positions as Project & Process Improvement Leader, Programmer Analyst, Assistant Vice President of Management Information Systems, and Cost/Financial Accountant. In addition, Wendy has experience in dealing with performance and maintenance of software and operational activities related to the development and support of various applications such as testing and development environment, upgrading applications and software platforms, coordinating the deployment of network applications, website development, and IT security. She resides in Connecticut with her husband Kenneth R. Cook and family. Edward L. Thomas has over 29 years of experience in public transportation; working in the areas of systems planning, financial planning, strategic planning, information technology development and application, innovative financial management, organizational development, and performance management. He started his career in 1978 with the Federal Transit Administration (FTA) where he managed planning and project development for transit new starts, served as a subject matter expert in project evaluation and financial assessments; conducted training in planning, financial analysis, and evaluation. In 1995, he became Director, FTA Office of Planning and Innovation where he managed the New Starts Program. He later became FTA Associate Administrator for Research, Demonstration and Innovation. After 24 years with FTA, he worked five years with the Washington Metropolitan Area Transit Authority (WMATA) where he served as Assistant General Manager for Planning, Information Technology and Real Estate. In that capacity, he led development and implementation of an innovative, $5 billion Capital Financial Plan called Metro Matters. Edward received his B.A. Degree in Urban Studies and Geography from the University of Maryland, a M.S. Degree in Urban Planning, with transportation planning and engineering emphasis, from Columbia University and post-graduate study in public and corporate finance at the University of Maryland. A. Siranjan Kulatilake is a successful business and IT leader with over 23 years of experience, expertise and accomplishments in executive leadership, strategic planning, IT governance, performance management, finance and entrepreneurship. He has career depth across the private, public and professional association sectors. As a consultant, he has untaken cost/benefit analysis of capital improvements versus operational improvements. Siranjan has conducted exhaustive root-cause analyses, tested and refined a custom Total Quality Management (TQM) methodology that made strategic use of IT to deliver capital, operational and structural improvements. Siranjan received a Bachelor of Science (Honors) in Mathematics from the Royal Holloway College, University of London - U.K.