final report capacity gaps in needs assessment planning
TRANSCRIPT
CAPACITY GAPS IN NEEDS ASSESSMENT AND PLANNING Support for Effective Cooperation and Coordination of Cross-border Initiatives in Southwest Ethiopia-Northwest Kenya, Marsabit-Borana
& Dawa, and Kenya-Somalia-Ethiopia (SECCCI) -T05.491 (T005)
Final Report
Antoine Mansour
March 2020
2
This report was commissioned by the United Nations Development Programme (UNDP) in the framework of the Project Support for Effective Cooperation and Coordination of Cross-border Initiatives in Southwest Ethiopia-Northwest Kenya, Marsabit-Borana & Dawa, and Kenya-Somalia-Ethiopia (SECCCI).
The project has been funded with the support of the European Union.
The report was produced by an external consultant and was not subjected to a validation workshop.
Disclaimer and Copyright
The content of this report does not reflect the official opinion of the European Union or UNDP. Responsibility for the information and views expressed in the report lies entirely with the author.
Reproduction is authorized provided the source is acknowledged.
3
TABLE OF CONTENTS
Page I. THE SCOPE OF THE ASSESSMENT……………………………………………………….. 4
1. Objectives of the assessment……………………………………………………………………. 4 2. The functional capacities to be assessed………………………………………………………… 4 3. Geographical areas covered in the capacity gaps in needs assessment and planning…………… 4 4. Approach………………………………………………………………………………………... 4 5. Assumptions…………………………………………………………………………………….. 5 6. Limitations……………………………………………………………………………………… 5
II. CAPACITY GAPS IN NEEDS ASSESSMENT AND PLANNING IN CLUSTER II……. 7
A. Characteristics of the sample…………………………………………………………………. 7 B. The capacity gaps……………………………………………………………………………… 8 1. Capacity to engage stakeholders in the design and implementation of needs assessment and local development planning………………………………………………………………………..
8
2. Capacity to identify and assess the needs of local communities………………………………… 10 3. Capacity to translate the needs into the formulation of a development plan…………………….. 14 4. Capacity to monitor and evaluate………………………………………………………………. 18 C. Conclusions: Prioritization of the capacity gaps……………………………………………. 19 1. Identification and assessment of needs of local communities………………………………….. 19 2. Translation of the needs into the formulation of a development plan in cross-borders………… 20 3. Monitoring and evaluation………………………………………………………………………. 20
II. CAPACITY GAPS IN NEEDS ASSESSMENT AND PLANNING IN CLUSTER III…… 21
A. Characteristics of the sample…………………………………………………………………. 21 B. The capacity gaps……………………………………………………………………………… 24 1. Capacity to engage stakeholders in the design and implementation of needs assessment and local development planning………………………………………………………………………..
24
2. Capacity to identify and assess the needs of local communities……………………………….. 27 3. Capacity to translate the needs into the formulation of a development plan 36 4. Capacity to monitor and evaluate……………………………………………………………….. 45 C. Conclusions: Prioritization of the capacity gaps……………………………………………. 46 1. Identification and assessment of needs of local communities…………………………………… 46 2. Translation of the needs into the formulation of a development plan in cross-borders…………. 46 3. Monitoring and evaluation………………………………………………………………………. 47

4
I. THE SCOPE OF THE ASSESSMENT
1. Objectives of the assessment
(1) To identify the technical gaps of relevant stakeholders in the three clusters in terms of carrying out needs assessments related to cross-border development needs.
(2) To identify and prioritize capacity gaps of local stakeholders in the participation in, and formulation of development plans.
2. The functional capacities to be assessed
The capacity gaps of relevant organizations in needs assessment and planning will be assessed through the following functional capacities:
(1) Capacity to engage stakeholders
(2) Capacity to identify and assess needs
(3) Capacity to translate the needs into the formulation of a development plan
(4) Capacity to monitor and evaluate
3. Geographical areas covered in the capacity gaps in needs assessment and planning
The capacity gaps in needs assessment and planning was implemented in the three following clusters: Cluster I: on the Kenyan and Ethiopian border encompassing Omo-Turkana; Cluster II: on the Kenyan and Ethiopian border encompassing Marsabit-Borana and Liben; and Cluster III: on the border between Kenya, Somalia and Ethiopia encompassing Mandera-Gedo-Doolow-Dawa.
Geographical area Cluster name Cluster I Kenya – Ethiopia South Omo (Ethiopia) & Turkana (Kenya) Cluster II Kenya – Ethiopia Marsabit County in Kenya and Borana &
Liben Zone in Ethiopia. Cluster III Kenya – Somalia - Ethiopia Mandera, Gedo and Doolow -Dawa
4. Approach
The following approach was used in the preparation of the report on capacity gaps in needs assessment and planning:
• A review of available secondary data was undertaken • An online questionnaire was prepared and tested by a few organizations
5
• The questionnaire was then sent by the coordinators of the three clusters to the relevant organizations
• Group discussions with respondents who filled out the questionnaire • Key informant interviews to assess the capacity gaps from the point of view of key
stakeholders. The interviews were conducted with: IGAD CBDFU (Cross Border Development Facilitation Unit) and the Life Peace Institute.
5. Assumptions
The effective implementation of the capacity gaps assessment is based on the assumptions that were indicated in the methodology presented in October 2020 with regard to the three expected deliverables: (1) Stakeholders’ mapping and analysis; (2) Capacity gaps in needs assessment and planning; and (3) Capacity development plan. The assumptions relevant to the capacity gaps were as follows:
• Organizations in the three clusters are willing to cooperate in the capacity needs assessment • Stakeholders will be available to participate in the interviews when necessary • Stakeholders participate in small groups in the focus groups discussions • Assistance is provided by UNDP field staff to the consultant in facilitating the
implementation of activities related to the capacity gaps assessment.
6. Limitations
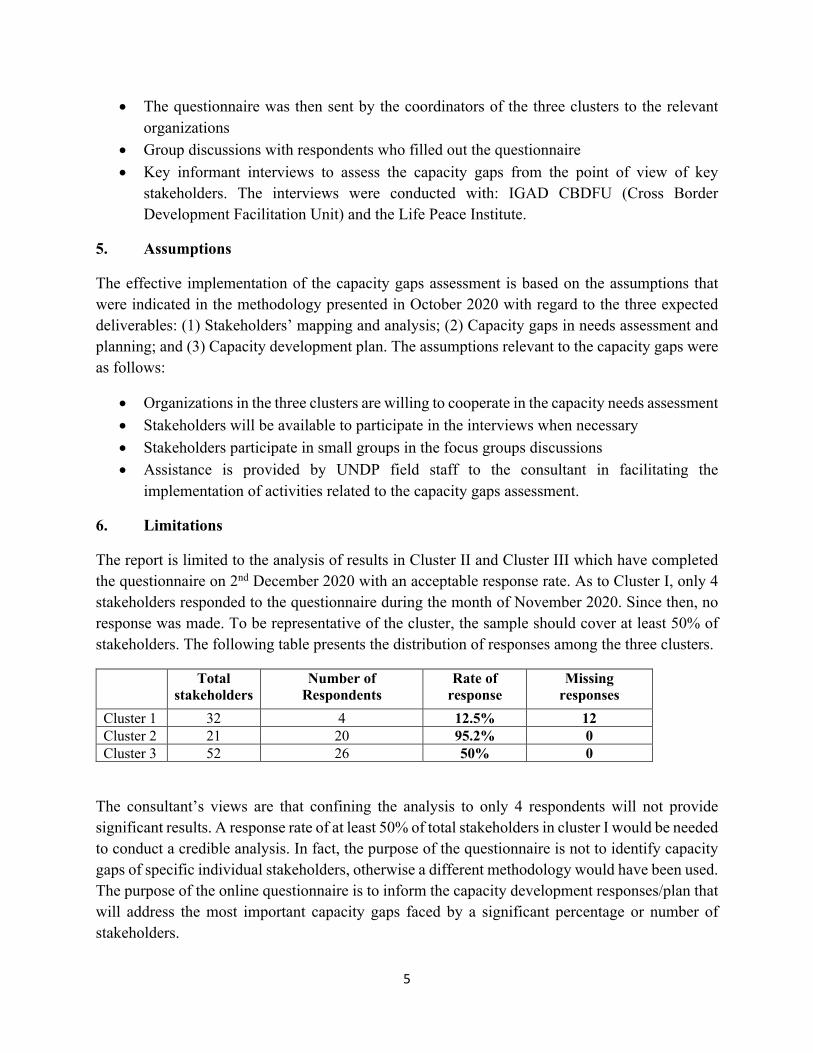
The report is limited to the analysis of results in Cluster II and Cluster III which have completed the questionnaire on 2nd December 2020 with an acceptable response rate. As to Cluster I, only 4 stakeholders responded to the questionnaire during the month of November 2020. Since then, no response was made. To be representative of the cluster, the sample should cover at least 50% of stakeholders. The following table presents the distribution of responses among the three clusters.
Total stakeholders
Number of Respondents
Rate of response
Missing responses
Cluster 1 32 4 12.5% 12 Cluster 2 21 20 95.2% 0 Cluster 3 52 26 50% 0
The consultant’s views are that confining the analysis to only 4 respondents will not provide significant results. A response rate of at least 50% of total stakeholders in cluster I would be needed to conduct a credible analysis. In fact, the purpose of the questionnaire is not to identify capacity gaps of specific individual stakeholders, otherwise a different methodology would have been used. The purpose of the online questionnaire is to inform the capacity development responses/plan that will address the most important capacity gaps faced by a significant percentage or number of stakeholders.
6
Stakeholders who filled out the online questionnaire tended to inflate the level of their capacity. This was more obvious in cluster III. The consultant was able to detect such overrating when responses to the same question, which was asked twice in different ways in the questionnaire, were different. In fact, the consultant decided on purpose to include same but differently formulated questions in order to detect the discrepancies in the responses.
The overrating was also evident when comparing the individual response with the reply made by the same stakeholder in the stakeholders’ mapping questionnaire. The response in the latter questionnaire showed clearly the weak capacity of the stakeholders. The weak capacity of a number of stakeholders was also clearly noticed during the discussions made by the consultant with some of the stakeholders. In view of the overrating, the consultant had to analyze the data according to the type of stakeholders: INGO, NGO, CBO and Public office, with the view to produce more credible results.
Other limitations arose due to the difficulty to communicate virtually with stakeholders, particularly in Ethiopia and Somalia, because of the weak internet connection and also the difficulty to reach them through the phone line network. The consultant was able to conduct a virtual group discussion (through internet) with two stakeholders in Cluster III, as others were not able to participate. The consultant did not succeed in meeting with stakeholders in Cluster III, although he also used his cell phone line, as unfortunately the network was continuously busy.
The analysis of the findings of the online questionnaire, therefore, took into consideration the above-mentioned limitations.

7
II. CAPACITY GAPS IN NEEDS ASSESSMENT AND PLANNING IN CLUSTER II
A. Characteristics of the sample
Almost all stakeholders (20) of the list of stakeholders of Cluster II (21 stakeholders) responded to the online questionnaire. They are distributed as follows: 40% from Dawa, 40% from Borena and 20% from Marsabit.
The list of respondents is presented below:
Borena Dawa Borena Zone Administration Office Administration Office, HR Department,
responsible for sectoral coordination office Water, Mineral and Energy Office Dawa Zone Administration Office Borena Zone Women’ Children's and Youth Office Dawa zone Water, Mineral and Energy Office Disaster Risk Management Office Disaster Risk Management Office Moyale Town Administration Office, Borena Zone Moyale Disaster Risk Management office Moyale Woreda Administration Office, Borena Zone Moyale Water, Mineral and Energy Office Moyale Woreda Youth and Sport Commission Office, Borena zone
Moyale Woreda Administration Office, Dawa Zone
Borena Zone Planning & Economic Development Cooperation
Moyale Woreda Women's, Children's and Youth Affairs Office, Dawa Zone
Marsabit Ministry of Water Ministry of Peace The County Government of Marsabit Vétérinaires Sans Frontières (VSF) Germany
(Omo Delta Project)
With the exception of VSF Gemany (INGO), all stakeholders are national and sub-national entities (public offices). The stakeholders cover one or several thematic areas/sectors in their interventions. The three most important sectors are:
• Cross-border conflict, peace and security (45% of total respondents) • Gender equality, youth and development (40%)
40%
40%
20%
Distribution of Respondents by Geographical Location
Dawa Borena Marsabit
8
• Health, water and sanitation (40%)
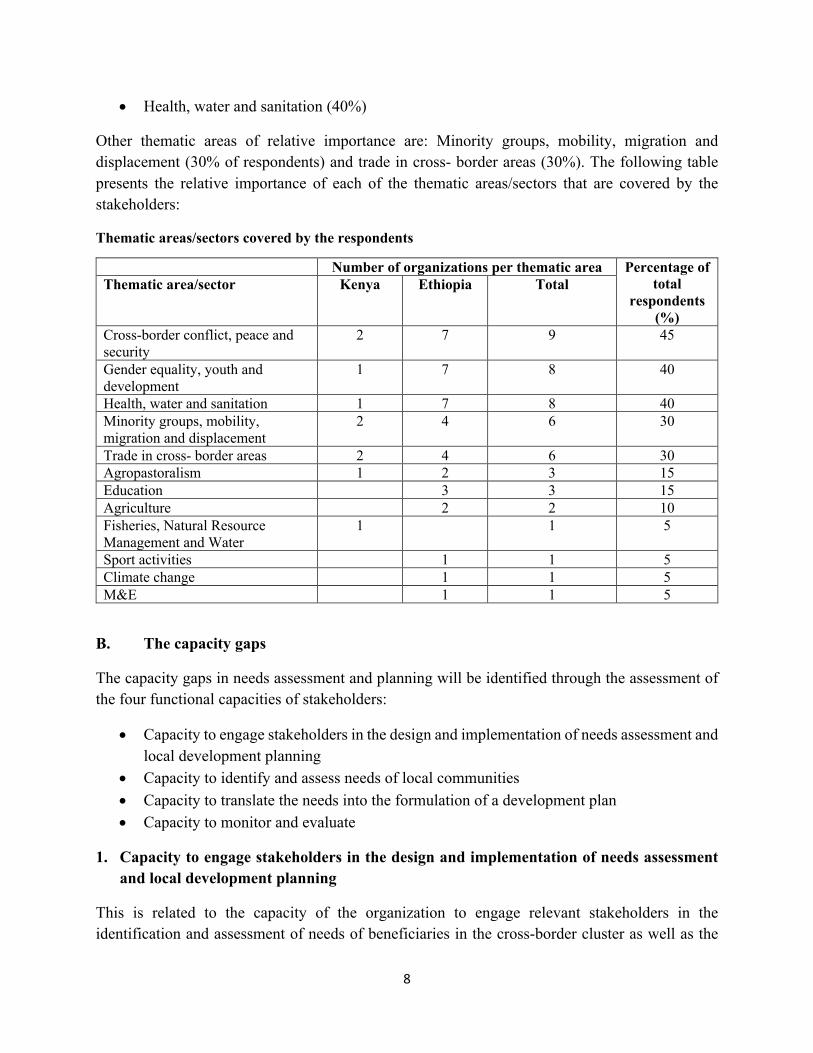
Other thematic areas of relative importance are: Minority groups, mobility, migration and displacement (30% of respondents) and trade in cross- border areas (30%). The following table presents the relative importance of each of the thematic areas/sectors that are covered by the stakeholders:
Thematic areas/sectors covered by the respondents
Number of organizations per thematic area Percentage of total
respondents (%)
Thematic area/sector Kenya Ethiopia Total
Cross-border conflict, peace and security
2 7 9 45
Gender equality, youth and development
1 7 8 40
Health, water and sanitation 1 7 8 40 Minority groups, mobility, migration and displacement
2 4 6 30
Trade in cross- border areas 2 4 6 30 Agropastoralism 1 2 3 15 Education 3 3 15 Agriculture 2 2 10 Fisheries, Natural Resource Management and Water
1 1 5
Sport activities 1 1 5 Climate change 1 1 5 M&E 1 1 5
B. The capacity gaps
The capacity gaps in needs assessment and planning will be identified through the assessment of the four functional capacities of stakeholders:
• Capacity to engage stakeholders in the design and implementation of needs assessment and local development planning
• Capacity to identify and assess needs of local communities • Capacity to translate the needs into the formulation of a development plan • Capacity to monitor and evaluate
1. Capacity to engage stakeholders in the design and implementation of needs assessment and local development planning
This is related to the capacity of the organization to engage relevant stakeholders in the identification and assessment of needs of beneficiaries in the cross-border cluster as well as the
9
capacity to develop accountability mechanisms that ensure multi-stakeholder participation and a free flow of knowledge and information among partners and stakeholders. This would include sharing of data and information with the public that would ensure transparency and accountability in return. Such participation will ensure ownership of the assessment by partners and stakeholders.
Almost all respondents stated they were able to identify and engage stakeholders in their interventions in needs assessment and in planning. A long list of stakeholders was provided by the respondents to confirm such a statement. The lists of stakeholders include various government agencies at the central government level and sub-national entities, and only one INGO (VSFG).
As to the sharing of the data, most of the targeted organizations including VSFF (94.7% of respondents) confirmed that they were sharing the findings of the needs assessment with stakeholders, compared to 84.2% (including VSFG) who shared these with the public.
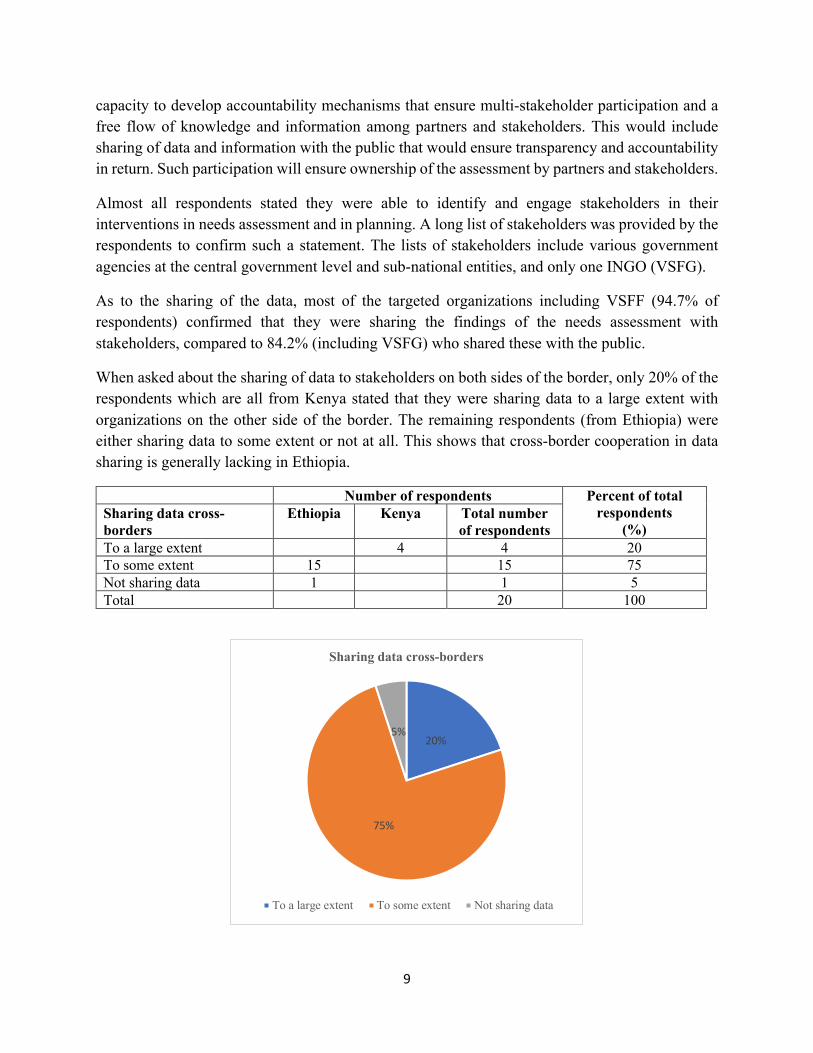
When asked about the sharing of data to stakeholders on both sides of the border, only 20% of the respondents which are all from Kenya stated that they were sharing data to a large extent with organizations on the other side of the border. The remaining respondents (from Ethiopia) were either sharing data to some extent or not at all. This shows that cross-border cooperation in data sharing is generally lacking in Ethiopia.
Number of respondents Percent of total respondents
(%) Sharing data cross-borders
Ethiopia Kenya Total number of respondents
To a large extent 4 4 20 To some extent 15 15 75 Not sharing data 1 1 5 Total 20 100
20%
75%
5%
Sharing data cross-borders
To a large extent To some extent Not sharing data
10
The mobilization of stakeholders in the preparation of a strategic plan and a development plan is not evident, as 75% of respondents have indicated they have partially developed capacity in these two areas. This also includes the ability of the organizations to engage appropriate stakeholders in the provision of inputs during the planning process.
2. Capacity to identify and assess the needs of local communities
Assessment will be made on the abilities of the relevant national and sub-national entities and civil society organizations to effectively access, gather, analyze and synthesize data and information, with the aim of assessing needs of target groups/beneficiaries. The assessment will include:
• The experience of the stakeholders in conducting or participating in needs assessment • Capacity of the stakeholders in the design of needs assessment and data collection • Cross-border cooperation and coordination in needs assessment
Experience of the stakeholders in conducting or participating in needs assessment
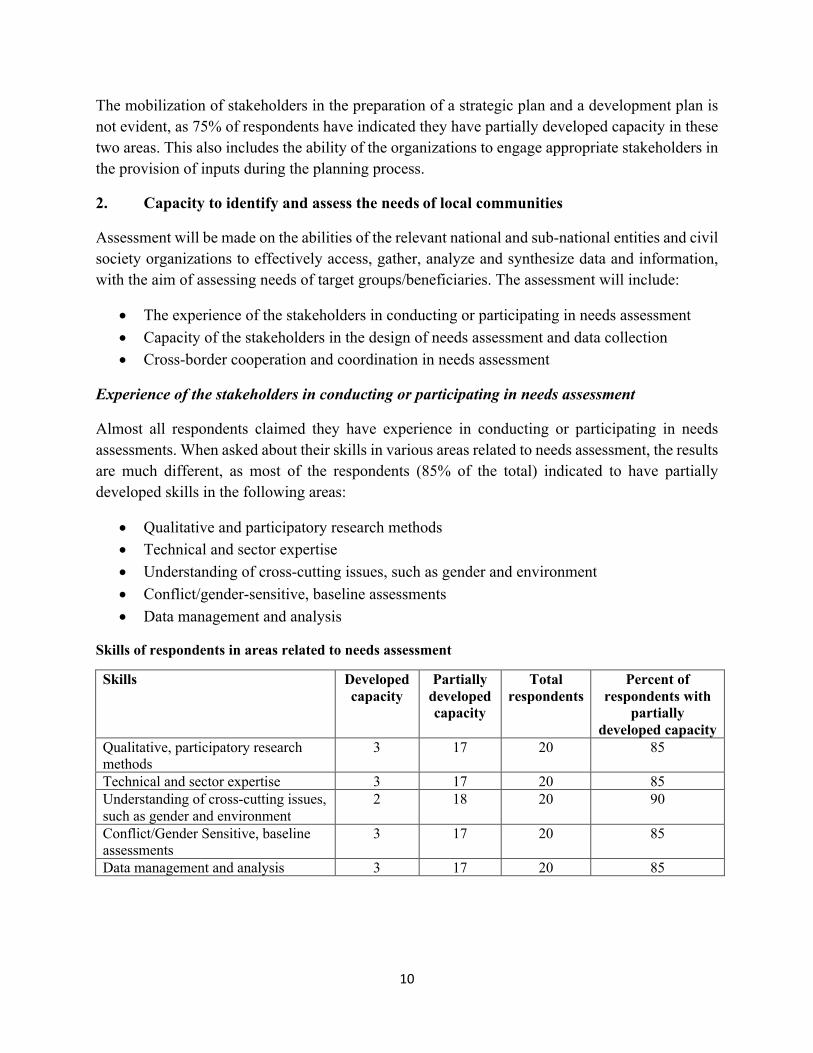
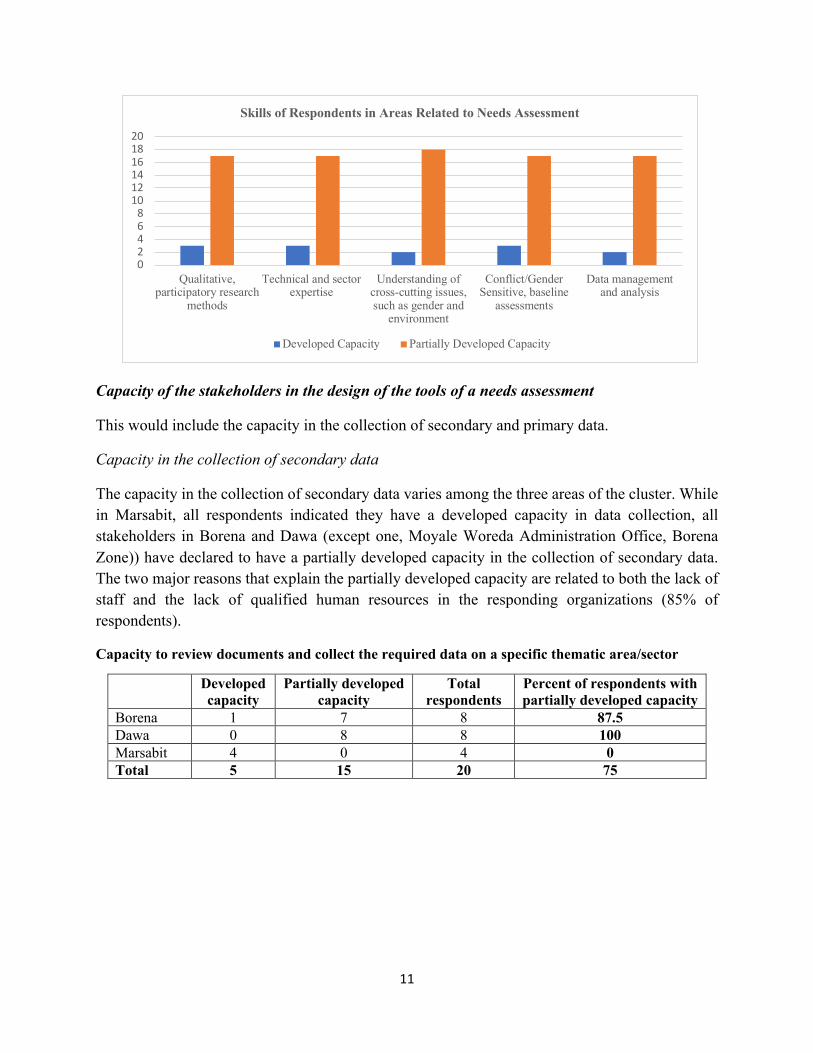
Almost all respondents claimed they have experience in conducting or participating in needs assessments. When asked about their skills in various areas related to needs assessment, the results are much different, as most of the respondents (85% of the total) indicated to have partially developed skills in the following areas:
• Qualitative and participatory research methods • Technical and sector expertise • Understanding of cross-cutting issues, such as gender and environment • Conflict/gender-sensitive, baseline assessments • Data management and analysis
Skills of respondents in areas related to needs assessment
Skills Developed capacity
Partially developed capacity
Total respondents
Percent of respondents with
partially developed capacity
Qualitative, participatory research methods
3 17 20 85
Technical and sector expertise 3 17 20 85 Understanding of cross-cutting issues, such as gender and environment
2 18 20 90
Conflict/Gender Sensitive, baseline assessments
3 17 20 85
Data management and analysis 3 17 20 85
11
Capacity of the stakeholders in the design of the tools of a needs assessment
This would include the capacity in the collection of secondary and primary data.
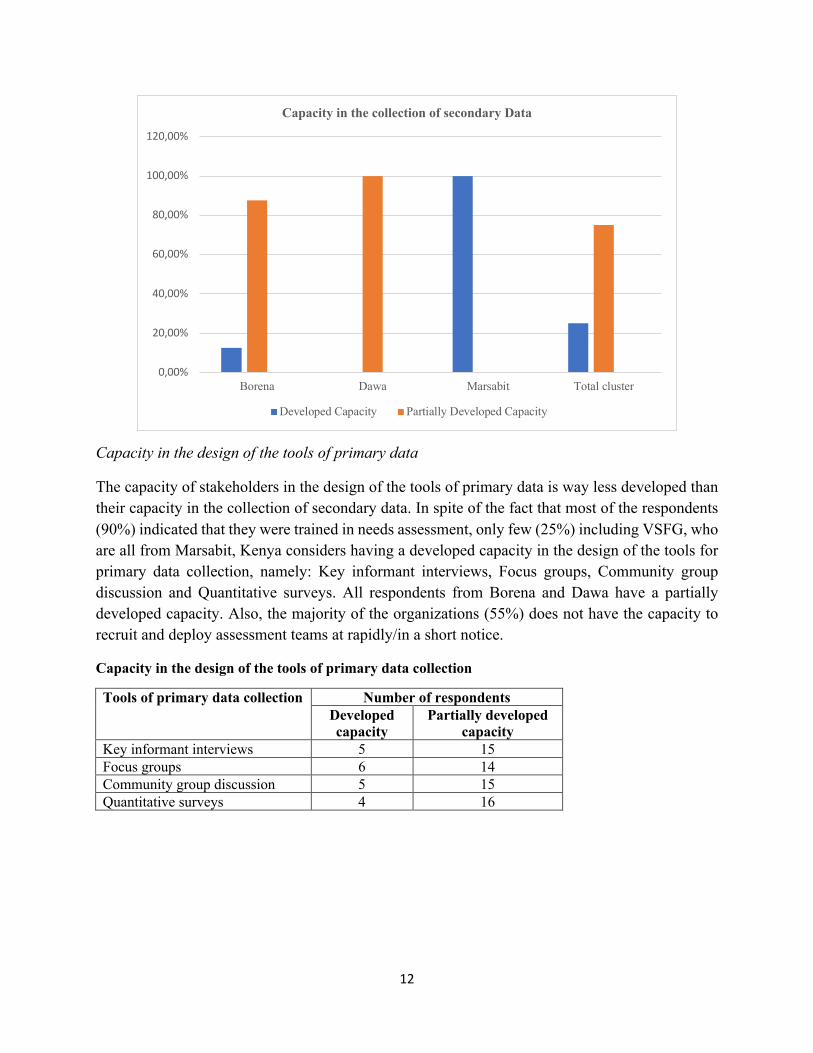
Capacity in the collection of secondary data
The capacity in the collection of secondary data varies among the three areas of the cluster. While in Marsabit, all respondents indicated they have a developed capacity in data collection, all stakeholders in Borena and Dawa (except one, Moyale Woreda Administration Office, Borena Zone)) have declared to have a partially developed capacity in the collection of secondary data. The two major reasons that explain the partially developed capacity are related to both the lack of staff and the lack of qualified human resources in the responding organizations (85% of respondents).
Capacity to review documents and collect the required data on a specific thematic area/sector
Developed capacity
Partially developed capacity
Total respondents
Percent of respondents with partially developed capacity
Borena 1 7 8 87.5 Dawa 0 8 8 100 Marsabit 4 0 4 0 Total 5 15 20 75
02468
101214161820
Qualitative,participatory research
methods
Technical and sectorexpertise
Understanding ofcross-cutting issues,such as gender and
environment
Conflict/GenderSensitive, baseline
assessments
Data managementand analysis
Skills of Respondents in Areas Related to Needs Assessment
Developed Capacity Partially Developed Capacity
12
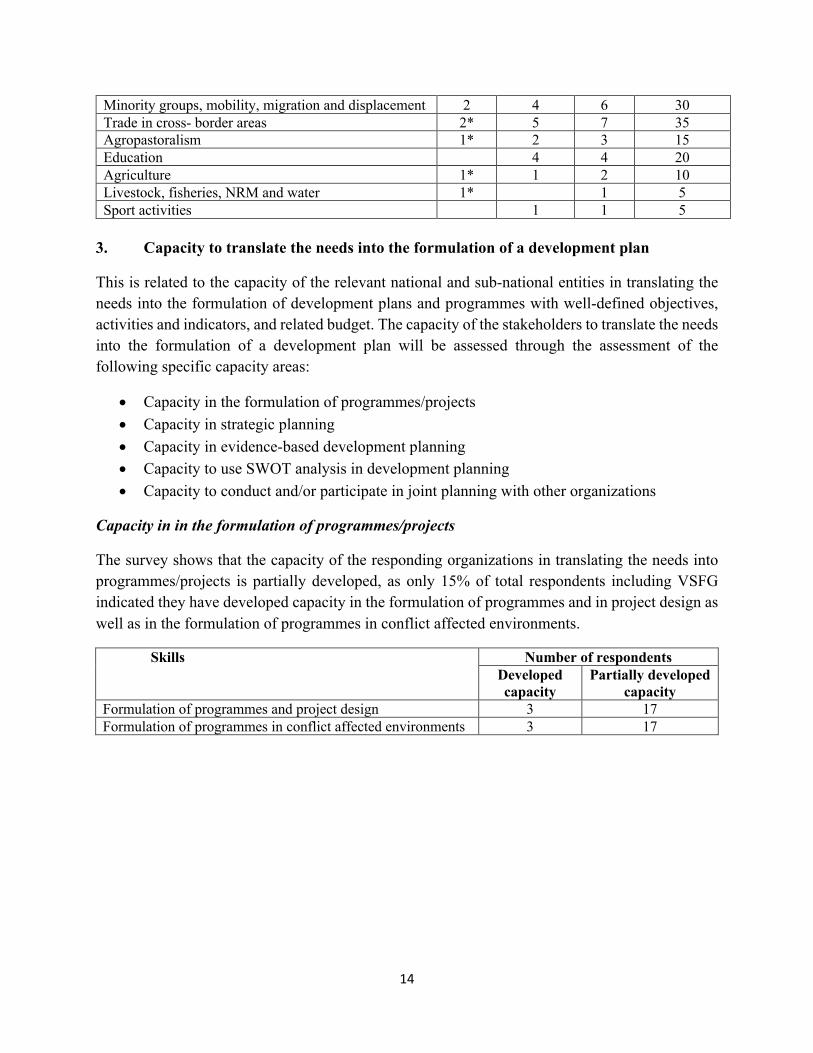
Capacity in the design of the tools of primary data
The capacity of stakeholders in the design of the tools of primary data is way less developed than their capacity in the collection of secondary data. In spite of the fact that most of the respondents (90%) indicated that they were trained in needs assessment, only few (25%) including VSFG, who are all from Marsabit, Kenya considers having a developed capacity in the design of the tools for primary data collection, namely: Key informant interviews, Focus groups, Community group discussion and Quantitative surveys. All respondents from Borena and Dawa have a partially developed capacity. Also, the majority of the organizations (55%) does not have the capacity to recruit and deploy assessment teams at rapidly/in a short notice.
Capacity in the design of the tools of primary data collection
Tools of primary data collection Number of respondents Developed capacity
Partially developed capacity
Key informant interviews 5 15 Focus groups 6 14 Community group discussion 5 15 Quantitative surveys 4 16
0,00%
20,00%
40,00%
60,00%
80,00%
100,00%
120,00%
Borena Dawa Marsabit Total cluster
Capacity in the collection of secondary Data
Developed Capacity Partially Developed Capacity

13
Cross-border cooperation and coordination in needs assessment
All interviewed organizations declared having experience in conducting or participating in joint needs assessments with another organization in the same geographical area, as well as having conducted joint needs assessment in cross-border areas (with another organization on the other side of the border). Cooperation in joint cross-border needs assessments was concentrated mainly on the following thematic areas/sectors according to priority: Cross-border conflict, peace and security; Gender equality, youth and development; Health, water and sanitation; and Minority groups, mobility, migration and displacement. In this respect, it is worth mentioning that all organizations in the thematic area of cross-border conflict, peace and security and almost those in gender equality, youth and development are conducting joint needs assessments in cross-border areas. This is less evident in trade, health, water and sanitation, agriculture and agropastoralism. It should be noted that stakeholders cover one or several thematic areas. As to VSF Germany, it conducted the needs assessments in five thematic areas, namely: Gender equality, youth and development, Trade in cross- border areas, agriculture, agropastoralism and Livestock, fisheries, NRM and water. The following table presents the most important areas/sectors that were addressed in cross-border joint needs assessments by the stakeholders in Kenya and Ethiopia.
Most important thematic areas/sectors covered in cross-border joint needs assessments
Number of organizations conducting needs assessment
in cross-border areas
Percent in total
respondents Thematic area/sector Kenya Ethiopia Total Cross-border conflict, peace and security 2 7 9 45 Gender equality, youth and development 2* 7 9 45 Health, water and sanitation 1 9 10 50
0%
10%
20%
30%
40%
50%
60%
70%
80%
90%
Key informant interviews Focus groups Community groupdiscussion
Quantitative surveys
Capacity in Designing the Tools for Primary Data Collection
Developed capacity Partially developed capacity
14
Minority groups, mobility, migration and displacement 2 4 6 30 Trade in cross- border areas 2* 5 7 35 Agropastoralism 1* 2 3 15 Education 4 4 20 Agriculture 1* 1 2 10 Livestock, fisheries, NRM and water 1* 1 5 Sport activities 1 1 5
3. Capacity to translate the needs into the formulation of a development plan
This is related to the capacity of the relevant national and sub-national entities in translating the needs into the formulation of development plans and programmes with well-defined objectives, activities and indicators, and related budget. The capacity of the stakeholders to translate the needs into the formulation of a development plan will be assessed through the assessment of the following specific capacity areas:
• Capacity in the formulation of programmes/projects • Capacity in strategic planning • Capacity in evidence-based development planning • Capacity to use SWOT analysis in development planning • Capacity to conduct and/or participate in joint planning with other organizations
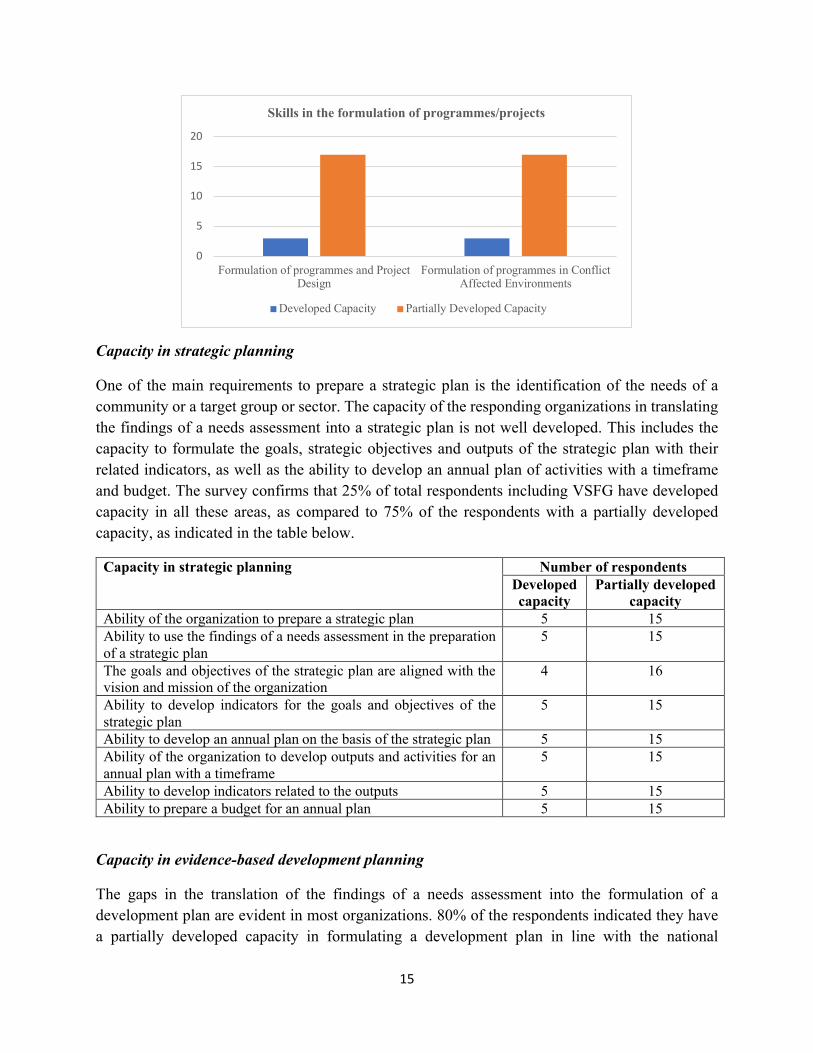
Capacity in in the formulation of programmes/projects
The survey shows that the capacity of the responding organizations in translating the needs into programmes/projects is partially developed, as only 15% of total respondents including VSFG indicated they have developed capacity in the formulation of programmes and in project design as well as in the formulation of programmes in conflict affected environments.
Skills Number of respondents Developed capacity
Partially developed capacity
Formulation of programmes and project design 3 17 Formulation of programmes in conflict affected environments 3 17
15
Capacity in strategic planning
One of the main requirements to prepare a strategic plan is the identification of the needs of a community or a target group or sector. The capacity of the responding organizations in translating the findings of a needs assessment into a strategic plan is not well developed. This includes the capacity to formulate the goals, strategic objectives and outputs of the strategic plan with their related indicators, as well as the ability to develop an annual plan of activities with a timeframe and budget. The survey confirms that 25% of total respondents including VSFG have developed capacity in all these areas, as compared to 75% of the respondents with a partially developed capacity, as indicated in the table below.
Capacity in strategic planning Number of respondents Developed capacity
Partially developed capacity
Ability of the organization to prepare a strategic plan 5 15 Ability to use the findings of a needs assessment in the preparation of a strategic plan
5 15
The goals and objectives of the strategic plan are aligned with the vision and mission of the organization
4
16
Ability to develop indicators for the goals and objectives of the strategic plan
5 15
Ability to develop an annual plan on the basis of the strategic plan 5 15 Ability of the organization to develop outputs and activities for an annual plan with a timeframe
5 15
Ability to develop indicators related to the outputs 5 15 Ability to prepare a budget for an annual plan 5 15
Capacity in evidence-based development planning
The gaps in the translation of the findings of a needs assessment into the formulation of a development plan are evident in most organizations. 80% of the respondents indicated they have a partially developed capacity in formulating a development plan in line with the national
0
5
10
15
20
Formulation of programmes and ProjectDesign
Formulation of programmes in ConflictAffected Environments
Skills in the formulation of programmes/projects
Developed Capacity Partially Developed Capacity
16
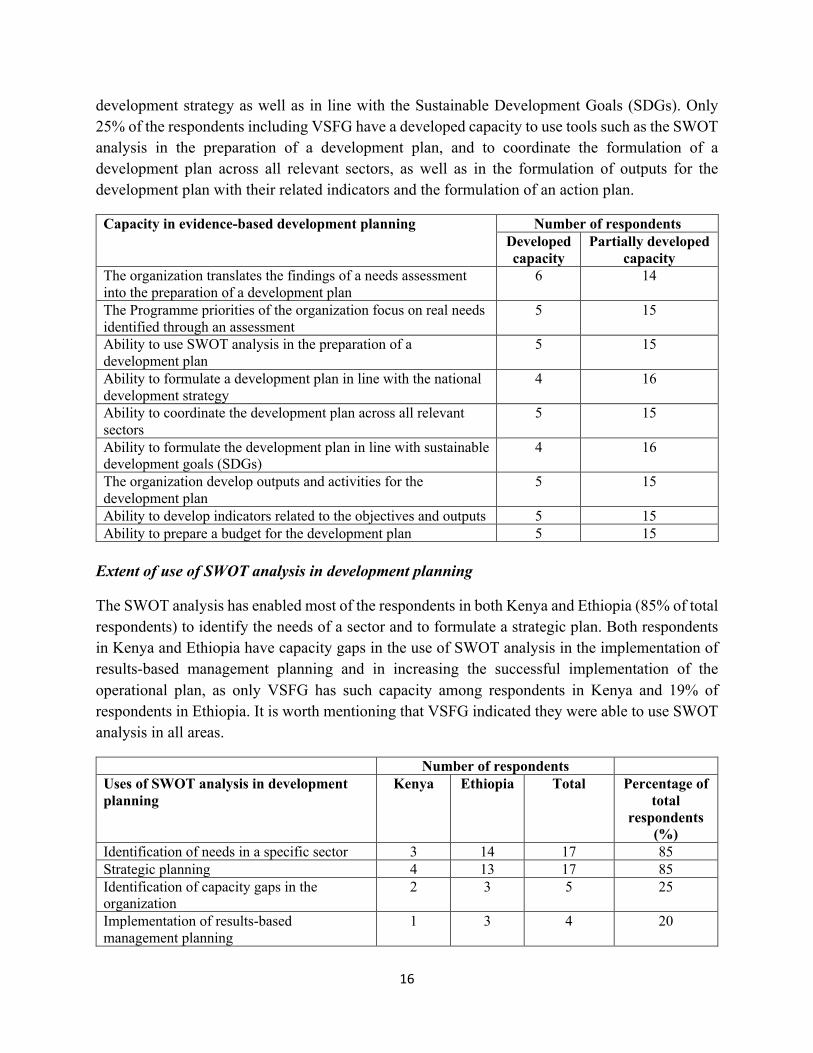
development strategy as well as in line with the Sustainable Development Goals (SDGs). Only 25% of the respondents including VSFG have a developed capacity to use tools such as the SWOT analysis in the preparation of a development plan, and to coordinate the formulation of a development plan across all relevant sectors, as well as in the formulation of outputs for the development plan with their related indicators and the formulation of an action plan.
Capacity in evidence-based development planning Number of respondents Developed capacity
Partially developed capacity
The organization translates the findings of a needs assessment into the preparation of a development plan
6 14
The Programme priorities of the organization focus on real needs identified through an assessment
5 15
Ability to use SWOT analysis in the preparation of a development plan
5 15
Ability to formulate a development plan in line with the national development strategy
4 16
Ability to coordinate the development plan across all relevant sectors
5 15
Ability to formulate the development plan in line with sustainable development goals (SDGs)
4 16
The organization develop outputs and activities for the development plan
5 15
Ability to develop indicators related to the objectives and outputs 5 15 Ability to prepare a budget for the development plan 5 15
Extent of use of SWOT analysis in development planning
The SWOT analysis has enabled most of the respondents in both Kenya and Ethiopia (85% of total respondents) to identify the needs of a sector and to formulate a strategic plan. Both respondents in Kenya and Ethiopia have capacity gaps in the use of SWOT analysis in the implementation of results-based management planning and in increasing the successful implementation of the operational plan, as only VSFG has such capacity among respondents in Kenya and 19% of respondents in Ethiopia. It is worth mentioning that VSFG indicated they were able to use SWOT analysis in all areas.
Number of respondents Uses of SWOT analysis in development planning
Kenya Ethiopia Total Percentage of total
respondents (%)
Identification of needs in a specific sector 3 14 17 85 Strategic planning 4 13 17 85 Identification of capacity gaps in the organization
2 3 5 25
Implementation of results-based management planning
1 3 4 20
17
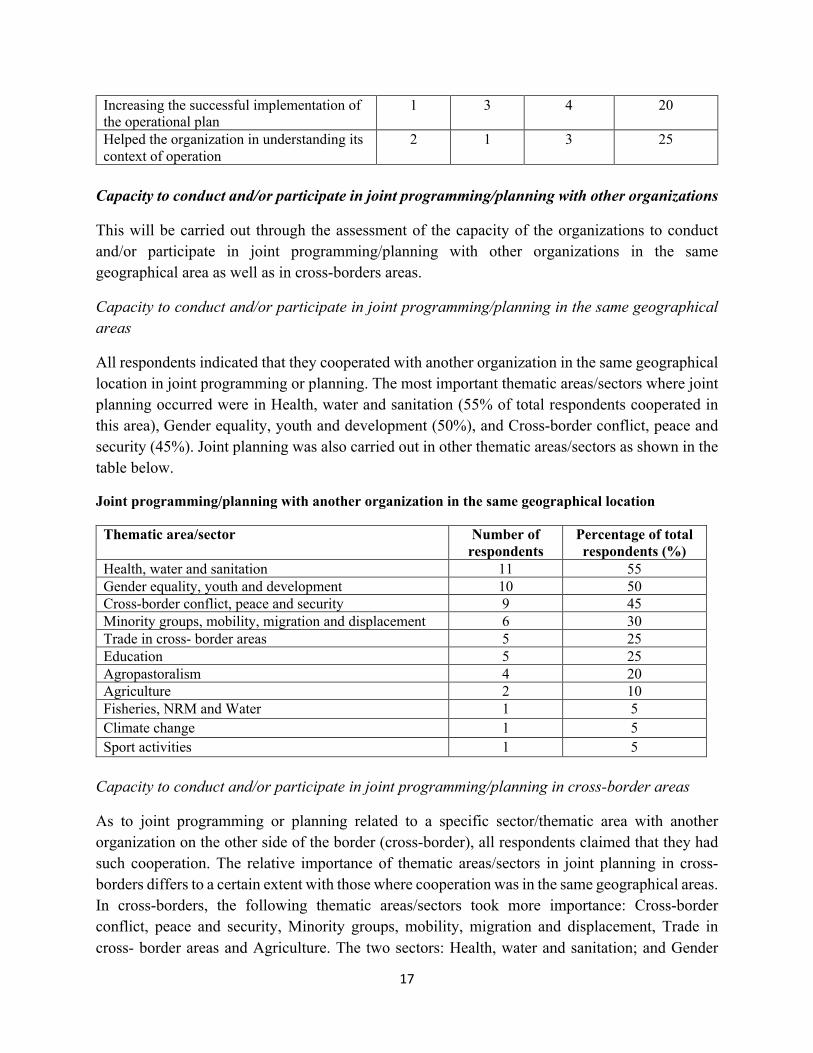
Increasing the successful implementation of the operational plan
1 3 4 20
Helped the organization in understanding its context of operation
2 1 3 25
Capacity to conduct and/or participate in joint programming/planning with other organizations
This will be carried out through the assessment of the capacity of the organizations to conduct and/or participate in joint programming/planning with other organizations in the same geographical area as well as in cross-borders areas.
Capacity to conduct and/or participate in joint programming/planning in the same geographical areas
All respondents indicated that they cooperated with another organization in the same geographical location in joint programming or planning. The most important thematic areas/sectors where joint planning occurred were in Health, water and sanitation (55% of total respondents cooperated in this area), Gender equality, youth and development (50%), and Cross-border conflict, peace and security (45%). Joint planning was also carried out in other thematic areas/sectors as shown in the table below.
Joint programming/planning with another organization in the same geographical location
Thematic area/sector Number of respondents
Percentage of total respondents (%)
Health, water and sanitation 11 55 Gender equality, youth and development 10 50 Cross-border conflict, peace and security 9 45 Minority groups, mobility, migration and displacement 6 30 Trade in cross- border areas 5 25 Education 5 25 Agropastoralism 4 20 Agriculture 2 10 Fisheries, NRM and Water 1 5 Climate change 1 5 Sport activities 1 5
Capacity to conduct and/or participate in joint programming/planning in cross-border areas
As to joint programming or planning related to a specific sector/thematic area with another organization on the other side of the border (cross-border), all respondents claimed that they had such cooperation. The relative importance of thematic areas/sectors in joint planning in cross-borders differs to a certain extent with those where cooperation was in the same geographical areas. In cross-borders, the following thematic areas/sectors took more importance: Cross-border conflict, peace and security, Minority groups, mobility, migration and displacement, Trade in cross- border areas and Agriculture. The two sectors: Health, water and sanitation; and Gender
18
equality, youth and development are of equal importance with regard to cooperation in the same geographical location or across borders.
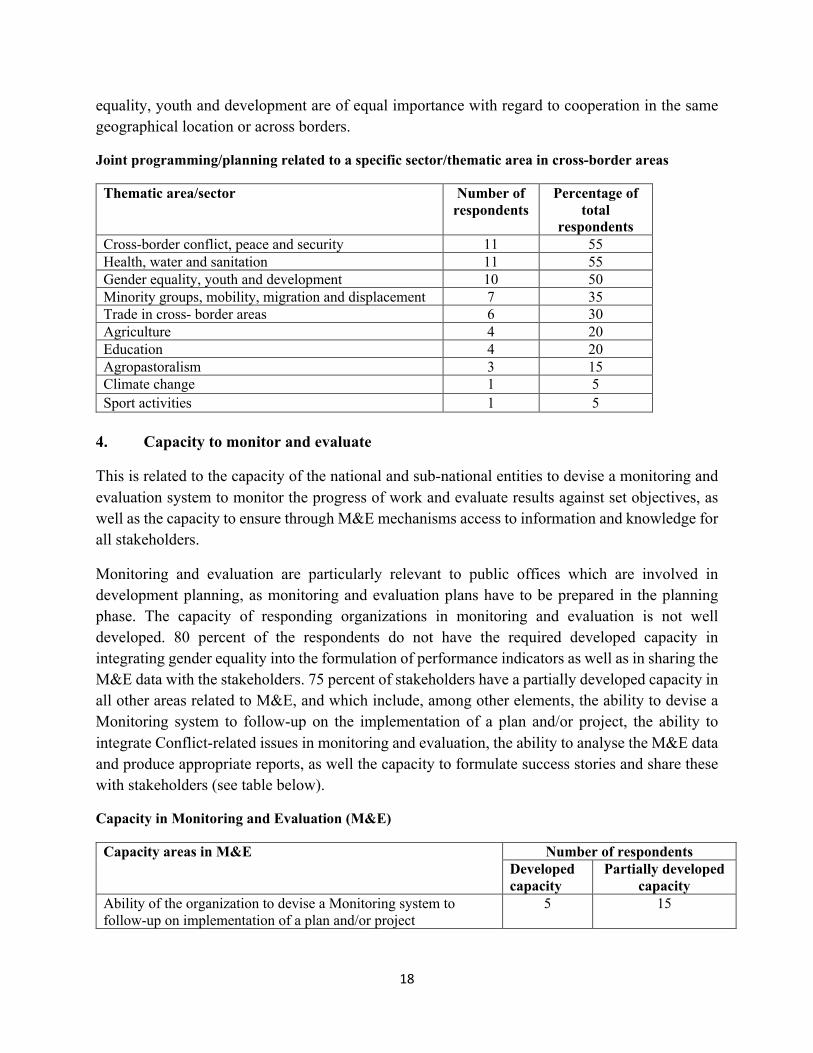
Joint programming/planning related to a specific sector/thematic area in cross-border areas
Thematic area/sector Number of respondents
Percentage of total
respondents Cross-border conflict, peace and security 11 55 Health, water and sanitation 11 55 Gender equality, youth and development 10 50 Minority groups, mobility, migration and displacement 7 35 Trade in cross- border areas 6 30 Agriculture 4 20 Education 4 20 Agropastoralism 3 15 Climate change 1 5 Sport activities 1 5
4. Capacity to monitor and evaluate
This is related to the capacity of the national and sub-national entities to devise a monitoring and evaluation system to monitor the progress of work and evaluate results against set objectives, as well as the capacity to ensure through M&E mechanisms access to information and knowledge for all stakeholders.
Monitoring and evaluation are particularly relevant to public offices which are involved in development planning, as monitoring and evaluation plans have to be prepared in the planning phase. The capacity of responding organizations in monitoring and evaluation is not well developed. 80 percent of the respondents do not have the required developed capacity in integrating gender equality into the formulation of performance indicators as well as in sharing the M&E data with the stakeholders. 75 percent of stakeholders have a partially developed capacity in all other areas related to M&E, and which include, among other elements, the ability to devise a Monitoring system to follow-up on the implementation of a plan and/or project, the ability to integrate Conflict-related issues in monitoring and evaluation, the ability to analyse the M&E data and produce appropriate reports, as well the capacity to formulate success stories and share these with stakeholders (see table below).
Capacity in Monitoring and Evaluation (M&E)
Capacity areas in M&E Number of respondents Developed capacity
Partially developed capacity
Ability of the organization to devise a Monitoring system to follow-up on implementation of a plan and/or project
5 15
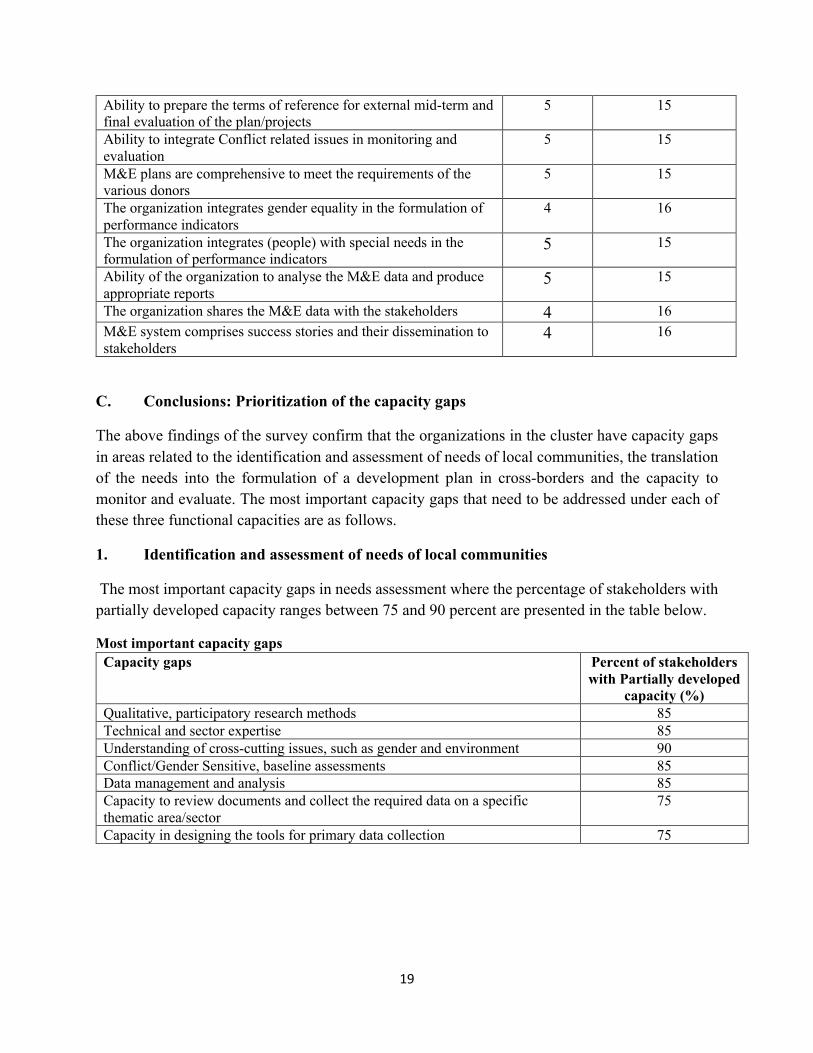
19
Ability to prepare the terms of reference for external mid-term and final evaluation of the plan/projects
5 15
Ability to integrate Conflict related issues in monitoring and evaluation
5 15
M&E plans are comprehensive to meet the requirements of the various donors
5 15
The organization integrates gender equality in the formulation of performance indicators
4 16
The organization integrates (people) with special needs in the formulation of performance indicators
5 15
Ability of the organization to analyse the M&E data and produce appropriate reports
5 15
The organization shares the M&E data with the stakeholders 4 16 M&E system comprises success stories and their dissemination to stakeholders
4 16
C. Conclusions: Prioritization of the capacity gaps
The above findings of the survey confirm that the organizations in the cluster have capacity gaps in areas related to the identification and assessment of needs of local communities, the translation of the needs into the formulation of a development plan in cross-borders and the capacity to monitor and evaluate. The most important capacity gaps that need to be addressed under each of these three functional capacities are as follows.
1. Identification and assessment of needs of local communities
The most important capacity gaps in needs assessment where the percentage of stakeholders with partially developed capacity ranges between 75 and 90 percent are presented in the table below.
Most important capacity gaps Capacity gaps Percent of stakeholders
with Partially developed capacity (%)
Qualitative, participatory research methods 85 Technical and sector expertise 85 Understanding of cross-cutting issues, such as gender and environment 90 Conflict/Gender Sensitive, baseline assessments 85 Data management and analysis 85 Capacity to review documents and collect the required data on a specific thematic area/sector
75
Capacity in designing the tools for primary data collection 75
20
2. Translation of the needs into the formulation of a development plan in cross-border areas
The most important capacity gaps in the formulation of a development plan in cross-border areas where the percentage of stakeholders with partially developed capacity ranges between 75 and 85 percent are presented in the table below. It is worth mentioning that VSFG indicated to have developed capacity in all these areas.
Capacity gaps Percent of stakeholders with Partially developed
capacity (%) Skills in the formulation of programmes and in project design 85 Capacity of the organization in strategic planning 75 Capacity of the organization in evidence-based development planning 75 Ability to mobilize stakeholders in the preparation of a strategic plan 75 Ability to mobilize stakeholders in the preparation of a development plan 75 Identification of capacity gaps in the organization through SWOT analysis 75 Implementation of results-based management planning through SWOT analysis 80
3. Monitoring and evaluation
All capacity areas in Monitoring and Evaluation (as identified in the part related to M&E) are considered gaps that should be addressed, as on average 75% of stakeholders have partially developed capacity. The other capacity gap is in terms of sharing data with other stakeholders and the public across borders.
Capacity gaps in M&E Percent of stakeholders with Partially developed capacity (%)
Sharing data across borders 80 Capacity to monitor and evaluate 75
The identified capacity gaps will inform the capacity development responses/plan that will be prepared in a separate report. The capacity development plan will prioritize the interventions in the short, medium and long-term responses.
21
III. CAPACITY GAPS IN NEEDS ASSESSMENT AND PLANNING IN CLUSTER III
A. Characteristics of the sample
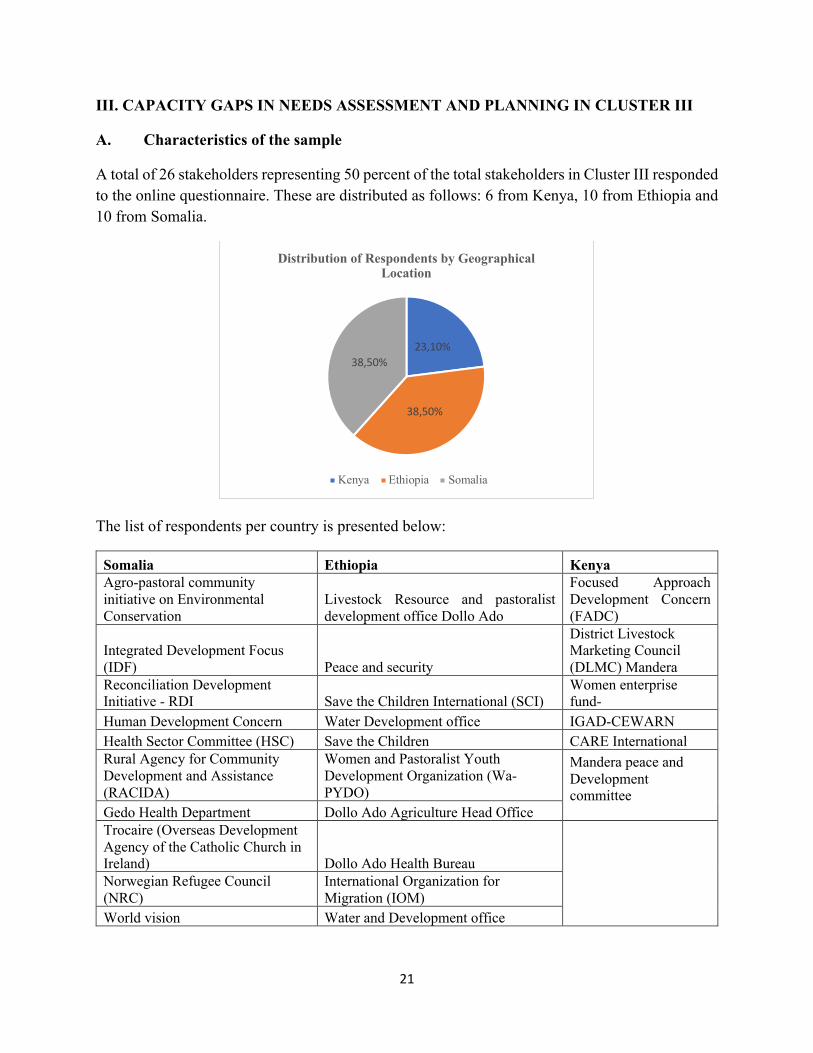
A total of 26 stakeholders representing 50 percent of the total stakeholders in Cluster III responded to the online questionnaire. These are distributed as follows: 6 from Kenya, 10 from Ethiopia and 10 from Somalia.
The list of respondents per country is presented below:
Somalia Ethiopia Kenya Agro-pastoral community initiative on Environmental Conservation
Livestock Resource and pastoralist development office Dollo Ado
Focused Approach Development Concern (FADC)
Integrated Development Focus (IDF) Peace and security
District Livestock Marketing Council (DLMC) Mandera
Reconciliation Development Initiative - RDI Save the Children International (SCI)
Women enterprise fund-
Human Development Concern Water Development office IGAD-CEWARN Health Sector Committee (HSC) Save the Children CARE International Rural Agency for Community Development and Assistance (RACIDA)
Women and Pastoralist Youth Development Organization (Wa-PYDO)
Mandera peace and Development committee Gedo Health Department Dollo Ado Agriculture Head Office
Trocaire (Overseas Development Agency of the Catholic Church in Ireland) Dollo Ado Health Bureau
Norwegian Refugee Council (NRC)
International Organization for Migration (IOM)
World vision Water and Development office
23,10%
38,50%
38,50%
Distribution of Respondents by Geographical Location
Kenya Ethiopia Somalia
22
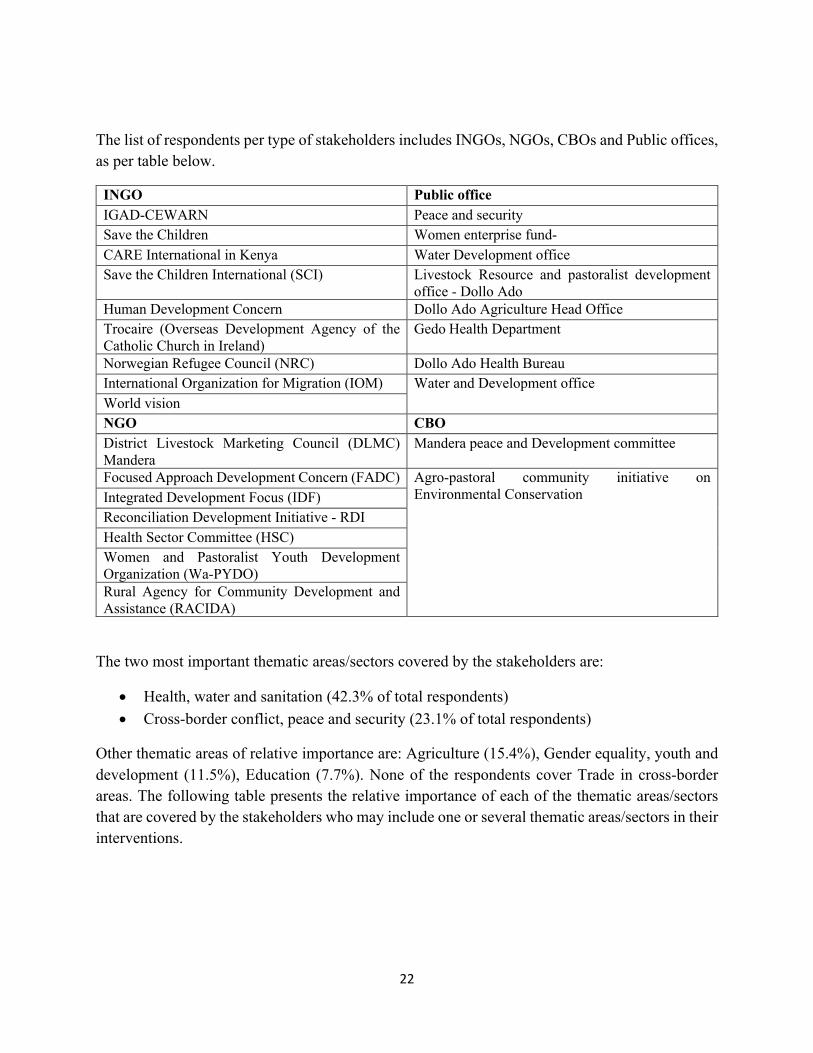
The list of respondents per type of stakeholders includes INGOs, NGOs, CBOs and Public offices, as per table below.
INGO Public office IGAD-CEWARN Peace and security Save the Children Women enterprise fund- CARE International in Kenya Water Development office Save the Children International (SCI) Livestock Resource and pastoralist development
office - Dollo Ado Human Development Concern Dollo Ado Agriculture Head Office Trocaire (Overseas Development Agency of the Catholic Church in Ireland)
Gedo Health Department
Norwegian Refugee Council (NRC) Dollo Ado Health Bureau International Organization for Migration (IOM) Water and Development office World vision NGO CBO District Livestock Marketing Council (DLMC) Mandera
Mandera peace and Development committee
Focused Approach Development Concern (FADC) Agro-pastoral community initiative on Environmental Conservation Integrated Development Focus (IDF)
Reconciliation Development Initiative - RDI Health Sector Committee (HSC) Women and Pastoralist Youth Development Organization (Wa-PYDO) Rural Agency for Community Development and Assistance (RACIDA)
The two most important thematic areas/sectors covered by the stakeholders are:
• Health, water and sanitation (42.3% of total respondents) • Cross-border conflict, peace and security (23.1% of total respondents)
Other thematic areas of relative importance are: Agriculture (15.4%), Gender equality, youth and development (11.5%), Education (7.7%). None of the respondents cover Trade in cross-border areas. The following table presents the relative importance of each of the thematic areas/sectors that are covered by the stakeholders who may include one or several thematic areas/sectors in their interventions.
23
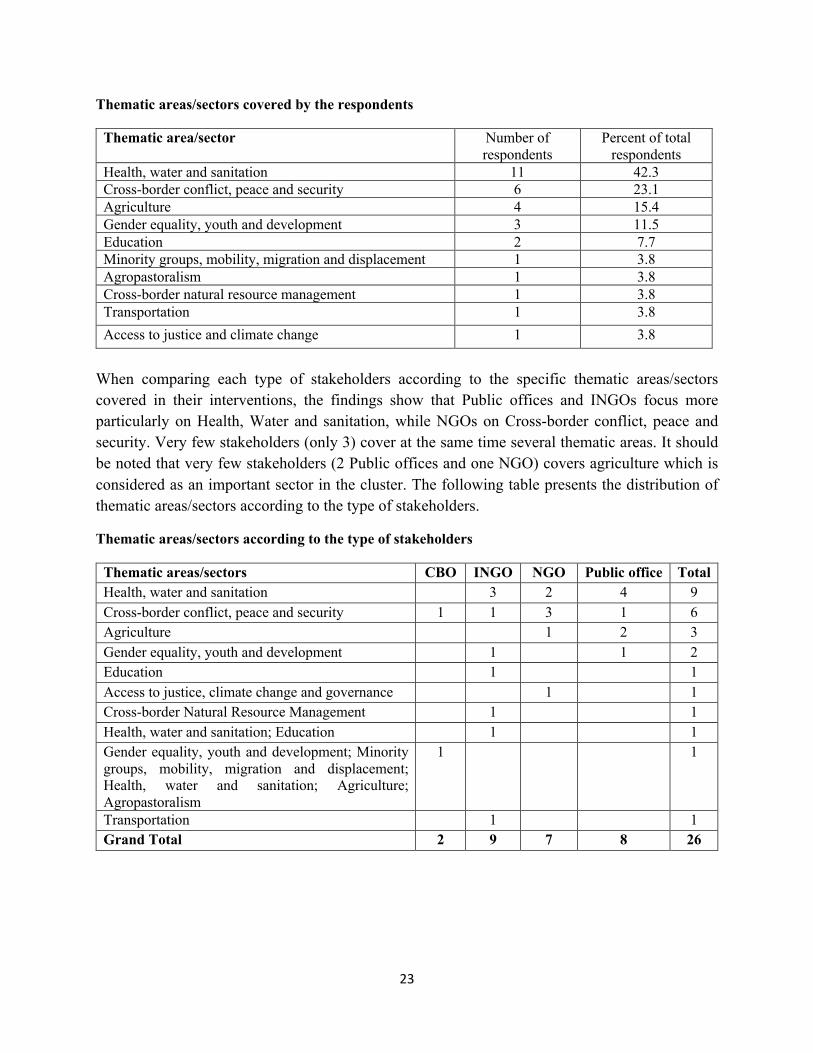
Thematic areas/sectors covered by the respondents
Thematic area/sector Number of respondents
Percent of total respondents
Health, water and sanitation 11 42.3 Cross-border conflict, peace and security 6 23.1 Agriculture 4 15.4 Gender equality, youth and development 3 11.5 Education 2 7.7 Minority groups, mobility, migration and displacement 1 3.8 Agropastoralism 1 3.8 Cross-border natural resource management 1 3.8 Transportation 1 3.8 Access to justice and climate change 1 3.8
When comparing each type of stakeholders according to the specific thematic areas/sectors covered in their interventions, the findings show that Public offices and INGOs focus more particularly on Health, Water and sanitation, while NGOs on Cross-border conflict, peace and security. Very few stakeholders (only 3) cover at the same time several thematic areas. It should be noted that very few stakeholders (2 Public offices and one NGO) covers agriculture which is considered as an important sector in the cluster. The following table presents the distribution of thematic areas/sectors according to the type of stakeholders.
Thematic areas/sectors according to the type of stakeholders
Thematic areas/sectors CBO INGO NGO Public office Total Health, water and sanitation 3 2 4 9 Cross-border conflict, peace and security 1 1 3 1 6 Agriculture 1 2 3 Gender equality, youth and development
1
1 2
Education
1
1 Access to justice, climate change and governance
1
1
Cross-border Natural Resource Management
1
1 Health, water and sanitation; Education
1
1
Gender equality, youth and development; Minority groups, mobility, migration and displacement; Health, water and sanitation; Agriculture; Agropastoralism
1
1
Transportation
1
1 Grand Total 2 9 7 8 26
24
B. The capacity gaps
The capacity gaps in needs assessment and planning will be identified through the assessment of the four functional capacities of stakeholders:
• Capacity to engage stakeholders in the design and implementation of needs assessment and local development planning
• Capacity to identify and assess needs of local communities • Capacity to translate the needs into the formulation of a development plan • Capacity to monitor and evaluate
1. Capacity to engage stakeholders in the design and implementation of needs assessment and local development planning
This is related to the capacity of the organization to engage relevant stakeholders in the identification and assessment of needs of beneficiaries in the cross-border cluster as well as the capacity to develop accountability mechanisms that ensure multi-stakeholder participation and a free flow of knowledge and information among partners and stakeholders. This includes sharing of data and information with the public that would ensure transparency and accountability. Such participation will ensure ownership of the assessment by partners and stakeholders.
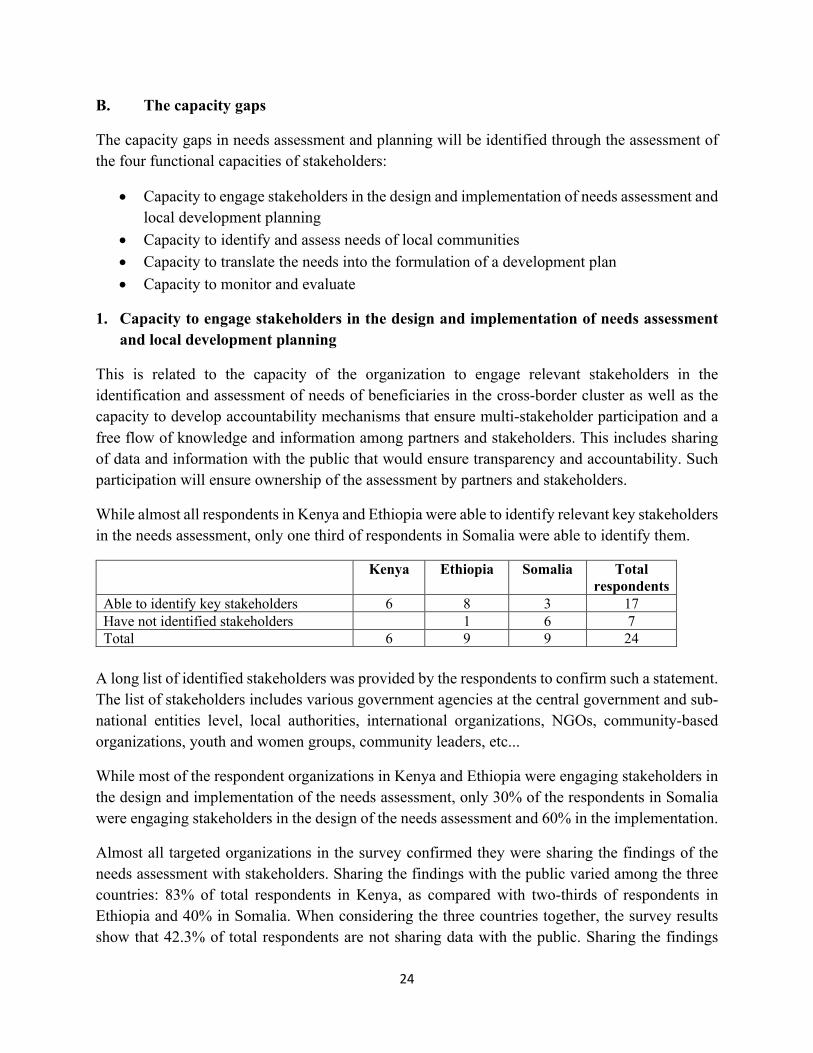
While almost all respondents in Kenya and Ethiopia were able to identify relevant key stakeholders in the needs assessment, only one third of respondents in Somalia were able to identify them.
Kenya Ethiopia Somalia Total respondents
Able to identify key stakeholders 6 8 3 17 Have not identified stakeholders 1 6 7 Total 6 9 9 24
A long list of identified stakeholders was provided by the respondents to confirm such a statement. The list of stakeholders includes various government agencies at the central government and sub-national entities level, local authorities, international organizations, NGOs, community-based organizations, youth and women groups, community leaders, etc...
While most of the respondent organizations in Kenya and Ethiopia were engaging stakeholders in the design and implementation of the needs assessment, only 30% of the respondents in Somalia were engaging stakeholders in the design of the needs assessment and 60% in the implementation.
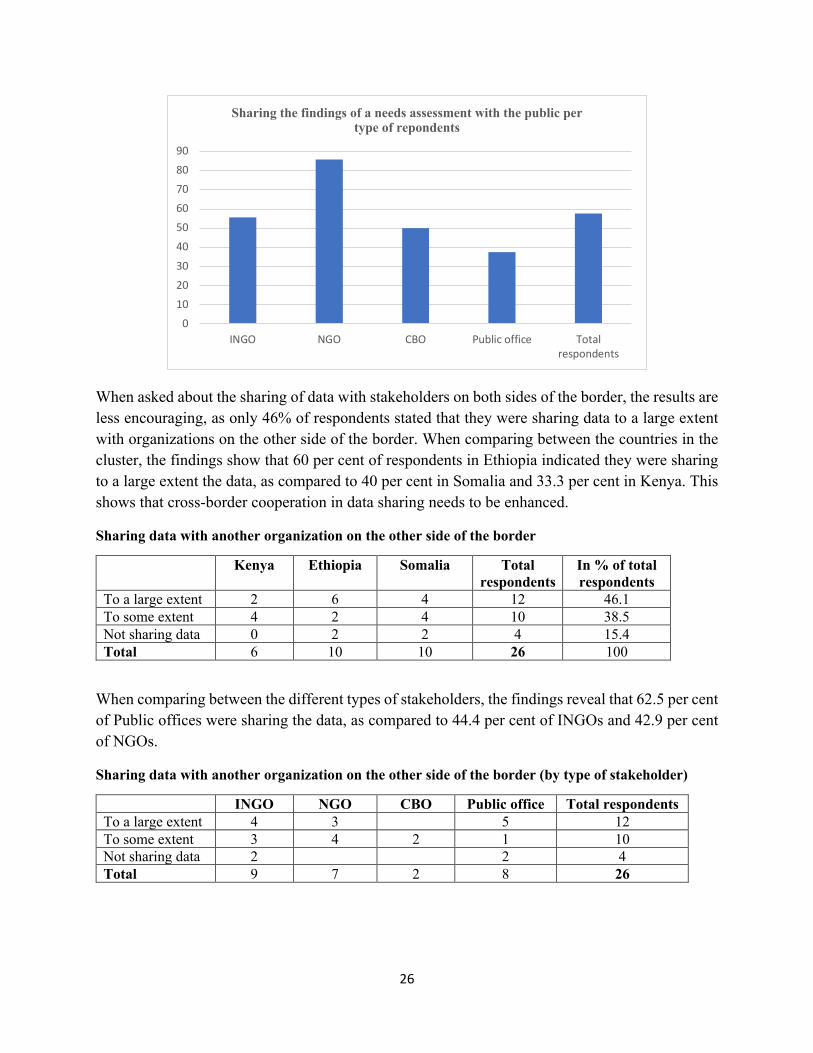
Almost all targeted organizations in the survey confirmed they were sharing the findings of the needs assessment with stakeholders. Sharing the findings with the public varied among the three countries: 83% of total respondents in Kenya, as compared with two-thirds of respondents in Ethiopia and 40% in Somalia. When considering the three countries together, the survey results show that 42.3% of total respondents are not sharing data with the public. Sharing the findings

25
with the public varied also among the different types of stakeholders: only 37.5 percent of Public offices as compared to 85.7 percent of NGOs and 55.6 percent of INGOs. Sharing the findings of an assessment with the public is an important transparency issue to be considered in support to capacity development of the organizations in the Cluster.
Sharing the findings of the assessment with stakeholders and the public
Kenya Ethiopia Somalia Total respondents
In % of total sample
Sharing the findings of the assessment with stakeholders
6 9 7 22 84.6
Sharing the findings of the assessment with the public
5 6 4 15 57.7
Sharing the findings of the assessment with stakeholders and the public per type of respondents
INGO NGO CBO Public office
Total respondents
Sharing the findings of the assessment with stakeholders
7 6 1 8 22
Sharing the findings of the assessment with the public
5 6 1 3 15
Percent of stakeholders who share the findings of the assessment with the public (%)
55.6 85.7 50 37.5
57.7
Total respondents 9 7 2 8 26
0
1020
30
40
50
6070
80
90
Sharing the findings of the assessment withstakeholders
Sharing the findings of the assessment with thepublic
Sharing the findings of the assessment
In percent of total sample
26
When asked about the sharing of data with stakeholders on both sides of the border, the results are less encouraging, as only 46% of respondents stated that they were sharing data to a large extent with organizations on the other side of the border. When comparing between the countries in the cluster, the findings show that 60 per cent of respondents in Ethiopia indicated they were sharing to a large extent the data, as compared to 40 per cent in Somalia and 33.3 per cent in Kenya. This shows that cross-border cooperation in data sharing needs to be enhanced.
Sharing data with another organization on the other side of the border
Kenya Ethiopia Somalia Total respondents
In % of total respondents
To a large extent 2 6 4 12 46.1 To some extent 4 2 4 10 38.5 Not sharing data 0 2 2 4 15.4 Total 6 10 10 26 100
When comparing between the different types of stakeholders, the findings reveal that 62.5 per cent of Public offices were sharing the data, as compared to 44.4 per cent of INGOs and 42.9 per cent of NGOs.
Sharing data with another organization on the other side of the border (by type of stakeholder)
INGO NGO CBO Public office Total respondents To a large extent 4 3 5 12 To some extent 3 4 2 1 10 Not sharing data 2 2 4 Total 9 7 2 8 26
0102030
405060708090
INGO NGO CBO Public office Totalrespondents
Sharing the findings of a needs assessment with the public per type of repondents

27
The ability to mobilize stakeholders in the development of the strategic plan is less evident, as 40% of respondents in both Ethiopia and Somalia have indicated that they have partially developed capacity in this area. This also includes the ability of the responding organizations in Somalia to engage appropriate stakeholders in the provision of inputs during the planning process.
2. Capacity to identify and assess needs of local communities
Assessment will be made on the abilities of the relevant national and sub-national entities and civil society organizations to effectively access, gather, analyze and synthesize data and information, with the aim of assessing needs of target groups/beneficiaries. The assessment will include:
• The experience of the stakeholders in conducting or participating in needs assessment • Capacity of the stakeholders in the design of a needs assessment and data collection • Cross-border cooperation and coordination in needs assessment
Experience of the stakeholders in conducting or participating in needs assessment
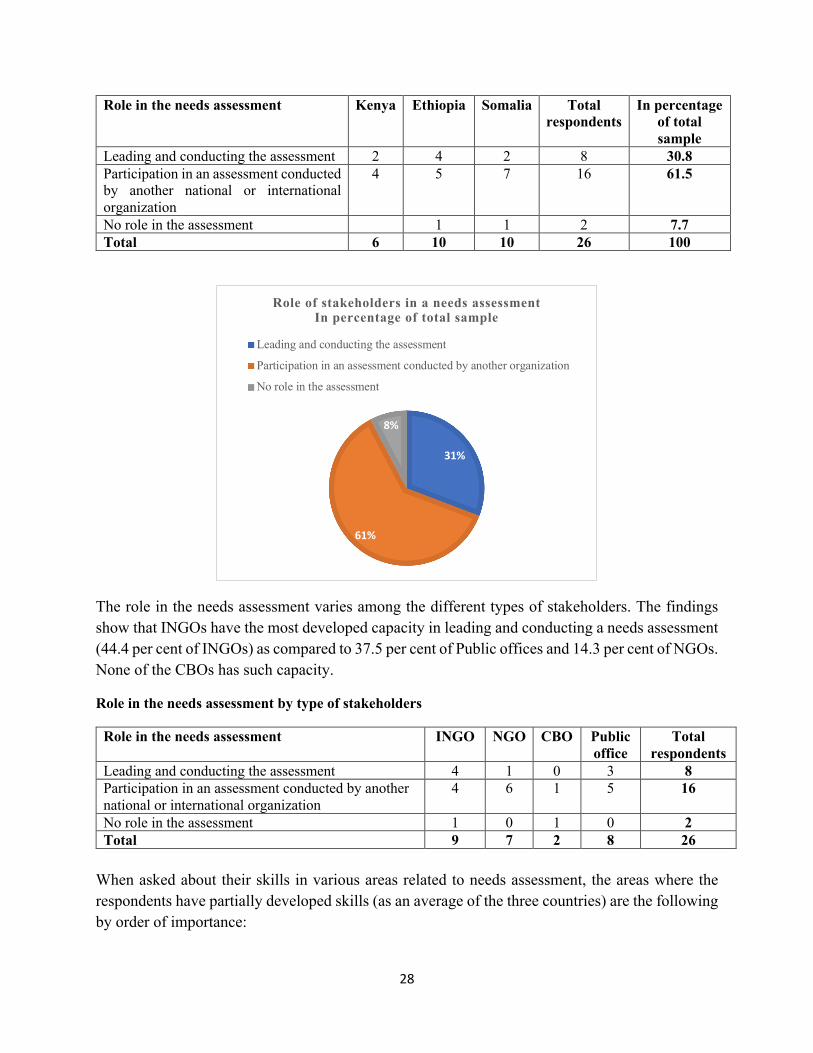
The capacity of leading a needs assessment is not quite developed in most of the organizations, as the respondents were more likely to participate in an assessment conducted by another organization rather than conducting one. Most of the respondents (61.5% of total respondents), in fact, indicated that they participated in an assessment conducted by another national or international organization, but only 30.8% was able to lead and conduct a needs assessment. Two of the respondents (7.7%) have never been involved in any needs assessment. It is worth mentioning that only 20% of the respondents in Somalia were able to lead and conduct an assessment, as compared to 40% in Ethiopia and 33% in Kenya.
46%
39%
15%
Extent of sharing data across bordersIn percentage of total sample
To a large extent To some extent Not sharing data
28
Role in the needs assessment Kenya Ethiopia Somalia Total respondents
In percentage of total sample
Leading and conducting the assessment 2 4 2 8 30.8 Participation in an assessment conducted by another national or international organization
4 5 7 16 61.5
No role in the assessment 1 1 2 7.7 Total 6 10 10 26 100
The role in the needs assessment varies among the different types of stakeholders. The findings show that INGOs have the most developed capacity in leading and conducting a needs assessment (44.4 per cent of INGOs) as compared to 37.5 per cent of Public offices and 14.3 per cent of NGOs. None of the CBOs has such capacity.
Role in the needs assessment by type of stakeholders
Role in the needs assessment INGO NGO CBO Public office
Total respondents
Leading and conducting the assessment 4 1 0 3 8 Participation in an assessment conducted by another national or international organization
4 6 1 5 16
No role in the assessment 1 0 1 0 2 Total 9 7 2 8 26
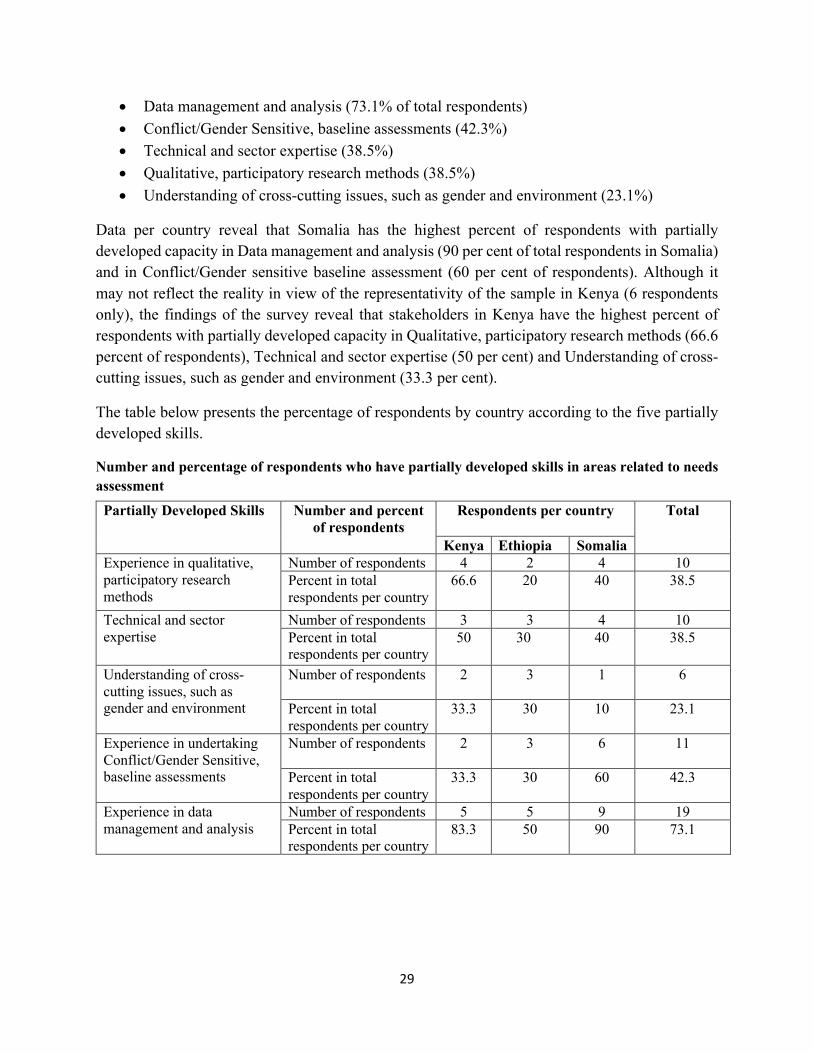
When asked about their skills in various areas related to needs assessment, the areas where the respondents have partially developed skills (as an average of the three countries) are the following by order of importance:
31%
61%
8%
Role of stakeholders in a needs assessmentIn percentage of total sample
Leading and conducting the assessment
Participation in an assessment conducted by another organization
No role in the assessment
29
• Data management and analysis (73.1% of total respondents) • Conflict/Gender Sensitive, baseline assessments (42.3%) • Technical and sector expertise (38.5%) • Qualitative, participatory research methods (38.5%) • Understanding of cross-cutting issues, such as gender and environment (23.1%)
Data per country reveal that Somalia has the highest percent of respondents with partially developed capacity in Data management and analysis (90 per cent of total respondents in Somalia) and in Conflict/Gender sensitive baseline assessment (60 per cent of respondents). Although it may not reflect the reality in view of the representativity of the sample in Kenya (6 respondents only), the findings of the survey reveal that stakeholders in Kenya have the highest percent of respondents with partially developed capacity in Qualitative, participatory research methods (66.6 percent of respondents), Technical and sector expertise (50 per cent) and Understanding of cross-cutting issues, such as gender and environment (33.3 per cent).
The table below presents the percentage of respondents by country according to the five partially developed skills.
Number and percentage of respondents who have partially developed skills in areas related to needs assessment
Partially Developed Skills Number and percent of respondents
Respondents per country Total
Kenya Ethiopia Somalia Experience in qualitative, participatory research methods
Number of respondents 4 2 4 10 Percent in total respondents per country
66.6
20
40
38.5
Technical and sector expertise
Number of respondents 3 3 4 10 Percent in total respondents per country
50 30
40
38.5
Understanding of cross-cutting issues, such as gender and environment
Number of respondents 2
3 1 6
Percent in total respondents per country
33.3
30
10
23.1
Experience in undertaking Conflict/Gender Sensitive, baseline assessments
Number of respondents 2
3 6 11
Percent in total respondents per country
33.3
30
60
42.3
Experience in data management and analysis
Number of respondents 5 5 9 19 Percent in total respondents per country
83.3
50
90
73.1

30
When comparing the level of capacity among different types of stakeholders, NGOs appear to have the highest percentage of respondents with partially developed capacity in all the skills indicated in the table below. This is followed by Public offices which have the partially developed capacity particularly in data management and analysis (62.5 per cent of respondents) and in Conflict/Gender sensitive baseline assessments (50 per cent of respondents).
Number of respondents who have partially developed skills in areas related to needs assessment per type of stakeholders
Partially Developed Skills
Number and percent of
respondents
Respondents per type of stakeholders Total INGO NGO CBO Public office
Experience in qualitative, participatory research methods
Number of respondents
2 5 2 1 10
Percent in total respondents per type of stakeholders
22.2 71.4 100 12.5 38.5
Technical and sector expertise
Number of respondents
3 3 1 3 10
Percent in total respondents per type of stakeholders
33.3
42.8 50 37.5 38.5
Understanding of cross-cutting issues, such as gender and environment
Number of respondents
3 1 1 1 6
Percent in total respondents per type of stakeholders
33.3 14.2 50 12.5 23.1
Experience in undertaking Conflict/Gender Sensitive, baseline assessments
Number of respondents
1 4 2 4 11
Percent in total respondents per type of stakeholders
11.1
57.1 100 50 42.3
00,10,20,30,40,50,60,70,80,9
1
Experience inqualitative,
participatory researchmethods
Technical and sectorexpertise
Understanding ofcross-cutting issues,such as gender and
environment
Experience inundertaking
conflict/gendersensitive, baseline
assessments
Experience in datamanagement and
analysis
Percent of stakeholders with partially developed skills by country
Kenya Ethiopia Somalia
31
Experience in data management and analysis
Number of respondents
6 6 2 5 19
Percent in total respondents per type of stakeholders
66.7 85.7 100 62.5 73.1
Capacity of the organization in the design of the tools of a needs assessment
This would include the capacity in the design of the needs assessment tools, particularly the collection of secondary data and primary data.
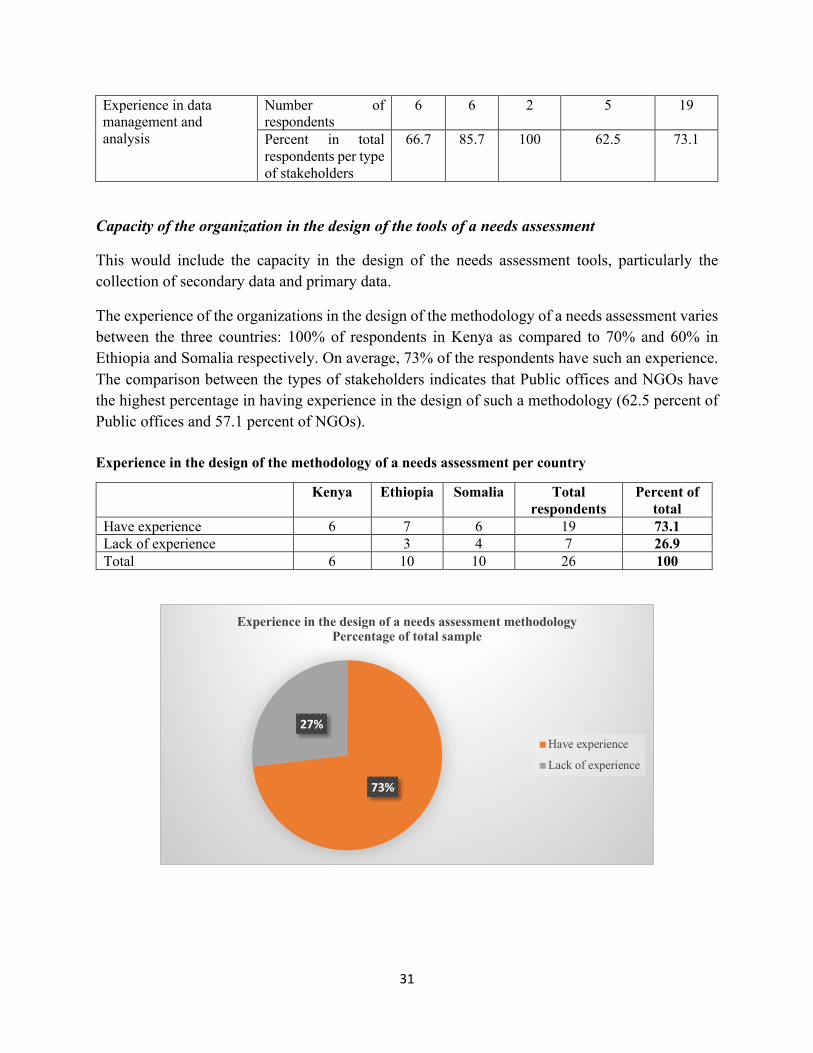
The experience of the organizations in the design of the methodology of a needs assessment varies between the three countries: 100% of respondents in Kenya as compared to 70% and 60% in Ethiopia and Somalia respectively. On average, 73% of the respondents have such an experience. The comparison between the types of stakeholders indicates that Public offices and NGOs have the highest percentage in having experience in the design of such a methodology (62.5 percent of Public offices and 57.1 percent of NGOs). Experience in the design of the methodology of a needs assessment per country
Kenya Ethiopia Somalia Total respondents
Percent of total
Have experience 6 7 6 19 73.1 Lack of experience 3 4 7 26.9 Total 6 10 10 26 100
73%
27%
Experience in the design of a needs assessment methodologyPercentage of total sample
Have experience
Lack of experience
32
Experience in the design of the methodology of a needs assessment per type of stakeholders
INGO NGO CBO Public office Total respondents
Have experience 8 4 2 5 19 Lack of experience 1 3 0 3 7 Percent of respondents with lack of experience (%)
11.1 42.9 0 37.5 26.9
Total 9 7 2 8 26
Capacity in the collection of secondary data
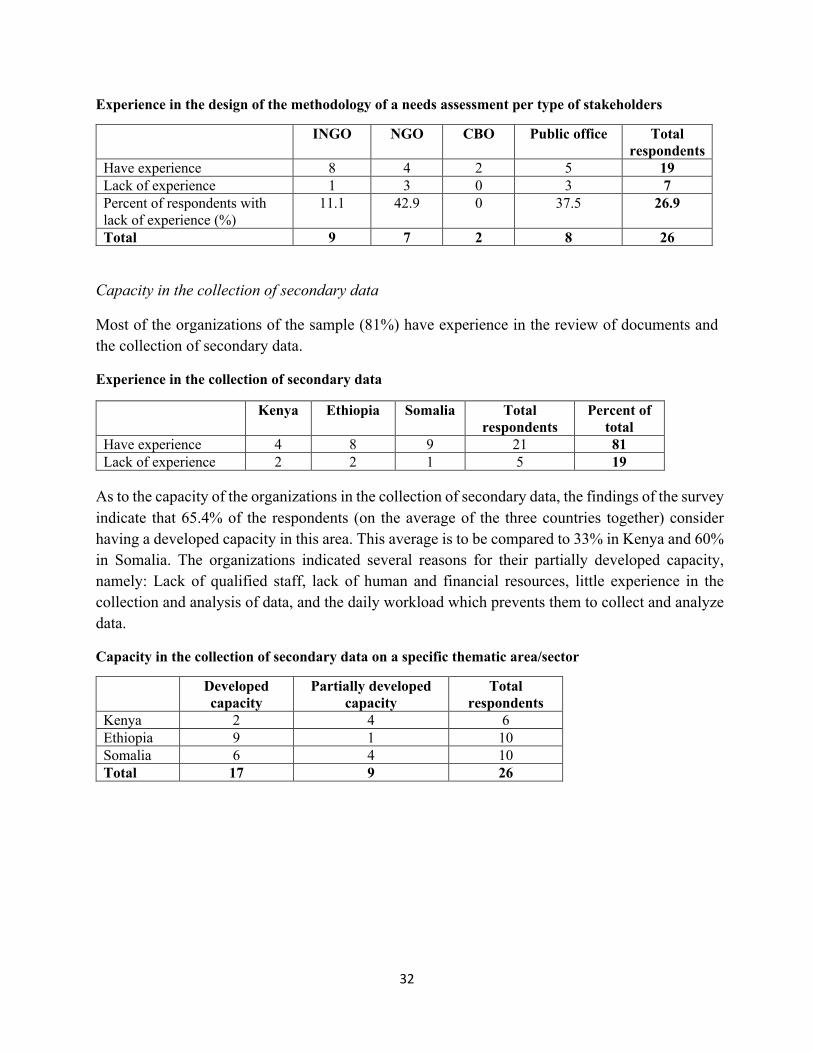
Most of the organizations of the sample (81%) have experience in the review of documents and the collection of secondary data.
Experience in the collection of secondary data
As to the capacity of the organizations in the collection of secondary data, the findings of the survey indicate that 65.4% of the respondents (on the average of the three countries together) consider having a developed capacity in this area. This average is to be compared to 33% in Kenya and 60% in Somalia. The organizations indicated several reasons for their partially developed capacity, namely: Lack of qualified staff, lack of human and financial resources, little experience in the collection and analysis of data, and the daily workload which prevents them to collect and analyze data.
Capacity in the collection of secondary data on a specific thematic area/sector
Developed capacity
Partially developed capacity
Total respondents
Kenya 2 4 6 Ethiopia 9 1 10 Somalia 6 4 10 Total 17 9 26
Kenya Ethiopia Somalia Total respondents
Percent of total
Have experience 4 8 9 21 81 Lack of experience 2 2 1 5 19

33
When comparing between different types of stakeholders, the findings of the survey reveal that NGOs have the highest percentage of respondents with partially developed capacity (71.4% of total NGO respondents), followed by CBOs (50%) and Public offices (25%).
Capacity in the collection of secondary data on a specific thematic area/sector by type of stakeholders
Developed capacity
Partially developed capacity
Percent of respondents with partially developed capacity (%)
Total respondents
INGO 8 1 11.1 9 NGO 2 5 71.4 7 CBO 1 1 50.0 2 Public office 6 2 25.0 8 Total 17 9 34.6 26
65%
35%
Percentage of total respondents
Developed capacity
Partially developed capacity
0 10 20 30 40 50 60 70 80
INGO
NGO
CBO
Public office
Total
Percentage of respondents with partially developed capacity in the collection of secondary data
34
Capacity in the design of the tools of primary data
The capacity of stakeholders in designing tools of primary data is way less developed than the capacity in collecting secondary data. While 85% of the respondents indicated that they received trainings in needs assessment, 65% consider having a developed capacity in the design of the tools for primary data collection, namely: Key informant interviews, Focus groups, Community group discussion and Quantitative surveys.
Capacity in the design of tools for primary data collection
While almost all INGOs have a developed capacity in the design of the tools for primary data collection, the percent of respondents with partially developed capacity reaches 100 per cent of CBOs, followed by NGOs (42.9%) and Public offices (37.5%).
Capacity in the design of tools for primary data collection by type of stakeholders
Cross-border cooperation and coordination in needs assessment
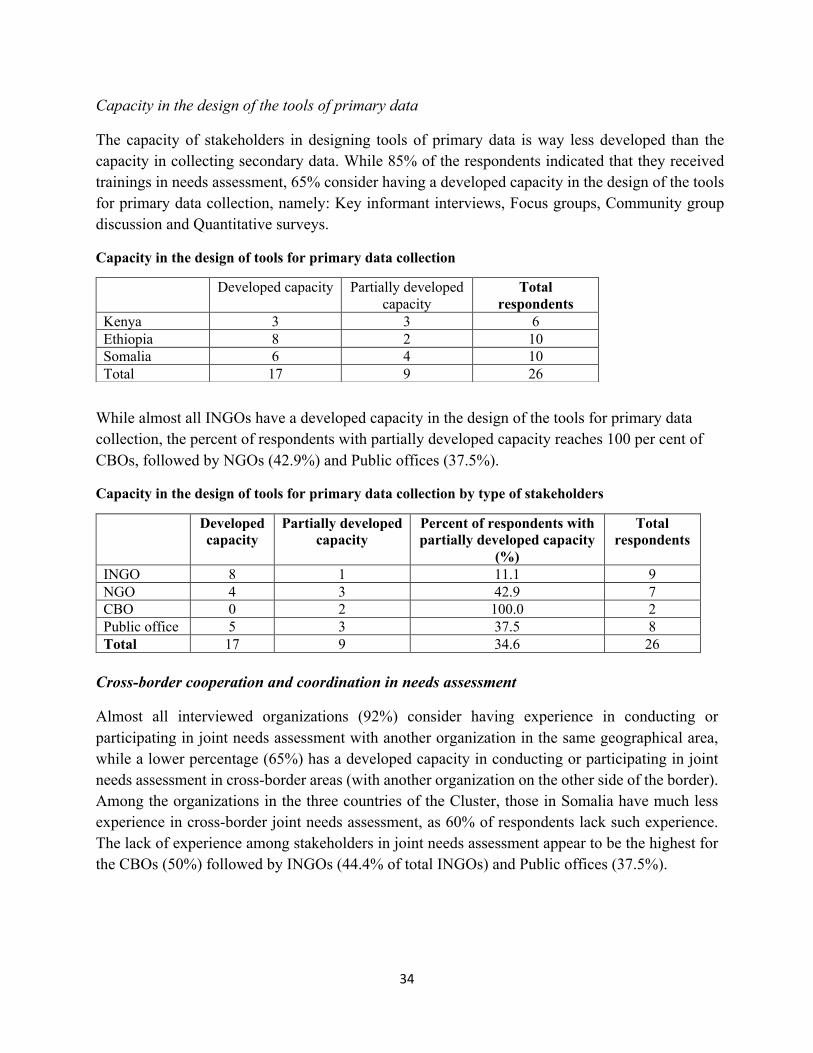
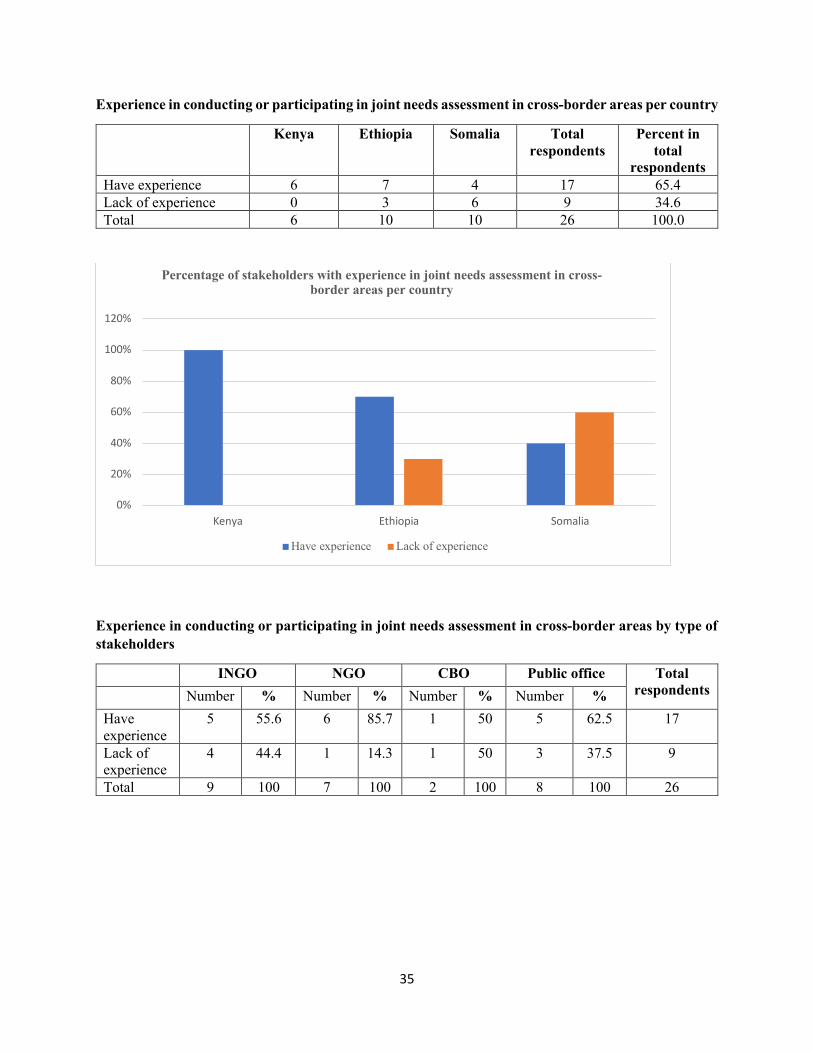
Almost all interviewed organizations (92%) consider having experience in conducting or participating in joint needs assessment with another organization in the same geographical area, while a lower percentage (65%) has a developed capacity in conducting or participating in joint needs assessment in cross-border areas (with another organization on the other side of the border). Among the organizations in the three countries of the Cluster, those in Somalia have much less experience in cross-border joint needs assessment, as 60% of respondents lack such experience. The lack of experience among stakeholders in joint needs assessment appear to be the highest for the CBOs (50%) followed by INGOs (44.4% of total INGOs) and Public offices (37.5%).
Developed capacity Partially developed capacity
Total respondents
Kenya 3 3 6 Ethiopia 8 2 10 Somalia 6 4 10 Total 17 9 26
Developed capacity
Partially developed capacity
Percent of respondents with partially developed capacity
(%)
Total respondents
INGO 8 1 11.1 9 NGO 4 3 42.9 7 CBO 0 2 100.0 2 Public office 5 3 37.5 8 Total 17 9 34.6 26
35
Experience in conducting or participating in joint needs assessment in cross-border areas per country
Kenya Ethiopia Somalia Total respondents
Percent in total
respondents Have experience 6 7 4 17 65.4 Lack of experience 0 3 6 9 34.6 Total 6 10 10 26 100.0
Experience in conducting or participating in joint needs assessment in cross-border areas by type of stakeholders
INGO NGO CBO Public office Total respondents Number % Number % Number % Number %
Have experience
5 55.6 6 85.7 1 50 5 62.5 17
Lack of experience
4 44.4 1 14.3 1 50 3 37.5 9
Total 9 100 7 100 2 100 8 100 26
0%
20%
40%
60%
80%
100%
120%
Kenya Ethiopia Somalia
Percentage of stakeholders with experience in joint needs assessment in cross-border areas per country
Have experience Lack of experience

36
Cooperation between the three countries of the Cluster in joint needs assessment in cross-border areas was concentrated mainly in the following thematic areas/sectors by order of importance: Cross-border conflict, peace and security; Health, water and sanitation; Gender equality, youth and development; and Agriculture. The following table presents the most important areas/sectors that were addressed in cross-border joint needs assessment according to the different organizations involved.
Most important thematic areas/sectors in cross-border joint needs assessments
Thematic area/sector Number of respondents
Percent of total
respondents Cross-border conflict, peace and security 8 42.1 Health, water and sanitation 7 36.8 Gender equality, youth and development 4 21.1 Agriculture 3 15.8 Minority groups, mobility, migration and displacement 2 10.5 Education 2 10.5 Agropastoralism 1 5.3 Trade in cross- border areas 1 5.3 Cross-border natural resource management 1 5.3
3. Capacity to translate the needs into the formulation of a development plan
This is related to the capacity of the relevant national and sub-national entities and civil society organizations in translating the needs into the formulation of development plans and programmes with well-defined objectives, activities and indicators, and related budget. The capacity of the stakeholders to translate the needs into the formulation of a development plan will be assessed through the following specific capacity areas:
0%
20%
40%
60%
80%
100%
INGO NGO CBO Public office
Percent of stakeholders with experience in conducting or participating in joint needs assessment in cros-borders by type of
stakeholders
Have experience Lack of experience
37
• Capacity in the formulation of programmes/projects • Capacity in strategic planning • Capacity in evidence-based development planning • Capacity to use SWOT analysis in development planning • Capacity to conduct and/or participate in joint planning with other organizations
Capacity in in the formulation of programmes/projects
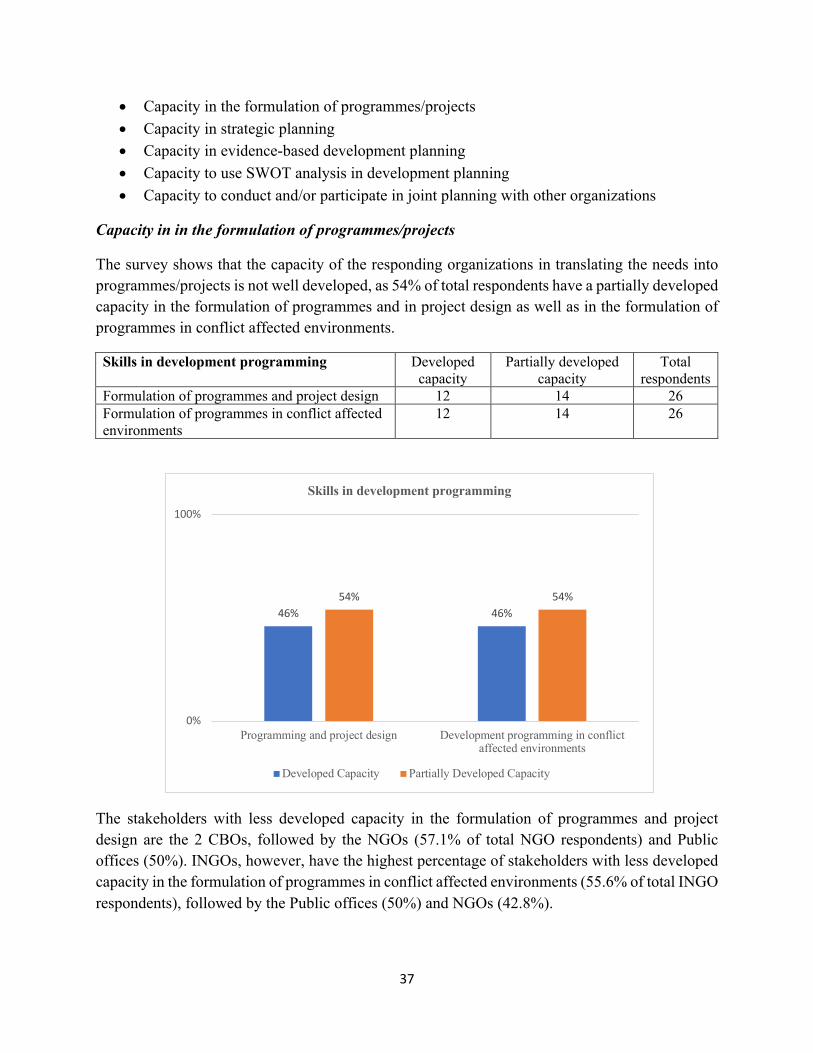
The survey shows that the capacity of the responding organizations in translating the needs into programmes/projects is not well developed, as 54% of total respondents have a partially developed capacity in the formulation of programmes and in project design as well as in the formulation of programmes in conflict affected environments.
Skills in development programming Developed capacity
Partially developed capacity
Total respondents
Formulation of programmes and project design 12 14 26 Formulation of programmes in conflict affected environments
12 14 26
The stakeholders with less developed capacity in the formulation of programmes and project design are the 2 CBOs, followed by the NGOs (57.1% of total NGO respondents) and Public offices (50%). INGOs, however, have the highest percentage of stakeholders with less developed capacity in the formulation of programmes in conflict affected environments (55.6% of total INGO respondents), followed by the Public offices (50%) and NGOs (42.8%).
46% 46%54% 54%
0%
100%
Programming and project design Development programming in conflictaffected environments
Skills in development programming
Developed Capacity Partially Developed Capacity
38
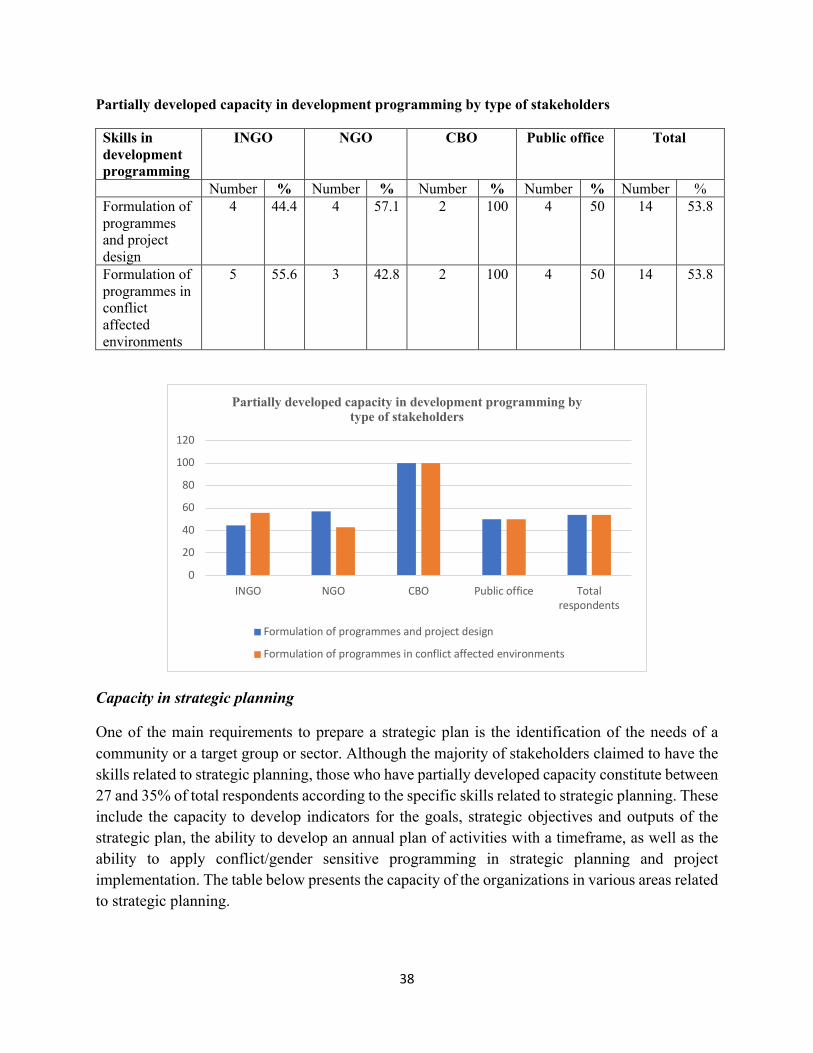
Partially developed capacity in development programming by type of stakeholders
Skills in development programming
INGO NGO CBO Public office Total
Number % Number % Number % Number % Number % Formulation of programmes and project design
4 44.4 4 57.1 2 100 4 50 14 53.8
Formulation of programmes in conflict affected environments
5 55.6 3 42.8 2 100 4 50 14 53.8
Capacity in strategic planning
One of the main requirements to prepare a strategic plan is the identification of the needs of a community or a target group or sector. Although the majority of stakeholders claimed to have the skills related to strategic planning, those who have partially developed capacity constitute between 27 and 35% of total respondents according to the specific skills related to strategic planning. These include the capacity to develop indicators for the goals, strategic objectives and outputs of the strategic plan, the ability to develop an annual plan of activities with a timeframe, as well as the ability to apply conflict/gender sensitive programming in strategic planning and project implementation. The table below presents the capacity of the organizations in various areas related to strategic planning.
0
20
40
60
80
100
120
INGO NGO CBO Public office Totalrespondents
Partially developed capacity in development programming by type of stakeholders
Formulation of programmes and project design
Formulation of programmes in conflict affected environments
39
Skills related to strategic planning Number of respondents Percentage of respondents with
partially developed capacity
Developed capacity
Partially developed capacity
Ability to use the findings of a needs assessment in the preparation of a strategic plan
19 7 27
Ability to apply conflict/Gender sensitive programming in strategic planning and project implementation
18 8 31
Ability to develop indicators for the goals and objectives of the strategic plan
19 7 27
Ability of the organization to develop outputs and activities for an annual plan with a timeframe
17 9 35
Ability to develop indicators related to the outputs
18 8 31
Capacity in evidence-based development planning
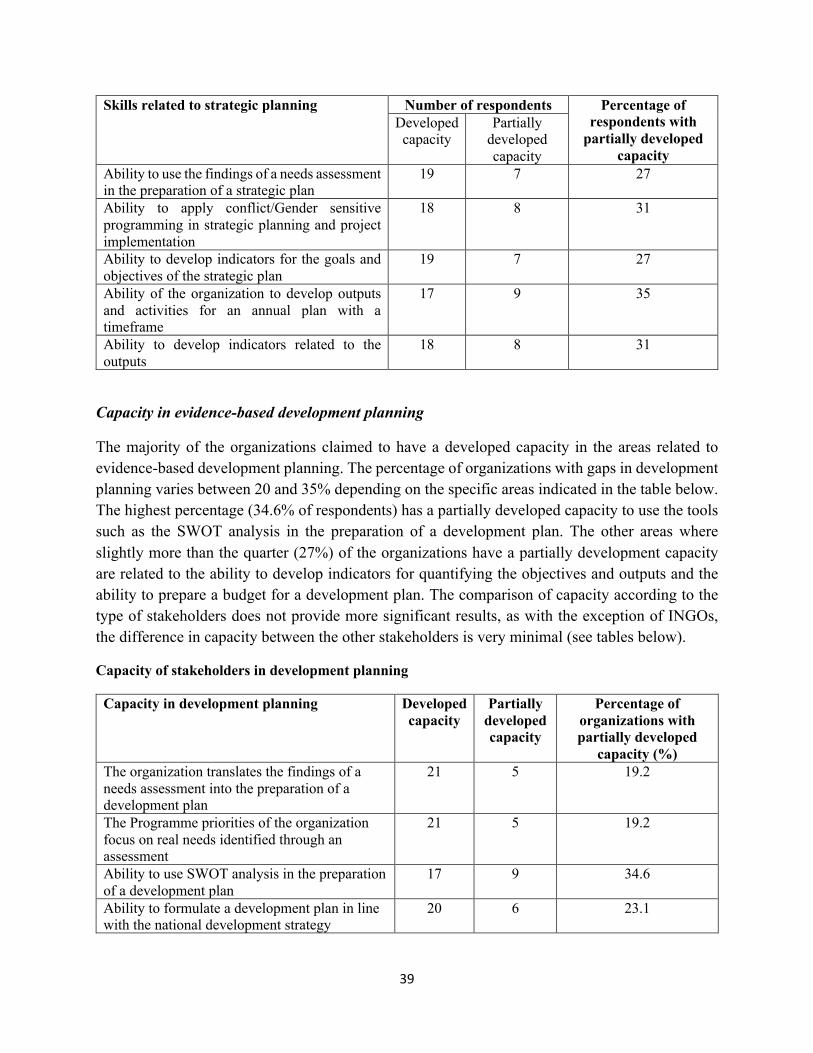
The majority of the organizations claimed to have a developed capacity in the areas related to evidence-based development planning. The percentage of organizations with gaps in development planning varies between 20 and 35% depending on the specific areas indicated in the table below. The highest percentage (34.6% of respondents) has a partially developed capacity to use the tools such as the SWOT analysis in the preparation of a development plan. The other areas where slightly more than the quarter (27%) of the organizations have a partially development capacity are related to the ability to develop indicators for quantifying the objectives and outputs and the ability to prepare a budget for a development plan. The comparison of capacity according to the type of stakeholders does not provide more significant results, as with the exception of INGOs, the difference in capacity between the other stakeholders is very minimal (see tables below).
Capacity of stakeholders in development planning
Capacity in development planning Developed capacity
Partially developed capacity
Percentage of organizations with partially developed
capacity (%) The organization translates the findings of a needs assessment into the preparation of a development plan
21 5 19.2
The Programme priorities of the organization focus on real needs identified through an assessment
21 5 19.2
Ability to use SWOT analysis in the preparation of a development plan
17 9 34.6
Ability to formulate a development plan in line with the national development strategy
20 6 23.1
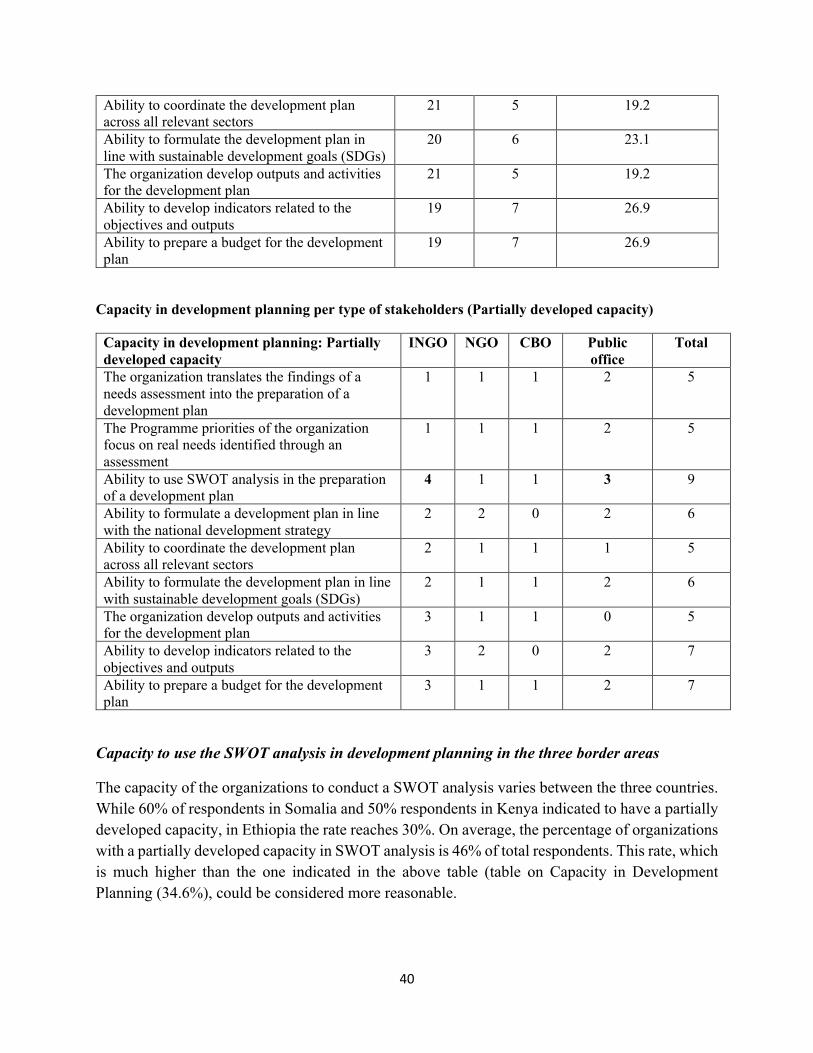
40
Ability to coordinate the development plan across all relevant sectors
21 5 19.2
Ability to formulate the development plan in line with sustainable development goals (SDGs)
20 6 23.1
The organization develop outputs and activities for the development plan
21 5 19.2
Ability to develop indicators related to the objectives and outputs
19 7 26.9
Ability to prepare a budget for the development plan
19 7 26.9
Capacity in development planning per type of stakeholders (Partially developed capacity)
Capacity in development planning: Partially developed capacity
INGO NGO CBO Public office
Total
The organization translates the findings of a needs assessment into the preparation of a development plan
1 1 1 2 5
The Programme priorities of the organization focus on real needs identified through an assessment
1 1 1 2 5
Ability to use SWOT analysis in the preparation of a development plan
4 1 1 3 9
Ability to formulate a development plan in line with the national development strategy
2 2 0 2 6
Ability to coordinate the development plan across all relevant sectors
2 1 1 1 5
Ability to formulate the development plan in line with sustainable development goals (SDGs)
2 1 1 2 6
The organization develop outputs and activities for the development plan
3 1 1 0 5
Ability to develop indicators related to the objectives and outputs
3 2 0 2 7
Ability to prepare a budget for the development plan
3 1 1 2 7
Capacity to use the SWOT analysis in development planning in the three border areas
The capacity of the organizations to conduct a SWOT analysis varies between the three countries. While 60% of respondents in Somalia and 50% respondents in Kenya indicated to have a partially developed capacity, in Ethiopia the rate reaches 30%. On average, the percentage of organizations with a partially developed capacity in SWOT analysis is 46% of total respondents. This rate, which is much higher than the one indicated in the above table (table on Capacity in Development Planning (34.6%), could be considered more reasonable.
41
Capacity to use SWOT analysis in development planning
Developed capacity
Partially developed capacity
Total respondents
Percentage of respondents with partially developed
capacity (%)
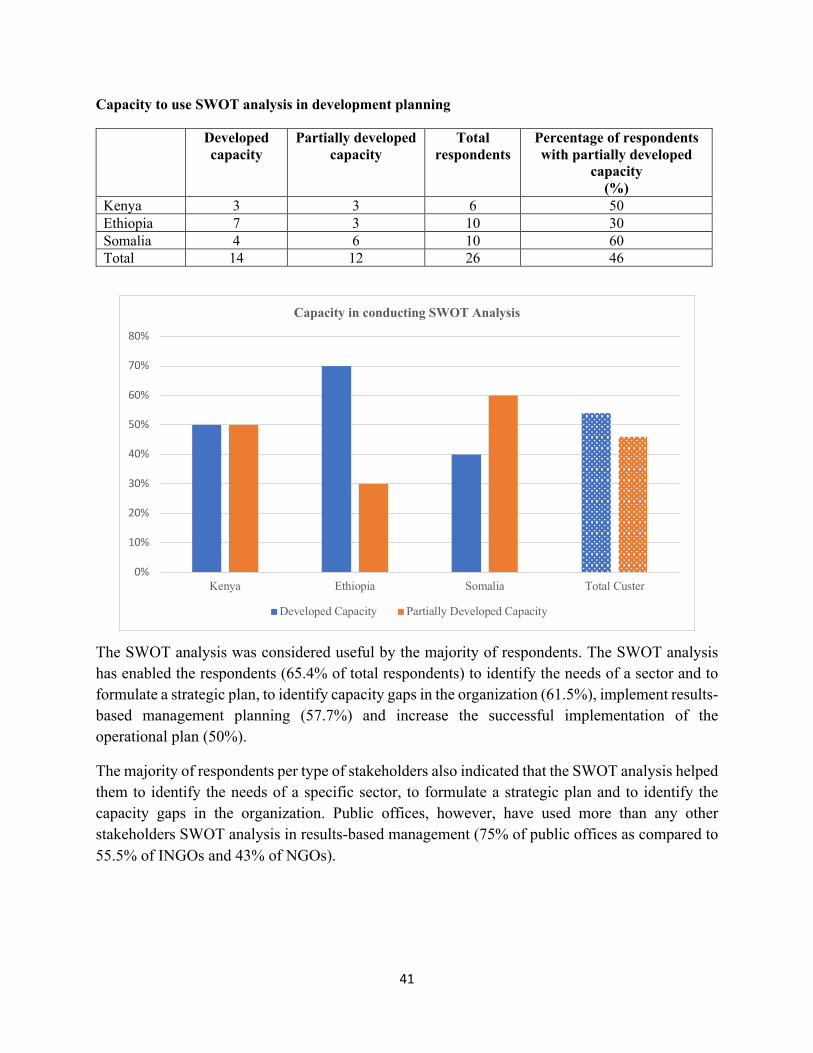
Kenya 3 3 6 50 Ethiopia 7 3 10 30 Somalia 4 6 10 60 Total 14 12 26 46
The SWOT analysis was considered useful by the majority of respondents. The SWOT analysis has enabled the respondents (65.4% of total respondents) to identify the needs of a sector and to formulate a strategic plan, to identify capacity gaps in the organization (61.5%), implement results-based management planning (57.7%) and increase the successful implementation of the operational plan (50%).
The majority of respondents per type of stakeholders also indicated that the SWOT analysis helped them to identify the needs of a specific sector, to formulate a strategic plan and to identify the capacity gaps in the organization. Public offices, however, have used more than any other stakeholders SWOT analysis in results-based management (75% of public offices as compared to 55.5% of INGOs and 43% of NGOs).
0%
10%
20%
30%
40%
50%
60%
70%
80%
Kenya Ethiopia Somalia Total Custer
Capacity in conducting SWOT Analysis
Developed Capacity Partially Developed Capacity
42
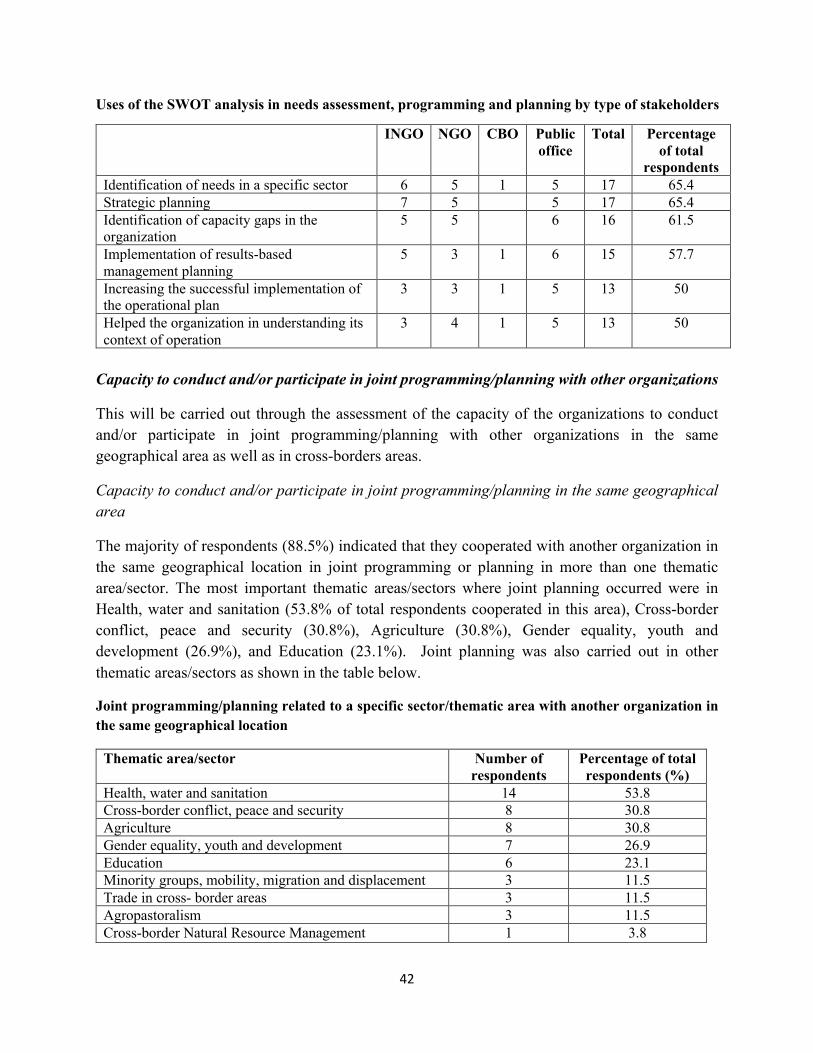
Uses of the SWOT analysis in needs assessment, programming and planning by type of stakeholders
INGO NGO CBO Public office
Total Percentage of total
respondents Identification of needs in a specific sector 6 5 1 5 17 65.4 Strategic planning 7 5 5 17 65.4 Identification of capacity gaps in the organization
5 5 6 16 61.5
Implementation of results-based management planning
5 3 1 6 15 57.7
Increasing the successful implementation of the operational plan
3 3 1 5 13 50
Helped the organization in understanding its context of operation
3 4 1 5 13 50
Capacity to conduct and/or participate in joint programming/planning with other organizations
This will be carried out through the assessment of the capacity of the organizations to conduct and/or participate in joint programming/planning with other organizations in the same geographical area as well as in cross-borders areas.
Capacity to conduct and/or participate in joint programming/planning in the same geographical area
The majority of respondents (88.5%) indicated that they cooperated with another organization in the same geographical location in joint programming or planning in more than one thematic area/sector. The most important thematic areas/sectors where joint planning occurred were in Health, water and sanitation (53.8% of total respondents cooperated in this area), Cross-border conflict, peace and security (30.8%), Agriculture (30.8%), Gender equality, youth and development (26.9%), and Education (23.1%). Joint planning was also carried out in other thematic areas/sectors as shown in the table below.
Joint programming/planning related to a specific sector/thematic area with another organization in the same geographical location
Thematic area/sector Number of respondents
Percentage of total respondents (%)
Health, water and sanitation 14 53.8 Cross-border conflict, peace and security 8 30.8 Agriculture 8 30.8 Gender equality, youth and development 7 26.9 Education 6 23.1 Minority groups, mobility, migration and displacement 3 11.5 Trade in cross- border areas 3 11.5 Agropastoralism 3 11.5 Cross-border Natural Resource Management 1 3.8

43
When comparing the thematic areas/sectors in which each of the stakeholders is involved in, the findings reveal that Public offices and INGOs are more involved in Health, water and sanitation than the NGOs, while the latter focus on Cross-border conflict, peace and security. Joint programming/planning related to a specific sector/thematic area with another organization in the same geographical location by type of stakeholder
CBO INGO NGO Public office Total
Health, water and sanitation 3 1 2 6 Cross-border conflict, peace and security 1 1 3 5 Agriculture 1 2 3 Gender equality, youth and development
1 1 2
Health, water and sanitation; Education
1
1 Health, water and sanitation; Education, agriculture and agropastoralism
1 1 2
Health, water and sanitation; Education and agriculture
Cross-border conflict, peace and security; Gender equality, youth and development; Health, water and sanitation; Trade in cross-border areas
1
1
Gender equality, youth and development; Health, water and sanitation; Education
1 1
Cross-border conflict, peace and security; Gender equality, youth and development; Minority groups, mobility, migration and displacement; Health, water and sanitation; Agriculture; Agropastoralism, Trade in cross-border areas; Education
1 1 2
Gender equality, youth and development; Minority groups, mobility, migration and displacement; Health, water and sanitation; Agriculture; Agropastoralism
1
1
Grand Total 2 8 6 8 24 Capacity to conduct and/or participate in joint programming/planning in cross-border areas
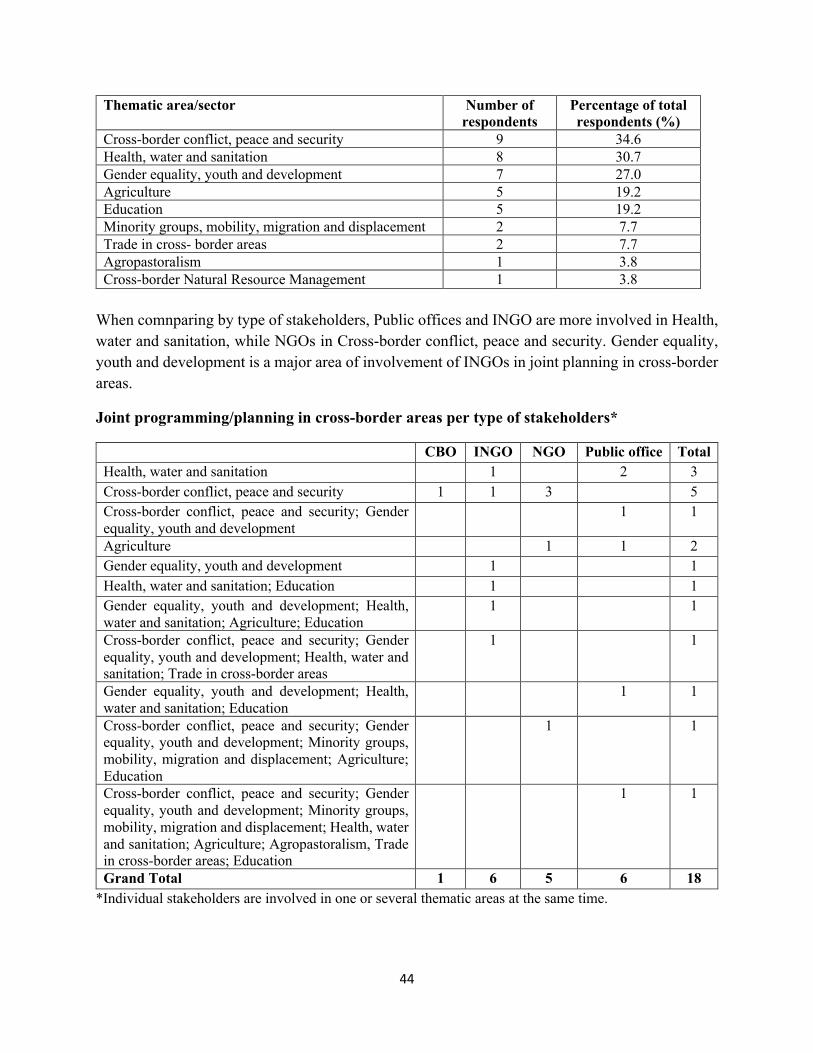
As to joint programming or planning related to a specific sector/thematic area with another organization in the other side of the border (cross-border), 73% of respondents claimed to have had such cooperation. The relative importance of thematic areas/sectors in joint planning in cross-border areas differs to a certain extent from those where cooperation was made in the same geographical area. In cross-border areas, only joint planning in Cross-border conflict, peace and security were slightly more important (34.6% as compared to 30.8% in joint planning in the same geographical location).
44
Thematic area/sector Number of respondents
Percentage of total respondents (%)
Cross-border conflict, peace and security 9 34.6 Health, water and sanitation 8 30.7 Gender equality, youth and development 7 27.0 Agriculture 5 19.2 Education 5 19.2 Minority groups, mobility, migration and displacement 2 7.7 Trade in cross- border areas 2 7.7 Agropastoralism 1 3.8 Cross-border Natural Resource Management 1 3.8
When comnparing by type of stakeholders, Public offices and INGO are more involved in Health, water and sanitation, while NGOs in Cross-border conflict, peace and security. Gender equality, youth and development is a major area of involvement of INGOs in joint planning in cross-border areas.
Joint programming/planning in cross-border areas per type of stakeholders*
CBO INGO NGO Public office Total Health, water and sanitation 1 2 3 Cross-border conflict, peace and security 1 1 3 5 Cross-border conflict, peace and security; Gender equality, youth and development
1 1
Agriculture 1 1 2 Gender equality, youth and development
1 1
Health, water and sanitation; Education
1
1 Gender equality, youth and development; Health, water and sanitation; Agriculture; Education
1 1
Cross-border conflict, peace and security; Gender equality, youth and development; Health, water and sanitation; Trade in cross-border areas
1
1
Gender equality, youth and development; Health, water and sanitation; Education
1 1
Cross-border conflict, peace and security; Gender equality, youth and development; Minority groups, mobility, migration and displacement; Agriculture; Education
1 1
Cross-border conflict, peace and security; Gender equality, youth and development; Minority groups, mobility, migration and displacement; Health, water and sanitation; Agriculture; Agropastoralism, Trade in cross-border areas; Education
1 1
Grand Total 1 6 5 6 18 *Individual stakeholders are involved in one or several thematic areas at the same time.

45
4. Capacity to monitor and evaluate
This is related to the capacity of the national and sub-national entities and civil society organizations to devise a monitoring and evaluation system to monitor progress of work and evaluate results against set objectives, as well as the capacity to ensure through M&E mechanisms access to information and knowledge for all stakeholders.
The capacity of organizations in monitoring and evaluation is quite developed. The main areas where the organizations have less developed capacity are by order of importance: Ability to prepare the terms of reference for external mid-term and final evaluation of the plan/projects (34.6% of respondents); the ability to integrate conflict related issues in monitoring and evaluation (30.8%); and the integration of gender equality in the formulation of performance indicators (27%).
Capacity in Monitoring and Evaluation (M&E)
Capacity areas in M&E Number of respondents Percentage of respondents with
partially developed capacity (%)
Developed capacity
Partially developed capacity
Ability to prepare the terms of reference for external mid-term and final evaluation of the plan/projects
17 9 34.6
Ability to integrate Conflict related issues in monitoring and evaluation
18 8 30.8
M&E plans are comprehensive to meet the requirements of the various donors
19 7 27.0
The organization integrates gender equality in the formulation of performance indicators
19 7 27.0
The organization integrates (people) with special needs in the formulation of performance indicators
20 6 23.1
Ability of the organization to analyse the M&E data and produce appropriate reports
21 5 19.2
M&E system comprises success stories and their dissemination to stakeholders
21 5 19.2
The organization shares the M&E data with the stakeholders
22 4 15.4
Ability of the organization to devise a Monitoring system to follow-up on implementation of a plan and/or project
22 4 15.4
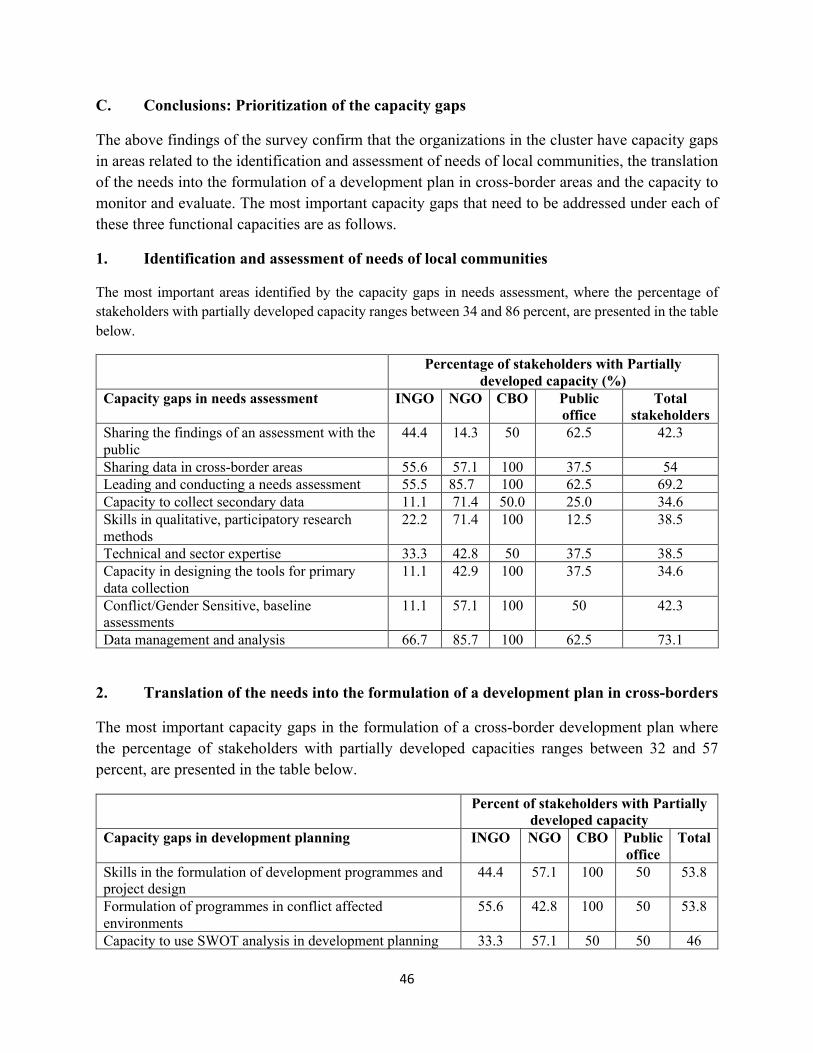
46
C. Conclusions: Prioritization of the capacity gaps
The above findings of the survey confirm that the organizations in the cluster have capacity gaps in areas related to the identification and assessment of needs of local communities, the translation of the needs into the formulation of a development plan in cross-border areas and the capacity to monitor and evaluate. The most important capacity gaps that need to be addressed under each of these three functional capacities are as follows.
1. Identification and assessment of needs of local communities
The most important areas identified by the capacity gaps in needs assessment, where the percentage of stakeholders with partially developed capacity ranges between 34 and 86 percent, are presented in the table below.
Percentage of stakeholders with Partially developed capacity (%)
Capacity gaps in needs assessment INGO NGO CBO Public office
Total stakeholders
Sharing the findings of an assessment with the public
44.4 14.3 50 62.5 42.3
Sharing data in cross-border areas 55.6 57.1 100 37.5 54 Leading and conducting a needs assessment 55.5 85.7 100 62.5 69.2 Capacity to collect secondary data 11.1 71.4 50.0 25.0 34.6 Skills in qualitative, participatory research methods
22.2 71.4 100 12.5 38.5
Technical and sector expertise 33.3 42.8 50 37.5 38.5 Capacity in designing the tools for primary data collection
11.1 42.9 100 37.5 34.6
Conflict/Gender Sensitive, baseline assessments
11.1
57.1 100 50 42.3
Data management and analysis 66.7 85.7 100 62.5 73.1
2. Translation of the needs into the formulation of a development plan in cross-borders
The most important capacity gaps in the formulation of a cross-border development plan where the percentage of stakeholders with partially developed capacities ranges between 32 and 57 percent, are presented in the table below.
Percent of stakeholders with Partially developed capacity
Capacity gaps in development planning INGO NGO CBO Public office
Total
Skills in the formulation of development programmes and project design
44.4 57.1 100 50 53.8
Formulation of programmes in conflict affected environments
55.6 42.8 100 50 53.8
Capacity to use SWOT analysis in development planning 33.3 57.1 50 50 46

47
Implementation of results-based management planning through SWOT analysis
44.5 57 50 25 42.8
Use of SWOT analysis in strategic planning 22.2 28.5 100 37.5 34.6
3. Monitoring and evaluation
All capacity areas in Monitoring and Evaluation (as identified in the part related to M&E) are considered gaps that should be addressed, as on average 30% of stakeholders have a partially developed capacity in this sector.
Capacity gaps in M&E Percentage of stakeholders with Partially developed capacity INGO NGO CBO Public
office Total
Ability to integrate Conflict related issues in monitoring and evaluation
22.2 28.6 50 37.5 30.8
Ability to prepare the terms of reference for external mid-term and final evaluation of the plan/projects
33.3 28.6 50 37.5 34.6
In summary, the five most important capacity gaps that would need to be addressed as high priorities are:
• Data management and analysis (73.1% of total respondents); the percentage is much higher for NGOs (85.7% of total NGOs) and CBOs (100%).
• Leading and conducting a needs assessment (70% of total respondents), while the percentage reached 85.7% for NGOs and 62.5% for Public offices.
• Sharing data in cross-border areas (54% of total respondents), as compared to 57.1% for NGOs and 55.6% for INGOs
• Skills in the formulation of development programmes and in project design (54% of total respondents), as compared to 57.1% for NGOs.
• Capacity to use SWOT analysis in development planning (46% of total respondents); the percentage is higher for NGOs (57.1%), CBOs (50%) and Public offices (50%).
In all other areas identified as gaps, CBOs and NGOs lag behind INGOs and Public offices.
The other capacity gaps are related to the SWOT analysis, the preparation of an action plan, technical and sector expertise and integration of conflict/gender issues in baseline assessments.
The less important capacity gaps identified are related to the capacity in the collection of secondary data and conducting qualitative participatory research methods, to the capacity in the design of the tools for primary data collection, the capacity in strategic planning and in conducting the SWOT analysis, as well as in monitoring and evaluation.
48
The identified capacity gaps will inform the capacity development responses/plan that will be prepared in a separate report. The capacity development plan will prioritize the interventions in the short, medium and long-term responses.
