final report - defense technical information center final report . soil amendments to reduce...
TRANSCRIPT

FINAL REPORT Soil Amendments to Reduce Bioavailability of
Metals in Soils: Experimental Studies and Spectroscopic Verification
SERDP Project ER-1351
JULY 2008 Kathy Banks Paul Schwab Cliff Johnson Darrel Schulze PURDUE UNIVERSITY
Distribution Statement A: Approve for Public Release, Distribution is Unlimted

Report Documentation Page Form ApprovedOMB No. 0704-0188
Public reporting burden for the collection of information is estimated to average 1 hour per response, including the time for reviewing instructions, searching existing data sources, gathering andmaintaining the data needed, and completing and reviewing the collection of information. Send comments regarding this burden estimate or any other aspect of this collection of information,including suggestions for reducing this burden, to Washington Headquarters Services, Directorate for Information Operations and Reports, 1215 Jefferson Davis Highway, Suite 1204, ArlingtonVA 22202-4302. Respondents should be aware that notwithstanding any other provision of law, no person shall be subject to a penalty for failing to comply with a collection of information if itdoes not display a currently valid OMB control number.
1. REPORT DATE 01 JAN 2008
2. REPORT TYPE N/A
3. DATES COVERED -
4. TITLE AND SUBTITLE Soil Amendments to Reduce Bioavailability of Metals in Soils:Experimental Studies and Spectroscopic Verification
5a. CONTRACT NUMBER
5b. GRANT NUMBER
5c. PROGRAM ELEMENT NUMBER
6. AUTHOR(S) 5d. PROJECT NUMBER
5e. TASK NUMBER
5f. WORK UNIT NUMBER
7. PERFORMING ORGANIZATION NAME(S) AND ADDRESS(ES) PURDUE UNIVERSITY
8. PERFORMING ORGANIZATIONREPORT NUMBER
9. SPONSORING/MONITORING AGENCY NAME(S) AND ADDRESS(ES) 10. SPONSOR/MONITOR’S ACRONYM(S)
11. SPONSOR/MONITOR’S REPORT NUMBER(S)
12. DISTRIBUTION/AVAILABILITY STATEMENT Approved for public release, distribution unlimited
13. SUPPLEMENTARY NOTES The original document contains color images.
14. ABSTRACT
15. SUBJECT TERMS
16. SECURITY CLASSIFICATION OF: 17. LIMITATION OF ABSTRACT
UU
18. NUMBEROF PAGES
140
19a. NAME OFRESPONSIBLE PERSON
a. REPORT unclassified
b. ABSTRACT unclassified
c. THIS PAGE unclassified
Standard Form 298 (Rev. 8-98) Prescribed by ANSI Std Z39-18

This report was prepared under contract to the Department of Defense Strategic Environmental Research and Development Program (SERDP). The publication of this report does not indicate endorsement by the Department of Defense, nor should the contents be construed as reflecting the official policy or position of the Department of Defense. Reference herein to any specific commercial product, process, or service by trade name, trademark, manufacturer, or otherwise, does not necessarily constitute or imply its endorsement, recommendation, or favoring by the Department of Defense.


i
Table of Contents
I. Acknowledgments ............................................................................................................. 1
II. Executive Summary ......................................................................................................... 2
III. Background ..................................................................................................................... 4 Metal Contamination at Department of Department Sites ................................................ 4 Soil Chemistry of Contaminant Metals ............................................................................ 5 Soil Amendments to Reduce Bioavailability .................................................................... 6 Spectroscopic Methods ..................................................................................................... 7 X-ray Methods .................................................................................................................. 8 Bioassays for Acute and Chronic Toxicity ....................................................................... 9 Plant Uptake by Hyperaccumulator Plants as an Indicator of Bioavailability ................. 9
IV. Tasks and Milestones ...................................................................................................... 11 Task 1. Site Selection and Sample Collection .................................................................. 11 Task 2. Soil Characterization ............................................................................................ 12
Task 2.1 Soil Classification. Classification will be evaluated using USDA soil survey maps. .............................................................................................................................. 12 Task 2.2 Soil chemical properties. Measured properties will include: pH, organic C, cation exchange capacity, contaminant and total metals, soluble salts. ........................ 12 Task 2.3 Soil physical properties. The properties to be assessed include textural analysis, water retention, infiltration, surface area. ....................................................... 12
Task 3. Laboratory Evaluation of Amendments ............................................................... 12 Task 4. Assays of Bioavailability and Analytical Methods .............................................. 13
Task 4a. Application of Chemical Assays ..................................................................... 13 Task 4b. Bio-Indicator Assays ....................................................................................... 13 Task 4c. In Situ Surface Spectroscopy (IR and Raman) ................................................ 13 Task 4d. X-ray and Synchrotron Methods. .................................................................... 14
V. Materials and Methods ..................................................................................................... 14 Task 1. Site Selection and Sample Collection .................................................................. 14
Smelter site soil: ............................................................................................................ 14 Utah soil: ........................................................................................................................ 14 New Jersey Soil: ............................................................................................................ 14
Task 2. Soil Characterization ............................................................................................ 15 Task 2.1 Soil Characterization .......................................................................................... 15
Task 2.2 and 2.3 Chemical and Physical Properties ...................................................... 15 Task 3. Laboratory Evaluation of Amendments. .............................................................. 15 Task 4. Assays of Bioavailability and Analytical Methods .............................................. 19
Task 4a. Application of Chemical Assays ..................................................................... 19 Task 4b. Bioassays. ........................................................................................................ 22 Task 4c. Spectroscopy. .................................................................................................. 26 Task 4d. X-ray Analyses ................................................................................................ 26
VI. Results and Accomplishments ........................................................................................ 33 Task 4. Assays of Bioavailability and Analytical Methods .............................................. 33

ii
Task 4a. Application of Chemical Assays ..................................................................... 33 Task 4c. Spectroscopic Identification of As and La Precipitates .................................. 65 Task 4d. X-ray Analyses ................................................................................................ 78 Synchrotron Micro-XRD and Micro-SXRF .................................................................. 86 Precipitation of Akaganeite ........................................................................................... 103
VII. Summary and Conclusions ............................................................................................ 116
VIII. References .................................................................................................................... 118

iii
List of Acronyms
ART-FTIR: Attenuated Total Reflectance - Fourier Transform Infrared Spectrometry
DoD: Department of Defense
EC: electrolytic conductivity
EPA: United States Environmental Protection Agency
EXAFS: extended x-ray absorption fine structure
FTIR: fourier transform infrared spectrometry
ICP: inductively coupled plasma
IR: infrared
LOI: loss on ignition
LSD: least significant difference
NJ: New Jersey
SEM: scanning electron micrograph
SERDP: Strategic Environmental Research and Development Program
SXRF: Synchrotron-based micro x-ray fluorescence
TCLP: toxicity characterization leaching protocol
USDA: United States Department of Agriculture
UT: Utah
WD-XRF: Wavelength-dispersive x-ray fluorescence
WHC: water holding capacity
XANES: x-ray absorption near-edge spectroscopy
XAS: x-ray absorption spectra
XRD: x-ray diffractometry
XRF: x-ray fluorescence

iv
List of Figures Figure 1. Shaker for PBET, IVG and TCLP Experiments. ........................................................... 21
Figure 2. (a) View of the Sampling Site on April 1, 2005 When the Surface Was Covered by About 20 cm Water. (b) Reddish Brown Precipitates on the Soil Surface. ......................... 28
Figure 3. (a) View of the Sampling Site on August 5, 2005 When the Water Table Was About 30 cm Below the Soil Surface. (b) The Dry Soil Surface Covered With a Reddish Brown Precipitate. Note the White Gypsum Precipitates on the Dry Plant Residues. .................... 30
Figure 4. Bioaccessible % of As With the Addition of Ce, Mn and P in Lead Smelter Soil. (0.5P, 2P and 5P represent 1:0.5 Mn and P, 1:2 Mn and P and 1:5 Mn and P; 1Ce and 3Ce represents 1:1 Ce and 1:3 Ce). ...................................................................................... 35
Figure 5. Bioaccessible % of Cr With the Addition of Ce, Mn and P in Lead Smelter Soil (0.5P, 2P and 5P represent 1:0.5 Mn and P, 1:2 Mn and P and 1:5 Mn and P; 1Ce and 3Ce represents 1:1 Ce and 1:3 Ce). ...................................................................................... 35
Figure 6. Bioaccessible % of Cd With the Addition of Ce, Mn and P in Lead Smelter Soil (0.5P, 2P and 5P represent 1:0.5 Mn and P, 1:2 Mn and P and 1:5 Mn and P; 1Ce and 3Ce represents 1:1 Ce and 1:3 Ce). ...................................................................................... 36
Figure 7. Bioaccessible % of Pb With the Addition of Ce, Mn and P in Lead Smelter Soil (0.5P, 2P and 5P represent 1:0.5 Mn and P, 1:2 Mn and P and 1:5 Mn and P; 1Ce and 3Ce represents 1:1 Ce and 1:3 Ce). ...................................................................................... 36
Figure 8. Bioaccessible % of As With the Addition of Ce, Mn and P in New Jersey Soil (0.5P and 5P represent 1:0.5 Mn and P and 1:5 Mn and P; 1Ce represent 1:1 Ce). ...................... 39
Figure 9. Bioaccessible % of As With the Addition of Ce, Mn and P in Utah soil (0.5P and 5P represent 1:0.5 Mn and P and 1:5 Mn and P; 1Ce represent 1:1 Ce). .................................. 40
Figure 10. Bioaccessible % of Cr With the Addition of Ce, Mn and P in New Jersey Soil (0.5P and 5P represent 1:0.5 Mn and P and 1:5 Mn and P; 1Ce represent 1:1 Ce). ...................... 40
Figure 11. Bioaccessible % of Cr With the Addition of Ce, Mn and P in Utah Soil (0.5P and 5P represent 1:0.5 Mn and P and 1:5 Mn and P; 1Ce represent 1:1 Ce). ............................ 41
Figure 12. Bioaccessible % of Cd With the Addition of Ce, Mn and P in New Jersey Soil (0.5P and 5P represent 1:0.5 Mn and P and 1:5 Mn and P; 1Ce represent 1:1 Ce). ...................... 41
Figure 13. Bioaccessible % of Cd With the Addition of Ce, Mn and P in Utah Soil (0.5P and 5P represent 1:0.5 Mn and P and 1:5 Mn and P; 1Ce represent 1:1 Ce). ............................ 42
Figure 14. Bioaccessible % of Pb With the Addition of Ce, Mn and P in New Jersey Soil (0.5P and 5P represent 1:0.5 Mn and P and 1:5 Mn and P; 1Ce represent 1:1 Ce). ...................... 42
Figure 15. Bioaccessible % of Pb With the Addition of Ce, Mn and P in Utah Soil (0.5P and 5P represent 1:0.5 Mn and P and 1:5 Mn and P; 1Ce represent 1:1 Ce). ............................ 43
Figure 16. TCLP As Concentration With the Addition of Ce, Mn and P in Lead Smelter Soil (0.5P, 2P and 5P represent 1:0.5 Mn and P, 1:2 Mn and P and 1:5 Mn and P; 1Ce and 3Ce represents 1:1 Ce and 1:3 Ce). ...................................................................................... 45

v
Figure 17. TCLP Cr Concentration With the Addition of Ce, Mn and P in Lead Smelter Soil (0.5P, 2P and 5P represent 1:0.5 Mn and P, 1:2 Mn and P and 1:5 Mn and P; 1Ce and 3Ce represents 1:1 Ce and 1:3 Ce). ...................................................................................... 46
Figure 18. TCLP Cd Concentration With the Addition of Ce, Mn and P in Lead Smelter Soil (0.5P, 2P and 5P represent 1:0.5 Mn and P, 1:2 Mn and P and 1:5 Mn and P; 1Ce and 3Ce represents 1:1 Ce and 1:3 Ce). ...................................................................................... 46
Figure 19. TCLP Pb Concentration With the Addition of Ce, Mn and P in Lead Smelter Soil (0.5P, 2P and 5P represent 1:0.5 Mn and P, 1:2 Mn and P and 1:5 Mn and P; 1Ce and 3Ce represents 1:1 Ce and 1:3 Ce). ...................................................................................... 47
Figure 20. TCLP As Concentration With the Addition of Ce, Mn and P in New Jersey Soil (0.5P and 5P represent 1:0.5 Mn and P and 1:5 Mn and P; 1Ce represent 1:1 Ce). ............ 49
Figure 21. TCLP As Concentration With the Addition of Ce, Mn and P in Utah Soil (0.5P and 5P represent 1:0.5 Mn and P and 1:5 Mn and P; 1Ce represent 1:1 Ce). ............................ 49
Figure 22. TCLP Cr Concentration With the Addition of Ce, Mn and P in New Jersey Soil (0.5P and 5P represent 1:0.5 Mn and P and 1:5 Mn and P; 1Ce represent 1:1 Ce) (regulatory limit 5 mg/L). .................................................................................................... 50
Figure 23. TCLP Cr Concentration With the Addition of Ce, Mn and P in Utah Soil (0.5P and 5P represent 1:0.5 Mn and P and 1:5 Mn and P; 1Ce represent 1:1 Ce). ............................ 50
Figure 24. TCLP Cd Concentration With the Addition of Ce, Mn and P in New Jersey Soil (0.5P and 5P represent 1:0.5 Mn and P and 1:5 Mn and P; 1Ce represent 1:1 Ce). ............ 51
Figure 25. TCLP Cd Concentration With the Addition of Ce, Mn and P in Utah Soil (0.5P and 5P represent 1:0.5 Mn and P and 1:5 Mn and P; 1Ce represent 1:1 Ce). ............................ 51
Figure 26. TCLP Pb Concentration With the Addition of Ce, Mn and P in New Jersey Soil (0.5P and 5P represent 1:0.5 Mn and P and 1:5 Mn and P; 1Ce represent 1:1 Ce). ............ 52
Figure 27. TCLP Pb Concentration With the Addition of Ce, Mn and P in Utah Soil (0.5 P and 5 P represent 1:0.5 Mn and P and 1:5 Mn and P; 1Ce represent 1:1 Ce). ........................... 53
Figure 28. Smelter Site Soil Leached Earthworm Tissue Metal Concentration. Values Followed by the Same Letter Are Not Significantly Different at P<0.05. .......................... 61
Figure 29. Utah Soil Earthworm Tissue Metal Content. Values Followed by the Same Letter Are Not Significantly Different at P<0.05. .......................................................................... 65
Figure 30. X-ray Diffraction Spectra of Lanthanum Arsenate Precipitate. (A) Arsenate With La(III) or Ce(III); 1P-La(III) at pH 5.5; 2P-La(III) at pH 3.9; 3P-Ce(III) at pH 3.9; 4P-Ce(III) at pH 5.5. (B) Match of Precipitate Spectra With a Standard of LaAsO4 (ref. code 00-015-0756) From X-ray Diffraction Library. ................................................................... 66
Figure 31. Raman Spectra of Aqueous As(V) and La(III) solution at pH 7.4, 6.6, 6.0, 5.2, 2.8 and 2.2. (A) 50 mM As(V) at pH 9.1 and (H) 50 mM La(III) at pH 4.6. Spectra B-G 50 mM As(V) and 7.5, 17.5, 23, 25, 28.9 and 50 mM La(III), respectively; (B) pH 7.4, (C) pH 6.6, (D) pH 6.0, (E) pH 5.2, (F) pH 2.8 and (G) pH 2.2. ............................................... 67
Figure 32. Comparison of Raman Spectra of Aqueous As(V) + La(III) (top) to Aqueous As(V) (bottom). (A and E) pH 7.4; (B and F) pH 6.6; (C and G) pH 5.2; (D and H) pH 2.2. ....... 68

vi
Figure 33. Raman Spectra of Solution of 50 mM As(V) + 25 mM La(III) at pH 5.2. Shaded Area was Integrated for Comparison With Chemical Modeling. ........................................ 68
Figure 34. Comparison of As(V) Concentrations at Targeted Points in Chemical Modeling to Concentrations of As(V) in Raman Spectra of the Solutions. ............................................. 69
Figure 35. Raman Spectra of Lanthanum Arsenate Precipitate at pH 7.4, 6.6, 6.0, 5.2, 2.8 and 2.2. Initial As(V) concentration of 50 mM. (A) 7.5 mM La(III) at pH 7.4; (B) 17.5 mM La(III) at pH 6.6; (C) 23 mM La(III) at pH 6.0; (D) 25 mM La(III) at pH 5.2; (E) 28.9 mM La(III) at pH 2.8; and (F) 50 mM La(III) at pH 2.2. .................................................... 69
Figure 36. Comparison of Raman Spectra of As(V) and La(III) Solution With Precipitate at pH 7.4. (A) Solution of 50 mM As(V) + 7.5 mM La(III) at pH 7.4 and (B) Precipitate of 50 mM As(V) + 7.5 mM La(III) at pH 7.4. .............................................................................. 70
Figure 37. ART-FTIR Spectra of Lanthanum Arsenate Precipitate at pH 7.4, 6.6, 6.0, 5.2, 2.8 and 2.2. Initial As(V) Concentration of 50 mM. (A) 7.5 mM La(III) at pH 7.4; (B) 17.5 mM La(III) at pH 6.6; (C) 23 mM La(III) at pH 6.0; (D) 25 mM La(III) at pH 5.2; (E) 28.9 mM La(III) at pH 2.8; (F) 50 mM La(III) at pH 2.2. ................................................... 71
Figure 38. Comparison of ART-FTIR Spectra With Raman Spectra of Lanthanum Arsenate Precipitate at pH 7.4 and 2.2. (A and B) 50 mM As(V) + 7.5 mM La(III) at pH 7.4; (C and D) 50 mM As(V) + 50 mM La(III) at pH 2.2. .............................................................. 71
Figure 39. Bioaccessibility Percent of Arsenic With Different Lanthanum Ratios to Soil Arsenic Over Time (1, 7, 90 and 180 days). ........................................................................ 73
Figure 40. Trend Between Ratios of La to Bioaccessibility Percent (considering all investigated ratios of La) in Lead Smelter Soil. .................................................................. 73
Figure 41. TCLP Results for Arsenic at Different Ratios of As:La Over Time (1, 7, 90 and 180 days); Regulatory Limit is 5 mg/L. ............................................................................... 76
Figure 42. Bioaccessibility Percent of Arsenic With Different Cerium Ratios to Soil Arsenic Over Time (1, 7, 90 and 180 days). ..................................................................................... 76
Figure 43. Trend Between Ratios of Ce to Bioaccessibility Percent Taking Into Consideration Different Ratios of Ce Amendment in Lead Smelter Soil. .................................................. 77
Figure 44. Trend Between Times to Bioaccessibility Percent (considering all investigated ratios of Ce) in Lead Smelter Soil........................................................................................ 77
Figure 45. TCLP Results for Arsenic at Different Ratios of As:Ce Over Time (1, 7, 90 and 180 days); Regulatory Limit is 5 mg/L. ...................................................................................... 78
Figure 46. Bulk Powder XRD Patterns of the Surface Horizon. (a) Sample S3a (0 -10 cm) Collected When the Soil Was Wet. (b) Sample S4a (0 -15 cm) Collected When the Soil Was Dry. Theoretical Patterns From the PDF Database Are Represented by the Different Colored Vertical Lines Were Also Included for Reference. Major Peaks Are Labeled With Mineral Names. Q = quartz, Gt = goethite, Gy = gypsum, and Ak = poorly crystalline akaganeite. .......................................................................................................... 83
Figure 47. Bulk Powder XRD Patterns of the Subsurface Horizons from 10 - 30 cm Deep For Sample Collection S3. (a) The 10 – 20 cm layer (S3b). (b) The 20 – 30 cm layer (S3c).

vii
Theoretical Patterns From the PDF Database Are Represented By the Different Colored Vertical Lines. B = birnessite, Gt = goethite, Gy = gypsum, H = hematite, M = magnetite, Q = quartz, and W = wustite. ............................................................................. 84
Figure 48. Bulk Powder XRD Patterns of the Horizons from 30 - 65 cm Deep For Sample Collection S3. (a) The 30 – 50 cm layer (S3d). (b) The 50 – 65 cm layer (S3e). Theoretical Patterns From the PDF Database Are Represented by the Different Colored Vertical Lines. Ga = galena, Gt = goethite, H = hematite, M = magnetite, Q = quartz, R = realgar, and W = wustite. ..................................................................................................... 85
Figure 49. Micro XRD Patterns of Soil Aggregates From the Surface Layer (a) pure goethite (Gt), (c) pure akaganeite (Ak), and (e) a mixture of goethite (Gt) and Akaganeite (Ak). The SXRF Spectra of Soil Aggregates From the Surface Layer With Major Mineral Phases of (b) goethite, (d) akaganeite, and (f) a mixture of goethite and akaganeite, Respectively. ........................................................................................................................ 86
Figure 50. Micro XRD Patterns of Soil Aggregates From the Surface Layer. (a) Schwertmannite (Sh) With Trace Amount of goethite (Gt). (b) Jarosite (Jt) With Trace Amount of Quartz (Q). (c) Pure Phase Gypsum (Gy). ........................................................ 87
Figure 51. (a) Typical μ-XRD Pattern of a Soil Aggregate From the Intermediate Layer (10 -30 cm). Peaks Are Labeled With Mineral Names. Major Phases Identified Include: Hematite (H), Magnetite (M), Siderite (S), Wustite (W), Goethite (Gt), and a Possible Phase Birnessite. (b) The SXRF Spectra of a Soil Aggregate From the Subsurface With Various Fe Minerals as the Major Phases. Fe is the Dominant Element Associated With Extremely High Content of Zn and Significant Amount of Pb and As. .............................. 90
Figure 52. (a) Micro XRD Pattern of a Soil Aggregate From the Deep Part Intermediate Layer (20 -30 cm). The Dominant Phase was the Poorly Crystalline Sphalerite With Broad Peaks (labeled with Sp). Other Phases Include Magnetite, Hematite, Goethite, and Possibly Birnessite. (b) SXRF Pattern of a Soil Aggregate From The Subsurface With Sphalerite (ZnS) as the Major Mineral Phase. Zn is the Dominant Element in the Pattern. Fe, Pb and As Are Also Present at High Levels. ................................................................. 91
Figure 53. (a) Micro-XRD Pattern of a Soil Aggregate From the Deep Reduced Layer. The Pattern Shows a Major Phase of Galena (Ga) With Very Smooth Diffraction Rings. The Smooth 2D Diffraction Ring Indicates it is a Secondary Precipitate. The Broad Humps May Belong to Some Amorphous Material. (b) The SXRF Pattern of a Soil Aggregate From the Reduced Layer With Galena as the Major Phase. Pb is the Dominant Element in This Aggregate. ................................................................................................................ 92
Figure 54. (a) Micro-XRD Pattern of a Soil Aggregate From the Deep Reduced Layer. The Pattern Shows a Pure Phase of Realgar (R). The Inset Picture (area 1000 μm × 750 μm) is an Optical Microscopy Image of the Aggregate. (b) The SXRF Pattern of a Soil Aggregate From the Reduced Layer With Realgar as the Major Phase. Arsenic is the Dominant Element in This Aggregate. ................................................................................ 93
Figure 55. Bulk Powder XRD Pattern of the Natural Precipitates. Theoretical Patterns From the PDF Database Represented by the Different Colored Vertical Lines Were Also Included For Reference. Major Peaks Are Labeled With Mineral Names. Q = quartz, Gt = goethite, and Ak = poorly crystalline akaganeite. ............................................................ 98

viii
Figure 56. (a) Micro XRD Pattern of a Soil Aggregate From the Natural Precipitate. The Theoretical Pattern (PDF: 00-042-1315) is Represented by the Vertical Lines. (b) SEM. .... 99
Figure 57. (a) Micro-XRD Pattern of a Soil Aggregate That Contains Well-Crystallized Goethite. Gt = goethite. (b) Micro-XRD Pattern of a Soil Aggregate That Contains Poorly-Crystallized Goethite. (c) SEM Micrograph of a Soil Aggregate With Well-Crystallized Goethite as the Major Mineral Phase. ........................................................... 100
Figure 58. (a) Micro XRD Pattern of a Soil Aggregate From the Natural Precipitates. The Theoretical Patterns Are Represented by Different Colored Vertical Lines. Jt = jarosite, Q = quartz. (b) SEM Micrograph of the Same Aggregate. ................................................ 102
Figure 59. (a) Micro XRD Pattern of a Soil Aggregate From the Natural Precipitates. Sh = schwertmannite, Gt = goethite. (b) SEM Micrograph for a Soil Aggregate With Schwertmannite as the Major Mineral Phase..................................................................... 105
Figure 60. Micro XRD Pattern of a Soil Aggregate From the Natural Precipitates. Sh = schwertmannite, Jt = jarosite. ............................................................................................ 105
Figure 61. Micro XRD Patterns of Soil Aggregates From the Natural Precipitates With Schwertmannite, Akaganeite, and Goethite as the Major Mineral Phases. ....................... 106
Figure 62. (a) The SXRF Spectrum of a Soil Aggregate From the Surface Precipitates With Goethite as the Major Mineral Phase (μ-XRD Pattern of the Same Aggregate in Figure 49a). (b) The SXRF Spectrum of a Soil Aggregate From the Surface Precipitates With Akaganeite as the Major Mineral Phase (Figure 56). ........................................................ 107
Figure 63. Arsenic XANES Spectra of Three Arsenic Reference Compounds. The Three Vertical Dotted Lines Indicate the Absorption Edge Energy Positions of the Oxidation States of +2, +3, and +5, Respectively. ............................................................................. 109
Figure 64. Arsenic XANES Spectra of 4 Typical Aggregates From the Surface Layer (0 – 10 cm) Where Goethite and Akaganeite Are the Dominant Mineral Phases. The Vertical Dotted Line at ~11874 eV Indicates That As(V) Species Are Predominant. .................... 110
Figure 65. Arsenic XANES Spectra of 3 Typical Aggregates From the Intermediate Layer (10 – 30 cm). The Vertical Dotted Lines at ~11874 eV and ~11870 eV Indicate That This Layer Contains a Mixed Oxidation States of As(V) and As(III). .................................................. 111
Figure 66. Linear Combination Fit of Arsenic XANES Spectrum of an Aggregate From the Intermediate Layer With Magnetite, Siderite, and Hematite as the Major Mineral Phases.112
Figure 67. Arsenic XANES Spectra of 4 Aggregates From the Most Reduced Layer Where Realgar is the Dominant Mineral Phase. The Vertical Dotted Line at ~11868 eV Indicates That As(II) is Predominant Oxidation State in This Layer. ............................... 112
Figure 68. Normalized κ3-weighted EXAFS Spectra at the As K-edge For As-adsorbed Goethite (top) and As-adsorbed Akaganeite (bottom). ...................................................... 114
Figure 69. XANES Spectra For Chromium Reference Compounds. The Spectra Are Labeled With the Molar Ration Cr(VI) in Each Mixture. The Height of the Pre-edge Peak Increases Monotonically With Cr(VI) Content.................................................................. 114

ix
Figure 70. Cr K-XANES Spectra of Soil Aggregates From Different Depths. The Lack of a Significant Pre-edge Peak Indicates That Cr(III) is the Predominant Oxidation State Throughout the Soil Profile. .............................................................................................. 115

x
List of Tables
Table 1. Selected Army Facilities With High Concentrations of the Metals Considered in This Proposal. (From Bricka et al., 1994). ....................................................................... 4
Table 2. Examples of Published Studies of Soil Amendments Added to Contaminated Soil to Reduce Bioavailability. .................................................................................................... 7
Table 3. Physical, Chemical, and Contamination Data for Contaminated and Control Soils. ... 16
Table 4. Lead Smelter Soil Amendment Ratios. All Amendments Are Given on a Weight Basis. .............................................................................................................................. 17
Table 5. New Jersey and Utah Soil Amendment Basis. ............................................................. 17
Table 6. Exact Formulation of the Treatments Used in This Study. .......................................... 18
Table 7. Germination of Test Species as Impacted by Amendment and Medium. .................... 22
Table 8. Impact of Leaching on Germination of Test Species After Application of Amendments. .................................................................................................................. 23
Table 9. Treatments Selected for the Bioassays for the Smelter Site Soil. ................................ 23
Table 10. Treatments Tested on the Smelter Site Soil for the Arsenic Hyperaccumulating Ferns. .............................................................................................................................. 25
Table 11. Field Sampling Descriptions of the Soil Samples. ..................................................... 29
Table 12. Statistical Differences in Lead Smelter Soil Bioaccessible % of As, Cr, Cd and Pb (α = 0.05, n = 3; LSD: As = 2.55, Cr = 2.25, Cd = 4.85, Pb = 4.93). ............................. 37
Table 13. Statistical Differences in New Jersey Soil Bioaccessible % of As, Cr, Cd and Pb (α = 0.05, n = 3; LSD: As = 13.90, Cr = 1.41, Cd = 3.30, Pb = 8.68). ............................... 43
Table 14. Statistical Differences in Utah Soil Bioaccessible % of As, Cr, Cd and Pb (α = 0.05, n = 3; LSD: As = 11.06, Cr = 1.51, Cd = 10.49, Pb = 3.04). ................................ 44
Table 15. New Jersey and Utah Soil Amendment Ratios. ......................................................... 44
Table 16. Statistical Differences in Lead Smelter Soil TCLP Concentrations of As, Cr, Cd and Pb (α = 0.05, n = 3; LSD: As = 17.64, Cr = 0.24, Cd = 0.41, Pb = 8.22). ............... 47
Table 17. Statistical Differences in New Jersey Soil TCLP Concentrations of As, Cr, Cd and Pb (α = 0.05, n = 3; LSD: As = 0.60, Cr = 0.07, Cd = 6.43, Pb = 1.74). ....................... 52
Table 18. Statistical Differences in Utah Soil TCLP Concentration of As, Cr, Cd and Pb (α = 0.05, n = 3; LSD: As = 0.70, Cr = 0.38, Cd = 2.36, Pb = 0.25). .................................... 53
Table 19. New Jersey Soil Barley Germination Percent (no significant differences*). ............. 54
Table 20. New Jersey Soil Barley Root Weight (mg/germinated seed). .................................... 54
Table 21. New Jersey Soil Earthworm Survival (%). ................................................................ 55
Table 22. New Jersey Soil Earthworm Biomass Change (%). ................................................... 55
Table 23. Water Soluble Metal Content From New Jersey Soil Leachate. ................................ 56

xi
Table 24. Smelter Site Soil Lettuce Germination Percentage (%). ............................................ 57
Table 25. Smelter Site soil Lettuce Average Root Length (mm). .............................................. 57
Table 26. Smelter Site Soil Earthworm Survival (%). ............................................................... 57
Table 27. Smelter Site Soil Earthworm Biomass Change (%). .................................................. 58
Table 28. Smelter Site Soil Leached Barley Germination (%).* ............................................... 58
Table 29. Smelter Site Soil Leached Barley Root Weight (mg/germinated seed)*. .................. 59
Table 30. Smelter Site Soil Leached Earthworm Survival (%). ................................................. 60
Table 31. Smelter Site Soil Leached Earthworm Biomass Change (%). ................................... 60
Table 32. Water Soluble Metal Concentrations From Smelter Site Soil .................................... 61
Table 33. Hyperaccumulator Fern Shoot Metal Content. ........................................................... 62
Table 34. Utah Soil Lettuce Germination (%). ........................................................................... 63
Table 35. Utah Soil Lettuce Average Root Length (mm). ......................................................... 63
Table 36. Utah Soil Earthworm Survival (%). ........................................................................... 64
Table 37. Utah Soil Earthworm Biomass Change (%). .............................................................. 64
Table 38. Pure Phase Precipitation pH Experiments; As(V) and As(III) Combined With La(III) or Ce(III). ............................................................................................................ 72
Table 39. Bioaccessibility % of Arsenic With La and Ce Amendments Over Time in Lead Smelter Soil. ................................................................................................................... 74
Table 40. Bioaccessibility % of Chromium with La and Ce Amendments Over Time in Lead Smelter Soil. ................................................................................................................... 75
Table 41. Major Element Contents and Loss on Ignition (LOI) for the Samples. ..................... 80
Table 42. Trace Element Contents for the Samples. .................................................................. 81
Table 43. Summary of Major Mineral Phases Identified at Different Depths by Synchrotron Micro X-ray Diffraction of the Samples. ....................................................................... 88

1
I. Acknowledgments The authors of this report would like to acknowledge the support of the Purdue Departments of Agronomy and Civil Engineering. Technical assistance was provided by Steven Sassman of Agronomy and Changhe Xiao of Civil Engineering. Doug Smith of the United States Department of Agriculture/ARS Soil Erosion Laboratory provided invaluable help by making his Inductively coupled plasma available for analyses. Gnanasiri S Premachandra aided in spectroscopic analyses. Graduate students Agnes Szleszak, Micah Humphries, and Xiadong Gao were invaluable in the completion of this work.

2
II. Executive Summary The overall objective of this study was to attempt to remediate metal-contaminated soils by finding an amendment or combination of amendments that could be applied and reduce chemical lability and bioavailability. We located three soils that were contaminated with at least of the metals Pb, Cd, Cr, and As. The soils were characterized for an array of chemical and physical properties including total metals. All soils had a mixture of metals requiring attention, and made the remediation challenge much greater because the chemistry of each metal was quite different from the others. Our approach to finding remediation solution using in situ amendments was to sequentially address the metals with additives known to target at least one metal. We then examined the soils for chemical lability (concentrations of metals removed from the soil by an extractant), bioaccessibility (metals available for removal from the soil by a sequence of extractants demonstrated to be correlated with availability to a given organism), and biotoxicity.
Orthophosphate is a known, successful amendment for Pb, and this was our first amendment. Quite predictably, the addition of orthosphosphate decreased Pb but greatly increased As and sometimes Cr concentrations. Therefore, our challenge was to find additional amendments that could suppress the other metals without impacting the effect of phosphate on Pb. In laboratory studies, combinations of chemical amendments, including rare earth elements, Mn and P, were added to soil with low redox potential to reduce the bioaccessible fraction of As, Cr, Cd and Pb. Lanthanum and Ce were able to form low solubility precipitates with As, as determined in aqueous solutions. Spectroscopic studies confirmed that LaAsO4(s) can form under pH conditions as low as 2.2.
Cerium was not affected by the low redox potential or possible interaction with S, and the addition of Ce was able to decrease the bioaccessible As fraction, but was ratio and time dependent. Combination amendments of Ce, Mn and P showed promising results. With the addition of 1:5 Pb+Cd:Mn and Pb+Cd:P, bioaccessible Cd was reduced below detection limit and bioaccessible Pb was reduced to 11% compared to 66% in the control. Also, the addition of 1:3 As:Ce and any ratio of Mn and P were able to decrease the Cr bioaccessible fraction significantly compared with the control. The bioaccessible fraction of As increased with the addition of Mn and P, and Ce was unable to offset this decrease. There was a slight offset with the addition of 1:3 As:Ce, but this was not significant compared with 1:1 As:Ce.
Three metal-contaminated soils collected from field sites were amended with combinations of manganese, phosphorus and cerium. A sandy soil from a former cadmium paint pigment manufacturing site (New Jersey soil) was amended, but the amendments increased toxicity to earthworms. Amendments had no effect on barley germination but depressed root growth. When the same amendments were applied to an organic soil from a former smelter site (smelter site soil), earthworm survival improved, earthworms gained biomass, and had reduced metal tissue concentration compared to the unamended smelter site soil. A sandy loam soil with slightly elevated metal levels (Utah soil) was amended, and amendment addition caused reduced lettuce root length and significantly elevated Cd earthworm tissue concentration.

3
Speciation is the key factor in controlling mobility and bioavailability and information on the mineralogy and geochemistry of contaminant metals is important for developing in-situ remediation strategies. We sampled a Histosol that received runoff and seepage water from the site of a former lead smelter. We used the synchrotron x-ray microprobe on beamline X26A at the National Synchrotron Light Source at Brookhaven National Laboratory to obtain micro x-ray diffraction patterns (µ-XRD) and micro x-ray fluorescence patterns (µ-XRF) for soil aggregates ~100 – 200 μm in diameter. Arsenic and chromium x-ray absorption near edge structure (XANES) spectra were then obtained for aggregates with significant concentrations of arsenic or chromium. Results show a clear pattern of metal speciation changes with depth. The oxidized yellow surface layer (0 – 10 cm depth) is dominated by goethite and poorly crystalline akaganeite. Lead and arsenic are highly associated with these Fe oxides by forming stable inner-sphere surface complexes. The occurrence of akaganeite in a natural soil is reported for the first time in this thesis. Gypsum, schwertmannite, and jarosite were identified in the surface layer as well, particularly for samples collected during dry periods. Fe(II)-containing minerals, including magnetite, siderite, and possibly wustite occur in the intermediate layers (10 – 30 cm depth). The unusual presence of hematite and wustite in the subsurface horizons is probably the results of a burning event at this site. Iron, lead, and arsenic sulfide minerals predominate at depths > ~30 cm and phases included realgar, greigite, galena, and sphalerite, alacranite, and others. Most of these minerals occur as almost pure phases in sub-millimeter aggregates and appear to be secondary phases that have precipitated from solution. Mineralogical and chemical heterogeneity and the presence of phases stable under different redox conditions make this a challenging soil for in-situ remediation.

4
III. Background Metal Contamination at Department of Department Sites Department of Defense (DOD) installations are often highly active in the use of metals for dozens of uses. Considering that many of these facilities are over a century old, one would anticipate that some of these areas are quite contaminated from a variety of sources. Indeed, over 15,000 facilities require some level of clean-up. Activities that have led to contamination include electroplating, equipment maintenance, chemical processing, manufacture of munitions, recycling of batteries, and use of solvents of all kinds. Remediation is required to remove contaminant sources and reduce further spread.
Metals and metalloids (often collectively called "heavy metals") are major contaminants at federal installations. Firing range soils have Pb in concentrations of percentages (tens of thousands of parts per million) along with other metals (e.g., copper); soils near electroplating facilities often have very high concentrations of chromium; and pesticide applications (As, Pb, Cu), munitions manufacture, and open burning pits can contribute a large suite of inorganic contaminants. Heavy metals have been quoted as comprising five of the six most common hazardous substances at U.S. army installations (Bricka et al, 1994), and the top three are Pb, Cd, and Cr (Marino et al., 1997).
Some examples are given in Table 1 and include Letterkenny Army Depot with approximately 800 mg/kg total Cr from electroplating and Anniston Army Depot with up to 3,000 mg/kg; up to 27,000 mg/kg Pb at the Iowa Army Ammunition Plant; several hundred mg/kg As at Picatinny Arsenal from explosives disposal; and over 50 mg/kg Cd at Rocky Mountain Arsenal. These areas are in various stages of clean-up, but many contamination problems remain.
Table 1. Selected Army Facilities With High Concentrations of the Metals Considered in This Proposal. (From Bricka et al., 1994).
Location Heavy metals Source Anniston Army Depot Cr, Cd (2,500-3,000 mg/kg) Electroplating, mechanical work Fort Hood Pb, Cr, Cd Battery disposal, firing ranges Letterkenny Army Depot Cr(VI) Electroplating Lonestar Ammunition Plant Cr (45 - 1,100 mg/kg) Demilitarization of explosives Picatinny Arsenal Pb, As Explosive disposal, shell burial Pine Bluff Arsenal Pb, As (2,000 - 30,000 mg/kg) Munitions, testing, burning Radford Ammunition Plant Pb (up to 6%), As Lead recovery facility Ravenna Ammunition Plant Pb (900 mg/kg), Cr, Cd Munitions disposal; Cr ore storage Redstone Arsenal As Arsenic-based mustard gas prod. Rocky Mountain Arsenal As, Cd, Cr (all appx. 1000 mg/kg) Demilitarization, burning White Sands Missile Range Cr(VI), Pb (>1000 mg/kg) Laser test facility; Cr cooling
system

5
Soil Chemistry of Contaminant Metals The soil chemistry of As, Cd, and Cr have been studied in great depth, and we cannot hope to convey all of the details here. However, it is possible to present general trends that will dictate the most likely choices for soil amendments for the metals. One amendment will not be suitable for all metals because Cd is a moderately soluble divalent cation that is present in trace quantities, even as a contaminant; As occurs as oxyanions in the soil; and Cr can be either a trivalent cation or oxyanion. Arsenic: Similar to chromium, the behavior of arsenic (As) in soils is complex because of pH effects and oxidation-reduction reactions. Arsenic occurs in two oxidation states in soils. The oxidized form, arsenate, occurs as a negatively charged oxyanion (AsO4
3-) with pKa values 2.3, 6.8, and 11.6. At pH values < 6.8, the dominant species in soil and subsurface environments is H2AsO4
- and at pH values > 6.8, the dominant form is HAsO42-. For the reduced species,
arsenite, the dominant form at most soil pH values is the neutral oxyanion, H3AsO3o species (the
pKa values for arsenite are 9.2 and 12.7). Both arsenite and arsenate are sorbed on soil particles but have distinct sorption behavior. Because the charge on arsenate and arsenite is neutral to negative, only the positively charged surface components of soils will have the potential to interact with As species in the soil solution. The dominant surface charge on soil particles is negative; however, iron and aluminum oxides have positively charged surfaces and are considered to be the controlling solid phases of As. The surface chemistry of arsenate and arsenite are somewhat similar to that of phosphate. Arsenate sorption on amorphous Al and Fe oxides is characterized by an apparent sorption maximum at a pH value of 4 (Hsia, et al. 1994; Manning and Goldberg, 1997; Pierce and Moore, 1980; Pierce and Moore, 1982). In contrast, arsenite adsorption is characterized by a sorption maximum occurring in the pH range of 7 to 8.5 (Manning and Goldberg, 1997; Pierce and Moore, 1982). Arsenite sorption is more susceptible to ionic strength effects and it is generally held that arsenate is more strongly bound than arsenite (Goldberg and Johnston, 2001). Of the two forms, the reduced arsenite form is thought to be more toxic. Cadmium: Cadmium occurs in soils as a divalent ion, Cd2+. Typical Cd concentrations in uncontaminated soils are <1 mg/kg. Soils with >25 mg/kg are considered hazardous. The chemistry of cadmium in the soils has strong parallels to calcium. At high pH, Cd can precipitate as CdCO3(otavite), which is fairly insoluble (Lindsay, 1979). However, slow kinetics of reaction and low total Cd concentrations in soil often prevent otavite formation. Cation exchange and adsorption reactions with soil minerals and organic matter, and solid solution formation with CaCO3(calcite) at pH>7.5 are the major mechanisms of Cd2+ retention in soils. Due to its soil chemistry, Cd tends to be bioavailable compared to other heavy metals. Li et al. (2000) found Cd concentrations of approximately 3 mg/kg in fescue growing in contaminated soil (160 mg Cd/kg soil). Increasing the pH with limestone, adding biosolids, and amending the soil with Fe and P dramatically increased plant growth and decreased metal uptake.
Chromium: The chemistry of Cr in soils is fairly complex because it can occur in two oxidation states, Cr(VI) and Cr(III). The Cr(VI) is the biggest concern because it is present as CrO4
2- which is soluble, mobile, acutely toxic, and a Class A human carcinogen. Although CrO4
2- can sorb to

6
variable-charge surfaces, the retention of Cr(VI) in soil is quite weak. Thus, if electroplating solutions containing Cr(VI) are disposed onto the soil, few mechanisms will be present to retard its offsite movement. Cr(III) is present in soils as Cr3+ or hydrolysis species (e.g., CrOH2+), and it tends to readily precipitate as oxides. In contrast to the hexavalent Cr, Cr(III) is sparingly soluble, nontoxic, and an essential element in human health (James et al., 1997). The transformation from Cr(VI) to Cr(III) or vice versa occurs under moderately reducing conditions in soils. Hexavalent Cr readily reduces to Cr(III) which then precipitates as Cr(OH)3; this freshly precipitated solid phase can be reoxidized to Cr(VI) under the proper conditions (James and Bartlett, 1983). Aged Cr(OH)3 or the less soluble Cr2O3 tend to resist reoxidation. Once reduced, one can maintain Cr in the trivalent state by proper manipulation of pH, organic matter, and redox potential. Lead: Of all the metals found on DoD sites, Pb is usually the most ubiquitous and the least soluble. Of note is that lead is a secondary focus in this research project. The human health issues of Pb are well known: exposure to excessive levels of lead can cause brain damage; affect a child’s growth; damage kidneys; impair hearing; cause vomiting, headaches, and appetite loss; and cause learning and behavioral problems. In adults, lead can increase blood pressure and can cause digestive problems, kidney damage, nerve disorders, sleep problems, muscle and joint pain, and mood changes. Lead poisoning can occur from drinking water high in lead, breathing airborne particles, or direct ingestion of Pb contaminated soil. Because of the extent of Pb contamination and the severity of the health effects, Pb chemistry in soil has been studied extensively. In soils, Pb is found as Pb(II) in the solid and solution phases. Elemental or metallic Pb is thermodynamically unstable in soils, but oxidation of the metal is a very slow process and can require decades to reach completion. At high pH, Pb forms oxides and carbonates that are sparingly soluble; under acidic conditions, PbSO4(s) limits solubility. In the presence of excess apatite or soluble orthophosphate, chloropyromorphite can form, which reduces Pb solubility approximately 100-fold. The formation of this mineral has been confirmed by x-ray diffraction and other methods (Zhang and Ryan, 1998a, 1998b).
Soil Amendments to Reduce Bioavailability To overcome the numerous problems associated with metal contaminated soils, various soil amendments have been added to reduce metal lability. The addition of organic materials has been used for decades to overcome phytotoxicity of all kinds (Li et al, 2000.). Carboxylic acid groups, phenolics, amines, and other structural constituents have a strong affinity for metals through cation exchange, chelation, sequestration, and other similar mechanisms. For cationic species, increasing the pH through the application of limestone can reduce solubility and lability due to precipitation of solid phases, co-precipitation with Fe and Al oxides, and greater retention on pH dependent cation exchange sites of soil minerals and organic matter (Brown et al, 1997). These reactions can be further enhanced by adding organic matter, iron, and limestone simultaneously to the soil (Li et al., 2000). The presence of the organic matter also encourages movement of the limestone into the soil subsurface. One of the most interesting success stories is the addition of phosphate to Pb-contaminated soils to form chloropyromorphite and reduce lability. Chloropyromorphite, Pb5(PO4)3Cl, is highly

7
insoluble and has been shown to form readily in contaminated, P-amended soils (Zhang et al., 1998a, 1998b) and has reduced availability as measured chemically and biologically (Hetteriachchi et al., 2000; Pearson et al, 2000). The addition of manganese oxides further reduced bioavailability (Hetteriachchi et al., 2000). For metals that form oxyanions [Cr(VI), As(III), As(V)], increasing the pH through limestone addition can actually increase availability and adsorption by organic matter by itself may be an inadequate control. Therefore, another approach is needed. An important mechanism of retention for these anionic species is adsorption onto the reactive surface of Fe and Al (hydro)oxides (Goldberg and Johnston, 2001). Ferrous sulfate in conjunction with limestone to precipitate Fe oxides have been added to soils and successfully reduced As solubility and mobility (Moore et al., 2000; Miller et al., 2000). This approach can be used for Cr(VI), but reducing to Cr(III) is more desirable than simply retaining Cr(VI); not only is Cr(III) far less soluble than Cr(VI), it is not toxic. Hexavalent chromium can be reduced by organic matter (Wittbrodt and Palmer, 1997) or ferrous ion (Wang and Vipulanandan, 2001; Olazabal et al., 1997). Reduction to Cr(III) followed by precipitation in the presence of Fe and organic matter should be an excellent mechanism to reduce bioavailability. Table 2 summarizes some of the approaches used successfully to reduce metal lability in contaminated soils.
Table 2. Examples of Published Studies of Soil Amendments Added to Contaminated Soil to Reduce Bioavailability.
Metal Amendment Mode of Action Reference Pb
PO43-
PO4
3- + Mn oxide
Precipitate chloropyromorphite Chloropyromorphite and Mn adsorption
Zhang and Ryan (1999) and many others Hetteriachchi et al (2000)
Cd Organic matter, Fe Organic sequestration, Fe oxide co-precipitation
Brown et al. (1997)
As FeSO4 + limestone Strong surface adsorption on Fe oxide
Moore et al. (2000); Miller et al. (2000); Vogt (1993)
Cr Fe(II) + limestone + organic matter
Reduction of Cr(VI) to Cr(III) plus pptn as Cr2O3 or co-precipitation with Fe hydroxide
Wang and Vipulanandan (2001); James et al. (1997)
Spectroscopic Methods Beginning with the first reported study of water sorbed on montmorillonite (Buswell, et al., 1937), infrared (IR) and Raman methods have contributed significantly to our understanding of the structure, bonding and reactivity of soils. Using dispersive IR methods, early applications focused mainly on the identification and characterization of the bulk structural properties of soil minerals (Farmer, 1974; White and Roth, 1986). During the past 10 years, emphasis has shifted to study a broader range of naturally occurring solid phases that include both crystalline and amorphous, organic and inorganic constituents (Johnston and Wang, 2002). In many cases, the most reactive and important solid phases in soil and subsurface environments cannot be studied by traditional methods, such as powder x-ray diffractometry (XRD), because the particles are too

8
small or the solid phases are amorphous. In contrast, all environmental particles have a characteristic vibrational spectrum. Of relevance to this proposal, we seek to develop effective strategies to reduce the bioavailability of three target metals in soils. Vibrational spectroscopy, such as ATR-FTIR and Raman methods proposed here, provide new tools to study the surface chemistry of the target metals (Johnston and Aochi, 1996; Johnston and Wang, 2002). The solid-water interface is critically important in the retention, transformation, and transport of metals, physical support for plants and microorganisms, water quality, oxidation-reduction reactions, and the hydraulic conductivity of soils. Vibrational methods are well suited to studying these processes and a brief summary of the proposed objectives are outlined below. Two of the metals, As and Cr, are present as oxyanions and can be observed spectroscopically directly on the soil surface. Recently we have reported on a combined spectroscopic and sorption study of arsenate (AsO4
3-) and arsenite (AsO33-) sorption to amorphous iron and aluminum
oxides using ATR-FTIR and Raman methods (Goldberg and Johnston, 2001). The vibrational modes of these metal oxyanions are influenced by their proximity to the soil surface and were found to be sensitive to pH effects, type of surface (Fe versus Al oxide), and type of surface complex (inner sphere versus outer sphere). For the third target metal, Cd, this metal does not possess M-O bonds and does not have a vibrational signature in the mid-infrared region. To study the interaction of Cd in soils under the proposed amendment strategies, we will examine the solid phases of contact. Vibrational methods (ATR-FTIR and Raman) are also suitable methods to study this transformation.
X-ray Methods Identifying the mineral phase in which a contaminant metal resides is particularly important in determining metal bioavailability because different mineral phases containing the same elements can have widely different solubilities. XRD is the method of choice for identifying specific minerals in complex mixtures. Unfortunately, the lower limit for detection for trace mineral phases by x-ray diffraction using a standard, sealed-tube laboratory x-ray source is not very good, and even in the very best of situations 3 to 5% (30,000 to 50,000 mg/kg) of a minor phase may be difficult or impossible to detect. A major limitation of conventional x-ray diffraction procedures is that several hundred milligrams of sample are usually needed to obtain useable x-ray powder diffraction patterns. Even though a contaminant metal could be concentrated in only a few sub-millimeter sized areas, this situation cannot be distinguished from the same element homogeneously distributed throughout the soil matrix. The bioavailability and the effectiveness of any potential remediation procedures is likely to be very different for a contaminant metal homogeneously distributed throughout the soil matrix versus the same element concentrated into a few small "hot spots." As we point out below, synchrotron-based micro x-ray diffraction has the potential to provide important information even when conventional, laboratory-based x-ray diffraction does not.

9
Bioassays for Acute and Chronic Toxicity Very few metals actually warrant concern about toxicity due to soil contamination. Most metals are relatively insoluble and form solid phases, are co-precipitated with other oxides, or are strongly complexed by organic matter. Thus, many elements "are not absorbed by or toxic to animals even when element-rich soils are ingested (e.g., Cr3+, Sn, Ti, Ag)," (Chaney et al., 1999). Plant uptake for As, Cu, Hg, Ni, and Ba is not an important pathway. Thus, the list of metals or metalloids that can be accumulated by plants and passed on to animals is rather short: Se, Cd, and possibly Co. Properly designed and executed research can be used to assess the risk potential of metal-contaminated soils. These studies then can be used as the basis for defining acceptable levels of contamination and assist in making choices about contaminants in soil and soil ecosystems. A complete toxicity assessment of contaminated soil should involve assays using plants, soil microorganisms, and soil invertebrates. Phytotoxicity Assays: Plant toxicity assessments are particularly relevant when phytotoxic contaminants are present in soil. In germination studies, seeds are planted in a small quantity of the contaminated soil and seedlings counted after an extended incubation period. In root elongation studies, the length of the root is assessed after incubation with the contaminated material. Results are compared to seedling enumeration and root length in uncontaminated control soil. Both seed germination and root elongation have been shown to decrease significantly in contaminated soil (Chang et al., 1992). Invertebrate Bioassays: Soil invertebrate toxicity assessments are important because earthworms have been linked directly to soil health and are an essential part of the terrestrial food web. Earthworms are exposed to contaminants both in the aqueous and sorbed phases. Toxicity may be quantified by measuring changes in worm biomass and reproduction. Bioaccumulation also can be easily assessed using earthworms. The US EPA recommends toxicity testing for contaminated soil using mortality measurements on earthworms (Eisenia foetida) (ECO Update, 1994, USEPA 540-F-94-012). Microbial Bioassays: The Environmental Protection Agency (EPA) also suggests including microbial toxicity tests (ECO Update, 1994), when developing a toxicity assessment protocol. Microtox is a common toxicity test using phosphorescent bacteria (Vibrio fischeri) and is used primarily to evaluate toxicity in aqueous samples. However, the applicability of Microtox to soil samples is questionable (Harkey and Pradhan, 1998). A more acceptable soil based protocol, such as microbial activity measurements, should be incorporated into a thorough screening evaluation. Assessment of the impact of contaminants on the microbiological community is an important mechanism to assess bioavailability.
Plant Uptake by Hyperaccumulator Plants as an Indicator of Bioavailability In the previous section, we discussed how sensitive plant species can be used as indicators of metal bioavailability. These plants will express symptoms of phytotoxicity at much lower metal bioavailability than most species. In sharp contrast, hyperaccumulator plants are indicators of high total concentration of specific metals in soils, even when bioavailability is not high. Hyperaccumulator plants have highly enhanced ability to extract metals from contaminated soils, as much as 1000 times that of non-hyperaccumulators (McGrath et al., 2001). Metal

10
concentrations in the plant tissue are a direct reflection of total metal content. The plant species also could be excellent bioindicators of the efficacy of efforts to reduce bioavailability in highly contaminated soils. These species are remarkable scavengers for metals, and uptake will be reduced only when bioavailability is effectively shut down. Hyperaccumulator species include Thlaspi caerulescens and Brassica juncea for Cd (McGrath et al, 2001), and a recently discovered fern for arsenic (Ma et al., 2001; Francesconi et al., 2002). Although a true hyperaccumulator has not been identified for Cr, sunflower has the ability to accumulate elevated concentrations (Davies et al., 2001) as does water hyacinth (Lytle et al., 1998). These plants can accumulate greater than 10,000 mg/kg of the metal for which they are specific. Their ability to attain these concentrations without phytotoxicity makes them effective hyperaccumulators but will also make them intriguing bioindicators of metal lability. Objective The overall objective of this research project is to significantly and measurably reduce the bioavailability and chemical mobility of arsenic, chromium, and cadmium in contaminated soils through the addition of soil amendments that bind the metals in place. Lead also was studied to a lesser extent to confirm experimental results. Amendments were selected based on our knowledge of the chemistry of metals in soils coupled with empirical approaches published in the scientific literature. Chemical bonding to soil surfaces, changes in speciation, and the chemical environment of the stabilized metals were verified using advanced spectroscopic and x-ray techniques.

11
IV. Tasks and Milestones
Task 1. Site Selection and Sample Collection Task 1.1 Site Selection: Based on contamination information, each site must have significant contamination of target metals. The presence of other contaminants is not an impediment. The chosen amendment strategies are not exclusive to other metals and should not be antagonistic. However, we will keep in mind that multiple metals could be confounding in those biological tests that are not specific to a certain metal and when more than one metal is present at high enough concentration to be toxic. Task 1.2 Soil Sampling: Contamination will be confirmed on-site with a field-portable x-ray fluorescence spectrometer. We will avoid unusual or extreme environmental conditions (flooded, buried soils), however, typical but challenging soils will not be dismissed.
Task 1: Sample Collection
Task 2: Soil Characterization
Task 3: Laboratory Application of Amendments
Task 4c: Spectroscopy
Task 5: Data Analysis and
Protocol Development
Task 4a: Chemical Assays
Task 4b: Bioassays
Task 4d: X-ray Analysis

12
Task 2. Soil Characterization Soil characterization will follow published protocols for classification, chemical properties, and physical properties. Task 2.1 Soil Classification. Classification will be evaluated using USDA soil survey maps. Task 2.2 Soil chemical properties. Measured properties will include: pH, organic C, cation
exchange capacity, contaminant and total metals, soluble salts. Task 2.3 Soil physical properties. The properties to be assessed include textural analysis,
water retention, infiltration, surface area. These properties will be used to determine proper approaches to amendments and use of bio-indicators.
Task 3. Laboratory Evaluation of Amendments Various amendments will be chosen based on the following: a) potential efficacy for one or more target metals, and b) availability and ease of application/mixing on a practical level. Amendments will be tested using a systematic approach. Each will be added at several concentrations based on predicted need, prior experience and published results. Mixing and equilibration also will be test parameters. The quantity of amendment will be dependent on the type of amendment and, sometimes, the level of contaminant in the soil. Inorganic applications such as phosphate or ferrous sulfate will be determined based on contaminant concentration. Organic amendments are nearly always applied in the range of 1 to 10% by weight.
A successful amendment program will need no reapplication. Data in the biosolids and stabilization literature support this, but a single application may prove not to be enough. The need for reapplication will be evaluated as part of Task 4. Reapplication will be followed by retesting. Extended testing of single applications is part of our overall design.

13
Task 4. Assays of Bioavailability and Analytical Methods
Task 4a. Application of Chemical Assays Chemical extractants can reflect metal lability. Weak salt extracts reflect water solubility and thermodynamic activities. Stronger salts tap “ion exchangeable” pools. Synthetic chelating agents extract metals that would be available over longer terms. Some extractants are specific to certain metals. Exchangeable pools, EDTA and DTPA are excellent for cations. Anionic extractants can be used for arsenic and Cr(VI) species, along with hydroxide, bicarbonates, and EDTA for organics. A chemical extraction protocol will be chosen and used on each amended soil based on the parameters listed in 2c.
Task 4b. Bio-Indicator Assays Phytotoxicity Assays: Seed germination, root elongation, and metal uptake can be correlated to metal bioavailability. All three methods will be used to assess the toxicity of the contaminants before and after amendments have been applied. Invertebrate Bioassays: Earthworms, particularly Eisenia foetida, are considered representative soil macroinvertebrates. Toxicity tests using earthworms will be conducted throughout the study. Microbial Bioassays: Microbial respiration will be evaluated by substrate induced respiration. Hyperaccumulator plants as bioavailability indicators: Hyperaccumulator plants have a highly enhanced ability to extract metals from contaminated soils. These plants will be grown in amended and unamended soil and uptake of heavy metals will be assessed over time to determine changes in the bioavailable fraction.
Task 4c. In Situ Surface Spectroscopy (IR and Raman) The rationale for using surface spectroscopy is that while the general soil chemistry of As, Cr, and Cd is understood, the chemical mechanisms underlying the behavior are not. Information about the surface chemistry of these metals can only be obtained using in situ surface spectroscopic methods. Specifically, As and Cr(VI) contaminants have sensitive vibrational chromophores and sensitive to pH, oxidation, surface interactions. With our experimental approach, the metals directly observable with in situ vibrational methods are Cr and As. Solid phases are influenced by the presence of metals (SOM, carbonates, clay minerals and oxides). This assessment will be conducted at Purdue under the direction of Dr. Cliff Johnston.

14
Task 4d. X-ray and Synchrotron Methods. The limitations of conventional x-ray diffraction are that the method requires 100+ mg samples, and the contaminant metal may be concentrated in sub-millimeter size areas. Also, concentrated areas of metals cannot be distinguished by XRD from the same element homogeneously distributed throughout the soil matrix. On the other hand, synchrotron-based micro x-ray diffraction can provide important fundamental information that conventional, laboratory-based x-ray diffraction does not. The unique characteristics of facilities such as those at Brookhaven create excellent analytical opportunities for inhomogeneous media. We will use the facilities at the National Synchrotron Light Source Brookhaven National Laboratory, specifically, the synchrotron x-ray microprobe on beamline X26A, to examine 30 μm thin sections. The microprobe, with an incident beam size that is now routinely 10 x 10 μm, will provide: a) elemental quantification using x-ray fluorescence (XRF) analysis, b) elemental oxidation state and some speciation information from x-ray absorption (XAS) spectroscopy, and c) phase identification from x-ray diffraction (XRD) for the contaminants in amended and un-amended soil.
V. Materials and Methods
Task 1. Site Selection and Sample Collection Three contaminated soils and three control soils were used in these experiments:
Smelter site soil: This soil was collected in Indiana and was found in a wetland environment. It is characterized as a muck soil. Arsenic, chromium, cadmium and lead levels are elevated above worldwide mean and US EPA Eco-Soil Screening Levels. Samples were collected from the field in a saturated condition from a depth of 0-30 cm and stored saturated in sealed containers at 7° C.
Utah soil: This soil was collected near Salt Lake City, Utah at a military owned site. The site was an enclosure where contaminated materials/soils were brought for holding. Cadmium, chromium and lead are above both the worldwide mean and US EPA Eco-Soil Screening Levels, but arsenic is only elevated compared to the worldwide mean. The soils were located near the Great Salt Lake in an arid environment. Samples collected had with very little water content, were sieved to 2 mm and stored at room temperature.
New Jersey Soil: This soil was collected from Newark, New Jersey at a site that had been a cadmium pigment manufacturing plant. Cadmium and lead levels are above both the worldwide mean and US EPA Eco-Soil Screening Levels, arsenic is only elevated compared to the worldwide mean, and chromium is below both worldwide mean and US EPA Eco-Soil Screening Levels. Samples were taken from the surrounding abandoned lot, sieved to 2 mm, allowed to air-dry and stored at room temperature.

15
Task 2. Soil Characterization
Task 2.1 Soil Characterization All of the soils used in this study were either drastically disturbed or had been transported to a holding facility (Utah soil). Thus, traditional soil characterization was not possible.
Task 2.2 and 2.3 Chemical and Physical Properties Samples were sent to MDS Harris Laboratories and analyzed using the following methods: texture by hydrometer measurement; pH by 1:1 soil/water slurry; cations/CEC by ammonium acetate extraction and ICP analysis; organic matter by loss on ignition; phosphorus by Bray P1 extraction; nitrate-N by visible spectrometry after cadmium reduction; sulfur by monocalcium phosphate extraction followed by ICP determination; boron by hot water extraction (ICP determination); trace elements by DTPA extraction (Sparks 1996). Total metal concentrations were obtained by strong acid digestion with two grams of soil mixed with 12.5 mL of 4 M HNO3 in digestions vials. The samples were heated at 80° C for 16 hours and analyzed for As, Cr, Cd and Pb by inductively coupled plasma spectroscopy (ICP). Table 3 presents soil parameters for all soils obtained from MDS Harris Labs. The agronomic properties of the soils are not unusual. The pH values fall in the typical range, as do texture, water holding capacity, cation exchange capacity, and available nutrients. Soluble salts (EC) are elevated for the Utah and Smelter site soils, and the Smelter site soil also has very high organic carbon that reflects its wetland environment. For the contaminant metals, the New Jersey soil has very high Cd and Pb; the Utah soil is elevated in Cr; and the Smelter site soil is high in As, Cr, Cd, and Pb. None of the other extractable metals or anions are noteworthy.
Task 3. Laboratory Evaluation of Amendments. Determining the best amendments for these soils was an iterative process. We originally chose a number of amendments known or speculated to interact with the targeted metals, and tested them. Those that failed completely were eliminated; those with promise were studied further with modification. Other amendments were added as well. Initially, orthophosphate and lanthanum were tested. Subsequent tests involved manganese oxides and cerium. Most of the focus was placed upon the Smelter site soil because it represented exactly the situation we were addressing: a site highly contaminated with several metals. However, the high organic matter and flooded field conditions complicated the chemistry. In the initial tests, about 300 g of previously dried and sieved (below 2 mm) soil was transferred to a plastic container and distilled water was added above the water capacity (~80 to 100%), resulting in moist, not saturated, soil. Lanthanum(III) (LaCl3·7H2O) was added and mixed in ratios of 1:3, 1:10 and 1:30 of As:La (based on weight ratios of 1700 mg As/kg soil). All amendment ratios described in this chapter were based on mass. These ratios correspond to the mole ratios of As:La: 1:1.25; 1:4.15; and 1:12.5, respectively. An unamended control soil was also maintained throughout the experiment (control 1). Control 2 designates soil that was taken

16
directly from the dried and sieved (below 2mm) soil, and sieved below 250 μm and used as a subsample. Subsamples (100 g) were removed after 1, 7, 90 and 180 days, sieved through a 250 μm sieve, and analyzed as described below.
Table 3. Physical, Chemical, and Contamination Data for Contaminated and Control Soils.
New Jersey Soil Texture loamy sand As (mg/kg) 13 Mg (mg/kg) 290 pH 8.2 Cr (mg/kg) 36 Ca (mg/kg) 3750 E.C. † (dS/m) 0.62 Cd (mg/kg) 1540 SO4 (mg/kg) 56 SAR 0.31 Pb (mg/kg) 1700 Zn (mg/kg) 45 CEC (cmolc/kg)
22 B (mg/kg) 1.2 Mn (mg/kg) 12
OM (%) 2.3 Na (mg/kg) 29 Cu (mg/kg) 6 Water holding cap. (%, w/w)
20 NO3- (mg/kg) 4 Fe (mg/kg) 13
Eh (mV) 480 K (mg/kg) 207 P (mg/kg) 5 Utah Soil Texture sandy loam As (mg/kg) 17 Mg (mg/kg) 210 pH 7.4 Cr (mg/kg) 260 Ca (mg/kg) 3750 E.C. (dS/m) 2.5 Cd (mg/kg) 48 SO4 (mg/kg) 65 SAR 0.9 Pb (mg/kg) 97 Zn (mg/kg) 18 CEC (cmolc/kg)
22 B (mg/kg) b.d. Mn (mg/kg) 7
OM (%) 2.4 Na (mg/kg) 79 Cu (mg/kg) 2 Water holding cap. (%, w/w)
21 NO3- (mg/kg) b.d. Fe (mg/kg) 23
Eh (mV) 400 K (mg/kg) 344 P (mg/kg) 18 Smelter site soil Texture loam As (mg/kg) 2700 Mg (mg/kg) 103 pH 5.9 Cr (mg/kg) 1000 Ca (mg/kg) 1540 E.C. (dS/m) 4.1 Cd (mg/kg) 170 SO4 (mg/kg) 5620 SAR 1.7 Pb (mg/kg) 3400 Zn (mg/kg) 37 CEC (cmolc/kg)
30 B (mg/kg) 1.7 Mn (mg/kg) 40
OM (%) 24 Na (mg/kg) 134 Cu (mg/kg) 1.2 Water holding cap. (%, w/w)
71 NO3- (mg/kg) 3 Fe (mg/kg) 180
Eh (mV) 160 K (mg/kg) 39 P (mg/kg) 5 E.C. – electrical conductivity; water holding cap – water holding capacity as a percent by weight; S.A.R. – sodium adsorption ratio; CEC – cation exchange capacity; OM – organic matter

17
In subsequent tests, for the lead smelter soil, 400 g of wet soil was transferred to a plastic container. For New Jersey and Utah soils, about 300 g of dry soil was transferred to a plastic container and 21% distilled water was added (by weight). Three amendments were added to the soils: cerium(III) (LaCl3·7H2O), based on As concentrations; manganese oxide (KMn8O16) and phosphate (KH2PO4), based on both Pb and Cd concentrations. Cryptomalane was used as the Mn oxide and was prepared in the laboratory according to the procedure described by McKenzie (1971). For the lead smelter soil, ratios of amendments described in
Table 4 were used. For New Jersey and UT soil, ratios of amendments are described in Table 5. The ratios for lead smelter soil are: 1:0.5, 1:2, and 1:5 Pb and Cd to Mn and P and the same ratios added with 1:1 or 1:3 As to Ce. Ce was added at ratios of 1:1 and 1:3 alone into the soil. In the New Jersey soil and Utah soil ratios of 1:05 and 1:5 Pb and Cd to Mn and P were added, and the same ratios were added together with 1:1 As to Ce ratio. As in the lead smleter soil, 1:1 As to Ce was added alone to New Jersey and Utah soils. Table 4. Lead Smelter Soil Amendment Ratios. All Amendments Are Given on a Weight Basis.
Ce Ratios Mn and P Ratios
1:0 1:0.5 1:2 1:5
1:0 x x x x
1:1 x x x x
1:3 x x x x
Table 5. New Jersey and Utah Soil Amendment Basis.
Ce Ratios Mn and P Ratios
1:0 1:0.5 1:5
1:0 x x x
1:1 x x x
The ratios described throughout this report are based on the weight ratios. An unamended control soil was also maintained throughout the experiment (control 1). Subsamples (200 g) were removed after 2 and 30 days, dried and sieved through a 250 μm sieve, and analyzed as described below. After the amendments above had been evaluated with rapid chemical tests, many were assessed with bioassays. The amendment approach had to be modified somewhat for the bioassays. Several amendments were applied to the contaminated soils, and a control soil of similar type was given the same amendment treatments to determine the effect of the amendments themselves on the biological organisms in each assay. The amendments were added based on the amount of metals in the contaminated soils, with ratios based on weight. Three amendment constituents were chosen based on previous work by Szlezak (2006): cryptomelane (KMn8O16 – potassium

18
manganese oxide), potassium phosphate (KH2PO4), and cerium chloride (CeCl3•7H2O). For all amendment additions, the amount added was based on a weight ratio. For the smelter site soil, addition of cryptomelane and potassium phosphate was at a ratio of 1:5 Mn:Pb and P:Pb based on Pb content, and addition of cerium chloride was at a ratio of either 1:3 or 1:1 Ce:As and was based on the As content. For the New Jersey and Utah soils, addition of cryptomelane and potassium phosphate was at a ratio of 1:5 Mn:Pb+Cr (based on Pb and Cr content combined), and addition of cerium chloride was at a ratio of 1:3 Ce:As+Cd (based on the As and Cd content combined). Treatment structure for each of the sets of soil is shown in Table 6. Table 6. Exact Formulation of the Treatments Used in This Study. Smelter Site Soil
--- Amendment added per 150 g --- Treatment Amendment KMn8O16 KH2PO4 CeCl3
1 Smelter 0 0 0 2 Smelter, pH 6.5 0 0 0 3 Smelter, pH 6.5, Mn & P (1:5) 3.39 10.55 0 4 Smelter, pH 6.5, Mn & P (1:5), Ce (1:3) 3.39 10.55 3.25 5 Smelter, pH 6.5, Mn & P (1:5), Ce (1:1) 3.39 10.55 1.08 6 Peat (control) 0 0 0 7 Peat, pH 6.5 0 0 0 8 Peat, pH 6.5, Mn & P (1:5) 3.39 10.55 0 9 Peat, pH 6.5, Mn & P (1:5), Ce (1:3) 3.39 10.55 3.25
10 Peat, pH 6.5, Mn & P (1:5), Ce (1:1) 3.39 10.55 1.08 New Jersey Soil
--- Amendment added per 150 g --- Treatment Amendment KMn8O16 KH2PO4 CeCl3
1 New Jersey Soil, Leached 0 0 0 2 New Jersey soil, Mn&P (1:5), Leached 0.06 10.68 0 3 New Jersey Soil, Mn&P (1:5), Ce (1:3),
Leached 0.06 10.68 0.06
4 Sand, Leached (control) 0 0 0 5 Sand, Mn&P (1:5), Leached 0.06 10.68 0 6 Sand, Mn&P (1:5), Ce (1:3), Leached 0.06 10.68 0.06
Utah Soil
--- Amendment added per 150 g --- Treatment Amendment KMn8O16 KH2PO4 CeCl3
1 Utah soil 0 0 0 2 Utah soil, Mn&P (1:5) 0.08 1.18 0 3 Utah soil, Mn&P (1:5), Ce (1:3) 0.08 1.18 0.0 4 Loam (control) 0 0 0 5 Loam, Mn&P (1:5) 0.08 1.18 0 6 Loam, Mn&P (1:5), Ce (1:3) 0.08 1.18 0.0

19
In all cases, each experimental unit was prepared individually as recommended by our statistics expert (Judy Santini, personal communication). Each amendment was added to deionized water and the solution (for P and Ce) or suspension (Mn) was mixed into the soil. The pH was adjusted to 6.5 with calcium oxide on all treatments except treatment 1 and 6 on the smelter site soil set. The pH was adjusted to provide adequate growing conditions for the organisms. For the New Jersey and Utah soils and their respective control soils, pH was at an adequate level and no adjustment was necessary. Upon completion of the smelter site lettuce germination and earthworm survival assays, we observed that the amendments had a negative effect on the peat treatments. After reviewing the amendment amounts and performing further tests, we found that the high amount of potassium phosphate added as a source of P resulted in very high soil electrical conductivity (EC). This high EC, approximately 22 mS/cm, was indicative of high salinity and the main cause of toxicity in the peat soils.
Task 4. Assays of Bioavailability and Analytical Methods
Task 4a. Application of Chemical Assays Metals by Acid Digestion Total metal concentration was quantified with a strong acid digestion method that dissolves almost all elements that could be environmentally available (Sposito et al., 1982). Elements bound to silicate structures will not be dissolved by this procedure. Two grams of soil were measured and mixed with 12.5 mL of 4 M HNO3 in digestion vessels. The samples were heated at 80° C for 16 hours and analyzed for As, Cr, Cd, and Pb by inductively coupled plasma spectroscopy (ICP). PBET The Physiologically Based Extraction Test (PBET) was used to evaluate the bioaccessible fraction of As, Cr and Pb in soil. This fraction is assumed to represent the greatest fraction of total arsenic that can be released into a child’s system. The PBET used in this project was developed by M. Barnett (personal communication) in collaboration with M. Ruby. The extraction solution was prepared as follows (all chemicals were reagent grade unless stated otherwise): Glycine (60.06 g; G48-500 Fisher Scientific) was added to 1.9 L of distilled deionized water and heated in a water bath to 37° C. Hydrochloric acid was added until the solution reaches pH of 1.5 ±0.05 for As and Cr tests and pH 2.3 ±0.05 for Pb tests (the pH meter was calibrated with buffer solutions that also are heated to 37° C). The volume of the solution was brought to 2 L (creating 0.4 M glycine). Approximately 1.00 g (±0.005 g) of <250 μm soil was transferred to a 125 mL plastic bottle and 100 mL of extraction fluid (37° C) was added. Samples are rotated at 30 rpm in 37° C water bath. After 1 hour, samples were removed, filtered through a 20 μm cellulose acetate syringe filter into a 15 mL centrifuged tube and stored at 4° C until analysis. Analyses were performed by ICP and the bioaccessible fraction was calculated using the equation:
. [ / ]* 0.1% *100.[ / ]* [ ]
conc from PBETorIVG mg LBioaccessibilitytotal conc mg kg weight used in PBETorIVG mg
=

20
IVG To assess cadmium, the bioaccessibility modified in vitro Gastrointestinal (IVG) method (Rodrigez et al., 1999) was used. The modifications allow reduced sample sizes, but the ratios of soil to solution were the same. Gastric phase solution consisted of 0.15 M NaCl and 1% porcine pepsin. In a 125 mL plastic bottle, 100 mL of solution was added to 0.67 g of soil (final weight is recorded), and the solution was adjusted to pH of 1.8 by addition of hydrochloric acid. Samples were shaken for 1 hour at 37° C, centrifuged for 15 minutes, and filtered through 2 μm filter. The solution was adjusted to pH below 2 and samples were analyzed for Cd by ICP. The second step of this extraction, which mimics the conditions in the intestine, was not well correlated with the in vivo test, so only the first step replicating the gastric phase was conducted. TCLP EPA’s Toxicity Characteristic Leaching Procedure 1311 was modified by Jinling Zhuang (Auburn University, personal communication, 2004) to allow the procedure to be easier to use and enable a greater number of samples to be tested. After reviewing the literature, most of the TCLP experiments are performed in a similar way. Depending on the soil pH, different extraction fluids were used. To determine which fluid to use, 5 g of soil was placed in a 250 mL Erlenmyer flask and 96.5 mL of deionized water was added. The sample was covered with a watch glass and stirred vigorously for 5 minutes using a magnetic stirrer. The pH of the liquid phase was measured and recorded. If the solution is pH<5, then extraction fluid #1 was used for the procedure. If pH>5, 3.5 mL of 1 M HCL was added to the sample and swirled briefly. The sample was heated at 50° C in a water bath for 10 minutes. The pH of the liquid phase is measured and recorded again when the sample was cooled to room temperature. If the solution had a pH<5, extraction fluid #1 was used. If the solution had a still pH>5, extraction fluid #2 was used. Extraction Fluid #1: Approximately 500 mL of distilled deionized water was placed into a 1 L volumetric flask and 5.7 mL of glacial acetic acid (CH3CH2OOH) was added. The solution was mixed and 64.3 mL of 1 M NaOH was added The solution was brought to 1 L with distilled deionized water. The pH was 4.93±0.05. Extraction Fluid #2: Approximately 500 mL of distilled deionized water was placed into a 1 L volumetric flask and 5.7 mL of glacial acid was added. The volume was brought to 1 L with distilled deionized water. The pH was 2.88±0.05. In a 125 mL plastic bottle, 5 g of soil was placed with 100 mL TCLP fluid. The sample was rotated for 18 hours at 30±2 rpm at 23° C. Afterwards, the sample is centrifuged for 10 min. The pH of the extract was measured, and 14.5 mL of extract was filtered through a 20 μm cellulose acetate disk filter. The sample was acidified with 0.5 mL of nitric acid and stored in a refrigerator at 4° C until analysis for As, Cr, Cd and Pb on ICP. If any of the metals were below detection by ICP, that metal was analyzed using graphite furnace atomic absorption spectrometry. According the to protocol, the soil was classified as hazardous waste if TCLP extract concentrations are equal to or greater than 5 mg/L for As, 5 mg/L for Cr, 1 mg/L for Cd and 5 mg/L for Pb. Shaker The shaker (used for PBET, IVG and TCLP) was constructed for this project and is shown in Figure 1. The shaker has the capacity to rotate at 30 rpm and maintained water

21
temperature of 37° C. Sixteen samples will fit in the shaker, so that it can accommodate the modified versions of all tests in this study. The modification consisted of constructing the shaker somewhat smaller for 125 mL plastic bottles and not 1L bottles as recommended by the EPA.
Figure 1. Shaker for PBET, IVG and TCLP experiments. Quality Control For quality control, the time between the end of the extraction on the shaker and filtration was less than 90 minutes or the test was repeated. All samples were run in duplicate. For every 13 samples, one blank, one soil of known concentration (NIST SRM 2711 National Institute of Standards and Technology, Standard Reference Material Program, Room 204, Building 202, Gaithersburg, Maryland 20899) and one control (unamended; control 2) soil were run. The pH of the remaining extract for PBET and IVG tests were measured in the sample bottle; if the pH was not within ±0.5 pH units of the starting point, the test was discarded and re-run.

22
Task 4b. Bioassays. Screening Test for Species with Salt Tolerance To account for the high salts resulting from the amendments, two screening tests were performed to determine 1) alternative plant species that might be resistant to such high EC and 2) the effect of leaching the soil after adding amendments on germination of the alternative species. Because the NJ soil and the smelter site soil both would receive high amounts of potassium phosphate, the two control soils (sand and peat) were used for the screening. The control soils received approximately 10 g potassium phosphate per 150g soil, an amount similar that applied to the contaminated soils. Another set of control soils remained unamended. Four alternative plant species were chosen: Japanese millet, oat, barley, and spring wheat. Each of these species was planted in the soil/treatment combinations: peat unamended, peat amended with potassium phosphate, sand unamended, and sand amended with potassium phosphate. The germination of the seeds was tested on wet paper towels prior to the experiment and found to be 85% or greater. All treatments were adjusted to pH 6.5 with the addition of calcium oxide as necessary. Approximately 100 g of soil was placed on a Petri dish, 40 seeds of each species were placed on the moist soil and covered with 16 mesh sand. The samples were placed in a controlled growth chamber (Percival Scientific model 136LLVL) at 24° C with two days of dark, followed by three days with a cycle of 16 hours light followed by 8 hours of darkness. No alternative plant species were able to germinate when amendments had been added (Table 7). The 10% germination for the Wheat P Peat treatment had only 2-3 plants germinate and those plants were very weak and hardly broke the surface of the soil. Table 7. Germination of Test Species as Impacted by Amendment and Medium.
Species/Trt. Germination (%)
Oats 0 Peat* 100 Oats P Peat 0 Oats 0 Sand 95 Oats P Sand 0
Barley 0 Peat 100 Barley P Peat 0 Barley 0 Sand 100 Barley P Sand 0 Millet 0 Peat 95 Millet P Peat 0 Millet 0 Sand 95 Millet P Sand 0 Wheat 0 Peat 100 Wheat P Peat 10 Wheat 0 Sand 100 Wheat P Sand 0

23
Screening Test for Leaching In a test similar to the alternative species screening, a slight modification of the treatment structure was used. For each test species, the two soil types were used, and for each species three of each soil type were amended and then leached with one, two or three pore volumes of water. A pore volume was estimated by adding water to the saturation point, draining, and quantifying the amount of water that drained. A total of six treatments were established for each soi: sand amended and leached once, sand amended and leached twice, sand amended and leached three times, peat amended and leached once, peat amended and leached twice, and peat amended and leached three times. Results are presented in Table 8.
Table 8. Impact of Leaching on Germination of Test Species After Application of Amendments.
Species/Trt 1 PV* 2 PV 3 PV
Oat/Sand 70 100 100 Oat/Peat 95 90 95
Wheat/Sand 90 100 100 Wheat/Peat 95 95 75 Barley/Sand 100 100 100 Barley/Peat 100 100 100 Millet/Sand 100 90 95 Millet/Peat 95 90 95
*PV = pore volume No species performed poorly in general, but barley tended to be the strongest in terms of germination with the least amount of leaching. From these data, we chose to use barley as a replacement species for the smelter site germination test. A revised treatment structure for the smelter site assays is shown in Table 9. Leaching for the smelter site soil and New Jersey soil treatments consisted of adding the amendments in deionized water, allowing equilibration overnight, draining, then adding water to saturation, allowing equilibration overnight, then draining. Table 9. Treatments Selected For the Bio-Assays For the Smelter Site Soil.
Treatment Amendment
1 Smelter
2 Smelter, pH 6.5, Leached
3 Smelter, pH 6.5, Mn & P (1:5), Leached
4 Smelter, pH 6.5, Mn & P (1:5), Ce (1:3), Leached
5 Smelter, pH 6.5, Mn & P (1:5), Ce (1:1), Leached

24
6 Peat, pH 6.5
7 Peat, pH 6.5, Mn & P (1:5), Leached
8 Peat, pH 6.5, Mn & P (1:5), Ce (1:3), Leached
9 Peat, pH 6.5, Mn & P (1:5), Ce (1:1), Leached Earthworm Toxicity Assay Five earthworms (Eisenia fetida) were exposed to contaminated soil with or without amendments for 14 days. Two replicates of 100 g each of soil with and without amendments (n treatments x 2 replicates) were sieved to 2 mm and brought to 80% water holding capacity (WHC). For the purposes of the current experiments, WHC is defined as the amount of water held in each soil type at -1/3 bar water potential. For the GH soil and the sand, WHC was determined by a soil column protocol (Schwab et al., 2006). For the peat soil, hydrophobicity issues prohibited either of the above methods, and water holding capacity was estimated visually. One hundred grams of each soil treatment was prepared independently and placed into a small plastic bag. Five clitellate earthworms per treatment were taken weighing 0.20 - 0.70 g (from an in-house culture kept at approximately 24° C grown in a topsoil and manure medium), rinsed with tap water, lightly dried, and placed in a wet paper towel for 12 hours to purge their intestines. They were rinsed a second time, lightly dried, weighed, and placed into their respective soil treatment bags. Two grams of Magic Worm Food (Magic Products, Amherst Junction, WI) was added to the top of the soil in each bag. Weight of bags, food, soil and earthworms was taken when the experiment was initiated (time 0), the bags were sealed, and small holes allowing airflow were placed in the top half of the bags. The bags were placed in a controlled growth chamber (Percival Scientific model 136LLVL) at 24° C continuous light for 14 days. The bags were arranged in the growth chamber in a randomized complete block experimental design. Every 2 to 3 days water was added as needed to bring the total bag weight back to time 0 weight. At the end of the 14 days, mortality of the earthworms in each treatment was recorded. Any earthworms alive after the 14 days were rinsed in tap water, and allowed to purge their intestines on moist paper towels for 12 hours. Depuration periods are suggested for reducing inaccurate ending weights and to reduce the amount of material in the gut that might interfere with tissue metal readings upon digestion. Worms were weighed to allow comparison of biomass change, and were placed in a freezer until digestion. Before the digestion process, earthworms were dried in an oven at 50° C for three days. The dry weight was recorded and worms were placed together by experimental unit, and ground for digestion. The experiment was repeated a second time for a total of four replications. Earthworms were digested following documented procedures (Maenpaa et al., 2002; Morgan et al., 2002; Oste et al., 2001; Pearson et al., 2000) with slight alterations necessary for the combination of earthworms by experimental unit for digestion, by weighing a ≤0.5 g sample of tissue from all surviving earthworms in an experimental unit, and placing the material in a digestion tube. A 7 mL aliquot of concentrated HNO3 was added and the samples were left at room temperature for 16 hours and heated at 90° C for 2 hours. Samples were then allowed to cool slightly, filtered through a Whatman 42 filter and diluted to 35 mL. The results were analyzed for total metal concentration using a Perkin Elmer Optima 200 DV ICP Optical Emission Spectrometer. For every 15 samples, two standards were run to assure quality control.

25
Germination and Root Elongation/Weight Assay In this assay, lettuce (Lactuca sativa L., Butter Crunch) or barley (Hordeum vulgare) was allowed to germinate in soils with and without amendments for 5 days and percent germination and root elongation (lettuce) or root weight (barley) were recorded as endpoints. One hundred grams of soil with and without amendments (n treatments x 2 replicates) were brought to 80% water holding capacity (WHC) and placed into a petri dish. The soils were leveled and 40 seeds were evenly placed on the soil surface and lightly pressed into the soil. A thin layer of 16 mesh sand was placed on the top of the soil to ensure complete coverage of the seeds. This sand covering was lightly sprayed with deionized water. Each dish was then placed in a plastic Ziploc bag in a Percival Scientific model 136LLVL growth chamber (24° C) in a randomized complete block experimental design with 2 blocks. The seeds were grown for two days without light, then three days with 16 hours light and 8 hours dark. After 5 days the dishes were removed and percent germination was determined. Also, average lettuce root length was determined. Barley root mass was harvested and dried in a forced air oven at 50° C. Total dry weight was then recorded and average dry weight per geminated seed was determined. The experiment was repeated a second time for a total of four replications. Arsenic Hyperaccumulator Assay In this test, the arsenic hyperaccumulating fern, Edenfern, was grown in smelter site soil to determine the effect of amendments on soil As bioavailability. Small, 3- to 4-frond Edenfern (Pteris vittata) plants were obtained from Edenspace Systems Corporation and transplanted to pots containing moist contaminated soil with and without amendments, and pots containing moist control soil (Treatments in Table 10). Two replicates were allowed to grow for 8 weeks and the pots were watered as necessary with no added fertilizers. After 8 weeks, the plants were washed with tap water to remove soil from shoots and roots, after which the plants were washed with ultrapure water followed by a 0.1 mol L-1 HCl solution and then ultrapure water again. Shoot portions were dried in a forced air drying unit at 50° C for three days. Plant shoot portions were then ground and digested using the same method described above for earthworm digestion. Table 10. Treatments Tested on the Smelter Site Soil For the Arsenic Hyperaccumulating Ferns.
Treatment Amendment
1 Smelter Control, leached 2 Smetler, pH 6.5, leached 3 Smelter Mn, P, leached 4 Smelter Mn, P, Ce (1:3), leached 5 Smelter Mn, P, Ce (1:1), leached 6 Peat, pH 6.5

26
Task 4c. Spectroscopy. Lanthanum arsenate and cerium arsenate precipitates were identified by x-ray diffraction. Samples were prepared from 0.25 M La (LaCl3
.7H2O); 0.25 M Ce (CeCl3.xH2O); 0.25 M As(V)
(Na2HAsO4·7H2O) and the pH was adjusted with HCl acid to pH 3.9 and 5.5. Samples were allowed to precipitate and settle overnight. The samples were washed (4 times with distilled water) and dried in an oven at 45° C. The x-ray diffraction library reference code for LaAsO4(s) is 00-015-0756. Speciation of As(V) was identified with Raman spectroscopy. Seven samples were prepared (identified from chemical modeling as points to represent the entire spectrum) of 50 mM As(V) at pH 9.1; 50 mM As(V) and 7.5 mM La(III) at pH 7.4; 50 mM As(V) and 17.5 mM La(III) at pH 6.6; 50 mM As(V) and 23 mM La(III) at pH 6.0; 50 mM As(V) and 25 mM La(III) at pH 5.2; 50 mM As(V) and 28.9 mM La(III) at pH 2.8; 50 mM As(V) and 50 mM La(III) at pH 2.2. The samples were allowed to precipitate for one day (in a desiccator with air replaced with nitrogen, to prevent CO2 interaction with As(V), at high pH). Both solution and precipitate were analyzed using Raman spectroscopy. For each solution, six exposures at 30 seconds were taken with a slit of 125 μm. For the precipitate, the Raman was adjusted to microscope analysis and six exposures at 30 seconds were taken with a slit of 50 μm. Both spectra of solution and precipitate presented in the results section had spectra of water subtracted from them. For the same samples, analysis using Attenuated Total Reflectance - Fourier Transform Infrared Spectrometry (ATR-FTIR) was performed. In this case, only results for precipitates were presented. The spectra of the solutions were subtracted from the spectra of the precipitates.
Task 4d. X-ray Analyses Field Sampling for X-ray Analyses The former smelter site was sampled 4 times between March 2004 and August 2005 with slightly different objectives each time. Sample collection 1 (S1) - The soil was initially sampled on March 11, 2004 to obtain metal-contaminated soil for greenhouse and laboratory studies aimed at identifying strategies for immobilizing potentially toxic metals in-situ. At the time, the site was covered by water ~10 cm deep. A pit was dug to a depth of ~50 cm and ~200 liters of the excavated material was collected and then mixed and sieved through a < 2 mm sieve on-site. The material was air-dried in a greenhouse and stored in plastic containers. Field-measured pH was 5.9, but the pH decreased to 3.7 after the soil was dried. The redox potential after the addition of water to the dry soil was 160 mV, but the Eh measured in the field was as low as -29 mV (Szlezak, 2006). Aliquots were analyzed by x-ray diffraction as described below. Sample collection 2 (S2) – Initial x-ray diffraction data from bulk sample S1 indicated the presence of both oxide and sulfide minerals that cannot be stable under the same redox conditions. The site was resampled on September 24, 2004, this time with the objective of collecting material from more carefully controlled depth increments. The site was drier than it had been in March. Although there was no free water on the soil surface, the surface was still moist and the water table was within a few centimeters of the soil surface. A small pit was

27
excavated to a depth of ~40 cm and samples were collected at different depth intervals (Table 11) based on morphology, placed into plastic bags, transported to the laboratory at ambient temperature and then air dried. The very surface (0 – 1 cm) was reddish brown in color. The material from 1 to 5 cm below the surface was distinctly greenish when sampled, but became brownish when exposed to the atmosphere for only a few minutes. We suspected this material might contain “green rust”, but unfortunately we were not prepared to sample redox sensitive material at the time. Material deeper in the profile was dark gray to black in color. Sample collection 3 (S3) - The site was resampled on April 1, 2005, this time with the objective of sampling the greenish material that oxidized quickly during the September 2004 sampling, and using techniques designed to minimize oxidation of reduced phases upon drying. During this sampling, which was in late spring and before the vegetation had begun to green up, the water table was ~20 cm above the soil surface (Figure 2). The greenish layer that we had observed during the previous September sampling under drier conditions was not found. Samples, therefore, were collected at 5 depths from the surface to a depth of ~65 cm from slices of soil taken with a tile spade from a water-filled pit. The samples were immediately sealed in polyethylene freezer bags and frozen in liquid N2 on site. The frozen samples were then transported to the laboratory and freeze-dried. Temperature, pH, and soil color were recorded in the field (Table 11).

28
Figure 2. (a) View of the Sampling Site on April 1, 2005 When the Surface Was Covered by About 20 cm water. (b) Reddish Brown Precipitates on the Soil Surface. Sample collection 4 (S4) - The soil was resampled on August 5, 2005, again with the objective of sampling the greenish material that oxidized rapidly. This time, the site was drier than during any of the previous samplings. The water table was about 30 cm below the surface and the surface layer was air-dry (Figure 3). Samples were collected from three layers: 0 – 15 cm, reddish brown surface precipitates; 15 - 20 cm, faintly greenish material; and 25 - 30 cm gray muck. The samples were immediately sealed in polyethylene bags, frozen in liquid N2 in the field, and then transported to the laboratory and freeze-dried. Sampling conditions, depth intervals, and brief sample descriptions are summarized in Table 11.
a
b

29
Table 11. Field Sampling Descriptions of the Soil Samples. Sample
Date Water Table Sample Depth
(cm) Temp (° C)
pH Munsell Color
Descriptions
03/11/04 ~10 cm above the soil surface
S1 0-50 mixed soil
09/24/04 ~5 cm below the soil surface, surface
material was moist, but there was no free
water
S2a S2b S2c S2d S4e
0-1 1-5
10-18 18-30 30-40
reddish brown precipitates greenish material
gray much (sapric material) gray muck (sapric material) gray muck (sapric material)
04/1/05 ~20 cm above the
soil surface S3a S3b S3c S3d S3e
0-10 10-20 20-30 30-50 50-65
9.3 8.4 7.6 --- 9.5
5.30 5.66 5.80 ---
6.30
5 YR 3/2 7.5 YR 3/2 7.5 YR 5/1
--- 5 YR 3/1
dark reddish brown precipitate dark brown muck (sapric material)
gray muck (sapric material) gray muck (sapric material)
very dark gray mark (sapric material)
08/5/05 ~ 30 cm below the soil surface
S4a S4b S4c
0-15 15-20 25-30
reddish brown precipitates faintly greenish material
gray much (sapric material)

30
Figure 3. (a) View of the Sampling Site on August 5, 2005 When the Water Table Was About 30 cm Below the Soil Surface. (b) The Dry Soil Surface Covered With a Reddish Brown Precipitate. Note the White Gypsum Precipitates on the Dry Plant Residues. Quantitative X-ray Fluorescence Analysis Wavelength-dispersive x-ray fluorescence (WD-XRF) spectroscopy was used to quantify the total contents of both major and trace elements. The samples were oven dried at 100° C for 24 hours, ground and homogenized in an agate mortar to pass a U.S standard No. 140 sieve (106 μm), and then transferred to glass vials sealed with plastic caps. The samples were sent to an experienced analysist for quantitative XRF analysis. Detailed procedures are described in Mertzman (2000). All elements were analyzed quantitatively, except for Cd and As, for which no certified standards were available. Immediately prior to XRF analysis, the samples were again oven-dried at 110° C for 3 hours and cooled in a dessicator. Loss on ignition (LOI) was determined as the weight loss between 110 and ~925° C. Sulfur was measured on a trace element briquette in which the original un-fired material was present, which includes much organic material. Sulfate constitutes part of the loss on ignition and perhaps some of the H2O loss.

31
Bulk Powder X-ray Diffraction (XRD) Analysis Bulk powder x-ray diffraction patterns were obtained using a PANalytical X’Pert PRO MPD x-ray diffraction system (PANalytical, Almelo, The Netherlands) equipped with a PW3050/60 θ-θ goniometer and a Co-target x-ray tube operated at 40 KeV and 35 mA. Incident beam optics consisted of an Fe beta filter, 0.04 radian Soller slit, a programmable divergence slit, and a beam mask set to illuminate a 10 × 10 mm sample area. A fixed, 1° anti-scatter slit was used in the incident beam at diffraction angles < 12° 2θ. The diffracted beam optics consisted of a programmable diffracted-beam anti-scatter slit, a 0.04 radian Soller slit, and a PW3015/20 X’Celerator detector configured for an active length of 2.12° 2θ. Aliquots consisting of ~0.5 g of freeze-dried sample were finely ground and homogenized in an agate mortar and pressed powder mounts were prepared in 10 × 15 mm Al sample holders. The samples were scanned from 2.1 to 80° 2θ at 0.05° steps with 60 sec measurement time per step. The data were analyzed with the X’Pert High Score Plus software package (PANalytical, Almelo, The Netherlands) and were converted to a fixed 1° divergence slit prior to phase analysis and plotting. Synchrotron Micro-XRD and Micro-SXRF Analysis Freeze-dried soil samples were examined under a binocular microscope, and aggregates about 100 - 200 μm in diameter that had distinctive morphologies and that appeared to be inorganic were selected and mounted on Kapton tape (DuPont) supported across 2 × 2 inch cardboard frames. We used the synchrotron x-ray microprobe at beamline X26A at the National Synchrotron Laboratory Source at Brookhaven National Laboratory to obtain both micro x-ray diffraction patterns and micro x-ray fluorescence patterns simultaneously for each aggregate. A monochromatic beam with a wavelength near 0.72 Å (actual wavelength varied slightly from run to run) was focused to a nominal size of 10 × 10 μm by Kirkpatrick-Baez mirrors. The 2D micro x-ray diffraction data were collected in transmission mode using a Bruker SMART 1500 CCD area detector with 1024 × 1024 pixel resolution using a 120 second exposure time per sample. The detector was calibrated against α-corundum (Al2O3, NIST standard SRM 674a) and Ag behenate [CH3(CH2)2OCOOAg] diffraction standards. Pattern integration was performed in FIT2D (A. Hammersley, European Synchrotron Radiation Facility, France; http://www.esrf.eu/computing/scientific/FIT2D ) to convert the two dimensional diffraction patterns to one dimensional 2θ vs. intensity spectra. X’Pert High Score Plus was used for phase identification using the PDF-4+ powder diffraction database (The International Centre of Diffraction Data, 12 Campus Boulevard, Newtown Square, PA; http://www.icdd.com ). Synchrotron-based micro x-ray fluorescence (SXRF) spectra were collected simultaneously for each aggregate using a Canberra SL30165 Si(Li) detector at energy above 17.0 keV with 300 seconds exposure time per sample. The samples were mounted at 45° to the incident beam and 45° to the Si(Li) detector. The MCA computer program (M. Rivers, GeoSoilEnviroCARS, Chicago, IL; http://cars9.uchicago.edu ) was used for μ-SXRF data analysis. Altogether, ~300 individual soil aggregates were analyzed by μ-XRD and SXRF. Mineral Synthesis Goethite, akaganeite, and schwertmannite were synthesized in the laboratory to compare their surface morphology and crystal structure with their natural analogues. All

32
synthetic minerals used in this study were synthesized using the methods described by Cornell and Schwertmann (2003) with minor modifications. Synthetic goethite was prepared by first precipitating ferrihydrite by adding 180 mL 5 M KOH to 100 mL M Fe(NO3)3·9H2O solution. The suspension was diluted to 2 L with deionized water and held in a closed polypropylene bottle in a 70° C oven for 60 h. The precipitate was washed well with deionized water and dried at 50° C. To precipitate akaganeite, 2 L of 0.1 M FeCl3•6H2O solution was kept in a closed polypropylene bottle at 70° C for 48 h. The precipitate was washed well with deionized water and air-dried at room temperature. Schwertmannite was synthesized by adding 10.8 g FeCl3·6H2O (~40 mM Fe3+) and 3 g of Na2SO4 (~10 mM SO4
2-) to 2 L deionized water at 60° C. The solution was maintained at 60° C for 12 min more, then cooled to room temperature. The suspension was dialyzed against deionized water, which was renewed on a daily basis for about 30 days, and then freeze-dried. All chemical products used in the experiment are A.C.S reagents and verified at 98% minimum purity. K(OH), FeCl3·6H2O, and Na2SO4 were obtained from Mallinckrodt, and Fe(NO3)3·9H2O was obtained from Sigma-Aldrich. The dialysis tubing (pore radius of 2.4 nm) was from Spectra/Pro. All synthetic minerals were precipitated under atmospheric conditions rather than under an inert gas to minimize the differences between natural and synthetic precipitation processes (Webster et al., 1998).

33
VI. Results and Accomplishments In this section, only Task 4 and Task 5 will be reported. Tasks 1, 2, and 3 are all procedural tasks designed to set the stage for the final two tasks.
Task 4. Assays of Bioavailability and Analytical Methods
Task 4a. Application of Chemical Assays Cerium, Phosphate, and Manganese Combinations to Reduce Bioaccessiblity of Arsenic, Chromium, Cadmium and Lead Simultaneously in Soil Smelter Soil The arsenic concentraton in the lead smelter soil is highly elevated at 1700 mg/kg, but has a very low bioaccessible fraction of 14 to 16%. Low redox and moderate/low pH conditions may favor precipitation with S. Under such conditions, As can form a strong precipitate, realgar-like arsenic sulfide, with low solubility especially at very low pH (O’Day et al., 2004). To decrease the bioaccessible fraction even further, Ce was added. Total Cr in the lead smelter soil is 1250 mg/kg, but similar to As, the bioaccessible fraction is low (16%). Low redox conditions favor Cr(III), which forms low solubility minerals such as Cr(OH)3 (Yiannakakais et al., 1999). Chromium(III) is very slow to oxidize to Cr(VI), even if the environment favors oxidation of Cr(III) to Cr(VI) (Barnhart 1997). In preliminary experiments, the Cr bioaccessible fraction decrease slightly with the addition of C. x-ray diffraction studies indicated that Ce can precipitate with Cr(VI) to form cerium chromate. There was no effect of Ce on either Cd or Pb which are present in the soil at 171 and 3185 mg/kg, respectively. While the bioaccessible fraction of Cd also is low, 9 to 10%, Cd is very toxic even at very low levels. Approximated 66% of Pb is bioaccessible. Combinations of Mn and P were added to decrease the bioaccessible fraction of Cd and Pb. Manganese as Mn(IV) can oxidize As(III) to As(V) and should increase As precipitation with Ce because As(V) is more likely to precipitate with Ce than As(III) (Tokunaga 1997). Manganese oxides also can provide adsorption sites for arsenic. Manganese may have a slight capability for decreasing As bioaccessibility as showed in preliminary studies where Mn was added alone, especially at high concentrations. However, such high ratios are less realistic in a field application. The smallest ratio tested, 1:5, was the more practical ratio that can be applied in a field situation. Time was not tested as a factor in the preliminary studies, but it may help reduce As below the low bioaccessible fraction. Cerium additions can to reduce soil pH (either by replacing H ions in the soil or providing H ions when Ce combines with As), which will be an advantage when phosphate is added. Other studies have shown that the initial decrease in soil pH after addition of P decreased Pb and Cd concentrations (Zhang and Ryan 1998b). After two days of aging, Mn and P combinations increased the bioaccessible fraction of As even at the lowest ratio (Figure 4). The only ratio that showed a significant difference was 1:2 with 20% bioaccessible As compared to 16% bioaccessible As in the control (Table 12). The increase is due to phosphate competing for the same sites as As. Phosphate is chemically similar to As,

34
and its degree of protonation depends upon the pH: PO43-, HPO4
2-, H2PO4-, H3PO4
o (Lindsay, 1979). Increases in bioaccessible As after additions of P were even greater after 30 days in which As increased for all Mn and P ratios. The addition of Ce at ratios of 1:1 and 1:3 resulted in the bioaccessible fraction of As remaining unchanged when compared to the control for the lowest ratio of Mn and P. At ratios of 1:2 and 1:5 of P, the bioaccessible % of As increased significantly when compared with the control. Higher ratio of Ce, 1:3, resulted in a bioaccessible % of As below 19%, while for the lower ratio, 1:1, bioaccessible % was below 21% similar to that of no Ce added. Further studies should be conducted to determine the affect of P and S on As precipitation with Ce in soil. Chromium was unaffected by the addition of Mn and P compared to the control soil (Figure 5). Cerium alone also did not reduce Cr concentrations. After 2 days with higher ratio of Ce of 1:3, and at any ratio of Mn and P, there was a significant difference in Cr bioaccessible %. Compared with 16% for the control, bioaccessible Cr decreased to 13% for 1:0.5 Mn and P; 12% for 1:2 Mn and P; and 13% for 1:5 Mn and P. After 30 days, the bioaccessible fraction increased slightly and was no longer significantly different than the control at p<5%, but was different at p<10%. Manganese can rapidly oxidize Cr(III) to Cr(VI) (Kozuh et al., 2000). This was a concern in this project, since there was a slight increase in the bioaccessible fraction of Cr with the addition of Mn. The addition of Mn even at the 1:5 ratio did not change Cr bioaccessible fraction, implying that Cr was not oxidized to more toxic and soluble Cr(VI). Cerium can limit increases in the bioaccessible fraction. Chromium may compete with As(V) for Ce. The interaction should be studied further in order to fully understand the immobilization process. Cadmium had a low bioaccessibility in the lead smelter soil, below 10%. With the addition of Mn and P at the ratio of 1:2 and 1:5, this fraction was reduced below detection limit (Figure 6). With the addition of Ce, Mn and P, Cd decrease was less dramatic, but there was a significant decease for both concentrations of Ce with the addition of 1:2 and 1:5 of Mn and P. With the addition of 1:3 Ce and 1:2 Mn and P after 2 days, Cd did not significantly decrease. After 30 days, the decrease was significant compared to the control. With the addition of 1:3 Ce and 1:5 Mn and Ce, the Cd bioaccessible fraction was decreased below detection limit after only two days. The standard deviation for bioaccessible percent of Cd was large, possibly due to the fact that time enhanced the decrease in Cd bioaccessible fraction. Of note is that the decrease was not similar in all 3 replicates. In some cases, Cd decreased below detection limit. In other cases, the decrease was significant but Cd concentration was detectable, creating high variability. The ratios of P were: 1:0.5, 1:2 and 1:5 Pb and Cd to P. The highest ratio was 1:5, because in the preliminary experiments, higher ratios did not decrease Pb further. In this study, it was shown that any ratio of P (1:0.5, 1:2, and 1:5) decreased Pb significantly below the control soil (66%) (Figure 7). With addition of 1:3 Ce, the decrease in Pb bioaccessible fraction was even greater. There was a significant difference between both 1:0.5 and 1:2 Mn and P added alone and with 1:1 Ce (Table 12). The addition of 1:5 Mn and P decreased the Pb bioaccessible fraction to 9% after 2 days and 11% after 30 days. Time did not seem to play a role, and the bioaccessible fraction was similar after 2 days as it was after 30 days. The formation of pyromorphite is quite fast in the soil, which is consistent with other studies (Zhang and Ryan, 1998a). The low pH and high water content were probably the most significant factors affecting the rapidly decreasing Pb bioaccessible fraction.

35
0
5
10
15
20
25
0.5P 2P 5P 1Ce 1Ce0.5P
1Ce2P
1Ce5P
3Ce 3Ce0.5P
3Ce2P
3Ce5P
control
ratios of amendments added
Bio
acce
ssib
le %
As
2 days30 days
Figure 4. Bioaccessible % of As With the Addition of Ce, Mn and P in Lead Smelter Soil. (0.5P, 2P and 5P represent 1:0.5 Mn and P, 1:2 Mn and P and 1:5 Mn and P; 1Ce and 3Ce represents 1:1 Ce and 1:3 Ce).
0
2
4
6
8
10
12
14
16
18
20
0.5P 2P 5P 1Ce 1Ce0.5P
1Ce2P
1Ce5P
3Ce 3Ce0.5P
3Ce2P
3Ce5P
control
treatments
Bio
acce
ssib
le C
r (%
of t
otal
)
2 days30 days
Figure 5. Bioaccessible % of Cr With the Addition of Ce, Mn and P in Lead Smelter Soil (0.5P, 2P and 5P represent 1:0.5 Mn and P, 1:2 Mn and P and 1:5 Mn and P; 1Ce and 3Ce represents 1:1 Ce and 1:3 Ce).

36
0
2
4
6
8
10
12
14
16
0.5P 2P 5P 1Ce 1Ce0.5P
1Ce2P
1Ce5P
3Ce 3Ce0.5P
3Ce2P
3Ce5P
control
ratios of amendments added
Bio
acce
ssib
le %
Cd
2 days30 days
Figure 6. Bioaccessible % of Cd With the Addition of Ce, Mn and P in Lead Smelter Soil (0.5P, 2P and 5P represent 1:0.5 Mn and P, 1:2 Mn and P and 1:5 Mn and P; 1Ce and 3Ce represents 1:1 Ce and 1:3 Ce).
0
10
20
30
40
50
60
70
80
0.5P 2P 5P 1Ce 1Ce0.5P
1Ce2P
1Ce5P
3Ce 3Ce0.5P
3Ce2P
3Ce5P
control
treatments
Bio
acce
ssib
le P
b (%
of t
otal
)
2 days30 days
Figure 7. Bioaccessible % of Pb With the Addition of Ce, Mn and P in Lead Smelter Soil (0.5P, 2P and 5P represent 1:0.5 Mn and P, 1:2 Mn and P and 1:5 Mn and P; 1Ce and 3Ce represents 1:1 Ce and 1:3 Ce).

37
Table 12. Statistical Differences in Lead Smelter Soil Bioaccessible % of As, Cr, Cd and Pb (α = 0.05, n = 3; LSD: As = 2.55, Cr = 2.25, Cd = 4.85, Pb = 4.93).
Ratios ------ As ------ ----- Cr ----- ----- Cd ----- ----- Pb ----- 2 days 30 days 2 days 30 days 2 days 30 days 2 days 30 days control defghij j ab abc abcd abc ab ab 1:0.5 Mn and P abcd cdefgh abcde abcde cdefgh defgh cd de 1:2 Mn and P abc a abcd abcde h h h h 1:5 Mn and P cdefgh abc bcde cde h h kl k 1:1 Ce defghij ij ab abc bcdefg efgh bc bcd 1:1 Ce and 1:0.5 Mn and P bcdefg defghij abcde abcde abcde fgh de ef
1:1 Ce and 1:2 Mn and P
abcd ab abcde abcde gh h hi ij
1:1 Ce and 1:5 Mn and P cdefgh abc bcde cde h gh kl kl
1:3 Ce defghij hij abc a ab abcdef a bcd 1:3 Ce and 1:0.5 Mn and P ghij fghij de cde a cdefgh f g
1:3 Ce and 1:2 Mn and P
defghi abcde e cde bcdefg gh ij j
1:3 Ce and 1:5 Mn and P efghij abcdef de cde h h l kl
New Jersey Soil and Utah Soil The combinations that were successful in decreasing the bioaccessible fractions of As, Cr, Cd, and Pb in the smelter soil had almost no significant effect on New Jersey and Utah soils (Table 13 and Table 14). Some of the combinations of Ce, Mn and P that were used for lead smelter soil were also applied to New Jersey and Utah soils (Table 15). Both New Jersey and Utah soil had a higher pH than lead smelter soil (pH 7.6 to 8.4 for New Jersey soil, pH 7.3 to 7.5 for Utah soil compared to 5.9 for Lead Smelter soil), lower organic matter content (2.3% for New Jersey soil, 2.4% for Utah soil compared to 24% for lead smelter soil), were dry through-out the year, and had much smaller concentrations of metals. Arsenic concentration was low for both New Jersey soil (14 mg/kg) and UT soil (17 mg/kg). The bioaccessible fraction of both soils was much higher than for lead smelter soil -- 63% for New Jersey soil and 39 to 57% for Utah. However, the absolute concentrations (mg/kg) of bioaccessible As in the soils were actually quite low. Soils that are highly oxidized pose a greater threat due to the higher As bioaccessible fraction compared to highly reduced soils. Arsenic is usually found in lower portions of the soil (in the Lead Smelter soil, As was found 50 cm below the surface) where the environment is more reduced. Soils generally have negatively charged sites, and anionic As is repelled rather than sorbed. However, when the soils are highly reduced in the presence of S are present, As can form stable sulfide solid phases.

38
In the New Jersey soil, the 1:5 Mn and P amendment increased the bioaccessible fraction of As to 90% after 2 days, significantly higher than the control (Figure 8). After 30 days, the increase was no longer significant. Mn and P added at the ratio of 1:0.5 increased the bioaccessible fraction significantly to 95%. When Ce was added alone at the ratio of 1:1, or together with Mn and P, there was a slight increase in the bioaccessible fraction of As. The increase was not significant compared to the control soil after 2 days. After 30 days the increase was significant for both Ce alone and Ce together with Mn and P at ratio of 1:0.5. The addition of P may have replaced some of the As in the soil, and because small amounts of Ce were added compared to P, there was nothing to offset the high ratios of free P. New Jersey soil had small amounts of As, 14 mg/kg, compared to the amount of Pb, 1700 mg/kg. Because amendments were added based on the concentrations of metals in the soil, the difference between Ce and P was large. After 2 days of aging in the Utah soil, the As bioaccessible fraction with the addition of 1:5 Mn and P (69%) and with 1:1 Ce (69%) was significantly greater than in the control soil. The bioaccessible fraction decreased significantly to 44% with the addition of 1:1 Ce and 1:0.5 Mn and P. No significant differences existed after 30 days for any of the amendments compared to the control (Figure 9). The initial increase might have been caused by P, but because in the Utah soil the Pb concentrations are small, only small amounts of P were added. A difference was observed between the New Jersey and Utah soils in terms of the Cr concentration compared to lead smelter soil, but the bioaccessible fraction was similar for all the three soils. In New Jersey soil, there was 36 mg/kg of Cr and 15 to 28 % was bioaccessible. In Utah soil, there was 260 mg/kg of Cr and 12% was bioaccessible. The Eh and pH for all three soils are in the region of Cr(OH)3 stability (Yiannakakais et al., 1999). The Cr(OH)3 can control Cr bioaccessibility even in the harsh PBET environment (pH 1.5) and produces low solubility. None of the amendments had any effect on the Cr bioaccessible fraction, and no significant change was observed compared to the control in both New Jersey soil and Utah soil after 2 days and 30 days of aging (Figure 10 and Figure 11). This lack of decrease in the Cr bioaccessible fraction may be due to the small amounts of Ce. Ce was added on the basis of As concentration in the soil. The New Jersey soil was highly contaminated with Cd with a concentration of 1545 mg/kg and 52 to 57% bioaccessible. This poses a serious threat because of the high toxicity of Cd. Utah soil had a much lower concentration, 49 mg/kg, but the bioaccessibility was higher than New Jersey soil, 66 to 94%. The high bioaccessibility of these two soils compared to the lead smelter soil likely results from: 1) higher organic content in lead smelter soil which provides negative sites for absorption, and 2) reduced environment to promote precipitation with S. The amendments had no significant effect on Cd compared to the control in both New Jersey soil and Utah soil (Figure 12 and Figure 13). High pH of both soils impeded dissolution of P and subsequent precipitation with Cd. Cadmium may have precipitated as otavite (CdCO3) without a decrease in the initial soil pH, lower amounts of Cd are available to form more stable phases. Additional experiments should to be conducted to evaluate the effect of pH changes after the addition of P and Mn. Hettiarachchi et al. (2000) showed that lowering the pH of the soil will have a greater effect on the decrease in Pb bioaccessibility. The mechanisms for Cd immobilization with P are unknown, and the effect of lowering the pH needs be investigated.

39
Lead concentration in the New Jersey soil was 1320 mg/kg and the bioaccessible fraction was 83%. Utah soil had only 97 mg/kg of Pb and 26 to 28% bioaccessible. In New Jersey soil, treatment of 1:5 Pb:P decreased Pb bioaccessible fraction to 56% after 2 days and 54% after 30 days; these percentages are significantly different than the control (Table 14). The addition of Ce did not hinder the reduction in the Pb bioaccessible fraction which was different than the control; 58% after 2 days and 53% after 30 days (Figure 14). In Utah soil, none of the treatments had an effect of reducing Pb bioaccessible fraction compared to the control (Figure 15). Low bioaccessible fraction of Pb in the Utah soil explains the lack in reduction after the addition of Mn and P compared to the New Jersey soil. In both soils, the pH is high; pH 8.2 for New Jersey soil and pH 7.4 for Utah soil. Lead and P solubilities are restricted in this pH range, and the interaction between them is hindered. In the New Jersey soil, Pb is soluble in the PBET solution, along with Mn and P. This allows the interaction to occur as explained by Hettiarachchi et al. (2000). Initial decrease in New Jersey and Utah soil pH before the addition of amendments would allow the formation of pyromorphite to occur, reducing the bioaccessible fraction even further.
0
20
40
60
80
100
120
0.5P 5P 1Ce 1Ce & 0.5P 1Ce & 5P controltreatments
Bio
acce
ssib
le A
s (%
of t
otal
)
2 days 30 days
Figure 8. Bioaccessible % of As With the Addition of Ce, Mn and P in New Jersey Soil (0.5P and 5P represent 1:0.5 Mn and P and 1:5 Mn and P; 1Ce represent 1:1 Ce).

40
0
10
20
30
40
50
60
70
80
90
100
1:0.5 P&Mn 1:5 P&Mn 1:1 Ce 1:1 Ce &1:0.5 P&Mn
1:1 Ce & 1:5P&Mn
control
ratios of amendments added
Bio
acce
ssib
le %
As
2 days30 days
Figure 9. Bioaccessible % of As With the Addition of Ce, Mn and P in Utah Soil (0.5P and 5P represent 1:0.5 Mn and P and 1:5 Mn and P; 1Ce represent 1:1 Ce).
0
5
10
15
20
25
30
35
0.5P 5P 1Ce 1Ce & 0.5P 1Ce & 5P control
treatments
Bio
acce
ssib
le C
r (%
of t
otal
)
2 days 30 days
Figure 10. Bioaccessible % of Cr With the Addition of Ce, Mn and P in New Jersey Soil (0.5P and 5P represent 1:0.5 Mn and P and 1:5 Mn and P; 1Ce represent 1:1 Ce).

41
0
2
4
6
8
10
12
14
16
1:0.5 P&Mn 1:5 P&Mn 1:1 Ce 1:1 Ce &1:0.5 P&Mn
1:1 Ce & 1:5P&Mn
control
ratios of amendments added
Bio
acce
ssib
le %
Cr
2 days30 days
Figure 11. Bioaccessible % of Cr with the Addition of Ce, Mn and P in Utah Soil (0.5P and 5P represent 1:0.5 Mn and P and 1:5 Mn and P; 1Ce represent 1:1 Ce).
0
10
20
30
40
50
60
70
0.5P 5P 1Ce 1Ce & 0.5P 1Ce & 5P control
treatments
Bio
acce
ssib
le C
d (%
of t
otal
)
2 days 30 days
Figure 12. Bioaccessible % of Cd With the Addition of Ce, Mn and P in New Jersey Soil (0.5P and 5P represent 1:0.5 Mn and P and 1:5 Mn and P; 1Ce represent 1:1 Ce).

42
0
10
20
30
40
50
60
70
80
90
100
1:0.5 P&Mn 1:5 P&Mn 1:1 Ce 1:1 Ce &1:0.5 P&Mn
1:1 Ce & 1:5P&Mn
control
ratios of amendments added
Bio
acce
ssib
le %
Cd
2 days30 days
Figure 13. Bioaccessible % of Cd With the Addition of Ce, Mn and P in Utah Soil (0.5P and 5P represent 1:0.5 Mn and P and 1:5 Mn and P; 1Ce represent 1:1 Ce).
0
10
20
30
40
50
60
70
80
90
100
0.5P 5P 1Ce 1Ce & 0.5P 1Ce & 5P control
treatments
Bio
acce
ssib
le P
b (%
of t
otal
)
2 days 30 days
Figure 14. Bioaccessible % of Pb With the Addition of Ce, Mn and P in New Jersey Soil (0.5P and 5P represent 1:0.5 Mn and P and 1:5 Mn and P; 1Ce represent 1:1 Ce).

43
0
5
10
15
20
25
30
35
1:0.5 P&Mn 1:5 P&Mn 1:1 Ce 1:1 Ce &1:0.5 P&Mn
1:1 Ce & 1:5P&Mn
control
ratios of amendments added
Bio
acce
ssib
le %
Pb
2 days30 days
Figure 15. Bioaccessible % of Pb With the Addition of Ce, Mn and P in Utah Soil (0.5P and 5P represent 1:0.5 Mn and P and 1:5 Mn and P; 1Ce represent 1:1 Ce). Table 13. Statistical Differences in New Jersey Soil Bioaccessible % of As, Cr, Cd and Pb (α = 0.05, n = 3; LSD: As = 13.90, Cr = 1.41, Cd = 3.30, Pb = 8.68).
ratios ----- As ----- ----- Cr ----- ----- Cd ----- ----- Pb -----
2 days 30 days 2 days 30 days 2 days 30 days 2 days 30 days
control bc c bc a d bc
1:0.5 Mn and P ab a bc a cd ab a a
1:5 Mn and P a c c a d cd b b
1:1 Ce c ab bc a d a a a
1:1 Ce and 1:0.5 Mn and P ab ab b a cd a a a
1:1 Ce and 1:5 Mn and P
ab bc c a cd bc b b

44
Table 14. Statistical Differences in Utah Soil Bioaccessible % of As, Cr, Cd and Pb (α = 0.05, n = 3; LSD: As = 11.06, Cr = 1.51, Cd = 10.49, Pb = 3.04).
ratios ----- As ----- ----- Cr ----- ----- Cd ----- ----- Pb -----
2 days 30 days 2 days 30 days 2 days 30 days 2 days 30 days
control b d ab ab bc a a a
1:0.5 Mn and P bc d ab a c a a a
1:5 Mn and P a cd ab b abc a a a
1:1 Ce a d ab ab c ab a a
1:1 Ce and 1:0.5 Mn and P cd d ab ab abc ab a a
1:1 Ce and 1:5 Mn and P
ab d ab ab bc ab a a
Table 15. New Jersey and Utah Soil Amendment Ratios.
---------- Mn and P ratio ----------
Ce
ratio
1:0 1:0.5 1:5
1:0 x x x
1:1 x x x
TCLP Lead Smelter Soil Figure 16 shows the effect of Ce, Mn and P on the TCLP concentration of As. No significant differences were observed between As TCLP concentration in the treated soil versus the control, which was above As TCLP concentration regulatory limit (5 mg/L) (Table 16). The addition of Mn and P at ratios of 1:2 and 1:5 increased the concentration of As significantly compared with the control soil, but the increase significantly declined between 2 days and 30 days. The addition of Ce was unable to counteract the addition of P. The amount of Ce added may require an increase for higher efficiency. In experiments with Ce in Chapter 4, time was an important factor. Chromium TCLP concentration in lead smelter soil was below the regulatory limit (5 mg/L) (Figure 17). Chromium increased significantly with the addition of 1:3 Ce, but the increase was small and did not exceed the regulatory limit. The addition of Mn and P at ratios of 1:2 and 1:5 significantly decreased Cr TCLP concentrations. Even with the addition of Ce, Mn and P were able to counteract the increase and there was no significant difference between adding Mn and P

45
alone or with Ce. While Ce decreases Cr bioaccessible concentration, TCLP concentration increased. The chemistry behind this observation is unknown and must be investigated further. Figure 18 shows TCLP concentrations for Cd. Even though there is a high amount of Cd in the lead smelter soil, TCLP-Cd does not exceed the regulatory limit of 1 mg/L. The addition of Mn and P at a ratio of 1:5 decreases the concentration below regulatory limit, but the decrease is not significantly different from the control. The treatments that are statistically different from the control are the addition of 1:3 Ce and 1:3 Ce + 1:0.5 Mn and P. These treatments increase the TCLP concentration of Cd above the regulatory limits after 2 days. However, after 30 days, the concentration is reduced below the regulatory limit. The addition of Mn and P at ratios of 1:2 and 1:5 was able to decrease Pb concentration below regulatory limit of 5 mg/L, and this decrease was significant compared to the control. Figure 19 shows that the addition of Ce increased the concentration of Pb, but the addition of Mn and P with Ce resulted in a TCLP concentration of Pb below regulatory limits and significantly different than the control. The increase in TCLP concentration of both Cd and Pb with the addition of Ce is not clearly understood.
0
20
40
60
80
100
120
140
160
0.5P 2P 5P 1Ce 1Ce0.5P
1Ce2P
1Ce5P
3Ce 3Ce0.5P
3Ce2P
3Ce5P
control
treatments
TCLP
As
(mg/
L)
2 days 30 days regulatory limit
Figure 16. TCLP As Concentration With the Addition of Ce, Mn and P in Lead Smelter Soil (0.5P, 2P and 5P represent 1:0.5 Mn and P, 1:2 Mn and P and 1:5 Mn and P; 1Ce and 3Ce represents 1:1 Ce and 1:3 Ce). .

46
0
1
2
3
4
5
0.5P 2P 5P 1Ce 1Ce0.5P
1Ce2P
1Ce5P
3Ce 3Ce0.5P
3Ce2P
3Ce5P
control
treatments
TCLP
Cr (
mg/
L)
2 days 30 days regulatory limit
Figure 17. TCLP Cr Concentration With the Addition of Ce, Mn and P in Lead Smelter Soil (0.5P, 2P and 5P represent 1:0.5 Mn and P, 1:2 Mn and P and 1:5 Mn and P; 1Ce and 3Ce represents 1:1 Ce and 1:3 Ce).
0.0
0.2
0.4
0.6
0.8
1.0
1.2
1.4
1.6
1.8
2.0
0.5P 2P 5P 1Ce 1Ce0.5P
1Ce2P
1Ce5P
3Ce 3Ce0.5P
3Ce2P
3Ce5P
control
treatments
TCLP
Cd
(mg/
L)
2 days 30 days regulatory limit
Figure 18. TCLP Cd Concentration With the Addition of Ce, Mn and P in Lead Smelter Soil (0.5P, 2P and 5P represent 1:0.5 Mn and P, 1:2 Mn and P and 1:5 Mn and P; 1Ce and 3Ce represents 1:1 Ce and 1:3 Ce).

47
0
20
40
60
80
100
120
140
160
0.5P 2P 5P 1Ce 1Ce0.5P
1Ce2P
1Ce5P
3Ce 3Ce0.5P
3Ce2P
3Ce5P
control
treatments
TCLP
Pb
(mg/
L)
2 days 30 days regulatory limit
Figure 19. TCLP Pb Concentration With the Addition of Ce, Mn and P in Lead Smelter Soil (0.5P, 2P and 5P represent 1:0.5 Mn and P, 1:2 Mn and P and 1:5 Mn and P; 1Ce and 3Ce represents 1:1 Ce and 1:3 Ce). Table 16. Statistical Differences in Lead Smelter Soil TCLP Concentrations of As, Cr, Cd and Pb (α = 0.05, n = 3; LSD: As = 17.64, Cr = 0.24, Cd = 0.41, Pb = 8.22).
ratios ----- As ----- ----- Cr ----- ----- Cd ----- ----- Pb ----- 2 days 30 days 2 days 30 days 2 days 30 days 2 days 30 days control g g bcd b b b ef e 1:0.5 Mn and P efg fg cdefgh bcdef b b h i 1:2 Mn and P d e fghi fghi b b h i 1:5 Mn and P ab b i hi b b i i 1:1 Ce g g bc b b b c d 1:1 Ce and 1:0.5 Mn and P efg g cdefghi cdefg b b h h
1:1 Ce and 1:2 Mn and P d ef hi defghi b b i i
1:1 Ce and 1:5 Mn and P a b ghi defghi b b i i
1:3 Ce g g a a a a a b 1:3 Ce and 1:0.5 Mn and P g fg bc bcde a a fg g
1:3 Ce and 1:2 Mn and P d ef efghi defghi b b i i
1:3 Ce and 1:5 Mn and P b c fghi efghi b b i i

48
New Jersey Soil and Utah Soil Figure 20 shows TCLP As concentrations for the New Jersey soil which are below regulatory limit. After 2 days, Mn and P combinations increased the TCLP As concentration significantly compared to the control. The addition of Ce was unable to counteract this increase, and the addition of Ce alone had no significant difference compare to the control (Table 17). In the Utah soil (Figure 21), the increases of As with the addition of Mn and P were smaller and were not significantly different from the control, with the exception of Ce and 1:5 Mn and P after 30 days. In both soils, the concentration of As are low and it does not exceed the regulatory limit of 5 mg/L. Chromium concentration in the New Jersey soil is low, and the TCLP concentration is below regulatory limit of 5 mg/L (Figure 22). All treatments reduced the TCLP concentration of Cr significantly compared to the control. The decrease was not significant for 1:1 Ce after 2 and 30 days and 1:05 Mn and P after 30 days. In Utah soil (Figure 23), the TCLP concentration of Cr is also below the regulatory limit, but none of the treatments had any significant effect. In the New Jersey soil, the addition of Mn and P decreased the TCLP concentration of Cd significantly compared to the control. This decrease was not large enough to reduce concentration below regulatory limit of 1 mg/L (Figure 24). The addition of Ce resulted in no significant difference compared to the control. Cerium also had no negative effect on the decrease with addition of Mn and P. Time was not a factor in the reduction of Cd concentration, but the amount of Mn and P played a greater role. The time period in these experiments of 30 days is short and may not represent the effect that time has on Cd stabilization. In Utah soil, none of the treatments had any significant effect on TCLP concentrations of Cd (Figure 25). Lead TCLP concentration in New Jersey soil was reduced significantly with the addition of Mn and P compared to the control (Figure 26). With the higher ratio of Mn and P (1:5), both without and with Ce, the TCLP concentration of Pb was reduced below detection limit. The addition of Ce had no effect on Pb. In Utah soil (Table 18), the Pb concentration was low and below regulatory limit. The addition of 1:5 Mn and P without and with Ce was able to reduce TCLP concentration of Pb significantly compared to the control after 2 days. After 30 days the reduction was significant compared to the control for all treatments except 1:0.5 Mn and P. This was the same as in the New Jersey soil. Cerium had no negative effect on Pb TCLP concentration.

49
0
1
2
3
4
5
6
0.5P 5P 1Ce 1Ce & 0.5P 1Ce & 5P control
treatments
TCLP
As
(mg/
L)
2 days 30 days regulatory limit
Figure 20. TCLP As Concentration With the Addition of Ce, Mn and P in New Jersey Soil (0.5P and 5P represent 1:0.5 Mn and P and 1:5 Mn and P; 1Ce represent 1:1 Ce).
0
1
2
3
4
5
6
0.5P 5P 1Ce 1Ce & 0.5P 1Ce & 5P control
treatments
TCLP
As
(mg/
L)
2 days 30 days regulatory limit
Figure 21. TCLP As Concentration With the Addition of Ce, Mn and P in Utah Soil (0.5P and 5P represent 1:0.5 Mn and P and 1:5 Mn and P; 1Ce represent 1:1 Ce).

50
0.00
0.01
0.02
0.03
0.04
0.05
0.06
0.07
0.08
0.09
0.10
0.5P 5P 1Ce 1Ce & 0.5P 1Ce & 5P control
treatments
TCLP
Cr (
mg/
L)
2 days 30 days
Figure 22. TCLP Cr Concentration With the Addition of Ce, Mn and P in New Jersey Soil (0.5P and 5P represent 1:0.5 Mn and P and 1:5 Mn and P; 1Ce represent 1:1 Ce) (regulatory limit 5 mg/L).
0
1
2
3
4
5
6
0.5P 5P 1Ce 1Ce & 0.5P 1Ce & 5P control
treatments
TCLP
Cr (
mg/
L)
2 days 30 days regulatory limit
Figure 23. TCLP Cr Concentration With the Addition of Ce, Mn and P in Utah Soil (0.5P and 5P represent 1:0.5 Mn and P and 1:5 Mn and P; 1Ce represent 1:1 Ce).

51
0
20
40
60
80
100
120
0.5P 5P 1Ce 1Ce & 0.5P 1Ce & 5P control
treatments
TCLP
Cd
(mg/
L)
2 days 30 days regulatory limit
Figure 24. TCLP Cd Concentration With the Addition of Ce, Mn and P in New Jersey Soil (0.5P and 5P represent 1:0.5 Mn and P and 1:5 Mn and P; 1Ce represent 1:1 Ce).
0
1
2
3
4
5
6
7
8
9
10
0.5P 5P 1Ce 1Ce & 0.5P 1Ce & 5P control
treatments
TCLP
Cd
(mg/
L)
2 days 30 days regulatory limit
Figure 25. TCLP Cd concentration with the addition of Ce, Mn and P in Utah soil (0.5P and 5P represent 1:0.5 Mn and P and 1:5 Mn and P; 1Ce represent 1:1 Ce).

52
0
5
10
15
20
25
30
0.5P 5P 1Ce 1Ce & 0.5P 1Ce & 5P control
treatments
TCLP
Pb
(mg/
L)
2 days 30 days regulatory limit
Figure 26. TCLP Pb Concentration With the Addition of Ce, Mn and P in New Jersey Soil (0.5P and 5P represent 1:0.5 Mn and P and 1:5 Mn and P; 1Ce represent 1:1 Ce). Table 17. Statistical Differences in New Jersey Soil TCLP Concentrations of As, Cr, Cd and Pb (α = 0.05, n = 3; LSD: As = 0.60, Cr = 0.07, Cd = 6.43, Pb = 1.74).
ratios ----- As ----- ----- Cr ----- ----- Cd ----- ----- Pb ----- 2 days 30 days 2 days 30 days 2 days 30 days 2 days 30 days control bc cd ab a a a ab ab 1:0.5 Mn and P a cd b ab b b c c 1:5 Mn and P a bc b b c e d d 1:1 Ce bc d ab ab a a a b 1:1 Ce and 1:0.5 Mn and P a cd b b b b c c
1:1 Ce and 1:5 Mn and P
a ab b b cd de d d

53
0
1
2
3
4
5
6
0.5P 5P 1Ce 1Ce & 0.5P 1Ce & 5P control
treatments
TCLP
Pb
(mg/
L)
2 days 30 days regulatory limit
Figure 27. TCLP Pb Concentration With the Addition of Ce, Mn and P in Utah Soil (0.5 P and 5 P represent 1:0.5 Mn and P and 1:5 Mn and P; 1Ce represent 1:1 Ce). Table 18. Statistical Differences in Utah Soil TCLP Concentration of As, Cr, Cd and Pb (α = 0.05, n = 3; LSD: As = 0.70, Cr = 0.38, Cd = 2.36, Pb = 0.25).
ratios ----- As ----- ----- Cr ----- ----- Cd ----- ----- Pb ----- 2 days 30 days 2 days 30 days 2 days 30 days 2 days 30 days control abcd de abc abc a a abc a 1:0.5 Mn and P abcd e abc bc a a ab abcde 1:5 Mn and P ab bcde abc c a a fg efg 1:1 Ce bcde e abc a a a abcde cdefg 1:1 Ce and 1:0.5 Mn and P abcd cde abc ab a a abcd bcdef
1:1 Ce and 1:2 Mn and P
a abc ab ab a a defg g
Bioassays New Jersey Soil The New Jersey soil was taken from the surrounding soil of a former cadmium pigment manufacturing site and had very low organic matter. It was chosen for testing because of the relative openness of the site combined with high levels of Cd and Pb.

54
Barley Assay Barley was used for the NJ plant assay. No reduction of germination resulted from either the contaminated soil without amendment, or the addition of amendment in either soil (Table 19). However, root weight was affected (Table 20). The unamended NJ soil treatment was significantly greater than the amended treatments. The amendments added to the sandy soil had no significant effects on root weight at the P<0.05 level, but at P<0.10 the amended treatments were significantly less that the unamended, but not different from each other. The overall soil by treatment effect was not significant, which indicates that the pattern of reduced root weight with the addition of amendments was similar for both soils. Even with the leaching of the soils after addition of either Mn, P or Mn, P, Ce (1:3), root weight was still depressed, which was somewhat surprising as that aspect of treatment had been designed to reduce the effects of excess phosphate on soil EC. The probable causes of the negative impact of amendments are discussed below. Table 19. New Jersey Soil Barley Germination Percent (no significant differences*)
Amendment Sand NJ ------------ % ---------- No Amendment, Leached 99.7 100 Mn & P (1:5), Leached 100 99.8 Mn & P (1:5), Ce (1:3), Leached 99.8 99.7
*Analysis of variance and mean separation tests were performed on arcsin transformed data. Results are presented in backtransformed units.
Table 20. New Jersey Soil Barley Root Weight (mg/germinated seed).
Amendment Sand* NJ** ----------------- % --------------- No Amendment, Leached 11.21 A 6.88 a Mn & P (1:5), Leached 8.23 B 3.03 b Mn & P (1:5), Ce (1:3), Leached 7.61 B 2.77 b
*Analysis of variance and mean separation tests were performed on log10- transformed data. Results are presented in backtransformed units.
*Values in the New Jersey column followed by the same letter are not significantly different (P<0.05), and for the Sand column capital values followed by the same letter are not significantly different (P<0.10)
Earthworm Assay. The impact of the addition of both Mn, P and Mn, P, Ce (1:3) amendments is more strikingly negative on earthworm survival, where no earthworms survived in amended New Jersey soils, but 100% survived the unamended New Jersey soil. No effect of amendments was observed in the control sand soil, where survival was 100% in all treatments (Table 21). Earthworm biomass change was positive for all surviving treatments. The amendments had no

55
effect on biomass change for the control sand soil (Table 22). This discovery was contrary to the hypothesized results. Archived samples of leachate from each treatment were examined further for details that might cast light on the cause of toxicity. It was initially thought that high EC or pH differences were again a cause of toxicity, but after further investigation ,the pH and EC of the New Jersey leachate showed no remarkable differences between the unamended or sand unamended leachates. With this discovery, it was surmised that other soil solution constituents were causing the acute toxicity; therefore, the samples were analyzed for metal content (As, Cd, Cr, Pb) Table 23). Arsenic was found to have the highest concentration in the leachate, especially when any amendment was applied. Though New Jersey soil had relatively small amounts of As, the addition of high levels of phosphate may have been responsible for a release of As from the soil due to competitive anion exchange. Peryea (1998) has observed increasing solubility, mobility and phytoavailability of As with the addition of phosphate to a lead arsenate-contaminated soil. Though leaching reduced the concentration approximately 4-fold, the As levels are still elevated at concentrations known to be toxic to aquatic organisms (Canivet et al., 2001; Forget et al., 1998; Lussier et al., 1985). Increasing water soluble As has been shown to reduce E. fetida cocoon production and juvenile development at much lower levels than those of the leachate reported here (Avila et al., 2007). Elevated levels of Cr and Cd were also found in leachate samples at levels known to be toxic to aquatic organisms (Forget et al., 1998; Hutchinson et al., 1994; Sorensen et al., 2006), which may have contributed to the acute toxicity. Chromium levels observed correspond to levels found to be toxic to E. fetida in a 48h distilled water test, where LC50 values ranged from 0.47 to 2.78 mg L-1 for Cr (Sivakumar and Subbhuraam, 2005). The addition of amendments resulted in acute toxicity to earthworms through increasing metals, specifically As and Cr, in the pore water. Pore water concentrations, in addition to total soil metal concentrations are key to explaining toxic effects of metals on the New Jersey soil. Futher clarification of these findings is recommended where variables such as additional leaching steps, aging, alteration of cerium levels or pH changes would be added to clarify causes of toxicity.
Table 21. New Jersey Soil Earthworm Survival (%)
Amendment Sand* NJ** ------------ % ---------- No Amendment, Leached 100 100 Mn & P (1:5), Leached 100 0 Mn & P (1:5), Ce (1:3), Leached 100 0
Table 22. New Jersey Soil Earthworm Biomass Change (%)
Amendment Sand* NJ** ------------ % ---------- No Amendment, Leached 123 111

56
Mn & P (1:5), Leached 117 ns Mn & P (1:5), Ce (1:3), Leached 122 ns
ns – no surviving earthworms
Table 23. Water Soluble Metal Content From New Jersey Soil Leachate.
Treatment As Pb Cd Cr -------------------------- mg/kg --------------------------
Initial Leachate No amendment 0.089 nd* 0.125 0.019 Mn, P 2.094 nd 0.300 0.493 Mn, P, Ce 2.273 nd 0.244 0.520 No amendment control sand 0.134 nd 0.013 0.000
Saturated Extract
No amendment 0.096 nd 0.079 0.032 Mn, P 0.607 nd 0.116 0.145 Mn, P, Ce 0.458 nd 0.089 0.105 No amendment control sand 0.114 nd 0.013 0.000
*nd – not detected
Smelter Site Soil The first set of biological assays on the smelter site soil made it clear that the amendments had severe toxic effects on the organisms. The following data are from the initial tests (unleached) and are followed by the leached treatment assays. Unleached Lettuce Assay With the addition of any amendment, no lettuce germinated. In the case of the peat soil alone, or with the pH raised to 6.5, germination was achieved, but the naturally low pH of the peat had a significant depressive effect on germination. Only when the pH was raised to 6.5 on the smelter site soil was there germination; however, it was still severely depressed at 7%, significantly less than the peat treatments with germination ( Table 24). Root length followed the same pattern where the peat with pH at 6.5 had significantly higher root length than without the pH raised. The smelter site soil with pH 6.5 also had significantly depressed root length compared to peat at pH 6.5, but was similar to the peat with no pH raise (Table 25). Earthworm Assay Earthworm survival on the peat soil was 100% in the absence of an amendment and pH 6.5 treatments, but survival on the smelter site soil was very low at 13% and 27% for no amendment and pH 6.5 respectively (Table 26). No earthworms survived in either soil for any treatments where amendment was

57
added. The two smelter site soil treatments with earthworms surviving were not different from one another. Biomass change for the earthworms surviving on the peat treatments was positive, and they were not different from one another, whereas surviving earthworms on the smelter site soil lost biomass during the course of the experiment ( Table 27). Table 24. Smelter Site Soil Lettuce Germination Percentage (%)
Amendment ------------ Soil**-----------
Peat Smelter -------------- % ------------
No Amendment 27 b ng pH 6.5 89 a 7 pH 6.5, Mn & P (1:5) ng † ng pH 6.5, Mn & P (1:5), Ce (1:3) ng ng pH 6.5, Mn & P (1:5), Ce (1:1) ng ng
*Analysis of variance and mean separation tests were performed on arcsintransformed data. Results are presented in backtransformed units.
**Values in a given column followed by the same letter are not significantly different (P<0.05)
†ng – no germination Table 25. Smelter Site Soil Lettuce Average Root Length (mm)
Amendment --------- Soil*--------
Peat Smelter ------------ % ----------
No Amendment 4.0 b - pH 6.5 49 a 8 pH 6.5, Mn & P (1:5) - - pH 6.5, Mn & P (1:5), Ce (1:3) - - pH 6.5, Mn & P (1:5), Ce (1:1) - -
*Values in a given column followed by the same letter are not significantly different (P<0.05) Table 26. Smelter Site Soil Earthworm Survival (%)
Amendment ------------ Soil-----------
Peat Smelter ------------ % ----------
No Amendment 100 13 pH 6.5 100 27

58
pH 6.5, Mn & P (1:5) ns* ns pH 6.5, Mn & P (1:5), Ce (1:3) ns ns pH 6.5, Mn & P (1:5), Ce (1:1) ns ns
*ns – no survival
Table 27. Smelter Site Soil Earthworm Biomass Change (%) Amendment ------------ Soil-----------
Peat Smelter ---------- % --------
No Amendment 130 75.2 pH 6.5 125 71.0 pH 6.5, Mn & P (1:5) - - pH 6.5, Mn & P (1:5), Ce (1:3) - - pH 6.5, Mn & P (1:5), Ce (1:1) - -
Leached Barley Assay Barley germination on the leached treatments was much greater than the lettuce on the unleached tests. For the peat soil, no treatment effect was observed and all treatments had 99% or greater germination. Germination on the smelter site soil was 94% or greater for all treatments, but germination was significantly reduced for the Mn, P and Mn, P, Ce (1:1) treatments compared to all others except Mn, P, Ce (1:3) (Table 28). Barley root weight did not show the same pattern of significance, however. For the peat soil, with the addition of any amendment, the root weight was significantly less than the peat at pH 6.5. The Mn, P and Mn, P, Ce (1:1) amendments were significantly less than the Mn, P, Ce (1:3). For the smelter site soil, all treatments were significantly greater than the unamended soil without pH 6.5. The Mn, P amendment was greater than Mn, P, Ce (1:3) and pH 6.5 treatments, but not Mn, P, Ce (1:1) (Table 29). Here we find a very positive effect of the addition of amendments, where the unamended smelter site soil resulted in very stunted barley roots, but with the addition of amendments roots were less inhibited. Table 28. Smelter Site Soil Leached Barley Germination (%)*
Amendment† ------------ Soil**-----------
Peat Smelter ------------- % -----------
pH 6.5, Leached 99.8 99.8 a pH 6.5, Mn & P (1:5), Leached 99.7 94.1 b pH 6.5, Mn & P (1:5), Ce (1:3), Leached 99.8 95.9 ab pH 6.5, Mn & P (1:5), Ce (1:1), Leached 100 94.5 b

59
No Amendment - 99.8 a
*Analysis of variance and mean separation tests were performed on arcsin-transformed data. Results are presented in backtransformed units.
**Values in a given column followed by the same letter are not significantly different (P<0.05) †PE No Amendment treatment did not exist, the pH 6.5, Leached treatment was the peat control
Table 29. Smelter Site Soil Leached Barley Root Weight (mg/germinated seed)*
Amendment† ------------ Soil**-----------
Peat Smelter
pH 6.5, Leached 15.0 a 5.1 b pH 6.5, Mn & P (1:5), Leached 6.7 c 6.5 a pH 6.5, Mn & P (1:5), Ce (1:3), Leached 9.1 b 5.1 b pH 6.5, Mn & P (1:5), Ce (1:1), Leached 6.9 c 5.4 ab No Amendment - 1.8 c
*Analysis of variance and mean separation tests were performed on log-transformed data. Results are presented in backtransformed units.
**Values in a given column followed by the same letter are not significantly different (P<0.05) †PE No Amendment treatment did not exist, the pH 6.5, Leached treatment was the peat control
Earthworm Assay Similar to the barley assay, earthworm survival and biomass gain were improved with the addition of any amendment. For the peat soil, no reduction in survival was observed, and all treatments resulted in 100% survival. Earthworms on the smelter site soil unamended treatment did not survive, with the pH 6.5 treatment resulting in 35% survival, and with the addition of any amendment to the smelter site soil, 95% or greater survival (Table 30). Earthworms in the peat soil had a positive biomass change, but the addition of the Mn, P, Ce (1:1) amendment caused significantly less change when compared to the unamended. Mn, P and Mn, P, Ce (1:3) were not different from Mn, P, Ce (1:1), nor were they different from the unamended in the peat soil. For the smelter site soil, the biomass did not increase, but with the addition of any amendment, a significant increase in percent change compared to the pH 6.5 only treatment occurred (Table 31). Again, for earthworms, the addition of amendment to the smelter site soil allowed for higher survival and increased biomass compared to the unamended or pH 6.5 smelter site soils. Metal contents of the earthworm tissue (Figure 28) are similar in range to other studies where earthworm tissue concentrations are recorded (Fischer and Koszorus, 1992; Langdon et al., 1999; Ma, 1982; Meharg et al., 1998; Pearson et al., 2000). In those studies earthworm tissue metal concentrations were found to range up to 120 mg kg-1 Cr, 240 mg kg-1 Pb, 902 mg kg-1 As and 75 mg kg-1 Cd. With the addition of any amendment, As, Cd and Pb tissue concentrations were significantly reduced compared to the undamended smelter site soil. For Cr, there were no differences noted for any treatment. For Pb, application of any amendment decreased tissue concentrations so that there was no significant difference from the earthworm tissue concentration on the peat soil. For Cd and As, tissue concentrations when amendments were

60
applied are still significantly elevated above the peat soil earthworms. The increased biomass gain in association with reduced bioavailability of metals on the amended smelter site soil compared to the unamended smelter site soil show the choice of these amendments to be advantageous on the smelter site soil. Table 30. Smelter Site Soil Leached Earthworm Survival (%)
Amendment† ------------ Soil*-----------
Peat Smelter
pH 6.5, Leached 100 35 b pH 6.5, Mn & P (1:5), Leached 100 95 a pH 6.5, Mn & P (1:5), Ce (1:3), Leached 100 95 a pH 6.5, Mn & P (1:5), Ce (1:1), Leached 100 100 a No Amendment - 0 b
*Values in a given column followed by the same letter are not significantly different (P<0.05) †PE No Amendment treatment did not exist, the pH 6.5, Leached treatment was the peat
control Table 31. Smelter Site Soil Leached Earthworm Biomass Change (%)
Amendment† ------------ Soil*-----------
PE SM ------------- % -------------
pH 6.5, Leached 121 a 63.2 b pH 6.5, Mn & P (1:5), Leached 111 ab 83.3 a pH 6.5, Mn & P (1:5), Ce (1:3), Leached 112 ab 82.4 a pH 6.5, Mn & P (1:5), Ce (1:1), Leached 105 b 88.1 a No Amendment - -
*Values in a given column followed by the same letter are not significantly different (P<0.05) †PE No Amendment treatment did not exist, the pH 6.5, Leached treatment was the peat
control

61
Figure 28. Smelter Site Soil Leached Earthworm Tissue Metal Concentration. Values Followed by the Same Letter are not Significantly Different at P<0.05 Table 32. Water Soluble Metal Concentrations From Smelter Site Soil
Treatment As Pb Cr Cd ------------------- mg/kg ----------------- Initial Leachate
pH 6.5, No Amendment 0.075 0.149 0.011 0.009 Mn, P 9.150 nd 0.003 0.050 Mn, P, Ce (1:3) 1.787 nd 0.002 0.016 Mn, P, Ce (1:1) 6.064 nd 0.003 0.029
Saturation Solution pH 6.5, No Amendment 0.046 0.212 0.018 0.014 Mn, P 7.822 0.006 0.004 0.041 Mn, P, Ce (1:3) 2.523 nd 0.007 0.013 Mn, P, Ce (1:1) 5.670 nd 0.003 0.025
nd – not detected After investigating the leachate metal concentration of the New Jersey soil (

62
Table 23), smelter site soil leachate for a selection of treatments also was determined (Table 32). Chromium and cadmium content of earthworm tissue is much lower than that observed for the New Jersey soil, but As levels are much higher for Mn and P or Mn and P with Ce (1:1). However, the high As levels were not toxic to the earthworms on the smelter site soil. Hyperaccumulator Fern Assay All fern plants survived and produced biomass except the Mn, P, Ce (1:3) treatment where only one replicate survived and produced very little biomass. Therefore, the Mn, P, Ce (1:3) treatment was excluded from statistical analysis but has been included in the reported data. Total metal concentrations in the fronds are presented in Table 33. Arsenic levels in the fronds increase with the addition of any amendment, but only the Mn, P, Ce (1:1) treatment is significantly greater than the unamended smelter site soil. Cadmium levels in the fronds are significantly reduced with the addition of any amendment, and the Mn, P amendment is not significantly different from the control peat frond concentrations. The Mn, P amendment significantly reduced Cr in the frond compared to the unamended control, but the inclusion of Ce in the amendment resulted in no significant difference from the unamended smelter site soil. Lead concentrations were significantly elevated with the Mn, P, Ce (1:1) amendment above the unamended smelter site soil. Though it had been hypothesized that the addition of the combination of amendments would reduce the uptake of metals, the inclusion of an As-scavenging species was important to monitor the in-situ effect of the amendments. However, the increase in As availability and uptake with the addition of amendments was unexpected as Ce had been included for the purpose of reducing available As due to its high affinity for As. Table 33. Hyperaccumulator Fern Shoot Metal Content
Treatment As* Pb Cr Cd
--------------------- mg/kg -------------------
smelter no amendment 163 a† 41.2 a 10.5 a 0.02 a
smelter pH 6.5, Leached 131 ab 8.17 b 3.00 b 4.42 b
pH 6.5, Mn & P (1:5), Leached 304 ac 0.65 c 3.04 bc 4.05 abc pH 6.5, Mn & P (1:5), Ce (1:3), Leached 666** 16.17 47.27 nd
pH 6.5, Mn & P (1:5), Ce (1:1), Leached 444 cd 1.44 d 9.82 ad 25.0 d
peat pH 6.5 21.4 ab 0.48 c 0.96 e nd
*Values in a given column followed by the same letter are not significantly different by t-test (P<0.05)
**Italicized data was not included in statistical analysis † All statistical analyses were by paired-t, and the comparisons are sequential beginning from
the top of each column and proceeding downward in the column. Thus, any mean in any column followed an “a” is not significantly different that the mean for “smelter no amendment”. Similarly, any mean in any column followed a “b” is not significantly different that the mean for “smelter pH 6.5, Leached”, etc.

63
The probable cause for increased As uptake is the high amount of phosphate applied based on its remedial effects on Pb and to some extent Cd. Phosphate rock has been applied to soil contaminated with As, Pb and Cd, where P. vittata was grown to assess metal uptake (Fayiga and Ma, 2005). With the addition of phosphate rock, Pb and Cd concentrations were significantly reduced in the frond, while As concentrations increased. Tu and Ma (2003) suggest phosphate application to As-contaminated soils in combination with P. vittata to be a viable strategy for phytoremediation. Though the objective here was not phytoremediation strategies, our data did reflect an increased availability of As to P. vittata. Utah Soil Lettuce Assay Lettuce germination was not affected by the addition of amendments for the Utah soil (Table 34). The loam control soil had an unknown source of depressive effect resulting in less that 45% germination for any treatment, with significantly less germination for the Mn, P, Ce (1:3) amendment (data not shown). A duplicate tests was performed to ascertain if the control soil depression was an irregularity or inherent to the soil. The duplicate test confirmed that the greenhouse soil held an unknown depressive effect, and the initial observations for Utah lettuce parameters are presented without the control. Average root length was significantly less with the addition of any amendment in the Utah soil (Table 35). The high germination and root length parameters for the Utah soil may be a result of the relatively low amount of metals (other than Cr) compared to the other soils used in these experiments. The amount of amendment was not as great for the Utah soil, so depression due to the addition of amendment, and the necessity of subsequent leaching, was not as pronounced.
Table 34. Utah Soil Lettuce Germination (%)
Amendment Utah Soil
--- % --- No Amendment 93 Mn & P (1:5) 88 Mn & P (1:5), Ce (1:3) 88
*Analysis of variance and mean separation tests were performed on arcsin-transformed data. Results are presented in backtransformed units.None of the differences were significant. Table 35. Utah Soil Lettuce Average Root Length (mm)
Amendment Utah Soil
---% --- No Amendment 46 a Mn & P (1:5) 38 b Mn & P (1:5), Ce (1:3) 36 b
*Values followed by the same letter are not significantly different (P<0.05)

64
Earthworm Assay Earthworm survival was 100% for both soils and all treatments (Table 36). Also, biomass change was >100% for both soils and all treatments, indicating that positive growth occurred (Table 37). No significant differences in biomass change were observed but there was a pattern of increasing earthworm biomass with the addition of amendments (in the Mn, P then Mn, P, Ce (1:3) order). Earthworm tissue metal concentrations were not reduced with the addition of any amendment (Figure 29) and the addition of Mn, P, Ce (1:3) to the smelter site soil caused a significant increase in Cd concentration over the unamended treatment. For Cd, Cr and Pb in some cases, tissue metal concentrations are higher than what was observed on the smelter site soil, while the total metal concentrations in the Utah soil were much lower than the smelter site soil. Earthworm metal uptake is not solely governed by total metal content of the soils alone, but is influenced by several soil parameters such as pH, CEC, organic matter and texture, with pH as the dominant factor in determining earthworm uptake of metals (Nahmani et al., 2007). Differences in soil properties between the Utah and smelter site soils such as pH and organic matter could have contributed to the observed pattern of biological response. The high organic matter content in the smelter site soil may have increased sorption sites for metals, or facilitated Cr reduction, thus decreasing the amount of metals in the soil solution available to earthworms. Though the literature suggests that an increase in soil pH is correlated to decrease in earthworm tissue metal concentration, here the opposite is found, where the Utah soil with pH at 7.4 caused higher accumulation than the smelter site soil at pH 5.9. When comparing the Utah and smelter site soils, the increased tissue metal concentration in the Utah soil could be explained by the differences in the smelter site soil having high organic matter and high levels of amendments added. Table 36. Utah Soil Earthworm Survival (%)
Amendment ------------ Soil*-----------
Loam Utah
------------ % ------------ No Amendment 100 100 Mn & P (1:5) 100 100 Mn & P (1:5), Ce (1:3) 100 100
Table 37. Utah Soil Earthworm Biomass Change (%)
Amendment Soil
Loam Utah
---------- % ---------- No Amendment 121 120 Mn & P (1:5) 122 125 Mn & P (1:5), Ce (1:3) 125 124

65
Figure 29. Utah Soil Earthworm Tissue Metal Content. Values Followed by the Same Letter Are Not Significantly Different at P<0.05.
Task 4c. Spectroscopic Identification of As and La Precipitates Raman and X-ray Spectroscopies Precipitates of As(V) and La(III) at pH 5.5 and 3.9 were prepared and identified by x-ray diffraction as LaAsO4 (Figure 30). The precipitate consisted of very small crystallites as indicated by the broad diffuse diffraction lines. The spectra were the same for precipitates formed at the two different pH values tested and were an exact match to the library reference spectra of LaAsO4. Also, As(V) combined with Ce(III) at pH 5.5 and 3.9 had the same spectra pattern. There is no CeAsO4 reference spectrum in our library, but because La and Ce are similar, they should produce similar patterns. It can be assumed that the precipitate of As and Ce is also CeAsO4. The assumption in Visual MINTEQ that the form of lanthanum arsenate formed at different pH is LaAsO4 is correct.

66
Figure 30. X-ray Diffraction Spectra of Lanthanum Arsenate Precipitate. (A) Arsenate with La(III) or Ce(III); 1P-La(III) at pH 5.5; 2P-La(III) at pH 3.9; 3P-Ce(III) at pH 3.9; 4P-Ce(III) at pH 5.5. (B) Match of Precipitate Spectra With a Standard of LaAsO4 (ref. code 00-015-0756) From X-ray Diffraction Library. Arsenate Speciation in Lanthanum Arsenate Solution and Precipitate Determined Using Raman Spectroscopy Arsenate in the solution after the addition of La does not form a LaAsO4 soluble complex that can be detected by Raman spectroscopy. Figure 31 show the spectra of As(V) solution at different pH after the addition of La(III). Spectra A in Figure 31 shows 50 mM As(V) at pH 9.1 and H shows 50 mM La(III). Lanthanum is not detected with Raman spectroscopy. The difference in aqueous arsenate speciation, after the precipitation of lanthanum arsenate, is due to change in pH of the solution and not due to of La complexation. Figure 32 compares a solution of As(V) with La(III) at different pH to spectra of As(V) with corresponding pH change. The similar differences in the spectra are seen with the change of pH with or without La in the solution. Integration of As peaks (Figure 33), allows us to quantify the As left in the solution after precipitation of 50 mM As with different amounts of La. This allows for the comparison of Visual MINTEQ modeling results with laboratory experiments using Raman spectroscopy. As shown in Figure 34, the seven targeted points of total soluble As as determined by chemical
P o s i t i o n [ ° 2 T h e t a ]2 0 3 0 4 0 5 0 6 0 7 0
C o u n t s
0
1 0 0 0 0
2 0 0 0 0
3 P
0
10000
20000
Counts
Position [°2Theta]10 20 30 40 50 60 70
4P 1P 2P 3P
A
B

67
modeling were compared to Raman spectra, the integrated region from 610 to 1028 wavenumber (cm-1). There is good correlation, with R2 of 0.98 (Figure 34), between chemical modeling and Raman spectroscopy studies. It was discussed in the literature (Tokunaga et al., 1999) and assumed in Visual MINTEQ modeling that As precipitates with La as LaAsO4. The precipitate that was prepared in our studies and analyzed by the x-ray diffraction matched the library reference spectra and Raman spectra. Experiments with As(V) and La(III) at pH 7.4, 6.6, 6.0, 5.2, 2.8 and 2.2 all showed the same speciation of AsO4
3- in the precipitate (Figure 35). There is a slight shift in the As-O position band with the decrease in pH, from 855.9 to 859.4 wavenumber (cm-1) (between pH 5.2 and 2.8). There was also water associated with the precipitate that was not associated in the solution spectra (Figure 36).
W avenum ber (cm -1)
A
B
C
D
E
F
G
H
Ram
an In
tens
ity
W avenum ber (cm -1)
A
B
C
D
E
F
G
H
Ram
an In
tens
ity
Figure 31. Raman Spectra of Aqueous As(V) and La(III) Solution at pH 7.4, 6.6, 6.0, 5.2, 2.8 and 2.2. (A) 50 mM As(V) at pH 9.1 and (H) 50 mM La(III) at pH 4.6. Spectra B-G 50 mM As(V) and 7.5, 17.5, 23, 25, 28.9 and 50 mM La(III), respectively; (B) pH 7.4, (C) pH 6.6, (D) pH 6.0, (E) pH 5.2, (F) pH 2.8 and (G) pH 2.2.

68
Ram
an In
tens
ity
Wavenumber (cm-1)
A
E
B
F
C
G
D
H
Ram
an In
tens
ity
Wavenumber (cm-1)
A
E
B
F
C
G
D
H
Figure Figure 32. Comparison of Raman Spectra of Aqueous As(V) + La(III) (top) to Aqueous As(V) (bottom). (A and E) pH 7.4; (B and F) pH 6.6; (C and G) pH 5.2; (D and H) pH 2.2.
Figure 33. Raman Spectra of Solution of 50 mM As(V) + 25 mM La(III) at pH 5.2. Shaded Area Was Integrated for Comparison With Chemical Modeling.

69
R2 = 0.98
0.0E+00
2.0E+05
4.0E+05
6.0E+05
8.0E+05
1.0E+06
1.2E+06
1.4E+06
1.6E+06
1.8E+06
0 0.01 0.02 0.03 0.04 0.05 0.06
total As (chemical modeling)
Inte
grat
ed A
rea
Figure 34. Comparison of As(V) Concentrations at Targeted Points in Chemical Modeling to Concentrations of As(V) in Raman Spectra of the Solutions.
Ram
an In
tens
ity
W av en u m b er (cm -1 )
A
B
C
D
E
F
Ram
an In
tens
ity
W av en u m b er (cm -1 )
A
B
C
D
E
F
Figure 35. Raman Spectra of Lanthanum Arsenate Precipitate at pH 7.4, 6.6, 6.0, 5.2, 2.8 and 2.2. Initial As(V) Concentration of 50 mM. (A) 7.5 mM La(III) at pH 7.4; (B) 17.5 mM La(III) at pH 6.6; (C) 23 mM La(III) at pH 6.0; (D) 25 mM La(III) at pH 5.2; (E) 28.9 mM La(III) at pH 2.8; and (F) 50 mM La(III) at pH 2.2.

70
Ram
an In
tens
ity
W avenumber (cm -1)
A
B
As-O stretching bands
HOH bend of water
OH stretch(sorbed water + structural OH)
Ram
an In
tens
ity
W avenumber (cm -1)
A
B
As-O stretching bands
HOH bend of water
OH stretch(sorbed water + structural OH)
Figure 36. Comparison of Raman spectra of As(V) and La(III) Solution With Precipitate at pH 7.4. (A) Solution of 50 mM As(V) + 7.5 mM La(III) at pH 7.4 and (B) Precipitate of 50 mM As(V) + 7.5 mM La(III) at pH 7.4.
Arsenate Speciation in Lanthanum Arsenate Precipitate: Comparison of Raman Spectroscopy to ATR-FTIR Spectroscopy The ATR-FTIR analysis of the precipitate of lanthanum arsenate formed at different pH yielded results similar to those from Raman spectroscopy. The precipitate formed at pH 7.4, 6.6, 6.0, 5.2, 2.8 and 2.2 had the same species of As(V). There is also a shift in As-O stretch band peaks with the decrease in pH (Figure 37). Figure 38 compares the spectra of ATR-FTIR and Raman of lanthanum arsenate precipitate at pH 7.4 and 2.2 and shows that the methods are complementary.

71
W a v e n u m b e r ( c m - 1 )
Abs
orba
nce
A
B
C
D
E
F
W a v e n u m b e r ( c m - 1 )
Abs
orba
nce
A
B
C
D
E
F
Figure 37. ATR-FTIR Spectra of Lanthanum Arsenate Precipitate at pH 7.4, 6.6, 6.0, 5.2, 2.8 and 2.2. Initial As(V) Concentration of 50 mM. (A) 7.5 mM La(III) at pH 7.4; (B) 17.5 mM La(III) at pH 6.6; (C) 23 mM La(III) at pH 6.0; (D) 25 mM La(III) at pH 5.2; (E) 28.9 mM La(III) at pH 2.8; (F) 50 mM La(III) at pH 2.2.
W a v e n u m b e r ( c m - 1 )
B
D
A
C
A R T - F T I R
A R T - F T I R
R a m a n
R a m a n
W a v e n u m b e r ( c m - 1 )
B
D
A
C
W a v e n u m b e r ( c m - 1 )
B
D
A
C
A R T - F T I R
A R T - F T I R
R a m a n
R a m a n
Figure 38. Comparison of ATR-FTIR Spectra with Raman Spectra of Lanthanum Arsenate Precipitate at pH 7.4 and 2.2. (A and B) 50 mM As(V) + 7.5 mM La(III) at pH 7.4; (C and D) 50 mM As(V) + 50 mM La(III) at pH 2.2.

72
Lanthanum and Cerium Effect on Arsenic in Soil In the field, the Lead Smelter soil was measured to be pH 5.9, but after drying the pH decreased below 4. This may have occurred because the soil (particularly sulfides) became oxidized, creating sulfuric acid. The addition of lanthanum to wet soil, especially at the higher concentrations, also reduced soil pH significantly. An extreme example is of 1:30 As:La in which the soil pH dropped to 1.6, but stabilized at approximated pH 3.1 to 3.3 and remained constant. One reason for the lower soil pH is that La exists as La3+ at pH below 4, so every mole of La can replace three moles of H+ on the soil exchange sites. The second reason for reduction in pH can be attributed to La combining with As. At pH < 7, two moles of hydrogen ions are released for every one mole of La and As combined. Above pH 7, one mole of hydrogen ion is released for every one mole of La and As combined. Studies in our laboratory show the same decrease in pH after addition of As(V) with La or Ce (Table 38).
Table 38. Pure Phase Precipitation pH Experiments; As(V) and As(III) Combined With La(III) or Ce(III).
Solution no addition
0.25 M La(III) 0.25 M Ce(III)
0 hr 1hr 18h 0 hr 1hr 18h ------------------------------------ pH --------------------------------------
0.25 M As(V) 8.73 2.15 1.70 1.45 1.98 1.66 1.48 0.25 M As(III) 11.23 6.00 5.94 5.74 5.61 5.53 5.42
Figure 39 indicates that La does not decrease the bioaccessible fraction of arsenic to less than the control soil, which has less than 10% bioaccessible As (Table 39). On the contrary, there is considerable increase in As bioaccessibility with the increase of added La, with an R2 value of 0.91 (Figure 40). There was no correlation with time, suggesting that most reactions occurred within one day (Table 40). Three possible explanations exist for the increase in arsenic with the addition of La: 1) La targets arsenic, but when exposed to harsh PBET conditions (low pH), the compound dissolves, 2) As is present as As(III) (in soil with low Eh, As(III) is the most probable form of As) forming soluble precipitate and 3) La targets the compound with which As is combined, and thereby resulting in As becoming more available. Xiaodong Gao and Darrell Schulze (Purdue University, Indiana, personal communication) reported that arsenic is present in the test soil in the form of realgar (AsS). There could be a potential interaction of La with S, hindering the formation of LaAsO4(s). TCLP results (Figure 41) suggest the same phenomena, basically before the addition of lanthanum the As does not pose a problem because the concentrations are below 5 mg/L (regulatory limit for As). The addition of La at even the smallest ratio increased the concentration of As released.

73
0 10 20 30 40 50 60
3
10
30
control 1
control 2
lant
hanu
m ra
tios
to a
rsen
ic in
soi
bioaccessibility % arsenic
1 day 7 days 90 days 180 days
Figure 39. Bioaccessibility Percent of Arsenic With Different Lanthanum Ratios to Soil Arsenic Over Time (1, 7, 90 and 180 days).
R2 = 0.9131
0
10
20
30
40
50
60
70
0 10 20 30ratios of lathanum to arsenic in soil
bioa
cces
sibi
lity
% o
f ars
enic
Figure 40. Trend Between Ratios of La to Bioaccessibility Percent (considering all investigated ratios of La) in Lead Smelter Soil.

74
Table 39. Bioaccessibility % of Arsenic With La and Ce Amendments Over Time in Lead Smelter Soil.
Treatment 1 day 7 days 90 days 180 days
- - - - - Bioaccessibility % - - - - - 1:3 As:La 11.60 13.84 16.85 10.95
12.13 13.75 14.69 10.11 18.19 15.18 8.76 10.44 14.14 14.71 8.59 10.69
1:10 As:La 25.83 27.24 10.82 19.82 25.03 26.45 8.65 19.64
1:30 As:La 43.50 55.91 16.59 61.94 47.01 55.98 23.56 56.78
1:3 As:Ce 9.93 9.35 5.46 8.19 10.45 8.16 7.32 5.99 5.99 9.12 8.41 4.09 6.05 9.20 5.65 4.53
1:10 As:Ce 10.28 8.95 4.68 3.41 10.02 8.79 7.06 4.44
1:30 As:Ce 10.34 8.32 4.36 3.05 6.53 8.30 4.16 2.99
control 1 6.29 7.60 7.93 6.75 6.44 9.23 7.02 4.75 5.88 9.54 4.88 4.00 3.39 9.42 4.61 3.95
control 2 6.01 13.73 7.98 8.38 8.73 10.70 10.70 7.37 15.45 11.72 13.73 9.69 7.85 11.74 9.27 9.94
Cerium at higher ratios with time resulted in a decrease of the bioaccessible fraction below both the control 1 (4.9%) and control 2 (8.8%) (Figure 42). With the ratios of 1:10 and 1:30, As:Ce bioaccessible As was reduced to 3.9 and 3.0% after 6 months. There is no correlation between the concentration of Ce and bioaccessible % after 1 day, but after 7, 90 and 180 days, there is a strong correlation with R2 of 0.98, 0.99, 0.80, respectively (Figure 43). The reaction between As and Ce is time dependent. This also is shown with the overall correlation (R2=0.80), where all the ratios of Ce are considered (Figure 44). In TCLP, which is a less rigorous extraction test, the results show that the ratio of 1:10 and 1:30 As:Ce, arsenic was reduced below detection limits within 1 day. With the ratio of 1:3 As:Ce after 90 days, arsenic concentration was decreased by half compared to the control (Figure 45). Cerium may have a higher affinity for arsenic than other elements in the soil, improving the potential for the interaction or Ce is less sensitive to a pH change than La.

75
Table 40. Bioaccessibility % of Chromium With La and Ce Amendments Over Time in Lead Smelter Soil.
Treatment 1 day 7 days 90 days 180 days
------------------------ Bioaccessibility % ------------------------ 1:3 As:La 43.88 42.27 42.58 34.49
44.34 45.58 45.71 35.92 43.21 36.93 20.83 19.95 37.74 37.10 19.63 20.68
1:10 As:La 40.00 34.52 19.58 15.15 37.64 33.78 20.47 16.31
1:30 As:La 37.64 33.78 20.47 16.31
29.10 30.90 19.60 16.23 31.39 30.43 20.53 17.73
1:3 As:Ce 57.84 56.26 46.42 57.00 53.14 51.25 53.81 43.99 18.20 36.60 17.60 18.01 33.66 35.32 17.38 19.35
1:4 As:Ce 40.82 51.91 47.42 39.28 55.03 49.86 41.34 38.88
1:10 As:Ce 39.97 34.27 22.08 17.24 32.43 34.63 18.58 20.18
1:30 As:Ce 42.49 33.29 18.53 13.05 33.11 32.52 18.73 12.61
control 1 43.22 41.58 42.53 37.93 46.32 44.46 39.99 30.80 38.22 38.47 24.65 19.18 35.57 39.80 24.31 19.15
control 2 24.97 34.35 28.65 30.14 30.74 27.75 34.35 30.17 39.45 35.80 27.75 29.04 29.69 35.79 25.60 25.28

76
0 100 200 300 400
3
10
30
control 1
control 2lant
hanu
m ra
tio to
ars
enic
in s
oi
mg/L arsenic in TCLP1 day 7 days 90 days 180 days
Figure 41. TCLP Results for Arsenic at Different Ratios of As:La Over Time (1, 7, 90 and 180 days); Regulatory Limit is 5 mg/L.
0 5 10 15
3
10
30
control 1
control 2
ceriu
m ra
tios
to a
rsen
ic in
soi
l
bioaccessibility % arsenic
1 day 7 days 90 days 180 days
Figure 42. Bioaccessibility Percent of Arsenic With Different Cerium Ratios to Soil Arsenic Over Time (1, 7, 90 and 180 days).

77
R2 = 0.8034
R2 = 0.9915
R2 = 0.9823
R2 = 0.0139
0
2
4
6
8
10
12
0 5 10 15 20 25 30ratios of cerium to arsenic in soil
bioa
cces
sibl
e %
ars
enic
1 day 7 days 90 days 180 days
Figure 43. Trend Between Ratios of Ce to Bioaccessibility Percent Taking into Consideration Different Ratios of Ce Amendment in Lead Smelter Soil.
R2 = 0.8022
0
2
4
6
8
10
12
0 50 100 150 200days
bioa
cces
sibi
lity
% o
f ars
enic
Figure 44. Trend Between Times to Bioaccessibility Percent (considering all investigated ratios of Ce) in Lead Smelter Soil.

78
0.00 0.20 0.40 0.60 0.80 1.00
3
10
30
control 1
control 2
ceriu
m ra
tio to
ars
enic
in s
oil
mg/L arsenic in TCLP1 day 7 days 90 days 180 days
Figure 45. TCLP Results for Arsenic at Different Ratios of As:Ce Over Time (1, 7, 90 and 180 days); Regulatory Limit is 5 mg/L. Research on LaAsO4 and CeAsO4 pure solid phases, show that both compounds dissolve completely when PBET tests are performed on them (using 0.1 g of the pure minerals to 100 mL PBET solution rather than 1 g used in the soil extraction procedure). This supports the first theory that La and Ce are targeting As in the soil, but are dissolving after exposure to the PBET test. The results for TCLP indicate that this conclusion may not be certain, because the TCLP solution is less harsh than the PBET (pH of about 4.9). The increase in As concentration in the TCLP after addition of La suggests that the second or third hypothesis is correct, La is targeting not As but complex with which As is combined (Tokunaga et al., 1997). It is unclear why Ce is showing a trend of decreasing bioaccessible As in the soil and, unlike La, is not affected by the low pH of PBET solution. Further studies using chemical modeling and spectroscopy (Raman and FTIR) are discussed in Chapter 6 to enhance understanding of this phenomenom.
Task 4d. X-ray Analyses Total Chemical Analysis The total contents of the major elements and loss on ignition (LOI) are summarized in Table 42. Sample S1 provides average elemental contents integrated over a depth of 0 – 50 cm, while samples S2, S3, and S4 provide information with depth. No apparent trends were observed in the loss on ignition (LOI) data. All samples have high LOIs varying from 218 to 568 g kg-1. The high LOI values reflect the fact that the soil is a Histosol with high organic matter content and that the Fe-rich inorganic phases (see below) are hydroxyl-rich.

79
A number of trends in major element contents were observed with depth. Aluminum and Si contents consistently increased with depth and this may reflect the change in depositional environment as the organic material accumulated at this site. Sodium, K, Mn, and Mg were present at quite low concentrations for all samples, particularly in the surface horizons. The average total contents of Na, K, Mn, and Mg provided by samples S1 are about half of the typical soil average of 6.3 g kg-1 for Na, 8.3 g kg-1 for K, 1.9 g kg-1 for Mn, and 5.0 g kg-1 for Mg (Lindsay, 1979). The total contents of these elements tend to be higher in the deeper horizons with the exception of the S4 samples. The depletion of these metals in the surface horizons can be explained by the seasonal fluctuation of the water table at this site. Soluble salts of these metals dissolved during wet periods when the surface was saturated. When the water table became lower during dry periods, these elements were leached and accumulated in the deep horizons, which resulted in the lower contents in the surface and higher contents in the deeper horizons. High contents of sulfur were present in all the samples, but the distribution trends differ among the four sample collections. For samples S2 and S4, which were collected during relatively dry periods, the sulfur content is generally higher in the surface horizons and lower in the deeper horizons. In contrast to S2 and S4, the S3 samples, which were collected during a wet period, has extremely high sulfur content in the deepest layer. Calcium and sulfur contents are correlated, with high Ca content associated with high S content, which is consistent with the presence of gypsum (see below). The S2 and S4 samples had higher content of Ca in the surface and lower content with depth, while the S3 samples had higher content of Ca in the deep horizons. The Fe content of this soil is very high (Table 42) compared to the soil average (~38 g kg-1) (Lindsay, 1979). For the S2 and S3 samples, the highest Fe contents occurred in the surface horizons, the second highest contents were in the lowest horizons, and the minimum Fe contents occurred at intermediate depths (10 – 18 cm in S2 and 20 – 30 cm in S3). The total contents of Pb, Cr, Zn, Cu, Sr, Zr, Ni, and V are summarized in Table 42. Cadmium and arsenic were analyzed semi-quantitatively due to the lack of certified standards, and are not included in the table. Due to insufficient sample material, data for some elements is missing in Table 42. The contents of Sr, Zr, V, and Ni are close to the background, and there is no clear evidence for contamination by these metals. The Cu content is slightly elevated compared to the soil average (~30 mg kg-1) (Lindsay, 1979). Lead, Cr, and Zn are present at much higher concentrations than in normal soils, particularly in certain horizons, indicating the soil is heavily contaminated with these metals. Lead and Zn occur at extremely high concentrations, and high Zn tends to be associated with high Pb contents, but this relationship is not consistent. Both Pb and Zn concentrations are higher in subsurface horizons than in surface horizons. Chromium content is lowest at the surface and is highest from about 18 – 30 cm below the soil surface. Arsenic is consistently present in all soil samples, but substantial Cd was only detected in the deepest layer (25 – 30 cm) of the S4 samples (data not shown).

80
Table 41. Major Element Contents and Loss on Ignition (LOI) for the Samples.
Sample Depth (cm)
Major element content Fe S
Al
Si Mn
Mg
Na
K
Ca
P Ti
LOI
--------------------------------------------------------------g kg-1---------------------------------------------------------------
S1 0-50 298.2 22.1 20.1 52.0 1.24 2.67 3.33 3.11 11.3 2.51 1.29 330.4
S2a S2b S2c S2d S2e
0-1 1-5
10-18 18-30 30-40
454.7 392.1 52.3
275.7 327.5
24.3 11.4 25.7 8.7 8.3
0.8 4.1
14.9 21.8 30.7
9.4 24.5 75.3 91.8 69.9
0.23 0.57 0.36 0.89 0.90
2.80 2.58 1.45 2.66 3.11
0 0
1.67 1.21 0.49
0.43 1.00 4.74 5.06 3.92
23.3 13.6 27.2 4.9 6.4
0.55 2.51 1.12 2.78 2.86
0.18 0.48 1.82 1.75 1.61
263.0 330.3 476.6 322.5 273.0
S3a S3b S3c S3d S3e
0-10 10-20 20-30 30-50 50-65
376.1 380.2 90.2
171.1 154.6
11.3
30.6
4.0 17.0 28.2 16.9 30.6
23.1 73.4 61.7 43.9
102.2
0.59 0.57 0.92 1.12 1.37
2.42 1.47 3.07 3.07 4.99
0 1.85 1.24 4.81 6.49
1.91 5.26 2.64 2.14 5.85
8.6 9.6
15.3 21.5 15.4
2.51 0.86 3.44 1.66 1.62
0.50 2.00 1.29 1.03 1.64
362.4 434.1 203.8 463.8 392.1
S4a S4b S4c
0-15 15-20 25-30
480.0
21.2
25.7
11.8
1.0
37.4
11.7
134.9
2.12
0.10
7.31
3.93
3.54
4.87
1.75
11.36
23.0
3.5
0.82
0.53
0.23
1.81
218.2 388.3 568.4

81
Table 42. Trace Element Contents for the Samples.
Sample Depth (cm)
Trace element content Pb Cr Zn
Cu Sr
Zr
Ni V
------------------------------------------------- mg kg-1 ----------------------------------------------
--
S1 0-50 11400 844 19400 100 54 70 27 60
S2a S2b S2c S2d S2e
0-1 1-5
10-18 18-30 30-40
335 2612
94200 5420 2835
13 27
547 1562 1290
147 47
5760 921 327
123 47 73
169 454
18 19 76 49 30
10 114 360 66 53
33 47 52
142 145
1 21
105 89 60
S3a S3b S3c S3d S3e
0-10 10-20 20-30 30-50 50-65
6370
46900
22 741
1298 516 188
9560
20000
358
109
18 54 31 55 85
149 268 47 45 66
40
40
16 127 73 73 69
S4a S4b S4c
0-15 15-20 25-30
176
10400
70
142
422
18600
78
65
39
40
17
66
156
65
4
55

82
Bulk Powder X-ray Diffraction (XRD) The bulk XRD patterns will be described as a function of depth. The S3 samples, collected when the water table was above the soil surface, and S4 samples, collected when the surface was dry, will be compared. The mineralogy of the reddish brown surface layer appears to be relatively simple, but differs slightly depending on when the sample was collected. Sample S3a (Figure 46) contains quartz (SiO2), goethite (α-FeOOH), and a poorly crystalline phase. Sample S4a (Figure 46) contains gypsum (CaSO4•2H2O), goethite, trace amount of quartz, and the same poorly crystalline phase as S3. The presence of large amounts of gypsum only in the samples from dry periods indicates that this mineral precipitated from solution as the soil dried. The poorly crystalline phase, present as a major phase in both S3 and S4, does not match any mineral phases in the PDF file particularly well. It has the diagnostic d110 peak of akaganeite (β-FeOOH) at 0.739 nm and other peaks match akaganeite very well, but the peaks are significantly broadened and the relative intensities of some of the major peaks are noticeably different compared to the akaganeite diffraction patterns in the literature (Deliyanni and Matis, 2005, Regenspurg and Peiffer, 2005). Incorporation of sulfate into the structure of akaganeite may partially destroy the crystallinity of the structure and lead to broad diffraction peaks (Bigham et al., 1990; Deliyanni et al., 2003). Sulfate-incorporated akaganeite is probably the best name for this poorly crystalline phase. This will be discussed in more detail in the next chapter. Akaganeite is usually observed as a corrosion product of Fe in marine environments and, to our knowledge, this is the first report of its formation under soil conditions. No significant differences were observed in the mineralogy of the subsurface horizons of sample collections S3 and S4. Therefore only the XRD patterns of S3 will be discussed. The mineralogy of sample S3b (10 - 20 cm) and S3c (20 - 30 cm) of S3 are very similar (Figure 47). Major phases include: quartz (SiO2), hematite (α-Fe2O3), and magnetite (Fe3O4), with trace amounts of goethite (α-FeOOH) and gypsum (CaSO4•2H2O). Wustite (FeO) and either birnessite [(Na,Ca)0.5(Mn4+,Mn3+)2O4•1.5H2O] or kaolinite [Al2Si2O5(OH)4] are possible phases in the 20 – 30 cm layer (S3c). Wustite has only three major diffraction peaks within the range of our measurements, all of which overlap with peaks of other phases in the sample, complicating definitive identification. The peak at 7.15 Å could be either due to birnessite or kaolinite, but other peaks belonging to these two possible minerals could not be resolved because of the complexity of the diffraction pattern. The identification of birnessite, kaolinite, and wustite, therefore, must remain tentative. Some peaks could not be identified due the complexity of the diffraction pattern, suggesting the presence of additional minerals. The bulk XRD patterns discussed above are complex and it is impossible to completely identify all mineral phases present. A number of peaks remain unidentified, particularly for the patterns of the intermediate layers.

83
10 20 30 40 50 60 70
0.739 nm
Ak
AkAk
Ak
Ak/Gt
Gt
Gt
GtGt
Gt/Q
GtGt Gt Gt
Gt Gt
Q
Q
Q
a
10 20 30 40 50 60 70
0.739 nm
Ak
AkAk
Ak
Ak/Gt
Gt
Gt
GtGt
Gt/Q
GtGt Gt Gt
Gt Gt
Q
Q
Q
a
10 20 30 40 50 60 70
Gy
Gy
Gy
Gy
Gy
GyGy
Gy
Ak
AkAk
Ak
AkAk
Gt
Gt GtGt
Co Kα 2θ/degrees
b
Q
10 20 30 40 50 60 70
Gy
Gy
Gy
Gy
Gy
GyGy
Gy
Ak
AkAk
Ak
AkAk
Gt
Gt GtGt
Co Kα 2θ/degrees
b
Q
Figure 46. Bulk Powder XRD Patterns of the Surface Horizon. (a) Sample S3a (0 -10 cm) Collected When the Soil Was Wet. (b) Sample S4a (0 -15 cm) Collected When the Soil Was Dry. Theoretical Patterns From the PDF Database are Represented by the Different Colored Vertical Lines Were Also Included for Reference. Major Peaks are Labeled With Mineral Names. Q = quartz, Gt = goethite, Gy = gypsum, and Ak = poorly crystalline akaganeite.

84
10 20 30 40 50 60 70
MM
H/M
M M
H/M
H
H
HH
H H
Q
Q
QQ Q
QM
Gt
Gt
Gy
a
10 20 30 40 50 60 70
MM
H/M
M M
H/M
H
H
HH
H H
Q
Q
QQ Q
QM
Gt
Gt
Gy
a
10 20 30 40 50 60 70
MM
H/M
MM
H/MH
H
HH
H H
Q
BQ
Gy Gt
Gt
Co Kα 2θ/degrees
W
W
b
W
10 20 30 40 50 60 70
MM
H/M
MM
H/MH
H
HH
H H
Q
BQ
Gy Gt
Gt
Co Kα 2θ/degrees
W
W
b
W
Figure 47. Bulk Powder XRD Patterns of the Subsurface Horizons From 10 - 30 cm Deep for Sample Collection S3. (a) The 10 – 20 cm Layer (S3b). (b) The 20 – 30 cm Layer (S3c). Theoretical Patterns from the PDF Database are Represented by the Different Colored Vertical Lines. B = birnessite, Gt = goethite, Gy = gypsum, H = hematite, M = magnetite, Q = quartz, and W = wustite.

85
10 20 30 40 50 60 70
Gt
Gt
H
H
H
H
H H
HH/M
H
Q
Q
RR
RR R R
WW
W
Ga
Ga
a
10 20 30 40 50 60 70
Gt
Gt
H
H
H
H
H H
HH/M
H
Q
Q
RR
RR R R
WW
W
Ga
Ga
10 20 30 40 50 60 70
Gt
Gt
H
H
H
H
H H
HH/M
H
Q
Q
RR
RR R R
WW
W
Ga
Ga
a
10 20 30 40 50 60 70
Q
Q
QQ Q
HH H/M
HH H/M
H
M
MM
R
R
Co Kα 2θ/degrees
b
10 20 30 40 50 60 70
Q
Q
QQ Q
HH H/M
HH H/M
H
M
MM
R
R
Co Kα 2θ/degrees
b
Figure 48. Bulk powder XRD Patterns of the Horizons From 30 - 65 cm Deep for Sample Collection S3. (a) The 30 – 50 cm Layer (S3d). (b) The 50 – 65 cm Layer (S3e). Theoretical Patterns From the PDF Database are Represented by the Different Colored Vertical Lines. Ga = galena, Gt = goethite, H = hematite, M = magnetite, Q = quartz, R = realgar, and W = wustite. The mineralogy of horizons that occurs > 30 cm below the surface is significantly different. In addition to the Fe oxide minerals identified in the upper horizons such as hematite, magnetite, goethite, and wustite, metal sulfides such as galena (PbS) and realgar (AsS) were uniquely identified (Figure 48). The detection limit for crystalline phases by bulk XRD analysis is about 3 to 5% by weight. Therefore, although these minerals are present as trace phases in the XRD patterns, the concentrations of Pb and As are extremely high compared to uncontaminated soils. The Pb content of the deepest layer S3e (50 – 65 cm) of S3 is 46,900 mg kg-1. If we assume all Pb is retained in solid phase galena, the maximum content of galena is ~5.4% by weight.

86
Synchrotron Micro-XRD and Micro-SXRF
In addition to the mineral phases already identified by bulk XRD, additional phases were found uniquely by synchrotron μ-XRD. A number of minerals occurred as almost pure phases in the sub-millimeter aggregates (Table 43). In some cases, the μ-XRF pattern collected simultaneously with the μ-XRD pattern provided the elemental information to support definitive phase identification by μ-XRD.
Figure 49. Micro XRD Patterns of Soil Aggregates From the Surface Layer (a) Pure Goethite (Gt), (c) Pure Akaganeite (Ak), and (e) a Mixture of Goethite (Gt) and Akaganeite (Ak). The SXRF Spectra of Soil Aggregates From the Surface Layer With Major Mineral Phases of (b) Goethite, (d) Akaganeite, and (f) a Mixture of Goethite and Akaganeite, Respectively.
Fe(III) oxides were found as the dominant species in the surface layers (S2a, S2b, S3a, and S4a). Pure goethite (Figure 49) and pure sulfate-incorporated akaganeite (Figure 49) were identified in this layer, but most frequently they occurred together in the same aggregates (Figure 50).
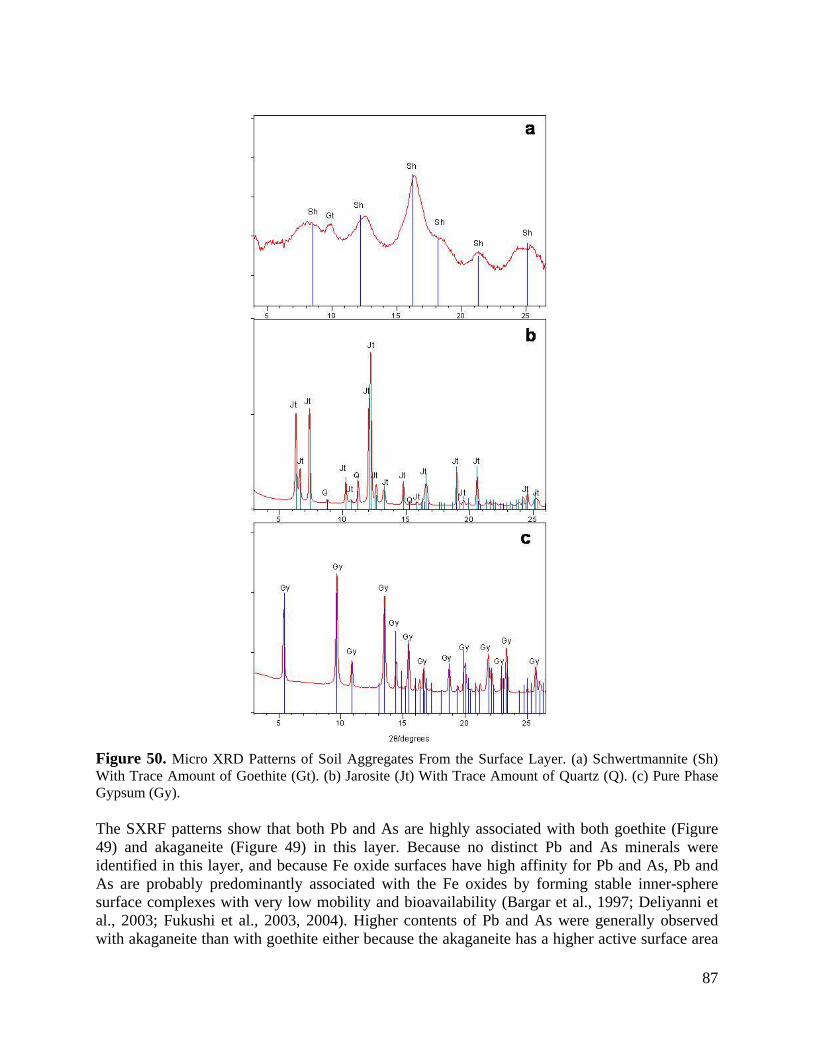
87
Figure 50. Micro XRD Patterns of Soil Aggregates From the Surface Layer. (a) Schwertmannite (Sh) With Trace Amount of Goethite (Gt). (b) Jarosite (Jt) With Trace Amount of Quartz (Q). (c) Pure Phase Gypsum (Gy). The SXRF patterns show that both Pb and As are highly associated with both goethite (Figure 49) and akaganeite (Figure 49) in this layer. Because no distinct Pb and As minerals were identified in this layer, and because Fe oxide surfaces have high affinity for Pb and As, Pb and As are probably predominantly associated with the Fe oxides by forming stable inner-sphere surface complexes with very low mobility and bioavailability (Bargar et al., 1997; Deliyanni et al., 2003; Fukushi et al., 2003, 2004). Higher contents of Pb and As were generally observed with akaganeite than with goethite either because the akaganeite has a higher active surface area

88
than goethite or because arsenate may incorporate into the akaganeite crystal structure more easily. Further investigation is needed to characterize the speciation of Pb and As in the surface layer. Table 43. Summary of Major Mineral Phases Identified at Different Depths by Synchrotron Micro X-ray Diffraction of the Samples.
Depth Mineral Name Chemical Formula PDF*
Reddish Brown Surface (0 – 10 cm)
goethite akaganeite schwertmannite jarosite gypsum
α-FeOOH β-FeOOH Fe8O8(OH)6SO4 KFe3(SO4)2(OH)6 CaSO4•2H2O
00-029-0713 00-042-1315 00-047-1475 00-036-0427 00-033-0311
Intermediate Layer (10 -30 cm)
magnetite hematite goethite gypsum wustite siderite sphalerite
Fe3O4 α-Fe2O3 α-FeOOH CaSO4•2H2O FeO FeCO3 (Zn, Fe2+)S
00-019-0629 00-033-0664 00-029-0713 00-021-0816 00-006-0615 01-080-0502 01-079-0043
Reduced Layer (30 – 65 cm)
magnetite hematite galena realgar alacranite sphealerite pyrrhotite mackinawite marcasite greigite pyrite mullite corundum
Fe3O4 α-Fe2O3 PbS AsS As4S4 (Zn, Fe2+)S Fe1-xS FeS FeS2 Fe3S4 FeS2 3Al2O3·2SiO2 Al2O3
00-019-0629 00-033-0664 00-005-0592 00-041-1494 01-088-1657 01-079-0043 00-029-0724 01-086-0389 00-037-0475 00-016-0713 00-042-1340 00-015-0776 00-046-1212
* - Powder diffraction file record number.
A number of sulfate-rich minerals were identified occasionally in the surface layer as almost pure mineral phases due to the extremely high concentration of sulfate at the site. They include schwertmannite [Fe8O8(OH)6SO4] (Figure 50), jarosite [KFe3(SO4)2(OH)2] (Figure 50), and gypsum (CaSO4•2H2O) (Figure 50). These minerals are particularly abundant in the samples collected during dry periods (S2 and S4). The identification of jarosite in some of the aggregates indicates that these sub-millimeter sites once reached very acidic conditions at some stage of the seasonal redox change cycle because jarosite forms at pH < 3 (Bigham et al., 1996). Schwertmannite, which is the most common Fe(III) precipitate at mining and smelter drainage sites, was identified in limited samples at this site, indicating that the Fe precipitation and transformation in soils is highly site-specific. The peak position, intensity and width of the schwertmannite diffraction pattern (Figure 50) are in good agreement with the theoretical pattern

89
from the PDF file. The trace amount of associated goethite with schwertmannite suggests that the final product of the transformation from schwertmannite is goethite. In contrast to the abundance of well crystalline materials in the surface layer, most aggregates from the intermediate layers (10 – 30 cm) have weak or very indistinct diffraction patterns. Although the Fe content decreased significantly in the intermediate layer as indicated by the quantitative XRF analysis, Fe is still the dominant element in SXRF patterns (Figure 51). The ratios of Fe to other metals, particularly Zn and Pb, are significantly lower, indicating deceasing Fe content and increasing Zn and Pb contents. The mineralogy of the intermediate layer is much complex than that of the surface horizons. No pure phases were identified in this layer. A mixture of various Fe minerals was identified as the major crystalline phases in μ-XRD patterns, including magnetite (Fe3O4), hematite (α-Fe2O3), trace amounts of goethite (α-FeOOH), and occasionally Fe(II) minerals, such as siderite (FeCO3) and possibly wustite (FeO) (Figure 51,Table 43). No distinct As or Pb mineral phases were identified. It is possible that we simply did not encounter aggregates with distinct As or Pb phases, that As and Pb might be absorbed by the hematite and magnetite surfaces by forming inner-sphere surface complexes, or that As and Pb occur in poorly crystalline phases that were not recognized. The presence of poorly crystalline phases is suggested by the much higher background in Figure 51 as compared to Figure 52b and Figure 52c, for example. Zinc sulfide sphalerite (ZnS) was identified frequently in the lower part of the intermediate layer (20 – 30 cm) as a very poorly crystalline phase with two broad diagnostic peaks in the XRD pattern (Figure 52a). The result was supported by its SXRF pattern in which Zn is the dominant element (Figure 52b). The poor crystallinity of sphalerite clearly indicates that it is a secondary precipitate from solution. Sphalerite was found in the intermediate layer because it is the first sulfide mineral in the redox potential sequence to precipitate from soil solution (Brennan and Lindsay, 1996). A number of sulfide minerals were identified in the reduced layer (30 – 65 cm) including realgar (AsS), galena (PbS), sphalerite [(Zn, Fe2+)S], alacranite (As4S4), and a series of Fe sulfides, greigite [(Fe2+Fe3+
2S4)], marcasite (FeS2), pyrrhotite (Fe1-xS), mackinawite (FeS), and pyrite (FeS2). Mullite (3Al2O3•2Si2O) and corundum (Al2O3) were occasionally identified in this layer as well (Table 43). Although thermodynamic models predict that reducing, acidic conditions with high concentration of reduced S favor precipitation of metal sulfides (Seyler and Martin, 1989), it has generally been believed that these sulfides form only under high temperature conditions in the earth’s crust (Smedley and Kinniburgh, 2002). A number of metal sulfides, however, have been reported to form in soils by secondary precipitation. Greigite (Fe3S4) was found in the deep horizon of a gley soil formed by bacterial activities (Stanjek, et al., 1994). Authigenic formation of orpiment (As2S3) by microbial precipitation has been reported in soils (Newman et al., 1998). Arsenopyrite (FeAsS) has also been reported to have been formed in sediments (Rittle et al., 1995).

90
5 10 15 20 25
B
Gt
Gt/MGt
H
H
H/M
HH
HH
MM
M
M
S
S
S
S
S
WW
S
Gt
Gt
2θ degrees
a
5 10 15 20 25
B
Gt
Gt/MGt
H
H
H/M
HH
HH
MM
M
M
S
S
S
S
S
WW
S
Gt
Gt
2θ degrees
5 10 15 20 25
B
Gt
Gt/MGt
H
H
H/M
HH
HH
MM
M
M
S
S
S
S
S
WW
S
Gt
Gt
2θ degrees
a
X-ray Energy (keV)
0 5 10 15 20
Log
Fluo
resc
ence
Cou
nts
0
1
2
3
4
5
6
Fe Kα
Fe Kβ
Zn Kα
Zn KβPb Lα /As Kα
Pb LβAs Kβ
X-ray Energy (keV)
0 5 10 15 20
Log
Fluo
resc
ence
Cou
nts
0
1
2
3
4
5
6
Fe Kα
Fe Kβ
Zn Kα
Zn KβPb Lα /As Kα
Pb LβAs Kβ
b
X-ray Energy (keV)
0 5 10 15 20
Log
Fluo
resc
ence
Cou
nts
0
1
2
3
4
5
6
Fe Kα
Fe Kβ
Zn Kα
Zn KβPb Lα /As Kα
Pb LβAs Kβ
X-ray Energy (keV)
0 5 10 15 20
Log
Fluo
resc
ence
Cou
nts
0
1
2
3
4
5
6
Fe Kα
Fe Kβ
Zn Kα
Zn KβPb Lα /As Kα
Pb LβAs Kβ
b
Figure 51. (a) Typical μ-XRD Pattern of a Soil Aggregate From the Intermediate Layer (10 -30 cm). Peaks Are Labeled With Mineral Names. Major Phases Identified Include: hematite (H), magnetite (M), siderite (S), wustite (W), goethite (Gt), and a possible phase birnessite. (b) The SXRF Spectra of a Soil Aggregate From the Subsurface With Various Fe Minerals as the Major Phases. Fe is the Dominant Element Associated With Extremely High Content of Zn and Significant Amount of Pb and As.
Galena (PbS) and realgar (AsS) in this soil may have two possible origins. They could simply be portions of the original sulfide ores used in the smelter operations that were somehow washed onto the surface of this soil and then somehow physically transported down into the profile. They also could be secondary precipitates from solutions, although no authigenic galena and realgar have been reported in soils so far. Based on the μ-XRD data and particle morphologies, we consider that these minerals to be secondary precipitates formed in soils. The

91
5 10 15 20 25
Sp
SpSp
2θ/degrees
a
5 10 15 20 25
Sp
SpSp
2θ/degrees
5 10 15 20 25
Sp
SpSp
2θ/degrees
a
X-ray Energy (KeV)
0 5 10 15 20
Log
Fluo
resc
ence
Cou
nts
0
1
2
3
4
5
6
Fe Kα
Fe Kβ
Zn Kα
Zn KβPb Lα /As Kα
As Kβ Pb Lβ
X-ray Energy (KeV)
0 5 10 15 20
Log
Fluo
resc
ence
Cou
nts
0
1
2
3
4
5
6
Fe Kα
Fe Kβ
Zn Kα
Zn KβPb Lα /As Kα
As Kβ Pb Lβ
b
X-ray Energy (KeV)
0 5 10 15 20
Log
Fluo
resc
ence
Cou
nts
0
1
2
3
4
5
6
Fe Kα
Fe Kβ
Zn Kα
Zn KβPb Lα /As Kα
As Kβ Pb Lβ
X-ray Energy (KeV)
0 5 10 15 20
Log
Fluo
resc
ence
Cou
nts
0
1
2
3
4
5
6
Fe Kα
Fe Kβ
Zn Kα
Zn KβPb Lα /As Kα
As Kβ Pb Lβ
b
Figure 52. (a) Micro XRD Pattern of a Soil Aggregate From the Deep Part Intermediate Layer (20 -30 cm). The dominant Phase Was the Poorly Crystalline Sphalerite With Broad Peaks (labeled with Sp). Other Phases Include Magnetite, Hematite, Goethite, and Possibly Birnessite. (b) SXRF Pattern of a Soil Aggregate From the Subsurface With Sphalerite (ZnS) as the Major Mineral Phase. Zn is the Dominant Element in the Pattern. Fe, Pb and As Are Also Present at High Levels. μ-XRD pattern of galena shows very smooth 2D diffraction rings (Figure 53a) indicative of crystals that are in the micrometer size range. On the other hand, crystals of galena from a primary lead ore are likely to be considerably larger and would produce very “spotty” and discontinuous diffraction rings. The smooth continuous rings are indicative of a very finely

92
divided solid, and such a precipitate is most likely to form from solution. The two broad humps in the pattern may belong to an amorphous phase that coprecipitated with galena, but the exact identification of this phase remains unknown. The SXRF pattern of this aggregate (Figure 53b) shows Pb is the dominated element.
Figure 53. (a) Micro-XRD Pattern of a Soil Aggregate From the Deep Reduced Layer. The Pattern Shows a Major Phase of Galena (Ga) With Very Smooth Diffraction Rings. The Smooth 2D Diffraction Ring Indicates it is a Secondary Precipitate. The Broad Humps May Belong to Some Amorphous Material. (b) The SXRF Pattern of a Soil Aggregate From the Reduced Layer With Galena as the Major Phase. Pb is the Dominant Element in This Aggregate.

93
Figure 54. (a) Micro-XRD Pattern of a Soil Aggregate From the Deep Reduced Layer. The Pattern Shows a Pure Phase of Realgar (R). The Inset Picture (area 1000 μm × 750 μm) is an Optical Microscopy Image of the Aggregate. (b) The SXRF Pattern of a Soil Aaggregate From the Reduced Layer With Realgar as the Aajor Phase. Arsenic is the Dominant Element in This Aggregate.
Realgar (Figure 54) was found exclusively in yellow-orange precipitates that appeared to have formed around plant residues, which is clear evidence for secondary precipitation of this mineral. The SXRF pattern (Figure 54b) of this aggregate shows that As is the dominant element. Both galena and realgar occurred as almost pure phases in some of the sub-millimeter aggregates. If our hypothesis that these sulfides are secondary precipitates is true, then these minerals will

94
control the solubilities of Pb and As under the reducing conditions of the deeper soil horizons and significantly attenuate Pb and As mobility and bioavailability as long as reducing conditions are maintained Data Interpretation The marsh site is near a stream and periodic flooding probably deposited inorganic sediment onto the marsh from time to time. As the organic materials accumulated, the frequency of the flood events most likely decreased. As a result the total Al and Si content is highest in the deepest horizons and decreases toward the surface. After the smelter was built on the site, the marsh began to receive runoff and seepage water from ore and spoil piles stored on the site. Sulfate, Fe, and various trace metals were then introduced onto the site with the runoff and seepage water, which was probably originally very acidic in order to transport the dissolved metals well into the marsh. Evidence for the transport of the contaminant metals as dissolved constituents is provided by the relative mineralogical purity of the surface horizon (0 – 10 cm, Figure 46). The surface material consists almost completely of goethite and akaganeite (plus gypsum during dry periods), all minerals that typically precipitate from acid mine drainage waters. The content of quartz, a mineral that is an indicator of sediment deposition, is very low. Because the water table is at or near the surface for much of the year and the soil consists predominately of organic soil material, an intense redox gradient exists with depth. Oxidized conditions exist from the surface to ~10 cm depth, intense reduced conditions exists at depths > ~30 cm, and intermediate redox conditions exist between 10 – 30 cm. The minerals identified in these zones are consistent with this redox gradient. Fluctuation in the water table results in dissolution – precipitation, oxidation – reduction, and adsorption – desorption reactions in the zone within which the fluctuation occurs, and this greatly impacts the speciation of Fe, S, Pb, As, Cr, and Cd.
The Speciation of Iron and Sulfur Both Fe and S contents are extremely high in this soil, and are far beyond the normal range of Indiana soils. Fe and S play a particularly important role in controlling metal biogeochemistry because they can directly affect the mobility and bioavailability of metals at this site. The geochemical cycles of Fe and S are closely coupled with metal speciation in both oxidizing and reducing environments (Dixit and Hering, 2003). The major source of Fe and S was probably from pyrite in the sulfide ores processed at this site. Sulfide ores are thermodynamically unstable under earth-surface conditions. Oxidation of sulfide minerals by atmospheric O2 releases SO4
2- and metals to the surrounding environment, and produces very acidic conditions. The oxidation of pyrite by atmospheric O2 can be expressed as:
+−+ ++→++ 2H2SOFeOHO27FeS 2
42
22(S)2 Eq. 0.1
Fe(II) produced by the weathering reaction can be transported and further oxidized to Fe(III) and precipitate as Fe(III) oxides. Under slightly acidic to near-neutral pH conditions, Fe(III) precipitates as goethite (α-FeOOH), which can be represented as:

95
++ +→++ 2HFeOOH-αOH23O
41Fe (S)22
2 Eq. 0.2
Under very low pH conditions (pH < 4), schwertmannite [Fe8O8(OH)6SO4] will precipitate (Jonsson et al., 2005):
+−+ +→+++ 14H)(SO(OH)OFeO10HSO4O8Fe (S)46882242
2 Eq. 0.3
The XRD results indicate that the oxidized surface layer (0 - ~10 cm) is dominated by various Fe(III) oxide minerals including goethite (α-FeOOH), akaganeite (β-FeOOH), and schwertmannite [Fe8O8(OH)6SO4]. As discussed above, the sulfate-incorporated akaganeite identified in this soil has much broader peaks and poorer crystallinity than akaganeite that has only chloride in its square tunnel structure. The poorly crystalline akaganeite or sulfate-incorporated akaganeite is metastable and will transform to the more thermodynamically stable Fe oxide, goethite, with time (Ford, 2002). Therefore we speculate that Fe first precipitates as sulfate-incorporated akaganeite due to the favorable pH conditions (~5.30) and the high content of sulfate and possibly chloride at the soil surface. It is then transformed to more thermodynamically stable goethite. The ratio of akaganeite to goethite varies from aggregate to aggregate. In some aggregates, goethite is the major phase with only a trace of akaganeite; in others, akaganeite may be the dominant phase, which indicates that the transformation is probably still in transition and has not achieved a steady state. The reducing conditions of the intermediate layer (10 – 30 cm) result in the reductive dissolution and transformation of the Fe(III) oxides, and this reductive dissolution has led to the depletion of Fe content in the intermediate layer. Magnetite (Fe3O4) was identified as one of the major phases. Authigenic magnetite could be the product of bioreduciton of Fe oxides under reducing conditions (Fredrickson et al., 1998). Siderite (FeCO3) is another major product of the transformation. Under extremely reducing conditions, siderite can control Fe solubility in soil solution (Brennan and Lindsay, 1996). Microbial degradation of organic matter and anaerobic respiration of plant roots facilitates the accumulation of high concentrations of carbonate in the subsurface layer (Burton et al., 2006). Microorganisms are capable of anaerobic growth using sulfate as electron acceptor under reducing conditions (Kirk et al., 2004), and this dissimilatory reduction process will reduce sulfate to sulfide and release carbonate to the soil solution, which provides carbonate for the formation of siderite. Under the strongly reducing conditions in the deepest layers (30 – 65 cm), a series of Fe sulfides were identified, including marcasite (FeS2), pyrrhotite (Fe1-xS), mackinawite (FeS), pyrite (FeS2), and greigite (Fe3S4). The reduction of sulfate to sulfide in the deepest layers produced the geochemical gradient for the precipitation and accumulation of Fe sulfide minerals in the reduced layer. Sulfur content was concentrated in the surface layer for samples collected during dry periods and in the reduced layer for samples collected during wet periods. This finding is consistent with the XRD results. During dry periods, the surface was under oxidizing conditions. Thus, sulfur was present as SO4
2- and precipitated as gypsum (CaSO4•2H2O), which was identified as one of the major mineral phases by XRD. During wet periods, the surface was flooded, gypsum was dissolved and resulted in the low content of S in the surface horizons, while in the deep horizons

96
with extremely reducing conditions, sulfur was reduced to S2-, and precipitated as various sulfides.
The Speciation of Trace Metals Chromium is a redox active element that generally occurs in either +3 or +6 oxidation states within soils. The two Cr oxidation states differ in both their geochemistry and effects on living organisms (Gonzalez et al., 2005). Cr(VI) occurs in the environment as the oxyanions HxCrO4
x-2, which exhibit high water solubility. In contrast, Cr(III) behaves like other trivalent cations in that it hydrolyzes and precipitates as insoluble oxides and hydroxides in soils (Fendorf and Zasoski, 1992; Marques et al., 2004; Lee and Hering, 2005). Chromium may enter the soil either as Cr(III) or as Cr(VI). The original drainage water from the smelter was probably very acidic and could carry significant amounts of Cr(III) into the soil. The dissolved Cr(III) could then precipitate as immobile Cr(III) species from solution when soil pH increased with time. Chromium is also possibly introduced into the soil as soluble Cr(VI) species. The quantitative XRF and Cr-XANES analyses indicate that Cr is highly concentrated in the intermediate layer (10 – 30 cm) as immobile Cr(III) species. If Cr was originally present as Cr(VI), we speculate that it was effectively reduced to Cr(III) by Fe(II) ions and Fe(II)-containing minerals such as magnetite, siderite, and wustite in the subsurface. The reduction from Cr(VI) to Cr(III) effectively immobilizes and retains Cr as sorbed surface complexes by Fe oxides or precipitates it as insoluble mineral phases, such as Cr(OH)3 or Cr1-xFex(OH)3, although no such phases were identified. Under oxidized surface conditions, arsenic and lead were highly associated with Fe oxides by forming stable inner-sphere surface complexes as indicated by SXRF spectra. Under highly reducing conditions with the high content of sulfur in this soil, As and Pb were predominantly retained in the solid phase as realgar (AsS) and galena (PbS). The identification of these metal sulfides in the soil is significant from the standpoint of immobilizing contaminant metals. Metal sulfides are stable under reducing conditions and the bioavailability of the metals may be greatly reduced by the formation of these sulfides. Therefore high-Pb and high-As activities should not be expected in either the oxidized surface horizons or the deepest, highly reduced horizons at this site.
Evidence for a Burning Event The presence in the subsurface horizons of this soil of oxide minerals that require temperatures > ~700° C for formation is inconsistent with the presence of other hydroxyl-rich phases that precipitated from solution. Mullite (3Al2O3•2Si2O), corundum (α-Al2O3), and wustite (FeO) are the most obvious high-temperature phases. Hematite (α-Fe2O3) and magnetite (Fe3O4) can form at high temperatures as well, but they also form at ambient soil temperatures. Mullite and corundum were occasionally identified in the deep layer (30 – 65 cm). There are two possibilities for the presence of these high-temperature minerals. One possibility is that they may simply be products emitted from the chimney of the smelter and deposited by wind onto the surface of the soil. This mechanism, however, would require transport of the minerals to the subsurface horizons. Another possibility is that they may have formed in place when the organic soil material burned. One fire at some time during the soil’s history could account for the in-situ

97
formation of mullite and corundum by dehydroxylation of aluminosilicate minerals, and once formed, these minerals would probably remain stable for long periods of time. The Fe(II)-containing mineral wustite (FeO) is considered as a high temperature mineral and is unstable upon exposure to ambient conditions (Cornell and Schwertmann, 2003). The reduction of hematite to wustite requires temperatures of 700 – 900o C. (Piotrowski et al., 2007). Wustite has never been reported in soils, but its presence in the subsurface of this soil along with mullite and corundum is consistent with a burning event at the site. Although hematite can form in soils via an internal rearrangement and dehydration within ferrihydrite aggregates rather than by precipitation from solution (Murad and Schwertmann, 1986), this process requires dry, warm, and oxidizing conditions that contrast greatly with the saturated, cool soil conditions at this site. Hematite, therefore, would not be expected to form under the ambient conditions of this site. A burning event, however, could easily result in hematite forming by the dehydroxylation of goethite, schwertmannite, or akaganeite. Although magnetite could form under the soil conditions by bioreduciton process, it can also form during a burning event as well.
Implication for In Situ Remediation This site is a wetland that has the capacity to sequester large quantities of metal contaminants. Due to the large amounts of Fe and S present at this site, metal speciation is closely coupled with the geochemical cycles of Fe and S under both oxidizing and reducing conditions. Results from this study indicate that the seasonal change of the water table greatly affects the speciation of Fe, S, and associated metals. Thus, greenhouse studies based on the mixed soil samples that were collected from 0 – 50 cm may not accurately reflect the real field conditions of the contaminated site. The pH decreased from 5.9 to 3.7 and the Eh increased from -29 mV to 160 mV when the soil dried in the laboratory. Artificial changes of the soil conditions will dramatically change the speciation, bioavailability, and toxicity of metals. Therefore, simply mixed and air-dried the soil samples from 0 – 50 cm may not be the best sampling approach for greenhouse and laboratory studies. To optimize the sampling, samples should be collected with depth increments that are consistent with the redox potential and then kept under conditions that are as close to original conditions as possible. For example, samples from the oxidized surface horizons can be kept in ambient conditions, but samples from the subsurface horizons should be kept under water saturated conditions to avoid the oxidation of reduced phases. Chemical stabilization is a promising in-situ remediation technology that can be cost effective and non-destructive for soil metal contamination. The properties of the soil will greatly influence the efficiency of the chemical amendments that are added. The site has an intense redox gradient with depth that varies with the fluctuation of the water table during the year. This seasonal change of redox potential may have significant impacts on the mineralogy and speciation of metals. Therefore, the laboratory determined best chemical amendments for the stabilization of metals based on the mixed soil samples may not reflect the real field situations. In-situ stabilization of a site like this should focus on the surface horizons (< 10 cm depth) because material at the surface is most likely to be ingested by animals and humans. Mixing of the soil should be minimized because mixing brings sulfides to the surface, which will then oxidized and release metals into solution.

98
Within a broader context, results from this research show that in-situ remediation treatments need to be very carefully considered before being deployed at field sites. A thorough understanding of the geochemistry and mineralogy of metals is essential in the evaluation of remediation treatments and the assessments of risks from contaminated soils.
Mineralogy of the Natural Surface Precipitates The mineral identification was first performed by bulk powder x-ray diffraction. A mixture of three mineral components was identified in the bulk XRD pattern, including quartz (SiO2), goethite (α-FeOOH), and a poorly crystalline mineral phase (Figure 55). Ferrihydrite and
10 20 30 40 50 60 70
Ak
AkAk
Ak
Ak/Gt
Gt
Gt
GtGt
Gt/Q
GtGt Gt Gt
Gt Gt
Q
Q
Q
Co Kα 2θ/degrees
10 20 30 40 50 60 70
Ak
AkAk
Ak
Ak/Gt
Gt
Gt
GtGt
Gt/Q
GtGt Gt Gt
Gt Gt
Q
Q
Q
Co Kα 2θ/degrees Figure 55. Bulk Powder XRD Pattern of the Natural Precipitates. Theoretical Patterns From the PDF Database Represented by the Different Colored Vertical Lines Were Also Included for Reference. Major Peaks Are Labeled With Mineral Names. Q = quartz, Gt = goethite, and Ak = poorly crystalline akaganeite.
schwertmannite are two common, poorly crystalline Fe(III) oxides that are frequently observed in acidic, sulfate-rich soils (Yu et al., 1999). Thus, we initially suspected that the poorly crystalline phase could be one of these two minerals. Both schwertmannite and ferrihydrite have been occasionally identified under pH conditions similar to that of this soil (Carlson et al., 2002). Neither ferrihydrite nor schwertmannite, however, matches the poorly crystalline phase, and the mineralogical complexity of the natural sample makes definitive identification difficult. Further investigation was conducted with synchrotron μ-XRD. About 80 individual μ-XRD patterns were obtained from the aggregates of the natural samples. The poorly crystalline phase was successfully identified as a pure phase by μ-XRD. Phase identification with PANalytical X’Pert PRO Highscore Plus clearly indicates that this mineral is akaganeite (β-FeOOH), which is very rare in natural soils. The peak positions of the mineral are in good agreement with the PDF pattern 00-042-1315 for akaganeite (Figure 56a), but the peaks are significantly broadened and

99
the relative intensities of several major peaks are noticeably different compared to the synthetic akaganeite diffraction pattern (not shown). In the synthetic akaganeite diffraction pattern, the (110) and (310) peaks at 0.739 nm and 0.331 nm are the two strongest peaks. Both peaks are reduced significantly in intensity relative to the (211) peak at 0.254 nm in the diffraction pattern of the natural soil samples, particularly the (110) peak. All peaks are significantly broadened, indicating much poorer crystallinity compared to the synthetic akaganeite. The SEM micrograph of akaganeite shows spherical particles that are cemented together forming large aggregates (Figure 56b), which is distinctly different from the typical somatoid
Figure 56. (a) Micro XRD Pattern of a Soil Aggregate From the Natural Precipitate. The Theoretical Pattern (PDF: 00-042-1315) is Represented by the Vertical Lines. (b) SEM.

100
morphology of the synthetic akaganeite. This spherical morphology is similar to the typical spherical pin-cushion morphology of schwertmannite particles. In addition to akaganeite, goethite is another major mineral phase identified. The μ-XRD patterns of goethite show a range of crystallinities. The peak positions and intensities of well-crystallized goethite match perfectly with the PDF pattern 00-029-0713 (Figure 57a), indicating a pure goethite with little or no foreign substitution. There are some mismatches in the peak intensities in poorly-crystallized goethite diffraction pattern (Figure 57b), especially at the position around 0.255 nm (16.30° 2θ) where sulfate-incorporated akaganeite has its strongest diffraction line. No typical needle-shape goethite morphology was observed in the SEM micrograph of the soil goethite (Figure 57c). The goethite occurred as rough, spherical particles about 0.5 μm across, which is similar to the morphology of the sulfate-incorporated akaganeite discussed above.
Gt
Gt
Gt
Gt
Gt
Gt
Gt Gt
GtGt
Gt
Gt
GtGt
Gt
a
Gt
Gt
Gt
Gt
Gt
Gt
Gt Gt
GtGt
Gt
Gt
GtGt
Gt
Gt
Gt
Gt
Gt
Gt
Gt
Gt Gt
GtGt
Gt
Gt
GtGt
Gt
a
Figure 57. (a) Micro-XRD Pattern of a Soil Aggregate That Contains Well-Crystallized Goethite. Gt = goethite. (b) Micro-XRD Pattern of a Soil Aggregate That Contains Poorly-Crystallized Goethite. (c) SEM Micrograph of a Soil Aggregate with Well-Crystallized Goethite as the Major Mineral Phase.

101
5 10 15 20 25
Gt Gt
GtGt
Gt
Gt
Gt
Gt
Gt
2θ/degrees
b
5 10 15 20 25
Gt Gt
GtGt
Gt
Gt
Gt
Gt
Gt
2θ/degrees
b
Figure 58. (con’t) (a) Micro-XRD Pattern of a Soil Aggregate That Contains Well-Crystallized Goethite. Gt = goethite. (b) Micro-XRD Pattern of a Soil Aggregate That Contains Poorly-Crystallized Goethite. (c) SEM Micrograph of a Soil Aggregate with Well-Crystallized Goethite as the Major Mineral Phase.
c

102
Figure 59. (a) Micro XRD Pattern of a Soil Aggregate From the Natural Precipitates. The Theoretical Patterns Are Represented by Different Colored Vertical Lines. Jt = jarosite, Q = quartz. (b) SEM Micrograph of the Same Aggregate. Schwertmannite and jarosite occasionally were identified as pure mineral phases at this site. These minerals are particularly abundant in the soil samples from dry periods. This observation is consistent with the pH-mineral relationship. During dry periods, the redox potential increases in this soil and results in the oxidation of mineral phases in the subsurface horizons. The oxidation process releases protons to the soil solution and produces acidic conditions (Eq. 4-1). The hydrolysis of Fe(III) will further decrease the pH. Thus, the low pH conditions generated

103
through the oxidation of sulfides and the hydrolysis of Fe(III) favor the precipitation of schwertmannite and jarosite at this site during dry periods. The identification of jarosite (Figure 58a) indicates that this site once reached very acidic conditions at some stage of the seasonal redox change cycle because jarosite forms at pH < 2.5 (Bigham et al., 1996). The surface morphology of jarosite is distinctly different from other secondary Fe(III) minerals identified at this site (Figure 58b). The bipyramidal crystals are similar in size and morphology to the jarosite crystals described by Jones and Renaut (2007) in Fe-rich precipitates from acid hot springs. Schwertmannite, which is the most common Fe(III) precipitate at mining and smelter drainage sites, was identified in limited samples at this site, indicating that the Fe precipitation and transformation in soils is highly site-specific. The peak positions, intensities, and widths of the schwertmannite μ-XRD pattern are in good agreement with the theoretical diffraction pattern (PDF: 00-047-1775) for schwertmannite (Figure 59a). Trace amounts of goethite were present as indicated by a weak peak at d = 0.418 nm. The SEM micrograph of soil schwertmannite shows the typical pin-cushion morphology, almost perfectly spherical, hedge-hog-like crystal aggregates about 2 μm across (Figure 59b). The small spherical particles seem to be cemented together, forming larger aggregates. Schwertmannite precipitation is believed to be directly linked to the bacterially catalyzed oxidation of Fe2+ (Kawano and Tomita, 2001), but no bacterial cells were observed in the SEM micrographs. The lack of visible cells does not necessarily indicate an absence of microbial influence. The bacterial cells may be encased inside the schwertmannite particles (Schroth and Parnell, 2005). The extremely low temperature produced by liquid N2 during the sampling processes may play a role in the absence of bacterial cells as well. Mixtures of schwertmannite and jarosite were also identified in this soil, indicating that low pH conditions favor the precipitation of these two minerals (Figure 60). Data Interpretation Precipitation of Akaganeite
Akaganeite often has been observed as a corrosion product of Fe in chloride-containing marine environments. The precipitation of akaganeite under soil conditions is documented here for the first time. We propose that two main reasons probably have led to the precipitation of akaganeite as one of the major secondary Fe(III) minerals at this site: First, the unique pH conditions of this soil may play a key role in the precipitation of akaganeite. The soil pH is considered as the most important factor in determining what Fe(III) minerals precipitate (Bigham et al., 1990, 1996; Yu et al., 1999; Carlson et al., 2002). The pH ~5.30 of the surface soil at this site is higher than the most favorable pH conditions for the precipitation of schwertmannite (pH 3 to 4) but is slightly lower than the pH conditions for the formation of ferrihydrite (near-neutral pH) (Jonsson et al., 2005). Therefore, the pH of this soil neither favors schwertmannite, nor favors ferrihydrite to precipitate for solution, whereas akaganeite has been successfully synthesized in the laboratory over the pH range from 1.5 to 8.0 (Cai et al., 2001; Bakoyannakis et al., 2003; Deliyanni et al., 2003). The stability of akaganeite at this pH range makes it possible to precipitate under the pH conditions of this soil.

104
Second, the presence of chloride in solution is essential for the formation of akaganeite. Well-crystallized synthetic akaganeite usually contains 3 to 9% chloride (Murad, 1979). However, the crystal structure of akaganeite is not sensitive to the content of chloride (Ishikawa and Inouye, 1975). Bigham et al. (1990) demonstrated that by reducing the chloride content to as low as 0.6%, the diffraction pattern still has most of the major peaks of akaganeite. The reason for this is that probably OH- and other anions may incorporate into the tunnels and stabilize the crystal structure when Cl- is removed. Therefore, although the presence of chloride is critical for the precipitation of akaganeite, the concentration required is much lower than the high concentration of sulfate required to form schwertmannite. Although chloride content was not measured, it is reasonable to assume that small amounts of chloride are present in such acidic, sulfate-rich mine drainage soils.

105
Figure 60. (a) Micro XRD Pattern of a Soil Aggregate From the Natural Precipitates. Sh = schwertmannite, Gt = goethite. (b) SEM Micrograph For a Soil Aggregate With Schwertmannite as the Major Mineral Phase. Several factors resulted in the broad peaks and relative intensity changes in the akaganeite diffraction pattern. Akaganeite crystal structure is sensitive to the pH of the initial synthesis solution. Low pH favors the nucleation and growth of akaganeite crystals, while increasing pH will result in the broad peaks and poor crystallinity (Cai, et al., 2001). Incorporation of sulfate into the structure of akaganeite also will partially destroy the crystallinity of the structure and lead to broad diffraction peaks due to the size restrictions of the structure (Bigham et al., 1990; Deliyanni et al., 2003). The SO4
2- ion (radius = 0.23 nm) is larger than Cl- ion (radius = 0.18 nm). Incorporation of sulfate into the tunnels of akaganeite will distort the akaganeite structure, lower the symmetry, reduce the crystal growth, and partly change the unit cell parameters (Jonsson et al., 2005). Bigham et al. (1990) reported that addition of sulfate to the initial hydrolysis solution for akaganeite synthesis broadened all peaks and reduced intensities of the (110) and (310) peaks. At extremely high concentration of sulfate (11.6%), the (110) peak was completely suppressed. Other anions having larger size than Cl-, such as arsenate (radius = 0.248 nm) and chromate (radius = 0.24 nm) which are present at high concentration in this soil, should have similar distortion effects as sulfate and will further destroy the crystallinity of akaganeite.
5 10 15 20 25
ShSh
Sh
Sh/JtSh Sh
JtJt
2θ/degrees5 10 15 20 25
ShSh
Sh
Sh/JtSh Sh
JtJt
2θ/degrees
ShSh
Sh
Sh/JtSh Sh
JtJt
2θ/degrees Figure 61. Micro XRD Pattern of a Soil Aggregate From the Natural Precipitates. Sh = schwertmannite, Jt = jarosite.
It appears that large quantities of sulfate incorporated into the structure of akaganeite had significant impacts on both its crystal structure and morphology. With sulfate incorporation to akaganeite, the (211) peak at 0.254 nm (Figure 56a) became the strongest peak in the diffraction pattern, while the (212) peak of schwertmannite at the same position is also the strongest peak in its diffraction. It seems that with the incorporation of sulfate into the structure the morphology of akaganeite also changed from somatoids to spherical particles which are similar to the schwertmannite morphology. Therefore, this mineral phase identified in this soil is like an

106
intermediate phase between akaganeite and schwertmannite. Sulfate-incorporated akaganeite is probably the best name for this poorly crystalline phase. Transformation of the Secondary Fe(III) Oxides The poorly crystalline phase sulfate-incorporated akaganeite and schwertmannite are metastable with respect to goethite and will transform to goethite with time. Thus, we speculate that the goethite in the precipitates is not the product of direct precipitation from the solution but the transformation of previously precipitated akaganeite or schwertmannite. The occurrence of mixtures of goethite and akaganeite is clear evidence for the transformation. The stack of the micro x-ray diffraction patterns (Figure 61) gives us a hint of the transformation processes. Fe(III) first precipitated as sulfate-incorporated akaganeite or schwertmannite depending on soil pH and anion concentrations. It then transformed to poorly-crystallized goethite. The crystals of the poorly-crystallized goethite grew with time and finally formed well-crystallized goethite. The occurrence of mixtures of two phases indicates that the transformation is probably still in transition and has not achieved a steady state. Although goethite could coprecipitate with other poorly crystalline Fe minerals when the sulfate concentration is low (Bradley et al., 1986), with the extremely high contents of sulfate at this site the coprecipitation of goethite and akaganeite should be very rare.
5 10 15 20 25
2θ/degree
Schwertmannite
Schwertmannite
Akaganeite
Akaganeite/goethite
Akaganeite/goethite
Akaganeite/goethite
Goethite
Major Phases:
5 10 15 20 25
2θ/degree
Schwertmannite
Schwertmannite
Akaganeite
Akaganeite/goethite
Akaganeite/goethite
Akaganeite/goethite
Goethite
Major Phases:
Figure 62. Micro XRD Patterns of Soil Aggregates From the Natural Precipitates With Schwertmannite, Akaganeite, and Goethite as the Major Mineral Phases.
The SEM micrographs provide additional direct evidence for the transformation from akaganeite to goethite. The goethite has rough, spherical particle morphology (Figure 58b), which is similar to the morphology of akaganeite. Such goethite pseudomorphs have been observed previously in acidic sulfate soils (Sullivan and Bush, 2004; Burton et al., 2006) and strongly support the hypothesis that goethite is the transformed product from precursor akaganeite.

107
The transformation from poorly crystalline akaganeite to more ordered crystalline goethite is generally believed to result in a decrease in surface area and release of adsorbed trace metals to solution. From the synchrotron micro x-ray fluorescence (SXRF) spectra of goethite (Figure 62a) and akaganeite (Figure 62b), both types of minerals contained high content of arsenic and lead. No apparent differences were observed between the two spectra, indicating that trace metals are somehow retained in the solid phase when akaganeite transformed to goethite. This finding probably could be explained by the site-specific transformation mechanisms. By examining the SEM micrographs of goethite and akaganeite, they have similar spherical particle morphologies with the same size, indicating that this transformation process is in-situ and the original morphology of akaganeite was almost completely kept. Thus the goethite should have a similar surface area as akaganeite and most of the trace metals are retained during the transformation process.
0 5 10 15 20
Log
Fluo
resc
ence
Cou
nts
0
2
4
6Fe Kα
Fe Kβ
Pb Lα /As KαPb Lβ
As Kβ
0 5 10 15 20
Log
Fluo
resc
ence
Cou
nts
0
2
4
6Fe Kα
Fe Kβ
Pb Lα /As KαPb Lβ
As Kβ
a
0 5 10 15 20
Log
Fluo
resc
ence
Cou
nts
0
2
4
6Fe Kα
Fe Kβ
Pb Lα /As KαPb Lβ
As Kβ
0 5 10 15 20
Log
Fluo
resc
ence
Cou
nts
0
2
4
6Fe Kα
Fe Kβ
Pb Lα /As KαPb Lβ
As Kβ
a
X-ray Energy (KeV)
0 5 10 15 20
Log
Fluo
resc
ence
Cou
nts
0
2
4
6Fe Kα
Fe Kβ
Pb Lα /As Kα Pb Lβ
As Kβ
X-ray Energy (KeV)
0 5 10 15 20
Log
Fluo
resc
ence
Cou
nts
0
2
4
6Fe Kα
Fe Kβ
Pb Lα /As Kα Pb Lβ
As Kβ
Fe Kα
Fe Kβ
Pb Lα /As Kα Pb Lβ
As Kβ
b
X-ray Energy (KeV)
0 5 10 15 20
Log
Fluo
resc
ence
Cou
nts
0
2
4
6Fe Kα
Fe Kβ
Pb Lα /As Kα Pb Lβ
As Kβ
X-ray Energy (KeV)
0 5 10 15 20
Log
Fluo
resc
ence
Cou
nts
0
2
4
6Fe Kα
Fe Kβ
Pb Lα /As Kα Pb Lβ
As Kβ
Fe Kα
Fe Kβ
Pb Lα /As Kα Pb Lβ
As Kβ
b
Figure 63. (a) The SXRF Spectrum of a Soil Aggregate From the Surface Precipitates With Goethite as the Major Mineral Phase (μ-XRD pattern of the same aggregate in Figure 49a). (b) The SXRF Spectrum

108
of a Soil Aggregate From the Surface Precipitates With Akaganeite as the Major Mineral Phase (Figure 56). Metal Speciation: Arsenic Micro-XANES Analysis The oxidation state of arsenic plays an important role in its mobility and bioavailability. In XANES spectra, a shift of the absorption edge energy positions is used to determine the differences in oxidation states (Szulczewski et al., 1997). The XANES spectra of the As reference compounds provide the adsorption edge energy positions for different As oxidation states (Figure 63). The adsorption edge positions for oxidation state +2, +3, and +5 are in good agreement with previous studies (Arai et al., 2003; 2006). The As absorption edge energy occurs at ~11874 eV for As(V) in NaH2AsO4, at ~11870 eV for As(III) in As2O3, and at ~11868 eV for As(II) in AsS (Figure 63). Based on the absorption edge positions of the standards, the As oxidation state of unknown samples could be assigned. It should be pointed out that As(II) is usually not considered as a common oxidation state of As in natural environments. However, we clearly observed a significant change in the As XANES spectra when As is associated with sulfide. The As adsorption edge in AsS is decreased by ~2.0 eV relative to As(III) in arsenic oxide (As2O3). Based on the position of adsorption edge and its chemical formula, we prefer to assign +2 as the formal oxidation state of As in arsenic sulfide (AsS). Arsenic and sulfur in the AsS structure are strongly covalent. The AsS structure has discrete (As4 – S4) molecular cage-like units with linked As - As and S - S dimers, which are connected by van der Waals forces (O'Day, 2006). The assignment of formal oxidation states to arsenic is not very meaning from a chemical standpoint because the bonding overall is essentially covalent.

109
Energy (eV)
11840 11860 11880 11900 11920 11940 11960 11980
Nor
mal
ized
Inte
rsity
0
1
2
3
4
5
As(II)
As(III)
As(V)
AsS std
As2O3 std
NaH2AsO4 std
Energy (eV)
11840 11860 11880 11900 11920 11940 11960 11980
Nor
mal
ized
Inte
rsity
0
1
2
3
4
5
As(II)
As(III)
As(V)
AsS std
As2O3 std
NaH2AsO4 stdAs(II)
As(III)
As(V)
AsS std
As2O3 std
NaH2AsO4 std
Figure 64. Arsenic XANES Spectra of Three Arsenic Reference Compounds. The Three Vertical Dotted Lines Indicate the Absorption Edge Energy Positions of the Oxidation States of +2, +3, and +5, Respectively. Arsenic K-edge XANES spectra of 4 aggregates from the surface horizon (0 – ~10 cm) are shown in Figure 64. The absorption edge energy position at ~11874 eV indicates that As(V) is the predominant oxidation state in this horizon. The results from the μ-XRD and μ-SXRF indicate that goethite (α-FeOOH) and akaganeite (β-FeOOH) are the predominant solid phases associated with the high contents of As. Although both arsenate and arsenite have strong affinity for Fe oxide surfaces, their affinities are strongly pH dependent (Bednar et al., 2005). Under the surface conditions of this contaminated site (pH = ~5.3), based on the solution chemistry of As, arsenate occurs predominately as the negatively charged H2AsO4
- species, while arsenite is present predominately as an uncharged species H3AsO3
0. Because the pH of the soil surface is below the point zero charge (PZC) of the Fe oxides (pH = ~7.0), the surfaces of these minerals are positively charged and have higher affinity for the negative charged arsenate species (H2AsO4
-) and lower affinity for the uncharged arsenite species (H3AsO30). Thus, in this oxidized
surface horizons, although a small amount of As(III) may be present because of the low transformation rate between the two oxidation states, As(V) should be the predominant species. Because arsenate adsorbs strongly to Fe oxides by forming stable inner-sphere surface complexes (Bowell, 1994; Fendorf et al., 1997; Goldberg and Johnston, 2001), we postulate that As mobility is very low in the surface horizon as long as it remains oxidized.

110
Energy (eV)
11840 11860 11880 11900 11920 11940 11960 11980
Nor
mol
ized
Inte
nsity
0
1
2
3
4
5
6
AsXANES.012
AsXANES.013
AsXANES.069
AsXANES.070
As(V)
Energy (eV)
11840 11860 11880 11900 11920 11940 11960 11980
Nor
mol
ized
Inte
nsity
0
1
2
3
4
5
6
AsXANES.012
AsXANES.013
AsXANES.069
AsXANES.070
As(V)
Figure 65. Arsenic XANES Spectra of 4 Typical Aggregates From the Surface Layer (0 – 10 cm) Where Goethite and Akaganeite Are the Dominant Mineral Phases. The Vertical Dotted Line at ~11874 eV Indicates That As(V) Species Are Predominant. Arsenic K-edge XANES spectra of the samples from the intermediate layer (10 to 30 cm) are presented in Figure 65. They are clearly different from the XANES spectra of the samples from the surface layer. The shoulders of the broad peaks in the spectra indicate the presence of multiple oxidation states. The two vertical dotted lines represent the absorption edge positions of As(V) at ~11874 eV and As(III) at ~11870 eV. A mixture of As(V) and As(III) oxidation states is clearly present, while no significant contribution from the As(II) associated with sulfides is observed. The results from the XRD analyses indicate that the major mineral phases in the intermediate layer are Fe(II)-containing minerals such as magnetite (Fe3O4), siderite (FeCO3), and wustite (FeO). An analysis of the data with linear combination fits in the XANES region for a soil aggregate from the intermediate layer with siderite, hematite, and magnetite as the major phases indicates that ~68% of the total As is As(III), while about 32% of the total As is As(V) (Figure 66), indicating that As(V) is subordinated to As(III). We speculate that two main reasons may result in the significant amounts of As(III) present: (i) the reducing conditions in the subsurface layer transformed a considerable amount of As(V) to As(III); (ii) the increasing pH with depth favors the adsorption of As(III) by Fe minerals (Dixit and Hering, 2003).

111
X-ray Energy (eV)
11840 11860 11880 11900 11920 11940 11960 11980
Nor
mal
ized
Inte
nsity
0
1
2
3
4
5
AsXANES.054
AsXANES.057
AsXANES.058
As(III) As(V)
X-ray Energy (eV)
11840 11860 11880 11900 11920 11940 11960 11980
Nor
mal
ized
Inte
nsity
0
1
2
3
4
5
AsXANES.054
AsXANES.057
AsXANES.058
As(III) As(V)
AsXANES.054
AsXANES.057
AsXANES.058
As(III) As(V)
Figure 66. Arsenic XANES Spectra of 3 Typical Aggregates From the Intermediate Layer (10 – 30 cm). The Vertical Dotted Lines at ~11874 eV and ~11870 eV Indicate That This Layer Contains a Mixed Oxidation States of As(V) and As(III). The results from the arsenic XANES spectra and XRD indicate that the reducing conditions in the intermediate layer have led to both reductive dissolution of Fe(III) oxides to Fe(II) and reduction of As(V) to As(III). The reductive dissolution of Fe oxides due to the onset of reducing conditions in the subsurface was reported to be one the major mechanisms for As mobilization in soils (Moore et al., 1988; Cummings et al., 1999; Meng et al., 2001; Bose and Sharma, 2002). Therefore, under the intermediate redox conditions of the subsurface layer, a substantial amount of As is likely to be mobile compared to the oxidized surface layer.

112
Figure 67. Linear Combination Fit of Arsenic XANES Spectrum of an Aggregate From the Intermediate Layer With Magnetite, Siderite, and Hematite as the Major Mineral Phases.
Energy (eV)
11840 11860 11880 11900 11920 11940 11960 11980
Nor
mal
ized
Inte
nsity
0
1
2
3
4
5
AsXANES.008
AsXANES.009
AsXANES.010
AsXANES.011
As(II)
Energy (eV)
11840 11860 11880 11900 11920 11940 11960 11980
Nor
mal
ized
Inte
nsity
0
1
2
3
4
5
AsXANES.008
AsXANES.009
AsXANES.010
AsXANES.011
As(II)
Figure 68. Arsenic XANES Spectra of 4 Aggregates From the Most Reduced Layer Where Realgar is the Dominant Mineral Phase. The Vertical Dotted Line at ~11868 eV Indicates That As(II) is Predominant Oxidation State in This Layer.
Arsenic K-edge XANES spectra of soil aggregates from the most reduced layer (30 – 65 cm) are shown in Figure 67. Compared to the XANES spectra of the surface and intermediate layer, the adsorption edge energy further decreased to ~11868 eV, indicating that As(II) associated with

113
sulfides is the predominant oxidation state. The result is consistent with the presence of realgar (AsS) as shown by μ-XRD in this layer. Because of the extremely high content of As, self adsorption effects became a serious problem for some soil aggregates with realgar as the major mineral phase. Since As is mainly retained in the solid phase of realgar (AsS), high As mobility should not be expected in this layer as long as it remains highly reduced.
Arsenic Micro-EXAFS Analysis Because As is highly adsorbed onto goethite and akaganeite in the surface layer (0 - ~10 cm), arsenic K-edge EXAFS spectra were collected for soil aggregates from the surface layer to investigate the adsorption mechanism. The κ3-weighted EXAFS spectra for both As-adsorbed goethite and As-adsorbed akaganeite are shown in Figure 68. These spectra are sinusoidal waves representing constructive and destructive interference between the propagated and the reflected waves caused by the scattered electrons between the absorber and the neighboring atoms (Paktunc et al., 2003). No apparent differences were observed between the two spectra. The As(V)-O distance (1.69 Å) was successfully fit in the first shell, and the fit results are in good agreement with other studies (Farquhar et al., 2002; Arai et al., 2006). The bond length and coordination number 4 indicate the predominant presence of AsO4
3- in these samples. The nonlinear least-squares fits with the second shell were not very successful because of the poor quality of the spectra and the lack of appropriate standards.
Chromium Micro-XANES Analysis Chromium occurs mainly as species in the oxidation states of Cr(III) and Cr(VI) in natural environments, and the oxidation state plays an important role in its mobility, bioavailability, and toxicity. XANES spectra of 4 Cr reference compounds containing pure and mixed Cr oxidation states are shown in Figure 69. The intensity of the pre-edge peak in the XANES spectra of the standards is linearly proportional to the mole fraction of of Cr(VI), and can be used to determine the proportion of Cr(VI) in the soil samples (Bajt et al., 1993). Figure 70 shows the Cr XANES spectra for aggregates from different depths. No distinct pre-edge peak of Cr(VI) was observed in any of the spectra, which indicates that Cr(III) is the predominant oxidation state at this site. Chromium may enter the soil either as Cr(III) or as Cr(VI). The original drainage water from the smelter was probably very acidic and could carry significant amounts of Cr(III) into the soil. The dissolved Cr(III) then could precipitate as immobile Cr(III) species from solution when soil pH increased with time.

114
Figure 69. Normalized κ3-Weighted EXAFS Spectra at the As K-Edge For As-Adsorbed Goethite (top) and As-Adsorbed Akaganeite (bottom).
X-ray Energy (eV)
5980 5990 6000 6010 6020
Nor
mal
ized
Inte
nsity
0
1
1.0
0.5
0.25
0
Cr(III)Cr(VI)Cr(VI)
+
X-ray Energy (eV)
5980 5990 6000 6010 6020
Nor
mal
ized
Inte
nsity
0
1
1.0
0.5
0.25
0
Cr(III)Cr(VI)Cr(VI)
+
1.0
0.5
0.25
0
Cr(III)Cr(VI)Cr(VI)
+
Figure 70. XANES Spectra For Chromium Reference Compounds. The Spectra Are Labeled With the Molar Ration Cr(VI) in Each Mixture. The Height of the Pre-Edge Peak Increases Monotonically With Cr(VI) Content.

115
Chromium may also be introduced into the soil as soluble Cr(VI) species. The noisy Cr XANES spectrum of the soil samples from the surface layer (0 - 10 cm) indicates that Cr is present as Cr(III) species at very low concentration, while based on the geochemistry of Cr, under the surface oxidized conditions, Cr(VI) is expected to be the predominant oxidation state. If Cr were originally introduced as Cr(VI), the contrariety can be explained that although CrO4
2- could be adsorbed onto Fe oxide surfaces by forming inner-sphere surface complexes (Deng et al., 1996; Fendorf et al., 1997), the extremely high concentrations of SO4
2-, AsO43-, and other anions
present at this site significantly suppressed the CrO42- adsorption and resulted in the high
mobility of Cr(VI) in the surface layer (Zachara et al., 1987). Chromium is found to be concentrated in the intermediate layer, especially highly associated with the mineral magnetite (Fe3O4). Numerous studies have demonstrated that Fe2+ and Fe(II)-containing minerals could effectively reduce Cr(VI) to Cr(III) (Jardine et al., 1999; Loyaux-Lawniczak et al., 2001), and the slag materials from the lead smelter added to this site provided sources of Fe. Cr(VI) reduction by magnetite has been observed in both laboratory studies (Peterson et al., 1996) and contaminated field sites (Peterson et al., 1997). Therefore, Cr mobility and bioavailability is likely to be very low at this site even if Cr was originally present as Cr(VI) due to the abundant presence of Fe2+ and Fe(II)-containing minerals in the subsurface layer. The reduction from Cr(VI) to Cr(III) can effectively immobilize and retain Cr as sorbed surface complexes by these Fe minerals or precipitate as insoluble mineral phases, such as Cr(OH)3 or Cr1-xFex(OH)3, although no such phases were identified.
X-ray Energy (eV)
5980 5990 6000 6010 6020
Nor
mal
ized
Inte
rsity
0
1
2
20-30 cm
30-50 cm
0-10 cm
X-ray Energy (eV)
5980 5990 6000 6010 6020
Nor
mal
ized
Inte
rsity
0
1
2
20-30 cm
30-50 cm
0-10 cm
Figure 71. Cr K-XANES Spectra of Soil Aggregates From Different Depths. The Lack of a Significant Pre-Edge Peak Indicates That Cr(III) is the Predominant Oxidation State Throughout the Soil Profile.

116
VII. Summary and Conclusions The overall objective of this study was to attempt to remediate metal-contaminated soils by finding an amendment or combination of amendments that could be applied and reduce chemical lability and bioavailability. We located three soils that were contaminated with at least of the meatls Pb, Cd, Cr, and As. The soils were characterized for an array of chemical and physical properties including total metals. All soils had a mixture of metals requiring attention, and made the remediation challenge much greater because the chemistry of each metal was quite different from the others. Our approach to finding remediation solution using in situ amendments was to sequentially address the metals with additives known to target at least one metal. We then examined the soils for chemical lability (concentrations of metals removed from the soil by an extractant), bioaccessibility (metals available for removal from the soil by a sequence of extractants demonstrated to be correlated with availability to a given organism), and biotoxicity. Orthophosphate is a known, successful amendment for Pb, and this was our first amendment. Quite predictably, the addition of orthosphosphate decreased Pb but greatly increased As and sometimes Cr concentrations. Therefore, our challenge was to find additional amendments that could suppress the other metals without impacting the effect of phosphate on Pb. In laboratory studies, combinations of chemical amendments, including rare earth elements, Mn and P, were added to soil with low redox potential to reduce the bioaccessible fraction of As, Cr, Cd and Pb. Lanthanum and Ce were able to form low solubility precipitates with As, as determined in aqueous solutions. Spectroscopic studies confirmed that LaAsO4(s) can form under pH conditions as low as 2.2. The addition of La to soil increased the bioaccessible fraction of As and was both ratio and time dependent. Chemical modeling, using Visual MINTEQ, showed that redox potential played a role in the increase of bioaccessible As. At Eh -29, even at neutral pH, LaAsO4(s) was unable to decrease the concentration of As below that controlled by realgar, which controls the As in the target soil. Because of the lack of solubility constants for lanthanum/cerium sulfides/sulfates, the possible hindrance of S was not determined. Cerium was not affected by the low redox potential or possible interaction with S, and the addition of Ce was able to decrease the bioaccessible As fraction, but was ratio and time dependent. Combination amendments of Ce, Mn and P showed promising results. With the addition of 1:5 Pb+Cd:Mn and Pb+Cd:P, bioaccessible Cd was reduced below detection limit and bioaccessible Pb was reduced to 11% compared to 66% in the control. Also, the addition of 1:3 As:Ce and any ratio of Mn and P were able to decrease the Cr bioaccessible fraction significantly compared with the control. The bioaccessible fraction of As increased with the addition of Mn and P, and Ce was unable to offset this decrease. There was a slight offset with the addition of 1:3 As:Ce, but this was not significant compared with 1:1 As:Ce. Additional research is needed to assess the long-term in-situ stabilization of soil with multiple metal contaminants. Three metal-contaminated soils collected from field sites were amended with combinations of manganese, phosphorus and cerium. A sandy soil from a former cadmium paint pigment manufacturing site (NJ soil) was amended, but the amendments increased toxicity to earthworms. Amendments had no effect on barley germination but depressed root growth. When the same amendments were applied to an organic soil from a former smelter site (smelter site soil),

117
earthworm survival improved, earthworms gained biomass, and had reduced metal tissue concentration compared to the unamended smelter site soil. A sandy loam soil with slightly elevated metal levels (UT soil) was amended, and amendment addition caused reduced lettuce root length and significantly elevated Cd earthworm tissue concentration. Speciation is the key factor in controlling mobility and bioavailability and information on the mineralogy and geochemistry of contaminant metals is important for developing in-situ remediation strategies. We sampled a Histosol that received runoff and seepage water from the site of a former lead smelter. We used the synchrotron x-ray microprobe on beamline X26A at the National Synchrotron Light Source at Brookhaven National Laboratory to obtain micro x-ray diffraction patterns (µ-XRD) and micro x-ray fluorescence patterns (µ-XRF) for soil aggregates ~100 – 200 μm in diameter. Arsenic and chromium x-ray absorption near edge structure (XANES) spectra were then obtained for aggregates with significant concentrations of arsenic or chromium. Results show a clear pattern of metal speciation changes with depth. The oxidized yellow surface layer (0 – 10 cm depth) is dominated by goethite and poorly crystalline akaganeite. Lead and arsenic are highly associated with these Fe oxides by forming stable inner-sphere surface complexes. The occurrence of akaganeite in a natural soil is reported for the first time in this thesis. Gypsum, schwertmannite, and jarosite were identified in the surface layer as well, particularly for samples collected during dry periods. Fe(II)-containing minerals, including magnetite, siderite, and possibly wustite occur in the intermediate layers (10 – 30 cm depth). The unusual presence of hematite and wustite in the subsurface horizons is probably the results of a burning event at this site. Iron, lead, and arsenic sulfide minerals predominate at depths > ~30 cm and phases included realgar, greigite, galena, and sphalerite, alacranite, and others. Most of these minerals occur as almost pure phases in sub-millimeter aggregates and appear to be secondary phases that have precipitated from solution. Mineralogical and chemical heterogeneity and the presence of phases stable under different redox conditions make this a challenging soil for in-situ remediation.

118
VIII. References Arai, Y., A. Lanzirotti, A., S.R. Sutton, M. Newville, J. Dyer, and D.L. Sparks. 2006. Spatial and
temporal variability of arsenic solid-state speciation in historically lead arsenate contaminated soils. Environmental Science & Technology 40:673-679.
Arai, Y., A. Lanzirotti, S.R. Sutton, J.A. Davis, and D.L. Sparks. 2003. Arsenic speciation and reactivity in poultry litter. Environmental Science & Technology 37:4083-4090.
Avila, G., H. Gaete, M. Morales, and A. Neaman. 2007. Reproduction of Eisenia foetida in agricultural soils from mining areas contaminated with copper and arsenic. Pesquisa Agropecuaria Brasileira 42:435-441.
Bajt, S., S.B. Clark, S.R. Sutton, M.L. Rivers, and J.V. Smith. 1993. Synchrotron X-ray microprobe determination of chromate content using X-ray absorption near-edge structure. Analytical Chemistry 65:1800-1804.
Bakoyannakis, D.N., E.A. Deliyanni, A.I. Zouboulis, K.A. Matis, L. Nalbandian, and L. Kehagias. 2003. Akaganeite and goethite-type nanocrystals: synthesis and characterization. Microporous and Mesoporous Materials 59:35-42.
Bargar, J.R., G.E. Brown, and G.A. Parks. 1997. Surface complexation of Pb(II) at oxide-water interfaces. 2. XAFS and bond-valence determination of mononuclear Pb(II) sorption products and surface functional groups on iron oxides. Geochimica et Cosmochimica Acta 61:2639-2652.
Barnhart J. 1997. Chromium Chemistry and implications for environmental fate and toxicity. Journal of Soil Contamination Volume 6/Number 6 pp. 561-568.
Bednar, A.J., J.R. Garbarino, J.F. Ranville, and T.R. Wildeman. 2005. Effects of iron on arsenic speciation and redox chemistry in acid mine water. Journal of Geochemical Exploration 85:55-62.
Bigham, J.M., U. Schwertmann, L. Carlson, and E. Murad. 1990. A poorly crystallized oxyhydroxysulfate of iron formed by bacterial oxidation of Fe(II) in acid-mine waters. Geochimica et Cosmochimica Acta 54:2743-2758.
Bigham, J.M., U. Schwertmann, S.J. Traina, R.L. Winland, and M. Wolf. 1996. Schwertmannite and the chemical modeling of iron in acid sulfate waters. Geochimica et Cosmochimica Acta 60:2111-2121.
Bose, P., and A. Sharma. 2002. Role of iron in controlling speciation and mobilization of arsenic in subsurface environment. Water Research 36:4916-4926.
Bowell, R.J. 1994. Sorption of arsenic by iron oxides and oxyhydroxides in soils. Applied
Bradley, K.S., J.M. Bigham, W.F. Jaynes, and T.J. Logan. 1986. Influence of sulfate on Fe-oxide formation: Comparisons with a stream receiving acid mine drainage. Clays and Clay Minerals 34:266-274.
Brennan, E.W., and W.L. Lindsay. 1996. The role of pyrite in controlling metal ion activities in highly reduced soils. Geochimica et Cosmochimica Acta 60:3609-3618.

119
Bricka, R.M., C.W. Williford, and L.W. Jones. 1994. Heavy metal soil contamination at U.S. Army installations: Proposed research and strategy for technology development. Tech. Rpt. IRRP-94-1, U.S. Army Engineers Waterways Experiment Station, Vicksburg, MS. (http://www.wes.army.mil/el/elpubs/pdf/trirrp94-1.pdf)
Brown S., R.L. Chaney, J.S. Angle. 1997. Subsurface liming and metal movement in soils amended with lime-stabilized biosolids. J. Environ. Qual. 26:724-732.
Burton, E.D., R.T. Bush, and L.A. Sullivan. 2006. Sedimentary iron geochemistry in acidic waterways associated with coastal lowland acid sulfate soils. Geochimica et Cosmochimica Acta 70:5455-5468.
Buswell,A.M., K.Krebs, and W.H.Rodebush. 1937. Infrared studies. III. Absorption bands of hydrogels between 2.5 and 3.5 micrometers. J.Am.Chem.Soc. 59: 2603-2605.
Cai, J., J. Liu, Z. Gao, A. Navrotsky, and S.L. Suib. 2001. Synthesis and anion exchange of tunnel structure akaganeite. Chemistry of Materials 13:4595-4602.
Canivet, V., P. Chambon, and J. Gibert. 2001. Toxicity and bioaccumulation of arsenic and chromium in epigean and hypogean freshwater macroinvertebrates. Archives of Environmental Contamination and Toxicology 40:345-354.
Carlson, L., J.M. Bigham, U. Schwertmann, A. Kyek, and F. Wagner. 2002. Scavenging of As from acid mine drainage by schwertmannite and ferrihydrite: A comparison with synthetic analogues. Environmental Science & Technology 36:1712-1719.
Chaney, R.L., Ryan, J.A., and Brown, S.L. 1999. In Anderson, W.C., Loehr, R.C., and Reible (eds)., Environmental availability of chlorinated organics, explosives, and metals in soils. Am. Acad. Environ. Engg., Annapolis, Maryland. pp 111-154.
Chang, A. C., Granato, T. C. and A. L. Page. 1992. A methodology for establishing phytotoxicity criteria for chromium, copper, nickel and zinc in agricultural land application of municipal sewage sludges. J. Environ. Qual., 21:521-536.
Cornell, R.M., and U. Schwertmann. 2003. The iron oxides: Structure, properties, reactions, occurrence and uses. VCH, Weinheim.
Cummings, D.E., F. Caccavo, S. Fendorf, and R.F. Rosenzweig. 1999. Arsenic mobilization by the dissimilatory Fe(III)-reducing bacterium Shewanella alga BrY. Environmental Science & Technology 33:723-729.
Davies, F.T., J.D. Puryear, R.J. Newton, J.N. Egilla, and J.A.S. Grossi. 2001. Mycorrhizal fungi enhance accumulation and tolerance of chromium in sunflower. J. Plant Physiol. 158:777-786.
Deliyanni, E.A., and K.A. Matis. 2005. Sorption of Cd ions onto akaganeite-type nanocrystals. Separation and Purification Technology 45:96-102.
Deliyanni, E.A., D.N. Bakoyannakis, A.I. Zouboulis, and K.A. Matis. 2003. Sorption of As(V) ions by akaganeite-type nanocrystals. Chemosphere 50:155-163.
Deng, Y.W., M. Stjernstrom, and S. Banwart. 1996. Accumulation and remobilization of aqueous chromium(VI) at iron oxide surfaces: Application of a thin-film continuous flow-through reactor. Journal of Contaminant Hydrology 21:141-151.

120
Dixit, S., and J.G. Hering. 2003. Comparison of arsenic(V) and arsenic(III) sorption onto iron oxide minerals: Implications for arsenic mobility. Environmental Science & Technology 37:4182-4189.
Farmer,V.C. 1974. The Layer Silicates. In The infrared spectra of minerals. V.C.Farmered., Mineral Society, London. 331-359.
Farquhar M.L., Charnock J.M., Livens F.R. and Vaughan D.J. 2002. Mechanisms of arsenic uptake from aqueous solution by interaction with goethite, lepidocrocite, mackinawite, and pyrite: an x-ray absorption spectroscopy study. Environmental Science and Technology Volume 36/Number 8 pp. 1757-1762.
Fayiga, A.O., and L.Q. Ma. 2005. Arsenic uptake by two hyperaccumulator ferns from four arsenic contaminated soils. Water Air and Soil Pollution 168:71- 89.
Fendorf, S.E., and R.J. Zasoski. 1992. Chromium(III) oxidation by δ-MnO2. 1. Characterization. Environmental Science & Technology 26:79-85.
Fendorf, S.E., M.J. Eick, P. Grossl, and D. Sparks. 1997. Arsenate and chromate retention mechanisms on goethite. 1. Surface structure. Environmental Science & Technology 31:315-320.
Fischer, E., and L. Koszorus. 1992. Sublethal effects, accumulation capacities and elimination rates of As, Hg and Se in the manure worm, eiseniafoetida (oligochaeta, lumbricidae). Pedobiologia 36:172-178.
Ford, R.G. 2002. Rates of hydrous ferric oxide crystallization and the influence on coprecipitated arsenate. Environmental Science & Technology 36:2459-2463.
Forget, J., J.F. Pavillon, M.R. Menasria, and G. Bocquene. 1998. Mortality and LC50 values for several stages of the marine copepod Tigriopus brevicornis (Muller) exposed to the metals arsenic and cadmium and the pesticides atrazine, carbofuran, dichlorvos, and malathion. Ecotoxicology and Environmental Safety 40:239-244.
Francesconi K., P. Visoottiviseth, W. Sridokchan, W. Goessler. 2002. Arsenic species in an arsenic hyperaccumulating fern, Pityrogramma calomelanos: a potential phytoremediator of arsenic-contaminated soils. Science of the Total Environment. 284 (1-3): 27-35.
Fredrickson, J.K., J.M. Zachara, D.W. Kennedy, H. Dong, T.C. Onstott, N.W. Hinman, and S.M. Li. 1998. Biogenic iron mineralization accompanying the dissimilatory reduction of hydrous ferric oxide by a groundwater bacterium. Geochimica et Cosmochimica Acta 62:3239-3257.
Fukushi, K., T. Sato, and N. Yanase. 2003. Solid-solution reactions in As(V) sorption by schwertmannite. Environmental Science & Technology 37:3581-3586.
Fukushi, K., T. Sato, N. Yanase, J. Minato, and H. Yamada. 2004. Arsenate sorption on schwertmannite. American Mineralogist 89:1728-1734.
Geochemistry 9:279-286.
Goldberg S. and Johnston C.T. 2001. Mechanisms of arsenic adsorption on amorphous oxides evaluated using macroscopic measurements, vibrational spectroscopy, and surface

121
complexation modeling. Journal of colloid and Interface Science Volume 234 pp. 204-216.
Gonzalez, A.R., K. Ndung'u, A.R. Flegal. 2005. Natural occurrence of hexavalent chromium in the Aromas Red Sands aquifer, California. Environmental Science & Technology 39:5505-5511.
Harkey, G. A., and S. P. Pradhan. 1998. Relationship between contaminant loss and toxicity during phytoremediation using the solid phase Microtox test. Bull. Environ. Cont. Tox. 61:419-425.
Hettiarachchi G.M., Pierzynski G.M. and Ransom M.D. 2000. In-situ stabilization of soil lead using phosphorus and manganese oxide. Environmental Science and Technology Volume 34/Number 21 pp. 4614-4619.
Hsia T.H., Lo S.L., Lin C.F., and Lee D.Y. 1994. Characterization of arsenate adsorption on hydrous iron oxide using chemical and physical methods. Colloids and Surface a-physicochemical and engineering aspects. Elsevier Science Volume 85 pp. 1-7
Hutchinson, T.H., T.D. Williams, and G.J. Eales. 1994. Toxicity of cadmium, hexavalent chromium and copper to marine fish larvae (cyprinodonvariegatus) and copepods (tisbe battagliai). Marine Environmental Research 38:275-290.
Ishikawa, T., and K. Inouye. 1975. Role of chlorine in β-FeOOH on its thermal change and reactivity to sulfur dioxide. Bulletin of the Chemical Society of Japan 48:1580-1584.
James, B.R., and R.J. Bartlett. 1984. Plant-soil interactions of chromium. Journal of Environmental Quality 13:67-70.
James, B.R., J.C. Petura, R.J. Vitale, and G.R. Mussoline. 1997. Oxidationreduction chemistry of chromium: Relevance to the regulation and remediation of chromate-contaminated soils. Journal of Soil Contamination 6:569-580.
Jardine, P.M., S.E. Fendorf, M.A. Mayes, I.L. Larsen, S.C. Brooks, and W.B. Bailey. 1999. Fate and transport of hexavalent chromium in undisturbed heterogeneous soil. Environmental Science & Technology 33:2939-2944.
Johnston,C.T. and Aochi,Y.O. 1996. Fourier transform infrared and Raman spectroscopy. In Methods of Soil Analysis Part 3 Chemical Methods. D.L.Sparksed., Soil Science Society of America, Madison, WI. 269-321.
Johnston,C.T. and Wang,S.L. 2002. Application of vibrational spectroscopy in soil and environmental sciences. In Handbook of Vibrational Spectroscopy. J.M.Chalmers and P.R.Griffithseds., John Wiley and Sons, New York. 3192-3206.
Jones, B., and R.W. Renaut. 2007. Selective mineralization of microbes in Fe-rich precipitates (jarosite, hydrous ferric oxides) from acid hot springs in the Waiotapu geothermal area, North Island, New Zealand. Sedimentary Geology 194:77-98.
Jonsson, J., P. Persson, S. Sjoberg, and L. Lovgren. 2005. Schwertmannite precipitated from acid mine drainage: Phase transformation, sulphate release and surface properties. Applied Geochemistry 20:179-191.
Kawano, M., and K. Tomita. 2001. Geochemical modeling of bacterially induced mineralization

122
of schwertmannite and jarosite in sulfuric acid spring water. The American Mineralogist 86:1156-1165.
Kirk, M. F., T. R. Holm, J. Park, Q. Jin, R.A. Sanford, B.W. Fouke, and C.M. Bethke. 2004. Bacterial sulfate reduction limits natural arsenic contamination in groundwater. Geology 32:953-956.
Kozuh, N., J. Stupar, and B. Gorenc. 2000. Reduction and oxidation processes of chromium in soils. Environmental Science & Technology 34:112-119.
Langdon, C.J., T.G. Piearce, S. Black, and K.T. Semple. 1999. Resistance to arsenic-toxicity in a population of the earthworm Lumbricus rubellus. Soil Biology & Biochemistry 31:1963-1967.
Lee, G.H., and J.G. Hering. 2005. Oxidative dissolution of chromium(III) hydroxide at pH 9, 3, and 2 with product inhibition at pH 2. Environmental Science & Technology 39:4921-4928.
Li, Y.M., R.L. Chaney, G. Siebielec, and B.A. Kerschner. 2000. Response of four turfgrass cultivars to limestone and biosolids-compost amendment of a zinc and cadmium contaminated soil at Palmerton, Pennsylvania. J. Environ. Qual. 29:1440-1447.
Lindsay W.L. 1979. Chemical Equilibria in Soils. The Blackburn Press pp. 316-342.
Loyaux-Lawniczak, S., P. Lecomte, and J.J. Ehrhardt. 2001. Behavior of hexavalent chromium in a polluted groundwater: Redox processes and immobilization in soils. Environmental Science & Technology 35:1350-1357.
Lussier, S.M., J.H. Gentile, and J. Walker. 1985. Acute and chronic effects of heavy-metals and cyanide on mysidopsis-bahia (crustacea, mysidacea). Aquatic Toxicology 7:25-35.
Lytle, C.M., F.W. Lytle, N. Yang, J.H. Qian, D. Hansen, A. Zayed, and N. Terry. 1998. Reduction of Cr(VI) to Cr(III) by wetland plants: Potential for in situ heavy metal detoxification. Environ. Sci. Technol. 32:3087-3093.
Ma L.Q., K.M. Komar, C. Tu, W.H. Zhang, Y. Cai, E.D. Kennelley. 2001. A fern that hyperaccumulates arsenic - A hardy, versatile, fast-growing plant helps to remove arsenic from contaminated soils. Nature. 409:579-579.
Ma, W.C. 1982. The influence of soil properties and worm-related factors on the concentration of heavy metals in earthworms. Pedobiologia 24:109-119.
Maenpaa, K.A., J.V.K. Kukkonen, and M.J. Lydy. 2002. Remediation of heavy metal-contaminated soils using phosphorus: Evaluation of bioavailability using an earthworm bioassay. Archives of Environmental Contamination and Toxicology 43:389-398.
Manning B.A. and Goldberg S. 1997. Arsenic(III) and arsenic(V) adsorption on three California soils. Soil Science Volume 162 pp. 886-85.
Marino, M.A., R.M. Bricka, and C.N Neale. 1997. Heavy metal soil remediation: The effects of attrition scrubbing on a wet gravity concentration process. Environmental Progress. 16:208-214.
Marques, J.J., D.G. Schulze, N. Curi, and S.A. Mertzman. 2004. Trace element geochemistry in Brazilian Cerrado soils. Geoderma 121:31-43.

123
McGrath S.P., F.J. Zhao, E. Lombi. 2001. Plant and rhizosphere processes involved in phytoremediation of metal-contaminated soils. Plant Soil. 232:207-214.
Mc Kenzie R.M. 1971. The synthesis of birnessite, cryptomelane, and some other oxides and hydroxides of manganese. Mineralogical Magazine Volume 38 pp. 493-502.
Meharg, A.A., R.F. Shore, and K. Broadgate. 1998. Edaphic factors affecting the toxicity and accumulation of arsenate in the earthworm Lumbricus terrestris. Environmental Toxicology and Chemistry 17:1124-1131.
Meng, X.G., G.P. Korfiatis, C. Jing, C. Christodoulatos. 2001. Redox transformations of arsenic and iron in water treatment sludge during aging and TCLP extraction. Environmental Science & Technology 35:3476-3481.
Mertzman, S. 2000. K–Ar results from the southern Oregon –northern California cascade range. Organic Geology 62:99–122.
Miller J., H. Akhter, F.K. Cartledge, M. McLearn. 2000. Treatment of arsenic-contaminated soils. II: Treatability study and remediation. J. Environ. Engineer.ASCE. 126:1004-1012.
Moore T.J., C.M. Rightmire, R.K. Vempati. 2000. Ferrous iron treatment of soils contaminated with arsenic-containing wood-preserving solution Soil Sedim. Contam. 9:375-405.
Moore, J.N., W.H. Ficklin, and C. Johns. 1988. Partitioning of arsenic and metals in reducing sulfidic sediments. Environmental Science & Technology 22:432-437.
Morgan, A.J., M. Evans, C. Winters, M. Gane, and M.S. Davies. 2002. Assaying the effects of chemical ameliorants with earthworms and plants exposed to a heavily polluted metalliferous soil. European Journal of Soil Biology 38:323-327.
Murad, E. 1979. Mossbauer and X-ray data of β-FeOOH (akaganeite). Clay Minerals 23:161-173.
Murad, E., and U. Schwertmann. 1986. The influence of aluminum substitution and crystallinity on the Mossbauer spectra of hematite. Clays and Clay Minerals 34:1-6.
Nahmani, J., M.E. Hodson, and S. Black. 2007. A review of studies performed to assess metal uptake by earthworms. Environmental Pollution 145:402- 424.
Newman, D.K., D. Ahmann, and F.M.M. Morel. 1998. A brief review of microbial arsenate respiration. Geomicrobiology Journal 15:255–268.
O’Day P.A., Vlassopoulos D., Root R. and Rivera N. 2004. The influence of sulfur and iron on dissolved arsenic concentrations in the shallow subsurface under changing redox conditions. PNAS Volume 101/Number 38 pp. 13703-13708.
O'Day, P.A. 2006. Chemistry and mineralogy of arsenic. Elements 2:77-83.
Olazabal, M.A., N.P. Nikolaidis, S.A. Suib, and J.M. Madariaga. 1997. Precipitation equilibria of the chromium(VI)/iron(III) system and spectroscopic characterization of the precipitates. Environ. Sci. Technol. 31:2898-2902.
Oste, L.A., J. Dolfing, W.C. Ma, and T.M. Lexmond. 2001. Cadium uptake by earthworms as related to the availability in the soil and the intestine. Environmental Toxicology and Chemistry 20:1785-1791.

124
Paktunc, D., A. Foster, and G. Laflamme. 2003. Speciation and characterization of arsenic in Ketza River mine tailings using x-ray absorption spectroscopy. Environmental Science & Technology 37:2067-2074.
Pearson M.S., K. Maenpaa, G.M. Pierzynski, M.J. Lydy. 2000. Effects of soil amendments on the bioavailability of lead, zinc, and cadmium to earthworms. J. Environ. Qual. 29:1611-1617.
Peryea, F.J. 1998. Phosphate starter fertilizer temporarily enhances soil arsenic uptake by apple trees grown under field conditions. Hortscience 33:826- 829.
Peterson, M.L., G.E. Brown, and G.A. Parks. 1997. Differential redox and sorption of Cr(III/VI) on natural silicate and oxide minerals: EXAFS and XANES results. Geochimica et Cosmochimica Acta 61:3399-3412.
Peterson, M.L., G.E. Brown, G.A. Parks, and C.L. Stein. 1996. Direct XAFS evidence for heterogeneous redox reaction at the aqueous chromium/magnetite interface. Colloids and Surfaces A-Physicochemical and Engineering Aspects 107:77-88.
Pierce, M.L., and C.B. Moore. 1982. Adsorption of Arsenite and Arsenate on Amorphous Iron Hydroxide. Water Research 16:1247-1253.
Piotrowski, K., K. Mondal, T. Wiltowski, P. Dydo, and G. Rizeg. 2007. Topochemical approach of kinetics of the reduction to hematite to wustite. Chemical Engineering Journal. Article in press.
Regenspurg, S., and S. Peiffer. 2005. Arsenate and chromate incorporation in schwertmannite. Applied Geochemistry 20:1226-1239.
Rittle, K.A., J.I. Drever, and P.J.S. Colberg. 1995. Precipitation of arsenic during bacterial sulfate reduction. Geomicrobiology Journal 13:1–11.
Rodriguez R.R., Basta N.T., Casteel S.W. and Pace L.W. 1999. An in vitro gastrointestinal method to estimate bioavailable arsenic in contaminated soils and solid media. Environmental Science and Technology Volume33 pp. 642-649.
Schroth, A.W., and R.A. Parnell. 2005. Trace metal retention through the schwertmannite to goethite transformation as observed in a field setting, Alta Mine, MT. Applied Geochemistry 20:907-917.
Schwab, A.P., M.K. Banks, J.E. Alleman, and M.S. Switzenbaum. 2006. Development of a Metals Toxicity Protocol for Biosolids 00-PUM-6. Water Environmental Research Foundation, Alexandria, VA.
Seyler, P., and J.M. Martin. 1989. Biogeochemical processes affecting arsenic species distribution in a permanently stratified lake. Environmental Science & Technology 23:1258-1263.
Sivakumar, S., and C.V. Subbhuraam. 2005. Toxicity of chromium(III) and chromium(VI) to the earthworm Eisenia fetida. Ecotoxicology and Environmental Safety 62:93-98.
Smedley, P.L., and D.G. Kinniburgh. 2002. A review of the source, behaviour and distribution of arsenic in natural waters. Applied Geochemistry 17:517-568.

125
Sorensen, M.A., P.D. Jensen, W.E. Walton, and J.T. Trumble. 2006. Acute and chronic activity of perchlorate and hexavalent chromium contamination on the survival and development of Culex quinquefasciatus Say (Diptera:Culicidae). Environmental Pollution 144:759-764.
Sparks, D.L. (ed). Methods of Soil Analysis. Part 3 – Chemical Methods. Soil Science Society of American Book Series: 5. Soil Science Society of America, Madison, WI.
Sposito, G., LG Lund, and A.C. Chang. 1982. Trace-Metal Chemistry in Arid-Zone Field Soils Amended with Sewage-Sludge .1. Fractionation of Ni, Cu, Zn, Cd, and Pb in Solid-Phases. Soil Sci. Soc. Am. J. 46:260-264.
Stanjek, H., J.W.E. Fassbinder, H. Vali, H. Wagele, and W. Graf. 1994. Evidence of biogenic greigite (ferromagnetic Fe3O4) in soil. European Journal of Soil Science 45:97-104.
Sullivan, L.A., and R.T. Bush. 2004. Iron precipitate accumulations associated with waterways in drained coastal acid sulfate landscapes of eastern Australia. Marine and Freshwater Research 55:727-736.
Szlezak, A.M. 2006. In-situ immobilization of arsenic, chromium, cadmium and lead by addition of chemical amendments to the soil. Ph.D. diss. Purdue University, West Lafayette, IN.
Szulczewski, M.D., P.A. Helmke, and W.F. Bleam. 1997. Comparison of XANES analyses and extractions to determine chromium speciation in contaminated soils. Environmental Science & Technology 31:2954-2959.
Tokunaga S., Wasay S.A., and Park S-W. 1997. Water Science and Technology. Volume 35/Number 7, pp. 71-78.
Tokunaga S., Yokoyama S., an dWasay S.A. 1999. Removal of arsenic(III) and arsenic(V) ions from aqueous solutions with lanthanum(III) salt and comparison with aluminum(III), calcium(II), and iron(III) salts. Water Environment Research Volume 71/Number 3 pp. 299-306.
Tu, C., and L.Q. Ma. 2003. Effects of arsenate and phosphate on their accumulation by an arsenic-hyperaccumulator Pteris vittata L. Plant and Soil 249:373-382.
U.S. Environmental Protection Agency. 2001. The Role of Screening-Level Risk Assessments and Refining Contaminants of Concern in Baseline Ecological Risk Assessments. Publication 9345.0-14. EPA 540/F-01/014. http://www.epa.gov/oswer/riskassessment/ecoup/pdf/slera0601.pdf
US EPA, ECO Update, 1994, USEPA 540-F-94-012.
Vogt, K.A., D.A. Publicover, J. Bloomfield, J.M. Perez, D.J. Vogt, and W.L. Silver. 1993. Belowground responses as indicators of environmental-change. Environmental and Experimental Botany 33:189-205.
Wallace, A. 1980. Trace-Metal Placement in Soil on Metal Uptake and Phytotoxicity. Journal of Plant Nutrition 2:35-38.
Wang, S., and C. Vipulanandan. 2001. Solidification/stabilization of Fe(II)-treated Cr(VI)-contaminated soil. Environ. Eng. Sci. 18:301-308.
Webster, J.G., P.J. Swedlund, and K.S. Webster. 1998. Trace metal adsorption onto an acid mine

126
drainage iron(III) oxy hydroxy sulfate. Environmental Science & Technology 32:1361-1368.
White,J.L. and Roth,C.B. 1986. Infrared spectrometry. In Methods of soil analysis. Part 1. Physical and mineralogical methods. A.Klute(ed.) American Society of Agronomy, Madison, WI. pp 291-326.
Wittbrodt, P.R. and C.D. Palmer. 1997. Reduction of Cr(VI) by soil humic acids. Europ. J. Soil Sci. 48:151-162.
Yiannakakais A., Chammas G., and Walter G. 1999. Applying geochemical methods to remediate chromium contamination.
Yu, J.Y., B. Heo, K.Y. Choi, J.P. Cho, and H.W. Chang. 1999. Apparent solubilities of schwertmannite and ferrihydrite in natural stream waters polluted by mine drainage. Geochimica et Cosmochimica Acta 63:3407-3416.
Zachara, J.M., D.C. Girvin, R.L. Schmidt, and T. Resch. 1987. Chromate adsorption on amorphous iron oxyhydroxide in the presence of major groundwater ions. Environmental Science & Technology 21:589-594.
Zhang P. and Ryan J.A. 1998a. In vitro soil Pb solubility in the presence of hydroxyapatite. Environmental Science and Technology Volume 32 pp. 2763-2768.
Zhang, P.C., and J.A. Ryan. 1998b. Formation of pyromorphite in anglesite hydroxyapatite suspensions under varying pH conditions. Environmental Science & Technology 32:3318-3324.
Zhang, P.C., and J.A. Ryan. 1999a. Transformation of Pb(II) from cerrusite to chloropyromorphite in the presence of hydroxyapatite under varying conditions of pH. Environmental Science & Technology 33: 625-630.
Zhang, P.C., and J.A. Ryan. 1999b. Formation of chloropyromorphite from galena (PbS) in the presence of hydroxyapatite. Environmental Science & Technology 33:618-624.