final report fuel cell economic development plan hydrogen roadmap€¦ · · 2008-02-07final...
TRANSCRIPT
FINAL REPORT
FUEL CELL ECONOMIC DEVELOPMENT PLAN
HYDROGEN ROADMAP
SUBMITTED TO:
Department of Economic & Community Development
January 1, 2008
BY:
The Connecticut Center for Advanced Technology, Inc.
© 2008
Connecticut Center for Advanced Technology, Inc.
222 Pitkin Street, Suite 101 East Hartford, CT 06108
(860) 291-8832 www.ccat.us
The Connecticut Center for Advanced Technology, Inc. © 2008 2
Fuel Cell Economic Development Plan - Hydrogen Roadmap Collaborative Participants
Project Management and Plan Development
Connecticut Center for Advanced Technology, Inc.: Elliot Ginsberg – Chief Executive Officer
Joel M. Rinebold – Program Director Paul Aresta – Project Manager Tom Drejer – Project Analyst
Project Consultants
Connecticut Academy of Science and Engineering – Third Party Review Connecticut Economic Resource Center – Communications Plan
GZA GeoEnvironmental Inc. – Emissions Analysis Barr Group, Inc. – Economics
Connecticut Center for Manufacturing Supply Chain Integration – Supply Chain Joe King – Transportation
Trent M. Molter – Research & Development Mark A. Thompson – Economic Multipliers
State Agencies
Connecticut Department of Economic and Community Development Renewable Energy Investment Fund (Connecticut Clean Energy Fund)
Connecticut Department of Environmental Protection Connecticut Department of Transportation
Connecticut Siting Council
Education University of Connecticut Global Fuel Cell Center
Gateway Community College Goodwin College
Connecticut Hydrogen - Fuel Cell Coalition
Manufacturers and Supply Chain Legal and Finance
Labor Government Education
The Connecticut Center for Advanced Technology, Inc. © 2008 3
Table of Contents
Foreword............................................................................................................................................... 8
EXECUTIVE SUMMARY ............................................................................................ 11 Summary of Recommended Strategies ............................................................................................... 19
PART I Identification and Assessment of Market Conditions for Fuel Cell and Hydrogen Technology................................................................................................. 21
Description of Fuel Cells and Hydrogen............................................................................................. 21 Global Market Analysis ...................................................................................................................... 24 Market Assessment for Stationary Fuel Cells, Transportation and Portable Fuel Cells ..................... 26
Stationary Fuel Cell Market ...................................................................................................... 26 Transportation Fuel Cell Market ............................................................................................... 31 Portable Power Fuel Cell Market .............................................................................................. 36 Summary of Potential Markets .................................................................................................. 38
Other Market Drivers.......................................................................................................................... 39 Policy......................................................................................................................................... 39 Electric Supply .......................................................................................................................... 41 Oil Supply and Consumption .................................................................................................... 42 Air Emissions ............................................................................................................................ 44 Connecticut Environmental Drivers for Hydrogen and Fuel Cell Technology ......................... 47 Connecticut Efficiency Drivers for Hydrogen and Fuel Cell Technology ................................ 50
PART II Analysis of Connecticut’s Hydrogen and Fuel Cell Industry ................. 55 Economic and Employment Benefits.................................................................................................. 55
Economic Benefits of Connecticut’s Hydrogen and Fuel Cell Industry.................................... 55 Connecticut’s Hydrogen and Fuel Cell Industry Employment.................................................. 57 Global Employment .................................................................................................................. 58
Fuel Cells ............................................................................................................................................ 59 Connecticut Fuel Cell Companies ............................................................................................. 59 Core Competencies of Connecticut Fuel Cell Companies......................................................... 62 Market Focus of Connecticut Fuel Cell Companies.................................................................. 62 Major Issues Facing Connecticut Fuel Cell OEMs ................................................................... 63
Hydrogen ............................................................................................................................................ 64 Connecticut Hydrogen Companies............................................................................................ 64 Core Competencies of Connecticut Hydrogen Companies ....................................................... 65 Market Focus of Connecticut Hydrogen Companies................................................................. 67
Connecticut’s Position in the Hydrogen and Fuel Cell Industry......................................................... 67 Federal and International Activity, and Activity in Other States............................................... 67 Companies’ Positioning in Fuel Cells and Hydrogen................................................................ 68 Connecticut’s Hydrogen and Fuel Cell Industry Supply Chain................................................. 71
PART III Discussion of Issues and Proposed Solutions .......................................... 75 Stationary Power................................................................................................................................. 75
Fuel Cells in Distributed Generation ......................................................................................... 75 Connecticut Electric Power Needs ............................................................................................ 78 Connecticut Renewable Portfolio Standards ............................................................................. 79 State Assistance for Stationary Fuel Cells................................................................................. 81 New Opportunities .................................................................................................................... 84 Distributed Generation Opportunities - Geographic Targeting ................................................. 85 Distributed Generation Opportunities - Energy Improvement Districts.................................... 86 Distributed Generation Opportunities - Utility Ownership ....................................................... 86 Connecticut CleanEnergyOptions ............................................................................................. 87
Stationary Power Plan for Connecticut ............................................................................................... 88 Public Investment for Reduced Costs........................................................................................ 88 Summary of Hydrogen and Fuel Cell Benefits in Connecticut ................................................. 91
The Connecticut Center for Advanced Technology, Inc. © 2008 4
Hydrogen and Fuel Cells in Transportation ........................................................................................ 92 Business Opportunities for Connecticut Companies ................................................................. 96 Challenges for Hydrogen Fuel Infrastructure and Vehicles ...................................................... 97 Activity Underway to Address Challenges for Hydrogen Fuel Infrastructure and Vehicles..... 99 Competing and/or Supporting Technologies ........................................................................... 103 Development of Legislation and Regulations Associated with the Use of Hydrogen............. 103 State Assistance for Hydrogen-Fueled Vehicles ..................................................................... 104 Hydrogen Infrastructure in Connecticut .................................................................................. 105 Prior Transportation Support by Connecticut.......................................................................... 105
Transportation Plan for Connecticut ................................................................................................. 106 Goals for the Hydrogen and Fuel Cell Transportation Plan .................................................... 106 Demonstrations........................................................................................................................ 109 Legislation, Public-Private Partnerships, Codes, Research and Development ........................ 115 Cost Estimate to Implement Proposed Transportation Plan .................................................... 119 Potential for Use of Federal Funding ...................................................................................... 121 Managing the Program ............................................................................................................ 122
Research and Development............................................................................................................... 124 Research Centers and Support................................................................................................. 124 Research and Development Pathway ...................................................................................... 125 Hydrogen and Fuel Cell Performance Goals ........................................................................... 126 Research and Development Activities Funded by Connecticut............................................... 133 Federal Research and Development Effort.............................................................................. 140
Research and Development Plan for Connecticut............................................................................. 142 Workforce Development Plan for Connecticut................................................................................. 145
Workforce Development Framework and Priorities................................................................ 145 Hydrogen and Fuel Cell Education in Connecticut ................................................................. 146 Educational Programs Related to the Hydrogen and Fuel Cell Industry ................................. 149
PART IV Recommendations.................................................................................... 152 Facilitate the Commercialization of Hydrogen-Based Technologies and Fuel Cells (Public Act 06-187, Sec. 64, (1))............................................................................................................................... 152 Enhance Energy Reliability and Security (Public Act 06-187, Sec. 64, (2)) .................................... 154 Promote the Improved Efficiency and Environmental Performance of Transportation and Electric Generation With Reduced Emissions, Reduced Greenhouse Gases, More Efficient Use of Nonrenewable Fuels, and Increased Use of Renewable and Sustainable Fuels (Public Act 06-187, Sec. 64, (3))....................................................................................................................................... 155 Facilitate the Installation of Infrastructure for Hydrogen Production, Storage, Transportation and Fueling Capability (Public Act 06-187, Sec. 64, (4))........................................................................ 157 Disseminate Information Regarding the Benefits of Hydrogen-Based Technologies and Fuel Cells (Public Act 06-187, Sec. 64, (5)) ...................................................................................................... 157 Retain and Expand Hydrogen and Fuel Cell Industries in Connecticut (Public Act 06-187, Sec. 64, (6)) .................................................................................................................................................... 158 Identify Areas within the State Transportation System That Would Benefit From the Integration of Potential Mass Transit and Fleet Transit Locations with Hydrogen or Natural Gas and Hydrogen Mixture Refueling Stations (Public Act 06-187, Sec. 64, (7)) .......................................................... 159 Identify Areas in the Electric and Natural Gas Distribution System of the State That Would Benefit From the Development of Distributed Generation Through Hydrogen Or Fuel Cell Technology as a Reliability Asset Necessary for Voltage Control, Grid Security, or System Reliability, or for the Provision of Required Uninterruptible Service at Customer Sites (Public Act 06-187, Sec. 64, (8))160
CONCLUSION ............................................................................................................. 162 Acronyms.......................................................................................................................................... 164 Glossary ............................................................................................................................................ 167
The Connecticut Center for Advanced Technology, Inc. © 2008 5
Index of Tables
Table ES.1 - Economic Multipliers for Connecticut’s Hydrogen and Fuel Cell Industry 12 Table ES.2 - Connecticut’s Hydrogen and Fuel Cell Industry Jobs ................................. 12 Table ES.3 - Potential Average Annual Emissions Reduction and Energy Savings Using Fuel Cells .......................................................................................................................... 15 Table ES.4 - Average Energy Efficiency of Conventional and Fuel Cell Vehicles ......... 16 Table ES.5 - Summary of Investment Strategy and Potential Annual Return on Investment......................................................................................................................... 17 Table I.1 - Distributed Generation Estimated Market Penetration for 2014..................... 30 Table I.2 - Selected Transportation Market Statistics....................................................... 32 Table I.3 - Summary of Mature Markets for Stationary, Portable and Transportation Power ................................................................................................................................ 39 Table I.4 - Connecticut Projected Peak Electric Demand................................................. 41 Table I.5 - Fuel Cell Emission Reductions ....................................................................... 48 Table I.6 - Potential Average Annual Emissions Reduction by Megawatt Using Fuel Cells .................................................................................................................................. 48 Table I.7 - Transportation Emissions Comparison ........................................................... 49 Table I.8 - Potential Annual Emission Reductions Using Hydrogen Fuel Cells .............. 50 Table I.9 - Potential Efficiency Gains Using Hydrogen Fuel Cells.................................. 50 Table I.10 - Potential Annual Btu and No. 2 Oil Savings per Fuel Cell Megawatt.......... 51 Table I.11 - Energy Savings Using Hydrogen Fuel Cells................................................. 52 Table I.12 - Average Energy Use of Conventional and Fuel Cell Vehicles ..................... 52 Table I.13 - Well to Wheel Analysis ................................................................................ 53 Table I.14 - Societal Lifecycle Costs for Alternative Transportation Options ................. 54 Table II.1 - Economic Impacts of CT Hydrogen and Fuel Cell Industry,......................... 56 Table II.2 - Employment for the Hydrogen and Fuel Cell Industry in Connecticut......... 57 Table II.3 - Connecticut Fuel Cell Original Equipment Manufacturers ........................... 60 Table II.4 - Connecticut Hydrogen Companies ................................................................ 64 Table II.5 - Connecticut Companies’ Fuel Cell Position Compared to other States ........ 69 Table II.6 - Connecticut Companies’ Hydrogen Position Compared to other States ....... 70 Table II.7 - Summary of Connecticut OEM Activities..................................................... 73 Table II.8 - Typical Materials, Manufacturing Processes, and Manufactured Components Involved in the Manufacturing of a Fuel Cell................................................................... 74 Table III.1 - Comparison of Stationary Power Applications ............................................ 79 Table III.2 - CCEF Distributed Generation Program Incentives for Fuel Cell Technology........................................................................................................................................... 81 Table III.3 - Project 100 Fuel Cell Projects ...................................................................... 83 Table III.4 - CCEF Funded Fuel Cell Projects ................................................................. 83 Table III.5 - Objectives and Goals for Hydrogen and Fuel Cell Transportation Plan .... 108 Table III.6 - Hydrogen and Fuel Cell Demonstration Activity....................................... 109 Table III.7 - Summary of Hydrogen and Fuel Cell Demonstration Activity for Step 1 . 110 Table III.8 - Efforts in Enabling Legislation, Public-Private Partnerships, Codes and Regulatory Requirements, and Research and Development........................................... 116 Table III.9 - Comparison of State Population and Vehicle Registrations....................... 117 Table III.10 - Estimated Cost Effort and Connecticut Contribution............................... 120

The Connecticut Center for Advanced Technology, Inc. © 2008 6
Table III.11 - Summary of Portable Power Performance Goals..................................... 132 Table III.12 - Connecticut Research and Development Funding (2007)........................ 138 Table S.1 - Fuel Cell Mature Market Potential............................................................... 163
The Connecticut Center for Advanced Technology, Inc. © 2008 7
Index of Figures
Figures ES.1 and ES.2 - 2006 Connecticut Hydrogen and Fuel Cell Industry Employment and Economic Summary ................................................................................................... 11 Figures ES.3 - Potential Mature Global Market ............................................................... 13 Figure ES.3 - Cost Reduction Gains and Fuel Cell Production........................................ 15 Figure I.1 - 2005 Market Focus ........................................................................................ 25 Figure I.2 - Global Sales and R&D Expenditures............................................................. 25 Figure I.3 - Oil and Gasoline Price Analysis .................................................................... 44 Figure I.4 - U.S. Greenhouse Gas Emissions by End-Use Economic Sector, 1990–200346 Figures II.1.1 and II.1.2 - 2006 Connecticut Employment and Economic Summary....... 56 Figure II.2 - Global Employment...................................................................................... 58 Figure II.3 - Fuel Cell System Supply Chain.................................................................... 72 Figure III.1 - Installation of Seven 200-kW Phosphoric Acid Fuel Cell Power Plants in a Critical Power Application ............................................................................................... 76 Figure III.2 - Installation of a 1,200 kW Molten Carbonate Fuel Cell Power Plant in an Installation Representative of a Distributed Generator on an Electric Utility System ..... 77 Figure III.3 - Annual Percentage Increase of Connecticut’s Renewable Portfolio Standards........................................................................................................................... 80 Figure III.4 - Projected Average Annual Capacity Increase of Connecticut’s Renewable Portfolio Standards............................................................................................................ 81 Figure III.5 - Cost reduction Gains Using Hydrogen Fuel Cells ...................................... 89 Figures III.6.1 and III.6.2 - Pictures of Hyundai and Nissan Automobile Applications 100 Figure III.7 - Picture of CT Transit Fuel Cell Bus with UTC Fuel Cell Power Plant .... 101 Figure III.8 - Picture of Auxiliary Power Units.............................................................. 102 Figure III.9 - Drawing of Service/Off-Road Vehicles .................................................... 102 Figure III.10.1 and 10.2 - Pictures of Hydrogen Refueling Equipment ......................... 105 Figures III.11.1 and III.11.2 - Conceptual Drawings of a Prototype Commercial Retail Hydrogen Fueling Station ............................................................................................... 113 Figure III.12 - Research and Development Pathway ...................................................... 125 Figure III.13 - Fuel Cell Patents, across Benchmark States, 2000 – 2006 ..................... 134 Figure III.14 - Fuel Cell R&D Citations, across Benchmark States, 2000 – 2006........ 134 Figure III.15 - Connecticut Research and Development Funding (2007) ...................... 138 Figure III.16 - U. S. DOE Hydrogen Technology Budget Request Program Areas (FY08)......................................................................................................................................... 140 Figure III.17 - Number of Hydrogen and Fuel Cell Projects Funded by Agency 2001 - 2006................................................................................................................................. 141 Figure III.18 - Scientific Research/Engineering: Percentage Distribution of Degrees & Certificates Awarded, 2004-05 ....................................................................................... 147 Figure III.19 - Manufacturing: Percentage Distribution of Degrees & Certificates Awarded, 2004-05........................................................................................................... 148
The Connecticut Center for Advanced Technology, Inc. © 2008 8
Foreword
As oil and other non-sustainable hydrocarbon energy resources become scarce, energy prices will increase and reliability for supply will be reduced. The U.S. economy is highly dependent on hydrocarbon energy sources; any disruption or shortage in this energy supply will severely affect Americans and the economy. Recently Federal Reserve Chairman Ben Bernanke said, “The increase in energy prices is clearly making the economy worse off both in terms of real activity and in terms of inflation. There is no question about it.”1 While the threat of such shortages is real and potentially significant, strategic planning to guide consumers to alternative and more efficient energy resources in a timely manner will extend the time of use for available resources and reduce the impact attributable to shortages of hydrocarbon fuels. Further, the use of alternative energy and more energy efficient generation technologies may be able to improve environmental performance, reduce long-term costs, and create opportunities for economic development. In addition, growing concern over global warming is providing added governmental focus upon energy systems that limit CO2 and other greenhouse gas emissions. Efficiency improvements, use of sustainable fuels and converting conventional fuels to hydrogen and hydrogen-rich fuels with carbon capture and sequestration offer opportunities to reduce greenhouse gas emissions. Attractive technologies being considered by the energy industry and supported by a number of states include fuel cell power plants and the use of hydrogen as an energy carrier for transportation and other applications. Because Connecticut is a world leader in the research, design, and manufacture of hydrogen and fuel cell related technologies, the State is uniquely positioned to help develop the fuel cell/hydrogen market and facilitate a smooth transition from hydrocarbon fuels using conventional combustion technology to the use of efficient electrochemical technology. Such a transition will help address important energy and environmental challenges while opening markets for Connecticut-manufactured fuel cells, fuel cell components, hydrogen infrastructure equipment, and services in the industrial, commercial, institutional, residential, and transportation sectors, and thereby develop opportunities for the substantial creation of high-paying jobs in Connecticut.
1 AP Jeannine Aversa, July 21, 2006
The Connecticut Center for Advanced Technology, Inc. © 2008 9
In accordance with Public Act 06-187, Section 64, the Connecticut Center for Advanced Technology, Inc. (CCAT) is pleased to submit to the Connecticut Department of Economic and Community Development (DECD), the following Final Plan for Fuel Cell Economic Development in Connecticut. Public Act 06-187, Section 64 states:
“The plan shall include a strategy to (1) facilitate the commercialization of hydrogen-based technologies and fuel cells; (2) enhance energy reliability and security; (3) promote the improved efficiency and environmental performance of transportation and electric generation with reduced emissions, reduced greenhouse gases, more efficient use of nonrenewable fuels, and increased use of renewable and sustainable fuels; (4) facilitate the installation of infrastructure for hydrogen production, storage, transportation and fueling capability; (5) disseminate information regarding the benefits of hydrogen-based technologies and fuel cells; (6) develop strategies to retain and expand hydrogen and fuel cell industries in Connecticut; (7) in consultation with the Department of Transportation, identify areas within the state transportation system that would benefit from the integration of potential mass transit and fleet transit locations with hydrogen or natural gas and hydrogen mixture refueling stations; and (8) in consultation with electric and natural gas service providers, identify areas in the electric and natural gas distribution system of the state that would benefit from the development of distributed generation through hydrogen or fuel cell technology as a reliability asset necessary for voltage control, grid security, or system reliability, or for the provision of required uninterruptible service at customer sites.”
This Final Plan has been developed to: (1) identify and assess market conditions for fuel cell and hydrogen technology, including the economic potential for Connecticut; (2) analyze Connecticut’s hydrogen and fuel cell industry; (3) examine issues and identify proposed solutions; and (4) identify and assess strategies to enhance Connecticut’s hydrogen and fuel cell industry for increased employment, revenues, and economic development. Consistent with the provisions of Public Act 06-187, CCAT consulted with the Connecticut Hydrogen-Fuel Cell Coalition, the Renewable Energy Investment Fund, the Connecticut Department of Transportation, Connecticut’s electric and gas service providers, and Connecticut’s hydrogen and fuel cell supply chain to develop this Final Plan. This analysis was undertaken by CCAT with assistance from:
• fuel cell and hydrogen equipment manufacturers, including FuelCell Energy, Inc., GenCell Corporation, Infinity Fuel Cell and Hydrogen, Inc., UTC Power, Distributed Energy Systems Corp./Proton Energy Systems, Avālence, LLC, and Precision Combustion, Inc.;
• academic institutions including Quinnipiac University, Gateway Community College, Goodwin College, and the University of Connecticut Global Fuel Cell Center;
The Connecticut Center for Advanced Technology, Inc. © 2008 10
• government agencies including the Connecticut Siting Council, the Renewable Energy Investment Fund (Connecticut Clean Energy Fund), Connecticut Department of Economic and Community Development, Connecticut Department of Environmental Protection, and the Connecticut Department of Transportation;
• The Clean Cities Coalitions of Connecticut, including Capital Clean Cities of Connecticut, Greater New Haven Clean Cities Coalition, Southwestern Connecticut Clean Cities Coalition, and Norwich Clean Cities Coalition;
• Connecticut’s electric and gas service providers including the Southern Connecticut Gas Company/Connecticut Natural Gas Company, The United Illuminating Company, Connecticut Light and Power, and Yankee Gas Services Company; and
• other members of the Connecticut Hydrogen-Fuel Cell Coalition, including Bradley, Foster & Sargent, Inc., GrowJobs CT, International Association of Machinists & Aerospace Workers, American Hydrogen Association, Hydrogen Safety, LLC, Greater New Haven Transit District, Pullman & Comley, LLC, AG/ENA, and Concurrent Technologies Corporation.
The Connecticut Center for Advanced Technology, Inc. © 2008 11
EXECUTIVE SUMMARY Connecticut’s industry has been the leader and innovator of fuel cell and electrolysis
technologies since the 1950s, and pioneered applications for spacecraft, submarines, and
stationary power. More recently, Connecticut industry has joined the effort to apply
these technologies to transportation. Connecticut manufacturers and researchers have
developed expertise in all fuel cell technologies and hydrogen generation. Consequently,
Connecticut is well positioned to maintain or expand its share of the stationary power and
transportation markets for increased employment, increased sales, and increased research
and development (R&D) expenditures.
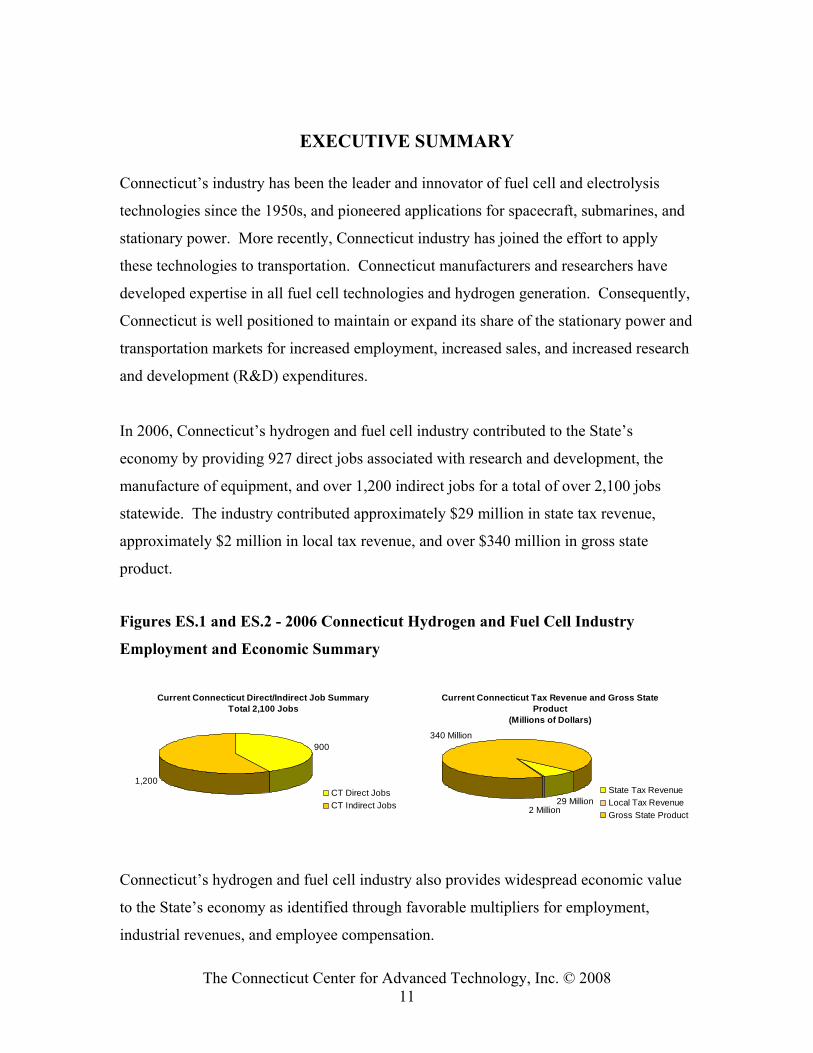
In 2006, Connecticut’s hydrogen and fuel cell industry contributed to the State’s
economy by providing 927 direct jobs associated with research and development, the
manufacture of equipment, and over 1,200 indirect jobs for a total of over 2,100 jobs
statewide. The industry contributed approximately $29 million in state tax revenue,
approximately $2 million in local tax revenue, and over $340 million in gross state
product.
Figures ES.1 and ES.2 - 2006 Connecticut Hydrogen and Fuel Cell Industry
Employment and Economic Summary
Current Connecticut Direct/Indirect Job Summary
Total 2,100 Jobs
900
1,200CT Direct JobsCT Indirect Jobs
Current Connecticut Tax Revenue and Gross State Product
(Millions of Dollars)
2 Million29 Million
340 Million
State Tax RevenueLocal Tax RevenueGross State Product
Connecticut’s hydrogen and fuel cell industry also provides widespread economic value
to the State’s economy as identified through favorable multipliers for employment,
industrial revenues, and employee compensation.
The Connecticut Center for Advanced Technology, Inc. © 2008 12
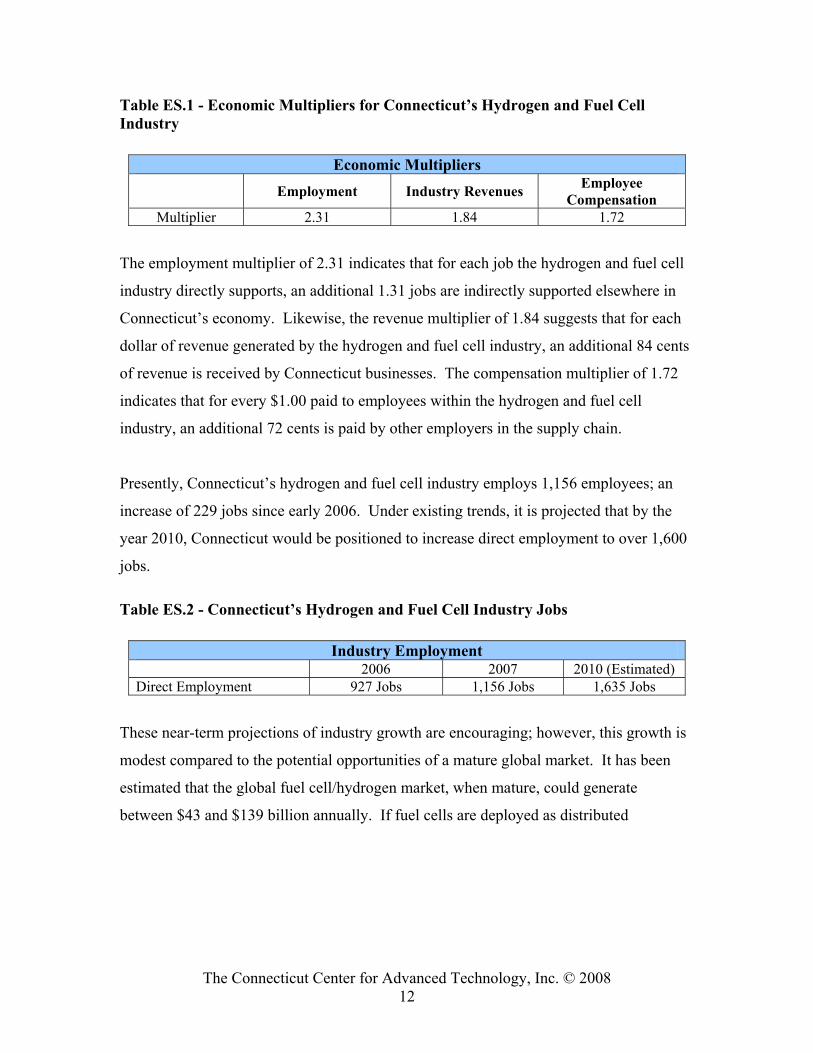
Table ES.1 - Economic Multipliers for Connecticut’s Hydrogen and Fuel Cell Industry
Economic Multipliers Employment Industry Revenues Employee
Compensation Multiplier 2.31 1.84 1.72
The employment multiplier of 2.31 indicates that for each job the hydrogen and fuel cell
industry directly supports, an additional 1.31 jobs are indirectly supported elsewhere in
Connecticut’s economy. Likewise, the revenue multiplier of 1.84 suggests that for each
dollar of revenue generated by the hydrogen and fuel cell industry, an additional 84 cents
of revenue is received by Connecticut businesses. The compensation multiplier of 1.72
indicates that for every $1.00 paid to employees within the hydrogen and fuel cell
industry, an additional 72 cents is paid by other employers in the supply chain.
Presently, Connecticut’s hydrogen and fuel cell industry employs 1,156 employees; an
increase of 229 jobs since early 2006. Under existing trends, it is projected that by the
year 2010, Connecticut would be positioned to increase direct employment to over 1,600
jobs.
Table ES.2 - Connecticut’s Hydrogen and Fuel Cell Industry Jobs
Industry Employment 2006 2007 2010 (Estimated)
Direct Employment 927 Jobs 1,156 Jobs 1,635 Jobs
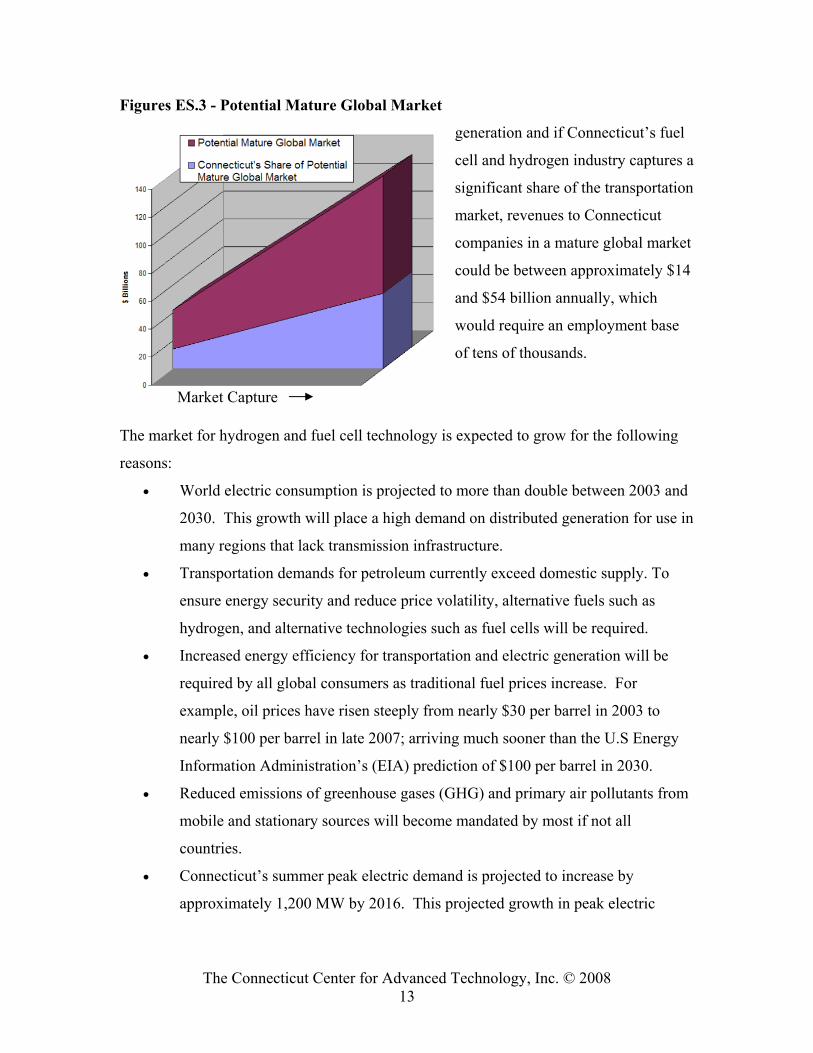
These near-term projections of industry growth are encouraging; however, this growth is
modest compared to the potential opportunities of a mature global market. It has been
estimated that the global fuel cell/hydrogen market, when mature, could generate
between $43 and $139 billion annually. If fuel cells are deployed as distributed
The Connecticut Center for Advanced Technology, Inc. © 2008 13
Figures ES.3 - Potential Mature Global Market
generation and if Connecticut’s fuel
cell and hydrogen industry captures a
significant share of the transportation
market, revenues to Connecticut
companies in a mature global market
could be between approximately $14
and $54 billion annually, which
would require an employment base
of tens of thousands.
The market for hydrogen and fuel cell technology is expected to grow for the following
reasons:
• World electric consumption is projected to more than double between 2003 and
2030. This growth will place a high demand on distributed generation for use in
many regions that lack transmission infrastructure.
• Transportation demands for petroleum currently exceed domestic supply. To
ensure energy security and reduce price volatility, alternative fuels such as
hydrogen, and alternative technologies such as fuel cells will be required.
• Increased energy efficiency for transportation and electric generation will be
required by all global consumers as traditional fuel prices increase. For
example, oil prices have risen steeply from nearly $30 per barrel in 2003 to
nearly $100 per barrel in late 2007; arriving much sooner than the U.S Energy
Information Administration’s (EIA) prediction of $100 per barrel in 2030.
• Reduced emissions of greenhouse gases (GHG) and primary air pollutants from
mobile and stationary sources will become mandated by most if not all
countries.
• Connecticut’s summer peak electric demand is projected to increase by
approximately 1,200 MW by 2016. This projected growth in peak electric
Market Capture
The Connecticut Center for Advanced Technology, Inc. © 2008 14
demand will require new generation resources in addition to conservation
measures.
• Connecticut will require new generation capacity to replace 942 MW of existing
generation capacity that will be at least 40 years old by 2008, and 2,461 MW of
existing generation capacity that will be at least 40 years old by 2016.
While hydrogen and fuel cell technology offers significant opportunities for improved
energy reliability, energy efficiency, and emission reductions, barriers have slowed
market penetration. These barriers include: high costs, lack of understanding and
recognition of fuel cell reliability and durability, unappreciated environmental values,
lack of investment needed to undertake research and development, insufficient
infrastructure, and strong competition from rate-base supported conventional grid
generation.
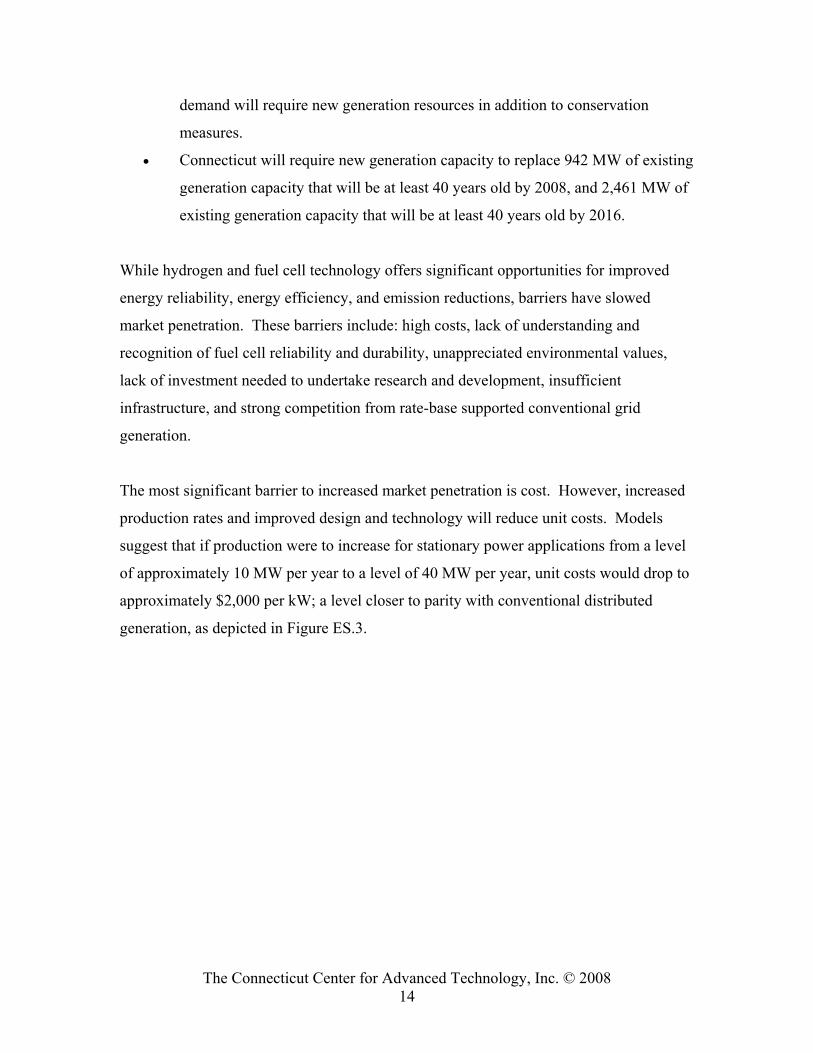
The most significant barrier to increased market penetration is cost. However, increased
production rates and improved design and technology will reduce unit costs. Models
suggest that if production were to increase for stationary power applications from a level
of approximately 10 MW per year to a level of 40 MW per year, unit costs would drop to
approximately $2,000 per kW; a level closer to parity with conventional distributed
generation, as depicted in Figure ES.3.
The Connecticut Center for Advanced Technology, Inc. © 2008 15
Figure ES.3 - Cost Reduction Gains and Fuel Cell Production
80% Learning Curve for Fuel Cell Production
0
500
1,000
1,500
2,000
2,500
3,000
3,500
10 20 40 80
Cumulative Megawatt Production
Ave
rage
Cos
t (U
S$/k
W)
With investment to produce 40 MW of fuel cell capacity in the state per year,
Connecticut industries will be able to reduce unit costs and potentially capture a larger
share of the global market. A long term investment of 40 MW per year will also help to
address Connecticut’s renewable portfolio standard requirements (RPS), GHG reduction
goals, and projected capacity deficiency of electric generation.
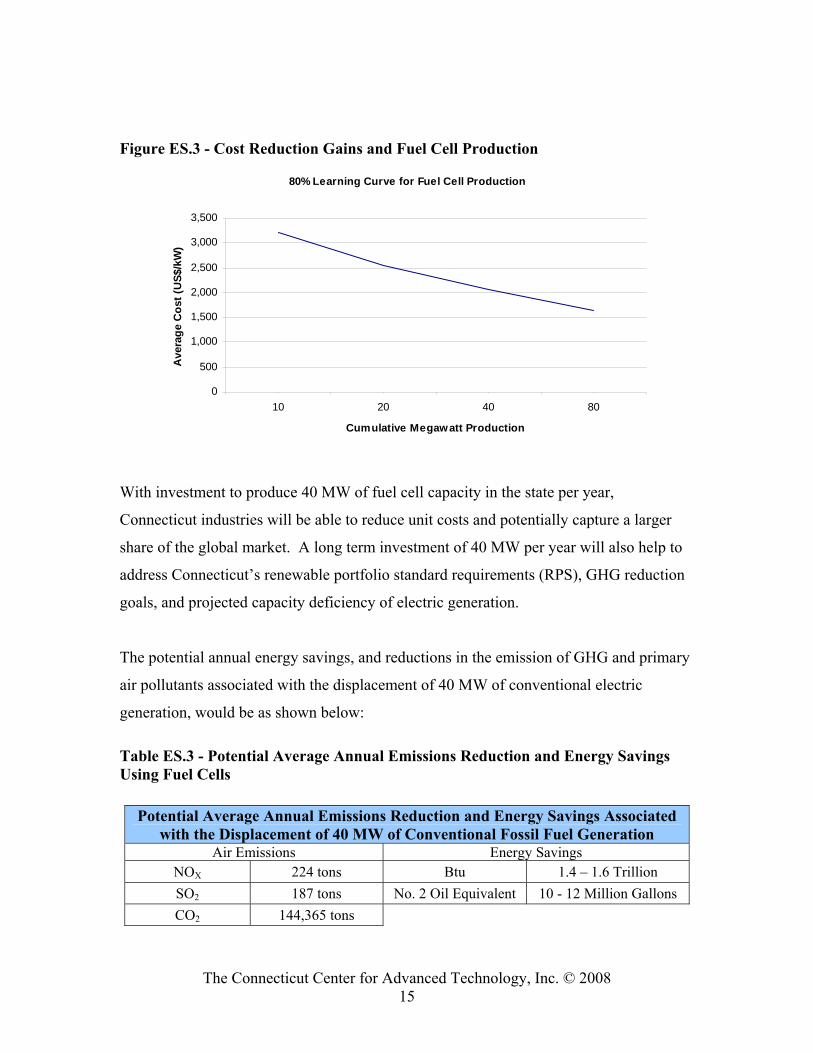
The potential annual energy savings, and reductions in the emission of GHG and primary
air pollutants associated with the displacement of 40 MW of conventional electric
generation, would be as shown below:
Table ES.3 - Potential Average Annual Emissions Reduction and Energy Savings Using Fuel Cells
Potential Average Annual Emissions Reduction and Energy Savings Associated with the Displacement of 40 MW of Conventional Fossil Fuel Generation
Air Emissions Energy Savings NOX 224 tons Btu 1.4 – 1.6 Trillion SO2 187 tons No. 2 Oil Equivalent 10 - 12 Million Gallons CO2 144,365 tons
The Connecticut Center for Advanced Technology, Inc. © 2008 16
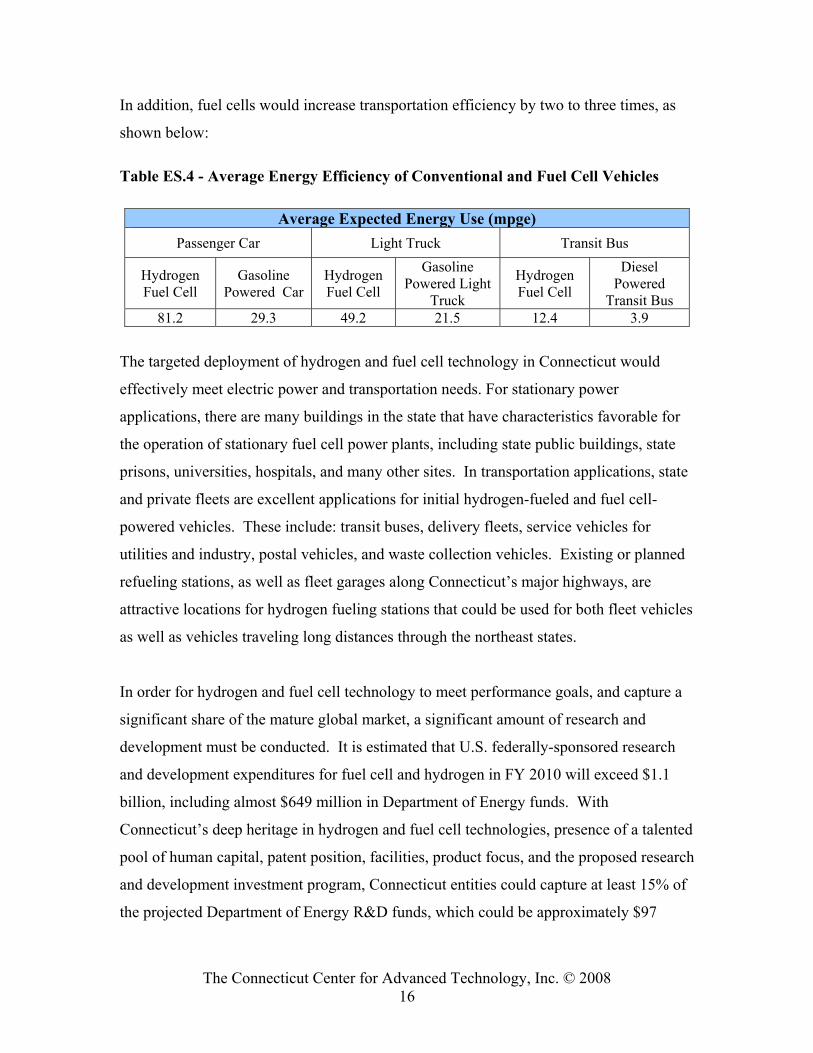
In addition, fuel cells would increase transportation efficiency by two to three times, as
shown below:
Table ES.4 - Average Energy Efficiency of Conventional and Fuel Cell Vehicles
The targeted deployment of hydrogen and fuel cell technology in Connecticut would
effectively meet electric power and transportation needs. For stationary power
applications, there are many buildings in the state that have characteristics favorable for
the operation of stationary fuel cell power plants, including state public buildings, state
prisons, universities, hospitals, and many other sites. In transportation applications, state
and private fleets are excellent applications for initial hydrogen-fueled and fuel cell-
powered vehicles. These include: transit buses, delivery fleets, service vehicles for
utilities and industry, postal vehicles, and waste collection vehicles. Existing or planned
refueling stations, as well as fleet garages along Connecticut’s major highways, are
attractive locations for hydrogen fueling stations that could be used for both fleet vehicles
as well as vehicles traveling long distances through the northeast states.
In order for hydrogen and fuel cell technology to meet performance goals, and capture a
significant share of the mature global market, a significant amount of research and
development must be conducted. It is estimated that U.S. federally-sponsored research
and development expenditures for fuel cell and hydrogen in FY 2010 will exceed $1.1
billion, including almost $649 million in Department of Energy funds. With
Connecticut’s deep heritage in hydrogen and fuel cell technologies, presence of a talented
pool of human capital, patent position, facilities, product focus, and the proposed research
and development investment program, Connecticut entities could capture at least 15% of
the projected Department of Energy R&D funds, which could be approximately $97
Average Expected Energy Use (mpge) Passenger Car Light Truck Transit Bus
Hydrogen Fuel Cell
Gasoline Powered Car
Hydrogen Fuel Cell
Gasoline Powered Light
Truck
Hydrogen Fuel Cell
Diesel Powered
Transit Bus 81.2 29.3 49.2 21.5 12.4 3.9
The Connecticut Center for Advanced Technology, Inc. © 2008 17
million. Consequently, the state is poised to benefit from innovation and business
creation opportunities associated with research and development activities.
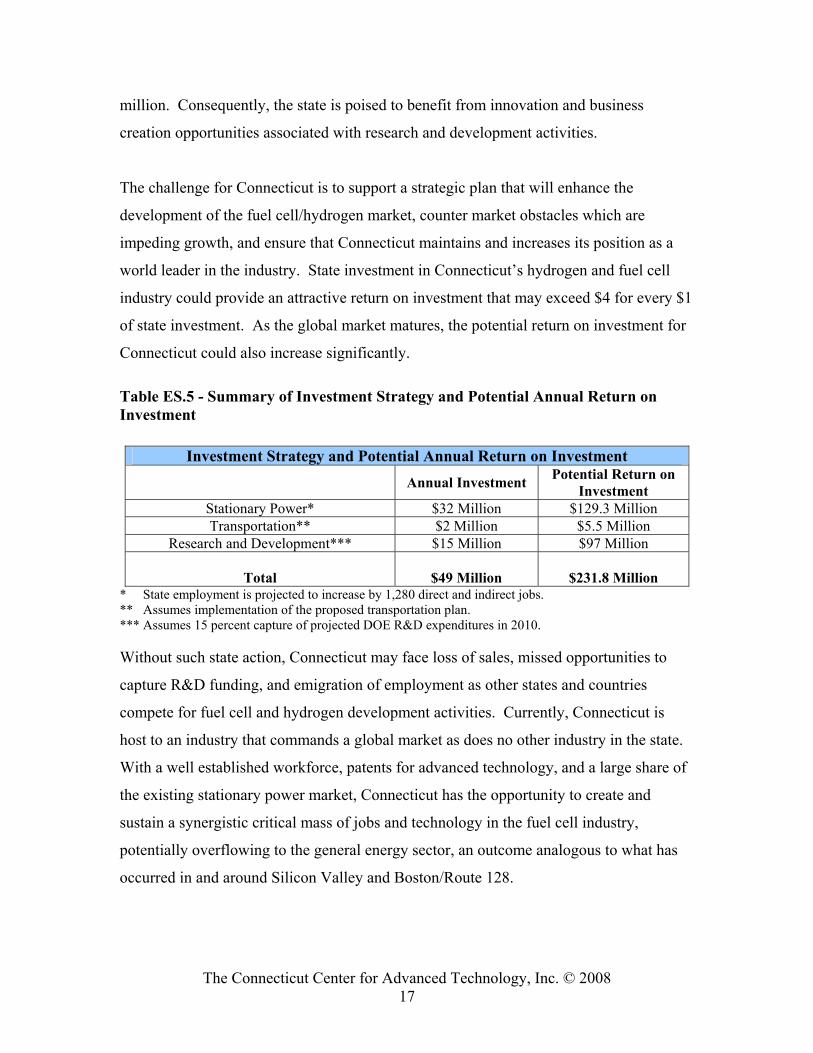
The challenge for Connecticut is to support a strategic plan that will enhance the
development of the fuel cell/hydrogen market, counter market obstacles which are
impeding growth, and ensure that Connecticut maintains and increases its position as a
world leader in the industry. State investment in Connecticut’s hydrogen and fuel cell
industry could provide an attractive return on investment that may exceed $4 for every $1
of state investment. As the global market matures, the potential return on investment for
Connecticut could also increase significantly.
Table ES.5 - Summary of Investment Strategy and Potential Annual Return on Investment
Investment Strategy and Potential Annual Return on Investment Annual Investment Potential Return on
Investment Stationary Power* $32 Million $129.3 Million Transportation** $2 Million $5.5 Million
Research and Development*** $15 Million $97 Million
Total
$49 Million
$231.8 Million * State employment is projected to increase by 1,280 direct and indirect jobs. ** Assumes implementation of the proposed transportation plan. *** Assumes 15 percent capture of projected DOE R&D expenditures in 2010. Without such state action, Connecticut may face loss of sales, missed opportunities to
capture R&D funding, and emigration of employment as other states and countries
compete for fuel cell and hydrogen development activities. Currently, Connecticut is
host to an industry that commands a global market as does no other industry in the state.
With a well established workforce, patents for advanced technology, and a large share of
the existing stationary power market, Connecticut has the opportunity to create and
sustain a synergistic critical mass of jobs and technology in the fuel cell industry,
potentially overflowing to the general energy sector, an outcome analogous to what has
occurred in and around Silicon Valley and Boston/Route 128.

The Connecticut Center for Advanced Technology, Inc. © 2008 18
In summary, data in this Final Report suggests that there are favorable market conditions
for the expansion of the hydrogen and fuel cell industry in Connecticut, that public
investment is appropriate and justified, that investment in hydrogen and fuel cell
technology would provide a favorable return for the state, and that there are favorable
sites for deployment of hydrogen and fuel cell technology in Connecticut to meet our
pressing energy needs, improve environmental performance, increase economic
development, and create new jobs.
The Connecticut Center for Advanced Technology, Inc. © 2008 19
Summary of Recommended Strategies
The following recommendations are intended as a menu of options to consider in support
of Connecticut’s hydrogen and fuel cell industry:
• Provide long-term and predictable tax advantage incentives to reduce early
development production costs for local manufacturers of fuel cells, fuel cell
components, and hydrogen equipment at $32 million per year for 10 years. This
investment strategy could earn a favorable return on investment for state
economic development, including federal tax credits of $40 million, and an
estimated $56 million in private investment from the manufacturers for a
cumulative value equivalent of over $128 million per year. In addition, the state
would gain 554 new jobs with an estimated value of nearly $33.28 million, for an
estimated total of 1,280 new jobs that would be added to the supply chain.
• Provide long-term and predictable grant and grant matching resources to support
public and private research and development (R&D) efforts in Connecticut at $15
million per year for ten years, to capture approximately $100 million in federal
R&D funding annually.
• Provide long-term support for bus, automobile, auxiliary power, service/off-road
vehicle, fueling station and infrastructure development and demonstration in
Connecticut at approximately $2 million per year to earn a favorable return on
investment for state economic development, including approximately $38.6
million from federal funding through 2015.
• Provide general support to the industry through the Connecticut Hydrogen-Fuel
Cell Cluster at $250,000 per year to:
o Monitor the implementation of the hydrogen roadmap for measurable
results in terms of jobs, electric capacity, and environmental performance;
o facilitate the development of hydrogen and fuel cell technology;
The Connecticut Center for Advanced Technology, Inc. © 2008 20
o disseminate information, and facilitate industry, academic and government
interaction; and
o assist and support manufacturing innovation, supply chain development,
and in-state lean manufacturing.
• Implement a Communications Plan to increase awareness and the level of
knowledge amongst potential customers, stakeholders, and investors
• Leverage all existing and proposed funding and/or state purchase to target the
installation of 40 MW of fuel cells per year at sites that provide high public
benefit, including but not limited to state and municipal public buildings including
schools, hospitals, and emergency shelters; Energy Improvement Districts; and
other identified priority sites.
• Dedicate a portion of Connecticut’s Renewable Portfolio Standard (RPS) for
combined heat and power (CHP) fuel cell and other performance equivalent
hydrogen fueled facilities and hydrogen (equivalent) production for dedicated use
with a fuel cell.
• Provide electric utility customer choice on utility bills for selection of hydrogen
and fuel cell technology as a Class I Renewable Energy manufactured in
Connecticut.
• Expand local property tax and state sales tax exemptions for hydrogen and fuel
cell technology, manufactured or partially manufactured (with proportional
benefit), in Connecticut.
• Support utility ownership of any fuel cell and other performance equivalent
hydrogen fueled facilities, including hydrogen (equivalent) production for
dedicated use with a fuel cell, up to 5 MW, at sites needed for voltage control,
grid security, and/or system reliability.
The Connecticut Center for Advanced Technology, Inc. © 2008 21
PART I Identification and Assessment of Market Conditions for Fuel Cell and
Hydrogen Technology
Markets for hydrogen and fuel cell technology include stationary, transportation and portable
power. It has been estimated that the global fuel cell/hydrogen market, when mature, could
generate between $43 and $139 billion annually. Revenues resulting from a mature market
for Connecticut companies could be between $14 and $54 billion annually. Market drivers
toward a mature market include growing electrical demand; electric capacity requirements;
energy reliability, security and price volatility; and reduction of greenhouse gas and primary
air pollutants. In addition, Connecticut faces near future electrical capacity gaps and pressure
to meet environmental statutory, regulatory, and administrative provisions that will further
increase market penetration at a local level.
Description of Fuel Cells and Hydrogen2
Fuel Cells
A fuel cell is a device that uses hydrogen (or a hydrogen-rich fuel) and oxygen to create an
electric current. The amount of power produced by a fuel cell depends on several factors,
including fuel cell type, cell size, operating temperature, and the pressure at which the gases
are supplied to the cell. A single fuel cell produces enough electricity for only the smallest
applications. Therefore, to provide the power needed for most applications, individual fuel
cells are combined in series into a fuel cell stack. A typical fuel cell stack may consist of
hundreds of fuel cells.
Fuel cells have the potential to replace the internal combustion engine in vehicles and provide
power for stationary and portable power applications. Fuel cells are in commercial service as
distributed generator power plants in stationary applications throughout the world, providing
electricity to power homes and businesses. Fuel cells are currently used to provide auxiliary
2 Refer to Appendix B: Comparison of Fuel Cell Technologies; The Connecticut Hydrogen-Fuel Cell Coalition, February 2006
The Connecticut Center for Advanced Technology, Inc. © 2008 22
power for manned space craft and auxiliary power and motive power for submarines. Fuel
cells are used in transportation applications, such as powering automobiles, trucks, buses,
cycles, and other vehicles. Many portable devices can be powered by fuel cells, such as
laptop computers and cell phones.
Fuel cells are cleaner and more efficient than traditional combustion-based engines and power
plants. Typically stationary fuel cell power plants are fueled with natural gas or other
hydrogen rich fuel and use a fuel reformer to deliver near pure hydrogen to the fuel cell stack
to produce an electric current. Since fuel cell technology is more efficient than combustion-
based technologies, less energy is needed to provide the same amount of power. Finally,
because hydrogen can be produced using a wide variety of resources found right here in the
United States—including natural gas, biological material, and through electrolysis of water
using electricity produced from indigenous sources—using hydrogen fuel cells can reduce
dependence on other countries for fuel.3 When pure hydrogen is used to power a fuel cell,
the only by-products are water and heat—no pollutants or greenhouse gases are produced by
the power plant itself although they may be generated in the production of hydrogen from
fossil fuels unless carbon capture and sequestration is utilized.4
Fuel cells are classified primarily by the kind of electrolyte they employ. This determines the
kind of chemical reactions that take place in the cell, the kind of catalysts required, the
temperature range in which the cell operates, the fuel required, and other factors. These
characteristics, in turn, affect the applications for which these cells are most suitable. There
are several types of fuel cells currently in use or under development, each with its own
advantages, limitations, and potential applications. These include proton exchange
membrane (PEM), direct methanol fuel cell (DMFC), alkaline fuel cell (AFC), phosphoric
acid fuel cell (PAFC), molten carbonate fuel cell (MCFC) and solid oxide fuel cell (SOFC).
3 U.S. Department of Energy 4 U.S. Department of Energy
The Connecticut Center for Advanced Technology, Inc. © 2008 23
Hydrogen
Hydrogen is the lightest and most abundant element in the universe. In its pure form
hydrogen (H2) is a colorless and odorless gas. However, since it combines easily with other
elements, hydrogen is rarely found by itself in nature and is usually found as a part of other
compounds, including fossil fuels, plant material, and water. Hydrogen is an energy carrier,
not an energy source, meaning that it stores and delivers energy in a usable form. Like
electricity, the most familiar energy carrier, it can be generated from a wide range of sources.
While hydrogen contains more energy per weight than any other energy carrier, it contains
much less energy by volume.
Hydrogen can be produced using a variety of domestic energy resources, including fossil
fuels such as coal and natural gas, renewables such as biomass, electricity from renewable
energy technologies, and thermal energy or electric power from nuclear.
Since it can be produced from several sources using various methods, hydrogen can be
produced at large generating plants and transported to users. The production of hydrogen
from fossil fuels at these large generating plants will require carbon capture and sequestration
to eliminate emissions of greenhouse gases. Hydrogen is currently transported by road via
cylinders, tube trailers, cryogenic tankers, and in pipelines. However, hydrogen pipelines
currently only exist in a few regions of the United States. Developing a more substantial
delivery infrastructure for hydrogen will require the use of high-pressure compressors for
gaseous hydrogen and liquefaction for cryogenic hydrogen. Both currently have significant
capital and operating costs, and energy inefficiencies.
Hydrogen can also be produced locally, using small electrolysis systems or natural gas
reformers, possibly at refueling stations, eliminating the need for long-distance transport, or
potentially on-board vehicles by reforming conventional fuels. Local generation from
hydrocarbon fuels would probably not be able to reduce greenhouse gases by employing
carbon capture and sequestration.
The Connecticut Center for Advanced Technology, Inc. © 2008 24
Hydrogen may be stored as a liquid, a high pressure gas, or by advanced physical or chemical
methods; all are under intense development to meet goals associated with hydrogen fueled
vehicles. Improvements to hydrogen storage may reduce costs and energy losses associated
with storage and distribution.
Global Market Analysis
Worldwide government spending for fuel cell and hydrogen infrastructure approached $1.5
billion in 2004.5,6 As the world’s largest energy consumer, the United States has a
particularly compelling need for this technology. The consensus of economists seems to be
that we will reach “a watershed moment” in our use of energy “in our lifetime.”7
From a global prospective, fuel cell technology has been recognized as an asset to improve
environmental performance and reduce use of non-renewable natural resources. Fuel cells
can provide distributed power, heat, and water from natural gas or renewable fuels such as
waste water treatment gas or land-fill gas with the greatest efficiency and lowest
environmental emissions yet achieved.8 With a broad range of potential applications, fuel
cell technology is a prime example of a transformative technology. Existing and emerging
markets for fuel cells and hydrogen technology include: stationary power/distributed
generation, portable power for handheld electronics, and transportation. While the global
market focus is relatively diverse, stationary power applications account for approximately 40
percent of the market involved in such applications (small stationary applications of 50 kW or
less at 24 percent, and large stationary applications greater than 50 kW at 16 percent). Other
markets include portable power generation at 18 percent, and transportation at 42 percent,
including vehicle drive (17 percent), fueling infrastructure (14 percent), and auxiliary power
units (APUs) for vehicles (11 percent).9
5 “Fuel Cell Industry Report”, May 2005, P. 12 6 “World Fuel Cells Study’, Freedonia Group, Cleveland, OH, July 2003 7 “The End of Cheap Oil”, National Geographic, 205, 6, 2004, 80 8 For more detailed information regarding fuel cells and hydrogen, see Part III 9 U.S. Fuel Cell Council; “2006 Worldwide Fuel Cell Industry Survey”
The Connecticut Center for Advanced Technology, Inc. © 2008 25
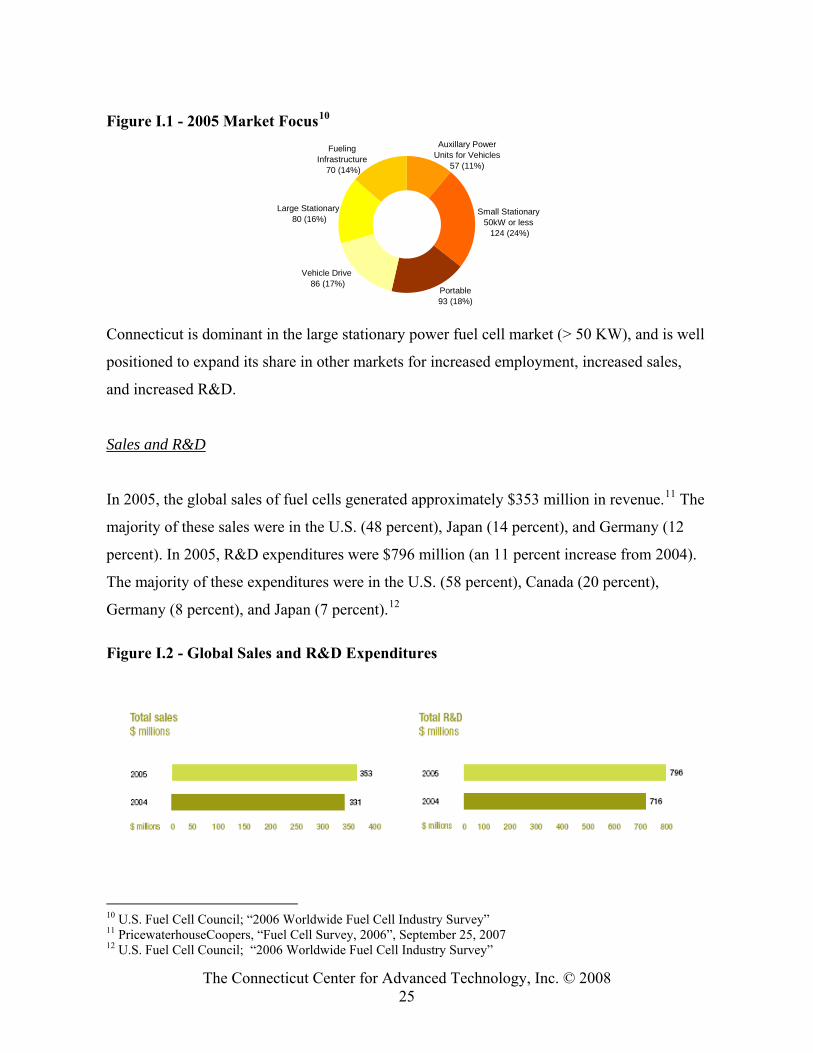
Figure I.1 - 2005 Market Focus10
Vehicle Drive 86 (17%)
Large Stationary 80 (16%)
Fueling Infrastructure
70 (14%)
Portable 93 (18%)
Auxillary Power Units for Vehicles
57 (11%)
Small Stationary 50kW or less 124 (24%)
Connecticut is dominant in the large stationary power fuel cell market (> 50 KW), and is well
positioned to expand its share in other markets for increased employment, increased sales,
and increased R&D.
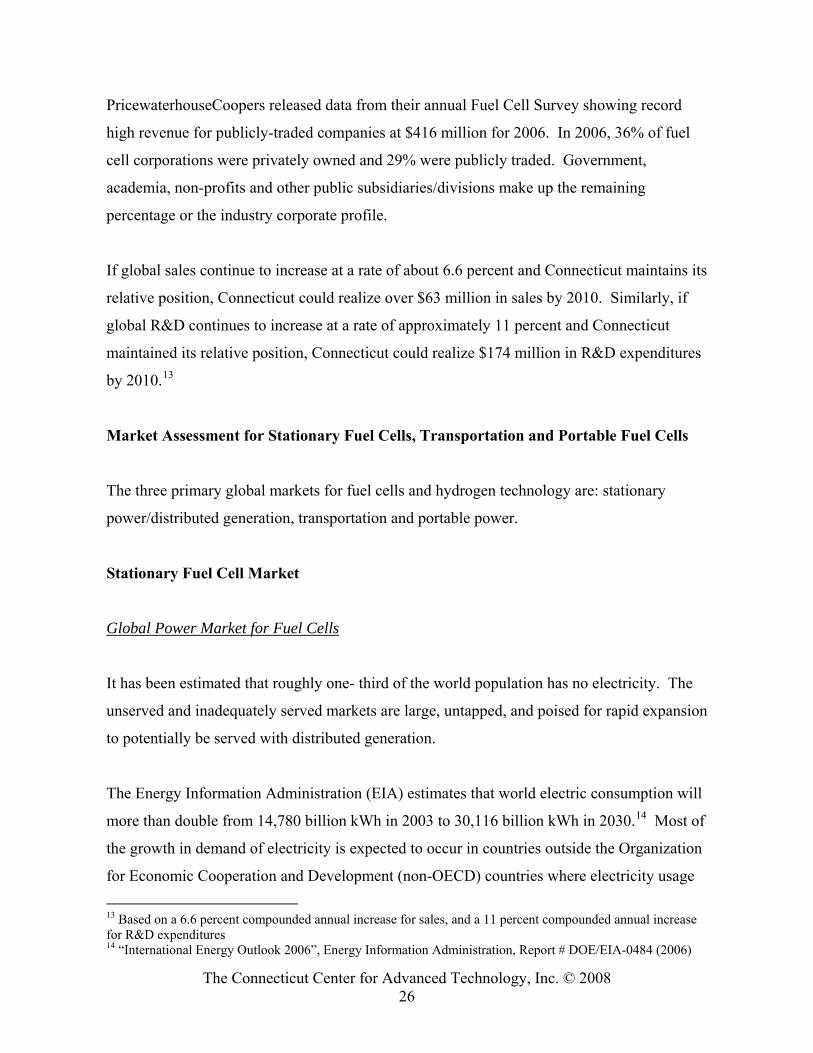
Sales and R&D
In 2005, the global sales of fuel cells generated approximately $353 million in revenue.11 The
majority of these sales were in the U.S. (48 percent), Japan (14 percent), and Germany (12
percent). In 2005, R&D expenditures were $796 million (an 11 percent increase from 2004).
The majority of these expenditures were in the U.S. (58 percent), Canada (20 percent),
Germany (8 percent), and Japan (7 percent).12
Figure I.2 - Global Sales and R&D Expenditures
10 U.S. Fuel Cell Council; “2006 Worldwide Fuel Cell Industry Survey” 11 PricewaterhouseCoopers, “Fuel Cell Survey, 2006”, September 25, 2007 12 U.S. Fuel Cell Council; “2006 Worldwide Fuel Cell Industry Survey”
The Connecticut Center for Advanced Technology, Inc. © 2008 26
PricewaterhouseCoopers released data from their annual Fuel Cell Survey showing record
high revenue for publicly-traded companies at $416 million for 2006. In 2006, 36% of fuel
cell corporations were privately owned and 29% were publicly traded. Government,
academia, non-profits and other public subsidiaries/divisions make up the remaining
percentage or the industry corporate profile.
If global sales continue to increase at a rate of about 6.6 percent and Connecticut maintains its
relative position, Connecticut could realize over $63 million in sales by 2010. Similarly, if
global R&D continues to increase at a rate of approximately 11 percent and Connecticut
maintained its relative position, Connecticut could realize $174 million in R&D expenditures
by 2010.13
Market Assessment for Stationary Fuel Cells, Transportation and Portable Fuel Cells
The three primary global markets for fuel cells and hydrogen technology are: stationary
power/distributed generation, transportation and portable power.
Stationary Fuel Cell Market
Global Power Market for Fuel Cells
It has been estimated that roughly one- third of the world population has no electricity. The
unserved and inadequately served markets are large, untapped, and poised for rapid expansion
to potentially be served with distributed generation.
The Energy Information Administration (EIA) estimates that world electric consumption will
more than double from 14,780 billion kWh in 2003 to 30,116 billion kWh in 2030.14 Most of
the growth in demand of electricity is expected to occur in countries outside the Organization
for Economic Cooperation and Development (non-OECD) countries where electricity usage
13 Based on a 6.6 percent compounded annual increase for sales, and a 11 percent compounded annual increase for R&D expenditures 14 “International Energy Outlook 2006”, Energy Information Administration, Report # DOE/EIA-0484 (2006)
The Connecticut Center for Advanced Technology, Inc. © 2008 27
is expected to grow at 3.9 percent per year as compared to 1.5 percent in OECD countries.15
All primary energy sources are expected to grow worldwide with coal and natural gas to
remain the most important fuels for electricity generation. However, total renewable
generation, including combined heat and power (CHP) and end-use generation, is projected to
grow by 1.5 percent per year, from 357 billion kWh in 2005 to 519 billion kWh in 2030.16 In
a 2006 survey conducted by World Alliance for Decentralized Energy (WADE), the share of
decentralized power generation in the world market increased to 7.2 percent by 2004, up from
7 percent in 2002.17 In addition, areas that are currently served with adequate supplies are
poised to expand to meet new demand and to replace some baseload supplies with distributed
generation. Consequently, there are expectations that substantial new electric generation will
be needed. While some of the capacity additions may come from centralized power plants,
the share of distributed generation in the overall mix is expected to increase. These
projections and surveys suggest a transition from a central power model to a ‘hybrid’ model
that includes central as well as distributed generation with CHP is underway, though slowly.
This 2006 survey also notes that there was a surge in distribution generation development
during 2005, with its share in new power generation addition at around 25 percent, up from
13 percent four years ago. While there are several market drivers for CHP distributed
generation, the main drivers include the demand for reliable energy associated with increased
use of electro-technology such as lighting, motors, and computers. Further, there is growing
realization that fuel prices are going to remain high thereby necessitating more efficient
solutions, such as CHP, to meet the ever growing demand for electricity. Other possible
benefits of CHP distributed generation, besides provision of on-site electricity and thermal
energy, include potential long-term energy price reduction, on-site supply stability with
improved power quality, lower water usage, emission reductions, and customer control of
energy with increased energy independence. There is also an increasing awareness on the
15 “International Energy Outlook 2006”, Energy Information Administration, Report # DOE/EIA-0484 (2006) 16 U.S. Department of Energy, “Annual Energy Outlook 2007 with Projections to 2030”; Report #:DOE/EIA-0383(2007); February 2007 17 “World Survey of Decentralized Energy 2006”, World Alliance of Decentralized Energy, May 2006; WADE is an organization that has more than 200 members worldwide. The members include distribution generation organizations, providers, governments, etc. The survey quoted here consists of direct inputs from WADE members
The Connecticut Center for Advanced Technology, Inc. © 2008 28
part of consumers and policymakers that distributed generation presents a viable component
of electric supply that can complement transmission and distribution (T&D) systems.
Global CHP Distributed Generation Market Drivers
In developing countries, the grid is often either unreliable or non-existent and those
governments do not have the resources to address the situation. As a result, a large number of
countries have mandates, initiatives or incentives to promote distributed generation.
Although it will take some time to take effect, the future of CHP distributed generation
worldwide is quite promising with the impetus for CHP distributed generation coming from:
• market demand and regulatory requirements to conserve energy resources and
reduce emissions through efficient CHP distributed generation applications;
• market demand for reliable power in developing countries where T&D systems
are constrained or inadequate;
• market demand for extremely reliable on-site electric and thermal power for
critical loads at commercial, industrial, communication, government, and public
health care facilities; and
• technical constraints and site situations where placement of new transmission and
distribution facilities is constrained by overall cost, land availability, public
opposition, etc.
U.S. CHP Distributed Generation Market Drivers
In the U.S. and the rest of the developed world that have well developed generation and T&D
infrastructure and an adequate electricity supply, the impetus for distributed generation comes
from:
• a need for extremely reliable power for critical commercial, industrial, communication
and health care facilities;
• opportunities to conserve resources and reduce emissions through distributed generation
in combined heat and power applications; and
The Connecticut Center for Advanced Technology, Inc. © 2008 29
• specific situations where placement of new transmission and distribution facilities is
constrained by land availability, public opposition, etc.
“The total distributed generation market in the U.S. between 2010 and 2020 is likely to be
35,000 MW. While much of this capacity will be based on gas turbines, fuel cells could
capture almost 20% of capacity.”18 The distributed generation goal pursued by the
Distributed Energy Office of the Department of Energy (DOE) is that 20 percent of all new
commercial building generating capacity additions be from distributed generation sources by
2020.19 There are a number of states, Connecticut being one of the most progressive in this
respect, who have introduced various incentives to promote distributed generation. These
incentives include capital grants for customer-side applications, property and sales tax
exemptions, on-site renewable distributed generation incentives, and streamlined siting
provisions. As a technology favored because of its increased efficiency, CHP distributed
generation will be the favored application except at low load factor applications established
for emergency backup supply.
Connecticut CHP Distributed Generation Market Drivers
The technical potential for CHP in Connecticut has been estimated at 1,673.2 MW consisting
of 981.2 MW from commercial/institutional CHP applications and 692 MW for industrial
CHP applications. This estimate assumes relatively coincident electric and thermal loads,
thermal energy loads in the form of steam or hot water, electric demand to thermal demand
ratios in the 0.5 to 2.5 range, and moderate to high operating hours greater than 4,000 hours
per year. As shown below, an accelerated market penetration of 503.6 MW has been
estimated for CHP potential in Connecticut to year 2014 assuming a 2 percent/year gradual
reduction in CHP cost, a 50 percent reduction of standby charges, a 10 percent reduction of
capital costs through implementation of incentive programs (buy downs, tax credits,
accelerated depreciation), payment of a $186/kW demand response capacity payment during 18 “The Future of Distributed Power Generation: New Technologies, Changing Economics and the Impact of Fuel Cells”, Business Insights, October 2007, http://www.researchandmarkets.com/reportinfo.asp?report_id=571659&t=d&cat_id= 19 “Distributed Generation Potential of the U.S. Commercial Sector”, Ernest Orlando Lawrence Berkeley Laboratory, May 2005, http://eetd.lbl.gov/ea/EMS/EMS_pubs.html
The Connecticut Center for Advanced Technology, Inc. © 2008 30
peak use summer months, and a higher market response rate to reflect more developers in the
marketplace and greater level of customer awareness. Use of advanced technology with lower
capital costs, higher efficiency, and lower operation and maintenance (O&M) costs increases
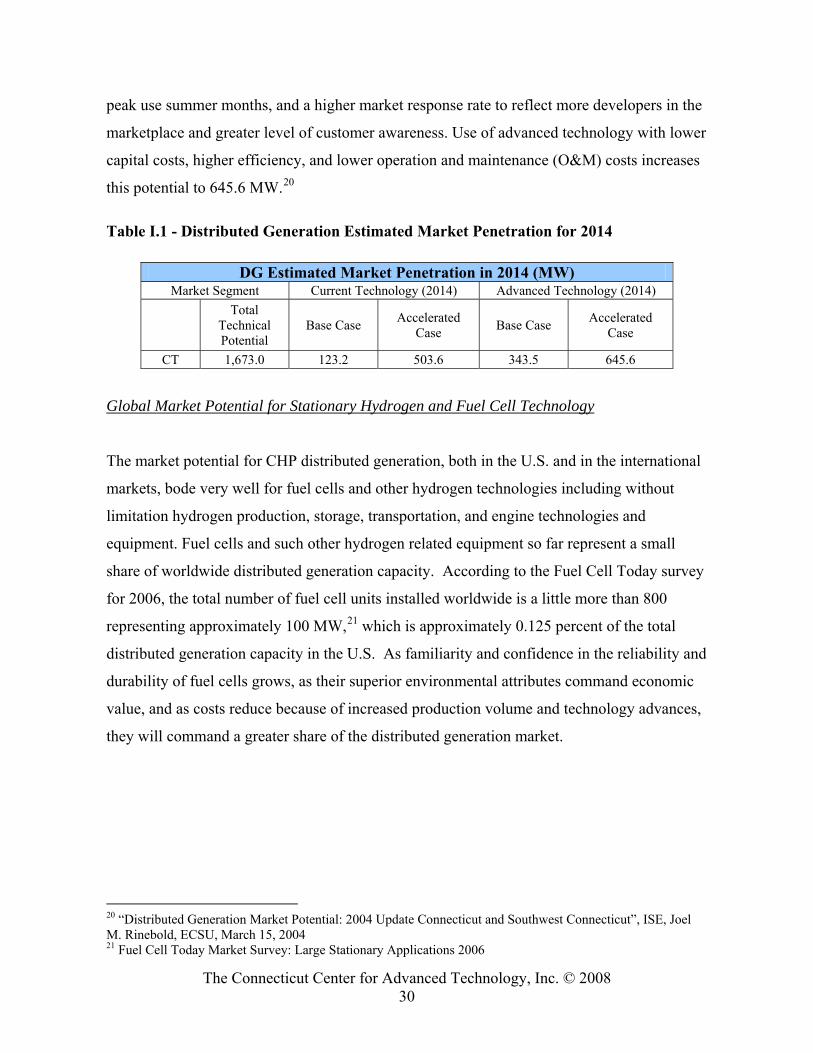
this potential to 645.6 MW.20
Table I.1 - Distributed Generation Estimated Market Penetration for 2014
DG Estimated Market Penetration in 2014 (MW) Market Segment Current Technology (2014) Advanced Technology (2014)
Total
Technical Potential
Base Case Accelerated Case Base Case Accelerated
Case
CT 1,673.0 123.2 503.6 343.5 645.6
Global Market Potential for Stationary Hydrogen and Fuel Cell Technology
The market potential for CHP distributed generation, both in the U.S. and in the international
markets, bode very well for fuel cells and other hydrogen technologies including without
limitation hydrogen production, storage, transportation, and engine technologies and
equipment. Fuel cells and such other hydrogen related equipment so far represent a small
share of worldwide distributed generation capacity. According to the Fuel Cell Today survey
for 2006, the total number of fuel cell units installed worldwide is a little more than 800
representing approximately 100 MW,21 which is approximately 0.125 percent of the total
distributed generation capacity in the U.S. As familiarity and confidence in the reliability and
durability of fuel cells grows, as their superior environmental attributes command economic
value, and as costs reduce because of increased production volume and technology advances,
they will command a greater share of the distributed generation market.
20 “Distributed Generation Market Potential: 2004 Update Connecticut and Southwest Connecticut”, ISE, Joel M. Rinebold, ECSU, March 15, 2004 21 Fuel Cell Today Market Survey: Large Stationary Applications 2006
The Connecticut Center for Advanced Technology, Inc. © 2008 31
The growth in global electric energy consumption over the period 2003 to 2030, if delivered
at a load factor22 of 0.6, requires a generating capacity addition of 2,918 GW. If, as WADE
predicts, 25 percent of this additional capacity is distributed generation, the annual distributed
generation capacity additions will average 27 GW per year or 27,019 MW per year. If fuel
cell attributes permit the capture of 25 percent of the distributed generation market at an
assumed price of $2,000/kW for units greater than 200 kW and if Connecticut companies
capture in excess of 75 percent of the stationary fuel cell market for units greater than 200
kW, revenues to Connecticut companies could be approximately $10.1 billion per year when
the distributed fuel cell market matures.23 If it is assumed that an additional 6.7 GW24 of fuel
cells are deployed annually to offset retirements of older fossil fuel units, the revenues to
Connecticut companies could exceed an additional $13.4 billion per year.
Transportation Fuel Cell Market
Nearly all cars and trucks run on gasoline or diesel, and they are the main reason why the
U.S. imports more than 55 percent of the oil it consumes (this consumption of oil is expected
to grow to more than 68 percent by 2025). Two-thirds of the 20 million barrels of oil
Americans use each day is used for transportation.25 The combustion of fossil fuels is a
significant contributor of air pollution. Reducing the dependence of oil and improving
environmental performance are two of the main reasons why there is a substantial opportunity
for the application of fuel cell technologies for transportation.
The following table of transportation statistics is the basis for estimating the market for fuel
cells in transportation:
22 Load factor is the ratio of the average load to peak load during a specified time interval. Load factor is an indication of efficient energy use 23Connecticut companies currently employ about 13% of the global fuel cell workforce and approximately 95% for large (200 kW or greater) stationary fuel cell sector 24 Assuming 40 year retirement/replacement schedule applied to 5,731 GW of estimated capacity needed to meet projected demand 25 http://www.hydrogen.gov
The Connecticut Center for Advanced Technology, Inc. © 2008 32
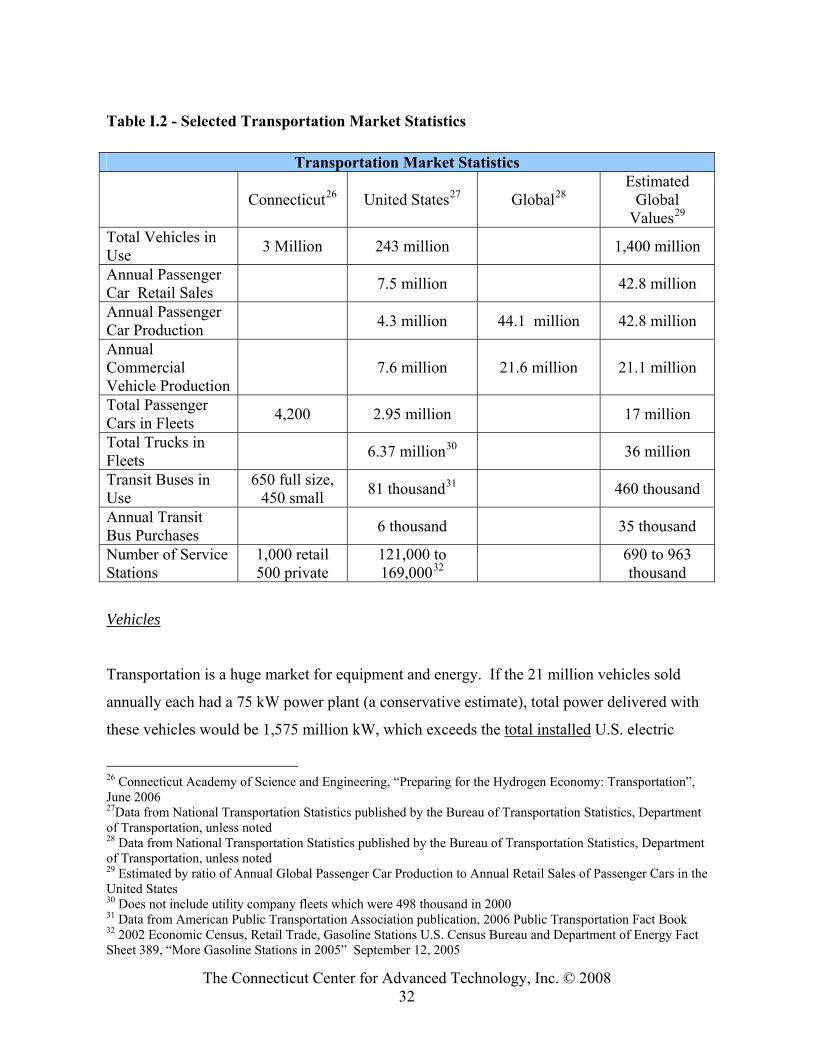
Table I.2 - Selected Transportation Market Statistics
Transportation Market Statistics
Connecticut26 United States27 Global28 Estimated
Global Values29
Total Vehicles in Use 3 Million 243 million 1,400 million
Annual Passenger Car Retail Sales
7.5 million 42.8 million
Annual Passenger Car Production
4.3 million 44.1 million 42.8 million
Annual Commercial Vehicle Production
7.6 million 21.6 million 21.1 million
Total Passenger Cars in Fleets 4,200 2.95 million 17 million
Total Trucks in Fleets
6.37 million30 36 million
Transit Buses in Use
650 full size, 450 small 81 thousand31 460 thousand
Annual Transit Bus Purchases
6 thousand 35 thousand
Number of Service Stations
1,000 retail 500 private
121,000 to 169,00032 690 to 963
thousand
Vehicles
Transportation is a huge market for equipment and energy. If the 21 million vehicles sold
annually each had a 75 kW power plant (a conservative estimate), total power delivered with
these vehicles would be 1,575 million kW, which exceeds the total installed U.S. electric
26 Connecticut Academy of Science and Engineering, “Preparing for the Hydrogen Economy: Transportation”, June 2006 27Data from National Transportation Statistics published by the Bureau of Transportation Statistics, Department of Transportation, unless noted 28 Data from National Transportation Statistics published by the Bureau of Transportation Statistics, Department of Transportation, unless noted 29 Estimated by ratio of Annual Global Passenger Car Production to Annual Retail Sales of Passenger Cars in the United States 30 Does not include utility company fleets which were 498 thousand in 2000 31 Data from American Public Transportation Association publication, 2006 Public Transportation Fact Book 32 2002 Economic Census, Retail Trade, Gasoline Stations U.S. Census Bureau and Department of Energy Fact Sheet 389, “More Gasoline Stations in 2005” September 12, 2005
The Connecticut Center for Advanced Technology, Inc. © 2008 33
generating capacity of 968 million kW. The business opportunity associated with supplying
fuel for transportation is also huge. International opportunities add to the opportunity in the
U.S.
An estimate of the total global revenues from fuel cells and hydrogen generating equipment
was made based on a number of assumptions. Many of these assumptions require further
analysis during the balance of this effort to check them against the range of assumptions by
others. However, it was judged reasonable to make an initial estimate to provide a rough
estimate of the economic impact of hydrogen and fuel cell transportation on Connecticut.
The estimate below was constructed with the following information and rationale:
• Officials of the Federal Transit Administration have a goal that fuel cell transit buses
will represent 10 percent of purchases by 2015.33
• Automakers and energy companies project initial sales of hydrogen fuel cell vehicles
in the period 2010 to 2020. Shell projects 50 percent of new auto purchases will be
fuel cell cars by 2040.34
• Fleet vehicles represent the best opportunity for early application because hydrogen
supply infrastructure is simplified.
• Penetration of automobiles will range from 5 percent to 50 percent and penetration of
heavy duty vehicles will range from 5 percent to 20 percent in the mature model year.
• The U.S. Department of Energy’s (DOE) goal for fuel cell cost in 2015 is $30 per
kW.35 The assumption is that an automobile fuel cell will be rated at 75 kW and
heavy duty vehicle fuel cells will be rated at 150 kW.
• Hydrogen refueling stations with either reformers or electrolyzers will cost between
$0.25 and $0.5 million per station based on interpretation of estimates.36
33 Sisson, Barbara A. “Hydrogen and Fuel Cell Bus Initiative, Paving the Way Nationally and Internationally”, U.S. Department of Transportation, Federal Transit Administration 34 “Preparing for the Hydrogen Economy”: Transportation Report by The Connecticut Academy of Science and Engineering for The Connecticut Department of Transportation, June 2006 35 U.S. Department of Energy; Hydrogen, Fuel Cells and Infrastructure Technologies Multi-Year Program Research, Development and Demonstration Plan for 2003-2010, February 2005 36 “A Near-Term Economic Analysis of Hydrogen Fueling Stations” Jonathan Weinert, Institute of Transportation Studies, University of California, Davis UCD-ITS-05-04, 2005
The Connecticut Center for Advanced Technology, Inc. © 2008 34
• Ultimately, 5 to 20 percent of the global filling stations will provide hydrogen fuel
over the next twenty years.
Based on these assumptions, the potential market for fuel cell technology in passenger
vehicles range from 2.1 to 21 million cars per year with total delivered fuel cell capacity
between 150 GW and 1,500 GW, and total fuel cell revenues between $4.5 and $45 billion.
The potential market for heavy duty vehicles range from 1 to 4 million vehicles per year with
total delivered fuel cell capacity between 150 GW and 600 GW. Assuming a power plant cost
of $75 per kW, total global fuel cell revenues could be between $11 and $45 billion annually.
Since Connecticut companies face significant competition for fuel cells used in the passenger
vehicle sector, it seems reasonable to assume their market share would be 10 to 20 percent or
between $0.5 and $9 billion, annually. There is less competition for the heavy-duty vehicle
market; consequently, Connecticut companies’ share could be 20 to 40 percent or between $2
and $18 billion, annually.
Service/Off-Road Vehicles
The U.S. Department of Energy (DOE) sponsored a study of early markets for hydrogen-
fueled PEM fuel cells.37 In the fork lift truck market, powering lift trucks, particularly in
multi-shift, high throughput distribution center applications currently involves battery
powered trucks, which require devoting significant space and capital to extra batteries being
charged, loss of productivity when the batteries are changed out each shift and issues
associated with disposal of batteries which contain hazardous waste. Hydrogen-fueled fuel
cell power would eliminate many of these issues, or reduce costs to be economically viable in
the near term. It is estimated that this annual market, 20 years after market entry, would
involve about 800,000 power plants per year with a total capacity of 800 MW. The estimated
cost of the trucks may be as much as $2 billion per year for the vehicles, with about half that
37 “Identification and Characterization of Near-Term Direct Hydrogen Proton Exchange Membrane Fuel Cell Markets”, DOE Contract DE-FC#36-03GO13110 by K Mahadevan, et al. of Battelle, April 2007
The Connecticut Center for Advanced Technology, Inc. © 2008 35
value being for the fuel cell power plants.38 Other markets for fuel cells in service/off-road
vehicles include airport ground support equipment, golf carts, mining vehicles, wheel chairs
and construction vehicles. An initial subsidy to reduce costs and expand the use of fuel cell
technology for these applications will accelerate market penetration significantly. If
Connecticut companies could capture approximately 15 percent share of this projected
market, revenues to Connecticut companies would be approximately $150 million, annually.
Auxiliary Power Units
The potential market for service/off-road vehicles and auxiliary power for on-road vehicles
are smaller markets than the market for motive power in buses, other fleet vehicles and
automobiles, but they may have earlier economic and technical feasibility and may be an
important early commercial deployment opportunity. There are a number of vehicle auxiliary
power applications including power for the sleeper cabs of over-the-road trucks, recreational
vehicles, luxury automobiles, etc. An assessment of this market was presented at the 2003
Annual Meeting of the Transportation Research Board.39 The advantages of fuel cells in this
market segment include: reduced noise, reduced pollution and reduced wear and tear on the
primary vehicle power plant. Many line-haul trucks generate power for sleeper cabs by idling
the main engine when at rest stops, which is prohibited in some states. The alternative is to
connect to ground power at the rest stop or to have an on-board auxiliary generator. The total
annual production of vehicles for this market is estimated at 2.3 million vehicles including 1.5
million luxury passenger vehicles with contractor pick-up trucks, recreational vehicles, and
line-haul heavy duty trucks representing over a half million vehicles.40 In addition, there are a
large number of refrigerated trailers requiring auxiliary generation when stopped, whose
small motors have recently been found to be out of compliance by California emission
regulators. Since these vehicles require 3 to 5 kW, the total annual market would be for 5 to
38 “Identification and Characterization of Near-Term Direct Hydrogen Proton Exchange Membrane Fuel Cell Markets”, DOE Contract DE-FC#36-03GO13110 by K Mahadevan, et al. of Battelle, April 2007 39 “Markets for Fuel Cell Auxiliary Power Units in Vehicles, a Preliminary Assessment” by Nicholas Lutseyet al of the Institute for Transportation Studies at University of California, Davis, presented to 2003 Annual Meeting of Transportation Research Board 40 “Markets for Fuel Cell Auxiliary Power Units in Vehicles, a Preliminary Assessment” by Nicholas Lutsey et al. of the Institute for Transportation Studies at University of California, Davis, presented to 2003 Annual Meeting of Transportation Research Board
The Connecticut Center for Advanced Technology, Inc. © 2008 36
10 million kilowatts. The portion of this market most suited to fuel cells is probably about a
quarter million vehicles with a total fuel cell capacity of 1,250 MW and a fuel cell market
value of about $625 million at a fuel cell power plant cost of $500 per kW. While hydrogen
fuel can be considered for much of this market, operation on traditional fuels would be
attractive through on-board reforming. If Connecticut companies could capture
approximately 15 percent share of this projected market, revenues to Connecticut companies
would be approximately $94 million, annually.
Filling Stations
The potential market for filling stations, with the assumptions noted above, would result in
1,700 to 10,000 stations being implemented each year, and revenues from hydrogen
generating equipment in these stations resulting in $0.5 to $5 billion dollars to the
manufacturers of electrolysis or reformer equipment. If Connecticut companies gain between
10 and 25 percent of these revenues, the revenue flow to Connecticut companies would range
between $50 million and $1.25 billion annually.
Generally the lower end of the ranges of impact described above are associated with more
success in alternative technologies to fuel cells and hydrogen, less aggressive promotion in
the form of government incentives, and failure to achieve the objectives of fuel cell
development programs. The higher end of the range is associated with opposite results for
each of these factors.
Portable Power Fuel Cell Market
Fuel cells have the potential to become an important source of power for the ever-growing
number of mobile electronic devices. Recent advances in electronics technology, particularly
as mobile phones and laptop computers merge to provide users with broadband wireless and
multifunctional portable computing capability, will require manufacturers to seek power
sources that have greater energy densities than the lithium-ion (Li-ion) or nickel-based
batteries in use today. In the year 2000, the total energy usage for personal electronic devices
The Connecticut Center for Advanced Technology, Inc. © 2008 37
was 3,500 watt-hours (Wh). By the year 2010, this annual energy requirement is predicted to
jump to 10,500+ Wh with power requirements ranging from 0.5 to 20 watts.41
Miniaturized fuel cells, using a liquid methanol fuel, show promise in meeting these new
energy density requirements. The main advantages of fuel cells over battery systems include
long run-times, high energy density and storage that allow portable electronic devices to
function for longer periods than those with batteries. Beyond increased operating times, fuel
cells also provide reduced weight, and an increased ease of recharging, potentially offering
greater consumer appeal than batteries. One very specific advantage of fuel cells over
batteries is the decoupling of energy stored from peak power delivered. This allows the fuel
cell to be sized to a given application more easily than a battery system offering the consumer
reduced size and weight.42
Energy dense fuel cells offer the potential to meet the new power and energy demands for
mobile phones, laptop computers, palm pilots, power tools, personal pagers, and other remote
devices including hearing aids, hotel door locks, smoke detectors, and meter readers.43 Some
estimate that the overall market for portable fuel cells in such electronics will mirror that of
battery systems that presently have a 40 percent per year growth rate and a current annual
market size in excess of $10 billion.44 Other market opportunities exist for the development
and manufacture of fueling cartridges and connectors. Allied Business Intelligence, a market
research company that tracks new technology, estimates that portable fuel cells will reach
annual unit sales of $200 million to $500 million by 2011.
Current market participants include fuel cell developers such as Giner Electrochemical
Systems, Lynntech Industries, Manhattan Scientific, and MTI Micro Fuel Cells; aerospace
integrators such as Ball Aerospace; and well-known electronics participants including Casio,
41 Pavio, J., Hallmark, J., Bostaph, J., Fisher, A., Mylan, B., Xie, C.G., “Developing Fuel Cells for Wireless Communication”, Fuel Cells Bulletin, Volume 2002, Issue 04, April 2002, Pages 8-11 42 Cropper, M., Geiger, S., Jollie, D., “Fuel Cells: A Survey of Current Developments”, Journal of Power Sources, 131 (2004) 57-61 43 Feder, B.J. (March 16, 2003). “For Smaller Fuel Cells, A Far Shorter Wait” Available Online: NYTimes.com 44 Dyer, C.K., “Fuel Cells for Portable Power Applications”, Journal of Power Sources, 106 (2002) 31-34
The Connecticut Center for Advanced Technology, Inc. © 2008 38
Samsung, Hitachi, Motorola, and Toshiba.45 Many of these companies are making substantial
financial commitments to commercializing these small fuel cell systems. As an example,
Hitachi is planning to commercialize a methanol-powered fuel cell for use in electronic
devices according to Japanese news reports. Hitachi’s plans to take the fuel cells to market
resulted in the establishment of facilities to produce between 2,000 and 3,000 methanol fuel
cells a month.
Sales are anticipated to be $510 million worldwide by 2008 with 145 million units in sales by
2010. By 2013, micro fuel cell markets are expected to reach $11 billion. This represents a
range of PC, mobile phones, personal digital assistants (PDA), and digital device segments in
a variety of industry, military and healthcare segments.46
It has been projected that the number of jobs created in the portable fuel cell sector for the
year 2021 could range from 2,973 to 3,063 direct jobs.47 Although Connecticut does not
currently have companies which manufacture portable fuel cells and only limited activity in
the component supply chain for portable technology, it is estimated that if Connecticut
maintains its current relative position of all global jobs related to fuel cells and hydrogen,48,49
approximately 386 jobs will be based in Connecticut by the end of the next decade.
At the present time, no U.S. company has committed to volume production of DMFC fuel
cells, although micro fuel cells have a window of opportunity to start manufacture in the
United States.50
Summary of Potential Markets
A summary of the mature annual markets for hydrogen and fuel cell technology in stationary,
transportation and portable electronics is provided in the table below. These market estimates 45 Apanel, G., Johnson, E., “Direct Methanol Fuel Cells – Ready to go Commercial?” 46 Kamarudin, S., Daud, W., Ho, S., Hasran, U., “Overview on the Challenges and Developments of Micro-Direct Methanol Fuel Cells (DMFC)”, Journal of Power Sources, Article in Press, 2006 47 Breakthrough Technologies Estimates for the Year 2021 48 New Haven Register, June 20, 2004 49 Fairfield County Business Journal, May 31, 2004 50 National Institute of Standards and Technology; ATP Working Paper Series Working Paper 05–01
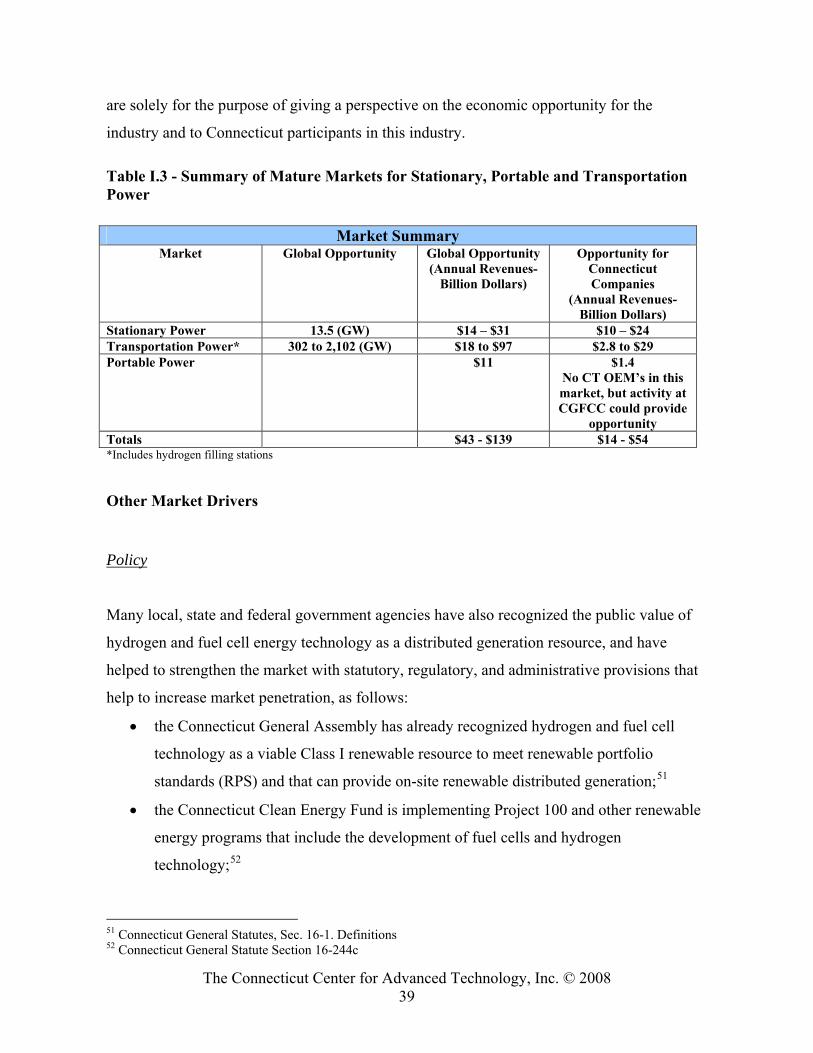
The Connecticut Center for Advanced Technology, Inc. © 2008 39
are solely for the purpose of giving a perspective on the economic opportunity for the
industry and to Connecticut participants in this industry.
Table I.3 - Summary of Mature Markets for Stationary, Portable and Transportation Power
Market Summary Market Global Opportunity
Global Opportunity (Annual Revenues-
Billion Dollars)
Opportunity for Connecticut Companies
(Annual Revenues-Billion Dollars)
Stationary Power 13.5 (GW) $14 – $31 $10 – $24 Transportation Power* 302 to 2,102 (GW) $18 to $97 $2.8 to $29 Portable Power $11 $1.4
No CT OEM’s in this market, but activity at CGFCC could provide
opportunity Totals $43 - $139 $14 - $54 *Includes hydrogen filling stations
Other Market Drivers
Policy
Many local, state and federal government agencies have also recognized the public value of
hydrogen and fuel cell energy technology as a distributed generation resource, and have
helped to strengthen the market with statutory, regulatory, and administrative provisions that
help to increase market penetration, as follows:
• the Connecticut General Assembly has already recognized hydrogen and fuel cell
technology as a viable Class I renewable resource to meet renewable portfolio
standards (RPS) and that can provide on-site renewable distributed generation;51
• the Connecticut Clean Energy Fund is implementing Project 100 and other renewable
energy programs that include the development of fuel cells and hydrogen
technology;52
51 Connecticut General Statutes, Sec. 16-1. Definitions 52 Connecticut General Statute Section 16-244c
The Connecticut Center for Advanced Technology, Inc. © 2008 40
• the Governor’s commitment to the Regional Greenhouse Gas Initiative (RGGI) to
reduce greenhouse gas emissions.53 The RGGI agreement will stabilize carbon
dioxide emissions from the region’s power plants at current levels from 2009 to 2015.
This will be followed by a 10 percent reduction in emissions by 2019;54
• the Governor’s “Connecticut’s Energy Vision for a Cleaner, Greener State” which
includes an initiative for “Advance Development of Connecticut’s Hydrogen
Economy”; and
• other state and local agencies have engaged in the siting of fuel cell technology, with
some of the siting processes streamlined for accelerated development based on
community support.55
With strategic guidance, applications using hydrogen and fuel cell technology would meet the
functional energy needs of the state to improve efficiency, reduce consumption of fuel, and
improve the environmental profile for energy production. Identified energy benefit drivers
from use of fuel cells and hydrogen technology would also include:
• clean and nearly emission free operation;
• ease of siting and regulatory approval for facility development;
• efficient operation that will conserve on fuel costs and can reduce the import of
foreign oil;
• flexibility to act as a bridge that can lead to widespread use of renewable fuels,
including methane or ethanol from biomass, and hydrogen produced by solar
and wind energy;
• improved reliability with uninterrupted power to critical load centers without
the need to build and rely on electric transmission lines; and
• operation that can reduce Federally Mandated Congestion Charges.
53 Connecticut Climate Change Initiative- http://ctclimatechange.com/index.html 54 Governor Rell Press Release, “Governor Rell Says Conn. Taking Critical Steps on Energy Independence and Environmental Protection”, http://www.ct.gov/governorrell/cwp/view.asp?Q=307886&A=1761, December 20, 2005 55 Connecticut General Statute Section 16-50k
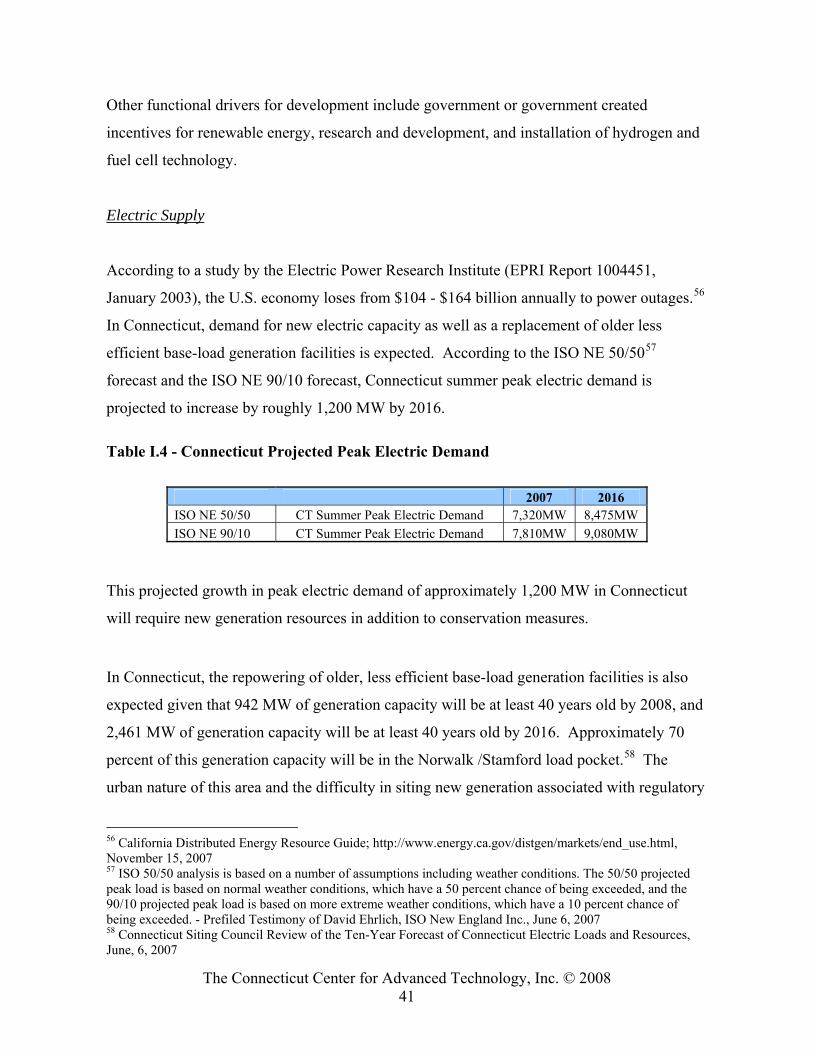
The Connecticut Center for Advanced Technology, Inc. © 2008 41
Other functional drivers for development include government or government created
incentives for renewable energy, research and development, and installation of hydrogen and
fuel cell technology.
Electric Supply
According to a study by the Electric Power Research Institute (EPRI Report 1004451,
January 2003), the U.S. economy loses from $104 - $164 billion annually to power outages.56
In Connecticut, demand for new electric capacity as well as a replacement of older less
efficient base-load generation facilities is expected. According to the ISO NE 50/5057
forecast and the ISO NE 90/10 forecast, Connecticut summer peak electric demand is
projected to increase by roughly 1,200 MW by 2016.
Table I.4 - Connecticut Projected Peak Electric Demand
This projected growth in peak electric demand of approximately 1,200 MW in Connecticut
will require new generation resources in addition to conservation measures.
In Connecticut, the repowering of older, less efficient base-load generation facilities is also
expected given that 942 MW of generation capacity will be at least 40 years old by 2008, and
2,461 MW of generation capacity will be at least 40 years old by 2016. Approximately 70
percent of this generation capacity will be in the Norwalk /Stamford load pocket.58 The
urban nature of this area and the difficulty in siting new generation associated with regulatory
56 California Distributed Energy Resource Guide; http://www.energy.ca.gov/distgen/markets/end_use.html, November 15, 2007 57 ISO 50/50 analysis is based on a number of assumptions including weather conditions. The 50/50 projected peak load is based on normal weather conditions, which have a 50 percent chance of being exceeded, and the 90/10 projected peak load is based on more extreme weather conditions, which have a 10 percent chance of being exceeded. - Prefiled Testimony of David Ehrlich, ISO New England Inc., June 6, 2007 58 Connecticut Siting Council Review of the Ten-Year Forecast of Connecticut Electric Loads and Resources, June, 6, 2007
2007 2016 ISO NE 50/50 CT Summer Peak Electric Demand 7,320MW 8,475MW ISO NE 90/10 CT Summer Peak Electric Demand 7,810MW 9,080MW
The Connecticut Center for Advanced Technology, Inc. © 2008 42
requirements for stringent air emission, climate control, and efficiency parameters for
approval and operation will likely provide some incentive to develop both grid-side and
customer-side CHP distributed generation to improve efficiency and lower costs.
In summary, Connecticut is projected to have a capacity gap beginning soon after 2009 with a
potential need for over 3,600 MW of generation capacity by 2016 (approximately 1,200 MW
of new demand plus 2,400 MW of capacity that could be retired for a total capacity need of
3,600 MW by 2016).59 Further, Connecticut only has the ability to move approximately 30
percent of the needed electric capacity from out of state resources into Connecticut load areas
by transmission facilities. Thus, Connecticut will be faced with difficult decisions that will
require in-state generation. Central station generation providing consumer power from the
grid without thermal value is not likely to capture this entire demand for new or replacement
generation as some consumers will seek high efficiency on-site CHP applications. As
previously discussed, the total technical potential for CHP distributed generation in
Connecticut has been estimated at 1,673 MW by 2014. However, the market potential has
been estimated to be 645.6 MW using advanced technology with accelerated market
penetration.60 While the threat of capacity shortages is real and potentially significant,
strategic planning to guide consumers to alternative and more efficient energy resources in a
timely manner will extend the time of use for available resources and reduce the impact
attributable to shortages of hydrocarbon fuels. Consequently, there is a market potential and
technical need for CHP distributed generation to meet a large part of the new capacity needs
of the state.
Oil Supply and Consumption
The EIA predicts world total oil production will increase from the current 81 million barrels
per day to 92 million barrels in 2015 and 107 million barrels per day in 2030, according to a
reference case. Although the EIA predicts production to increase, most studies estimate peak 59 The Connecticut Forecast of Loads and Resources also identifies a need for new energy capacity soon after 2009: 406 MW deficiency by 2009 that grows to 1,241 MW by 2016 under ISO 90/10; with retirement of the oldest oil and coal facilities, the deficiency would be 897 MW in 2008 increasing to 3,702 MW by 2016 60 “Distributed Generation Market Potential: 2004 Update Connecticut and Southwest Connecticut”, ISE, Joel M. Rinebold, ECSU, March 15, 2004
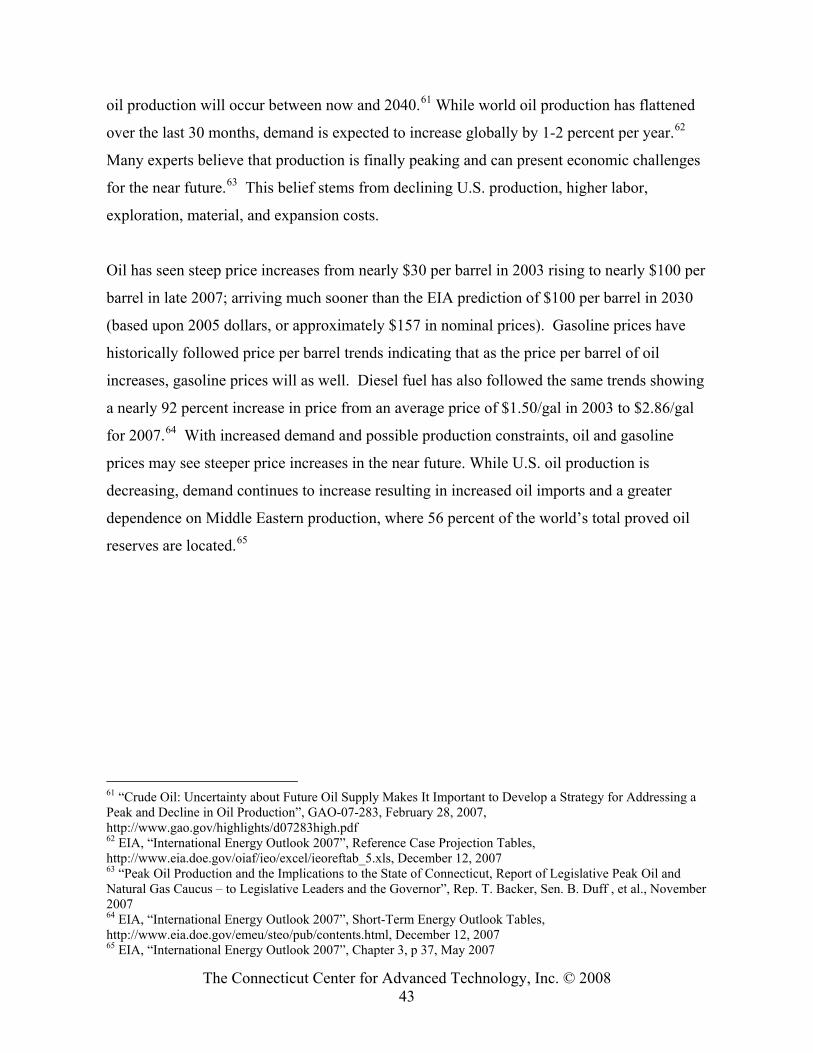
The Connecticut Center for Advanced Technology, Inc. © 2008 43
oil production will occur between now and 2040.61 While world oil production has flattened
over the last 30 months, demand is expected to increase globally by 1-2 percent per year.62
Many experts believe that production is finally peaking and can present economic challenges
for the near future.63 This belief stems from declining U.S. production, higher labor,
exploration, material, and expansion costs.
Oil has seen steep price increases from nearly $30 per barrel in 2003 rising to nearly $100 per
barrel in late 2007; arriving much sooner than the EIA prediction of $100 per barrel in 2030
(based upon 2005 dollars, or approximately $157 in nominal prices). Gasoline prices have
historically followed price per barrel trends indicating that as the price per barrel of oil
increases, gasoline prices will as well. Diesel fuel has also followed the same trends showing
a nearly 92 percent increase in price from an average price of $1.50/gal in 2003 to $2.86/gal
for 2007.64 With increased demand and possible production constraints, oil and gasoline
prices may see steeper price increases in the near future. While U.S. oil production is
decreasing, demand continues to increase resulting in increased oil imports and a greater
dependence on Middle Eastern production, where 56 percent of the world’s total proved oil
reserves are located.65
61 “Crude Oil: Uncertainty about Future Oil Supply Makes It Important to Develop a Strategy for Addressing a Peak and Decline in Oil Production”, GAO-07-283, February 28, 2007, http://www.gao.gov/highlights/d07283high.pdf 62 EIA, “International Energy Outlook 2007”, Reference Case Projection Tables, http://www.eia.doe.gov/oiaf/ieo/excel/ieoreftab_5.xls, December 12, 2007 63 “Peak Oil Production and the Implications to the State of Connecticut, Report of Legislative Peak Oil and Natural Gas Caucus – to Legislative Leaders and the Governor”, Rep. T. Backer, Sen. B. Duff , et al., November 2007 64 EIA, “International Energy Outlook 2007”, Short-Term Energy Outlook Tables, http://www.eia.doe.gov/emeu/steo/pub/contents.html, December 12, 2007 65 EIA, “International Energy Outlook 2007”, Chapter 3, p 37, May 2007
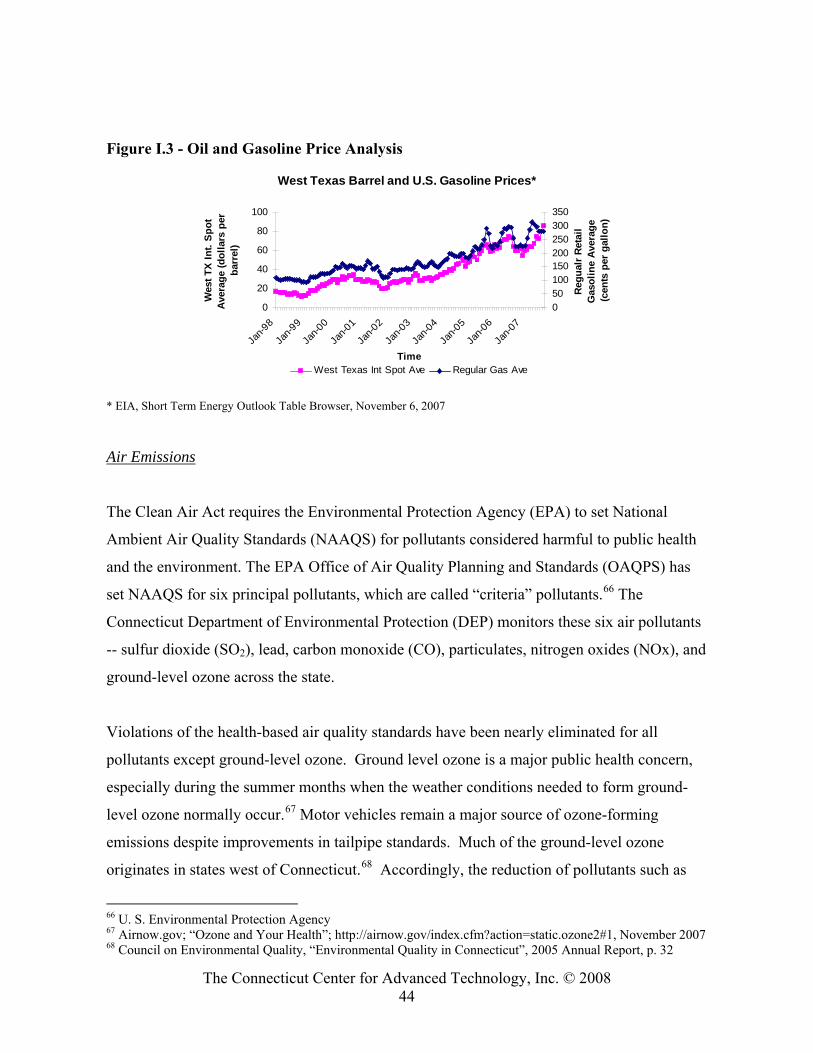
The Connecticut Center for Advanced Technology, Inc. © 2008 44
Figure I.3 - Oil and Gasoline Price Analysis
West Texas Barrel and U.S. Gasoline Prices*
0
20
40
60
80
100
Jan-9
8
Jan-9
9
Jan-0
0
Jan-0
1
Jan-0
2
Jan-0
3
Jan-0
4
Jan-0
5
Jan-0
6
Jan-0
7
Time
Wes
t TX
Int.
Spot
Av
erag
e (d
olla
rs p
er
barr
el)
050100150200250300350
Reg
ualr
Reta
il G
asol
ine
Aver
age
(cen
ts p
er g
allo
n)
West Texas Int Spot Ave Regular Gas Ave
* EIA, Short Term Energy Outlook Table Browser, November 6, 2007
Air Emissions
The Clean Air Act requires the Environmental Protection Agency (EPA) to set National
Ambient Air Quality Standards (NAAQS) for pollutants considered harmful to public health
and the environment. The EPA Office of Air Quality Planning and Standards (OAQPS) has
set NAAQS for six principal pollutants, which are called “criteria” pollutants.66 The
Connecticut Department of Environmental Protection (DEP) monitors these six air pollutants
-- sulfur dioxide (SO2), lead, carbon monoxide (CO), particulates, nitrogen oxides (NOx), and
ground-level ozone across the state.
Violations of the health-based air quality standards have been nearly eliminated for all
pollutants except ground-level ozone. Ground level ozone is a major public health concern,
especially during the summer months when the weather conditions needed to form ground-
level ozone normally occur.67 Motor vehicles remain a major source of ozone-forming
emissions despite improvements in tailpipe standards. Much of the ground-level ozone
originates in states west of Connecticut.68 Accordingly, the reduction of pollutants such as
66 U. S. Environmental Protection Agency 67 Airnow.gov; “Ozone and Your Health”; http://airnow.gov/index.cfm?action=static.ozone2#1, November 2007 68 Council on Environmental Quality, “Environmental Quality in Connecticut”, 2005 Annual Report, p. 32
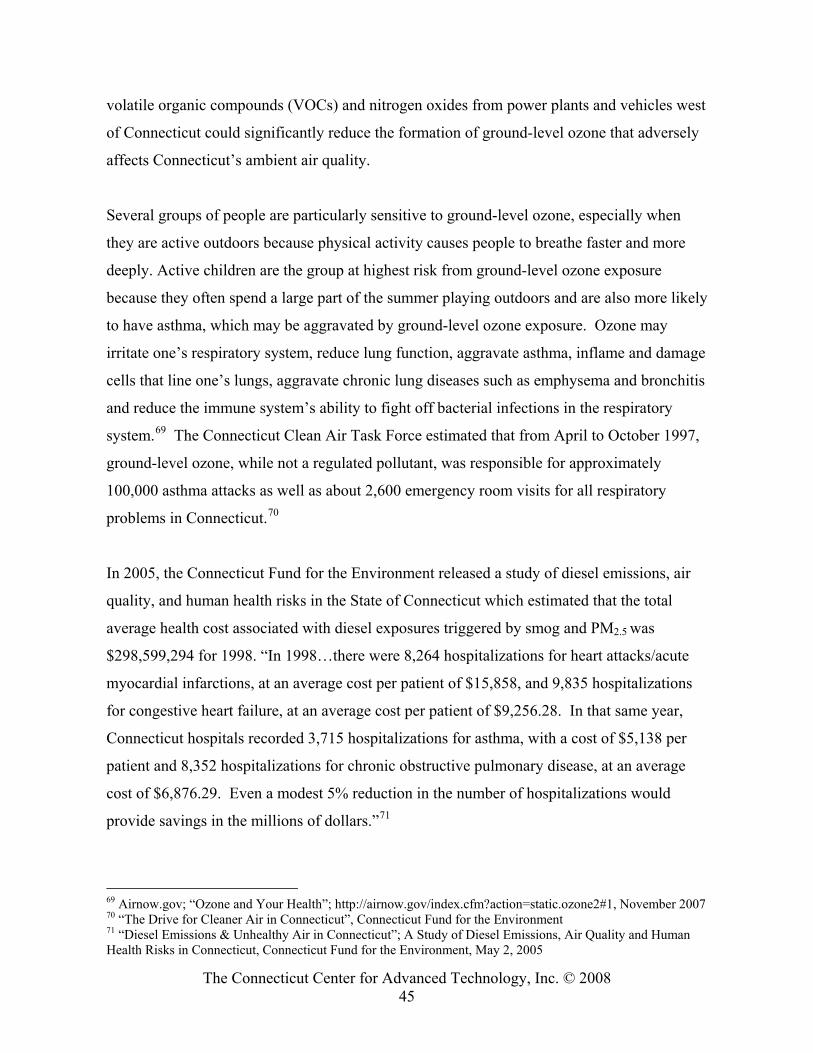
The Connecticut Center for Advanced Technology, Inc. © 2008 45
volatile organic compounds (VOCs) and nitrogen oxides from power plants and vehicles west
of Connecticut could significantly reduce the formation of ground-level ozone that adversely
affects Connecticut’s ambient air quality.
Several groups of people are particularly sensitive to ground-level ozone, especially when
they are active outdoors because physical activity causes people to breathe faster and more
deeply. Active children are the group at highest risk from ground-level ozone exposure
because they often spend a large part of the summer playing outdoors and are also more likely
to have asthma, which may be aggravated by ground-level ozone exposure. Ozone may
irritate one’s respiratory system, reduce lung function, aggravate asthma, inflame and damage
cells that line one’s lungs, aggravate chronic lung diseases such as emphysema and bronchitis
and reduce the immune system’s ability to fight off bacterial infections in the respiratory
system.69 The Connecticut Clean Air Task Force estimated that from April to October 1997,
ground-level ozone, while not a regulated pollutant, was responsible for approximately
100,000 asthma attacks as well as about 2,600 emergency room visits for all respiratory
problems in Connecticut.70
In 2005, the Connecticut Fund for the Environment released a study of diesel emissions, air
quality, and human health risks in the State of Connecticut which estimated that the total
average health cost associated with diesel exposures triggered by smog and PM2.5 was
$298,599,294 for 1998. “In 1998…there were 8,264 hospitalizations for heart attacks/acute
myocardial infarctions, at an average cost per patient of $15,858, and 9,835 hospitalizations
for congestive heart failure, at an average cost per patient of $9,256.28. In that same year,
Connecticut hospitals recorded 3,715 hospitalizations for asthma, with a cost of $5,138 per
patient and 8,352 hospitalizations for chronic obstructive pulmonary disease, at an average
cost of $6,876.29. Even a modest 5% reduction in the number of hospitalizations would
provide savings in the millions of dollars.”71
69 Airnow.gov; “Ozone and Your Health”; http://airnow.gov/index.cfm?action=static.ozone2#1, November 2007 70 “The Drive for Cleaner Air in Connecticut”, Connecticut Fund for the Environment 71 “Diesel Emissions & Unhealthy Air in Connecticut”; A Study of Diesel Emissions, Air Quality and Human Health Risks in Connecticut, Connecticut Fund for the Environment, May 2, 2005
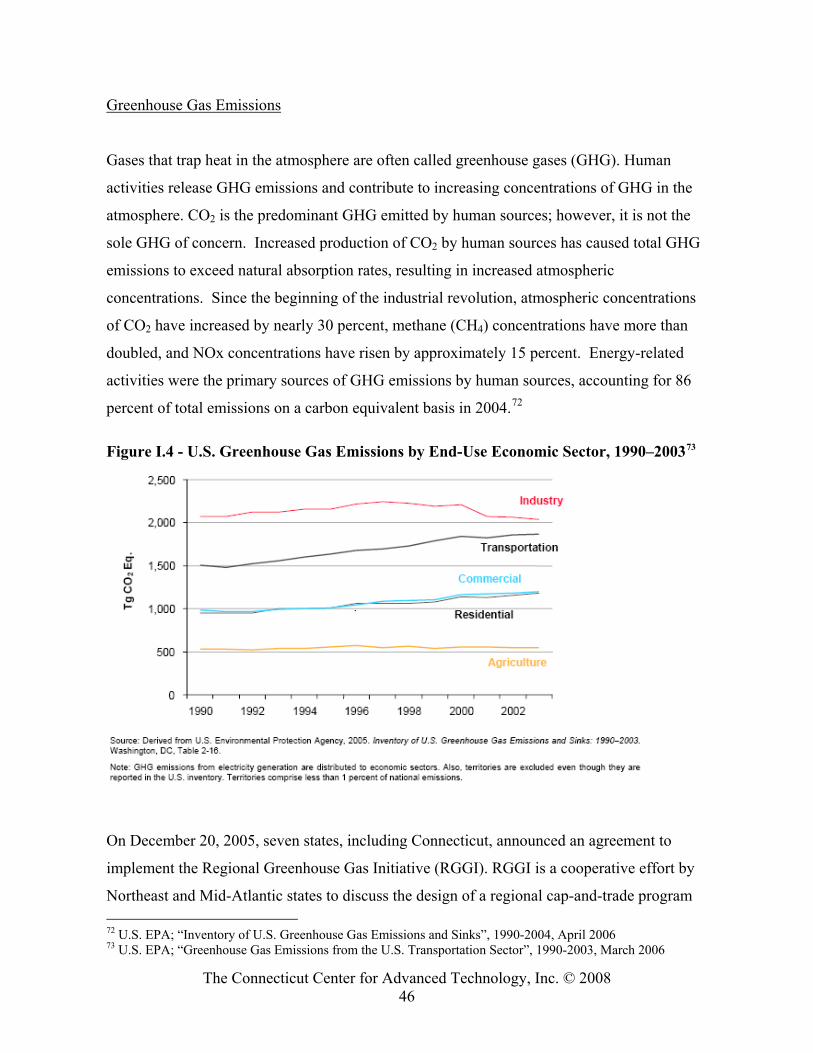
The Connecticut Center for Advanced Technology, Inc. © 2008 46
Greenhouse Gas Emissions
Gases that trap heat in the atmosphere are often called greenhouse gases (GHG). Human
activities release GHG emissions and contribute to increasing concentrations of GHG in the
atmosphere. CO2 is the predominant GHG emitted by human sources; however, it is not the
sole GHG of concern. Increased production of CO2 by human sources has caused total GHG
emissions to exceed natural absorption rates, resulting in increased atmospheric
concentrations. Since the beginning of the industrial revolution, atmospheric concentrations
of CO2 have increased by nearly 30 percent, methane (CH4) concentrations have more than
doubled, and NOx concentrations have risen by approximately 15 percent. Energy-related
activities were the primary sources of GHG emissions by human sources, accounting for 86
percent of total emissions on a carbon equivalent basis in 2004.72
Figure I.4 - U.S. Greenhouse Gas Emissions by End-Use Economic Sector, 1990–200373
On December 20, 2005, seven states, including Connecticut, announced an agreement to
implement the Regional Greenhouse Gas Initiative (RGGI). RGGI is a cooperative effort by
Northeast and Mid-Atlantic states to discuss the design of a regional cap-and-trade program 72 U.S. EPA; “Inventory of U.S. Greenhouse Gas Emissions and Sinks”, 1990-2004, April 2006 73 U.S. EPA; “Greenhouse Gas Emissions from the U.S. Transportation Sector”, 1990-2003, March 2006
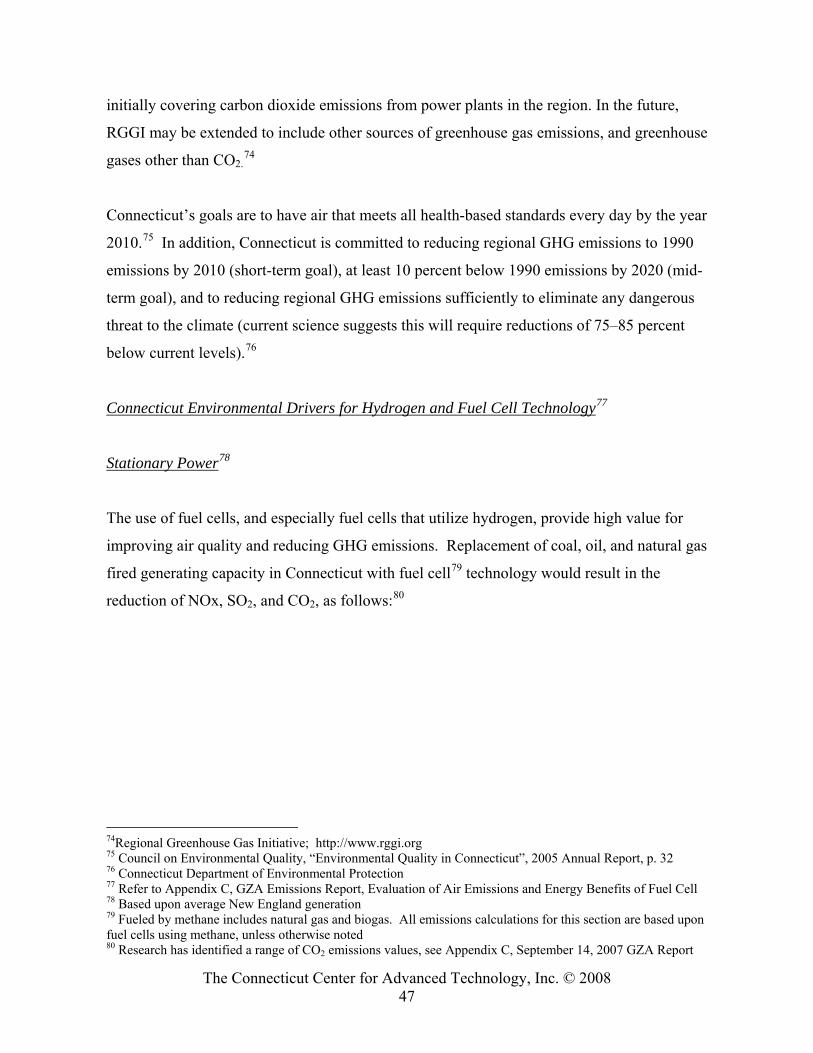
The Connecticut Center for Advanced Technology, Inc. © 2008 47
initially covering carbon dioxide emissions from power plants in the region. In the future,
RGGI may be extended to include other sources of greenhouse gas emissions, and greenhouse
gases other than CO2.74
Connecticut’s goals are to have air that meets all health-based standards every day by the year
2010.75 In addition, Connecticut is committed to reducing regional GHG emissions to 1990
emissions by 2010 (short-term goal), at least 10 percent below 1990 emissions by 2020 (mid-
term goal), and to reducing regional GHG emissions sufficiently to eliminate any dangerous
threat to the climate (current science suggests this will require reductions of 75–85 percent
below current levels).76
Connecticut Environmental Drivers for Hydrogen and Fuel Cell Technology77
Stationary Power78
The use of fuel cells, and especially fuel cells that utilize hydrogen, provide high value for
improving air quality and reducing GHG emissions. Replacement of coal, oil, and natural gas
fired generating capacity in Connecticut with fuel cell79 technology would result in the
reduction of NOx, SO2, and CO2, as follows:80
74Regional Greenhouse Gas Initiative; http://www.rggi.org 75 Council on Environmental Quality, “Environmental Quality in Connecticut”, 2005 Annual Report, p. 32 76 Connecticut Department of Environmental Protection 77 Refer to Appendix C, GZA Emissions Report, Evaluation of Air Emissions and Energy Benefits of Fuel Cell 78 Based upon average New England generation 79 Fueled by methane includes natural gas and biogas. All emissions calculations for this section are based upon fuel cells using methane, unless otherwise noted 80 Research has identified a range of CO2 emissions values, see Appendix C, September 14, 2007 GZA Report
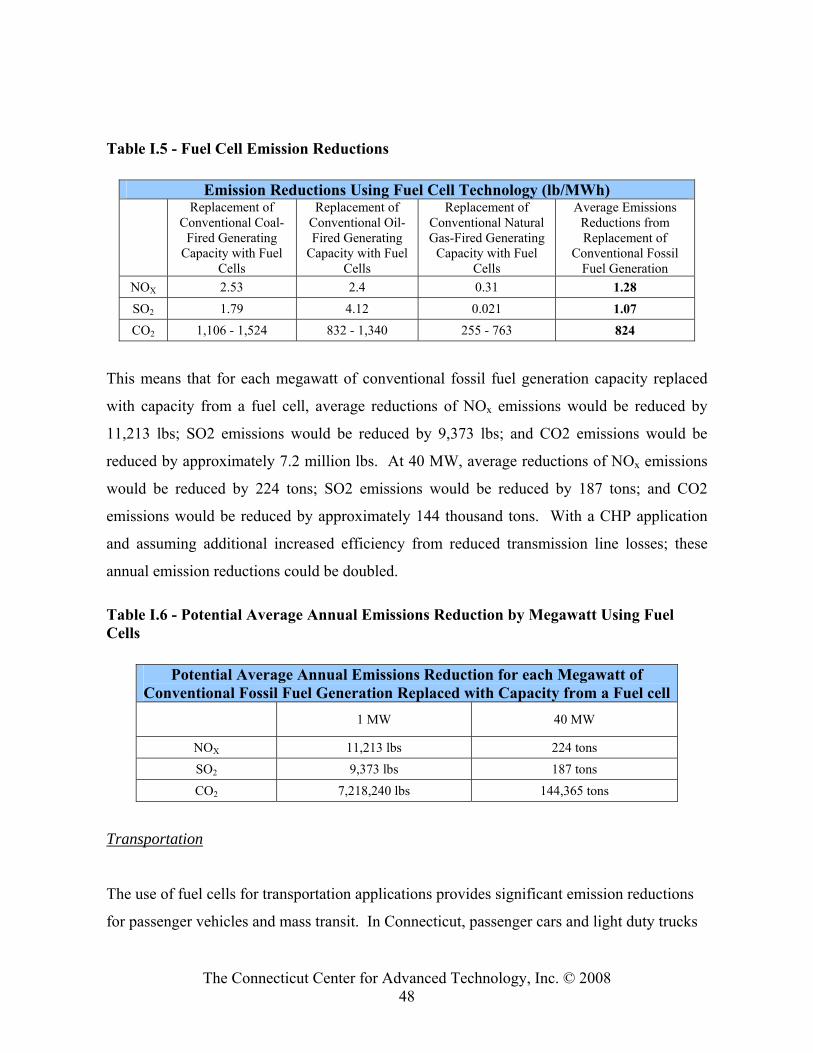
The Connecticut Center for Advanced Technology, Inc. © 2008 48
Table I.5 - Fuel Cell Emission Reductions
Emission Reductions Using Fuel Cell Technology (lb/MWh)
Replacement of Conventional Coal-
Fired Generating Capacity with Fuel
Cells
Replacement of Conventional Oil-Fired Generating
Capacity with Fuel Cells
Replacement of Conventional Natural Gas-Fired Generating
Capacity with Fuel Cells
Average Emissions Reductions from Replacement of
Conventional Fossil Fuel Generation
NOX 2.53 2.4 0.31 1.28 SO2 1.79 4.12 0.021 1.07 CO2 1,106 - 1,524 832 - 1,340 255 - 763 824
This means that for each megawatt of conventional fossil fuel generation capacity replaced
with capacity from a fuel cell, average reductions of NOx emissions would be reduced by
11,213 lbs; SO2 emissions would be reduced by 9,373 lbs; and CO2 emissions would be
reduced by approximately 7.2 million lbs. At 40 MW, average reductions of NOx emissions
would be reduced by 224 tons; SO2 emissions would be reduced by 187 tons; and CO2
emissions would be reduced by approximately 144 thousand tons. With a CHP application
and assuming additional increased efficiency from reduced transmission line losses; these
annual emission reductions could be doubled.
Table I.6 - Potential Average Annual Emissions Reduction by Megawatt Using Fuel Cells
Potential Average Annual Emissions Reduction for each Megawatt of Conventional Fossil Fuel Generation Replaced with Capacity from a Fuel cell
1 MW 40 MW
NOX 11,213 lbs 224 tons SO2 9,373 lbs 187 tons CO2 7,218,240 lbs 144,365 tons
Transportation
The use of fuel cells for transportation applications provides significant emission reductions
for passenger vehicles and mass transit. In Connecticut, passenger cars and light duty trucks
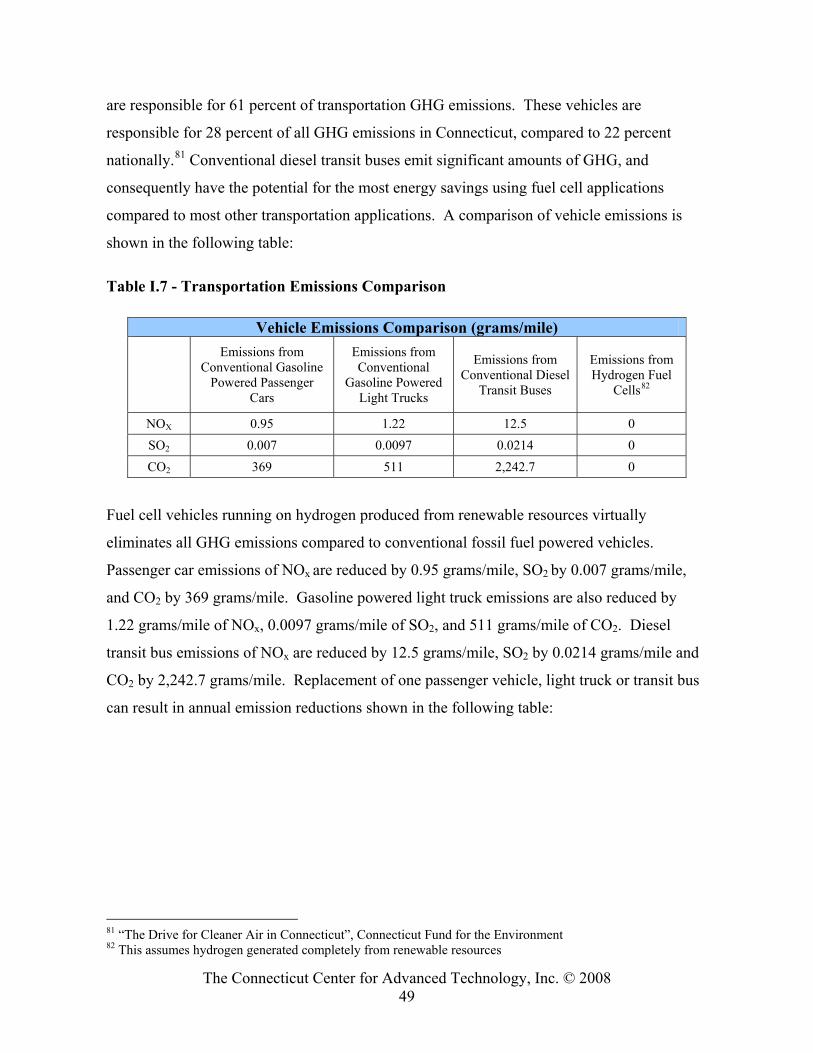
The Connecticut Center for Advanced Technology, Inc. © 2008 49
are responsible for 61 percent of transportation GHG emissions. These vehicles are
responsible for 28 percent of all GHG emissions in Connecticut, compared to 22 percent
nationally.81 Conventional diesel transit buses emit significant amounts of GHG, and
consequently have the potential for the most energy savings using fuel cell applications
compared to most other transportation applications. A comparison of vehicle emissions is
shown in the following table:
Table I.7 - Transportation Emissions Comparison
Vehicle Emissions Comparison (grams/mile)
Emissions from Conventional Gasoline
Powered Passenger Cars
Emissions from Conventional
Gasoline Powered Light Trucks
Emissions from Conventional Diesel
Transit Buses
Emissions from Hydrogen Fuel
Cells82
NOX 0.95 1.22 12.5 0 SO2 0.007 0.0097 0.0214 0 CO2 369 511 2,242.7 0
Fuel cell vehicles running on hydrogen produced from renewable resources virtually
eliminates all GHG emissions compared to conventional fossil fuel powered vehicles.
Passenger car emissions of NOx are reduced by 0.95 grams/mile, SO2 by 0.007 grams/mile,
and CO2 by 369 grams/mile. Gasoline powered light truck emissions are also reduced by
1.22 grams/mile of NOx, 0.0097 grams/mile of SO2, and 511 grams/mile of CO2. Diesel
transit bus emissions of NOx are reduced by 12.5 grams/mile, SO2 by 0.0214 grams/mile and
CO2 by 2,242.7 grams/mile. Replacement of one passenger vehicle, light truck or transit bus
can result in annual emission reductions shown in the following table:
81 “The Drive for Cleaner Air in Connecticut”, Connecticut Fund for the Environment 82 This assumes hydrogen generated completely from renewable resources
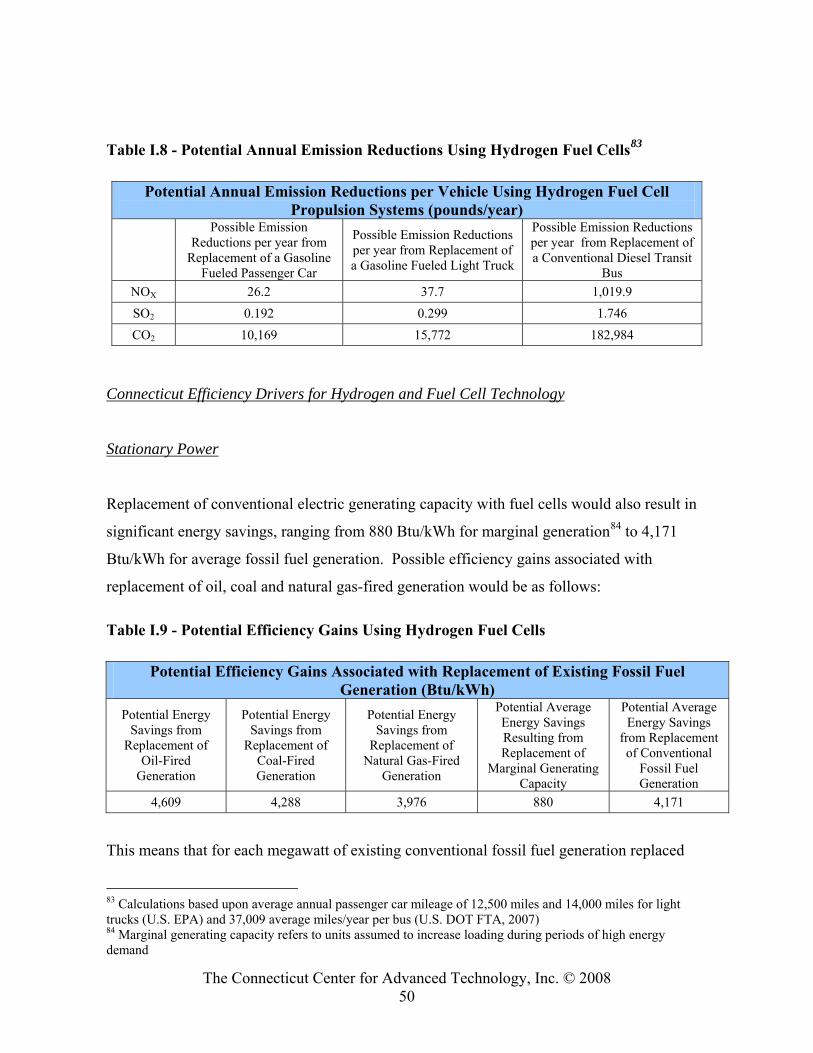
The Connecticut Center for Advanced Technology, Inc. © 2008 50
Table I.8 - Potential Annual Emission Reductions Using Hydrogen Fuel Cells83
Potential Annual Emission Reductions per Vehicle Using Hydrogen Fuel Cell Propulsion Systems (pounds/year)
Possible Emission Reductions per year from
Replacement of a Gasoline Fueled Passenger Car
Possible Emission Reductions per year from Replacement of a Gasoline Fueled Light Truck
Possible Emission Reductions per year from Replacement of a Conventional Diesel Transit
Bus NOX 26.2 37.7 1,019.9 SO2 0.192 0.299 1.746 CO2 10,169 15,772 182,984
Connecticut Efficiency Drivers for Hydrogen and Fuel Cell Technology
Stationary Power
Replacement of conventional electric generating capacity with fuel cells would also result in
significant energy savings, ranging from 880 Btu/kWh for marginal generation84 to 4,171
Btu/kWh for average fossil fuel generation. Possible efficiency gains associated with
replacement of oil, coal and natural gas-fired generation would be as follows:
Table I.9 - Potential Efficiency Gains Using Hydrogen Fuel Cells
Potential Efficiency Gains Associated with Replacement of Existing Fossil Fuel Generation (Btu/kWh)
Potential Energy Savings from
Replacement of Oil-Fired
Generation
Potential Energy Savings from
Replacement of Coal-Fired Generation
Potential Energy Savings from
Replacement of Natural Gas-Fired
Generation
Potential Average Energy Savings Resulting from Replacement of
Marginal Generating Capacity
Potential Average Energy Savings
from Replacement of Conventional
Fossil Fuel Generation
4,609 4,288 3,976 880 4,171
This means that for each megawatt of existing conventional fossil fuel generation replaced
83 Calculations based upon average annual passenger car mileage of 12,500 miles and 14,000 miles for light trucks (U.S. EPA) and 37,009 average miles/year per bus (U.S. DOT FTA, 2007) 84 Marginal generating capacity refers to units assumed to increase loading during periods of high energy demand
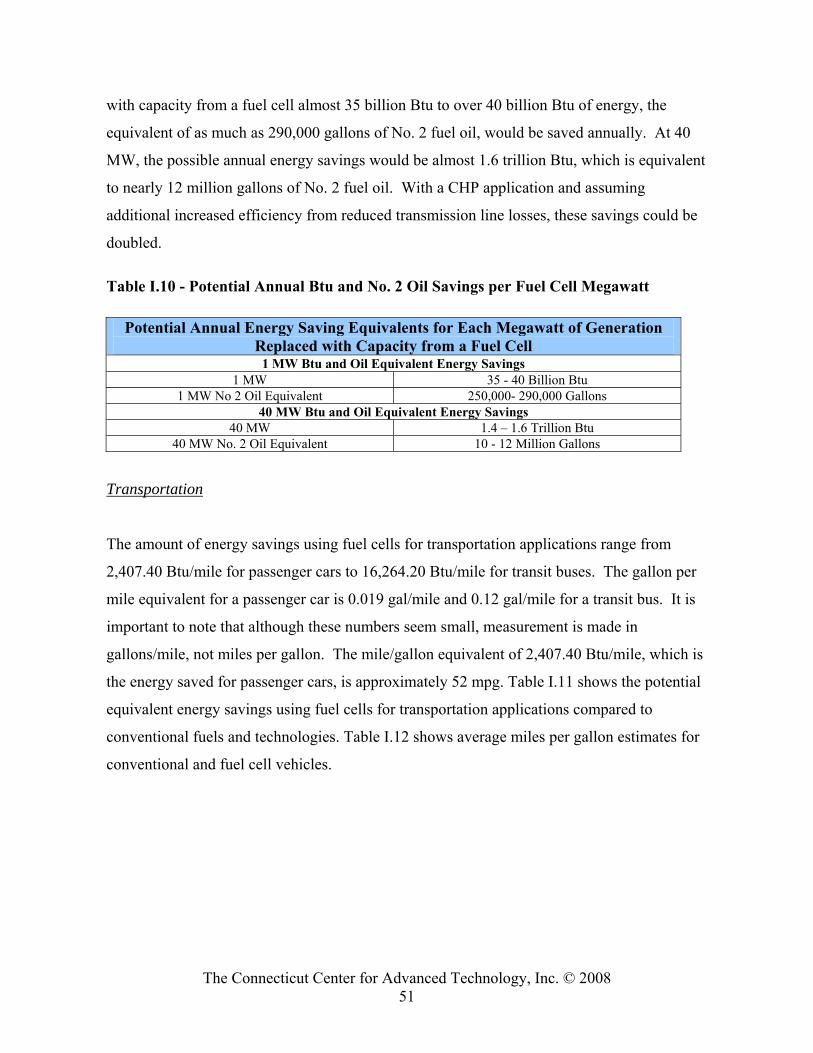
The Connecticut Center for Advanced Technology, Inc. © 2008 51
with capacity from a fuel cell almost 35 billion Btu to over 40 billion Btu of energy, the
equivalent of as much as 290,000 gallons of No. 2 fuel oil, would be saved annually. At 40
MW, the possible annual energy savings would be almost 1.6 trillion Btu, which is equivalent
to nearly 12 million gallons of No. 2 fuel oil. With a CHP application and assuming
additional increased efficiency from reduced transmission line losses, these savings could be
doubled.
Table I.10 - Potential Annual Btu and No. 2 Oil Savings per Fuel Cell Megawatt
Potential Annual Energy Saving Equivalents for Each Megawatt of Generation Replaced with Capacity from a Fuel Cell
1 MW Btu and Oil Equivalent Energy Savings 1 MW 35 - 40 Billion Btu
1 MW No 2 Oil Equivalent 250,000- 290,000 Gallons 40 MW Btu and Oil Equivalent Energy Savings
40 MW 1.4 – 1.6 Trillion Btu 40 MW No. 2 Oil Equivalent 10 - 12 Million Gallons
Transportation
The amount of energy savings using fuel cells for transportation applications range from
2,407.40 Btu/mile for passenger cars to 16,264.20 Btu/mile for transit buses. The gallon per
mile equivalent for a passenger car is 0.019 gal/mile and 0.12 gal/mile for a transit bus. It is
important to note that although these numbers seem small, measurement is made in
gallons/mile, not miles per gallon. The mile/gallon equivalent of 2,407.40 Btu/mile, which is
the energy saved for passenger cars, is approximately 52 mpg. Table I.11 shows the potential
equivalent energy savings using fuel cells for transportation applications compared to
conventional fuels and technologies. Table I.12 shows average miles per gallon estimates for
conventional and fuel cell vehicles.
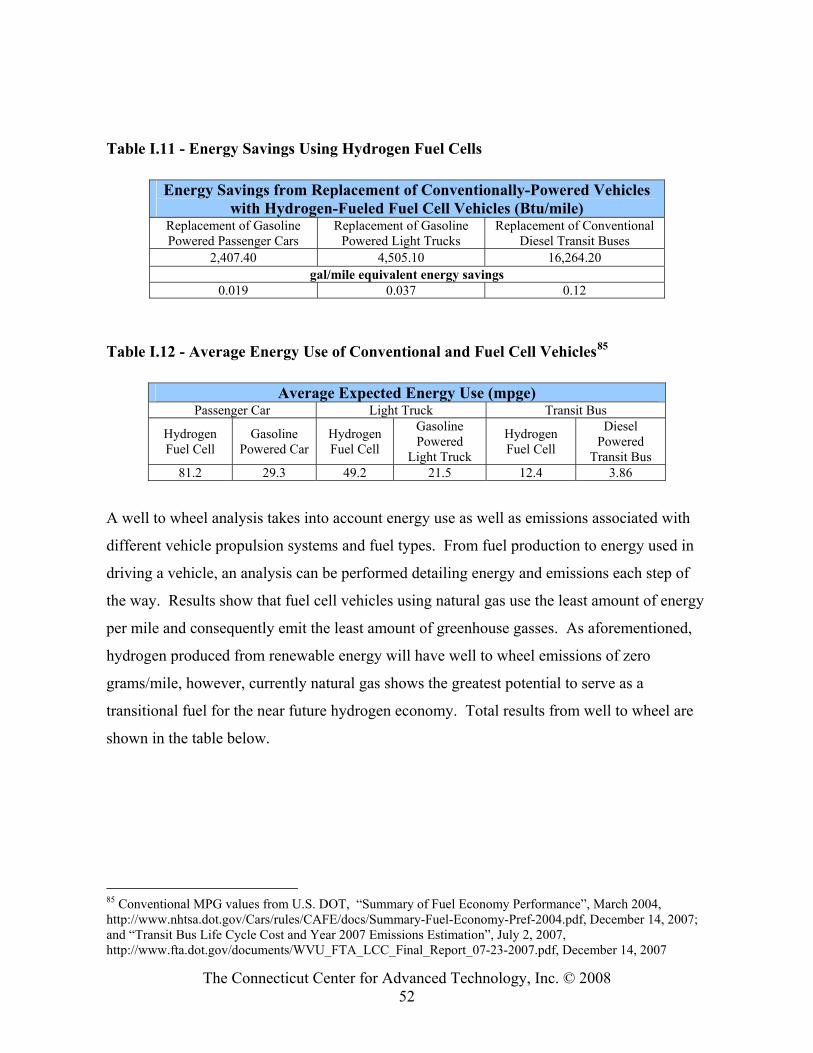
The Connecticut Center for Advanced Technology, Inc. © 2008 52
Table I.11 - Energy Savings Using Hydrogen Fuel Cells
Energy Savings from Replacement of Conventionally-Powered Vehicles with Hydrogen-Fueled Fuel Cell Vehicles (Btu/mile)
Replacement of Gasoline Powered Passenger Cars
Replacement of Gasoline Powered Light Trucks
Replacement of Conventional Diesel Transit Buses
2,407.40 4,505.10 16,264.20 gal/mile equivalent energy savings
0.019 0.037 0.12
Table I.12 - Average Energy Use of Conventional and Fuel Cell Vehicles85
Average Expected Energy Use (mpge) Passenger Car Light Truck Transit Bus
Hydrogen Fuel Cell
Gasoline Powered Car
Hydrogen Fuel Cell
Gasoline Powered
Light Truck
Hydrogen Fuel Cell
Diesel Powered
Transit Bus 81.2 29.3 49.2 21.5 12.4 3.86
A well to wheel analysis takes into account energy use as well as emissions associated with
different vehicle propulsion systems and fuel types. From fuel production to energy used in
driving a vehicle, an analysis can be performed detailing energy and emissions each step of
the way. Results show that fuel cell vehicles using natural gas use the least amount of energy
per mile and consequently emit the least amount of greenhouse gasses. As aforementioned,
hydrogen produced from renewable energy will have well to wheel emissions of zero
grams/mile, however, currently natural gas shows the greatest potential to serve as a
transitional fuel for the near future hydrogen economy. Total results from well to wheel are
shown in the table below.
85 Conventional MPG values from U.S. DOT, “Summary of Fuel Economy Performance”, March 2004, http://www.nhtsa.dot.gov/Cars/rules/CAFE/docs/Summary-Fuel-Economy-Pref-2004.pdf, December 14, 2007; and “Transit Bus Life Cycle Cost and Year 2007 Emissions Estimation”, July 2, 2007, http://www.fta.dot.gov/documents/WVU_FTA_LCC_Final_Report_07-23-2007.pdf, December 14, 2007
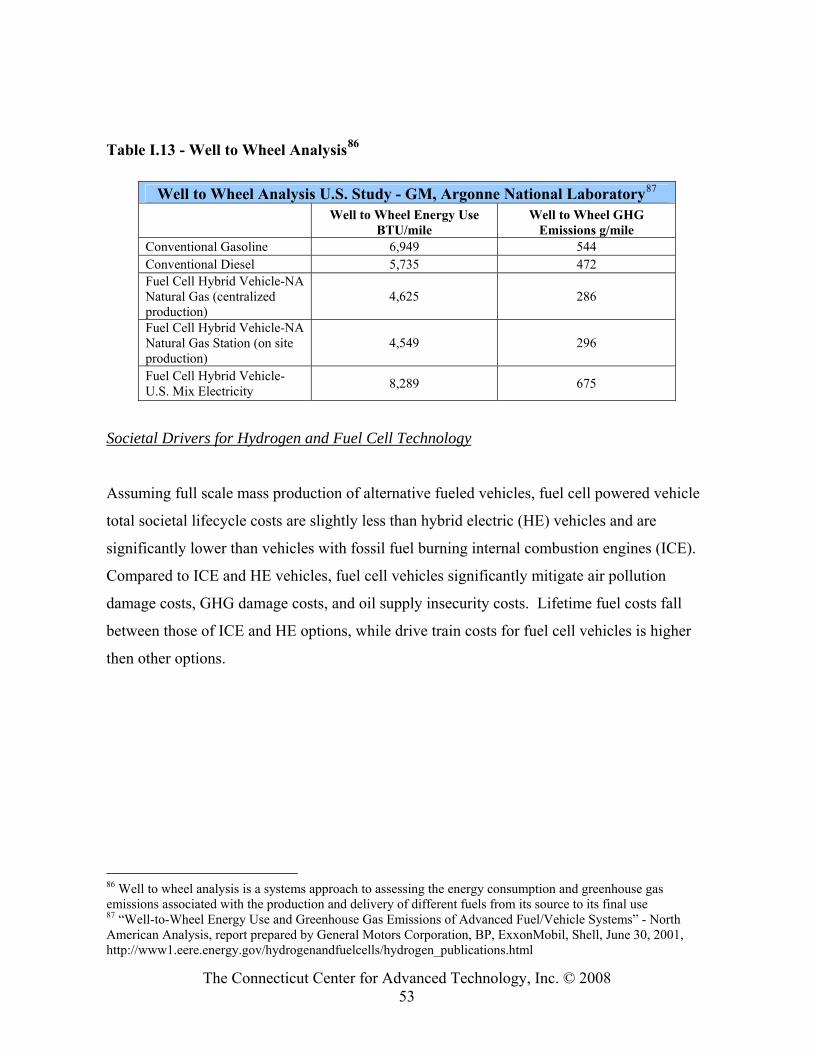
The Connecticut Center for Advanced Technology, Inc. © 2008 53
Table I.13 - Well to Wheel Analysis86
Well to Wheel Analysis U.S. Study - GM, Argonne National Laboratory87
Well to Wheel Energy Use
BTU/mile Well to Wheel GHG
Emissions g/mile Conventional Gasoline 6,949 544 Conventional Diesel 5,735 472 Fuel Cell Hybrid Vehicle-NA Natural Gas (centralized production)
4,625 286
Fuel Cell Hybrid Vehicle-NA Natural Gas Station (on site production)
4,549 296
Fuel Cell Hybrid Vehicle-U.S. Mix Electricity 8,289 675
Societal Drivers for Hydrogen and Fuel Cell Technology
Assuming full scale mass production of alternative fueled vehicles, fuel cell powered vehicle
total societal lifecycle costs are slightly less than hybrid electric (HE) vehicles and are
significantly lower than vehicles with fossil fuel burning internal combustion engines (ICE).
Compared to ICE and HE vehicles, fuel cell vehicles significantly mitigate air pollution
damage costs, GHG damage costs, and oil supply insecurity costs. Lifetime fuel costs fall
between those of ICE and HE options, while drive train costs for fuel cell vehicles is higher
then other options.
86 Well to wheel analysis is a systems approach to assessing the energy consumption and greenhouse gas emissions associated with the production and delivery of different fuels from its source to its final use 87 “Well-to-Wheel Energy Use and Greenhouse Gas Emissions of Advanced Fuel/Vehicle Systems” - North American Analysis, report prepared by General Motors Corporation, BP, ExxonMobil, Shell, June 30, 2001, http://www1.eere.energy.gov/hydrogenandfuelcells/hydrogen_publications.html
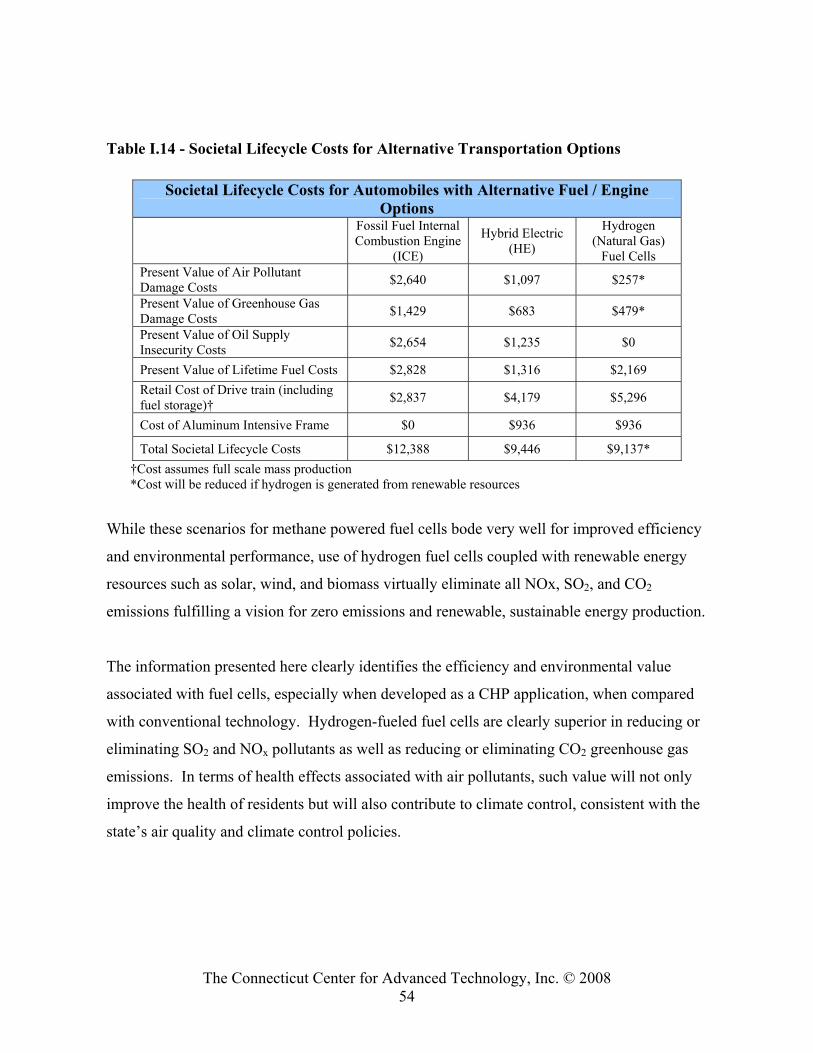
The Connecticut Center for Advanced Technology, Inc. © 2008 54
Table I.14 - Societal Lifecycle Costs for Alternative Transportation Options
Societal Lifecycle Costs for Automobiles with Alternative Fuel / Engine Options
Fossil Fuel Internal Combustion Engine
(ICE)
Hybrid Electric (HE)
Hydrogen (Natural Gas)
Fuel Cells Present Value of Air Pollutant Damage Costs $2,640 $1,097 $257*
Present Value of Greenhouse Gas Damage Costs $1,429 $683 $479*
Present Value of Oil Supply Insecurity Costs $2,654 $1,235 $0
Present Value of Lifetime Fuel Costs $2,828 $1,316 $2,169 Retail Cost of Drive train (including fuel storage)† $2,837 $4,179 $5,296
Cost of Aluminum Intensive Frame $0 $936 $936
Total Societal Lifecycle Costs $12,388 $9,446 $9,137* †Cost assumes full scale mass production *Cost will be reduced if hydrogen is generated from renewable resources
While these scenarios for methane powered fuel cells bode very well for improved efficiency
and environmental performance, use of hydrogen fuel cells coupled with renewable energy
resources such as solar, wind, and biomass virtually eliminate all NOx, SO2, and CO2
emissions fulfilling a vision for zero emissions and renewable, sustainable energy production.
The information presented here clearly identifies the efficiency and environmental value
associated with fuel cells, especially when developed as a CHP application, when compared
with conventional technology. Hydrogen-fueled fuel cells are clearly superior in reducing or
eliminating SO2 and NOx pollutants as well as reducing or eliminating CO2 greenhouse gas
emissions. In terms of health effects associated with air pollutants, such value will not only
improve the health of residents but will also contribute to climate control, consistent with the
state’s air quality and climate control policies.
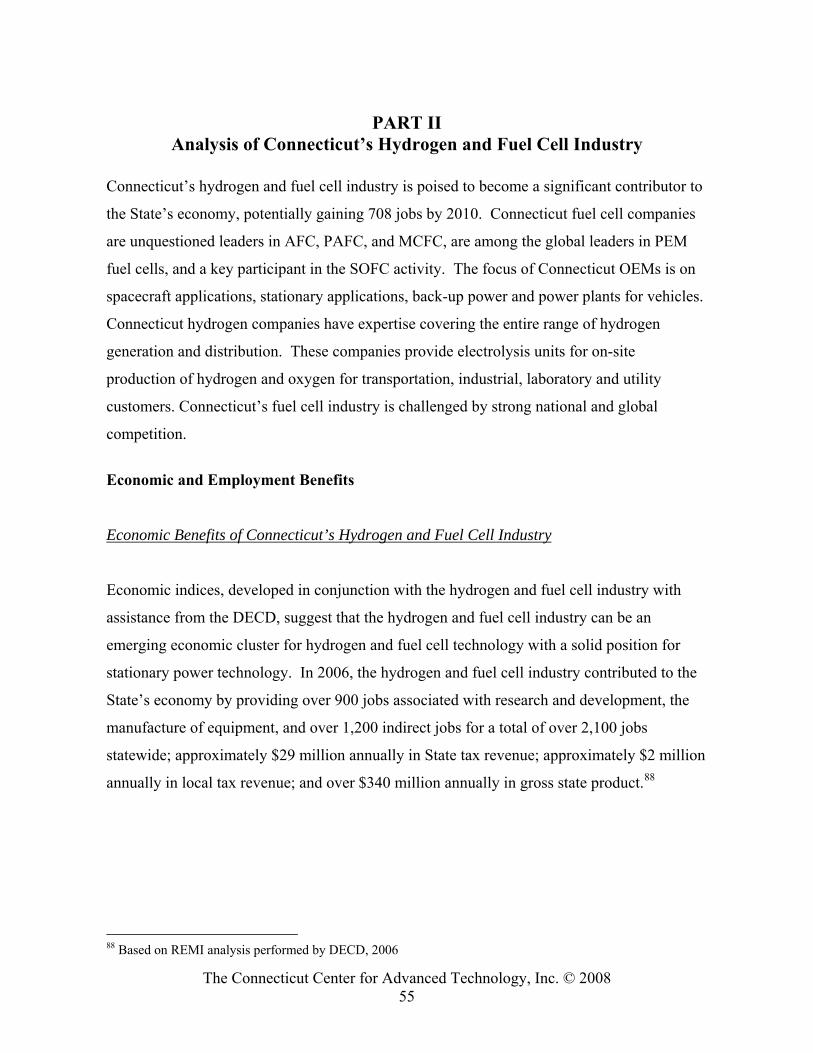
The Connecticut Center for Advanced Technology, Inc. © 2008 55
PART II Analysis of Connecticut’s Hydrogen and Fuel Cell Industry
Connecticut’s hydrogen and fuel cell industry is poised to become a significant contributor to
the State’s economy, potentially gaining 708 jobs by 2010. Connecticut fuel cell companies
are unquestioned leaders in AFC, PAFC, and MCFC, are among the global leaders in PEM
fuel cells, and a key participant in the SOFC activity. The focus of Connecticut OEMs is on
spacecraft applications, stationary applications, back-up power and power plants for vehicles.
Connecticut hydrogen companies have expertise covering the entire range of hydrogen
generation and distribution. These companies provide electrolysis units for on-site
production of hydrogen and oxygen for transportation, industrial, laboratory and utility
customers. Connecticut’s fuel cell industry is challenged by strong national and global
competition.
Economic and Employment Benefits
Economic Benefits of Connecticut’s Hydrogen and Fuel Cell Industry
Economic indices, developed in conjunction with the hydrogen and fuel cell industry with
assistance from the DECD, suggest that the hydrogen and fuel cell industry can be an
emerging economic cluster for hydrogen and fuel cell technology with a solid position for
stationary power technology. In 2006, the hydrogen and fuel cell industry contributed to the
State’s economy by providing over 900 jobs associated with research and development, the
manufacture of equipment, and over 1,200 indirect jobs for a total of over 2,100 jobs
statewide; approximately $29 million annually in State tax revenue; approximately $2 million
annually in local tax revenue; and over $340 million annually in gross state product.88
88 Based on REMI analysis performed by DECD, 2006
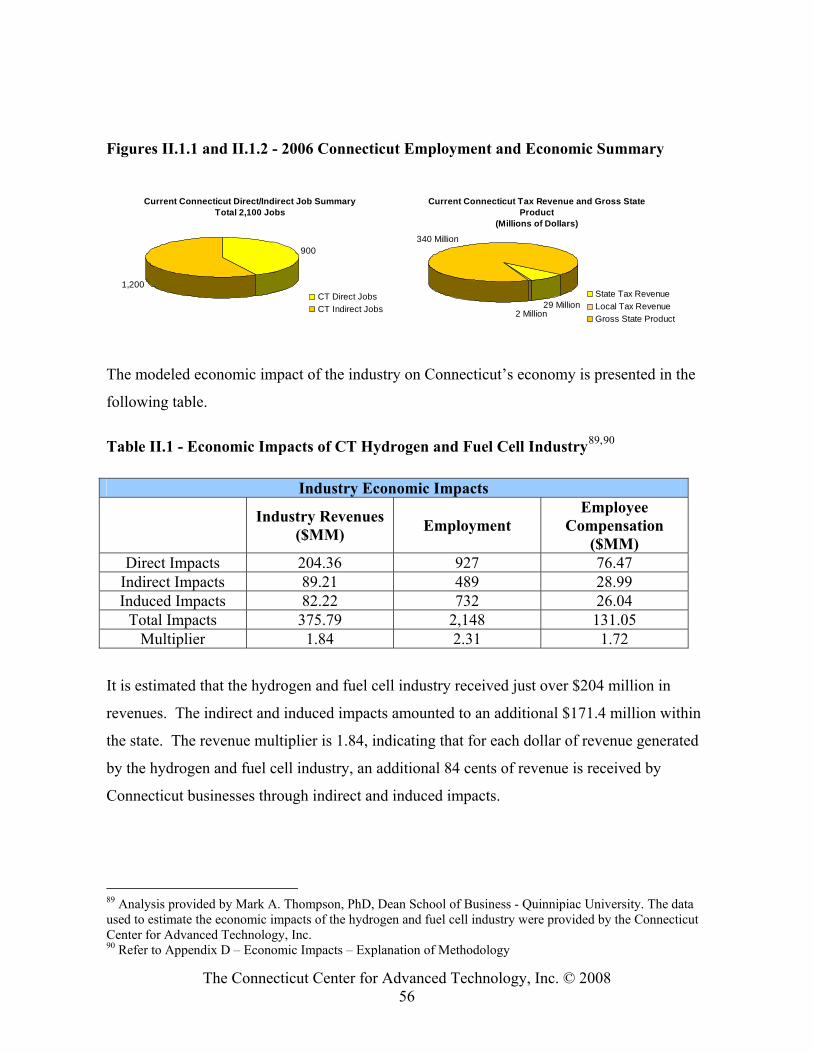
The Connecticut Center for Advanced Technology, Inc. © 2008 56
Figures II.1.1 and II.1.2 - 2006 Connecticut Employment and Economic Summary
Current Connecticut Direct/Indirect Job Summary
Total 2,100 Jobs
900
1,200CT Direct JobsCT Indirect Jobs
Current Connecticut Tax Revenue and Gross State Product
(Millions of Dollars)
2 Million29 Million
340 Million
State Tax RevenueLocal Tax RevenueGross State Product
The modeled economic impact of the industry on Connecticut’s economy is presented in the
following table.
Table II.1 - Economic Impacts of CT Hydrogen and Fuel Cell Industry89,90
Industry Economic Impacts Industry Revenues
($MM) Employment Employee
Compensation ($MM)
Direct Impacts 204.36 927 76.47 Indirect Impacts 89.21 489 28.99 Induced Impacts 82.22 732 26.04
Total Impacts 375.79 2,148 131.05 Multiplier 1.84 2.31 1.72
It is estimated that the hydrogen and fuel cell industry received just over $204 million in
revenues. The indirect and induced impacts amounted to an additional $171.4 million within
the state. The revenue multiplier is 1.84, indicating that for each dollar of revenue generated
by the hydrogen and fuel cell industry, an additional 84 cents of revenue is received by
Connecticut businesses through indirect and induced impacts.
89 Analysis provided by Mark A. Thompson, PhD, Dean School of Business - Quinnipiac University. The data used to estimate the economic impacts of the hydrogen and fuel cell industry were provided by the Connecticut Center for Advanced Technology, Inc. 90 Refer to Appendix D – Economic Impacts – Explanation of Methodology
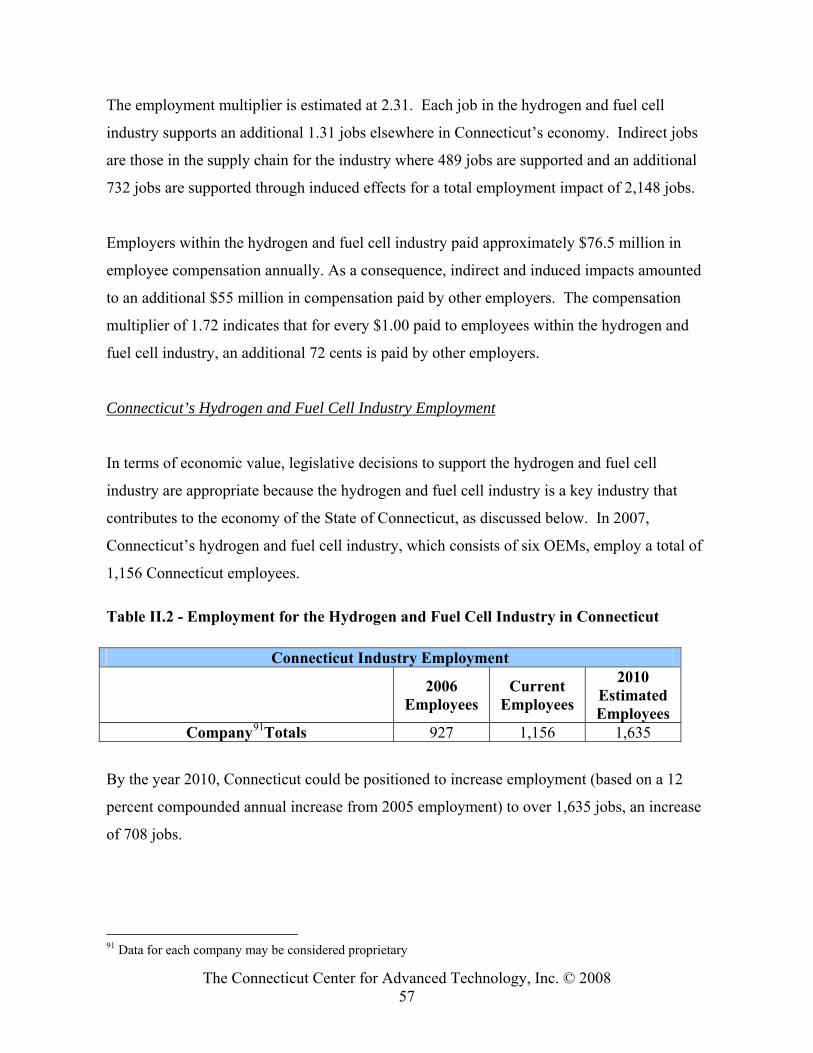
The Connecticut Center for Advanced Technology, Inc. © 2008 57
The employment multiplier is estimated at 2.31. Each job in the hydrogen and fuel cell
industry supports an additional 1.31 jobs elsewhere in Connecticut’s economy. Indirect jobs
are those in the supply chain for the industry where 489 jobs are supported and an additional
732 jobs are supported through induced effects for a total employment impact of 2,148 jobs.
Employers within the hydrogen and fuel cell industry paid approximately $76.5 million in
employee compensation annually. As a consequence, indirect and induced impacts amounted
to an additional $55 million in compensation paid by other employers. The compensation
multiplier of 1.72 indicates that for every $1.00 paid to employees within the hydrogen and
fuel cell industry, an additional 72 cents is paid by other employers.
Connecticut’s Hydrogen and Fuel Cell Industry Employment
In terms of economic value, legislative decisions to support the hydrogen and fuel cell
industry are appropriate because the hydrogen and fuel cell industry is a key industry that
contributes to the economy of the State of Connecticut, as discussed below. In 2007,
Connecticut’s hydrogen and fuel cell industry, which consists of six OEMs, employ a total of
1,156 Connecticut employees.
Table II.2 - Employment for the Hydrogen and Fuel Cell Industry in Connecticut
Connecticut Industry Employment
2006 Employees
Current Employees
2010 Estimated Employees
Company91Totals 927 1,156 1,635
By the year 2010, Connecticut could be positioned to increase employment (based on a 12
percent compounded annual increase from 2005 employment) to over 1,635 jobs, an increase
of 708 jobs.
91 Data for each company may be considered proprietary
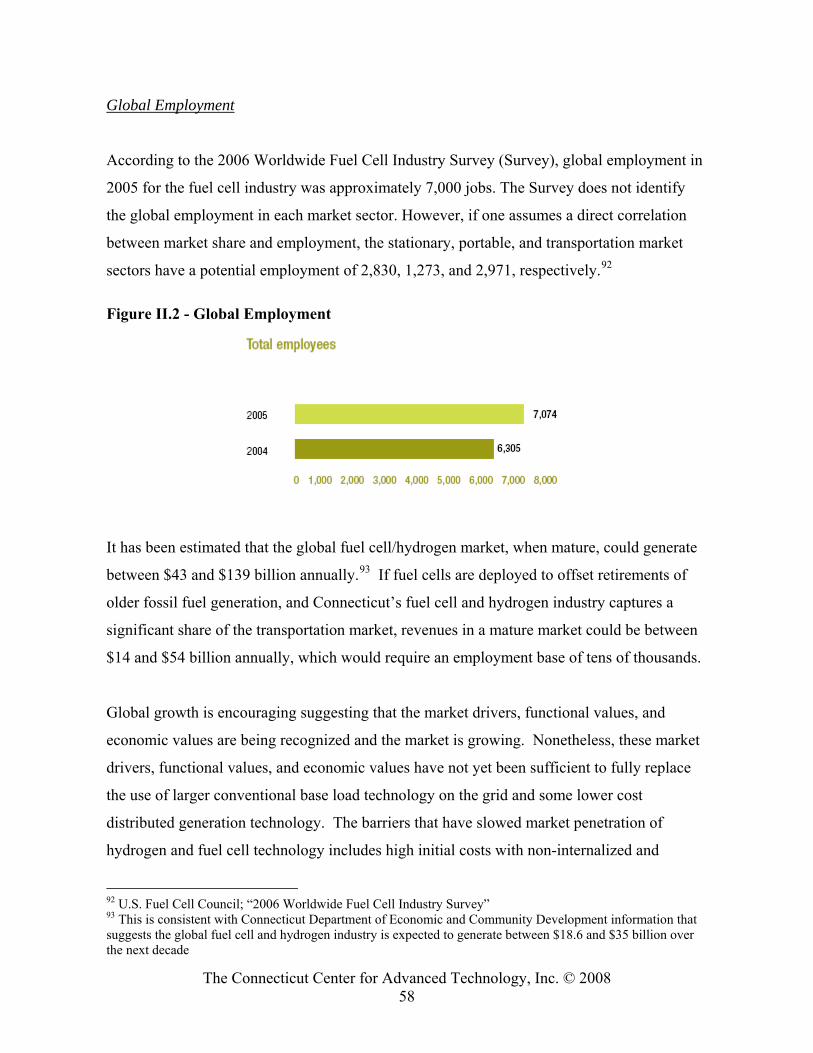
The Connecticut Center for Advanced Technology, Inc. © 2008 58
Global Employment
According to the 2006 Worldwide Fuel Cell Industry Survey (Survey), global employment in
2005 for the fuel cell industry was approximately 7,000 jobs. The Survey does not identify
the global employment in each market sector. However, if one assumes a direct correlation
between market share and employment, the stationary, portable, and transportation market
sectors have a potential employment of 2,830, 1,273, and 2,971, respectively.92
Figure II.2 - Global Employment
It has been estimated that the global fuel cell/hydrogen market, when mature, could generate
between $43 and $139 billion annually.93 If fuel cells are deployed to offset retirements of
older fossil fuel generation, and Connecticut’s fuel cell and hydrogen industry captures a
significant share of the transportation market, revenues in a mature market could be between
$14 and $54 billion annually, which would require an employment base of tens of thousands.
Global growth is encouraging suggesting that the market drivers, functional values, and
economic values are being recognized and the market is growing. Nonetheless, these market
drivers, functional values, and economic values have not yet been sufficient to fully replace
the use of larger conventional base load technology on the grid and some lower cost
distributed generation technology. The barriers that have slowed market penetration of
hydrogen and fuel cell technology includes high initial costs with non-internalized and
92 U.S. Fuel Cell Council; “2006 Worldwide Fuel Cell Industry Survey” 93 This is consistent with Connecticut Department of Economic and Community Development information that suggests the global fuel cell and hydrogen industry is expected to generate between $18.6 and $35 billion over the next decade
The Connecticut Center for Advanced Technology, Inc. © 2008 59
unappreciated environmental values, cost consuming interconnections, complicated codes and
standards, lack of adequate public awareness, investment needed to undertake advanced
research and development, lack of continuous (large scale) automated production, and strong
competition from rate base supported grid generation load that could view distributed
generation as a disruptive technology.
Fuel Cells
Connecticut Fuel Cell Companies
Connecticut industry has been involved with hydrogen and fuel cell technologies since the
1950s. Connecticut Companies were involved early with electrolysis systems for submarines
and spacecraft applications and with fuel cells for spacecraft. Since the 1960s Connecticut
companies pioneered application of fuel cell technology to stationary power applications and
continue to lead the world in this fuel cell application. Beginning in the 1990s, Connecticut
companies have participated in applying fuel cell and hydrogen generation technology to
transportation applications.
Table II.3 identifies activity by Connecticut companies in the development and manufacture
of fuel cells power plants for end use applications (Original Equipment Manufacturers).
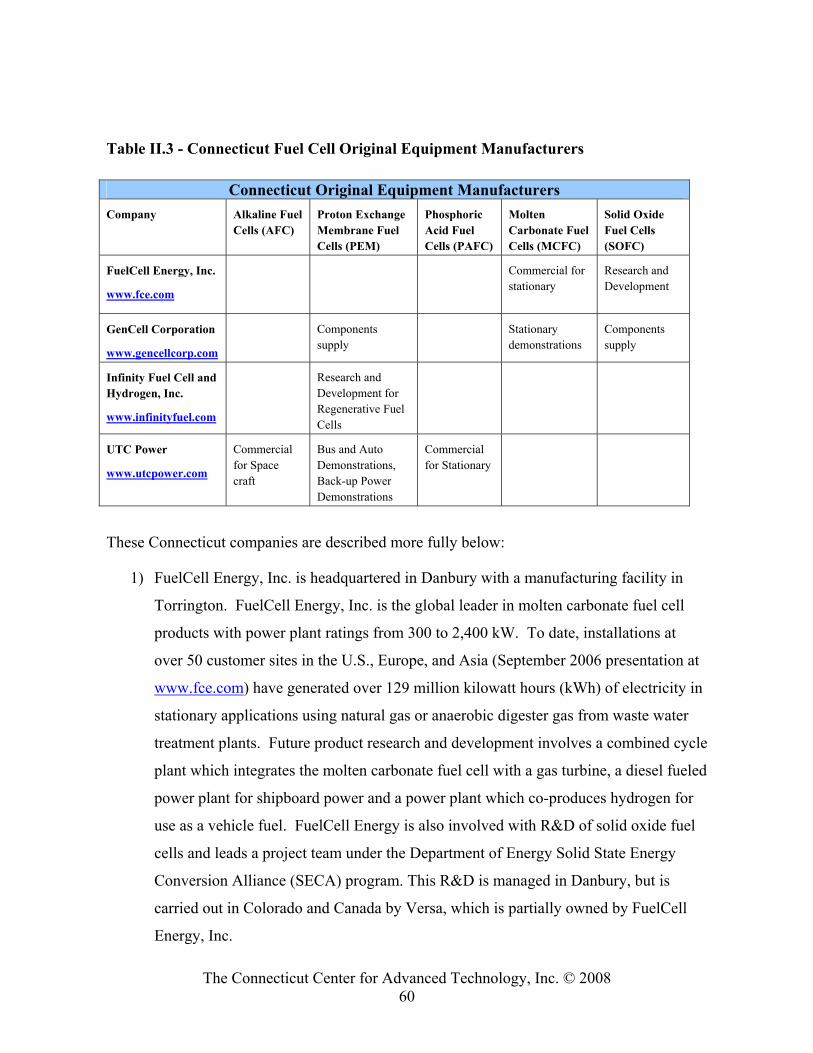
The Connecticut Center for Advanced Technology, Inc. © 2008 60
Table II.3 - Connecticut Fuel Cell Original Equipment Manufacturers
Connecticut Original Equipment Manufacturers Company Alkaline Fuel
Cells (AFC) Proton Exchange Membrane Fuel Cells (PEM)
Phosphoric Acid Fuel Cells (PAFC)
Molten Carbonate Fuel Cells (MCFC)
Solid Oxide Fuel Cells (SOFC)
FuelCell Energy, Inc.
www.fce.com
Commercial for stationary
Research and Development
GenCell Corporation
www.gencellcorp.com
Components supply
Stationary demonstrations
Components supply
Infinity Fuel Cell and Hydrogen, Inc.
www.infinityfuel.com
Research and Development for Regenerative Fuel Cells
UTC Power
www.utcpower.com
Commercial for Space craft
Bus and Auto Demonstrations, Back-up Power Demonstrations
Commercial for Stationary
These Connecticut companies are described more fully below:
1) FuelCell Energy, Inc. is headquartered in Danbury with a manufacturing facility in
Torrington. FuelCell Energy, Inc. is the global leader in molten carbonate fuel cell
products with power plant ratings from 300 to 2,400 kW. To date, installations at
over 50 customer sites in the U.S., Europe, and Asia (September 2006 presentation at
www.fce.com) have generated over 129 million kilowatt hours (kWh) of electricity in
stationary applications using natural gas or anaerobic digester gas from waste water
treatment plants. Future product research and development involves a combined cycle
plant which integrates the molten carbonate fuel cell with a gas turbine, a diesel fueled
power plant for shipboard power and a power plant which co-produces hydrogen for
use as a vehicle fuel. FuelCell Energy is also involved with R&D of solid oxide fuel
cells and leads a project team under the Department of Energy Solid State Energy
Conversion Alliance (SECA) program. This R&D is managed in Danbury, but is
carried out in Colorado and Canada by Versa, which is partially owned by FuelCell
Energy, Inc.
The Connecticut Center for Advanced Technology, Inc. © 2008 61
2) GenCell Corporation, located in Southbury, is a fuel cell developer and manufacturer
with a “design for continuous manufacture” approach to help make fuel cells
economically attractive. GenCell’s system product, a MCFC system suitable for the
mid-size stationary power user (40–125 kW) is in its demonstration phase. GenCell
also has a fuel cell components business, involving the sale of its metallic bipolar
plates to proton exchange and solid oxide fuel cell manufacturers.94
3) Infinity Fuel Cells is located in Windsor. Infinity is involved with development of
regenerative fuel cells which can be used to store electric energy from renewable or
other sources.
4) UTC Power is a unit of United Technologies Corporation located in South Windsor.
UTC provided the alkaline fuel cell power plants used in the Apollo lunar program in
the 1960s and 1970s; a more advanced alkaline fuel cell by UTC is used in the space
shuttle vehicle. UTC pioneered stationary applications of fuel cells with phosphoric
acid fuel cells. After demonstration activities in the 1960s, 1970s and 1980s, it
produced the initial commercial fuel cell product with deliveries beginning in 1992.
The third version of this 200 kW product is now in production while a 400 kW
product will be launched in 2009. Installations of more than 270 of these power
plants have occurred in 85 cities and 19 countries and the fleet has accumulated over
eight million hours and 1.4 billion kWh of successful operation to date
(www.utcpower.com). In the 1990s, UTC began development of proton exchange
membrane technology for undersea and vehicle applications and currently has
demonstration power plants in automobiles of three different manufacturers. The
largest demonstration fleet is a 32 vehicle fleet funded under a U.S. DOE program in
which UTC is a member of a team that includes Chevron and Hyundai.95 UTC also
provides fuel cell power plants for transit buses in California, Connecticut, and
94 GenCell Corporation 95 UTC Press Release dated February 18, 2005
The Connecticut Center for Advanced Technology, Inc. © 2008 62
Belgium. UTC also has R&D activity ongoing in SOFC and stationary PEM fuel
cells.
Core Competencies of Connecticut Fuel Cell Companies
Connecticut companies are unquestioned leaders in AFC, PAFC, and MCFC, are among the
global leaders in PEM fuel cells, and a key participant in the SOFC activity sponsored by the
U.S. DOE. Connecticut companies are also recognized as leaders in the integrated design of
power plants for spacecraft and large (hundreds of kW) stationary applications and among the
leaders in vehicle power plant integration. For stationary power plants, the system includes
conversion of hydrocarbon fuels such as natural gas, digester gas and petroleum products to
hydrogen, conversion of direct current power to alternating current, recovery of useful heat,
and operating multiple power plants in parallel with the grid and/or with other power plants.
With installation of hundreds of power plants throughout the world, and operation of these
power plants for millions of hours, these Connecticut companies have unequaled experience
with demonstrations and product support including application design, installation, parts
supply and maintenance.
Market Focus of Connecticut Fuel Cell Companies
The focus of Connecticut OEMs is on spacecraft applications, stationary applications for
primary power in the hundreds of kW and above range, replacement of battery back-up power
through hydrogen fuel cells and regenerative fuel cells and power plants for vehicles. Within
the stationary power market place, emphasis is on customers with (1) a need for very reliable
power, (2) customers with waste gas from anaerobic digester processes, (3) customers with
combined heat and power loads which can take advantage of all the outputs of the fuel cell
power plants, and (4) customers in situations where the distribution of central station power is
extremely costly or where environmental factors are major determinants of purchase
decisions. In the vehicle market, the focus is on power plants for buses and automobiles
although there is activity in fork lift truck and vehicle auxiliary power applications.
The Connecticut Center for Advanced Technology, Inc. © 2008 63
Connecticut does not have any companies that are strongly focused on small (several kW)
stationary fuel cells, or portable fuel cell applications such as power for personal computers
and communications devices. There is also limited activity in the component supply chain
for these fuel cell applications.
Major Issues Facing Connecticut Fuel Cell OEMs
Connecticut’s fuel cell companies face the same issues as other fuel cell companies
throughout the world. These include:
• Reducing manufactured cost to competitive levels even for specialized application to
low volume markets. Fuel cells are not competitive without subsidies for mass
markets in stationary and in particular vehicle applications. Costs are still integer
multiples of the required levels.
• Demonstrating the durability and reliability in long term commercial service to
validate fuel cell technical and economic characteristics.
• Developing market distribution channels and financial product offerings which
facilitate use of fuel cells in situations where the ultimate customer focuses on the
application of capital expenditures to the core business.
• Uncertainties regarding infrastructure investments needed to provide hydrogen fuel
for vehicle fuel cell power plants.
• Uncertainties regarding production of hydrogen-fueled vehicles by vehicle OEMs.
• Securing long-term investment in fuel cell research, development, manufacturing and
marketing, especially when compelling evidence of market acceptance is lacking.
• Capturing economic value from the environmental characteristics of fuel cells which
provide social benefit, but which are not recognized in economic decision-making.
• Instituting government policies which facilitate capturing benefits of distributed
generation.
• Acceptance of standards, codes and regulations associated with the use of stationary
fuel cell power plants and hydrogen-fueled vehicles and their infrastructure.
• Government decisions regarding incentives and regulatory policies favorable to
hydrogen fueled vehicles.
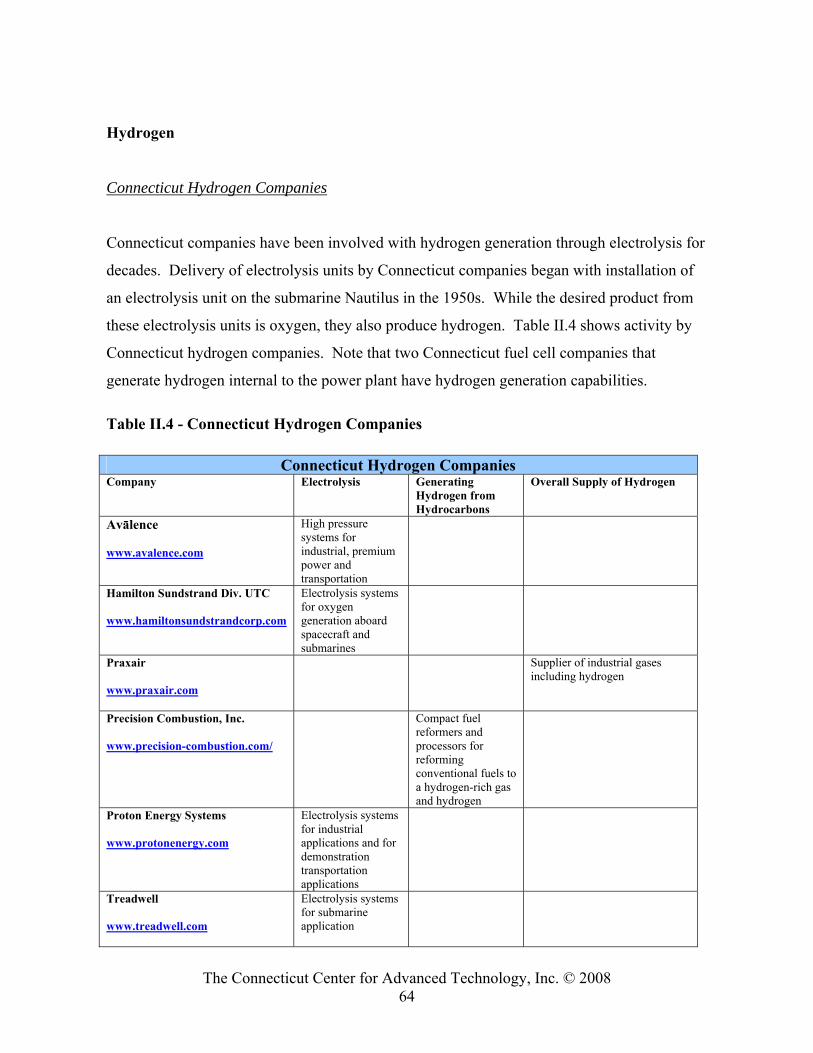
The Connecticut Center for Advanced Technology, Inc. © 2008 64
Hydrogen
Connecticut Hydrogen Companies
Connecticut companies have been involved with hydrogen generation through electrolysis for
decades. Delivery of electrolysis units by Connecticut companies began with installation of
an electrolysis unit on the submarine Nautilus in the 1950s. While the desired product from
these electrolysis units is oxygen, they also produce hydrogen. Table II.4 shows activity by
Connecticut hydrogen companies. Note that two Connecticut fuel cell companies that
generate hydrogen internal to the power plant have hydrogen generation capabilities.
Table II.4 - Connecticut Hydrogen Companies
Connecticut Hydrogen Companies Company Electrolysis Generating
Hydrogen from Hydrocarbons
Overall Supply of Hydrogen
Avālence www.avalence.com
High pressure systems for industrial, premium power and transportation
Hamilton Sundstrand Div. UTC www.hamiltonsundstrandcorp.com
Electrolysis systems for oxygen generation aboard spacecraft and submarines
Praxair www.praxair.com
Supplier of industrial gases including hydrogen
Precision Combustion, Inc. www.precision-combustion.com/
Compact fuel reformers and processors for reforming conventional fuels to a hydrogen-rich gas and hydrogen
Proton Energy Systems www.protonenergy.com
Electrolysis systems for industrial applications and for demonstration transportation applications
Treadwell www.treadwell.com
Electrolysis systems for submarine application
The Connecticut Center for Advanced Technology, Inc. © 2008 65
Core Competencies of Connecticut Hydrogen Companies
Connecticut hydrogen companies have expertise covering the entire range of hydrogen
generation and distribution. There are four electrolysis manufacturers in the State: Avālence,
Distributed Energy Systems (the parent company of Proton Energy Systems), Hamilton
Sundstrand Division of United Technologies and Treadwell.
Avālence, LLC based in Milford, CT offers leading-edge electrolytic technology to produce
high-pressure hydrogen gas for clean energy infrastructure applications. Avālence is a spin-
off of two longstanding Connecticut firms with more than 150 years combined experience in
the fields of hydrogen and air-separation equipment design and manufacture. Avālence’s
market focus is on commercializing a high pressure electrolyzer for use in industrial and
fueling.
Two of the Connecticut companies involved with electrolysis (Treadwell and the Hamilton
Sundstrand Division of United Technologies) focus their electrolysis products on oxygen
generation for submarines and spacecraft. Treadwell systems have been installed on over 100
submarines in the U.S. Navy fleet beginning with the submarine Nautilus in the 1950s.
Proton Energy Systems, a subsidiary of Distributed Energy Systems Corporation, produces
electrolysis systems for the purpose of hydrogen generation for industry, utilities, and a
number of hydrogen vehicle fueling stations for hydrogen vehicle systems. The company has
installed over 750 hydrogen generators in more than 41 countries.96 Proton is also involved
with application of its hydrogen generators in combination with a fuel cell power generator
for use as an electric energy storage device.
Precision Combustion is developing compact fuel reformers and processors for efficiently
reforming conventional fuels such as diesel, gasoline and biofuels to a hydrogen-rich gas and
hydrogen that can be used by fuel cell stacks. Its technology is primarily development stage,
96 Distributed Energy Systems Corporation Form 10-K filed on March 10, 2006
The Connecticut Center for Advanced Technology, Inc. © 2008 66
though it has sold fuel reformers for natural gas-fueled fuel cell systems. Precision’s primary
sources of fuel cell and hydrogen-related revenue have been the DOD and DOE.
Praxair is an industrial gas company that produces specialty gases including hydrogen and
distributes compressed gas and liquid hydrogen by tanker trucks and by compressed gas
hydrogen pipelines to industrial customers throughout the world. Praxair is involved with
demonstration projects associated with hydrogen-fueled vehicles and, together with Proton
Energy Systems also provides on-site generation of hydrogen through electrolysis. It should
be noted that while Praxair is headquartered and distributes hydrogen in Connecticut, its
hydrogen generation facilities are located in other states.
The major fuel cell OEMs in Connecticut are involved with generating hydrogen from
hydrocarbon fuels such as natural gas. UTC Power uses hydrogen generation technology in
its fuel cell power plants as an independent hydrogen generator. UTC Power has fuel cell
power plants in the drive systems of demonstration automobiles of Hyundai and Nissan, in
auxiliary power units in BMW vehicle demonstrations, and power plants in several fuel cell
buses in California, Connecticut and Europe. Both UTC Power and FuelCell Energy
incorporate on-site generation of hydrogen by reforming natural gas in their stationary fuel
cell power plants and have installed over 300 units in many countries around the globe;
together, they are the leaders or among the leaders in on-site hydrogen generation experience.
While they do not offer these products for applications such as on-site generation of hydrogen
from natural gas at fueling stations or for generation of hydrogen at waste water treatment
plants or landfills, those products would be natural adaptations of the fuel processors in their
current fuel cell products. FuelCell Energy is developing a fuel cell power plant which will
produce electricity, heat and hydrogen. Other fuel cell companies in Connecticut, such as
Infinity Fuel Cell and Hydrogen LLC incorporate hydrogen storage in regenerative fuel cell
systems.
In addition to these OEMs for fuel cell power plants and hydrogen infrastructure products and
services, over 40 Connecticut companies are involved with the production of components or
provision of services in this field. For example, in the area of services, AG/ENA an
The Connecticut Center for Advanced Technology, Inc. © 2008 67
architectural firm located in Connecticut, heads-up the ARRCH/H2 Alliance, which is a
multi-company initiative composed of industry leaders that have developed a design for a
Hydrogen Fueling Station/Information Center.
Market Focus of Connecticut Hydrogen Companies
Connecticut companies provide electrolysis units for on-site production of hydrogen and
oxygen for industrial, laboratory and utility customers. The integrated industrial gas supply
company, Praxair, focuses on hydrogen for industrial and laboratory applications. Precision
Combustion’s fuel processors are intended for integration with transportation and other fuel
cells, including most fuel cell stack technologies for both military and commercial markets.
Many of the Connecticut hydrogen companies are involved with demonstration of hydrogen
supply for vehicle use, usually as part of a U.S. DOE or state funded activity.
Connecticut’s Position in the Hydrogen and Fuel Cell Industry
Federal and International Activity, and Activity in Other States
During most of the second half of the twentieth century, Connecticut dominated the fuel cell
industry with programs in all types of fuel cells. Since the late 1980’s and 1990’s, fuel cell
and hydrogen activity has grown significantly in the United States and in many other
countries. Connecticut’s fuel cell industry still leads the fuel cell world, particularly in
stationary and spacecraft power plants, but Connecticut’s fuel cell industry is challenged by
strong global competition in vehicle fuel cell power plants and is currently not a factor in
portable fuel cell activity. Connecticut is the headquarters state for an industrial gas company
with industrial generation, storage and distribution of hydrogen and hosts a number of
companies involved with electrolysis products for generation of hydrogen.
The United States, Japan and the European Union have expanded efforts on fuel cells and
hydrogen and their industrial companies are joined by other industrial efforts in Australia,
China and India among others. In addition to companies focused on fuel cells, these efforts
The Connecticut Center for Advanced Technology, Inc. © 2008 68
cover fuel cells for stationary, vehicle and portable applications as well as all aspects of
hydrogen generation, storage, distribution and dispensing. These large national and industrial
efforts set the pace for development and demonstration of the technology for stationary,
vehicle and portable fuel cell power plants and development of all aspects of the hydrogen
infrastructure. Connecticut plans for hydrogen and fuel cell development must coordinate
with the timing of these large efforts and be guided by the technology and status they achieve.
Appendix E describes these hydrogen and fuel cell efforts.
Companies’ Positioning in Fuel Cells and Hydrogen
Connecticut is now challenged by the efforts of other states in fuel cells and hydrogen. The
neighboring states of New York and Massachusetts are particularly strong in small stationary
power plants, vehicle power plants and portable power plants. It should be noted that
Connecticut and its neighboring states have a major portion of the U.S. fuel cell and hydrogen
industry and are central to the east coast transportation system. California is not yet a strong
competitor in terms of industrial companies, but its air quality problems and market size
permit it to exert strong influence over national and industrial efforts. California is also a
leader in support of research, demonstration and early deployment activity. Ohio and
Michigan have strong programs to encourage economic development associated with fuel
cells and hydrogen because they have many jobs associated with the supply chain for vehicle
power plants. Florida and South Carolina have research activity which provides a base for
attracting federal funds and they are active in pursuit of relocation of industrial companies
through economic development incentives. Appendix E also describes these efforts of other
states.
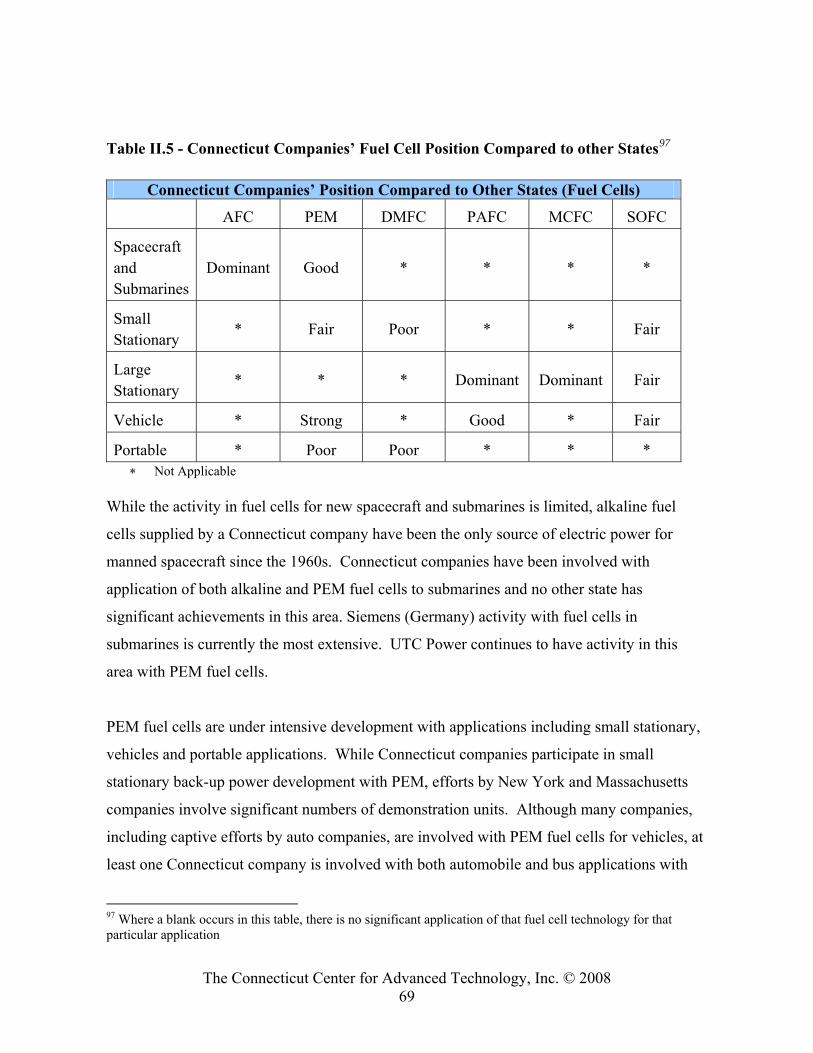
The Connecticut Center for Advanced Technology, Inc. © 2008 69
Table II.5 - Connecticut Companies’ Fuel Cell Position Compared to other States97
Connecticut Companies’ Position Compared to Other States (Fuel Cells)
AFC PEM DMFC PAFC MCFC SOFC
Spacecraft and Submarines
Dominant Good * * * *
Small Stationary
* Fair Poor * * Fair
Large Stationary
* * * Dominant Dominant Fair
Vehicle * Strong * Good * Fair
Portable * Poor Poor * * * ∗ Not Applicable
While the activity in fuel cells for new spacecraft and submarines is limited, alkaline fuel
cells supplied by a Connecticut company have been the only source of electric power for
manned spacecraft since the 1960s. Connecticut companies have been involved with
application of both alkaline and PEM fuel cells to submarines and no other state has
significant achievements in this area. Siemens (Germany) activity with fuel cells in
submarines is currently the most extensive. UTC Power continues to have activity in this
area with PEM fuel cells.
PEM fuel cells are under intensive development with applications including small stationary,
vehicles and portable applications. While Connecticut companies participate in small
stationary back-up power development with PEM, efforts by New York and Massachusetts
companies involve significant numbers of demonstration units. Although many companies,
including captive efforts by auto companies, are involved with PEM fuel cells for vehicles, at
least one Connecticut company is involved with both automobile and bus applications with
97 Where a blank occurs in this table, there is no significant application of that fuel cell technology for that particular application
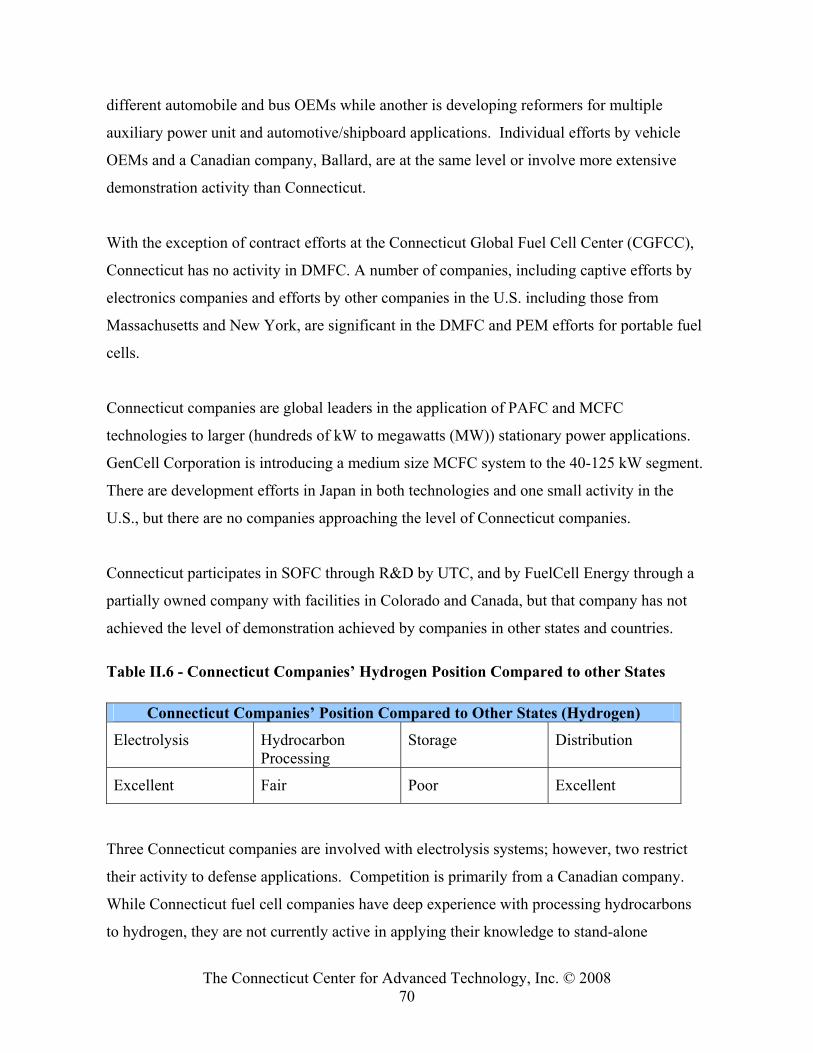
The Connecticut Center for Advanced Technology, Inc. © 2008 70
different automobile and bus OEMs while another is developing reformers for multiple
auxiliary power unit and automotive/shipboard applications. Individual efforts by vehicle
OEMs and a Canadian company, Ballard, are at the same level or involve more extensive
demonstration activity than Connecticut.
With the exception of contract efforts at the Connecticut Global Fuel Cell Center (CGFCC),
Connecticut has no activity in DMFC. A number of companies, including captive efforts by
electronics companies and efforts by other companies in the U.S. including those from
Massachusetts and New York, are significant in the DMFC and PEM efforts for portable fuel
cells.
Connecticut companies are global leaders in the application of PAFC and MCFC
technologies to larger (hundreds of kW to megawatts (MW)) stationary power applications.
GenCell Corporation is introducing a medium size MCFC system to the 40-125 kW segment.
There are development efforts in Japan in both technologies and one small activity in the
U.S., but there are no companies approaching the level of Connecticut companies.
Connecticut participates in SOFC through R&D by UTC, and by FuelCell Energy through a
partially owned company with facilities in Colorado and Canada, but that company has not
achieved the level of demonstration achieved by companies in other states and countries.
Table II.6 - Connecticut Companies’ Hydrogen Position Compared to other States
Connecticut Companies’ Position Compared to Other States (Hydrogen)
Electrolysis Hydrocarbon Processing
Storage Distribution
Excellent Fair Poor Excellent
Three Connecticut companies are involved with electrolysis systems; however, two restrict
their activity to defense applications. Competition is primarily from a Canadian company.
While Connecticut fuel cell companies have deep experience with processing hydrocarbons
to hydrogen, they are not currently active in applying their knowledge to stand-alone
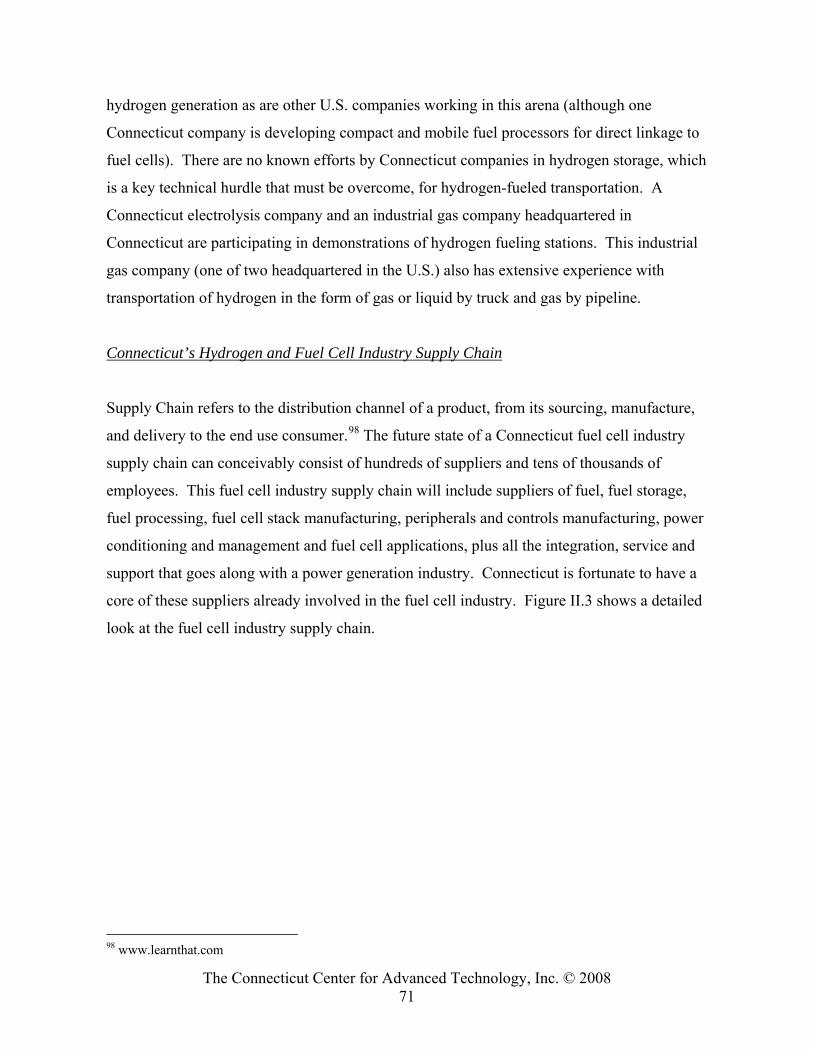
The Connecticut Center for Advanced Technology, Inc. © 2008 71
hydrogen generation as are other U.S. companies working in this arena (although one
Connecticut company is developing compact and mobile fuel processors for direct linkage to
fuel cells). There are no known efforts by Connecticut companies in hydrogen storage, which
is a key technical hurdle that must be overcome, for hydrogen-fueled transportation. A
Connecticut electrolysis company and an industrial gas company headquartered in
Connecticut are participating in demonstrations of hydrogen fueling stations. This industrial
gas company (one of two headquartered in the U.S.) also has extensive experience with
transportation of hydrogen in the form of gas or liquid by truck and gas by pipeline.
Connecticut’s Hydrogen and Fuel Cell Industry Supply Chain
Supply Chain refers to the distribution channel of a product, from its sourcing, manufacture,
and delivery to the end use consumer.98 The future state of a Connecticut fuel cell industry
supply chain can conceivably consist of hundreds of suppliers and tens of thousands of
employees. This fuel cell industry supply chain will include suppliers of fuel, fuel storage,
fuel processing, fuel cell stack manufacturing, peripherals and controls manufacturing, power
conditioning and management and fuel cell applications, plus all the integration, service and
support that goes along with a power generation industry. Connecticut is fortunate to have a
core of these suppliers already involved in the fuel cell industry. Figure II.3 shows a detailed
look at the fuel cell industry supply chain.
98 www.learnthat.com
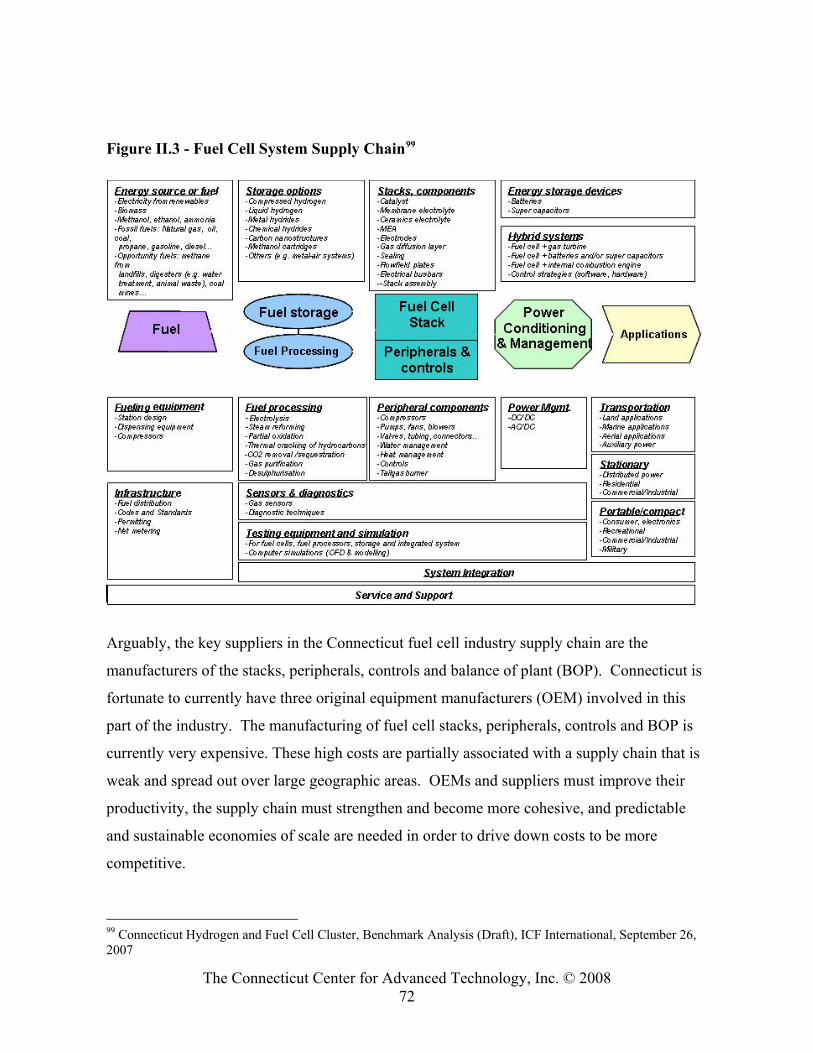
The Connecticut Center for Advanced Technology, Inc. © 2008 72
Figure II.3 - Fuel Cell System Supply Chain99
Arguably, the key suppliers in the Connecticut fuel cell industry supply chain are the
manufacturers of the stacks, peripherals, controls and balance of plant (BOP). Connecticut is
fortunate to currently have three original equipment manufacturers (OEM) involved in this
part of the industry. The manufacturing of fuel cell stacks, peripherals, controls and BOP is
currently very expensive. These high costs are partially associated with a supply chain that is
weak and spread out over large geographic areas. OEMs and suppliers must improve their
productivity, the supply chain must strengthen and become more cohesive, and predictable
and sustainable economies of scale are needed in order to drive down costs to be more
competitive.
99 Connecticut Hydrogen and Fuel Cell Cluster, Benchmark Analysis (Draft), ICF International, September 26, 2007
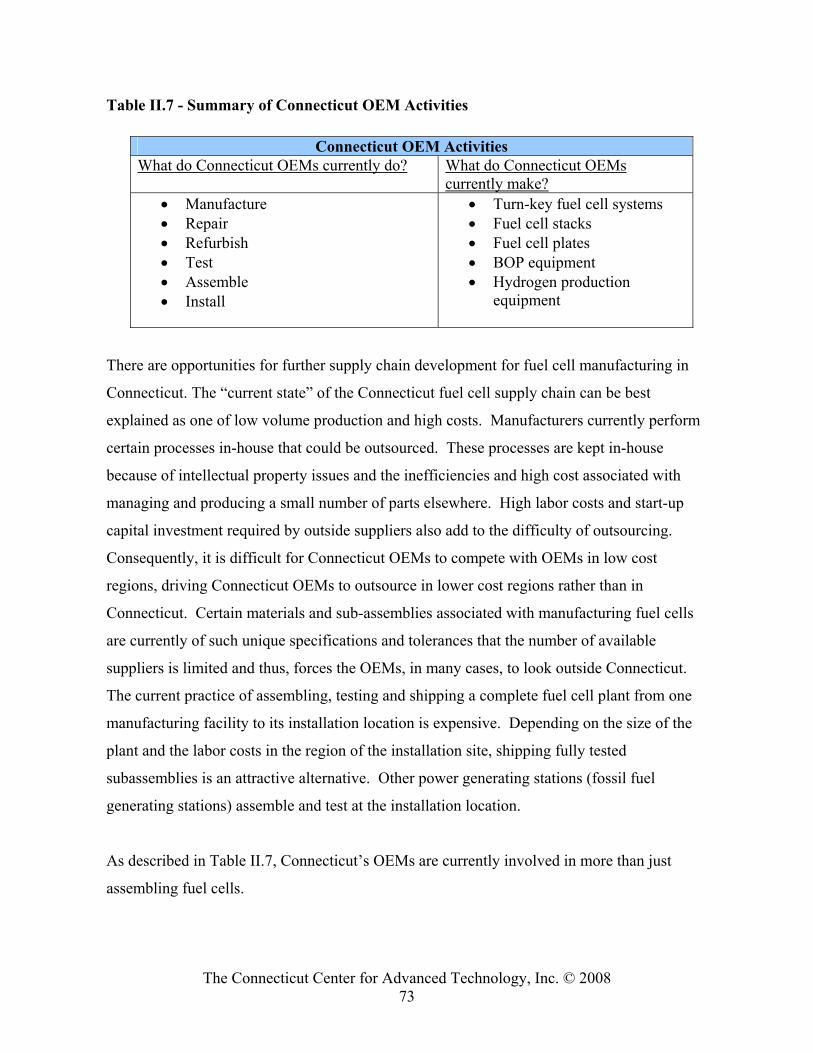
The Connecticut Center for Advanced Technology, Inc. © 2008 73
Table II.7 - Summary of Connecticut OEM Activities
Connecticut OEM Activities What do Connecticut OEMs currently do?
What do Connecticut OEMs currently make?
• Manufacture • Repair • Refurbish • Test • Assemble • Install
• Turn-key fuel cell systems • Fuel cell stacks • Fuel cell plates • BOP equipment • Hydrogen production
equipment
There are opportunities for further supply chain development for fuel cell manufacturing in
Connecticut. The “current state” of the Connecticut fuel cell supply chain can be best
explained as one of low volume production and high costs. Manufacturers currently perform
certain processes in-house that could be outsourced. These processes are kept in-house
because of intellectual property issues and the inefficiencies and high cost associated with
managing and producing a small number of parts elsewhere. High labor costs and start-up
capital investment required by outside suppliers also add to the difficulty of outsourcing.
Consequently, it is difficult for Connecticut OEMs to compete with OEMs in low cost
regions, driving Connecticut OEMs to outsource in lower cost regions rather than in
Connecticut. Certain materials and sub-assemblies associated with manufacturing fuel cells
are currently of such unique specifications and tolerances that the number of available
suppliers is limited and thus, forces the OEMs, in many cases, to look outside Connecticut.
The current practice of assembling, testing and shipping a complete fuel cell plant from one
manufacturing facility to its installation location is expensive. Depending on the size of the
plant and the labor costs in the region of the installation site, shipping fully tested
subassemblies is an attractive alternative. Other power generating stations (fossil fuel
generating stations) assemble and test at the installation location.
As described in Table II.7, Connecticut’s OEMs are currently involved in more than just
assembling fuel cells.
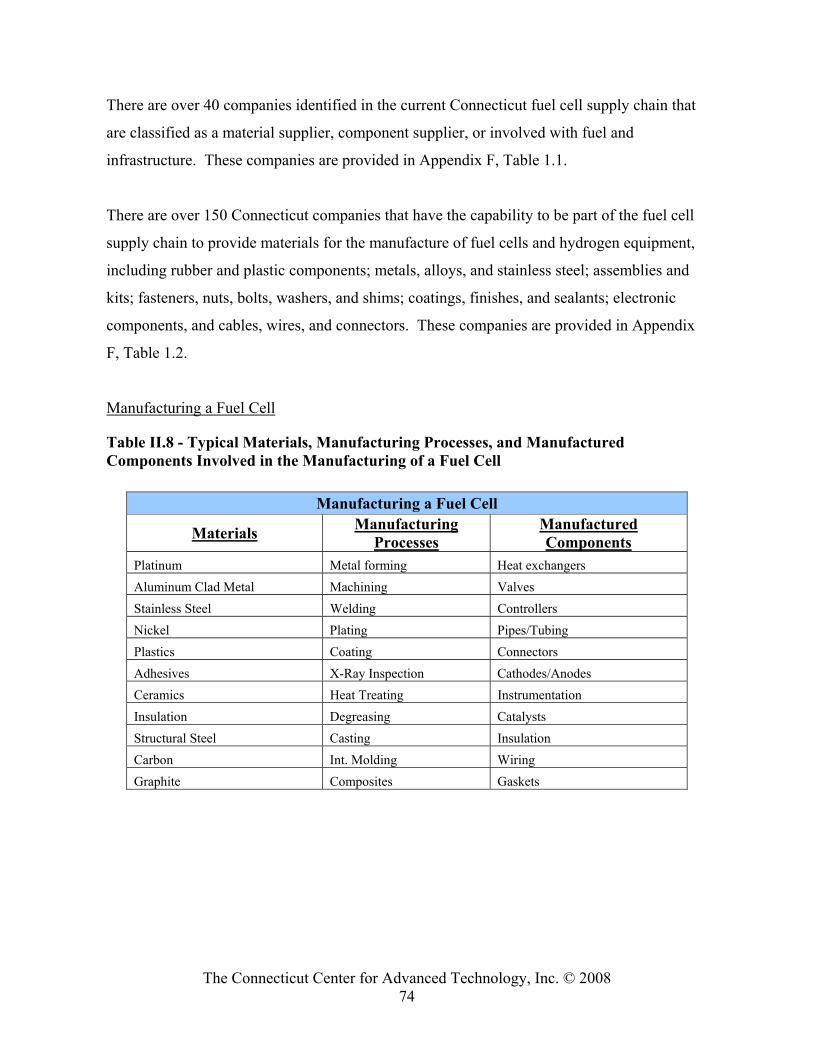
The Connecticut Center for Advanced Technology, Inc. © 2008 74
There are over 40 companies identified in the current Connecticut fuel cell supply chain that
are classified as a material supplier, component supplier, or involved with fuel and
infrastructure. These companies are provided in Appendix F, Table 1.1.
There are over 150 Connecticut companies that have the capability to be part of the fuel cell
supply chain to provide materials for the manufacture of fuel cells and hydrogen equipment,
including rubber and plastic components; metals, alloys, and stainless steel; assemblies and
kits; fasteners, nuts, bolts, washers, and shims; coatings, finishes, and sealants; electronic
components, and cables, wires, and connectors. These companies are provided in Appendix
F, Table 1.2.
Manufacturing a Fuel Cell
Table II.8 - Typical Materials, Manufacturing Processes, and Manufactured Components Involved in the Manufacturing of a Fuel Cell
Manufacturing a Fuel Cell
Materials Manufacturing Processes
Manufactured Components
Platinum Metal forming Heat exchangers Aluminum Clad Metal Machining Valves Stainless Steel Welding Controllers Nickel Plating Pipes/Tubing Plastics Coating Connectors Adhesives X-Ray Inspection Cathodes/Anodes Ceramics Heat Treating Instrumentation Insulation Degreasing Catalysts Structural Steel Casting Insulation Carbon Int. Molding Wiring Graphite Composites Gaskets
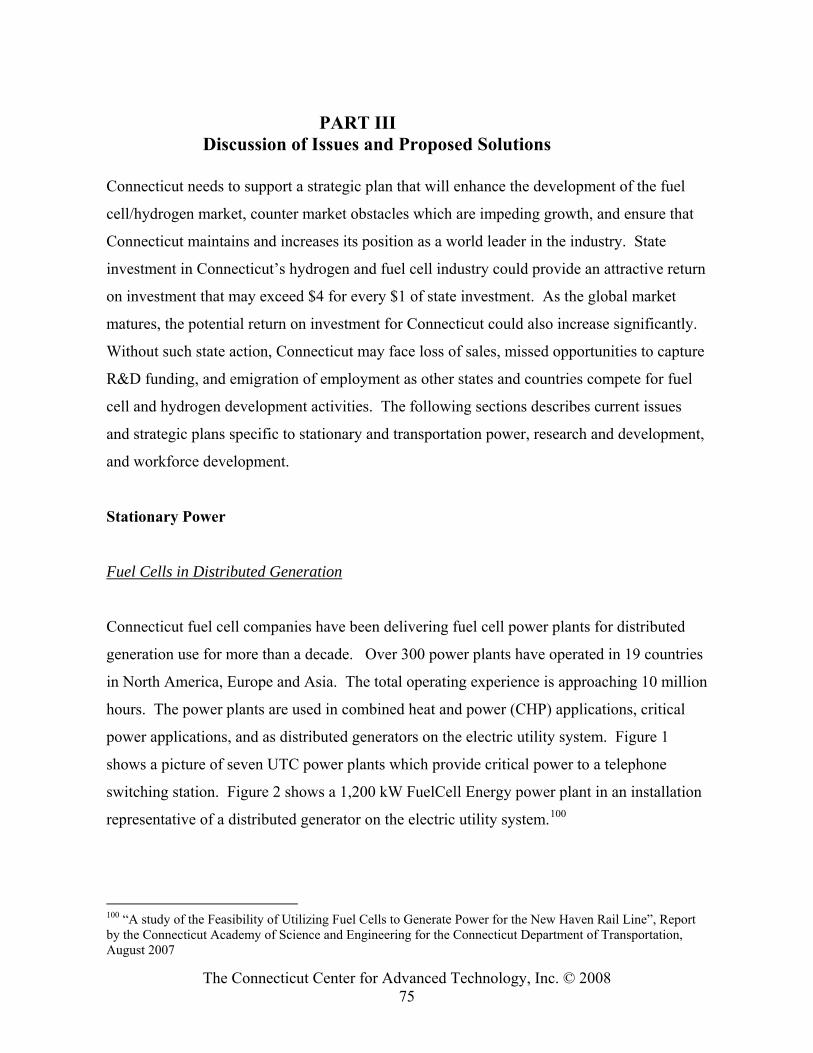
The Connecticut Center for Advanced Technology, Inc. © 2008 75
PART III Discussion of Issues and Proposed Solutions
Connecticut needs to support a strategic plan that will enhance the development of the fuel
cell/hydrogen market, counter market obstacles which are impeding growth, and ensure that
Connecticut maintains and increases its position as a world leader in the industry. State
investment in Connecticut’s hydrogen and fuel cell industry could provide an attractive return
on investment that may exceed $4 for every $1 of state investment. As the global market
matures, the potential return on investment for Connecticut could also increase significantly.
Without such state action, Connecticut may face loss of sales, missed opportunities to capture
R&D funding, and emigration of employment as other states and countries compete for fuel
cell and hydrogen development activities. The following sections describes current issues
and strategic plans specific to stationary and transportation power, research and development,
and workforce development.
Stationary Power
Fuel Cells in Distributed Generation
Connecticut fuel cell companies have been delivering fuel cell power plants for distributed
generation use for more than a decade. Over 300 power plants have operated in 19 countries
in North America, Europe and Asia. The total operating experience is approaching 10 million
hours. The power plants are used in combined heat and power (CHP) applications, critical
power applications, and as distributed generators on the electric utility system. Figure 1
shows a picture of seven UTC power plants which provide critical power to a telephone
switching station. Figure 2 shows a 1,200 kW FuelCell Energy power plant in an installation
representative of a distributed generator on the electric utility system.100
100 “A study of the Feasibility of Utilizing Fuel Cells to Generate Power for the New Haven Rail Line”, Report by the Connecticut Academy of Science and Engineering for the Connecticut Department of Transportation, August 2007
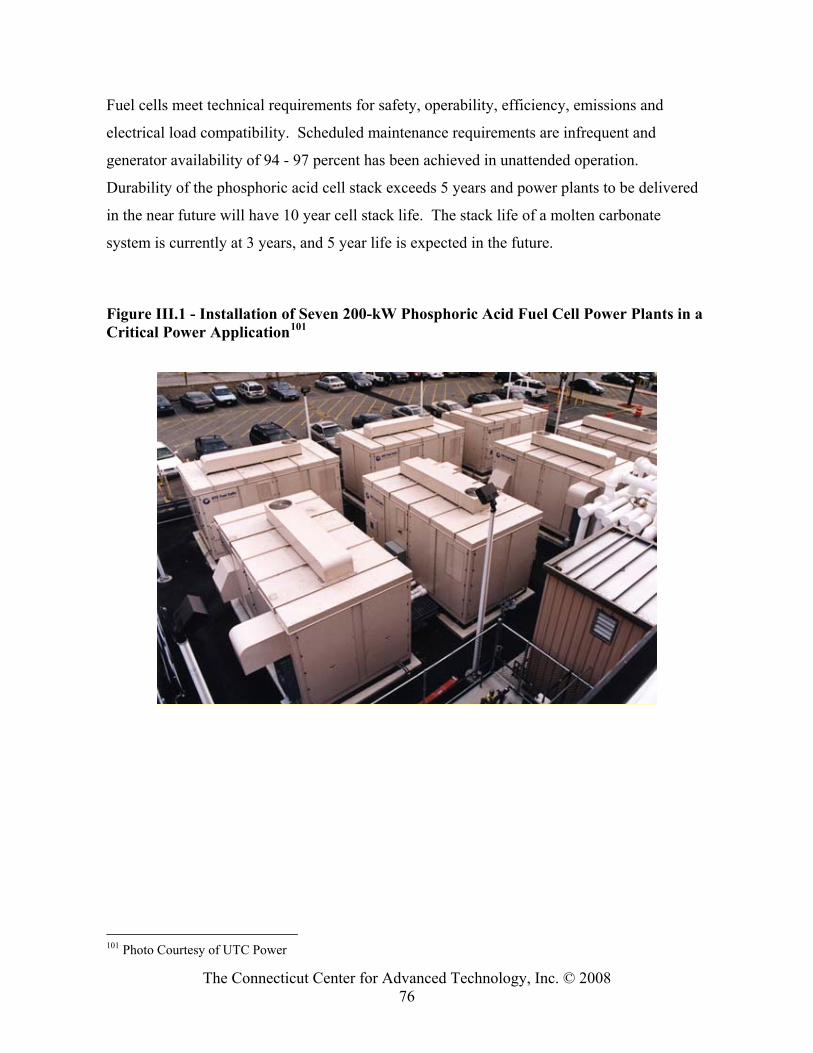
The Connecticut Center for Advanced Technology, Inc. © 2008 76
Fuel cells meet technical requirements for safety, operability, efficiency, emissions and
electrical load compatibility. Scheduled maintenance requirements are infrequent and
generator availability of 94 - 97 percent has been achieved in unattended operation.
Durability of the phosphoric acid cell stack exceeds 5 years and power plants to be delivered
in the near future will have 10 year cell stack life. The stack life of a molten carbonate
system is currently at 3 years, and 5 year life is expected in the future.
Figure III.1 - Installation of Seven 200-kW Phosphoric Acid Fuel Cell Power Plants in a Critical Power Application101
101 Photo Courtesy of UTC Power
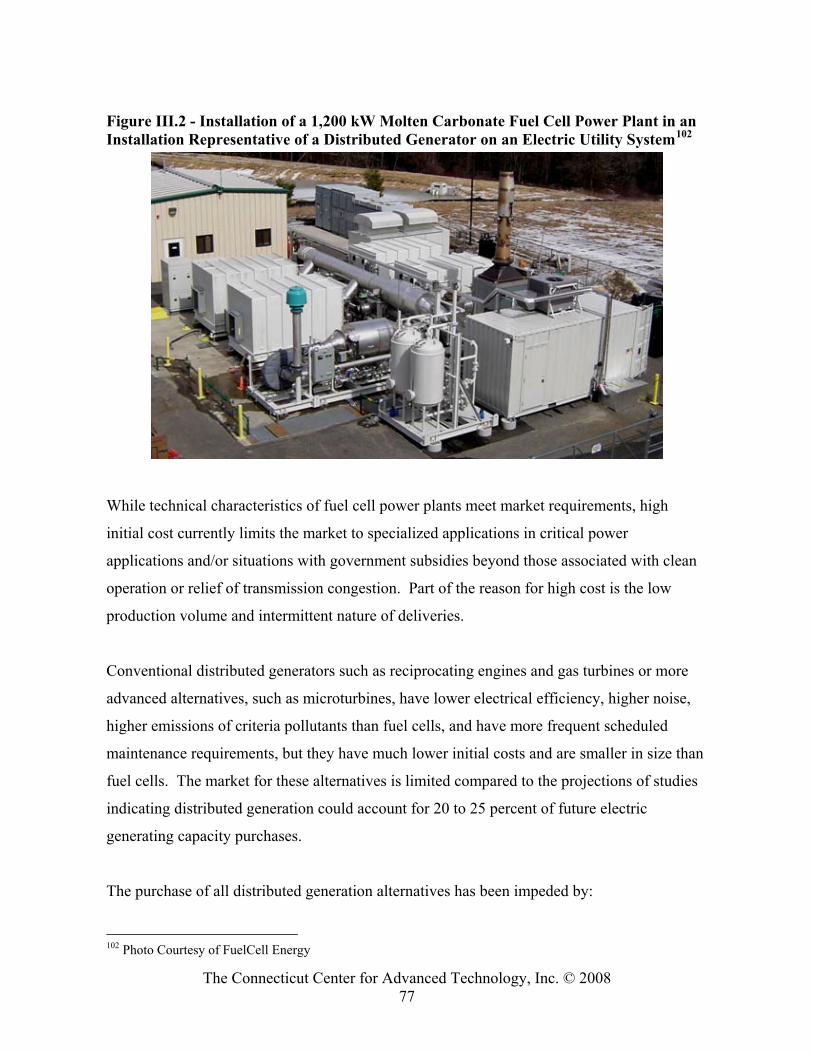
The Connecticut Center for Advanced Technology, Inc. © 2008 77
Figure III.2 - Installation of a 1,200 kW Molten Carbonate Fuel Cell Power Plant in an Installation Representative of a Distributed Generator on an Electric Utility System102
While technical characteristics of fuel cell power plants meet market requirements, high
initial cost currently limits the market to specialized applications in critical power
applications and/or situations with government subsidies beyond those associated with clean
operation or relief of transmission congestion. Part of the reason for high cost is the low
production volume and intermittent nature of deliveries.
Conventional distributed generators such as reciprocating engines and gas turbines or more
advanced alternatives, such as microturbines, have lower electrical efficiency, higher noise,
higher emissions of criteria pollutants than fuel cells, and have more frequent scheduled
maintenance requirements, but they have much lower initial costs and are smaller in size than
fuel cells. The market for these alternatives is limited compared to the projections of studies
indicating distributed generation could account for 20 to 25 percent of future electric
generating capacity purchases.
The purchase of all distributed generation alternatives has been impeded by:
102 Photo Courtesy of FuelCell Energy
The Connecticut Center for Advanced Technology, Inc. © 2008 78
• Stringent interconnection requirements;
• Lack of recognition of benefits from lower emissions, lower transmission and
distribution costs and lower production of greenhouse gases;
• A requirement for investment in electric generation equipment by customers with no
relevant skills. A customer-owned distributed generator represents a paradigm shift
from a traditionally outsourced purchase of power from a utility to the in-sourcing of a
service which is outside the core competencies of most customers.
To overcome the impediments to wide spread use of fuel cells, investment by the state to
reduce unit costs through increased production and predictable demand, as well as enhanced
R&D support, is recommended in conjunction with meeting Connecticut power requirements.
This section:
• reviews those requirements which include both the generation needed to meet
increasing demand, clean generation required to meet Connecticut Renewable
Portfolio Standards (RPS);
• describes current Connecticut support for stationary fuel cells;
• suggests additional measures to support market development and jobs for
Connecticut’s fuel cell industry; and
• finally, the benefits of this state investment are reviewed.
Connecticut Electric Power Needs
As previously discussed, Connecticut is projected to have an electric generation capacity gap
beginning soon after 2009 with a potential need for over 3,600 MW of generation capacity by
2016 (approximately 1,200 MW of new demand plus 2,400 MW of capacity that could be
retired for a total capacity need of 3,600 MW by 2016).103 Connecticut only has the ability
to move approximately 30 percent of needed electric capacity from out of state resources into
Connecticut load areas by transmission facilities. Consequently, Connecticut will be faced 103 The Connecticut Forecast of Loads and Resources also identifies a need for new energy capacity soon after 2009: 406 MW deficiency by 2009 that grows to 1,241 MW by 2016 under ISO 90/10; with retirement of oldest oil and coal facilities deficiency is 897 MW in 2008 and increases to 3,702 MW in 2016
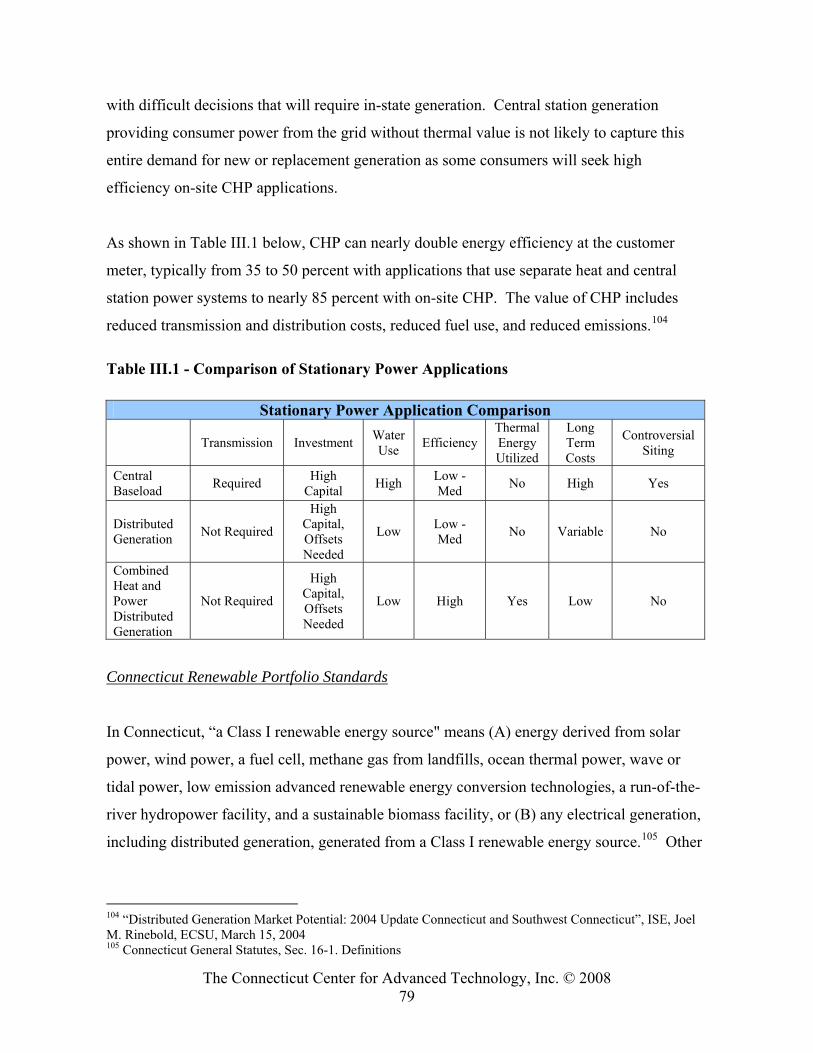
The Connecticut Center for Advanced Technology, Inc. © 2008 79
with difficult decisions that will require in-state generation. Central station generation
providing consumer power from the grid without thermal value is not likely to capture this
entire demand for new or replacement generation as some consumers will seek high
efficiency on-site CHP applications.
As shown in Table III.1 below, CHP can nearly double energy efficiency at the customer
meter, typically from 35 to 50 percent with applications that use separate heat and central
station power systems to nearly 85 percent with on-site CHP. The value of CHP includes
reduced transmission and distribution costs, reduced fuel use, and reduced emissions.104
Table III.1 - Comparison of Stationary Power Applications
Stationary Power Application Comparison
Transmission Investment Water
Use Efficiency Thermal Energy Utilized
Long Term Costs
Controversial Siting
Central Baseload Required High
Capital High Low - Med No High Yes
Distributed Generation Not Required
High Capital, Offsets Needed
Low Low - Med No Variable No
Combined Heat and Power Distributed Generation
Not Required
High Capital, Offsets Needed
Low High Yes Low No
Connecticut Renewable Portfolio Standards
In Connecticut, “a Class I renewable energy source" means (A) energy derived from solar
power, wind power, a fuel cell, methane gas from landfills, ocean thermal power, wave or
tidal power, low emission advanced renewable energy conversion technologies, a run-of-the-
river hydropower facility, and a sustainable biomass facility, or (B) any electrical generation,
including distributed generation, generated from a Class I renewable energy source.105 Other
104 “Distributed Generation Market Potential: 2004 Update Connecticut and Southwest Connecticut”, ISE, Joel M. Rinebold, ECSU, March 15, 2004 105 Connecticut General Statutes, Sec. 16-1. Definitions
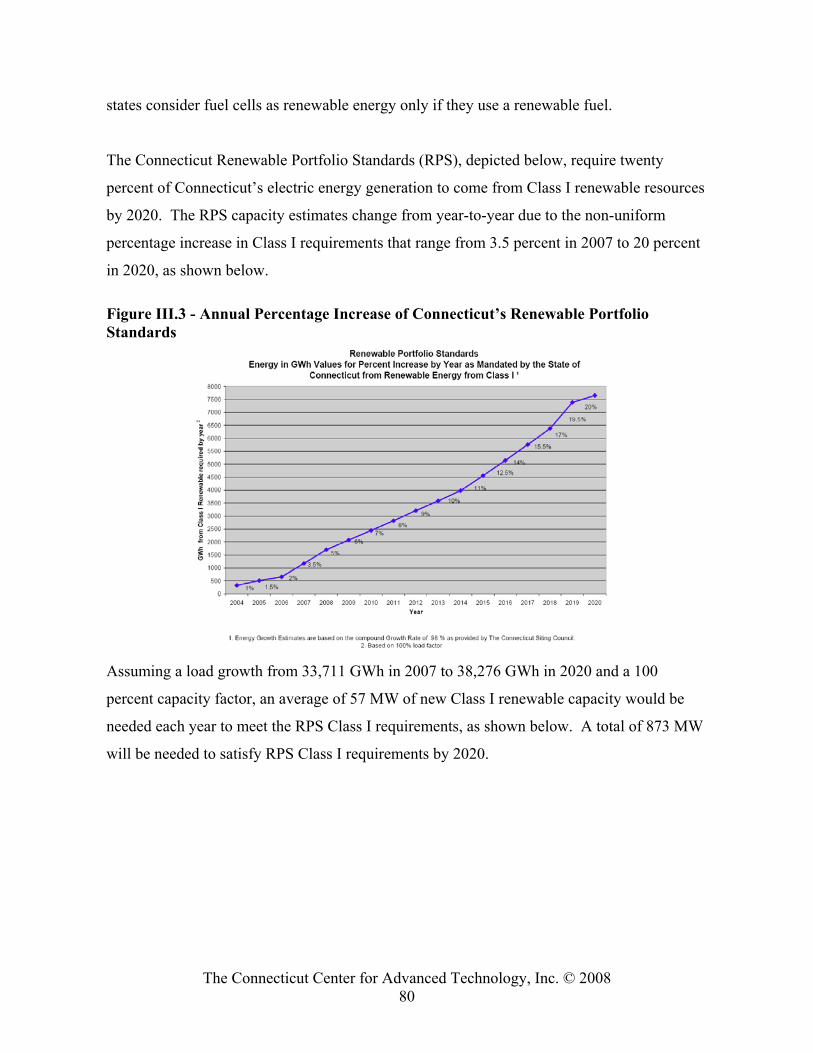
The Connecticut Center for Advanced Technology, Inc. © 2008 80
states consider fuel cells as renewable energy only if they use a renewable fuel.
The Connecticut Renewable Portfolio Standards (RPS), depicted below, require twenty
percent of Connecticut’s electric energy generation to come from Class I renewable resources
by 2020. The RPS capacity estimates change from year-to-year due to the non-uniform
percentage increase in Class I requirements that range from 3.5 percent in 2007 to 20 percent
in 2020, as shown below.
Figure III.3 - Annual Percentage Increase of Connecticut’s Renewable Portfolio Standards
Assuming a load growth from 33,711 GWh in 2007 to 38,276 GWh in 2020 and a 100
percent capacity factor, an average of 57 MW of new Class I renewable capacity would be
needed each year to meet the RPS Class I requirements, as shown below. A total of 873 MW
will be needed to satisfy RPS Class I requirements by 2020.
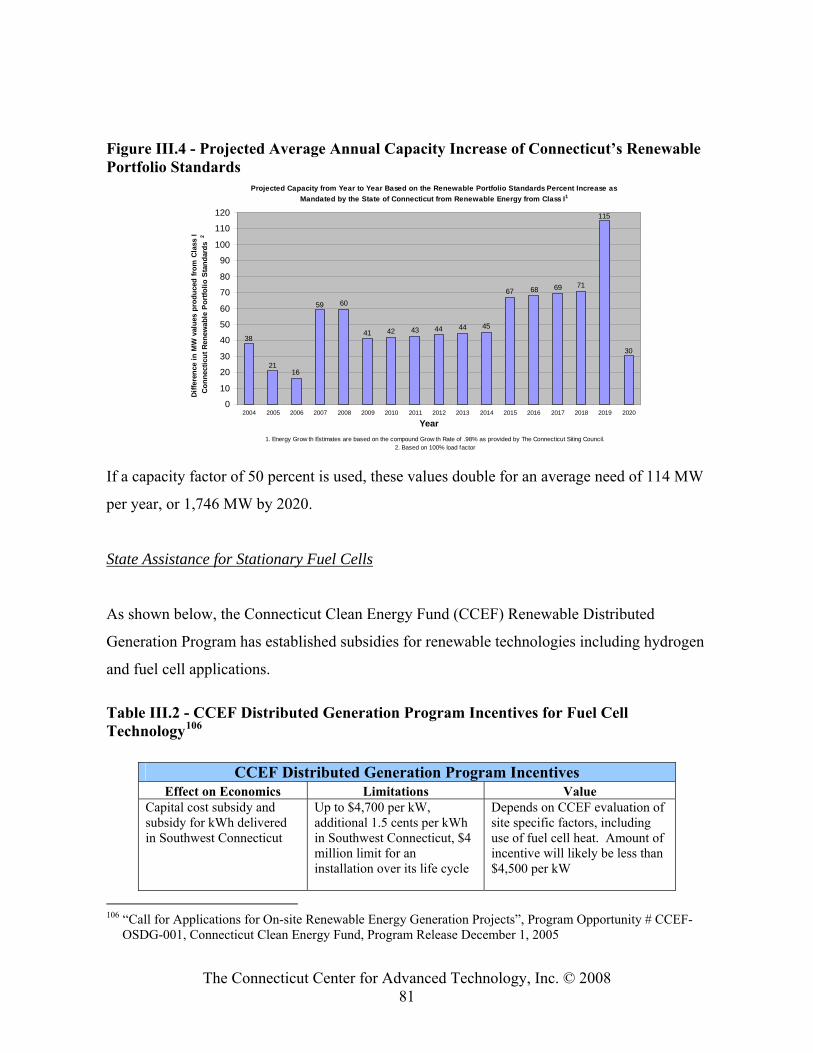
The Connecticut Center for Advanced Technology, Inc. © 2008 81
Figure III.4 - Projected Average Annual Capacity Increase of Connecticut’s Renewable Portfolio Standards
Projected Capacity from Year to Year Based on the Renewable Portfolio Standards Percent Increase as Mandated by the State of Connecticut from Renewable Energy from Class I1
16
115
30
71696867
454444434241
6059
21
38
0
10
20
30
40
50
60
70
80
90
100
110
120
2004 2005 2006 2007 2008 2009 2010 2011 2012 2013 2014 2015 2016 2017 2018 2019 2020
Year
Diffe
renc
e in
MW
val
ues
prod
uced
from
Cla
ss I
Conn
ectic
ut R
enew
able
Por
tfolio
Sta
ndar
ds2
1. Energy Grow th Estimates are based on the compound Grow th Rate of .98% as provided by The Connecticut Siting Council.2. Based on 100% load factor
If a capacity factor of 50 percent is used, these values double for an average need of 114 MW
per year, or 1,746 MW by 2020.
State Assistance for Stationary Fuel Cells
As shown below, the Connecticut Clean Energy Fund (CCEF) Renewable Distributed
Generation Program has established subsidies for renewable technologies including hydrogen
and fuel cell applications.
Table III.2 - CCEF Distributed Generation Program Incentives for Fuel Cell Technology106
CCEF Distributed Generation Program Incentives Effect on Economics Limitations Value
Capital cost subsidy and subsidy for kWh delivered in Southwest Connecticut
Up to $4,700 per kW, additional 1.5 cents per kWh in Southwest Connecticut, $4 million limit for an installation over its life cycle
Depends on CCEF evaluation of site specific factors, including use of fuel cell heat. Amount of incentive will likely be less than $4,500 per kW
106 “Call for Applications for On-site Renewable Energy Generation Projects”, Program Opportunity # CCEF-
OSDG-001, Connecticut Clean Energy Fund, Program Release December 1, 2005
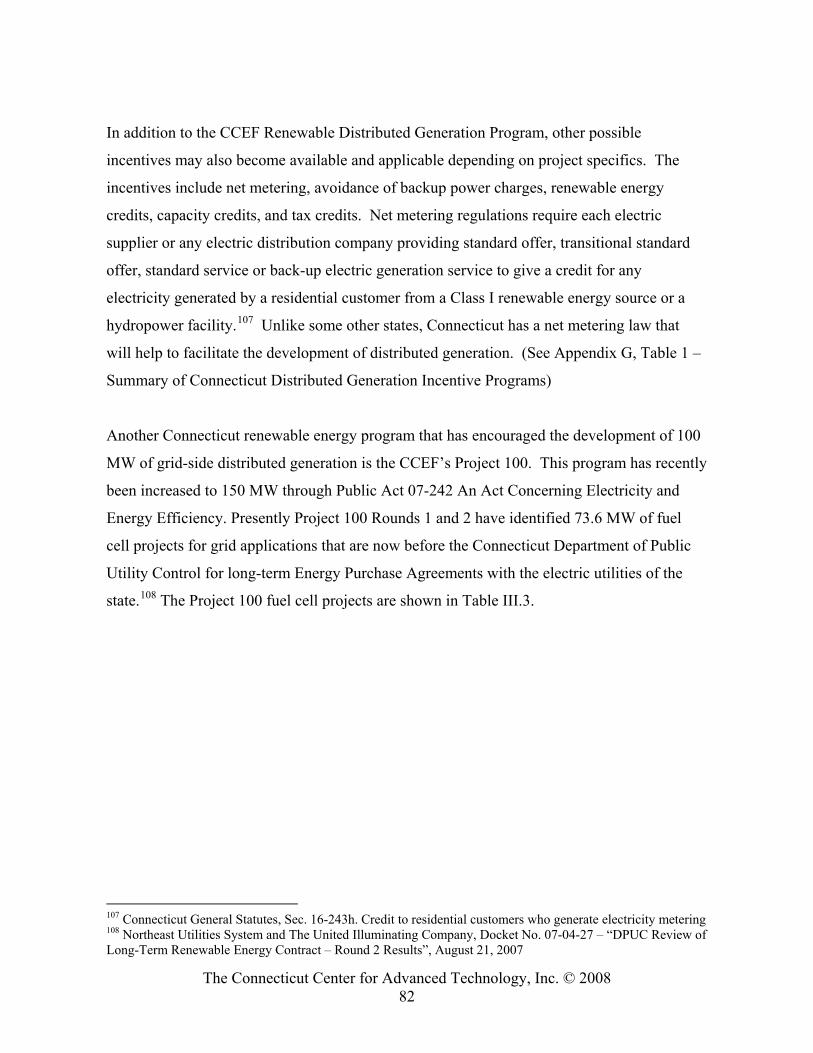
The Connecticut Center for Advanced Technology, Inc. © 2008 82
In addition to the CCEF Renewable Distributed Generation Program, other possible
incentives may also become available and applicable depending on project specifics. The
incentives include net metering, avoidance of backup power charges, renewable energy
credits, capacity credits, and tax credits. Net metering regulations require each electric
supplier or any electric distribution company providing standard offer, transitional standard
offer, standard service or back-up electric generation service to give a credit for any
electricity generated by a residential customer from a Class I renewable energy source or a
hydropower facility.107 Unlike some other states, Connecticut has a net metering law that
will help to facilitate the development of distributed generation. (See Appendix G, Table 1 –
Summary of Connecticut Distributed Generation Incentive Programs)
Another Connecticut renewable energy program that has encouraged the development of 100
MW of grid-side distributed generation is the CCEF’s Project 100. This program has recently
been increased to 150 MW through Public Act 07-242 An Act Concerning Electricity and
Energy Efficiency. Presently Project 100 Rounds 1 and 2 have identified 73.6 MW of fuel
cell projects for grid applications that are now before the Connecticut Department of Public
Utility Control for long-term Energy Purchase Agreements with the electric utilities of the
state.108 The Project 100 fuel cell projects are shown in Table III.3.
107 Connecticut General Statutes, Sec. 16-243h. Credit to residential customers who generate electricity metering 108 Northeast Utilities System and The United Illuminating Company, Docket No. 07-04-27 – “DPUC Review of Long-Term Renewable Energy Contract – Round 2 Results”, August 21, 2007
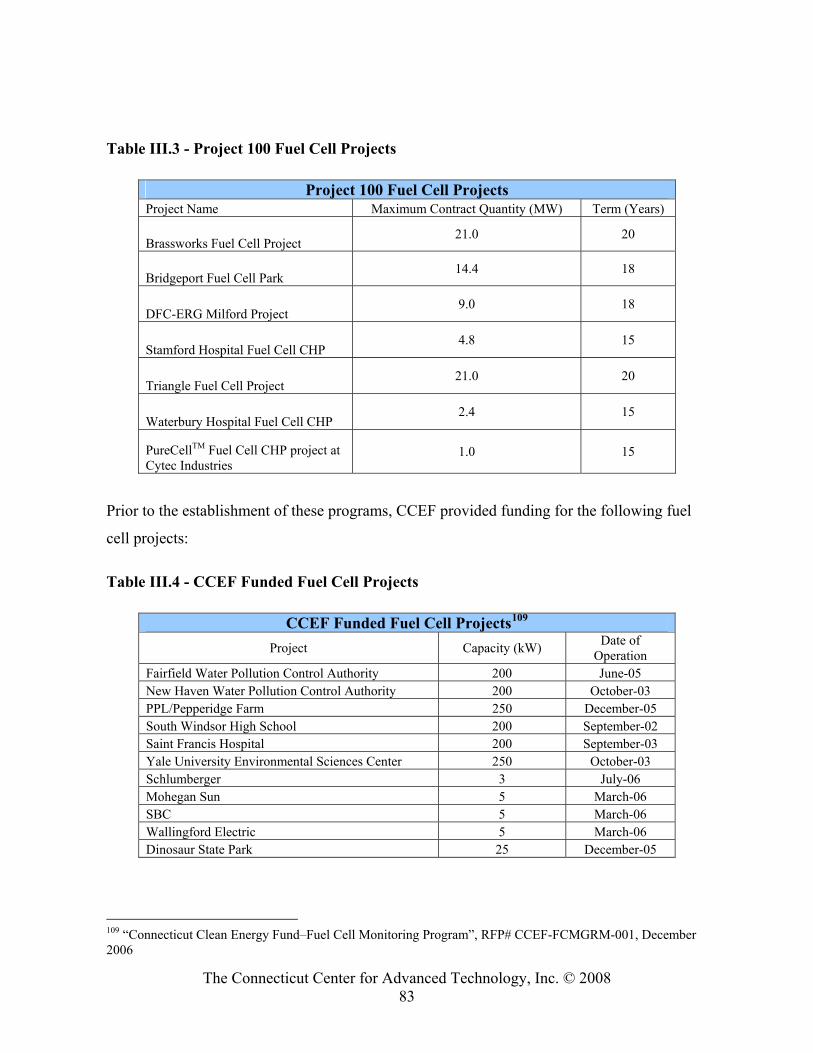
The Connecticut Center for Advanced Technology, Inc. © 2008 83
Table III.3 - Project 100 Fuel Cell Projects
Project 100 Fuel Cell Projects Project Name Maximum Contract Quantity (MW) Term (Years)
Brassworks Fuel Cell Project 21.0 20
Bridgeport Fuel Cell Park 14.4 18
DFC-ERG Milford Project 9.0 18
Stamford Hospital Fuel Cell CHP 4.8 15
Triangle Fuel Cell Project 21.0 20
Waterbury Hospital Fuel Cell CHP 2.4 15
PureCellTM Fuel Cell CHP project at Cytec Industries
1.0 15
Prior to the establishment of these programs, CCEF provided funding for the following fuel
cell projects:
Table III.4 - CCEF Funded Fuel Cell Projects
CCEF Funded Fuel Cell Projects109 Project Capacity (kW) Date of
Operation Fairfield Water Pollution Control Authority 200 June-05 New Haven Water Pollution Control Authority 200 October-03 PPL/Pepperidge Farm 250 December-05 South Windsor High School 200 September-02 Saint Francis Hospital 200 September-03 Yale University Environmental Sciences Center 250 October-03 Schlumberger 3 July-06 Mohegan Sun 5 March-06 SBC 5 March-06 Wallingford Electric 5 March-06 Dinosaur State Park 25 December-05
109 “Connecticut Clean Energy Fund–Fuel Cell Monitoring Program”, RFP# CCEF-FCMGRM-001, December 2006
The Connecticut Center for Advanced Technology, Inc. © 2008 84
The Connecticut legislature through Connecticut Public Act 05-1, An Act Concerning Energy
Independence, and the Connecticut Department of Public Utility Control (DPUC) also
established a program to provide monetary grants and other financial incentives to assist
commercial and industrial customers with the cost of installing customer-owned electric
generating equipment. As of August 24, 2007, over 270 MW of distributed generation had
been approved for applications including emergency generation, CHP, base load, demand
response and peak shaving. However, none of these projects used hydrogen or fuel cell
technology.110
Overall, these incentive programs are of high value and have produced many proposals, but
have not firmly identified market capacity goals for fuel cell development, identified specific
application targets with regulatory guidance, or confirmed the long-term availability and
transparency of funding. Consequently, the fuel cell industry has not been able to project
Connecticut’s best and most favored opportunities that could be funded and thus have not
been able to develop manufacturing production facilities at a size and scale that will drive
down costs.
New Opportunities
The threat of capacity shortages is real and potentially significant. Consequently, strategic
planning to guide consumers to alternative and more efficient energy resources in a timely
manner will extend the time of use for available resources and reduce the impact attributable
to shortages of hydrocarbon fuels. Strategic placement of fuel cells across the state at
government facilities, electric generation facilities, substations (to support critical grid and
voltage support), within microgrids, and at large energy use facilities can provide significant
reliability benefits and promote energy independence.
110 “Connecticut Department of Public Utility Control, Summary of DG Grants”, dated August 24, 2007
The Connecticut Center for Advanced Technology, Inc. © 2008 85
Distributed Generation Opportunities - Geographic Targeting
State investment in fuel cells, as a high efficiency CHP facility, should be targeted to sites of
high public benefit, as identified by this analysis. These strategic targets may include sites
with renewable energy resources, commercial buildings with potentially high electric and
thermal consumption (inpatient healthcare, education, lodging, food sales, food service,
homeland security, and public order and safety), selected town and state buildings, energy
intensive industries, grid substations, telecommunications facilities, selected public works
facilities, prisons, institutions, military sites, alternative fueling stations, and state fuel
dispensing locations. The highest priority level for these applications has been estimated at
approximately 85 MW for an approximate two year investment strategy at over 40 MW per
year, but such level does not include transportation or refueling opportunities. Further, this
85 MW level can be easily refined to target additional schools, utilities, large commercial
users, healthcare facilities, and public order and safety facilities to over 400 MW of fuel cell
capacity as a predictable and transparent 10-year investment strategy. On average, this 40
MW allocation per year for ten years, 400 MW total, is also generally consistent with and
falls within the State’s RPS requirements, and the total technical potential for CHP distributed
generation estimated at 1,673 MW to 2014. It has been estimated that the market potential for
CHP using current technology for an accelerated case is approximately 504 MW in
Connecticut to the year 2014. The use of advanced technology with higher efficiency, and
lower operation and maintenance costs increases this market potential to 645.6 MW.111
Predictable deployment for state applications can be achieved through bulk purchase or by
creating mandates for fuel cell installation at certain existing state buildings and for certain
new state public building construction. Utilizing systems at least partially manufactured in
Connecticut will help to ensure continued growth and benefit of in-state industry and
economy.
111 “Distributed Generation Market Potential: 2004 Update Connecticut and Southwest Connecticut”, ISE, Joel M. Rinebold, ECSU, March 15, 2004
The Connecticut Center for Advanced Technology, Inc. © 2008 86
Distributed Generation Opportunities - Energy Improvement Districts
Many businesses can suffer damages and lose revenue due to power failures and other power
loss due to a lack of adequate energy infrastructure. Energy Improvement Districts (EIDs)
can manage peak power requirements, relieve overloaded substations, and prevent power
quality losses at local businesses. The microgrid approach of an EID is an ideal situation for
CHP fuel cell power plants to provide peaking and backup power for these congested
districts. Taking local control of key energy planning, putting 70 percent of waste heat to
work in space heating and cooling, eliminating line loss and poor power quality due to wires,
and installing electric power generators compatible with the environmental and economic
tenor of the community are all common sense objectives which can be achieved with the
ingenuity of EID microgrids. Benefits from local EIDs will reverberate to entire states and
geographic regions as robust economic development and electric power grid stabilization.112
Distributed Generation Opportunities - Utility Ownership
Existing legislation authorizes electric distribution companies to enter into contracts for Class
I renewable energy generation, and allows electric distribution companies to own up to 65
MW of generating capacity. There are significant benefits associated with limited utility
ownership of fuel cell capacity and other performance equivalent hydrogen fueled facilities.
Connecticut will face increased electric demand and will need to address peak energy loading
in an environmentally responsible way, especially during the summer months when air
conditioners cause increased energy use and the formation of ground level ozone is more
prominent. Utility ownership will allow maximum public control over grid-side distributed
generation and can provide generation capacity needed during times of peak energy use in the
state. Although mandated purchase of Class I generation technology will require capital
investment, the long term rate of return will be justified as a public benefit.
112 Guy Warner, Pareto Energy, “Energy Improvement Districts Promote Common Sense Ingenuity”, April 3, 2006
The Connecticut Center for Advanced Technology, Inc. © 2008 87
Connecticut CleanEnergyOptions
Connecticut CleanEnergyOptions, a Connecticut Department of Public Utilities Control
(DPUC) approved program, allows Connecticut residents to support clean energy options on
their utility bills through Renewable Energy Credits (REC). Clean energy options include
combinations of renewable resources such as wind, small hydroelectric and landfill gas.
Customers continue to receive electric service from their regular provider; however, a small
clean energy surcharge appears on their bill, which is the cost to purchase renewable energy
credits and displace an equal amount of electricity that would have been generated from
traditional sources, such as coal, oil and natural gas-fired generating plants.113
Much of the electricity generated, that is offered through the current Connecticut
CleanEnergyOptions, is sourced from out-of-state sites in the northeast. Through the use of
fuel cells, a choice to purchase electricity generated by hydrogen and fuel cell technology
manufactured in the State of Connecticut would allow state residents to select in-state
renewable options. Supporting renewable technology sourced from Connecticut
manufacturers benefits the state’s economy, supports the creation of in-state jobs and allows
for increased state revenue.
As of November 2007, approximately 16,000114 Connecticut customers have signed up for
the CleanEnergyOptions program. A total of 18,000 customers are expected to enroll before
March 31, 2008. The load used by the forecasted 18,000 customers would be approximately
150,000 MWh,115 requiring 17 MW of renewable energy. The recommended installation of
40 MW of fuel cells per year in the state provides a valuable local energy source which can
be added to the CleanEnergyOptions program. This 40 MW per year will help to fulfill
Connecticut’s Renewable Portfolio Standards (RPS), allow for a local choice of clean energy,
and drive clean energy costs down or maintain current costs without having to expand 113 CTCleanEnergyOptions – Frequently Asked Questions, http://www.ctcleanenergyoptions.com/faq.htm#1 114 Keri Enright, State Program Director, Smartpower 115 “DPUC Consideration of the Connecticut Clean Energy Options Program for 2008”, Docket No. 07-01-09, http://www.dpuc.state.ct.us/dockcurr.nsf/6eaf6cab79ae2d4885256b040067883b/c9953dcfabfb633085257363006f593b/$FILE/070109-092707.doc
The Connecticut Center for Advanced Technology, Inc. © 2008 88
geographic eligibility beyond the northeast. Within the first year, approximately 40,000
households could benefit from fuel cell generated energy, growing to nearly 400,000
households after ten years. Consistent with the U.S. Census estimate of over 1,400,000
households in the State of Connecticut, fuel cell generated energy could power nearly 30
percent of Connecticut households by 2020 based upon a 40 MW per year increase. Utilizing
a 100 percent capacity factor, Connecticut would need to average 57 MW per year of new
Class I renewable capacity per year to satisfy the RPS by 2020. The provision of 40 MW per
year over 10 years will satisfy 46 percent of the Class I RPS demand at a 100 percent load
factor, and 11 percent of the demand at a 50 percent load factor.
A new program will be initiated in April 2008 and considerations are currently being made to
decide alternative product delivery options. Fuel cells are an eligible energy source for the
program; however, the current version does not offer this option. It is recommended that fuel
cells be included in the clean energy option choices considering high efficiency compared to
other Class I renewables including solar, wind, hydroelectric, and wave, and the need to
satisfy the RPS requirements.
Stationary Power Plan for Connecticut
Public Investment for Reduced Costs
Proprietary industry estimates reported the cost of capital to produce electric distributed
energy in 1997 to be around $20,000 per kW; however, that has dropped to an estimated
$3,200 per kW today.
Figure III.5 below, demonstrates that the cost of manufacturing fuel cells will decrease as
production increases. The reduction in cost per kW as shown in Figure III.5 correlates with a
decrease in production costs. Calculations based upon the Wrights Cumulative Average
Model using an 80 percent learning curve show that costs can theoretically be reduced by 20
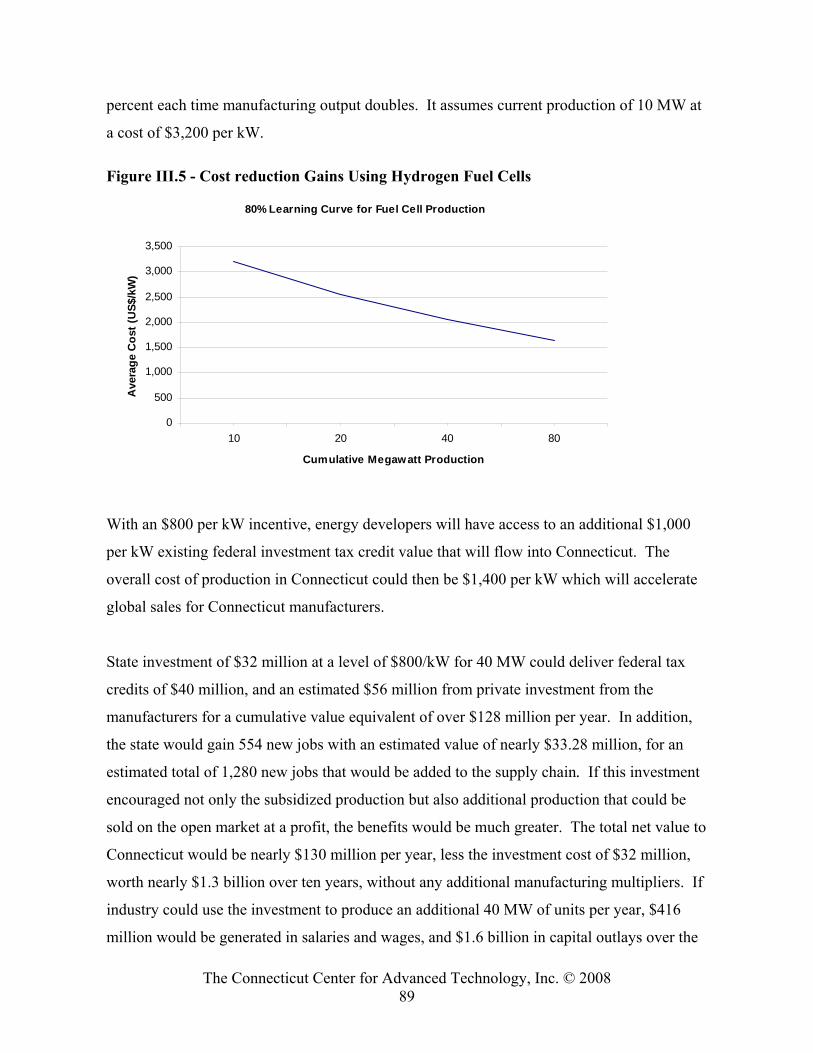
The Connecticut Center for Advanced Technology, Inc. © 2008 89
percent each time manufacturing output doubles. It assumes current production of 10 MW at
a cost of $3,200 per kW.
Figure III.5 - Cost reduction Gains Using Hydrogen Fuel Cells
80% Learning Curve for Fuel Cell Production
0
500
1,000
1,500
2,000
2,500
3,000
3,500
10 20 40 80
Cumulative Megawatt Production
Ave
rage
Cos
t (U
S$/k
W)
With an $800 per kW incentive, energy developers will have access to an additional $1,000
per kW existing federal investment tax credit value that will flow into Connecticut. The
overall cost of production in Connecticut could then be $1,400 per kW which will accelerate
global sales for Connecticut manufacturers.
State investment of $32 million at a level of $800/kW for 40 MW could deliver federal tax
credits of $40 million, and an estimated $56 million from private investment from the
manufacturers for a cumulative value equivalent of over $128 million per year. In addition,
the state would gain 554 new jobs with an estimated value of nearly $33.28 million, for an
estimated total of 1,280 new jobs that would be added to the supply chain. If this investment
encouraged not only the subsidized production but also additional production that could be
sold on the open market at a profit, the benefits would be much greater. The total net value to
Connecticut would be nearly $130 million per year, less the investment cost of $32 million,
worth nearly $1.3 billion over ten years, without any additional manufacturing multipliers. If
industry could use the investment to produce an additional 40 MW of units per year, $416
million would be generated in salaries and wages, and $1.6 billion in capital outlays over the
The Connecticut Center for Advanced Technology, Inc. © 2008 90
next 10 years, far exceeding the 10-year state investment of $320 million.116 This means that
the state would receive approximately $5 for each dollar of state investment.
The source of the $800 per kW stationary fuel cell investment strategy could be from a state
income tax credit and/or premium tax credit, for in-state development of fuel cells and fuel
cell components, created through modification of the state tax code.117 However, renewable
portfolio standards (RPS) and mandates for fuel cells in public buildings would be
appropriate and justified, and thus such fuel cells could be developed as part of the market
cost for facility building development. If such mandates were adopted, the $800 per kW
incentive could at some time be reduced and overall economic value of the state’s investment
would increase further. Utilities will also have economic incentive to invest in fuel cells for
voltage control to stabilize the grid at remote locations. Additional opportunities to
encourage market development for deployment exists through mechanisms to allow
Connecticut utility customers choice on their utility bills to select clean, renewable, and
efficient generation provided by fuel cell technology made in Connecticut by in-state
workers. Use of a provision to reduce or eliminate local property tax costs for hydrogen and
fuel cell technology within local communities, with encouragement for development at local
“Energy Improvement Districts” as authorized by Public Act 07-01, could then be used
effectively to complete a comprehensive strategy for in-state manufacture, consumer
selection, and market expansion within local communities.
Furthermore, since the public investment would have multiplier effects, such value would
more than double over the life of the incentive program. The economic value does not take
into account the benefits and cost reductions associated with improvements in manufacturing
and the savings in health care from a cleaner environment, which as described elsewhere in
this report, would be substantial. Additional benefits for employment would result from
repair, service and support, equipment upgrades, and fuel development as well as the jobs and 116 Refer to Appendix H, Sonny Barr Economic Analysis 117 State investment in economic development through tax credits has precedent with other industry incentives such as the Connecticut Film Industry tax credits under Public Act 07-235 and Public Act 06-186. Expense credits are available under the insurance premiums tax as well as the corporation business tax which allows for net revenue losses for the State. As of May 2007, 36 projects have been preliminarily approved eligible for over $87 million in tax credits. This credit was expected to result in a General Fund Revenue loss of $10 million in FY 08 and $20 million in FY 09
The Connecticut Center for Advanced Technology, Inc. © 2008 91
income from the many years of purchases of spare components and fuels to keep the plants
fully operable. With this increased market for manufacturing, there would be a potential need
to coordinate and improve the entire state supply/value chain for improved production
efficiency and lower costs.
The production of 40 MW of Class I renewable generation capacity from commercially
available fuel cells would require approximately 200 200 kW units, 160 250 kW units, 100
400 kW, 1,000 40 kW units or any combination of ratings and unit quantities that would
achieve 40 MW. Smaller fuel cell applications and hydrogen applications utilizing renewable
resources would also be available to meet this renewable capacity need in Connecticut and
the region.
Summary of Hydrogen and Fuel Cell Benefits in Connecticut
• Identified benefits associated with the use of fuel cells and hydrogen technology
for stationary power generation in Connecticut would include $416 million
generated in salaries and wages, and 1.6 billion in capital outlays over the next
10 years. Other benefits include:
• creation of jobs associated with in-state manufacture and in-state generation;
• clean and nearly emission free operation;
• ease of siting and regulatory approval for facility development;
• efficient operation providing both heat and power that will conserve on fuel
costs and can reduce the import of foreign oil;
• renewable resource with legislative designation as a Class I renewable energy
source technology to meet Renewable Portfolio Standards;
• ability to function as a bridge that can lead to widespread use of renewable fuels
including methane, ethanol, biomass or biomass wastes and hydrogen produced
by solar and wind energy;
• potential conservation of water resources when compared with base load
generation;
The Connecticut Center for Advanced Technology, Inc. © 2008 92
• improved reliability with uninterrupted power to critical load centers without
the need to build and rely on electric transmission lines; and
• operation that can reduce transmission congestion that results in Federally
Mandated Congestion Charges.
Hydrogen and Fuel Cells in Transportation
Transportation is a major component of the economy. In 2004, over 243 million vehicles
were in use in the U.S. comprised of 136 million cars, 6 million motorcycles, 8 million
trucks, 92 million “other 2-axle 4-tire” vehicles, and 795 thousand buses.118 Transportation is
served by approximately 180,000 retail service stations.119 New vehicle sales are significant
with over 17 million vehicles sold in 2004, most of which were cars and light duty trucks.
Transportation is the primary use of petroleum with the United States consuming 140 billion
gallons of gasoline and 44 billion gallons of diesel fuel annually.120 Imports constitute
approximately 55 percent of the petroleum consumed in the U.S.121 Transportation is a major
contributor to U.S. greenhouse gas and other emissions and to the balance of payments
deficit.
Hydrogen-fueled vehicles with fuel cell power plants have many advantages, including:
• quiet operation;
• no emissions of controlled pollutants such as nitrous oxide, carbon monoxide,
hydrocarbon gases or particulates;
• no emissions of greenhouse gases from the vehicles themselves;
• substantial (30 to 50 percent) reduction in greenhouse gases on a well-to-wheel basis
compared to conventional gasoline or gasoline-hybrid vehicles when the hydrogen is
produced by conventional methods from natural gas;
118 U.S. Department of Transportation, Bureau of Transportation Statistics, National Transportation Statistics 2006, December 2006, Table 1-11 119 American Petroleum Institute 120 Energy Information Administration, 2005 Data 121 Energy Information Administration, 2003 Data
The Connecticut Center for Advanced Technology, Inc. © 2008 93
• no greenhouse gas emissions on a well-to-wheel basis when the hydrogen is produced
from renewable or nuclear energy sources or when generation from hydrocarbon
sources is accompanied by carbon capture and sequestration;
• ability to fuel vehicles with indigenous energy sources which reduces dependence on
imported energy and adds to energy security; and
• efficient use of energy resources. Studies indicate that fuel cell vehicles operating on
hydrogen will have well-to-wheel efficiencies 300 percent higher than conventional
vehicles and 50 to 70 percent higher than current gasoline-hybrid vehicles.122, 123
In order to secure these advantages the following must be addressed:
• Current deficiencies of hydrogen as an energy carrier include cost and efficiency of
generating and distributing hydrogen, i.e. the size and cost of on-board hydrogen
storage;
• performance, durability and cost of fuel cell power plants; and
• Vehicle and infrastructure companies along with local state and federal governments
must cooperate to insure that all aspects of the product, business, legislative and
regulatory requirements are in place.
A global effort is underway to develop hydrogen infrastructure and hydrogen-fueled vehicles
using fuel cell power plants. The effort involves:
• leading automobile manufacturers;
• bus manufacturers;
• fork lift truck manufacturers;
• major electrical equipment manufacturers;
• electronics companies;
• fuel cell power plant manufacturers;
• fuel cell component manufacturers;
122 “Challenges for Sustainable Mobility and Development of Fuel Cell Vehicles”, Masatami Takimoto, Executive Vice President, Toyota Motor Corporation, January 26, 2006. Presentation at the 2nd International Hydrogen & Fuel Cell Expo Technical Conference Tokyo, Japan 123 “Twenty Hydrogen Myths”, Amory B. Lovins, Rocky Mountain Institute, June 20, 2003
The Connecticut Center for Advanced Technology, Inc. © 2008 94
• companies involved with various manufacturing and operational elements of the
hydrogen supply infrastructure from hydrogen production to hydrogen distribution,
storage and dispensing;
• non-profit organizations, universities, and national laboratories; and
• national, state and local governments.
Efforts are also underway to further develop hydrogen-fueled internal combustion engine
vehicles. These vehicles will have some of the attributes noted above although to a lesser
extent than hydrogen vehicles with fuel cell power plants. Auto company and government
efforts currently focus on vehicles fueled with stored hydrogen after prior attempts to develop
on-board conversion of gasoline or diesel fuel to hydrogen were unsuccessful. Some effort is
again underway to develop on-board conversion of petroleum derived fuels to hydrogen for
use in a fuel cell power plant.124 In addition to technical challenges, size and cost of on-board
reforming are major hurdles. Both of these approaches, i.e., hydrogen-fueled internal
combustion engines and on-board hydrogen generation, will have some of the attributes noted
above, although to a lesser extent than stored-hydrogen vehicles with fuel cell power plants.
Reduction in cost and advances in reliability and performance of low temperature proton
exchange membrane (PEM) fuel cells and other types of fuel cells have allowed hydrogen-
fueled fuel cells to be considered seriously for vehicular applications. These technical
achievements coupled with increased concern for energy independence, noise from diesel
buses in urban areas, emissions of controlled pollutants and greenhouse gases provide
investor and government incentive to pursue fuel cell technology.
Currently there are:
• four to five hundred hydrogen vehicles (both fuel cell and internal combustion engine)
deployed worldwide;125
• seventy two hydrogen stations in the U.S. with over 250 worldwide;126 and
124 ExxonMobil Press Release dated November 14, 2007, “ExxonMobil to Work with Partners to Commercialize On-Vehicle Hydrogen Fuel System for Lift Truck Application” 125 Database of Cars, Bikes and other Vehicles, www.h2mobility.org, November 2007
The Connecticut Center for Advanced Technology, Inc. © 2008 95
• forty seven states and the District of Columbia with some form of fuel cell or
hydrogen legislation, demonstration or other activity.127
These programs address key issues associated with achieving success including:
• hydrogen production cost and efficiency;
• hydrogen transportation and storage size, cost, and efficiency, which affect both
hydrogen distribution and storage of hydrogen on-board vehicles;
• developing a hydrogen fuel infrastructure; and
• fuel cell operability and cost.
In addition to the risks associated with developing hydrogen fueled transportation itself,
investors and governments also face risks associated with development of alternative
transportation technologies which could reduce the benefits associated with hydrogen fueled
transportation. These alternative technologies include:
• advances in performance of conventional internal combustion engine technology;
• hybrid vehicles;
• natural gas vehicles; and
• biofuels such as ethanol and bio-diesel.
A review of the U.S. government program to advance hydrogen and fuel cell technology by a
committee of the National Research Council128 stated that:
• “This is a broad, very challenging research effort … that will enable the vision of a
clean and sustainable transportation energy future;
• Research goals have been established … that, if attained, promise to overcome the
multiple high-risk barriers to achieving that vision;
126 “Searchable Database of Hydrogen Stations in North America” www.hydrogenassociation.org/general/fueling.Search.asp#null and Searchable Database of Existing & Planned Hydrogen Stations around the World”, www.fuelcells.org/info/charts/h2fuelingstations.pdf, November 2007 127 “State Activities that Promote Fuel Cell and Hydrogen Infrastructure Development”, www.fuelcells.org/info/StateActivity, October 2006 128 Review of the FreedomCAR and Fuel Partnership, First Report by Committee on Review of the FreedomCAR and Fuel Cell Research Program, Phase 1 of the National Research Council of the National Academies, 2005
The Connecticut Center for Advanced Technology, Inc. © 2008 96
• The committee believes that research in support of this vision is justified by the
potentially enormous beneficial impact for the nation; and
• Funding levels and the consequent research results during the next few years should
allow future reviews to make a more firmly based assessment.”
A summary of research and development challenges, alternative technologies and the efforts
to overcome them is contained in a report prepared by The Connecticut Academy of Science
and Engineering (CASE) for the Connecticut Department of Transportation (DOT).129 The
report also identifies organizations and individuals who are interested parties in regard to the
use of hydrogen in Connecticut and describes their concerns as well as suggested efforts to
address the concerns.
The advent of hydrogen-fueled transportation will have the following impacts on
Connecticut:
• a business opportunity for Connecticut companies;
• development of hydrogen fuel infrastructure in Connecticut;
• competition from other states; and
• development of legislation and regulations for transportation use of hydrogen.
Business Opportunities for Connecticut Companies
Many Connecticut companies are involved with development, demonstration, and
commercialization of products and services for hydrogen fueled transportation. These
products include: fuel cell power plants for use in automobiles and buses, electrolysis systems
to convert water to hydrogen fuel, fuel reformers for on-board conversion of conventional
fuels to hydrogen fuel, and the infrastructure business of producing and delivering hydrogen
for transportation use. This technology could be used to convert natural gas or petroleum
fuels to hydrogen. One Connecticut company is developing a fuel cell that produces hydrogen
as a co-product along with electricity and heat.
129 Connecticut Academy of Science and Engineering, “Preparing for the Hydrogen Economy: Transportation”, June 2006, www.ctcase.org
The Connecticut Center for Advanced Technology, Inc. © 2008 97
Most global auto companies have activity in hydrogen fuel cell powered vehicles. Currently
General Motors, Honda and Toyota have internal programs to develop hydrogen fuel cell
powered automobiles. Ford and DaimlerChrysler purchase fuel cells from Ballard, a
Canadian company for their vehicles. A Connecticut company, UTC Power, has fuel cells in
Hyundai, Nissan and BMW vehicles. Many hydrogen fuel cell buses are manufactured by
DaimlerChrysler and use Ballard fuel cell power plants. UTC Power also has fuel cell power
plants in buses manufactured by U.S. and European companies. Hydrogenics, another
Canadian company, has fuel cells in buses as well. The U.S. DOE has four fuel cell
automobile demonstration programs with auto and oil company partnerships. The teams are
DaimlerChrysler/British Petroleum, Ford/British Petroleum, General Motors/Shell and
Hyundai/Chevron. UTC Power is a member of the Hyundai/Chevron team and Ballard
participates with both Ford and DamilerChrysler. GM uses a fuel cell developed in part at its
facilities at Honeoye Falls, New York.
Challenges for Hydrogen Fuel Infrastructure and Vehicles
Development of a hydrogen fuel infrastructure and vehicles using hydrogen fuel cells for
power has many technical challenges including:
• cost and efficiency of clean generation of hydrogen;
• cost, efficiency and scale of hydrogen distribution;
• size and cost of hydrogen storage on vehicles, refueling stations and in distribution
(volumetric energy density of hydrogen stored in any form is still well below that of
gasoline and this contributes to weight penalties as well);
• fuel cell power plant ability to operate consistently with current operating
environment and power demands of vehicles;
• fuel cell component cost;
• fuel cell power plant cost; and
• fuel cell power plant durability and reliability.
In addition, there are significant business challenges:
The Connecticut Center for Advanced Technology, Inc. © 2008 98
• The general public is not sufficiently familiar with the technology, development
status, or benefits, nor has an understanding of the underlying basis for hydrogen
vehicle safety. While the public is generally supportive of hydrogen when informed
properly, this knowledge is not wide-spread.
• While there are significant efforts to develop national and international hydrogen
safety standards for vehicles, fueling stations, and building codes, state and municipal
regulations and those who administer them lag behind standards development.
Furthermore, building code officials are not sufficiently familiar with the technology
and the standards developments.
• A chicken-egg problem exists in regard to uncertainty of the availability of hydrogen
supply infrastructure on the part of vehicle manufacturers and potential purchasers.
There is also uncertainty in regard to the vehicle market demand for hydrogen fuel on
the part of hydrogen infrastructure companies. Both aspects of the problem require
technology improvements with subsequent demonstration. Independent decisions by
multiple participants required for success increases commercialization risk and
mechanisms for reducing risk are needed.
• Alternative technologies focusing on similar objectives create uncertainties in regard
to investment in hydrogen and fuel cell vehicles. These include biofuels such as
ethanol and biodiesel, compressed natural gas fuel, hydrogen fueled internal
combustion engines, hybrid and plug-in hybrid vehicles, improvements to internal
combustion engines and structural materials which reduce vehicle weight and power
consumption. The degree of success with these technologies is not certain, but to the
degree they reduce fossil fuel consumption, energy imports and emissions of regulated
pollutants and greenhouse gases, they reduce the incentive to invest in hydrogen fuel
and fuel cell powered vehicles. At the same time, these technologies pioneer
alternative fuels and the electric drive technology which facilitates the design,
development and deployment of hydrogen fueled fuel cell vehicles.
These technical and business challenges are being addressed in large programs sponsored by
U.S. and other national governments, vehicle and infrastructure product manufacturers,
energy and industrial gas companies and other states.
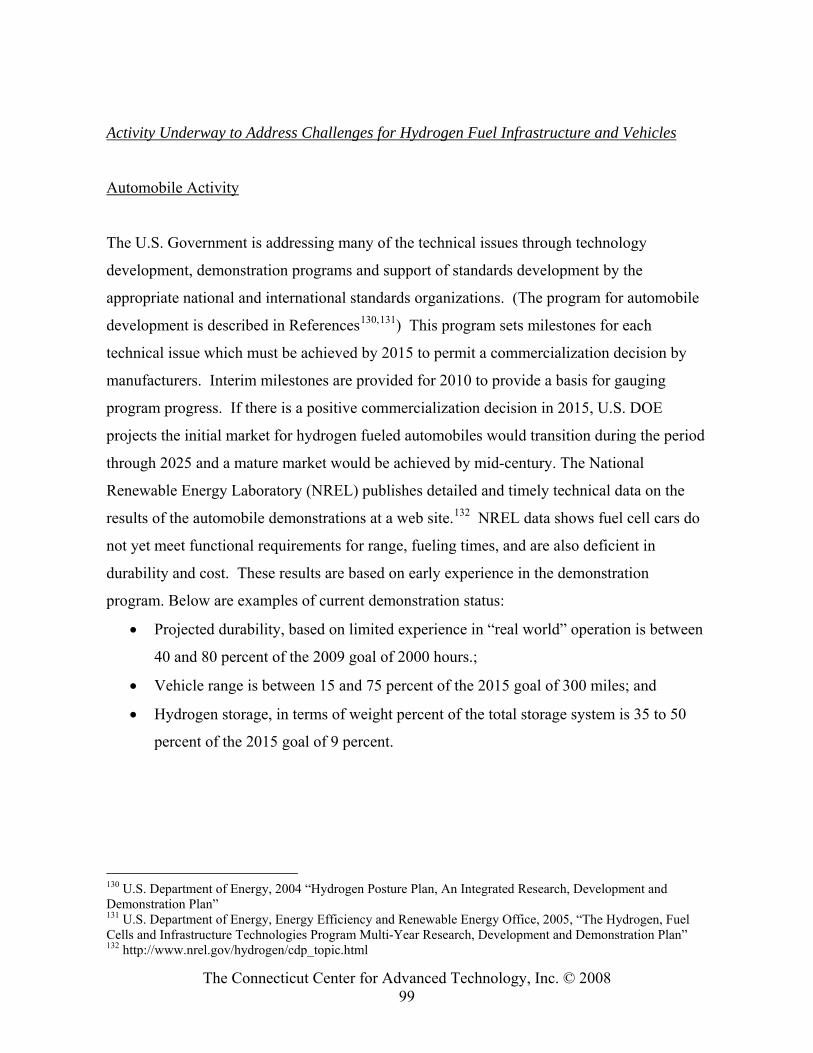
The Connecticut Center for Advanced Technology, Inc. © 2008 99
Activity Underway to Address Challenges for Hydrogen Fuel Infrastructure and Vehicles
Automobile Activity
The U.S. Government is addressing many of the technical issues through technology
development, demonstration programs and support of standards development by the
appropriate national and international standards organizations. (The program for automobile
development is described in References130,131) This program sets milestones for each
technical issue which must be achieved by 2015 to permit a commercialization decision by
manufacturers. Interim milestones are provided for 2010 to provide a basis for gauging
program progress. If there is a positive commercialization decision in 2015, U.S. DOE
projects the initial market for hydrogen fueled automobiles would transition during the period
through 2025 and a mature market would be achieved by mid-century. The National
Renewable Energy Laboratory (NREL) publishes detailed and timely technical data on the
results of the automobile demonstrations at a web site.132 NREL data shows fuel cell cars do
not yet meet functional requirements for range, fueling times, and are also deficient in
durability and cost. These results are based on early experience in the demonstration
program. Below are examples of current demonstration status:
• Projected durability, based on limited experience in “real world” operation is between
40 and 80 percent of the 2009 goal of 2000 hours.;
• Vehicle range is between 15 and 75 percent of the 2015 goal of 300 miles; and
• Hydrogen storage, in terms of weight percent of the total storage system is 35 to 50
percent of the 2015 goal of 9 percent.
130 U.S. Department of Energy, 2004 “Hydrogen Posture Plan, An Integrated Research, Development and Demonstration Plan” 131 U.S. Department of Energy, Energy Efficiency and Renewable Energy Office, 2005, “The Hydrogen, Fuel Cells and Infrastructure Technologies Program Multi-Year Research, Development and Demonstration Plan” 132 http://www.nrel.gov/hydrogen/cdp_topic.html
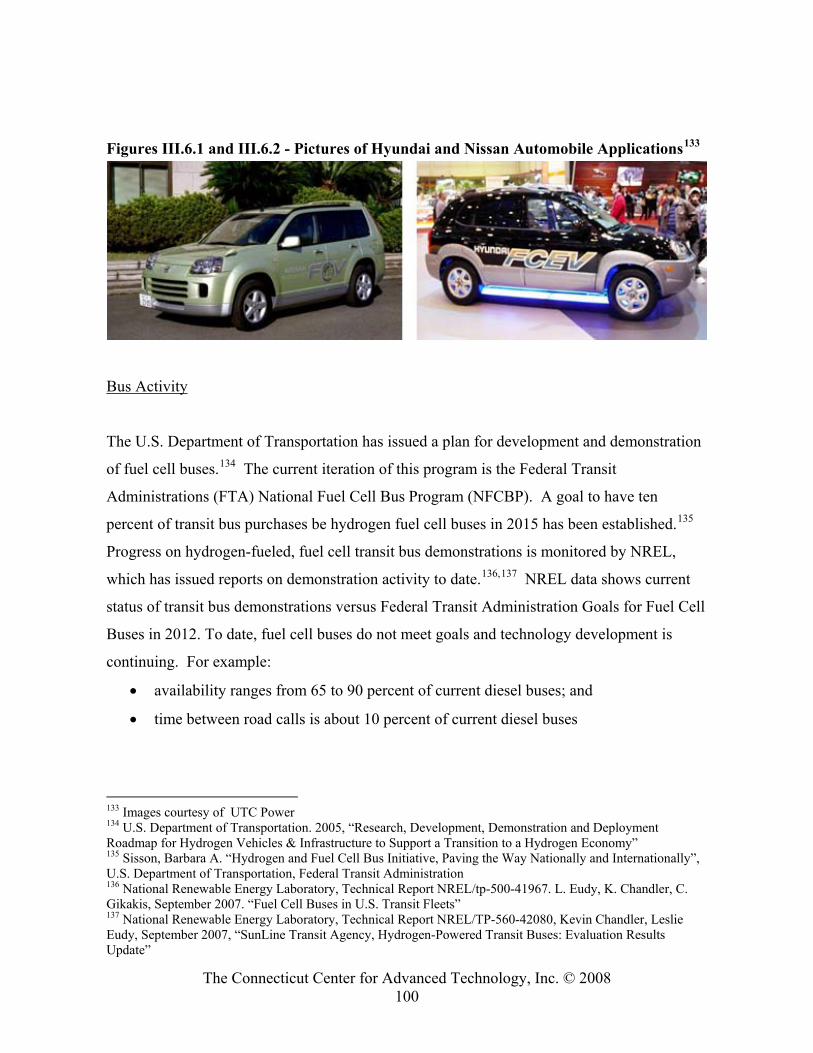
The Connecticut Center for Advanced Technology, Inc. © 2008 100
Figures III.6.1 and III.6.2 - Pictures of Hyundai and Nissan Automobile Applications133
Bus Activity
The U.S. Department of Transportation has issued a plan for development and demonstration
of fuel cell buses.134 The current iteration of this program is the Federal Transit
Administrations (FTA) National Fuel Cell Bus Program (NFCBP). A goal to have ten
percent of transit bus purchases be hydrogen fuel cell buses in 2015 has been established.135
Progress on hydrogen-fueled, fuel cell transit bus demonstrations is monitored by NREL,
which has issued reports on demonstration activity to date.136,137 NREL data shows current
status of transit bus demonstrations versus Federal Transit Administration Goals for Fuel Cell
Buses in 2012. To date, fuel cell buses do not meet goals and technology development is
continuing. For example:
• availability ranges from 65 to 90 percent of current diesel buses; and
• time between road calls is about 10 percent of current diesel buses
133 Images courtesy of UTC Power 134 U.S. Department of Transportation. 2005, “Research, Development, Demonstration and Deployment Roadmap for Hydrogen Vehicles & Infrastructure to Support a Transition to a Hydrogen Economy” 135 Sisson, Barbara A. “Hydrogen and Fuel Cell Bus Initiative, Paving the Way Nationally and Internationally”, U.S. Department of Transportation, Federal Transit Administration 136 National Renewable Energy Laboratory, Technical Report NREL/tp-500-41967. L. Eudy, K. Chandler, C. Gikakis, September 2007. “Fuel Cell Buses in U.S. Transit Fleets” 137 National Renewable Energy Laboratory, Technical Report NREL/TP-560-42080, Kevin Chandler, Leslie Eudy, September 2007, “SunLine Transit Agency, Hydrogen-Powered Transit Buses: Evaluation Results Update”
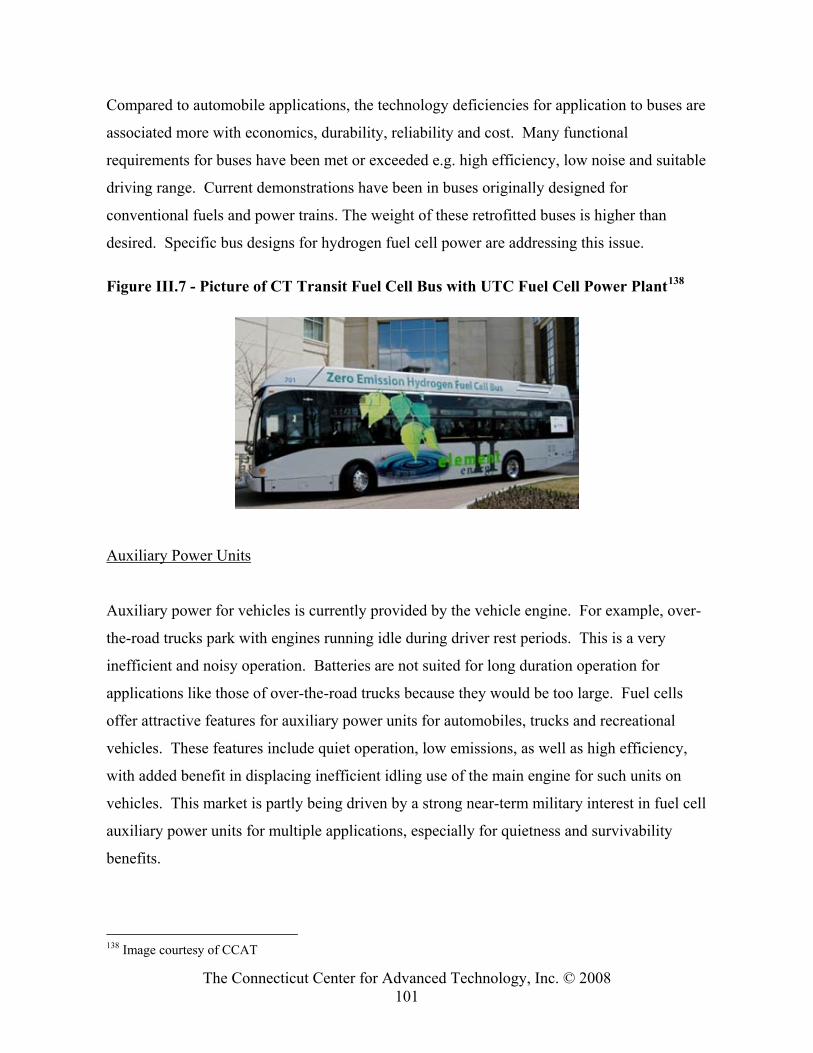
The Connecticut Center for Advanced Technology, Inc. © 2008 101
Compared to automobile applications, the technology deficiencies for application to buses are
associated more with economics, durability, reliability and cost. Many functional
requirements for buses have been met or exceeded e.g. high efficiency, low noise and suitable
driving range. Current demonstrations have been in buses originally designed for
conventional fuels and power trains. The weight of these retrofitted buses is higher than
desired. Specific bus designs for hydrogen fuel cell power are addressing this issue.
Figure III.7 - Picture of CT Transit Fuel Cell Bus with UTC Fuel Cell Power Plant138
Auxiliary Power Units
Auxiliary power for vehicles is currently provided by the vehicle engine. For example, over-
the-road trucks park with engines running idle during driver rest periods. This is a very
inefficient and noisy operation. Batteries are not suited for long duration operation for
applications like those of over-the-road trucks because they would be too large. Fuel cells
offer attractive features for auxiliary power units for automobiles, trucks and recreational
vehicles. These features include quiet operation, low emissions, as well as high efficiency,
with added benefit in displacing inefficient idling use of the main engine for such units on
vehicles. This market is partly being driven by a strong near-term military interest in fuel cell
auxiliary power units for multiple applications, especially for quietness and survivability
benefits.
138 Image courtesy of CCAT
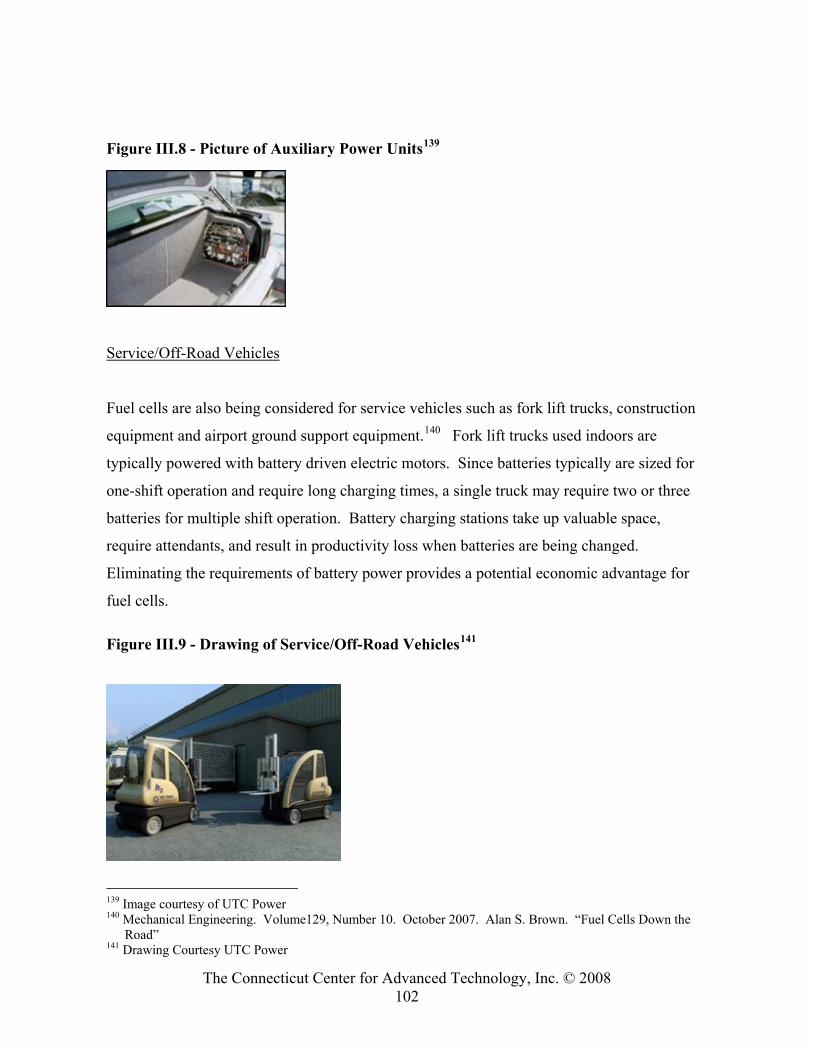
The Connecticut Center for Advanced Technology, Inc. © 2008 102
Figure III.8 - Picture of Auxiliary Power Units139
Service/Off-Road Vehicles
Fuel cells are also being considered for service vehicles such as fork lift trucks, construction
equipment and airport ground support equipment.140 Fork lift trucks used indoors are
typically powered with battery driven electric motors. Since batteries typically are sized for
one-shift operation and require long charging times, a single truck may require two or three
batteries for multiple shift operation. Battery charging stations take up valuable space,
require attendants, and result in productivity loss when batteries are being changed.
Eliminating the requirements of battery power provides a potential economic advantage for
fuel cells.
Figure III.9 - Drawing of Service/Off-Road Vehicles141
139 Image courtesy of UTC Power 140 Mechanical Engineering. Volume129, Number 10. October 2007. Alan S. Brown. “Fuel Cells Down the
Road” 141 Drawing Courtesy UTC Power
The Connecticut Center for Advanced Technology, Inc. © 2008 103
Competing and/or Supporting Technologies
When considering hydrogen fueled transportation, experience with other alternative fuels
should be considered. For example, experience with compressed natural gas (CNG) fueled
vehicles presented issues of vehicle supply and gaseous fuel availability which curtailed
progress of this technology in Connecticut. Similar problems in fuel transportation and
energy value are occurring with E85 ethanol.142 Programs to support hydrogen fueled
vehicles must address these and other business and code/standard issues associated with new
fuels.
California, Colorado, and Vancouver, Canada are considering hydrogen and CNG blends
referred to as Hythane® for medium and heavy duty vehicles. The Las Vegas Municipal fleet
has an on going program demonstrating CNG and hydrogen blends in light trucks.
Additionally, utilizing hydrogen powered internal combustion engines (HICE) fed with
hydrogen-blend fuels is another early adopter strategy. HICE engines could be fueled by:
• Pure hydrogen
• Hydrogen/CNG Blend
• Hydrogen/diesel blend
Target vehicles include fleet vehicles (automobiles, small trucks, buses), service/off-road
vehicles (fork lift trucks), construction vehicles, and small yard machinery vehicles (lawn
mowers, tractors, etc.). While these internal combustion engine vehicles are competitors to
fuel cell powered vehicles, their application would contribute to increased utilization of
hydrogen fueling stations, which are needed by both technologies.
Development of Legislation and Regulations Associated with the Use of Hydrogen
Use of hydrogen is well established in the industrial environment and appropriate codes and
standards are in place. Substantial experience with natural gas vehicles and refueling stations
also contributes to the basis for developing standards, codes and regulations for use of
142 Business Week. October 1, 2007. David Kiley, “Big Oil’s Big Stall on Ethanol”
The Connecticut Center for Advanced Technology, Inc. © 2008 104
hydrogen in transportation. Significant effort is underway to develop national and
international standards governing use of hydrogen as a transportation fuel. The CASE report,
referenced above, has a comprehensive listing of standards activity associated with hydrogen
and a U.S. DOE website (www.fuelcellstandards.com) provides the latest status updates. The
Connecticut Fire Academy offers a training module for fires involving industrial hydrogen,
and Connecticut codes and standards are updated regularly to reflect changes to national and
international codes and standards as discussed in the CASE report.
Connecticut has significant legislation and state-sponsored effort in support of stationary fuel
cells; however, little effort or planning is in place in regard to transportation applications of
hydrogen and fuel cells.
State Assistance for Hydrogen-Fueled Vehicles
Appendix E, Table IV.7 shows examples of state assistance for hydrogen fueled vehicles.
Hydrogen infrastructure support is dominated by California’s Hydrogen Highway program,
which couples a requirement on vehicle manufacturers to meet targets for alternative fueled
vehicles. Government vehicle purchase requirements and other incentives for private
purchase of these vehicles make California the clear leader in regard to alternative fueled
vehicles including hydrogen vehicles. Florida and New York are other states which have
assistance noted, but they are at a very low level compared to those in California.
Connecticut has very little assistance available for hydrogen fueled vehicles which is in sharp
contrast to the situation for stationary power applications.
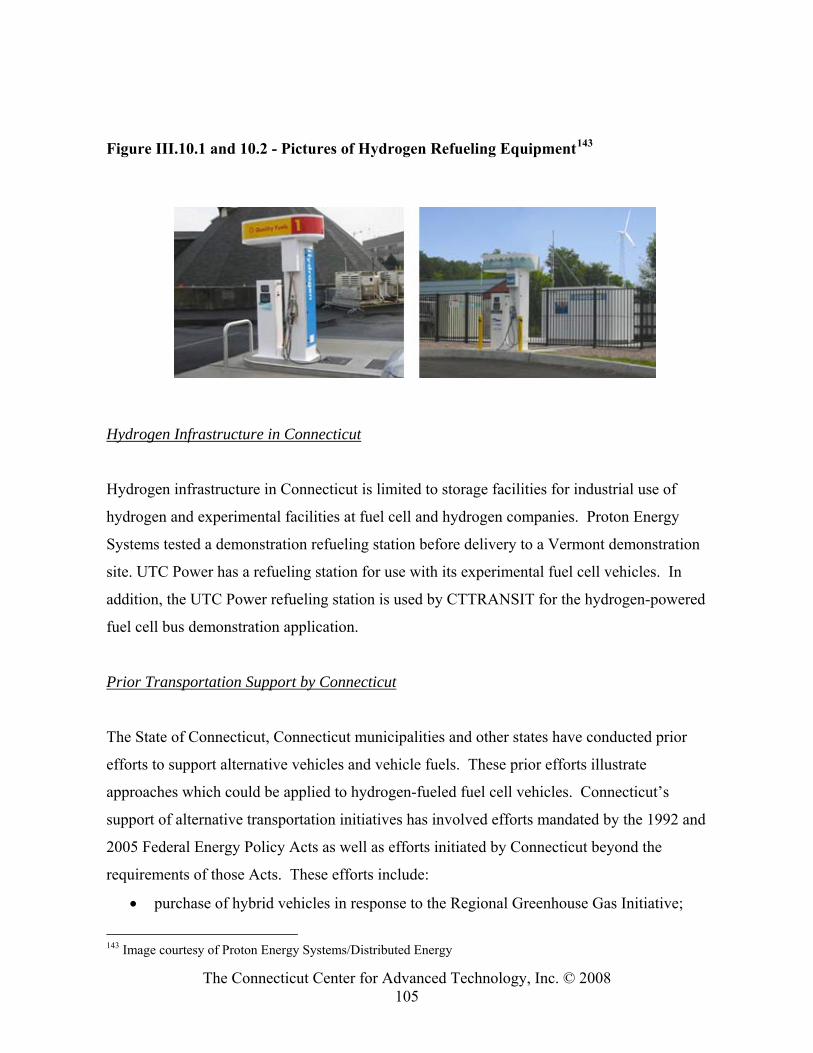
The Connecticut Center for Advanced Technology, Inc. © 2008 105
Figure III.10.1 and 10.2 - Pictures of Hydrogen Refueling Equipment143
Hydrogen Infrastructure in Connecticut
Hydrogen infrastructure in Connecticut is limited to storage facilities for industrial use of
hydrogen and experimental facilities at fuel cell and hydrogen companies. Proton Energy
Systems tested a demonstration refueling station before delivery to a Vermont demonstration
site. UTC Power has a refueling station for use with its experimental fuel cell vehicles. In
addition, the UTC Power refueling station is used by CTTRANSIT for the hydrogen-powered
fuel cell bus demonstration application.
Prior Transportation Support by Connecticut
The State of Connecticut, Connecticut municipalities and other states have conducted prior
efforts to support alternative vehicles and vehicle fuels. These prior efforts illustrate
approaches which could be applied to hydrogen-fueled fuel cell vehicles. Connecticut’s
support of alternative transportation initiatives has involved efforts mandated by the 1992 and
2005 Federal Energy Policy Acts as well as efforts initiated by Connecticut beyond the
requirements of those Acts. These efforts include:
• purchase of hybrid vehicles in response to the Regional Greenhouse Gas Initiative;
143 Image courtesy of Proton Energy Systems/Distributed Energy
The Connecticut Center for Advanced Technology, Inc. © 2008 106
• hybrid bus evaluations;
• no sales tax on hybrid automobiles that achieve an overall 40 miles/gal EPA fuel
efficiency rating (voluntary property tax breaks are also available for participating
municipalities);
• State purchase of alternative fueled vehicles in response to National Energy Policy
Acts;
• availability of E85 and biodiesel at several of the 70 state fueling stations;
• CTTRANSIT operation of fuel cell bus purchased by U.S. Department of
Transportation;
• Greater New Haven Transit District dedicated electric trolley replicas purchased by
federal transit bus funds;
• Norwich, Fairfield, Bridgeport, Hartford (Capital Police), Rocky Hill, Glastonbury,
Monroe and New Haven have invested in, or have plans to purchase of CNG vehicles
and fueling stations; and
• Greater New Haven, Norwich, Energy Alternatives of Southwest Connecticut and the
Capital (Hartford) Clean Cities Coalitions have funded, initiated, collaborated and
managed programs valued at $10 million for alternative fuels vehicles and
infrastructure since the beginning of the decade.
Transportation Plan for Connecticut
Goals for the Hydrogen and Fuel Cell Transportation Plan
Recommended goals for Connecticut include:
A. Support the development of transportation-related fuel cell technology in the State in
order to maximize Connecticut technology content in future transportation fuel cell
systems;
B. Attract automobile and bus companies to demonstrate in Connecticut through
infrastructure and legislative support for commercial deployment;
The Connecticut Center for Advanced Technology, Inc. © 2008 107
C. Accelerate commercial readiness and commercial deployment of hydrogen-fueled
vehicles with emphasis on fuel cell vehicles in Connecticut;
D. Reduce controlled pollutant and GHG emissions, reduce noise, and increase energy
security and efficiency;
E. Maximum capture of jobs associated with production of vehicles, fueling stations and
infrastructure products including component sub-assemblies, original equipment
manufacturing and long term product support;
F. Position Connecticut to capture federal and other grant funding for research,
development, demonstration and deployment of hydrogen infrastructure and fuel cell
vehicles to have strong influence on regional efforts in this area; and
G. Extend Connecticut capture of market content by expanding applications beyond
automobiles and buses, applying existing fuel processing capability to fueling stations
and increasing vehicle value content by expanding beyond the fuel cell itself to
associated vehicles, vehicle subsystems, and hydrogen storage
The recommended plan for Connecticut is complementary to the global efforts by national
governments, vehicle manufacturers, fuel cell manufacturers and hydrogen equipment
infrastructure manufacturers to develop and demonstrate the functional, cost, durability and
reliability capabilities of hydrogen infrastructure and fuel cell powered vehicles.
Connecticut’s efforts are challenged and complemented by efforts in other states to develop
an industrial base around this market opportunity and to secure the benefits of hydrogen
fueled fuel cell vehicles for their residents. These other state efforts are summarized in
Appendix E. The Connecticut plan focuses on providing better opportunity for development
of Connecticut products for the transportation market and establishing the basis for rapid
commercial deployment in Connecticut.
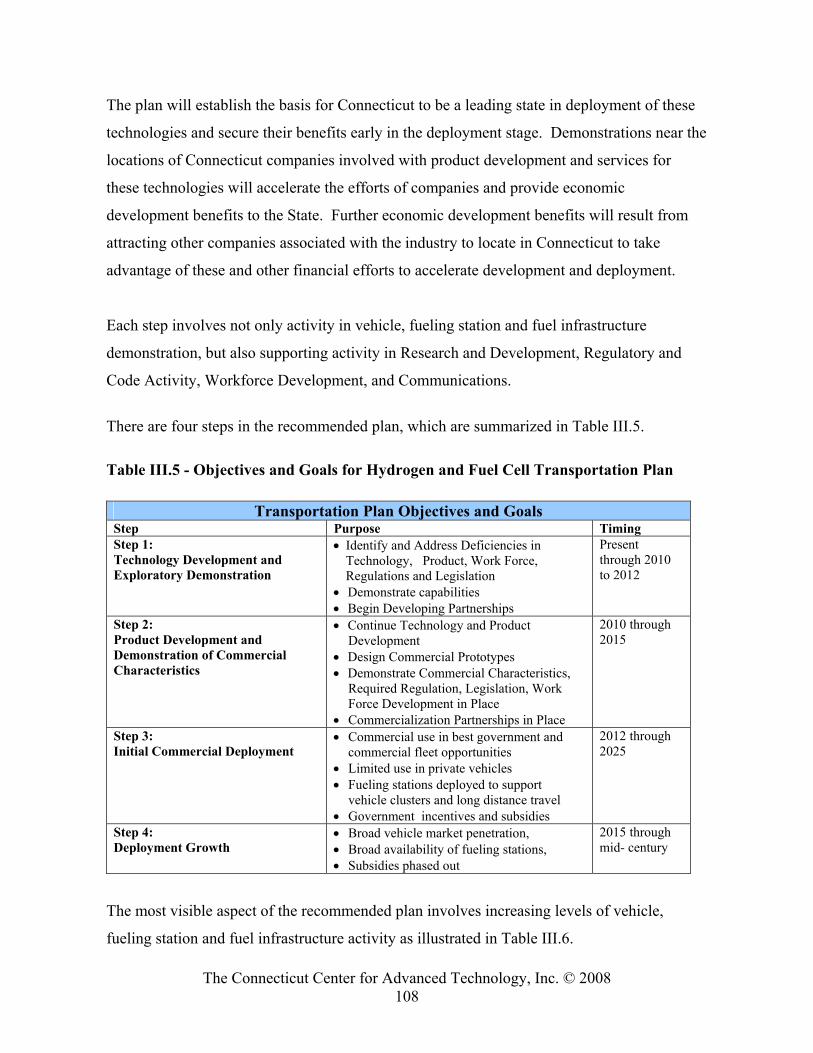
The Connecticut Center for Advanced Technology, Inc. © 2008 108
The plan will establish the basis for Connecticut to be a leading state in deployment of these
technologies and secure their benefits early in the deployment stage. Demonstrations near the
locations of Connecticut companies involved with product development and services for
these technologies will accelerate the efforts of companies and provide economic
development benefits to the State. Further economic development benefits will result from
attracting other companies associated with the industry to locate in Connecticut to take
advantage of these and other financial efforts to accelerate development and deployment.
Each step involves not only activity in vehicle, fueling station and fuel infrastructure
demonstration, but also supporting activity in Research and Development, Regulatory and
Code Activity, Workforce Development, and Communications.
There are four steps in the recommended plan, which are summarized in Table III.5.
Table III.5 - Objectives and Goals for Hydrogen and Fuel Cell Transportation Plan
Transportation Plan Objectives and Goals Step Purpose Timing Step 1: Technology Development and Exploratory Demonstration
• Identify and Address Deficiencies in Technology, Product, Work Force, Regulations and Legislation
• Demonstrate capabilities • Begin Developing Partnerships
Present through 2010 to 2012
Step 2: Product Development and Demonstration of Commercial Characteristics
• Continue Technology and Product Development
• Design Commercial Prototypes • Demonstrate Commercial Characteristics,
Required Regulation, Legislation, Work Force Development in Place
• Commercialization Partnerships in Place
2010 through 2015
Step 3: Initial Commercial Deployment
• Commercial use in best government and commercial fleet opportunities
• Limited use in private vehicles • Fueling stations deployed to support
vehicle clusters and long distance travel • Government incentives and subsidies
2012 through 2025
Step 4: Deployment Growth
• Broad vehicle market penetration, • Broad availability of fueling stations, • Subsidies phased out
2015 through mid- century
The most visible aspect of the recommended plan involves increasing levels of vehicle,
fueling station and fuel infrastructure activity as illustrated in Table III.6.
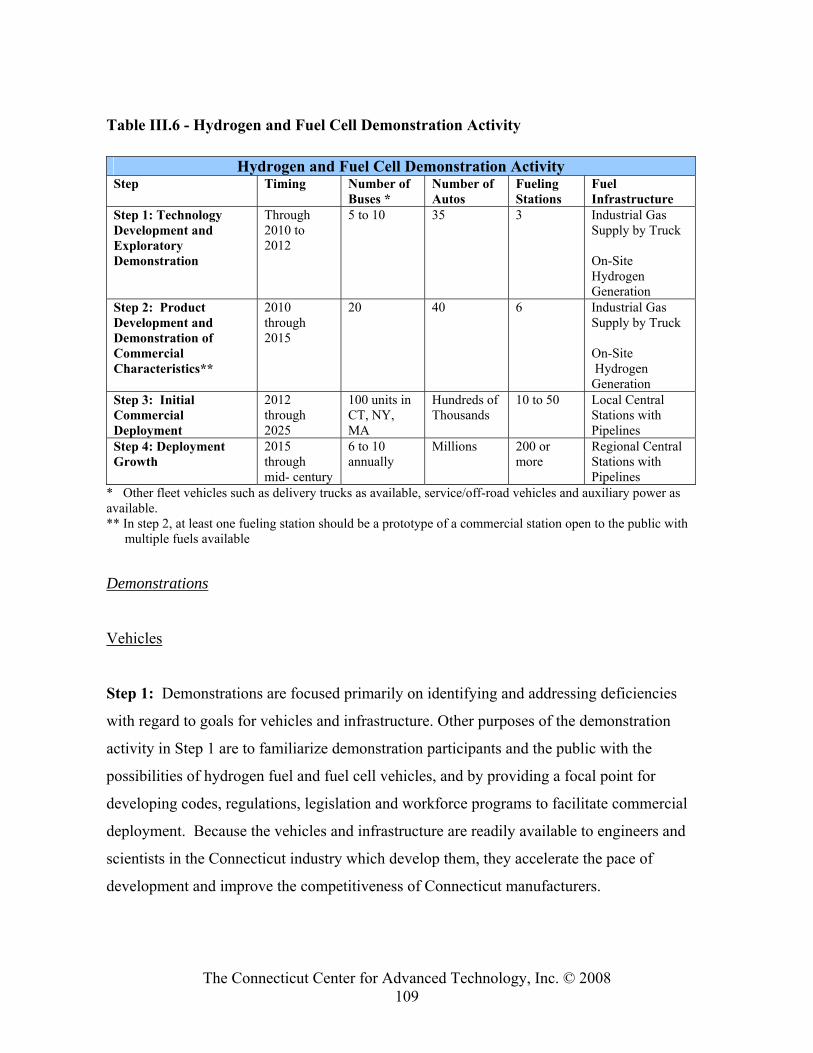
The Connecticut Center for Advanced Technology, Inc. © 2008 109
Table III.6 - Hydrogen and Fuel Cell Demonstration Activity
Hydrogen and Fuel Cell Demonstration Activity Step Timing Number of
Buses * Number of Autos
Fueling Stations
Fuel Infrastructure
Step 1: Technology Development and Exploratory Demonstration
Through 2010 to 2012
5 to 10 35 3 Industrial Gas Supply by Truck On-Site Hydrogen Generation
Step 2: Product Development and Demonstration of Commercial Characteristics**
2010 through 2015
20 40 6 Industrial Gas Supply by Truck On-Site Hydrogen Generation
Step 3: Initial Commercial Deployment
2012 through 2025
100 units in CT, NY, MA
Hundreds of Thousands
10 to 50 Local Central Stations with Pipelines
Step 4: Deployment Growth
2015 through mid- century
6 to 10 annually
Millions 200 or more
Regional Central Stations with Pipelines
* Other fleet vehicles such as delivery trucks as available, service/off-road vehicles and auxiliary power as available. ** In step 2, at least one fueling station should be a prototype of a commercial station open to the public with
multiple fuels available
Demonstrations
Vehicles
Step 1: Demonstrations are focused primarily on identifying and addressing deficiencies
with regard to goals for vehicles and infrastructure. Other purposes of the demonstration
activity in Step 1 are to familiarize demonstration participants and the public with the
possibilities of hydrogen fuel and fuel cell vehicles, and by providing a focal point for
developing codes, regulations, legislation and workforce programs to facilitate commercial
deployment. Because the vehicles and infrastructure are readily available to engineers and
scientists in the Connecticut industry which develop them, they accelerate the pace of
development and improve the competitiveness of Connecticut manufacturers.
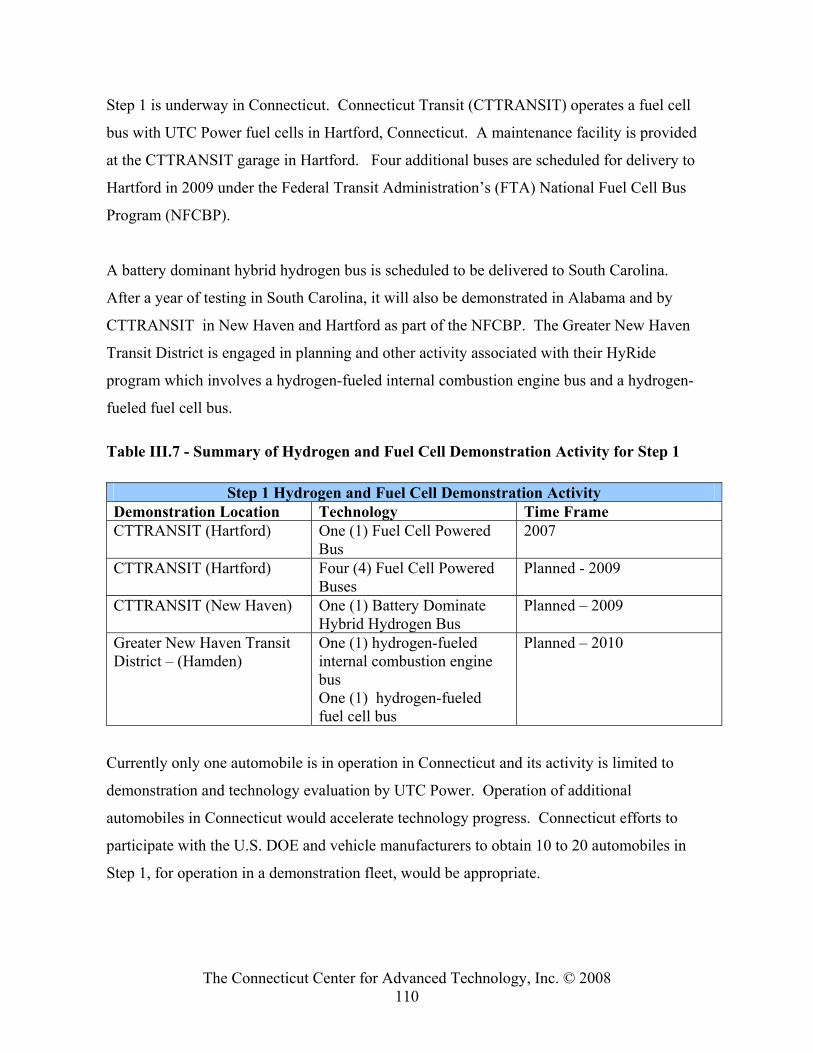
The Connecticut Center for Advanced Technology, Inc. © 2008 110
Step 1 is underway in Connecticut. Connecticut Transit (CTTRANSIT) operates a fuel cell
bus with UTC Power fuel cells in Hartford, Connecticut. A maintenance facility is provided
at the CTTRANSIT garage in Hartford. Four additional buses are scheduled for delivery to
Hartford in 2009 under the Federal Transit Administration’s (FTA) National Fuel Cell Bus
Program (NFCBP).
A battery dominant hybrid hydrogen bus is scheduled to be delivered to South Carolina.
After a year of testing in South Carolina, it will also be demonstrated in Alabama and by
CTTRANSIT in New Haven and Hartford as part of the NFCBP. The Greater New Haven
Transit District is engaged in planning and other activity associated with their HyRide
program which involves a hydrogen-fueled internal combustion engine bus and a hydrogen-
fueled fuel cell bus.
Table III.7 - Summary of Hydrogen and Fuel Cell Demonstration Activity for Step 1
Step 1 Hydrogen and Fuel Cell Demonstration Activity Demonstration Location Technology Time Frame CTTRANSIT (Hartford) One (1) Fuel Cell Powered
Bus 2007
CTTRANSIT (Hartford) Four (4) Fuel Cell Powered Buses
Planned - 2009
CTTRANSIT (New Haven) One (1) Battery Dominate Hybrid Hydrogen Bus
Planned – 2009
Greater New Haven Transit District – (Hamden)
One (1) hydrogen-fueled internal combustion engine bus One (1) hydrogen-fueled fuel cell bus
Planned – 2010
Currently only one automobile is in operation in Connecticut and its activity is limited to
demonstration and technology evaluation by UTC Power. Operation of additional
automobiles in Connecticut would accelerate technology progress. Connecticut efforts to
participate with the U.S. DOE and vehicle manufacturers to obtain 10 to 20 automobiles in
Step 1, for operation in a demonstration fleet, would be appropriate.

The Connecticut Center for Advanced Technology, Inc. © 2008 111
Step 2: While most of the buses in Step 1 involve modifying an existing bus design for
hydrogen fuel cell operation, Step 2 will involve buses designed from the start for this drive
system. These buses will be used to demonstrate that the buses can meet objectives of the
FTA’s NFCBP and that they are ready for commercial deployment. To demonstrate the
required reliability and durability, a number of buses will be required nationally. It is
suggested that Connecticut be a leading state (perhaps in partnership with neighboring states)
by demonstrating 20 buses through co-funding with the FTA.
At this time Connecticut should also expand demonstration efforts for fuel cell powered
automobiles, in conjunction with the U.S. DOE and vehicle manufacturers, for up to 40 of
these automobiles in Connecticut.
Step 3: The FTA has stated their objective to purchase 500 hydrogen-fueled fuel cell buses
annually by 2015. Again, in support of its industrial base, Connecticut could develop
partnerships with its neighboring states to purchase 100 buses annually in the initial
deployment stage of Step 3. A goal of 10 percent of Connecticut’s bus fleet purchases or 6 to
10 buses per year is an appropriate target for Connecticut.
Commercial deployment of fuel cell powered automobiles for state-owned fleets, with
encouragement for greater deployment in private fleets and for individual use would be
appropriate.
Step 4: Connecticut purchases in the mature commercial stage of Step 4 should be
aggressive, particularly in the early years to drive the cost of these buses down to a level
associated with greater market penetration.
Purchase and use of fuel cell powered automobiles in Connecticut should be consistent with
the national totals in the mature market situation.
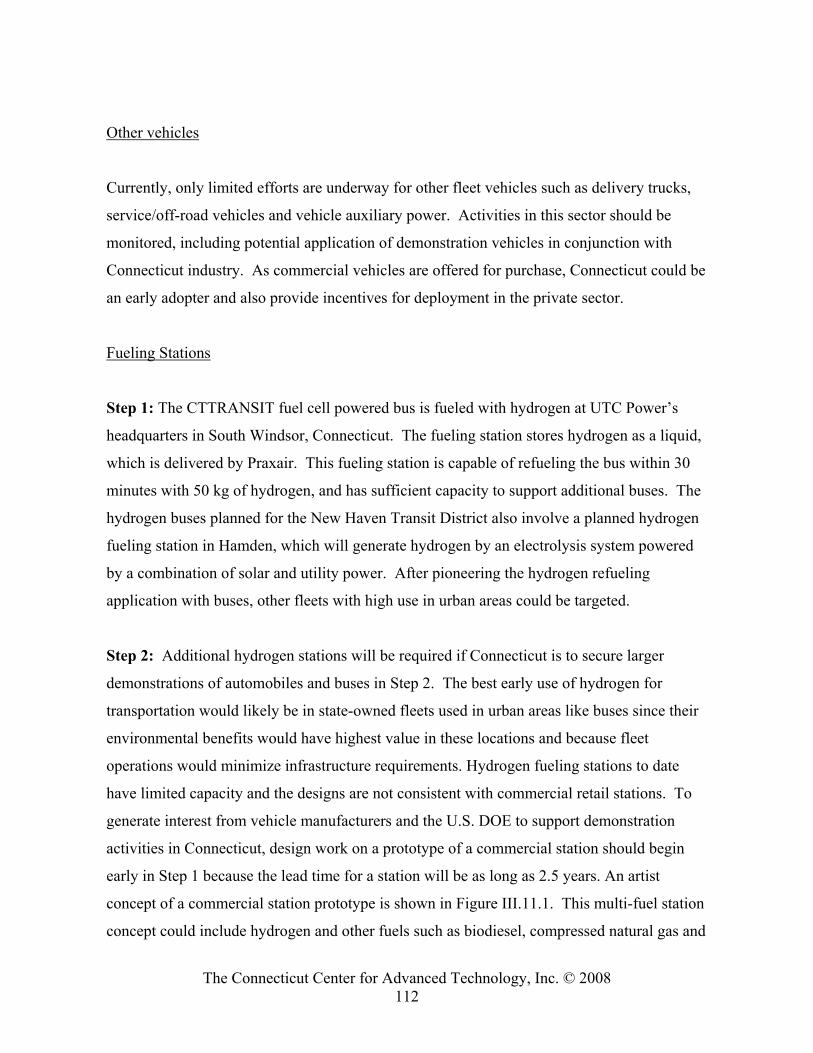
The Connecticut Center for Advanced Technology, Inc. © 2008 112
Other vehicles
Currently, only limited efforts are underway for other fleet vehicles such as delivery trucks,
service/off-road vehicles and vehicle auxiliary power. Activities in this sector should be
monitored, including potential application of demonstration vehicles in conjunction with
Connecticut industry. As commercial vehicles are offered for purchase, Connecticut could be
an early adopter and also provide incentives for deployment in the private sector.
Fueling Stations
Step 1: The CTTRANSIT fuel cell powered bus is fueled with hydrogen at UTC Power’s
headquarters in South Windsor, Connecticut. The fueling station stores hydrogen as a liquid,
which is delivered by Praxair. This fueling station is capable of refueling the bus within 30
minutes with 50 kg of hydrogen, and has sufficient capacity to support additional buses. The
hydrogen buses planned for the New Haven Transit District also involve a planned hydrogen
fueling station in Hamden, which will generate hydrogen by an electrolysis system powered
by a combination of solar and utility power. After pioneering the hydrogen refueling
application with buses, other fleets with high use in urban areas could be targeted.
Step 2: Additional hydrogen stations will be required if Connecticut is to secure larger
demonstrations of automobiles and buses in Step 2. The best early use of hydrogen for
transportation would likely be in state-owned fleets used in urban areas like buses since their
environmental benefits would have highest value in these locations and because fleet
operations would minimize infrastructure requirements. Hydrogen fueling stations to date
have limited capacity and the designs are not consistent with commercial retail stations. To
generate interest from vehicle manufacturers and the U.S. DOE to support demonstration
activities in Connecticut, design work on a prototype of a commercial station should begin
early in Step 1 because the lead time for a station will be as long as 2.5 years. An artist
concept of a commercial station prototype is shown in Figure III.11.1. This multi-fuel station
concept could include hydrogen and other fuels such as biodiesel, compressed natural gas and
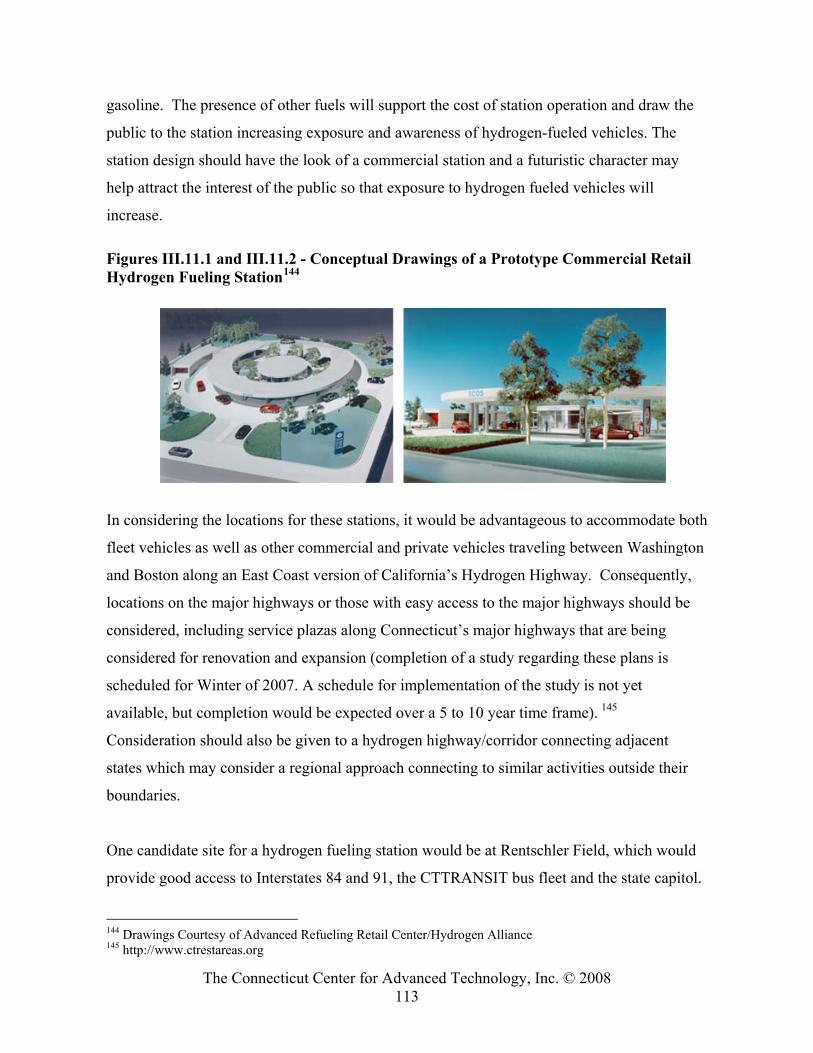
The Connecticut Center for Advanced Technology, Inc. © 2008 113
gasoline. The presence of other fuels will support the cost of station operation and draw the
public to the station increasing exposure and awareness of hydrogen-fueled vehicles. The
station design should have the look of a commercial station and a futuristic character may
help attract the interest of the public so that exposure to hydrogen fueled vehicles will
increase.
Figures III.11.1 and III.11.2 - Conceptual Drawings of a Prototype Commercial Retail Hydrogen Fueling Station144
In considering the locations for these stations, it would be advantageous to accommodate both
fleet vehicles as well as other commercial and private vehicles traveling between Washington
and Boston along an East Coast version of California’s Hydrogen Highway. Consequently,
locations on the major highways or those with easy access to the major highways should be
considered, including service plazas along Connecticut’s major highways that are being
considered for renovation and expansion (completion of a study regarding these plans is
scheduled for Winter of 2007. A schedule for implementation of the study is not yet
available, but completion would be expected over a 5 to 10 year time frame). 145
Consideration should also be given to a hydrogen highway/corridor connecting adjacent
states which may consider a regional approach connecting to similar activities outside their
boundaries.
One candidate site for a hydrogen fueling station would be at Rentschler Field, which would
provide good access to Interstates 84 and 91, the CTTRANSIT bus fleet and the state capitol.
144 Drawings Courtesy of Advanced Refueling Retail Center/Hydrogen Alliance 145 http://www.ctrestareas.org
The Connecticut Center for Advanced Technology, Inc. © 2008 114
Since the Cabella’s store at Rentschler field and the University of Connecticut football
stadium attract many visitors from around Connecticut and other states, this would be a good
location for greater public access and exposure. Alternatively, the CTTRANSIT facility
located at the Jennings Road exit in Hartford, which serves CTTRANSIT’s fuel cell bus fleet
storage and maintenance operations, would also be near Interstates 84 and 91, and the state
capitol. Other locations along Interstate 95 should be considered for development in Step 2
depending on the deployment of additional buses in New Haven and a location in Fairfield
County (Stamford for example) with proximity to vehicle demonstrations in White Plains,
New York.
Step 3: Commercial deployment of vehicles will not proceed until availability of hydrogen or
multi-fuel fueling stations is assured. During Step 3, Connecticut could take the lead in
insuring hydrogen stations are sufficient to accommodate the needs of Connecticut’s fleet and
private vehicle purchasers. At the same time, strategic sites to make hydrogen available for
vehicles crossing the state could be located near the interstates in Connecticut, including I-95,
I-395, I-91, and I-84. Diffusion of the infrastructure to additional sites would then follow as
the fleet of hydrogen fueled vehicles increases in number. It has been proposed that sales of
vehicles be concentrated in a few areas to provide economic use of hydrogen refueling
stations during the build out of these vehicles. Further, it is suggested that opening fleet
refueling sites (including state owned sites) to retail sales be considered as part of the
transition to a mature business. Ten to fifty stations may be required.
Step 4: The development of hydrogen or multi-fuel fueling stations in Step 4 would be in
response to market demand with 200 or more stations required.
Infrastructure
In addition to fueling stations with on-site hydrogen generation through electrolysis or natural
gas reforming, central generation of hydrogen with truck or pipeline distribution to fueling
stations should be considered. Currently, central generation involves locations outside
Connecticut with truck distribution to fueling stations. For example, the bus fueling station in
The Connecticut Center for Advanced Technology, Inc. © 2008 115
South Windsor is supplied with liquid hydrogen trucked from a generating plant in Niagara
Falls where the hydrogen is produced with electrolysis units powered by water power.
Longer term, central plants with local and then regional distribution via hydrogen pipelines
may be the most effective source of hydrogen, but this will require a significant number of
fueling stations with robust demand to make them economically viable.
Legislation, Public-Private Partnerships, Codes, Research and Development
Less visible, but no less critical to the development of hydrogen-fueled transportation, are
efforts in enabling legislation, public-private partnerships, codes and regulatory requirements,
research and development. Highlights of these areas are summarized in Table III.8. The
program will also be associated with education and communication efforts described
elsewhere in this document (Section III). The vehicles and fueling stations in the
transportation portion of the effort will provide significant assistance to education and
communication efforts.
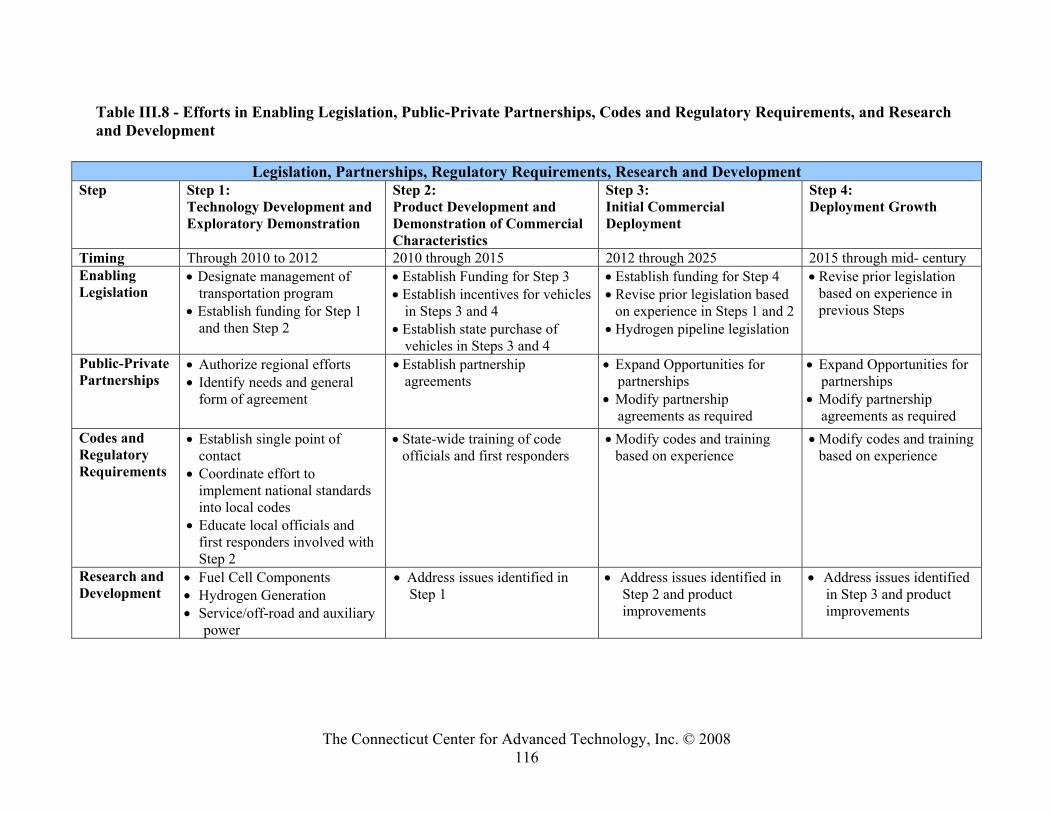
The Connecticut Center for Advanced Technology, Inc. © 2008 116
Table III.8 - Efforts in Enabling Legislation, Public-Private Partnerships, Codes and Regulatory Requirements, and Research and Development
Legislation, Partnerships, Regulatory Requirements, Research and Development Step Step 1:
Technology Development and Exploratory Demonstration
Step 2: Product Development and Demonstration of Commercial Characteristics
Step 3: Initial Commercial Deployment
Step 4: Deployment Growth
Timing Through 2010 to 2012 2010 through 2015 2012 through 2025 2015 through mid- century Enabling Legislation
• Designate management of transportation program
• Establish funding for Step 1 and then Step 2
• Establish Funding for Step 3 • Establish incentives for vehicles
in Steps 3 and 4 • Establish state purchase of
vehicles in Steps 3 and 4
• Establish funding for Step 4 • Revise prior legislation based
on experience in Steps 1 and 2 • Hydrogen pipeline legislation
• Revise prior legislation based on experience in previous Steps
Public-Private Partnerships
• Authorize regional efforts • Identify needs and general
form of agreement
• Establish partnership agreements
• Expand Opportunities for partnerships
• Modify partnership agreements as required
• Expand Opportunities for partnerships
• Modify partnership agreements as required
Codes and Regulatory Requirements
• Establish single point of contact
• Coordinate effort to implement national standards into local codes
• Educate local officials and first responders involved with Step 2
• State-wide training of code officials and first responders
• Modify codes and training based on experience
• Modify codes and training based on experience
Research and Development
• Fuel Cell Components • Hydrogen Generation • Service/off-road and auxiliary
power
• Address issues identified in Step 1
• Address issues identified in Step 2 and product improvements
• Address issues identified in Step 3 and product improvements
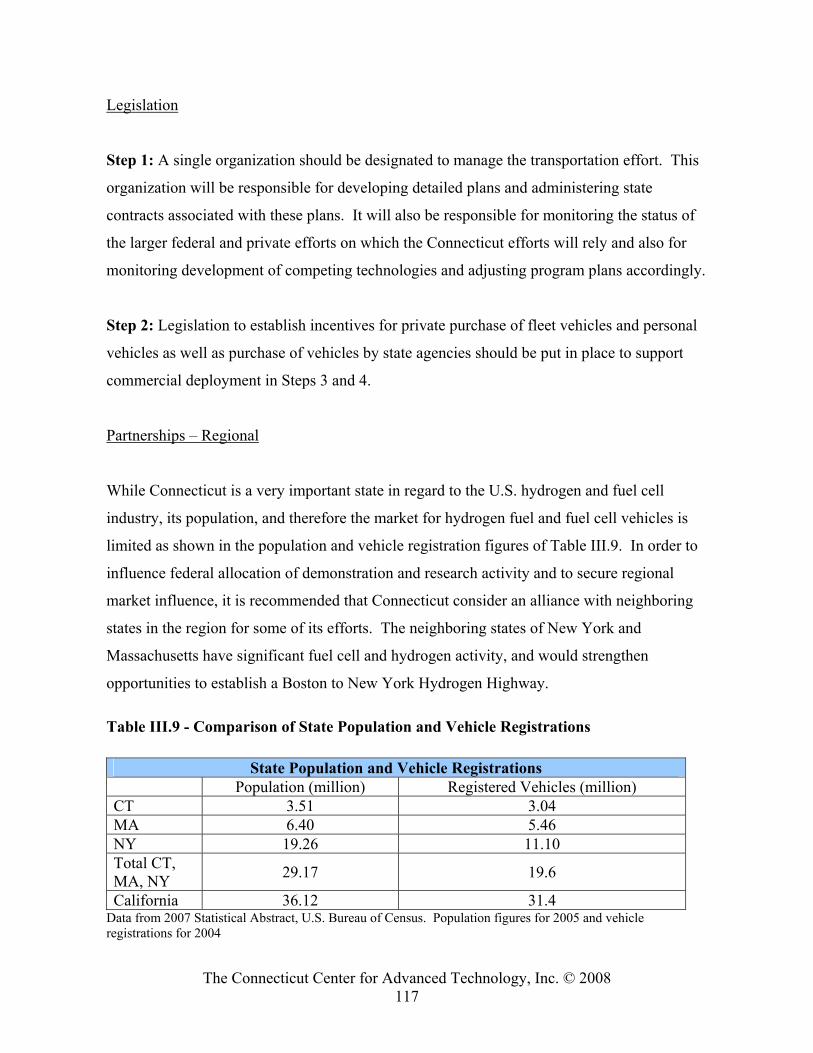
The Connecticut Center for Advanced Technology, Inc. © 2008 117
Legislation
Step 1: A single organization should be designated to manage the transportation effort. This
organization will be responsible for developing detailed plans and administering state
contracts associated with these plans. It will also be responsible for monitoring the status of
the larger federal and private efforts on which the Connecticut efforts will rely and also for
monitoring development of competing technologies and adjusting program plans accordingly.
Step 2: Legislation to establish incentives for private purchase of fleet vehicles and personal
vehicles as well as purchase of vehicles by state agencies should be put in place to support
commercial deployment in Steps 3 and 4.
Partnerships – Regional
While Connecticut is a very important state in regard to the U.S. hydrogen and fuel cell
industry, its population, and therefore the market for hydrogen fuel and fuel cell vehicles is
limited as shown in the population and vehicle registration figures of Table III.9. In order to
influence federal allocation of demonstration and research activity and to secure regional
market influence, it is recommended that Connecticut consider an alliance with neighboring
states in the region for some of its efforts. The neighboring states of New York and
Massachusetts have significant fuel cell and hydrogen activity, and would strengthen
opportunities to establish a Boston to New York Hydrogen Highway.
Table III.9 - Comparison of State Population and Vehicle Registrations
State Population and Vehicle Registrations Population (million) Registered Vehicles (million) CT 3.51 3.04 MA 6.40 5.46 NY 19.26 11.10 Total CT, MA, NY 29.17 19.6
California 36.12 31.4 Data from 2007 Statistical Abstract, U.S. Bureau of Census. Population figures for 2005 and vehicle registrations for 2004
The Connecticut Center for Advanced Technology, Inc. © 2008 118
Vehicle Infrastructure Partnerships
Successful penetration of the transportation market by hydrogen vehicles will require
simultaneous deployment of vehicles and infrastructure. These elements of hydrogen
transportation involve many different corporations as well as local, state and federal
governments. Uncertainty with regard to decisions and commitment of the other independent
players adds risk to decisions by the individual entities and delays deployment. Partnership
agreements with each independent party would be an important mechanism for establishing
the roles, responsibilities, schedule and performance objectives of each participant. During
Step 1, the basic needs of each party should be identified and a general form of an agreement
which satisfies those needs should be established. In Step 2, partnerships should be
established and they should carry out many of the demonstration activities in Step 2. The
partnerships are crucial to commercial deployment and should continue during Steps 3 and 4.
Code and Regulatory Efforts
National and international efforts to establish standards for the design and installation of
hydrogen infrastructure and hydrogen vehicles are summarized in a 2006 study of hydrogen
transportation in Connecticut.146 However, there is no coordinated effort to incorporate these
standards into building codes and other regulations in Connecticut. Further, there is no
central focus which can answer and resolve questions regarding these issues in Connecticut,
and local permitting officials are not sufficiently trained in this area. As mentioned
previously, a single organization designated to manage the transportation effort could also act
as the primary contact and coordinating entity for these activities in Connecticut. This is
important in minimizing wasted effort during design and construction of infrastructure
facilities and, perhaps more important, establishing this focal point would make Connecticut
more attractive to support the efforts of federal agencies and vehicle manufacturers.
146 The Connecticut Academy of Science and Engineering. Report to The Connecticut Department of
Transportation. June 2006. “Preparing for the Hydrogen Economy: Transportation”
The Connecticut Center for Advanced Technology, Inc. © 2008 119
Research and Development
The research and development activity associated with transportation is primarily associated
with products which have not yet been delivered for demonstration activity by Connecticut
industry. These products include fuel cell components such as fuel processors for gasoline
and diesel fuel, on-site natural gas reformers for fueling stations and power plants for
service/off-road vehicles and gasoline or diesel fueled auxiliary power units. After Step 1,
Connecticut support of research and development should shift to correcting shortcomings
identified in demonstration activities. The bulk of research and development will be funded
by the U.S. government and industry, but initial research funding and subsequent co-funding
from the Connecticut will be effective in securing additional funds from these sources.
Cost Estimate to Implement Proposed Transportation Plan
A preliminary estimate of program cost has been prepared. The primary sources of program
funding are expected to be the Hydrogen, Fuel Cell and Infrastructures Technology
Program147 of the Energy Efficiency and Renewable Energy Office of the U.S. DOE and the
National Fuel Cell Bus Program of the Federal Transit Administration of the U.S. Department
of Transportation.148 Co-funding of the effort by Connecticut and Connecticut’s industry will
provide the balance of funds.
147 http://www1.eere.energy.gov/hydrogenandfuelcells/ 148 http://www.fta.dot.gov/documents/Strategic_plan_9-30-05.doc
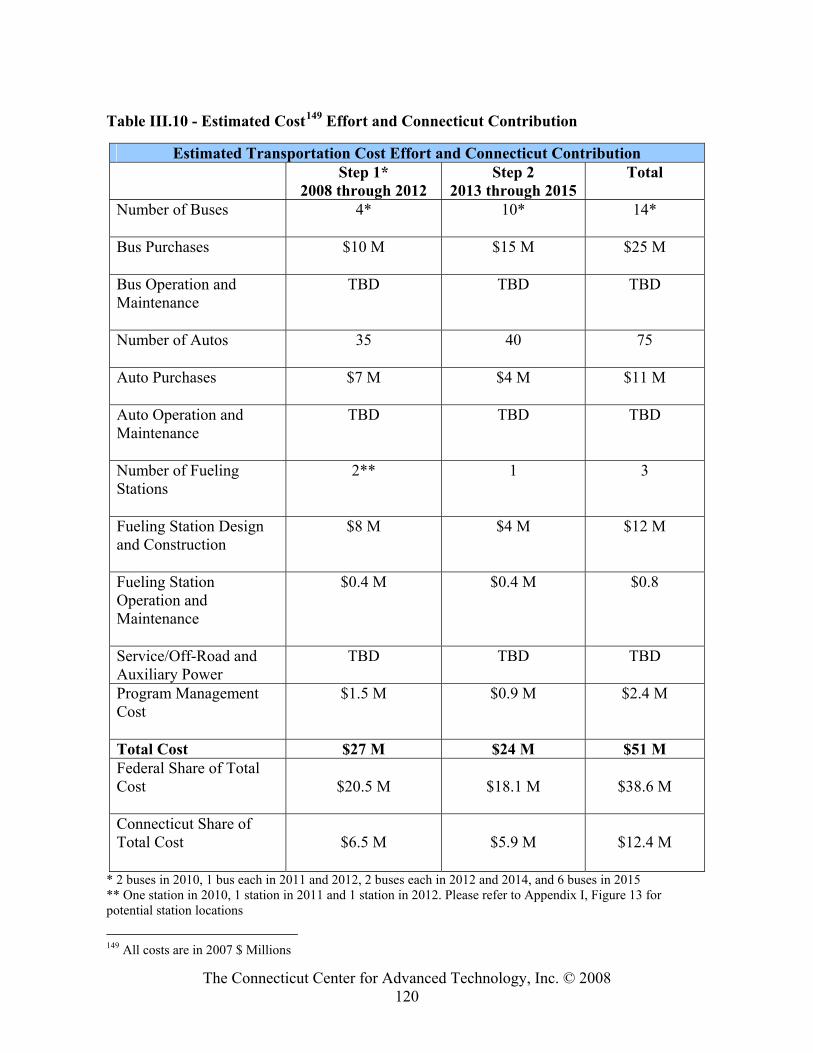
The Connecticut Center for Advanced Technology, Inc. © 2008 120
Table III.10 - Estimated Cost149 Effort and Connecticut Contribution
Estimated Transportation Cost Effort and Connecticut Contribution Step 1*
2008 through 2012 Step 2
2013 through 2015 Total
Number of Buses
4* 10* 14*
Bus Purchases
$10 M $15 M $25 M
Bus Operation and Maintenance
TBD TBD TBD
Number of Autos
35 40 75
Auto Purchases
$7 M $4 M $11 M
Auto Operation and Maintenance
TBD TBD TBD
Number of Fueling Stations
2** 1 3
Fueling Station Design and Construction
$8 M $4 M $12 M
Fueling Station Operation and Maintenance
$0.4 M $0.4 M $0.8
Service/Off-Road and Auxiliary Power
TBD TBD TBD
Program Management Cost
$1.5 M $0.9 M $2.4 M
Total Cost $27 M $24 M $51 M Federal Share of Total Cost
$20.5 M
$18.1 M
$38.6 M
Connecticut Share of Total Cost
$6.5 M
$5.9 M
$12.4 M
* 2 buses in 2010, 1 bus each in 2011 and 2012, 2 buses each in 2012 and 2014, and 6 buses in 2015 ** One station in 2010, 1 station in 2011 and 1 station in 2012. Please refer to Appendix I, Figure 13 for potential station locations
149 All costs are in 2007 $ Millions
The Connecticut Center for Advanced Technology, Inc. © 2008 121
It is assumed that U.S. Government programs would provide 80 percent of the funding for
purchase of vehicles and fueling stations, and that Connecticut and industry would be
responsible for the balance of 20 percent for hardware purchases, as well as for operating and
maintenance costs, and program management. This means that the share borne by
Connecticut and industry would be approximately $12.4 million, not including all operation
and maintenance costs for buses, automobiles, service/off-road, and auxiliary power
applications. These totals do not include unknown costs for service/off-road vehicle power
and auxiliary power. No estimate has been made for Steps 3 and 4 because they are nearly a
decade in the future.
Potential for Use of Federal Funding
Department of Transportation
Connecticut Congestion Mitigation and Air Quality (CMAQ): As currently configured, the
Connecticut CMAQ Alternative Fuel Vehicle (AFV) Program grant program provides
funding to cover the incremental cost of an AFV. The incremental cost is the difference in
cost between the AFV model and its equivalent petroleum fueled model. No funding is
available to support the growth of infrastructure. In contrast, all of the states that surround
Connecticut allow for CMAQ funds to be used to support infrastructure.
National Fuel Cell Bus Program of the Federal Transit Administration:150 The NFCBP is a
research, development, and demonstration program. The program began granting funds in
2006 and is authorized to grant $12,750,000 and $13,500,000 for fiscal years 2008 and 2009,
respectively. The program aims to facilitate the development of commercially viable fuel cell
bus technologies and related infrastructure and will competitively award funding for up to
three geographically diverse non-profit organizations or eligible recipients (i.e., transit
agencies eligible to receive FTA financial assistance).
150 Federal Transit Administration. National Fuel Cell Bus Program Solicitation, www.fta.dot.gov/documents/Fuel_Cell_Solicitation_Guidelines_Final.doc; November 30, 2007
The Connecticut Center for Advanced Technology, Inc. © 2008 122
Department of Energy Funding
Clean Cities Program: Since its inception in 1994, the DOE Clean Cities Program has
solicited for AFV proposals as part of the State Energy Projects (SEP) program. (This grant
program is administered within the State of Connecticut by OPM.) Lately, the solicitations
have tended to be weighted towards large regional partnership type projects. It should be
noted that FHA CMAQ funds cannot be used as part of any match for Federal Grant
programs. The Connecticut Clean Cities can be part of the partnership and submit any
proposal on behalf of the Connecticut Hydrogen-Fuel Cell Coalition.
Hydrogen, Fuel Cell and Infrastructures Technology Program of the Energy Efficiency and
Renewable Energy Office:151 This initiative is the lead program for directing and integrating
activities in hydrogen and fuel cell R&D and responsible for coordinating the R&D activities
for DOE's Hydrogen Program. It works in partnership with industry, academia, and national
laboratories to advance the field of hydrogen and fuel cell technologies with the vision of
making the technology feasible for widespread use. The program offers various funding
opportunities directed at supporting the goals of the program. Each opportunity has its own
guidelines and objectives.
Managing the Program
There are many uncertainties in the development of hydrogen vehicles and infrastructure.
Some are basic and apply to all market segments like the cost of fuel cell power plants, the
associated electric drives and batteries and the cost of hydrogen delivered to the vehicle.
While size and weight of the fuel cell and hydrogen storage are far from acceptable levels for
automobiles, they are much closer for buses. Buses and other fleet vehicles require durability
much greater than automobiles, but are somewhat more tolerant of long start up times. Both
automobiles and buses require much higher levels of reliability than has been demonstrated,
but this is more of an engineering development/test/design issue than a fundamental
technology issue. It will take significant amounts of demonstration testing to identify 151 U.S. Department of Energy, Hydrogen, Fuel Cells & Infrastructure Technologies Program www1.eere.energy.gov/hydrogenandfuelcells/, November 2007
The Connecticut Center for Advanced Technology, Inc. © 2008 123
reliability problems and time will be required to design and verify solutions to these
problems.
The uncertainties are compounded by the dependence for success among multiple parties
including vehicle manufacturers, fuel cell manufacturers, vehicle system manufacturers,
infrastructure companies and federal and state government. At present, there is no
mechanism that compels each party to make the decisions required for all parties to succeed.
Competing technologies such as improvements to conventional vehicle drive systems, hybrid
vehicles, vehicles fueled with natural gas and natural gas-hydrogen mixtures (Hythane®) and
vehicles fueled by renewable fuels such as E85 ethanol and biodiesel are all improving and
these improvements may reduce incentives to develop fuel cell vehicles and the hydrogen
infrastructure. Some of these alternative technologies may also pioneer approaches beneficial
to hydrogen and fuel cell vehicles and could accelerate the deployment of hydrogen and fuel
cell vehicles.
While the uncertainties noted above could result in delay of program activity, there is also the
possibility that the program activity may accelerate. Should political, economic, energy
security or environmental policies prompt a rapid advancement towards alternative fuels, the
large-scale production of hydrogen fuel cell cars could begin sooner than expected and
Connecticut should be prepared to take advantage of these unforeseen developments.
Prudent use of Connecticut funds and effort in this endeavor requires that progress in
development of the fundamental technology, over which Connecticut has little control, and
progress in demonstrating the suitability of vehicles in terms of performance, durability,
reliability and cost be monitored regularly and frequently. The Connecticut program should
be adjusted to reflect the current status and prospects for the technology.
The Connecticut Center for Advanced Technology, Inc. © 2008 124
Research and Development
The global market in fuel cell technology continues to grow, and is projected to be a multi-
billion dollar industry. However, to some extent, the industry is still in the early stages of
development in certain market sectors, and major barriers to product development remain. In
particular, fuel cell scientific research and technology development progress has not been
linked to integrated product development processes, and limitations in the supporting
technical, human, and commercial infrastructure have resulted in serious problems with
product cost and durability. Several national studies of the state of the art reflect the need to
address cross-cutting challenges.152 According to the U.S. DOE Report to Congress, “Proving
full performance and reliability of fuel cell systems over the required life in field applications
is a prerequisite for all applications.”153
Research Centers and Support
While much of the related research and development have historically been conducted within
industry and national laboratories, a number of the states have significant research center
activity supported by federal and state funding for fuel cell and hydrogen research. These
centers are typically located at universities and this research support is an important factor in
state involvement with fuel cells. In Connecticut, the Connecticut Global Fuel Cell Center
(CGFCC) at the University of Connecticut (UCONN) undertakes such scientific research and
technology development. Appendix E, Table IV.5 describes the research and development
centers located around the nation that are specifically directed at alternative energy including
fuel cells and hydrogen, as well as key state funding initiatives. Many of the other states have
federally funded energy research facilities that provide supporting infrastructure for hydrogen
152 “National Hydrogen Energy Roadmap”, United States Department of Energy, November 2002 152 “Fuel Cells for Transportation”, United States Department of Energy, March 2002 152 Engineering and Public Policy, Committee on Science, “On Being a Scientist: Responsible Conduct in Research”, National Academy Press, 1995 152 U.S. Department of Energy Hydrogen Program, 2007 Annual Progress Report; http://www.hydrogen.energy.gov/annual_progress07_storage.html#g, December 2007 153 “Fuel Cell Report to Congress”, Department of Energy, ESECS EE-1973, Feb. 2003
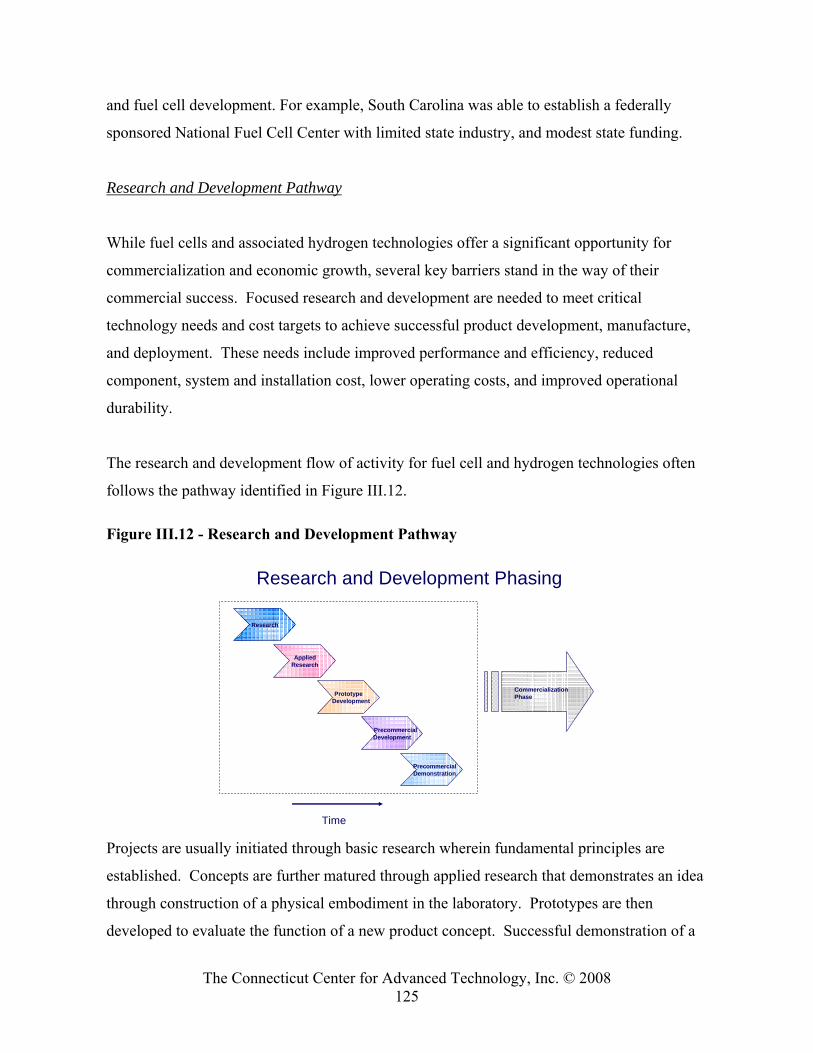
The Connecticut Center for Advanced Technology, Inc. © 2008 125
and fuel cell development. For example, South Carolina was able to establish a federally
sponsored National Fuel Cell Center with limited state industry, and modest state funding.
Research and Development Pathway
While fuel cells and associated hydrogen technologies offer a significant opportunity for
commercialization and economic growth, several key barriers stand in the way of their
commercial success. Focused research and development are needed to meet critical
technology needs and cost targets to achieve successful product development, manufacture,
and deployment. These needs include improved performance and efficiency, reduced
component, system and installation cost, lower operating costs, and improved operational
durability.
The research and development flow of activity for fuel cell and hydrogen technologies often
follows the pathway identified in Figure III.12.
Figure III.12 - Research and Development Pathway
Research and Development Phasing
Time
Research
AppliedResearch
PrototypeDevelopment
PrecommercialDevelopment
PrecommercialDemonstration
CommercializationPhase
Projects are usually initiated through basic research wherein fundamental principles are
established. Concepts are further matured through applied research that demonstrates an idea
through construction of a physical embodiment in the laboratory. Prototypes are then
developed to evaluate the function of a new product concept. Successful demonstration of a
The Connecticut Center for Advanced Technology, Inc. © 2008 126
prototype often leads to pre-commercial development where product features are further
developed and evaluated. The final phase of research and development includes pre-
commercial demonstration wherein the general form of the product is evaluated against the
anticipated operational environment that the product would see in service. Knowledge gained
through these efforts is carried forward into the commercialization phase of the product
development cycle. Once a technology platform is developed and deployed, this new
technology may also be leveraged into new market applications thereby creating spin-out
opportunities.
Hydrogen and Fuel Cell Performance Goals
The U.S. Department of Energy has established performance targets for various hydrogen and
fuel cell technologies in addressing transportation; hydrogen production and fueling
infrastructure; stationary; and portable power. These performance targets have relevance to
Connecticut entities in their efforts to develop new business as they create opportunities for
R&D market growth. Each of these R&D market opportunities will be summarized in the
sections that follow.
Transportation Power
The majority of the R&D focus is on fuel cells for transportation applications wherein the
cost of fuel cell systems must be reduced in order to become competitive with internal
combustion engines (ICEs) which currently cost about $25-35 / kW for an automobile.
According to the U.S. Department of Energy, a fuel cell system needs to cost less than $50 /
kW for the technology to be competitive. Ballard Power Systems showed a 2005 cost of
$73/kW at a reasonable production volume in a Roadmap cost estimate.154 While much of the
cost of a PEM fuel cell comes from precious-metal catalysts that are currently used to support
the electrochemical reactions the costs of the membrane, cell hardware and balance-of-plant
154 “DOE Hydrogen Program Record”, http://hydrogen.energy.gov/pdfs/5036_fuel_cell_stack_durability.pdf, May 22, 2006
The Connecticut Center for Advanced Technology, Inc. © 2008 127
components are also important. Fuel cells for transportation also face special design
challenges relating to size/weight, fuel requirements and transient response.
The durability of fuel cells operating under automotive conditions is unknown, although
performance requirements and reliability are expected to be similar to that of current
automotive engines (5,000 hour lifespan ~150,000 miles equivalent) under challenging
environmental conditions (-40° to +40°C). Fuel cell stack systems have been reported to
have over 2,000 hour life spans.155 Membranes must be able to perform over the full range of
system operating temperatures with less than 5 percent loss of performance by the end of life.
The durability of catalysts and carbon supports is also a problem. Fuel cell and stack
hardware (bipolar plates, gas diffusion layers and seals) require further development to
decrease stack weight and improve sealing capability.
Air management for fuel cell systems is a challenge because current compressor technologies
are considered inadequate for automotive fuel cell applications. Thermal and water
management also require further development to maximize performance and minimize
size/weight, reduce parasitic power consumption, and minimize the overall cost and
complexity of the system. A primary objective set forth by the U.S. Department of Energy
for fuel cells used in transportation markets is shown below:
• By 2010, develop a 60 percent peak-efficient, durable, direct hydrogen fuel cell power
system for transportation at a cost of $45/kW; by 2015, a cost of $30/kW.156
Hydrogen Production and Fueling Infrastructure
It is expected that hydrogen fuel introduced as an energy carrier for the transportation sector
will initially be required in small quantities. Consequently, it is anticipated that distributed
production of hydrogen may be the most viable approach, which would require less capital
investment for the small capacity of hydrogen needed, as compared to centralized hydrogen
155 “DOE Hydrogen Program Record”, http://hydrogen.energy.gov/pdfs/5036_fuel_cell_stack_durability.pdf, May 22, 2006 156 DOE, Hydrogen, Fuel Cells & Infrastructure Technologies Program, March 2005, http://www.nrel.gov/docs/fy05osti/34289.pdf, November 29, 2007
The Connecticut Center for Advanced Technology, Inc. © 2008 128
generation systems. In addition, distributed hydrogen generation would not require a
substantial hydrogen transport and delivery infrastructure.
Two promising distributed hydrogen production technologies are (1) reforming of natural gas
or liquid fuels, including bio-derived liquids, such as ethanol and bio-oil, and (2) small-scale
water electrolysis located at the point of use. Of these technologies, small-scale natural gas
reformers are the closest to meeting the hydrogen production cost targets, but these systems
emit carbon dioxide – a greenhouse gas. Onboard or on-site reformation of conventional
fuels does not directly reduce greenhouse gas emissions, but does offer a means for fuels cells
to use the existing fuel distribution system. Distributed reformation of bio-derived liquids
offers significantly lower net greenhouse gas emissions. The use of small-scale electrolyzers
to produce hydrogen by splitting water make sense with a low cost of electricity and/or when
coupled to renewables such as solar, wind, or hydro-power. Additionally, photo-
electrochemical hydrogen production157 has the potential to be used in the long term for
distributed hydrogen production.
Other production methods combine the generation of hydrogen fuel, heat, and electric power.
In these scenarios, hydrogen fuel could be produced for use: (1) in stationary fuel cells to
produce electricity and heat and (2) as a transportation fuel in fuel cell vehicles or hydrogen-
fueled internal combustion engine vehicles. Systems are currently being designed to offer
flexibility in producing the appropriate combination of hydrogen fuel, heat, and electric
power for a given application. This technology allows two markets for the hydrogen that
could help to initiate the use of hydrogen when hydrogen demand is small.
Hydrogen separation and compression are key technologies that apply to most hydrogen
production options. Metallic and microporous separation membranes are being developed as
candidate materials for hydrogen purification. Reducing the cost of membrane materials,
achieving higher throughput, increasing separation efficiency, and addressing durability
issues are critical research areas. High efficiency compressors must be developed that have
157 this consists of solar energy incident on a semiconductor electrode which absorbs the light to generate electricity that is used to produce hydrogen form water in-situ
The Connecticut Center for Advanced Technology, Inc. © 2008 129
low capital cost, minimal maintenance requirements, and low operating cost.
Electrochemical systems are now being developed to separate hydrogen from a contaminated
stream and to effect highly efficient compression in a solid state device. Again, efforts to
reduce cost, and validate the durability of the individual elements of these systems, as well as
scale-up to meet the volume and pressure demands of field applications for separation and
compression, are critical research areas.
The overall challenge to hydrogen production is reducing cost. According to U.S.
Department of Energy estimates, hydrogen (as of 2003) costs $5/gge (gallon of gasoline
equivalent) delivered to a car at a refueling station based on distributed production using
natural gas. This is significantly higher than the 2015 goal of $2.00/gge (the cost in 2006 is
estimated to be $3.00/gge). Estimates of the delivered cost of hydrogen using currently
available technology for all production feedstocks are considerably higher than that required
for hydrogen to be a cost-competitive primary energy carrier.
Specific performance goals for hydrogen infrastructure development, as proposed by the U.S.
Department of Energy, include the following:158
• Reduce the cost of hydrogen to $2.00-$3.00/gge (delivered) at the pump. This goal is
independent of the technology pathway;
• By 2010, reduce the cost of distributed production of hydrogen from natural gas to
$2.50/gge (delivered) at the pump. By 2015, reduce the cost of distributed hydrogen
production from natural gas to $2.00/gge (delivered) at the pump;
• By 2012 reduce the cost of distributed production of hydrogen from biomass-derived
renewable liquids to $3.80/gge (delivered) at the pump. By 2017, reduce the cost of
distributed production of hydrogen from biomass-derived renewable liquids to
<$3.00/gge (delivered) at the pump;
• By 2012, reduce the cost of distributed production of hydrogen from distributed water
electrolysis to $3.70/gge (delivered) at the pump. By 2017, reduce the cost of
distributed production of hydrogen from distributed water electrolysis to <$3.00/gge
158 DOE, Hydrogen, Fuel Cells & Infrastructure Technologies Program, March 2005, http://www.nrel.gov/docs/fy05osti/34289.pdf, November 29, 2007
The Connecticut Center for Advanced Technology, Inc. © 2008 130
(delivered) at the pump. By 2012, reduce the cost of central production of hydrogen
from wind water electrolysis to $3.10/gge at plant gate ($4.80/gge delivered), By
2017, reduce the cost of central production of hydrogen from wind water electrolysis
to <$2.00/gge at plant gate (<$3.00/gge delivered);
• By 2012, reduce the cost of hydrogen produced from biomass gasification to
$1.60/gge at the plant gate (<$3.30/gge delivered). By 2017, reduce the cost of
hydrogen produced from biomass gasification to $1.10/gge at the plant gate
($2.10/gge delivered);
• By 2017, develop high-temperature thermo-chemical cycles driven by concentrated
solar energy to produce hydrogen with a projected cost of $3.00/gge at the plant gate
($4.00/gge delivered) and verify the potential for this technology to be competitive in
the long term; and
• Develop advanced renewable photo-electrochemical and biological hydrogen
generation technologies. By 2018, verify the feasibility of these technologies to be
competitive in the long term.
Stationary Power
Although performance requirements for stationary power systems differ from transportation
applications, some challenges, such as the requirement for cost competitiveness and access to
hydrogen fuel, remain the same. But the benefit is that stationary power systems have a much
higher price point than transportation systems. Performance of fuel cells for stationary
applications for up to 60,000 hours159 has been demonstrated. Current performance goals
include 40,000 hours of reliable operation over the full range of external environmental
conditions (-35° to 40°C).
The low operating temperature of PEM fuel cells limits the amount of waste heat that can be
effectively used in CHP applications. This technology is therefore being considered for
intermittent operation including backup power applications. A 1 kWe residential fuel cell
159 UTC Power, December 13, 2007
The Connecticut Center for Advanced Technology, Inc. © 2008 131
system was introduced in Japan on a limited scale in early February of 2005.160 In addition,
technologies that need to be developed for molten carbonate and phosphoric acid stationary
systems include designs for better thermal management and those that will enable CHP
efficiencies to exceed 80%.
By 2011, the U.S. Department of Energy seeks to have a distributed generation PEM fuel cell
system operating on natural gas or LPG that achieves 40% electrical efficiency and 40,000
hours durability at $750/kW.161
Portable Power
Elements of fuel cell systems technology for portable power applications include consumer
electronics, high power portable systems, and fuels/fuels packaging. While direct methanol
fuel cells (a PEM fuel cell having a liquid methanol fuel feed rather than hydrogen) have been
the technology of choice for low-power consumer electronics, direct methanol, proton
exchange membrane, and solid oxide fuel cells are candidates for high power portable
systems – depending on specific application requirements. Portable fuel storage and/or
processing technologies are of critical importance for each of these applications with liquid
methanol, hydrogen in solid, liquid and gas forms, liquid hydrocarbons, and ammonia all
being considered for different applications.
Fuel cell requirements for consumer electronics can be divided into three primary categories
ranging from low-power (sub-Watt to 20 Watt), medium power (20-50 Watts) for laptop
computers, and high power (1-5 kW) for auxiliary power units. In 2002, the U.S. Department
of Energy conducted a workshop with many of the technology manufacturers to establish
160 “Japanese Partners Plan Commercial Launch of Residential PEM Cogen Systems”, Science Direct, Fuel Cells Bulletin, Volume 2005, Issue 2, February 2005, Page 3 161 “21st Century Truck Partnership, Roadmap and Technical White Papers”, Appendix of Supporting Information, December 2006, http://www1.eere.energy.gov/vehiclesandfuels/pdfs/program/21ctp_roadmap_appendix_2007.pdf
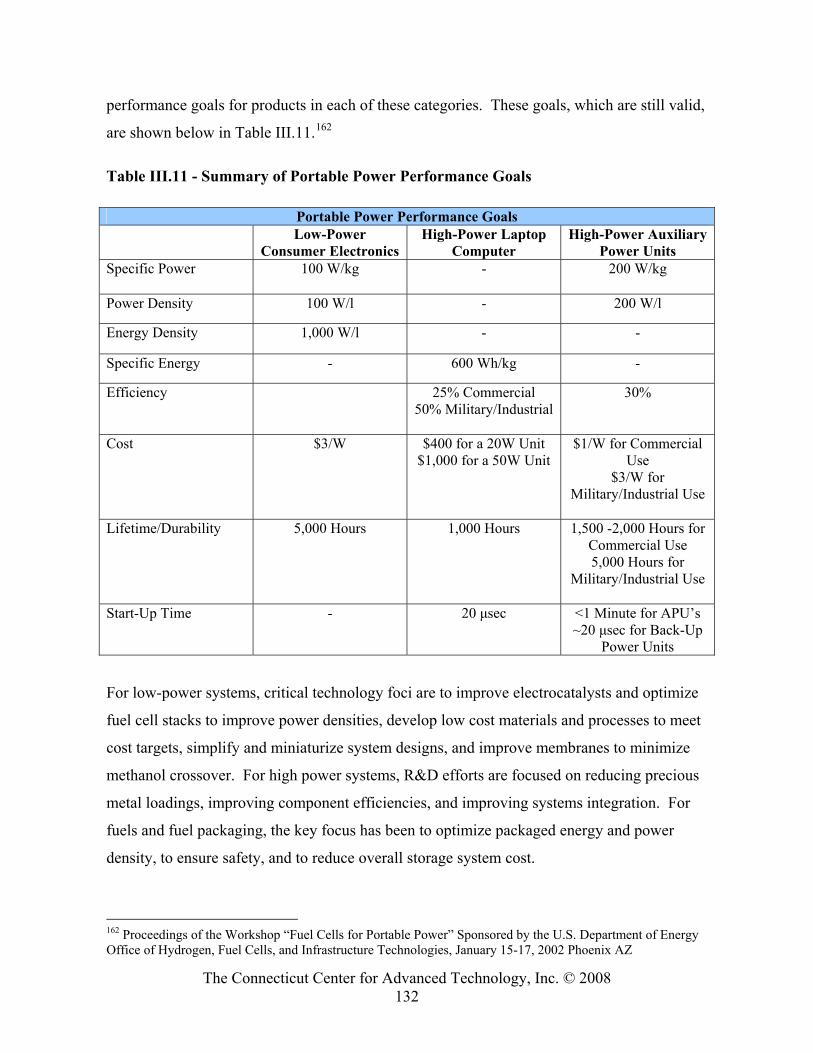
The Connecticut Center for Advanced Technology, Inc. © 2008 132
performance goals for products in each of these categories. These goals, which are still valid,
are shown below in Table III.11.162
Table III.11 - Summary of Portable Power Performance Goals
Portable Power Performance Goals Low-Power
Consumer Electronics High-Power Laptop
Computer High-Power Auxiliary
Power Units Specific Power 100 W/kg - 200 W/kg
Power Density 100 W/l - 200 W/l
Energy Density 1,000 W/l - -
Specific Energy - 600 Wh/kg -
Efficiency 25% Commercial 50% Military/Industrial
30%
Cost $3/W $400 for a 20W Unit $1,000 for a 50W Unit
$1/W for Commercial Use
$3/W for Military/Industrial Use
Lifetime/Durability 5,000 Hours 1,000 Hours 1,500 -2,000 Hours for
Commercial Use 5,000 Hours for
Military/Industrial Use
Start-Up Time - 20 μsec <1 Minute for APU’s ~20 μsec for Back-Up
Power Units
For low-power systems, critical technology foci are to improve electrocatalysts and optimize
fuel cell stacks to improve power densities, develop low cost materials and processes to meet
cost targets, simplify and miniaturize system designs, and improve membranes to minimize
methanol crossover. For high power systems, R&D efforts are focused on reducing precious
metal loadings, improving component efficiencies, and improving systems integration. For
fuels and fuel packaging, the key focus has been to optimize packaged energy and power
density, to ensure safety, and to reduce overall storage system cost.
162 Proceedings of the Workshop “Fuel Cells for Portable Power” Sponsored by the U.S. Department of Energy Office of Hydrogen, Fuel Cells, and Infrastructure Technologies, January 15-17, 2002 Phoenix AZ
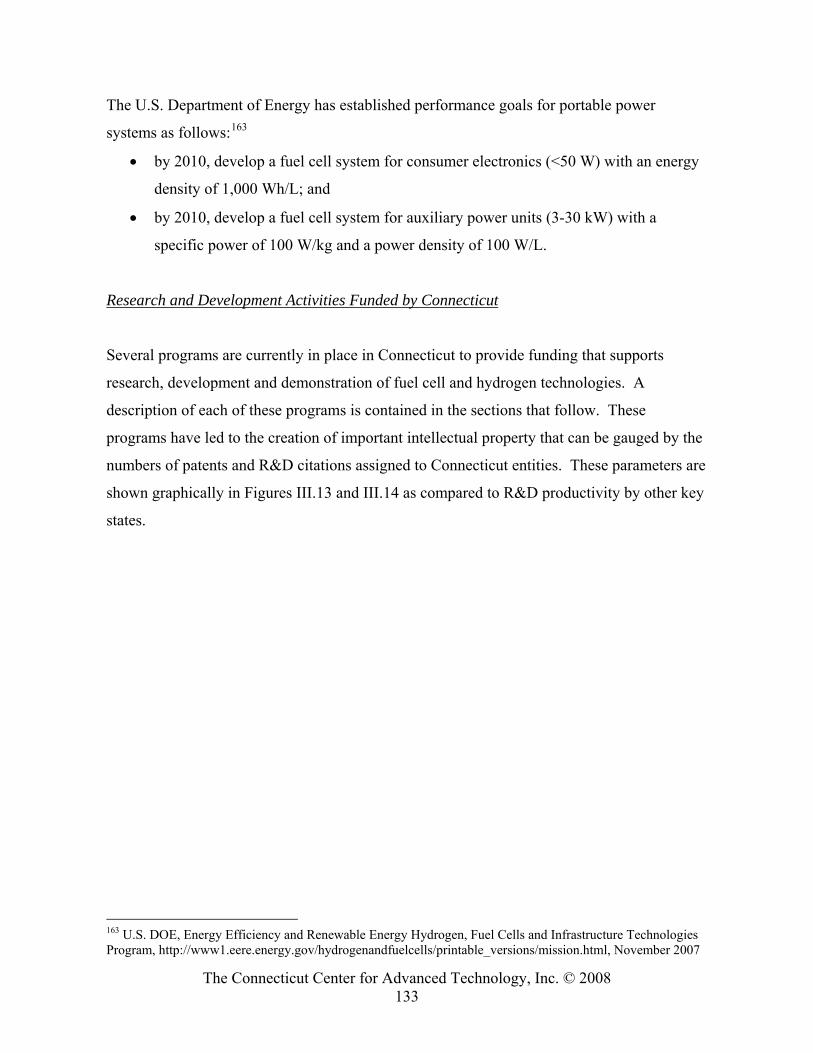
The Connecticut Center for Advanced Technology, Inc. © 2008 133
The U.S. Department of Energy has established performance goals for portable power
systems as follows:163
• by 2010, develop a fuel cell system for consumer electronics (<50 W) with an energy
density of 1,000 Wh/L; and
• by 2010, develop a fuel cell system for auxiliary power units (3-30 kW) with a
specific power of 100 W/kg and a power density of 100 W/L.
Research and Development Activities Funded by Connecticut
Several programs are currently in place in Connecticut to provide funding that supports
research, development and demonstration of fuel cell and hydrogen technologies. A
description of each of these programs is contained in the sections that follow. These
programs have led to the creation of important intellectual property that can be gauged by the
numbers of patents and R&D citations assigned to Connecticut entities. These parameters are
shown graphically in Figures III.13 and III.14 as compared to R&D productivity by other key
states.
163 U.S. DOE, Energy Efficiency and Renewable Energy Hydrogen, Fuel Cells and Infrastructure Technologies Program, http://www1.eere.energy.gov/hydrogenandfuelcells/printable_versions/mission.html, November 2007
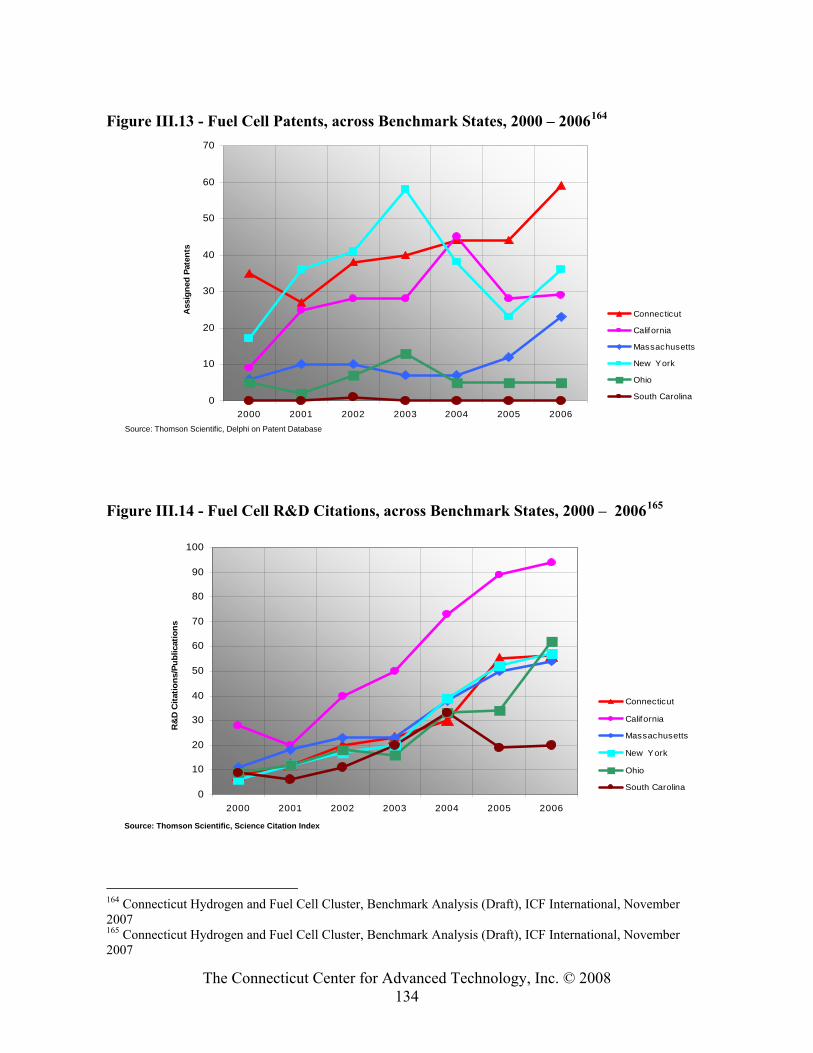
The Connecticut Center for Advanced Technology, Inc. © 2008 134
Figure III.13 - Fuel Cell Patents, across Benchmark States, 2000 – 2006164
Figure III.14 - Fuel Cell R&D Citations, across Benchmark States, 2000 – 2006165
164 Connecticut Hydrogen and Fuel Cell Cluster, Benchmark Analysis (Draft), ICF International, November 2007 165 Connecticut Hydrogen and Fuel Cell Cluster, Benchmark Analysis (Draft), ICF International, November 2007
Source: Thomson Scientific, Delphi on Patent Database
0
10
20
30
40
50
60
70
2000 2001 2002 2003 2004 2005 2006
Ass
igne
d Pa
tent
s
Connecticut
California
Massachusetts
New York
Ohio
South Carolina
0
10
20
30
40
50
60
70
80
90
100
2000 2001 2002 2003 2004 2005 2006
R&
D C
itatio
ns/P
ublic
atio
ns
Connecticut
California
Massachusetts
New York
Ohio
South Carolina
Source: Thomson Scientific, Science Citation Index
The Connecticut Center for Advanced Technology, Inc. © 2008 135
Connecticut Clean Energy Fund
The Connecticut Clean Energy Fund (CCEF) is financed by a ratepayer charge. Among its
many activities, the CCEF manages the Operational Demonstration Program which provides
up to $750,000 for pre-commercial technology demonstration.166 The goal of the program is
to make apparent the feasibility and economic benefits of new technology from such energy
sources as fuel cells, wind, solar, wave and tidal energy, ocean thermal energy, biomass,
landfill gas, and run-of-the-river hydropower. Hydrogen generation and storage technologies
are also supported. In 2007, an estimated $1.25 million will be used to support projects in
support of stationary power and hydrogen generation technologies that are nearing the
product introduction phase. Most of the OEM’s in Connecticut have benefited from this
fund.
Connecticut Yankee Ingenuity Fund
For 22 years, the Connecticut Yankee Ingenuity Fund provided funds to universities that
collaborate with Connecticut businesses to accelerate the development of emerging or
enabling technologies. The program was terminated in June of 2007. The Yankee Ingenuity
Technology Program awarded up to $300,000 to Connecticut universities that would
collaborate with Connecticut businesses on applied research and development projects.
Projects funded by the Connecticut Yankee Ingenuity Fund were intended to accelerate the
development of emerging or enabling technologies, provide state businesses with access to
world-class researchers, and improve the competitiveness of Connecticut’s technology
companies.167 Approximately $740,000 was recently awarded to Connecticut universities to
support fuel cell research as part of this initiative.
166 http://www.ctinnovations.com/funding/ccef/demo_project.php, November 2007 167 http://www.ctinnovations.com/funding/ccef/yankee.php, November 2007
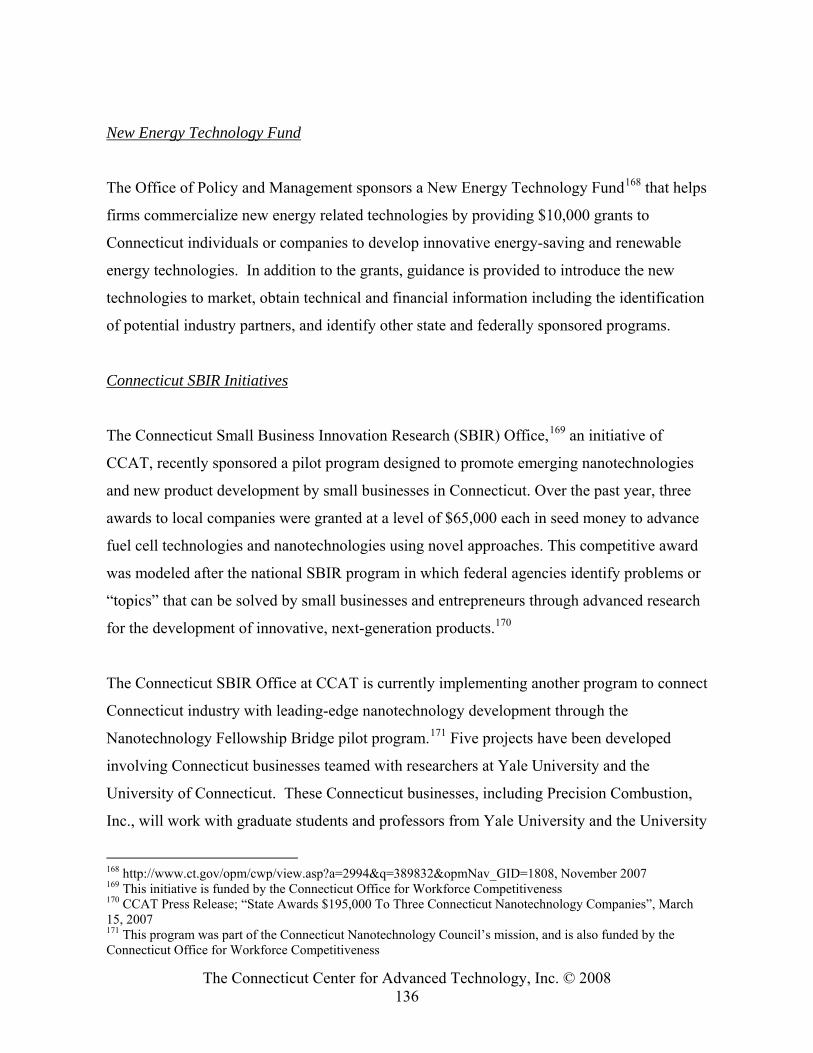
The Connecticut Center for Advanced Technology, Inc. © 2008 136
New Energy Technology Fund
The Office of Policy and Management sponsors a New Energy Technology Fund168 that helps
firms commercialize new energy related technologies by providing $10,000 grants to
Connecticut individuals or companies to develop innovative energy-saving and renewable
energy technologies. In addition to the grants, guidance is provided to introduce the new
technologies to market, obtain technical and financial information including the identification
of potential industry partners, and identify other state and federally sponsored programs.
Connecticut SBIR Initiatives
The Connecticut Small Business Innovation Research (SBIR) Office,169 an initiative of
CCAT, recently sponsored a pilot program designed to promote emerging nanotechnologies
and new product development by small businesses in Connecticut. Over the past year, three
awards to local companies were granted at a level of $65,000 each in seed money to advance
fuel cell technologies and nanotechnologies using novel approaches. This competitive award
was modeled after the national SBIR program in which federal agencies identify problems or
“topics” that can be solved by small businesses and entrepreneurs through advanced research
for the development of innovative, next-generation products.170
The Connecticut SBIR Office at CCAT is currently implementing another program to connect
Connecticut industry with leading-edge nanotechnology development through the
Nanotechnology Fellowship Bridge pilot program.171 Five projects have been developed
involving Connecticut businesses teamed with researchers at Yale University and the
University of Connecticut. These Connecticut businesses, including Precision Combustion,
Inc., will work with graduate students and professors from Yale University and the University
168 http://www.ct.gov/opm/cwp/view.asp?a=2994&q=389832&opmNav_GID=1808, November 2007 169 This initiative is funded by the Connecticut Office for Workforce Competitiveness 170 CCAT Press Release; “State Awards $195,000 To Three Connecticut Nanotechnology Companies”, March 15, 2007 171 This program was part of the Connecticut Nanotechnology Council’s mission, and is also funded by the Connecticut Office for Workforce Competitiveness
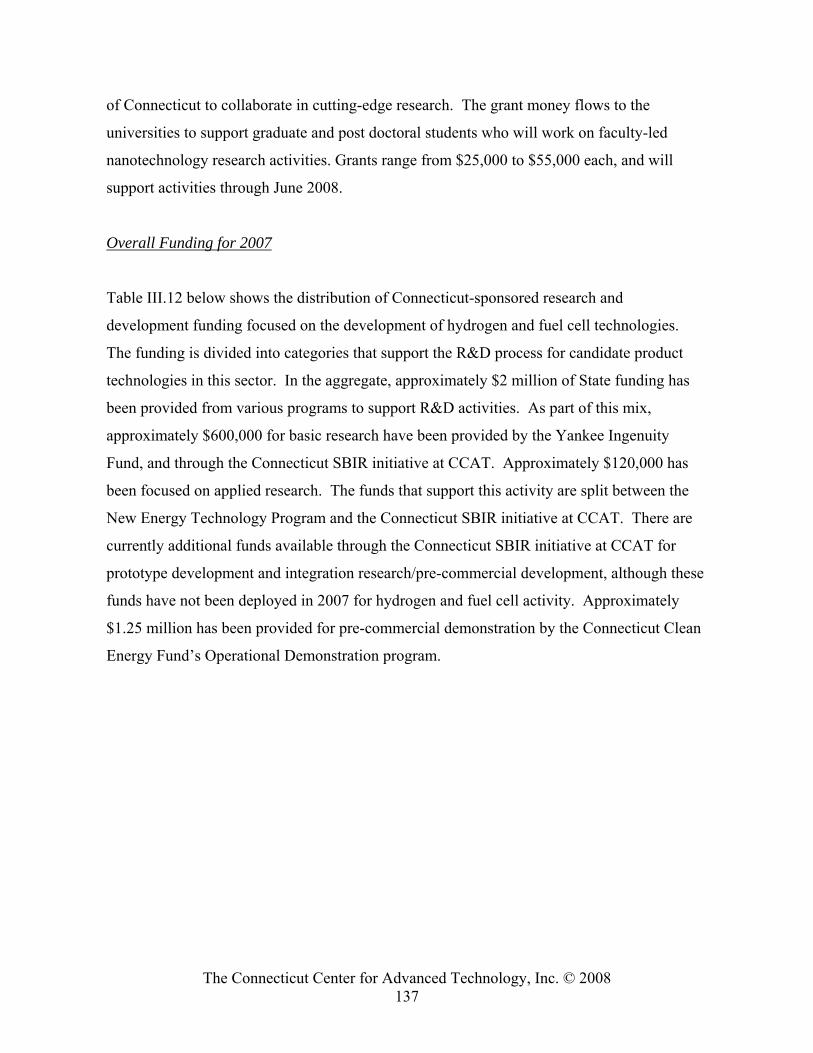
The Connecticut Center for Advanced Technology, Inc. © 2008 137
of Connecticut to collaborate in cutting-edge research. The grant money flows to the
universities to support graduate and post doctoral students who will work on faculty-led
nanotechnology research activities. Grants range from $25,000 to $55,000 each, and will
support activities through June 2008.
Overall Funding for 2007
Table III.12 below shows the distribution of Connecticut-sponsored research and
development funding focused on the development of hydrogen and fuel cell technologies.
The funding is divided into categories that support the R&D process for candidate product
technologies in this sector. In the aggregate, approximately $2 million of State funding has
been provided from various programs to support R&D activities. As part of this mix,
approximately $600,000 for basic research have been provided by the Yankee Ingenuity
Fund, and through the Connecticut SBIR initiative at CCAT. Approximately $120,000 has
been focused on applied research. The funds that support this activity are split between the
New Energy Technology Program and the Connecticut SBIR initiative at CCAT. There are
currently additional funds available through the Connecticut SBIR initiative at CCAT for
prototype development and integration research/pre-commercial development, although these
funds have not been deployed in 2007 for hydrogen and fuel cell activity. Approximately
$1.25 million has been provided for pre-commercial demonstration by the Connecticut Clean
Energy Fund’s Operational Demonstration program.
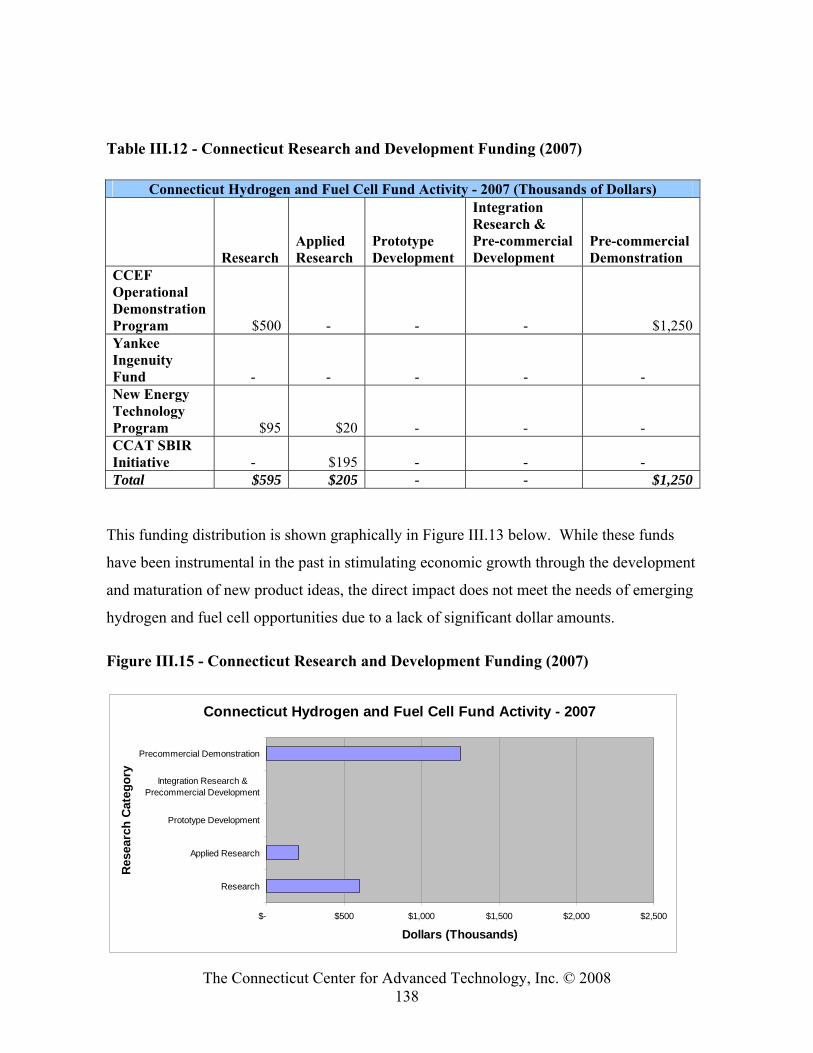
The Connecticut Center for Advanced Technology, Inc. © 2008 138
Table III.12 - Connecticut Research and Development Funding (2007)
Connecticut Hydrogen and Fuel Cell Fund Activity - 2007 (Thousands of Dollars)
Research Applied Research
Prototype Development
Integration Research & Pre-commercial Development
Pre-commercial Demonstration
CCEF Operational Demonstration Program $500 - - - $1,250 Yankee Ingenuity Fund - - - - - New Energy Technology Program $95 $20 - - - CCAT SBIR Initiative - $195 - - - Total $595 $205 - - $1,250
This funding distribution is shown graphically in Figure III.13 below. While these funds
have been instrumental in the past in stimulating economic growth through the development
and maturation of new product ideas, the direct impact does not meet the needs of emerging
hydrogen and fuel cell opportunities due to a lack of significant dollar amounts.
Figure III.15 - Connecticut Research and Development Funding (2007)
Connecticut Hydrogen and Fuel Cell Fund Activity - 2007
$- $500 $1,000 $1,500 $2,000 $2,500
Research
Applied Research
Prototype Development
Integration Research &Precommercial Development
Precommercial Demonstration
Res
earc
h C
ateg
ory
Dollars (Thousands)
The Connecticut Center for Advanced Technology, Inc. © 2008 139
Eminent Faculty in Sustainable Energy
Connecticut recently passed legislation that sets aside $2 million/year to support the
establishment of an Eminent Faculty Team in Sustainable Energy at the University of
Connecticut. The program is focused on conducting research to support sustainable energy
activity which may include fuel cells and hydrogen and draws matching financial support
from local fuel cell and energy industry. The University will seek to attract a scholar of
international stature and reputation who will effectively leverage and expand research and
development activities in sustainable energy, including fuel cells, biofuels and photovoltaics.
Other senior faculty positions will also be added as part of this program. Since this is a new
activity, and the specific distribution of funds within this program is not known, the impact
on the development of hydrogen and fuel cell technologies within the State is not fully known
at this time.
Connecticut Global Fuel Cell Center - Research Capabilities
Recognizing the need for fuel cell scientific research and technology development, the
CGFCC was established at UCONN in 2001. Over 40 faculty and 60 students are conducting
contract research on fuel cell science and related technologies at the CGFCC’s dedicated
16,000-ft2 facility. Initial research and development activity at CGFCC has benefited by an
investment of the Connecticut Clean Energy Fund. The contract research program for the
CGFCC in 2005 served 21 clients. Through these efforts and, especially through interactions
with industry, UCONN faculty has identified the need to focus on the systems that can benefit
from the incorporation of fuel cells, fully integrated from the electrical, thermal, mechanical,
chemical, and geometrical standpoints. In the last three years, the $15 million investment in
fuel cell engineering and science at UCONN has created a strong base for contract research
on a full range of nano- to systems-level topics associated with PEM fuel cells, direct
methanol fuel cells DMFCs, and SOFCs.172
172 Connecticut Global Fuel Cell Center, http://www.ctfuelcell.uconn.edu
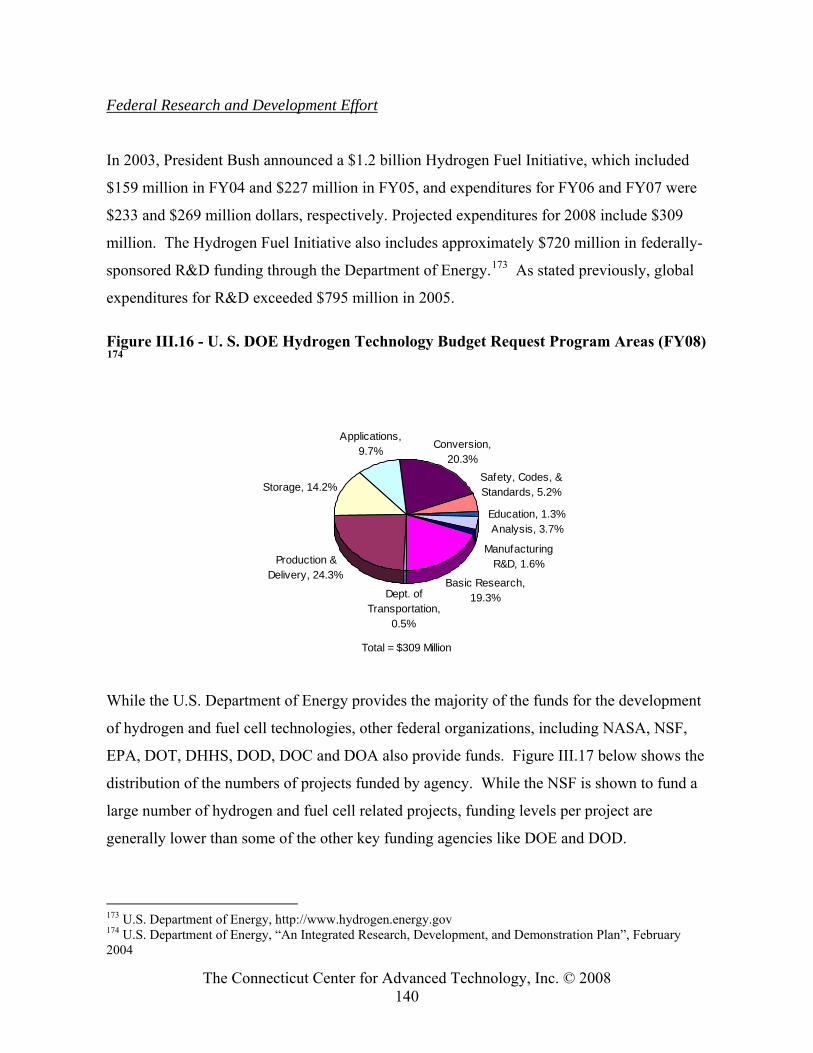
The Connecticut Center for Advanced Technology, Inc. © 2008 140
Federal Research and Development Effort
In 2003, President Bush announced a $1.2 billion Hydrogen Fuel Initiative, which included
$159 million in FY04 and $227 million in FY05, and expenditures for FY06 and FY07 were
$233 and $269 million dollars, respectively. Projected expenditures for 2008 include $309
million. The Hydrogen Fuel Initiative also includes approximately $720 million in federally-
sponsored R&D funding through the Department of Energy.173 As stated previously, global
expenditures for R&D exceeded $795 million in 2005.
Figure III.16 - U. S. DOE Hydrogen Technology Budget Request Program Areas (FY08)
174
Dept. of Transportation,
0.5%
Storage, 14.2%Safety, Codes, & Standards, 5.2%
Education, 1.3%
Applications, 9.7% Conversion,
20.3%
Production & Delivery, 24.3%
Basic Research, 19.3%
Analysis, 3.7%
Manufacturing R&D, 1.6%
Total = $309 Million
While the U.S. Department of Energy provides the majority of the funds for the development
of hydrogen and fuel cell technologies, other federal organizations, including NASA, NSF,
EPA, DOT, DHHS, DOD, DOC and DOA also provide funds. Figure III.17 below shows the
distribution of the numbers of projects funded by agency. While the NSF is shown to fund a
large number of hydrogen and fuel cell related projects, funding levels per project are
generally lower than some of the other key funding agencies like DOE and DOD.
173 U.S. Department of Energy, http://www.hydrogen.energy.gov 174 U.S. Department of Energy, “An Integrated Research, Development, and Demonstration Plan”, February 2004
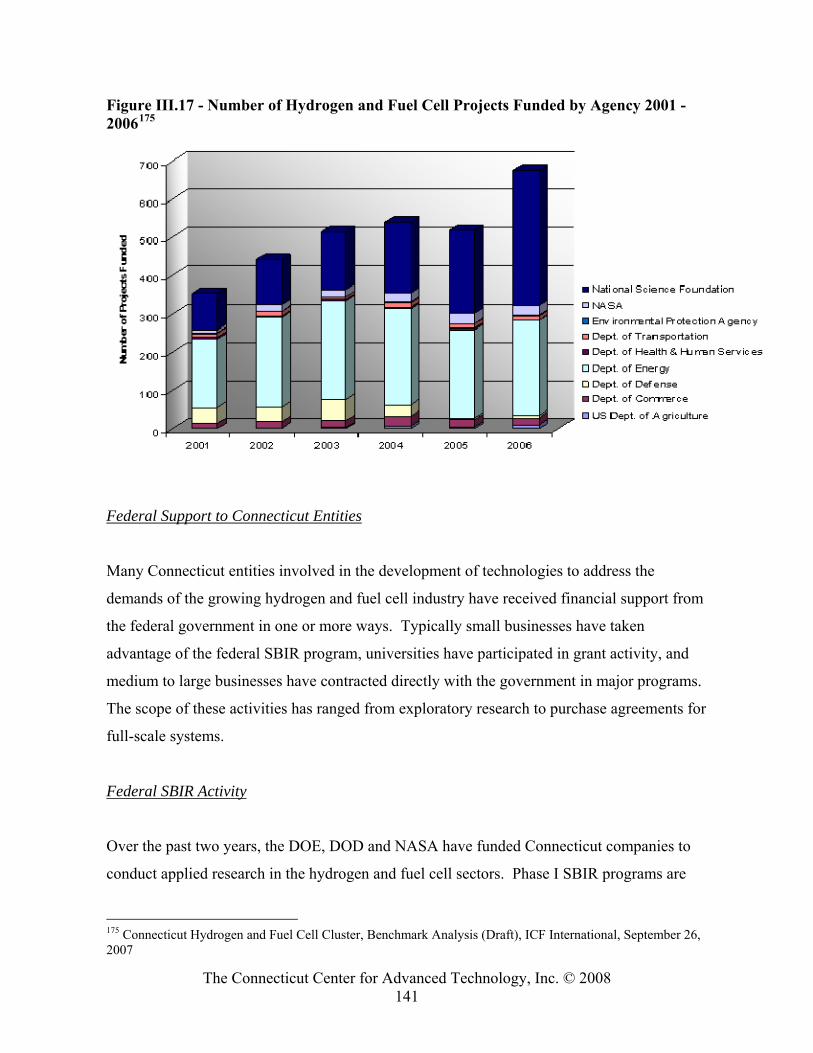
The Connecticut Center for Advanced Technology, Inc. © 2008 141
Figure III.17 - Number of Hydrogen and Fuel Cell Projects Funded by Agency 2001 - 2006175
Federal Support to Connecticut Entities
Many Connecticut entities involved in the development of technologies to address the
demands of the growing hydrogen and fuel cell industry have received financial support from
the federal government in one or more ways. Typically small businesses have taken
advantage of the federal SBIR program, universities have participated in grant activity, and
medium to large businesses have contracted directly with the government in major programs.
The scope of these activities has ranged from exploratory research to purchase agreements for
full-scale systems.
Federal SBIR Activity
Over the past two years, the DOE, DOD and NASA have funded Connecticut companies to
conduct applied research in the hydrogen and fuel cell sectors. Phase I SBIR programs are
175 Connecticut Hydrogen and Fuel Cell Cluster, Benchmark Analysis (Draft), ICF International, September 26, 2007
The Connecticut Center for Advanced Technology, Inc. © 2008 142
highly competitive with less than 1 in 10 proposed projects being funded. These programs
often net $100,000 or less and program activities generally must be completed within a 1 year
period. Successful completion of a Phase I activity allows a company to compete for a two
year Phase II program. Generally around 50% of the successful Phase I projects are allowed
to move forward to a Phase II. These programs range from $250 thousand to $1 million,
depending on the specific activity and funding agency. Success in Phase II may lead to larger
follow-on R&D support and product acquisition (Phase III) that is drawn from regular agency
budgets and provided to the SBIR firm with competitive preference.
The federal SBIR awards made to Connecticut companies for activities related to the
generation of hydrogen and the development of fuel cells through Phase I/II programs totaled
less than $2 million in the aggregate in each of 2005 and 2006 for hydrogen and fuel cell
development activity. In 2007, there were four Phase I awards to Connecticut companies
totaling approximately $400,000.
Research and Development Plan for Connecticut
The development and deployment of technologies related to hydrogen and fuel cells face
significant technical challenges with respect to cost, performance, and durability.
Connecticut has long been a center of innovation for high technology products, and
significant capability exists within Connecticut’s industrial and academic entities to address
these important technical challenges. State funding has been instrumental in supporting
research and development opportunities within this field, particularly at the initiation of the
R&D pipeline with support from the New Energy Technology Program, administered by the
Office of Policy and Management, the former Yankee Ingenuity Program, which was
administered by Connecticut Innovations, and the Connecticut SBIR Program at CCAT.
Critical financial support has also been provided at the end of the pipeline by the Connecticut
Clean Energy Fund in their Operational Demonstration Program.
However, support is currently lacking toward the center of the R&D pipeline wherein novel
concepts are developed and evaluated in prototype configurations (Step 3, Figure III.12). This
The Connecticut Center for Advanced Technology, Inc. © 2008 143
step is critical to successful R&D, but also important for marketing and financing the idea, as
well as achieving intellectual property protection. Support for the development of high
quality prototypes of new product concepts could enable companies to obtain private
investment. It is suggested that this gap be addressed in two ways. The first is to expand the
current Connecticut SBIR Initiative to reach beyond basic and applied research to include the
development of systems that validate the form and function of a new concept in prototype
form. The second is to create a cost share/cost matching program to allow companies that
have validated their basic technology through fundamental research to effectively multiply
their financial support from Federal agencies. This concept would make Connecticut entities
much more competitive in obtaining federal dollars directed for development activity that
may also carry a significant cost share burden.
The pilot program, developed by the SBIR Initiative at CCAT, demonstrated how to
successfully implement a federal model at the state level to support new product development
by small businesses in Connecticut. This pilot program has been modified to the new "CT
Nanotechnology Fellowship Bridge" program. These pilot programs should be expanded to
provide the level of funding needed to support the depth and breadth of innovative ideas
available for maturation and potential commercialization in the hydrogen and fuel cell sector.
Generally, three to four times the investment in basic and applied R&D is required to bring
promising technologies through the prototype stage.176 Based on the fact that Connecticut is
currently investing approximately $800,000 on an annual basis on basic and applied R&D in
the hydrogen and fuel cell sector, it is suggested that approximately $3 million per year be
invested for the advancement of these technologies through the prototype development stage.
The federal government provides funds for applied research through the national SBIR
program and to conduct R&D in support of government agency objectives, particularly for
the Department of Defense and the Department of Energy, through a series of competitive
bids or through congressionally directed actions. Often, the Department of Energy requires a
“cost share” wherein the proposing entity must contribute some share of the overall funds
required to complete the project of interest. Such grants tend to be highly competitive at the
176 Trent Molter, Connecticut Global Fuel Cell Center, December 14, 2007
The Connecticut Center for Advanced Technology, Inc. © 2008 144
outset, so when a Connecticut entity wins, its technology has generally been selected as
superior to other technologies from across the country. Small and developing companies
often have great difficulty finding internal funds to meet the cost share requirement for these
opportunities. It is suggested that cost share and cost match assistance be provided to
leverage federal funds to support these competitive bids, and political assistance to support
congressionally directed efforts could provide significant resources for R&D efforts in
Connecticut.
In FY 2005, the U.S. Department of Energy expenditure on the research and development of
fuel cells and hydrogen technology was approximately $385 million, which includes $300
million in support of ongoing fuel cell and hydrogen technology programs and $85 million in
combined support of the Freedom Car Initiative and the Vehicle Technologies Program.177
Historically, governmental R&D investment has grown by 11percent per year.178 Therefore,
R&D expenditures in FY 2010 from DOE are estimated to be approximately 649 million. If
it is assumed that because of Connecticut’s proposed cost share investment program,
Connecticut’s R&D efforts are able to capture 15% of the available R&D funds,
Connecticut’s share would be approximately $97 million. For DOE programs, cost share
requirements range from 0% to 50% with a nominal requirement of 15% of the value of the
program. Assuming that Connecticut entities invest half of the overall cost share
requirement, it is suggested that the State establish a cost share/cost match fund to contribute
the remainder, or approximately $7 million. In addition, it is estimated that sponsored
research from DOD, NASA, NSF, DOT, etc., would be approximately $458 million in 2010.
Using these same guidelines for state investment, it is suggested that the State establish a cost
match fund that covers 7.5% of the cost of other programs or $5 million for add-on R&D
activities to complement the Federal project. The total value of the cost share and cost match
funds would be $12 million. This investment provides an opportunity to help build State
technologies whose promise and worth has been validated by competitive awards or follow-
on awards by the Federal government, thereby building upon success. 177 Connecticut Hydrogen and Fuel Cell Cluster, Benchmark Analysis (Draft), ICF International, September 26, 2007 178 Connecticut Hydrogen and Fuel Cell Cluster, Benchmark Analysis (Draft), ICF International, September 26, 2007
The Connecticut Center for Advanced Technology, Inc. © 2008 145
While the New Energy Technology Program, administered by the Office of Policy and
Management, has been instrumental in providing risk funding to investigate new ideas or and
to support new energy projects, the level of funding provided by this program is substantially
less than what is needed to properly explore new ideas. It is suggested that support of this
important program be continued and doubled to include $100,000 in funds, half of which
could be focused on new hydrogen and fuel cell technologies.
The Yankee Ingenuity Program, which had been administered by Connecticut Innovations,
provided funds for the investigation of new technologies by university researchers. It is
suggested that a similar program be created and refined to accommodate the interests of small
business through the creation of a sliding scale for both cost share and technology ownership,
based on the size of the business or company revenue. Financial support to assist in the
development of new product concepts, conducting market studies and exploratory R&D in
the hydrogen and fuel cell sector would provide critical assistance to Connecticut hydrogen
and fuel cell companies.
Workforce Development Plan for Connecticut
Workforce Development Framework and Priorities
Education and training of the workforce including technical workers and policy implementers
at all levels is one of the highest priorities for the sustainable energy economy.179 Future
workers will be needed at all levels to insure continuity in the operation and maintenance of
the hydrogen and alternative fuels infrastructure. Training programs are needed that
communicate an intimate understanding of regulations, codes, standards, skills, properties of
materials, and understanding of public policies, practices, and operating procedures.
Connecticut needs to implement additional educational programs in order to remain
competitive with other states.
179 International Energy Association Conference, Detroit, April 2007
The Connecticut Center for Advanced Technology, Inc. © 2008 146
Hydrogen and Fuel Cell Education in Connecticut
Connecticut currently has one major educational center for hydrogen and fuel cell research
and development. The Connecticut Global Fuel Center at the University of Connecticut is a
world class center that seeks to propel Connecticut into the forefront of renewable energy
innovation and commercialization. As part of the UCONN School of Engineering, the center
offers on-site facilities for fuel cell and stack performance testing and education aimed at
training tomorrow's energy leaders in diverse fuel cell and other sustainable energy
technologies.
The University of Hartford administers a Clean Energy Institute with focus on photovoltaics.
Eastern Connecticut State University (ECSU) has an Institute for Sustainable Energy, but
currently has no established hydrogen or fuel cell specific research or programs. UCONN
and ECSU however, have education programs that provide outreach to K-12 students,
sparking interest in renewable energy careers. Gateway Community College is moving
forward with a plan to develop and innovative Energy Services Technologies (within a Center
for a Sustainable Future) associate degree program, a process will require at least two years of
development. Training classes will ensure that an individual understands the energy and
mechanical systems surrounding the fuel cell, the basics of fuel cell and electrolyzer
technology, hydrogen safety training, and other related topics technician graduates could take
to the workplace. Asnuntuck Community College offers an employer sponsored technology
scholarship for high school and GED equivalent students in manufacturing technology. The
program features externships with sponsor companies and guaranteed hiring by that company
at the completion of the program. Other schools involved with related renewable energy
programs include Quinnipiac University, Naugatuck Valley Community College which
featured a Fuel Cell Certificate program in the spring of 2006, and Yale University which has
a Center for Green Chemistry and Engineering.
Connecticut has a strongly diversified portfolio of scientific research/engineering graduates to
support the hydrogen and fuel cell industry.
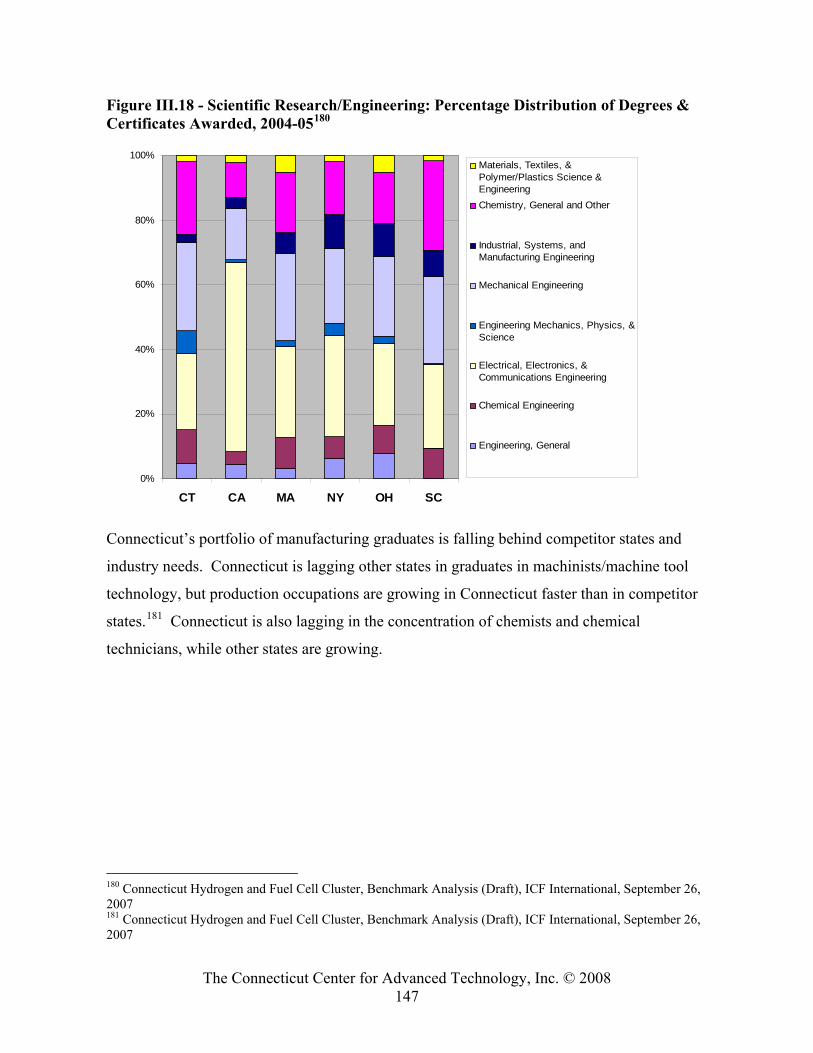
The Connecticut Center for Advanced Technology, Inc. © 2008 147
Figure III.18 - Scientific Research/Engineering: Percentage Distribution of Degrees & Certificates Awarded, 2004-05180
Connecticut’s portfolio of manufacturing graduates is falling behind competitor states and
industry needs. Connecticut is lagging other states in graduates in machinists/machine tool
technology, but production occupations are growing in Connecticut faster than in competitor
states.181 Connecticut is also lagging in the concentration of chemists and chemical
technicians, while other states are growing.
180 Connecticut Hydrogen and Fuel Cell Cluster, Benchmark Analysis (Draft), ICF International, September 26, 2007 181 Connecticut Hydrogen and Fuel Cell Cluster, Benchmark Analysis (Draft), ICF International, September 26, 2007
0%
20%
40%
60%
80%
100%
CT CA MA NY OH SC
Materials, Textiles, &Polymer/Plastics Science &EngineeringChemistry, General and Other
Industrial, Systems, andManufacturing Engineering
Mechanical Engineering
Engineering Mechanics, Physics, &Science
Electrical, Electronics, &Communications Engineering
Chemical Engineering
Engineering, General
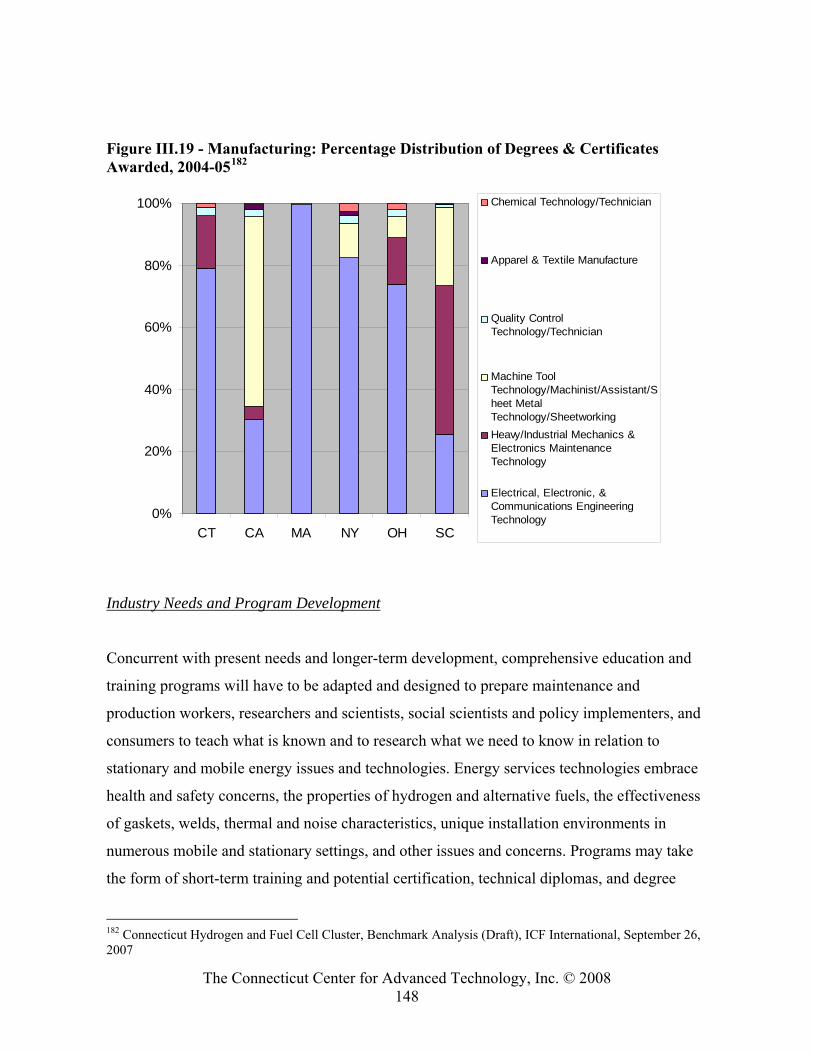
The Connecticut Center for Advanced Technology, Inc. © 2008 148
Figure III.19 - Manufacturing: Percentage Distribution of Degrees & Certificates Awarded, 2004-05182
Industry Needs and Program Development
Concurrent with present needs and longer-term development, comprehensive education and
training programs will have to be adapted and designed to prepare maintenance and
production workers, researchers and scientists, social scientists and policy implementers, and
consumers to teach what is known and to research what we need to know in relation to
stationary and mobile energy issues and technologies. Energy services technologies embrace
health and safety concerns, the properties of hydrogen and alternative fuels, the effectiveness
of gaskets, welds, thermal and noise characteristics, unique installation environments in
numerous mobile and stationary settings, and other issues and concerns. Programs may take
the form of short-term training and potential certification, technical diplomas, and degree
182 Connecticut Hydrogen and Fuel Cell Cluster, Benchmark Analysis (Draft), ICF International, September 26, 2007
0%
20%
40%
60%
80%
100%
CT CA MA NY OH SC
Chemical Technology/Technician
Apparel & Textile Manufacture
Quality ControlTechnology/Technician
Machine ToolTechnology/Machinist/Assistant/Sheet MetalTechnology/SheetworkingHeavy/Industrial Mechanics &Electronics MaintenanceTechnology
Electrical, Electronic, &Communications EngineeringTechnology
The Connecticut Center for Advanced Technology, Inc. © 2008 149
programs. Training of local maintenance personnel will also be needed to operate testing and
monitoring equipment. This equipment will be adapted to alternative fuels and embedded in
large-scale deployment of hydrogen and alternative fuels systems including leak detection
analyzers, system calibrators, and compressor maintenance.
Codes, standards and regulations related to liability and insurance policies in the emerging
hydrogen and alternative fuels infrastructure warrant accelerated research and development.
An important component of market acceptance and deployment of early technologies is the
development of programs to insure early adopters who, in addition to the insurance industry,
require the confidence to assume risk. The current lack of experience with hydrogen, fuel
cells, and alternative fuels makes it difficult to assess the full range of human, financial and
material risks associated with large-scale deployment. The further development of codes and
standards and regulatory environment is critical to this process and concomitant with the need
for short courses and training programs. Short-term non-credit programs can be developed to
address needs for numerous aspects of safety and workforce training to insure the long-term
viability of hydrogen in mobile and stationary applications. These areas include crisis
management, emergency response, safety protocols, pipeline and station up-keep, security,
and tube safety issues.
Educational Programs Related to the Hydrogen and Fuel Cell Industry
University of Connecticut • Directly Associated Undergraduate Majors
o Engineering and manufacturing degrees Special topics - fuel cell course
• Indirectly Related Undergraduate Majors o Chemistry o Mathematics o Physics
• Associated Research o Connecticut Global Fuel Cell Center (CGFCC)
>40 faculty researching fuel cells with CGFCC Faculty from all aforementioned related majors
o Student Research University allows both graduate and undergraduate research in
conjunction with CGFCC
The Connecticut Center for Advanced Technology, Inc. © 2008 150
High rate of student internships Yale University
• Directly Associated Undergraduate Majors o Engineering, Molecular Biophysics and Biochemistry Degrees
• Indirectly Related Undergraduate Majors o Mathematics o Physics o Chemistry
• Associated Research o Student research o Center for Green Chemistry and Engineering
Undergraduate and Graduate Research available o Faculty research
• Other o Campus has a 250-kW fuel cell power generator
Eastern Connecticut State University • Directly Associated Undergraduate Majors
o Environmental Earth Science Sustainable Energy Studies Interdisciplinary Minor
o Biochemistry Major Chemistry and Physics Minor
• Indirectly Related Undergraduate Majors o Mathematics
• Associated Research o Institute for Sustainable Energy
Serves as a resource for sustainable energy information Asnuntuck Community College
• Manufacturing Technology o Employer-sponsored Technology Scholarship Program
Gateway Community College • Directly Associated Degrees
o Engineering Technology Degrees o Connecticut College of Technology
• Indirectly Related Degrees o Natural Sciences and Mathematics (AS) o Electrical Engineering Technology (AS) o Natural Sciences and Mathematics (AS)
Naugatuck Valley Community College
• Directly Associated Degrees o Engineering Technology Degrees o Fuel Cell Technology Certificate Program

The Connecticut Center for Advanced Technology, Inc. © 2008 151
Only offered in spring 2006 University of Hartford
• Directly Associated Undergraduate Majors o Engineering degrees
• Indirectly Related Undergraduate Majors o Physics o Chemistry o Mathematics
• Associated Research o Clean Energy Institute (College of Engineering)
Renewable energy R&D projects o Student Research
Undergraduate and graduate research available Quinnipiac University
• Related Undergraduate Majors o Chemistry o Mathematics o Microbiology/Molecular Biology
The Connecticut Center for Advanced Technology, Inc. © 2008 152
PART IV Recommendations
The following recommendations are intended as a menu of options to consider in support of
the long-term continuous production and deployment of 40 MW stationary fuel cells, research
and development, industry support/coordination and bus/vehicle with refueling:
Facilitate the Commercialization of Hydrogen-Based Technologies and Fuel Cells (Public Act 06-187, Sec. 64, (1)) Recommendation: Provide long-term and predictable tax advantage incentives to reduce
early development production costs for local manufacturers of fuel cells, fuel cell
components, and hydrogen-generation, storage, and transportation at $32 million per year
for 10 years to earn a return on investment for state economic development of
approximately $73 million per year.
Objectives:
• Facilitate the commercialization of hydrogen-based technologies and fuel cells;
• Reduce early development production costs for local manufacturers of fuel cells, fuel
cell components, and hydrogen-generating, storage, and transportation equipment;
• Increase global market opportunities;
• Improve competition with conventional technologies; and
• Improve market penetration.
Implementation:
State investment of $32 million at a level of $800/kW for 40 MW should be implemented
annually to reduce early development production costs for local manufacturers of fuel cells,
fuel cell components, and hydrogen-generating, storage, and transportation.
The Connecticut Center for Advanced Technology, Inc. © 2008 153
Recommendation: Provide long-term and predictable grant and grant matching resources
to support research and development (R&D) efforts in Connecticut at $15 million per year
for ten years, to increase gain access to over $100 million in federal R&D funding.
Objectives: • Provide the tools needed to support product growth and reduce costs;
• Support research for new technologies;
• Support applied R&D through the commercialization phase;
• Create and support prototype development and demonstration program; and
• Leverage existing state and federal resources with cost sharing/cost match.
Implementation:
An investment of $15 million should be implemented annually to reinforce and expand
existing state efforts to properly harvest new ideas through the New Energy Technology
Program; accommodate the interests of small business through the creation of a sliding scale
for both cost share and technology ownership based on business size or company revenue;
reinstate and modify a program similar to the Yankee Ingenuity Program to better serve small
business; expand the Connecticut SBIR program at CCAT to accelerate the development
cycle and move new ideas through the R&D process; assist with cost share/cost match to
capture a larger share of competitive bids especially for small and developing companies; and
support the development and demonstration of high quality prototypes of new product
concepts.
Recommendation: Support of the Connecticut Hydrogen-Fuel Cell Cluster to assist
Connecticut’s hydrogen and fuel cell industry, facilitate the development of hydrogen and
fuel cell technology, disseminate information, facilitate industry, academic and government
interaction at $250,000 per year.
The Connecticut Center for Advanced Technology, Inc. © 2008 154
Objectives:
• Facilitate identification, communication, and management of key information among
users, manufacturers, infrastructure managers, and the supply chain entities associated
with fuel cell and hydrogen technology;
• Strengthen Connecticut’s fuel cell and hydrogen industry through industry, academic
and government involvement;
• Define and assist in the development of industry and government policy, standards,
and goals to advance and demonstrate fuel cell and hydrogen technologies;
• Facilitate workforce development efforts to support the hydrogen and fuel cell
industry; and
• Provide a forum for discussing common issues and for developing joint projects.
Implementation:
Maintain support for the Connecticut Hydrogen-Fuel Cell Coalition to implement and
coordinate strategies to retain and expand Connecticut’s Hydrogen and fuel cell industry,
including implementation of a Communications Plan; coordination of technical training to
address safety and applicable codes and standards; management of an Apprentice/Co-
op/Internship program; coordination of legal and financial assistance for business and
inventors to mitigate the high cost of patenting and protecting new inventions; and program
monitoring for return on investment, unit cost reduction, global market penetration increase,
state supply chain employment increase, grid stability, and energy costs.
Enhance Energy Reliability and Security (Public Act 06-187, Sec. 64, (2))
Recommendation: Leverage all existing and proposed funding and/or state purchase to
target the installation of 40 MW of fuel cells per year at identified sites that provide high
public benefit including but not limited to:
o State public buildings;
o Energy Improvement Districts;
The Connecticut Center for Advanced Technology, Inc. © 2008 155
o Priority sites including schools, hospitals, emergency shelters, etc.
Objectives:
• Enhance energy reliability and security;
• Reinforce the value of high efficiency applications at public sites in Connecticut;
• Increase grid reliability in parallel with customer-side distributed generation;
• Provide a long-term predictable policy for applications;
• Provide premium power with increased reliability to business and industry; and
• Improve efficiency and environmental profile at EIDs and microgrids.
This conceptual investment strategy and systematic geographic targeting, developed with
market modeling, could be replicated in other states, regions, municipalities, and utilities,
further expanding the global market for fuel cell applications and reinforcing the value of the
investment in Connecticut.
Implementation:
Establish statutory state purchase/mandates to install 40 MW per year of fuel cells at sites that
provide high public benefit. Provide funding and/or resources to DPW, DOT, and
municipalities through CCEF, DPUC, and OPM to support installation of hydrogen and fuel
cell technology at state public buildings, Energy Improvement Districts, and identified
priority sites consistent with the State Plan for Fuel Cell Economic Development.
Promote the Improved Efficiency and Environmental Performance of Transportation and Electric Generation With Reduced Emissions, Reduced Greenhouse Gases, More Efficient Use of Nonrenewable Fuels, and Increased Use of Renewable and Sustainable Fuels (Public Act 06-187, Sec. 64, (3))
Recommendation: Dedication of a portion of the Connecticut RPS to achieve market pull
for CHP fuel cell and other performance equivalent hydrogen fueled facilities and
hydrogen (equivalent) production for dedicated use with a fuel cell.
The Connecticut Center for Advanced Technology, Inc. © 2008 156
Objectives:
• Provide direction for achievement of economic, environmental, and energy reliability
goals;
• Promote the improved efficiency and environmental performance of electric
generation in the state;
• Increase the certainty of hydrogen and fuel cell applications;
• Ensure value with the production of jobs and economic development, as well as
renewable energy; and
• Promote the development of in-state renewable energy resources to meet RPS
requirements.
Implementation:
Establish a statutory change to clarify that a portion (based on a 100 percent capacity factor;
25, 50, and 75 percent equals approximately 14 MW, 27 MW, and 40 MW, respectively) of
the RPS requirements be dedicated to fuel cell and other performance equivalent hydrogen
fueled technologies.
Recommendation: Provision of electric utility customer choice on utility bills for selection
of hydrogen and fuel cell technology as a Class I Renewable Energy manufactured in
Connecticut.
Objectives:
• Promote industry growth through demand for energy generated by fuel cells;
• Enhance awareness of Connecticut’s role in hydrogen and fuel cell technology;
• Allow greater choice of renewable energy sources; and
• Promote the development of Class I renewable resources to meet the Renewable
Portfolio Standards.
The Connecticut Center for Advanced Technology, Inc. © 2008 157
Implementation:
Direct the DPUC to include energy generated by hydrogen and fuel cell technology as a
customer option in the CleanEnergyOptions program.
Facilitate the Installation of Infrastructure for Hydrogen Production, Storage, Transportation and Fueling Capability (Public Act 06-187, Sec. 64, (4))
Recommendation: Expand local property tax and state sales tax exemptions for hydrogen
and fuel cell technology manufactured or partially manufactured (with proportional
benefit) in Connecticut.
Objectives:
• Encourage purchase of in-state manufactured hydrogen and fuel cell technology;
• Demonstrate support at the local level for the development of renewable energy;
• Encourage the growth of a sustainable and profitable goods production industry
within the state; and
• Facilitate the installation of infrastructure for hydrogen production, storage,
transportation and fueling capability.
Implementation:
Establish a statutory change to expand existing local property tax exemptions and sales tax
exemptions for hydrogen and fuel cell technologies, for those which are principally
manufactured in the state.
Disseminate Information Regarding the Benefits of Hydrogen-Based Technologies and Fuel Cells (Public Act 06-187, Sec. 64, (5)) Recommendation: Implement a Communications Plan to increase awareness and the level
of knowledge amongst potential customers, stakeholders, and investors.183
183 Refer to Appendix J, Marketing Communications Plan
The Connecticut Center for Advanced Technology, Inc. © 2008 158
Objectives:
• Educate key target audiences about the basics of hydrogen fuel cell technology;
• Increase awareness about hydrogen fuel cell technology among target audiences;
• Promote the extensive capabilities of Connecticut’s hydrogen and fuel cell companies
and organizations; and
• Position Connecticut as a leader in the hydrogen and fuel cell industry.
Implementation:
Support the tactical implementation of a long-term communications effort to shift awareness
levels and perceptions regarding the benefits of hydrogen and fuel cell technology, and
Connecticut’s hydrogen and fuel cell industry.
Retain and Expand Hydrogen and Fuel Cell Industries in Connecticut (Public Act 06-187, Sec. 64, (6)) Recommendation: State assistance to support innovation, supply chain development, and
in-state lean manufacturing for all fuel cell and hydrogen fueled equipment and hydrogen
production manufacturing facilities.
Objectives:
• Improve the exchange of information among suppliers and facilitate strategic planning
activities;
• Identify how investment in key market segments of the fuel cell supply chain will
benefit the state with jobs and economic value;
• Bridge the gap between current and future state of Connecticut’s hydrogen and fuel
cell industry;
• Facilitate the commercialization of hydrogen and fuel cell technologies; and
• Enable fuel cells to be more competitive by improving manufacturing efficiency and
reducing production costs.
The Connecticut Center for Advanced Technology, Inc. © 2008 159
Implementation:
Provide funding for the Connecticut Center for Manufacturing Supply Chain Integration to
assist hydrogen and fuel cell companies with the implementation of design innovation
projects to find less costly materials, parts, and assemblies; provide instruction and
facilitation of OEM make/buy analysis; facilitate identification and development of local
supply chains; and tooling subsidies for sub-tier suppliers.
Identify Areas within the State Transportation System That Would Benefit From the Integration of Potential Mass Transit and Fleet Transit Locations with Hydrogen or Natural Gas and Hydrogen Mixture Refueling Stations (Public Act 06-187, Sec. 64, (7)) Recommendation: Provide long-term support for bus, automobile, auxiliary power,
service/off-road vehicle, fueling station and infrastructure development and
demonstration in Connecticut at approximately $2 million per year through 2015 to
achieve a return on investment for state economic development of approximately $38.6
million.
Objectives:
• Support development of transportation-related fuel cell technology in the State;
• Accelerate commercial readiness and commercial deployment of hydrogen-fueled
vehicles;
• Maximum capture of jobs associated with fuel cell powered vehicles;
• Capture federal and other grant funding opportunities for hydrogen infrastructure and
fuel cell vehicles;
• Attract auto and bus companies to demonstrate in CT through infrastructure, and
legislative support for commercial deployment; and
• Extend Connecticut capture of market for fuel cell vehicles and hydrogen
infrastructure.
The Connecticut Center for Advanced Technology, Inc. © 2008 160
Implementation:
State investment of $2 million per year should be implemented to support development of
transportation-related fuel cell technology and infrastructure in the state. Policy directives to
utilize existing CMAQ funds to be used to support infrastructure.
Identify Areas in the Electric and Natural Gas Distribution System of the State That Would Benefit From the Development of Distributed Generation Through Hydrogen Or Fuel Cell Technology as a Reliability Asset Necessary for Voltage Control, Grid Security, or System Reliability, or for the Provision of Required Uninterruptible Service at Customer Sites (Public Act 06-187, Sec. 64, (8)) Recommendation: Support utility ownership of any fuel cell and other performance
equivalent hydrogen fueled facilities, including hydrogen (equivalent) production for
dedicated use with a fuel cell, up to 5 MW at sites needed for voltage control, grid security,
and/or system reliability.
Objectives:
• Improve grid and system reliability;
• Control peak power requirements;
• Provide prudent return on authorized capital investment in utility fuel cell and
hydrogen technology;
• Maintain a level of control over grid-side distributed generation;
• Compensate overloaded substations and transmission facilities; and
• Promote the use of high efficiency CHP technology for reduced costs.
Implementation:
Statutory clarification that utility ownership of fuel cells, up to 5 MW per site, is applicable to
the rate base as a prudent expenditure, so long as the fuel cell deployment is consistent with
the State Plan for Fuel Cell Economic Development and operation of the electric grid.
Deployment can be established through utility and ISO planning with the installation of fuel

The Connecticut Center for Advanced Technology, Inc. © 2008 161
cells including hydrogen (equivalent) production for dedicated use with a fuel cell for grid
and voltage support at transmission and distribution substations, at customer sites and ends of
distribution feeders, and at generation sites for black start capability.
The Connecticut Center for Advanced Technology, Inc. © 2008 162
CONCLUSION
As a current world leader in the research, design, and manufacture of hydrogen and fuel cell
related technology, Connecticut is uniquely positioned to execute this sustainable energy
vision to enable a smooth transition from conventional hydrocarbon fuels using conventional
combustion technology to use of advanced high efficiency electrochemical fuel cell
technology and other efficient, clean, hydrogen technologies. Such transition will find
markets for energy management in industrial, commercial, institutional, and residential
sectors, and could help develop a core Connecticut technology strength for these major
emerging growth industries.
In terms of economic value, legislative decisions to support the hydrogen and fuel cell
industry are being carefully considered because economic development is being driven by
energy. Opportunities for local economic development and the creation of high-paying jobs
related to this industry will be substantial and well justified as part of a long-term strategy for
the state that also reinforces economic, environmental, and energy policy. Energy can be
derived by hydrogen and fuel cells, and the hydrogen and fuel cell industry is a key industry
that can drive economic development in Connecticut. Under existing trends, by the year
2010, Connecticut would be positioned to increase direct employment in the hydrogen and
fuel cell industry to over 1,635 jobs (a 12 percent annual, 708 job gain from 2005); sales
would be over $63 million (a 6.6 percent annual, $17 million gain from 2005); and
investment in R&D would be $174 million (an 11 percent annual, $71 million gain from
2005).
If fuel cells are deployed as distributed generation to help offset retirements of older fossil
fuel generation, and if Connecticut’s fuel cell and hydrogen industry captures a significant
share of the transportation market, revenues to Connecticut companies in a mature global
market could be between approximately $14 billion and $54 billion annually, which would
require an employment base of tens of thousands.
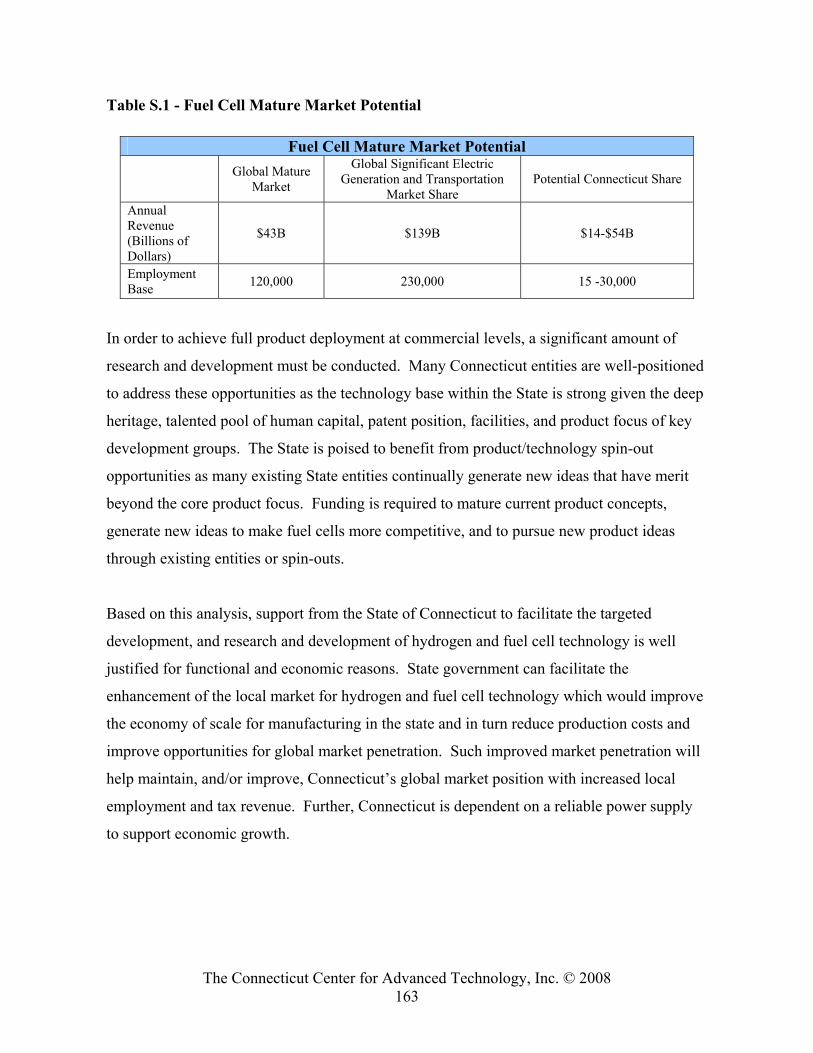
The Connecticut Center for Advanced Technology, Inc. © 2008 163
Table S.1 - Fuel Cell Mature Market Potential
Fuel Cell Mature Market Potential
Global Mature Market
Global Significant Electric Generation and Transportation
Market Share Potential Connecticut Share
Annual Revenue (Billions of Dollars)
$43B $139B $14-$54B
Employment Base 120,000 230,000 15 -30,000
In order to achieve full product deployment at commercial levels, a significant amount of
research and development must be conducted. Many Connecticut entities are well-positioned
to address these opportunities as the technology base within the State is strong given the deep
heritage, talented pool of human capital, patent position, facilities, and product focus of key
development groups. The State is poised to benefit from product/technology spin-out
opportunities as many existing State entities continually generate new ideas that have merit
beyond the core product focus. Funding is required to mature current product concepts,
generate new ideas to make fuel cells more competitive, and to pursue new product ideas
through existing entities or spin-outs.
Based on this analysis, support from the State of Connecticut to facilitate the targeted
development, and research and development of hydrogen and fuel cell technology is well
justified for functional and economic reasons. State government can facilitate the
enhancement of the local market for hydrogen and fuel cell technology which would improve
the economy of scale for manufacturing in the state and in turn reduce production costs and
improve opportunities for global market penetration. Such improved market penetration will
help maintain, and/or improve, Connecticut’s global market position with increased local
employment and tax revenue. Further, Connecticut is dependent on a reliable power supply
to support economic growth.
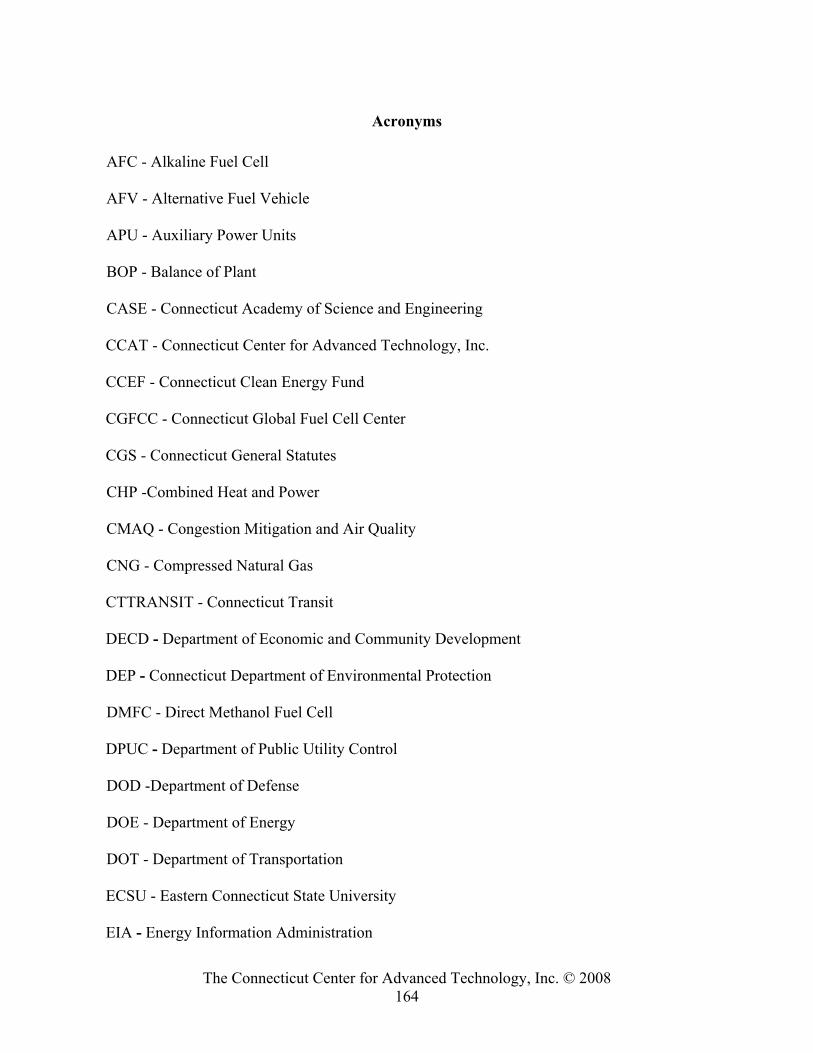
The Connecticut Center for Advanced Technology, Inc. © 2008 164
Acronyms AFC - Alkaline Fuel Cell AFV - Alternative Fuel Vehicle APU - Auxiliary Power Units BOP - Balance of Plant CASE - Connecticut Academy of Science and Engineering CCAT - Connecticut Center for Advanced Technology, Inc. CCEF - Connecticut Clean Energy Fund CGFCC - Connecticut Global Fuel Cell Center CGS - Connecticut General Statutes CHP -Combined Heat and Power CMAQ - Congestion Mitigation and Air Quality CNG - Compressed Natural Gas CTTRANSIT - Connecticut Transit DECD - Department of Economic and Community Development DEP - Connecticut Department of Environmental Protection DMFC - Direct Methanol Fuel Cell DPUC - Department of Public Utility Control DOD -Department of Defense DOE - Department of Energy DOT - Department of Transportation ECSU - Eastern Connecticut State University EIA - Energy Information Administration
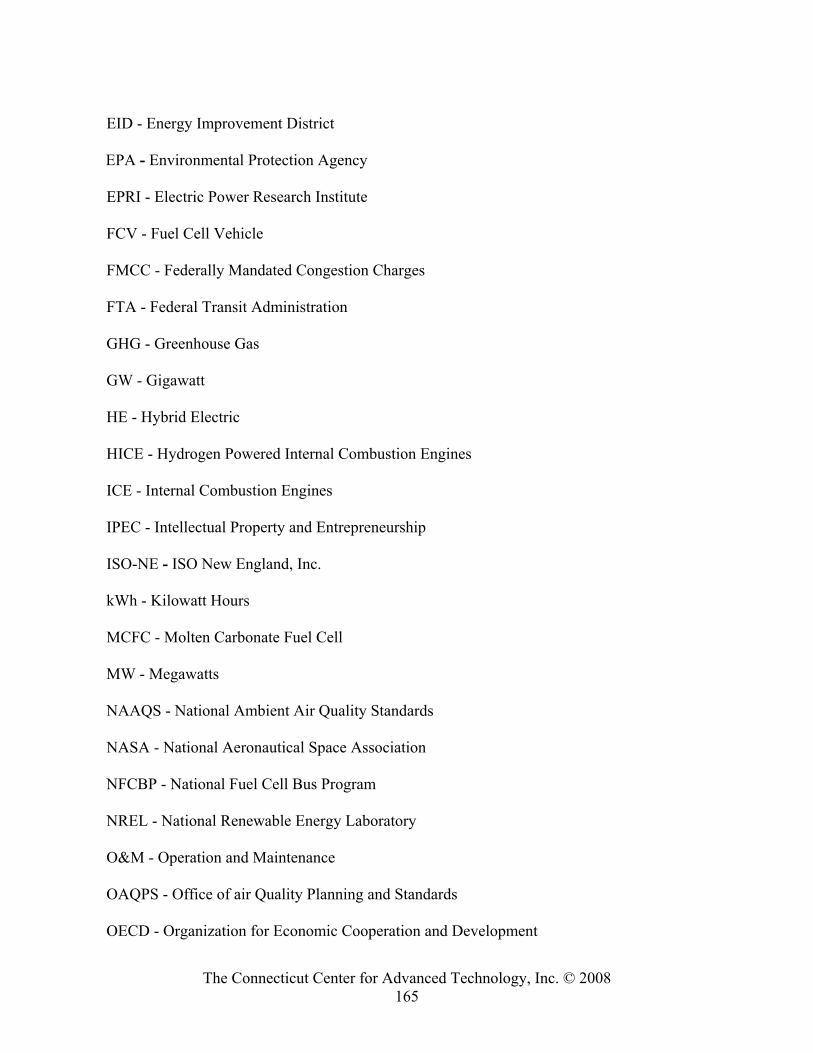
The Connecticut Center for Advanced Technology, Inc. © 2008 165
EID - Energy Improvement District EPA - Environmental Protection Agency EPRI - Electric Power Research Institute FCV - Fuel Cell Vehicle FMCC - Federally Mandated Congestion Charges FTA - Federal Transit Administration GHG - Greenhouse Gas GW - Gigawatt HE - Hybrid Electric HICE - Hydrogen Powered Internal Combustion Engines ICE - Internal Combustion Engines IPEC - Intellectual Property and Entrepreneurship ISO-NE - ISO New England, Inc. kWh - Kilowatt Hours MCFC - Molten Carbonate Fuel Cell MW - Megawatts NAAQS - National Ambient Air Quality Standards NASA - National Aeronautical Space Association NFCBP - National Fuel Cell Bus Program NREL - National Renewable Energy Laboratory O&M - Operation and Maintenance OAQPS - Office of air Quality Planning and Standards OECD - Organization for Economic Cooperation and Development
The Connecticut Center for Advanced Technology, Inc. © 2008 166
PAFC - Phosphoric Acid Fuel Cell PDA - Personal Digital Assistants PEM - Polymer Electrolyte Membrane / Proton Exchange Membrane PEMFC - Polymer Electrolyte Membrane Fuel Cell R&D - Research & Development REC - Renewable Energy Credits RGGI - Regional Greenhouse Gas Initiative RPS - Renewable Portfolio Standards SBIR - Small Business Innovation Research SEP - State Energy Project SOFC - Solid Oxide Fuel Cell T&D - Transmission and Distribution UCONN - University of Connecticut U.S. - United States UTC - United Technologies Corporation WADE - World Alliance for Decentralized Energy Wh - Watt-hours
The Connecticut Center for Advanced Technology, Inc. © 2008 167
Glossary184 A Alkaline Fuel Cell (AFC) A type of hydrogen/oxygen fuel cell in which the electrolyte is concentrated potassium hydroxide (KOH), and hydroxide ions (OH-) are transported from the cathode to the anode. Alternative Fuel An alternative to gasoline or diesel fuel that is not produced in a conventional way from crude oil, for example compressed natural gas (CNG), liquefied petroleum gas(LPG), liquefied natural gas (LNG), ethanol, methanol and hydrogen. B Bipolar Plates Conductive plate in a fuel cell stack that acts as an anode for one cell and a cathode for the adjacent cell. The plate may be made of metal or a conductive polymer (which may be a carbon-filled composite). The plate usually incorporates flow channels for the fluid feeds and may also contain conduits for heat transfer. British Thermal Unit (BTU) The mean British Thermal Unit is 1/180 of the heat required to raise the temperature of one pound (1lb) of water from 32°F to 212°F at a constant atmospheric pressure. It is about equal to the quantity of heat required to raise one pound (1 lb.) of water 1°F. C Carbon Dioxide (CO2) A colorless, odorless, noncombustible gas that is slightly more than 1.5 times as dense as air and becomes a solid (dry ice) below –78.5ºC. It is present in the atmosphere as a result of the decay of organic material and the respiration of living organisms. It is produced by the burning of wood, coal, coke, oil, natural gas, or other fuels containing carbon. Catalyst A chemical substance that increases the rate of a reaction without being consumed; after the reaction it can potentially be recovered from the reaction mixture chemically unchanged. The catalyst lowers the activation energy required, allowing the reaction to proceed more quickly or at a lower temperature. In a fuel cell, the catalyst facilitates the reaction of oxygen and hydrogen. It is usually made of platinum powder very thinly coated onto carbon paper or cloth. The catalyst is rough and porous so that the maximum surface area of the platinum can
184 U.S. Department of Energy; Hydrogen, Fuel Cells & Infrastructure Technologies Program:
http://www1.eere.energy.gov/hydrogenandfuelcells/glossary.html
The Connecticut Center for Advanced Technology, Inc. © 2008 168
be exposed to the hydrogen or oxygen. The platinum-coated side of the catalyst faces the membrane in the fuel cell. Compressed Hydrogen Gas (CHG) Compressed hydrogen gas is hydrogen compressed to a high-pressure and stored at ambient temperature. Compressed Natural Gas (CNG) Mixtures of hydrocarbon gases and vapors, consisting principally of methane in gaseous form that has been compressed. D Direct Methanol Fuel Cell (DMFC) A type of fuel cell in which the fuel is methanol (CH3OH), in gaseous or liquid form. The methanol is oxidized directly at the anode instead of first being reformed to produce hydrogen. The electrolyte is typically a PEM. E Electrode A conductor through which electrons enter or leave an electrolyte. Batteries and fuel cells have a negative electrode (the anode) and a positive electrode (the cathode). Electrolysis A process that uses electricity, passing through an electrolytic solution or other appropriate medium, to cause a reaction that breaks chemical bonds, e.g., electrolysis of water to produce hydrogen and oxygen. Electrolyte A substance that conducts charged ions from one electrode to the other in a fuel cell, battery, or electrolyzer. Energy The quantity of work a system or substance is capable of doing, usually measured in British thermal units (Btu) or Joules (J). F Fuel Cell A device that produces electricity through an electrochemical process, usually from hydrogen and oxygen. Fuel Cell Stack Individual fuel cells connected in series. Fuel cells are stacked to increase voltage. Fuel Processor Device used to generate hydrogen from fuels such as natural gas, propane, gasoline, methanol, and ethanol, for use in fuel cells.
The Connecticut Center for Advanced Technology, Inc. © 2008 169
G Gas Fuel gas, such as natural gas, undiluted liquefied petroleum gases (vapor phase only), liquefied petroleum gas-air mixtures, or mixtures of these gases. (Natural Gas - Mixtures of hydrocarbon gases and vapors consisting principally of methane (CH4) in gaseous form.) Greenhouse Effect Warming of the Earth's atmosphere due to gases in the atmosphere that allow solar radiation (visible, ultraviolet) to reach the Earth's atmosphere but do not allow the emitted infrared radiation to pass back out of the Earth's atmosphere. Greenhouse Gas (GHG) Gases in the Earth's atmosphere that contribute to the greenhouse effect. H Heat Exchanger Device (e.g., a radiator) that is designed to transfer heat from the hot coolant that flows through it to the air blown through it by the fan. Hydrogen (H2) Hydrogen (H) is the most abundant element in the universe but it is generally bonded to another element. Hydrogen gas (H2) is a diatomic gas composed of hydrogen atoms and is colorless and odorless. Hydrogen is flammable when mixed with oxygen over a wide range of concentrations. I Internal Combustion Engine (ICE) An engine that converts the energy contained in a fuel inside the engine into motion by combusting the fuel. Combustion engines use the pressure created by the expansion of combustion product gases to do mechanical work. K Kilowatt (kW) A unit of power equal to about 1.34 horsepower or 1,000 watts. L Liquefied Hydrogen (LH2) Hydrogen in liquid form. Hydrogen can exist in a liquid state, but only at extremely cold temperatures. Liquid hydrogen typically has to be stored at -253°C (-423°F). The temperature requirements for liquid hydrogen storage necessitate expending energy to compress and chill the hydrogen into its liquid state. Liquefied Natural Gas (LNG) Natural gas in liquid form. Natural gas is a liquid at -162°C (-259°F) at ambient pressure.
The Connecticut Center for Advanced Technology, Inc. © 2008 170
Liquefied Petroleum Gas (LPG) Any material that consists predominantly of any of the following hydrocarbons or mixtures of hydrocarbons: propane, propylene, normal butane, isobutylene, and butylenes. LPG is usually stored under pressure to maintain the mixture in the liquid state. M Megawatt (MW) A unit of power equal to one million watts or 1,000 kilowatts. Methane (CH4) See Natural Gas. Methanol (CH3OH) An alcohol containing one carbon atom. It has been used, together with some of the higher alcohols, as a high-octane gasoline component and is a useful automotive fuel in its own right. Miles Per Gallon Equivalent (MPGE) Energy content equivalent to that of a gallon of gasoline (114,32 Btu). Molten Carbonate Fuel Cell (MCFC) A type of fuel cell that contains a molten carbonate electrolyte. Carbonate ions (CO3
-2) are transported from the cathode to the anode. Operating temperatures are typically near 650°C. N Nitrogen Oxides (NOx) Any chemical compound of nitrogen and oxygen. Nitrogen oxides result from high temperature and pressure in the combustion chambers of automobile engines and other power plants during the combustion process. When combined with hydrocarbons in the presence of sunlight, nitrogen oxides form smog. A basic air pollutant; automotive exhaust emission levels of nitrogen oxides are regulated by law. O Oxidant A chemical, such as oxygen, that consumes electrons in an electrochemical reaction. Oxygen (O2) A diatomic colorless, tasteless, odorless, gas that makes up about 21percent of air. P Phosphoric Acid Fuel Cell (PAFC)
The Connecticut Center for Advanced Technology, Inc. © 2008 171
A type of fuel cell in which the electrolyte consists of concentrated phosphoric acid (H3PO4). Protons (H+) are transported from the anode to the cathode. The operating temperature range is generally 160-220°C. Polymer Electrolyte Membrane (PEM) A fuel cell incorporating a solid polymer membrane used as its electrolyte. Protons (H+) are transported from the anode to the cathode. The operating temperature range is generally 60-100°C. Polymer Electrolyte Membrane Fuel Cell (PEMFC or PEFC) A type of acid-based fuel cell in which the transport of protons (H+) from the anode to the cathode is through a solid, aqueous membrane impregnated with an appropriate acid. The electrolyte is a called a polymer electrolyte membrane (PEM). The fuel cells typically run at low temperatures (<100°C). Proton Exchange Membrane (PEM) See Polymer Electrolyte Membrane. R Reformer Device used to generate hydrogen from fuels such as natural gas, propane, gasoline, methanol, and ethanol for use in fuel cells. Reforming A chemical process in which hydrogen containing fuels react with steam, oxygen, or both to produce a hydrogen-rich gas stream. Regenerative Fuel Cell A fuel cell that produces electricity from hydrogen and oxygen and can use electricity from solar power or some other source to divide the excess water into oxygen and hydrogen fuel to be re-used by the fuel cell.
The Connecticut Center for Advanced Technology, Inc. © 2008 172
S Solid Oxide Fuel Cell (SOFC) A type of fuel cell in which the electrolyte is a solid, nonporous metal oxide, typically zirconium oxide (ZrO2) treated with Y2O3, and O-2 is transported from the cathode to the anode. Any CO in the reformate gas is oxidized to CO2 at the anode. Temperatures of operation are typically 800-1,000°C. Steam Reforming The process for reacting a hydrocarbon fuel, such as natural gas, with steam to produce hydrogen as a product. This is a common method for bulk hydrogen generation. T Turbine Machine for generating rotary mechanical power from the energy in a stream of fluid. The energy, originally in the form of head or pressure energy, is converted to velocity energy by passing through a system of stationary and moving blades in the turbine. W Watt (W) A unit of power equal to one joule of work performed per second; 746 watts are the equivalent of one horsepower. The watt is named for James Watt, Scottish engineer (1736-1819) and pioneer in steam engine design.