final report - icrc.act.gov.au · the cost of petrol. the figure shows that most of the petrol...
TRANSCRIPT

Final Report
Investigation into motor vehicle petrol prices in the ACT
Report 9 of 2019, June 2019

Final Report: Investigation into motor
vehicle petrol prices in the ACT
The Independent Competition and Regulatory Commission is a Territory Authority
established under the Independent Competition and Regulatory Commission Act 1997
(the ICRC Act). The Commission is constituted under the ICRC Act by one or more
standing commissioners and any associated commissioners appointed for particular
purposes. Commissioners are statutory appointments. Joe Dimasi is the current Senior
Commissioner who constitutes the Commission and takes direct responsibility for
delivery of the outcomes of the Commission.
We have responsibilities for a broad range of regulatory and utility administrative
matters. We have responsibility under the ICRC Act for regulating and advising
government about pricing and other matters for monopoly, near-monopoly and
ministerially declared regulated industries, and providing advice on competitive
neutrality complaints and government-regulated activities. We also have responsibility
for arbitrating infrastructure access disputes under the ICRC Act. In discharging our
objectives and functions, we provide independent robust analysis and advice.
Our objectives are set out in section 7 and 19L of the ICRC Act and section 3 of the
Utilities Act 2000.
Correspondence or other inquiries may be directed to the Commission at the following
address:
Independent Competition and Regulatory Commission
PO Box 161
Civic Square ACT 2608
The Commission may be contacted at the above address, by telephone on
(02) 6205 0799, or by fax on (02) 6207 5887. Our website is at www.icrc.act.gov.au
and our email address is [email protected].
Executive Summary
Final Report: Investigation into motor
vehicle petrol prices in the ACT i
Executive Summary
On 22 February 2019 the Commission received Terms of Reference from the ACT
Government to undertake a factual analysis of the petrol market in the ACT. The
Terms of Reference require the Commission to consider:
• comparisons of average petrol prices and costs faced by petrol suppliers with other
capital cities and regional towns in proximity to the ACT;
• how petrol prices are determined in the ACT;
• the nature of costs faced by ACT petrol suppliers in the Territory;
• the structure of the market, including any variation observed across different
locations within the ACT; and
• whether there is effective competition in the ACT market, including whether
barriers to entry exist and the level of information available to consumers.
This report sets out the findings of the investigation and describes the evidence and
information considered in reaching those findings. The Commission recognises the
assistance of petrol retailers in providing detailed information on their operating costs,
revenues and volumes sold for the investigation.
Overview of key findings
Petrol markets are dynamic. Prices are influenced by a range of factors, which can
differ between capital cities, between smaller and larger cities, between cities and
regional towns, and within cities. Daily prices are often characterised by volatility and
in some locations by price cycles, which may be short or long and regular or irregular.
As a result, comparing prices and price movements across locations is complex.
The Commission has analysed daily, monthly and annual prices to identify the drivers
of short-term price levels and the underlying drivers of longer-term price trends.
Petrol retailers have limited control over the retail price of petrol
Petrol retailers have limited control over the final retail price of petrol. Nationally, in
2018 around 90 per cent of the retail petrol price was wholesale costs (including excise
tax) and only around 10 per cent was retail costs and margins. In Canberra, retail costs
and margins accounted for around 14 per cent of the petrol price in 2018.
Retail prices generally follow the wholesale fuel price (based on the international
parity price represented by Singapore’s Mogas 95 price) with varying degrees of time
lag and price ‘stickiness’.
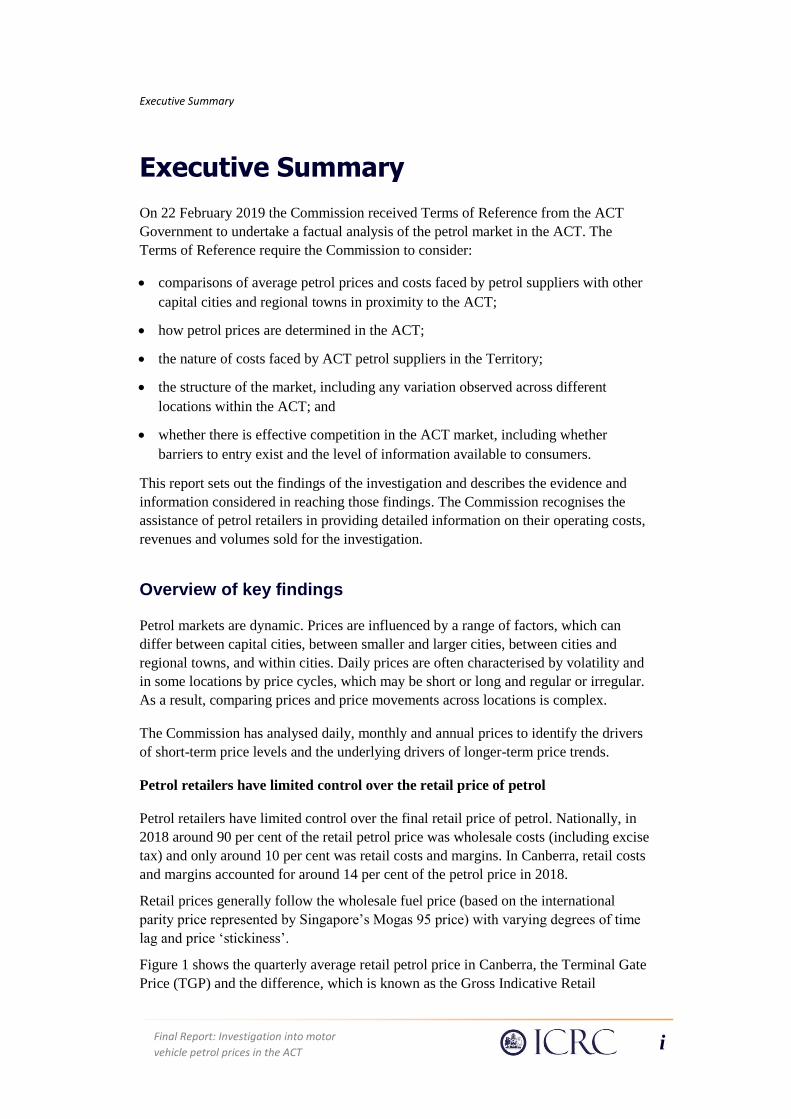
Figure 1 shows the quarterly average retail petrol price in Canberra, the Terminal Gate
Price (TGP) and the difference, which is known as the Gross Indicative Retail

Executive Summary
ii Final Report: Investigation into motor
vehicle petrol prices in the ACT
Difference (GIRD).1 The GIRD is an approximate measure of the retail component of
the cost of petrol. The figure shows that most of the petrol price is made up of the TGP,
which petrol retailers cannot control. The GIRD has fluctuated around 20 cents per litre
(cpl) between December 2014 and March 2019.
Figure 1 Long term variation in the ACT quarterly average petrol price, TGP and GIRD
Source: ACCC quarterly reports on the Australian petroleum market and Australian Institute of Petroleum Sydney TGP dataset.
Petrol prices in Canberra are generally higher than in Sydney and most other
capital cities
Retail petrol prices in Canberra can be higher or lower than those in Sydney and other
capital cities on any given day. Comparisons of petrol prices on any given day will be
influenced by the timing of petrol price cycles (when comparisons are being made
between Canberra and cities with a price cycle) and differences in how long changes in
wholesale prices take to flow through to retail prices. For example, petrol price
differences between Sydney and Canberra may appear to be larger when the Sydney
petrol market is at the bottom of its price cycle.2 Analysis of prices on a monthly and
annual average basis smooth out the daily fluctuations and allow us to see the
underlying medium and longer term trends.
Between 2012-13 and 2018-19, regular unleaded petrol (RULP) prices in the ACT,
measured as annual average prices, were consistently higher than in Sydney (based on
data to May 2019), averaging 8.4 cpl higher in the ACT over this period. The annual
price difference increased in each of the last three years to be 11.8 cpl higher in
1 The TGP is the petrol price paid by wholesalers.
2 Regular retail price cycles, characterised by rapid price hikes followed by long discounting phases, have
been a feature of petrol prices in Australia’s five largest cities (Sydney, Melbourne, Brisbane, Perth and
Adelaide) for decades.
020406080
100120140160180
Qu
arte
rly
Ave
rage
Pri
ce
(cp
l)
Retail price TGP GIRD

Executive Summary
Final Report: Investigation into motor
vehicle petrol prices in the ACT iii
2018-19. However, in May 2019, the monthly average petrol price in Canberra was
only 0.6 cpl higher than in Sydney.
Monthly average petrol prices in Canberra, Hobart and Darwin were consistently
higher than the five largest capital cities in 2018. Although sometimes higher,
Canberra’s monthly average prices were frequently lower than Hobart and Darwin
(Figure 2). The difference in monthly average petrol prices between the capital cities
has narrowed in the first three months of 2019.
Figure 2 Comparison of capitals monthly average RULP (cpl)
Source: ACCC (2019) Report on the Australian petroleum market—March 2019.
In 2014-15 (the latest year for which data is available for costs and margins on petrol
retailers in Sydney), the annual average retail petrol price in Canberra was around 7 cpl
higher than in Sydney. This was due to higher transport costs (around 1.3 cpl), higher
retail operating costs (4 cpl) and a higher net retail margin (1 cpl).
Some caution should be exercised when comparing petrol retail costs and margins
between the ACT and NSW. The markets are somewhat different in that RULP
accounts for a higher share of motor vehicle fuel in the ACT than in NSW, reflecting
the ethanol (E10) mandate in NSW. There is evidence to suggest that retail operating
costs in NSW have increased relative to those in the ACT since 2014-15, coinciding
with the introduction of the NSW ethanol mandate.
Petrol prices in Canberra averaged around 1.7 cpl higher than in surrounding
towns between 2012-13 and 2018-19, but there can be substantial variations in
price differences on any given day
The Commission examined retail petrol prices in 11 regional towns in proximity to
Canberra, including those on the South Coast (such as Batemans Bay and Nowra),
towns on the Hume Highway (such as Goulburn and Yass) and inland towns not on the
Hume Highway (such as Cooma and Wagga Wagga).

Executive Summary
iv Final Report: Investigation into motor
vehicle petrol prices in the ACT
Annual average petrol prices in Canberra were around 1.7 cpl higher than in
surrounding towns between 2012-13 and 2018-19. The average monthly price
difference between Canberra and surrounding towns widened in the last six months of
2018 but has narrowed over 2019 to be 0.4 cpl in May 2019. For some areas, such as
inland towns not on the Hume Highway, the average monthly petrol price in May was
higher than in Canberra (see Figure 3).
Figure 3 Monthly average petrol prices in the ACT and towns not on the Hume Highway, January 2013 to May 2019
Source: Based on retail price data from Informed Sources.
In recent years the higher annual average petrol price in Canberra than in the
regional comparison locations largely reflects a higher retail margin and to a
lesser degree higher wholesale petrol costs
The Commission gathered commercially confidential data on petrol retailer annual
costs and net margins3 from businesses operating in Canberra and nearby locations
under section 41 of the ICRC Act. This data set is not available from any other source
and provides a more comprehensive basis for analysis than is possible using publicly
available information.
In 2017-18, Canberra’s retail petrol price was, on average, 4.9 cpl higher than the
regional comparison locations (for the sample of petrol retailers examined).4 Around
two thirds of this difference was due to a higher average net retail margin in Canberra
with the rest largely due to higher wholesale petrol costs.
Canberra’s higher average net retail margin likely reflects weaker competition in
Canberra. This is due to Canberra having a more concentrated retail petrol market, with
3 The net retail margin is the profit margin of the retailer. It is different to the GIRD which includes both
retail operating costs and the net retail margin. The Commission requested net retail margins through its
section 41 data request to petrol companies.
4 Based on data from petrol companies for which 2017-18 is the latest complete financial year.
-10
-5
0
5
10
15
90
100
110
120
130
140
150
160
170
Jan-
2013
Apr
-201
3
Jul-2
013
Oct
-201
3
Jan-
2014
Apr
-201
4
Jul-2
014
Oct
-201
4
Jan-
2015
Apr
-201
5
Jul-2
015
Oct
-201
5
Jan-
2016
Apr
-201
6
Jul-2
016
Oct
-201
6
Jan-
2017
Apr
-201
7
Jul-2
017
Oct
-201
7
Jan-
2018
Apr
-201
8
Jul-2
018
Oct
-201
8
Jan-
2019
Apr
-201
9
cpl
cpl
Difference (RHS) Inland towns average RULP (LHS) ACT average RULP (LHS)

Executive Summary
Final Report: Investigation into motor
vehicle petrol prices in the ACT v
a higher proportion of retailers with business models of offering a premium product
and a lower number of independent retailers with a business strategy to aggressively
discount. It also likely reflects the relatively poor visibility of many petrol stations in
Canberra, which makes it difficult for consumers to compare competing retailers’
prices.
Canberra’s higher wholesale petrol costs likely reflect uncompetitive supply contracts
of petrol retailers in Canberra with a high market share, particularly the former
agreement between Coles Express and Viva Energy.
The volume of petrol sold at a particular site will affect its retail operating costs on a
cent per litre basis. Some retail business costs (such as rent and, to some degree,
wages) do not vary in proportion with the volume of fuel sold. This means that fuel
retailers with lower fuel volumes generally need to charge a higher per litre price for
fuel sold than prices charged by higher volume sites.
In 2017-18, retail operating costs (on a cent per litre basis) were lower in Canberra than
in the surrounding regions. This reflects higher fuel sales volumes per site in Canberra,
which reduces fixed operating costs (such as rent payments) on a cent per litre basis.
Recent changes to the structure of some petrol businesses (such as Coles Express and
Viva Energy, and Woolworths and Euro Garages) may lead to changes in wholesale
petrol costs and net retail margins in Canberra in the future.
Petrol retailers in Canberra are more profitable than those in surrounding
regions and in Sydney, in part because of their higher net retail margins, but
there is significant variation across retailers
Canberra service stations, on average, typically make larger profits than the average of
those in the regional comparison locations. This is due to a higher volume of fuel sold
in Canberra and, in recent years, an increase in the net retail margin. In 2017-18, the
average net profit per site was around $750,000 in Canberra compared to around
$380,000 in the regional comparison locations. However, there is significant variation
in profitability across retailers in Canberra, with some sites making profits below the
average for the regional comparison locations.
In Canberra, most petrol retailer profits are from fuel sales. In 2017-18 profit from fuel
sales accounted for just over 60 per cent of total profits. In contrast, most petrol retailer
profits in regional comparison locations was from non-fuel sales, with profit from fuel
sales accounting for around 30 per cent of total profits in 2017-18.
Further, petrol stations in Canberra are typically more profitable on average than those
in Sydney. In 2014-15 the average net profit per site was around $600,000 in Canberra
compared to a little below $500,000 in Sydney. The higher annual net profit per site in
Canberra compared to Sydney reflected a higher retail margin. This may reflect the
impact of investments by NSW petrol retailers in infrastructure required to meet the
E10 mandate, and other regulatory changes in NSW, which increased borrowing costs
and squeezed margins. It may also reflect differences in the type of fuel sold at petrol
stations and differences in profits from non-fuel products; however the Commission
does not have data to verify this.
Executive Summary
vi Final Report: Investigation into motor
vehicle petrol prices in the ACT
The relatively higher annual average net profit per site in Canberra may reflect a higher
return that would be required to justify setting up and investing in a petrol station in
Canberra. These costs can be substantial and are likely to vary to some degree by
location. For example, the Legislative Assembly Select Committee on fuel pricing
found that there is a higher cost of securing and operating service stations in Canberra
compared to Sydney and towns in regional NSW.5
There are substantial differences in petrol retailer prices, costs and net margins
within Canberra
There are substantial differences in petrol retailer prices, costs and net margins within
Canberra. These differences reflect differences in business models, the level of
competition in the local area, costs of operating in particular areas, and the prices
charged by the wholesale petrol suppliers supplying to particular sites or retailers.
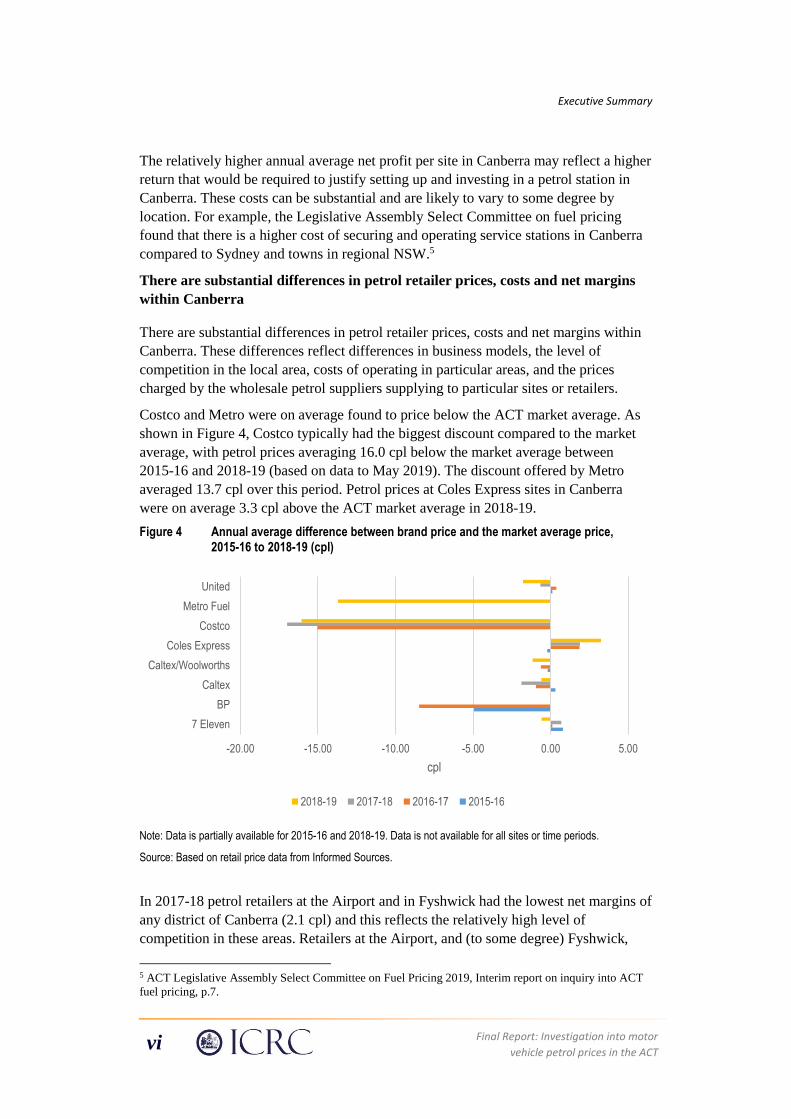
Costco and Metro were on average found to price below the ACT market average. As
shown in Figure 4, Costco typically had the biggest discount compared to the market
average, with petrol prices averaging 16.0 cpl below the market average between
2015-16 and 2018-19 (based on data to May 2019). The discount offered by Metro
averaged 13.7 cpl over this period. Petrol prices at Coles Express sites in Canberra
were on average 3.3 cpl above the ACT market average in 2018-19.
Figure 4 Annual average difference between brand price and the market average price, 2015-16 to 2018-19 (cpl)
Note: Data is partially available for 2015-16 and 2018-19. Data is not available for all sites or time periods.
Source: Based on retail price data from Informed Sources.
In 2017-18 petrol retailers at the Airport and in Fyshwick had the lowest net margins of
any district of Canberra (2.1 cpl) and this reflects the relatively high level of
competition in these areas. Retailers at the Airport, and (to some degree) Fyshwick,
5 ACT Legislative Assembly Select Committee on Fuel Pricing 2019, Interim report on inquiry into ACT
fuel pricing, p.7.
-20.00 -15.00 -10.00 -5.00 0.00 5.00
7 Eleven
BP
Caltex
Caltex/Woolworths
Coles Express
Costco
Metro Fuel
United
cpl
2018-19 2017-18 2016-17 2015-16

Executive Summary
Final Report: Investigation into motor
vehicle petrol prices in the ACT vii
tend to adopt a business model with a focus on competition and aggressive discounting.
The net retail margin was highest in Tuggeranong (7.2 cpl) followed by Gungahlin
(7.1 cpl).
North Canberra had the highest retail petrol prices of all districts in Canberra in
2017-18, reflecting the relatively high costs of operating in this area (such as high lease
payments). Petrol retailers near the Airport had the lowest retail operating cost in
2017-18 (on a cent per litre basis, compared to retailers in other Canberra districts),
reflecting the higher volume of fuel sold at these sites.
The Commission found that the most profitable retailers in Canberra (those with the
highest profits per site) did not always have the highest margins (the profit earned on
each litre of petrol sold). Retailers that adopted a business model centred around
competitive pricing (such as those near the Airport and in Fyshwick) had lower than
average net margins but often had higher than average profits per site because they sold
a large volume of petrol. However, this was not always the case—sometimes retailers
with lower than average margins had low profits per site because their volumes were
not high enough to offset the lower margin, for example because of strong competition
for volumes in the local area or a less favourable location. Similarly, retailers with
premium business models, such as Coles Express, generally had a higher than average
net margin and had high profits at sites with high fuel sales volumes and lower profits
at sites with lower sales volumes.
While there does not appear to be evidence of regular price cycles for Canberra as a
whole, the Commission has found that there may be irregular price cycles around the
Airport. Daily average petrol prices around the Airport change much more frequently
than prices in other regions. This may reflect the higher level of competition in this
area.
The mixture of ownership structures, brands and business models in a specific
geographic market influences the effectiveness of competition in that market
Fuel retailers operate under a variety of brands and business arrangements that result in
different degrees of local versus centralised control over business decisions including
pricing.
The ACT has a relatively high degree of retail market concentration (see Figure 5). In
2018-19, four major brands (Coles Express/Shell, Caltex, Caltex/Woolworths, and BP)
accounted for 44 of the 58 Canberra retail petrol sites (76 per cent), and these plus
7-Eleven accounted for over 90 per cent of the market.
The ACT has the smallest proportion of small independent or minor independent
branded retailers (United, Metro Fuel, Costco and Hall Village Motors in the ACT)
compared with other States and Territories.

Executive Summary
viii Final Report: Investigation into motor
vehicle petrol prices in the ACT
Figure 5 Proportion of retail sites in Canberra and Sydney by brand
Source: Informed Sources (2019), Submission to Select Committee on Fuel Pricing, Legislative Assembly for The Australian Capital Territory, Inquiry into the Select Committee on Fuel Pricing, submission no. 14, 25 February; ACCC (2018), Retail and wholesale petrol market shares in Australia, September.
Recent changes to the retail petrol market may change the average price of petrol in
Canberra relative to other areas in the future. As of March 2019, Viva Energy started to
set petrol prices at Coles Express sites. Viva Energy has indicated it will improve the
competitiveness of pricing at these sites to obtain growth in the volume of fuel sold. As
Canberra has a relatively large share of Coles Express petrol sites, this may be
important for the average petrol price in Canberra in the future. Woolworths sold its
retail petrol sites to Euro Garages in April 2019. Euro Garages started to set prices at
Woolworths sites as of April 2019. It is not yet clear what type of business model Euro
Garages will adopt and, hence, the potential implications for petrol prices.
The Commission’s process for this investigation
The Commission’s investigation has involved the collection of information, data
analysis and stakeholder consultation. Table 1 shows the key steps in the investigation.
Table 1 Timeline of the investigation
Task Date
Terms of reference received 22 February 2019
Draft report released 8 May 2019
Submissions on draft report closed 6 June 2019
Final report to Treasurer 28 June 2019

Executive Summary
Final Report: Investigation into motor
vehicle petrol prices in the ACT ix
During the investigation, the Commission has consulted with a range of stakeholders,
including petrol distributors, wholesalers, retailers, and other government agencies
such as the Australian Competition and Consumer Commission (ACCC).
The Commission gathered data on petrol retailer annual costs and margins from
businesses operating in Canberra and nearby locations under section 41 of the ICRC
Act. These data are not available publicly and is more comprehensive than that used by
market observers and commentators. This information includes petrol retailer operating
costs, the net retail margin and the volume of fuel sold. The Commission was not able
to gather data from all petrol retailers; however, the Commission was able to obtain
data for more than 90 per cent of petrol retailers in the ACT and surrounding regions.
The Commission engaged ACIL Allen to assist with analysing this data.
To inform the investigation the Commission also used publicly available data,
including information provided in submissions to the Legislative Assembly inquiry. It
also purchased data from the market intelligence company, Informed Sources.
The Commission released a draft report on 8 May 2019 as part of the consultation
process for this investigation. The Commission received no formal submissions on the
report. However, following the release of the draft report, the Commission undertook
targeted consultation with petrol retailers to better understand the issues raised in the
report and to seek feedback on its draft findings.

x Final Report: Investigation into motor
vehicle petrol prices in the ACT
Contents
Executive Summary i
Overview of key findings i
The Commission’s process for this investigation viii
1 What has the Commission been asked to do? 1
1.1 Background to this investigation 1
1.2 The Commission’s role and powers 1
1.3 Terms of Reference 2
1.4 Purpose of this report 2
1.5 The Commission’s investigation process 2
1.6 Structure of progress report 3
2 Overview of the Australian petrol market 5
2.1 Australian retail fuel markets 6
2.2 Cost composition of retail petrol prices 11
2.3 Many factors influence fuel retailer costs and margins 16
2.4 Why the retail price of petrol varies over time 20
2.5 Availability of price information and price monitoring 23
3 The retail petrol market in the ACT and surrounding regions 27
3.1 Key characteristics of ACT retail petrol market 27
3.2 Comparison with regions in proximity to the ACT 32
4 Petrol prices in the ACT 39
4.1 Data and method of analysis 40
4.2 Changes in daily average retail petrol prices in Canberra 41
4.3 Are petrol prices higher in the ACT? 45
4.4 Lag between retail price and terminal gate price across
selected locations 53
4.5 Price differentials within the ACT 54
4.6 Concluding remarks 59
5 Petrol retailer costs and margins 61
5.1 Data gathered by the Commission 62
5.2 Petrol retailer costs and net margins – Canberra compared to
Sydney and the national average 64
5.3 Petrol retailer costs and net margins – Canberra compared to
regional comparison locations 70
5.4 Petrol retailer costs and net margins by district of Canberra 81

Final Report: Investigation into motor
vehicle petrol prices in the ACT xi
5.5 Summary 82
Appendix 1 Terms of Reference 85
Appendix 2 Compliance with the Terms of Reference 87
Appendix 3 Compliance with the ICRC Act 89
Abbreviations and acronyms 91
References 93
xii Final Report: Investigation into motor
vehicle petrol prices in the ACT
List of tables
Table 1 Timeline of the investigation viii
Table 1.1 Timeline of the investigation 3
Table 2.1 Retailer brands by industry structure groupings 9
Table 2.2 Illustrative fuel retailer characteristics and costs (based
on data for Victoria) 19
Table 3.1 Ownership changes in Canberra petrol market 29
Table 3.2 Canberra key demographics 31
Table 3.3 Total kilometres travelled, by type of vehicle by
business and private use and by area of operation,
ACT, 2018 32
Table 3.4 Indicative demographics of comparison towns 34
Table 3.5 Comparison of annual average RULP over 3 years
(cpl) 35
Table 4.1 Annual mean, maximum and minimum retail petrol
prices in ACT, 2015-16 to 2018-19 (cpl) 55
Table 5.1 Petrol cost components in Canberra and Sydney in
2014-15 (cpl) 65
Table 5.2 Differences in the average retail petrol price and the
petrol cost components: Canberra compared to
regional comparison locations, 2012-13 to 2017-18
(cpl) 70
Table 5.3 Petrol cost component by region of Canberra in 2017-
18 (cpl) 82
List of figures
Figure 1 Long term variation in the ACT quarterly average
petrol price, TGP and GIRD ii
Figure 2 Comparison of capitals monthly average RULP (cpl) iii
Figure 3 Monthly average petrol prices in the ACT and towns
not on the Hume Highway, January 2013 to May 2019 iv
Final Report: Investigation into motor
vehicle petrol prices in the ACT xiii
Figure 4 Annual average difference between brand price and the
market average price, 2015-16 to 2018-19 (cpl) vi
Figure 5 Proportion of retail sites in Canberra and Sydney by
brand viii
Figure 2.1 Australia’s major import shipping routes: petroleum
products 7
Figure 2.2 The Australian fuel supply chain and retail market 8
Figure 2.3 Share of ACCC monitored retail petrol sales volumes
in Australia by retailer category, 2002-03 to 2016-17 11
Figure 2.4 Overall regular ULP retail price cost stack (based on
five largest cities), March quarter 2019 12
Figure 2.5 Average monthly Terminal Gate Prices, October 2014
to May 2019 14
Figure 2.6 Long term variation in the ACT quarterly average
petrol price, TGP and GIRD 15
Figure 2.7 Three dimensions of retail fuel business 17
Figure 2.8 Monthly average retail prices in aggregate and Mogas
95 prices (cpl) 21
Figure 2.9 Edgeworth cycles in Sydney and Perth in early 2019 22
Figure 3.1 ACT petrol stations by geography as at 19 June 2019 28
Figure 3.2 Proportion of retail sites in Canberra and Sydney by
brand 28
Figure 3.3 Proportion of Independent or minor branded petrol
retailers in each State or Territory 30
Figure 3.4 Method of travel to work, greater capital city 32
Figure 3.5 Comparison of capitals monthly average RULP (cpl) 35
Figure 3.6 Distribution of prices in ACT and the three
comparative regions, based on ACCC quarterly reports
of averaged prices for the last month in each quarter,
December quarter 2014 to March quarter 2019 36
Figure 3.7 Distribution of prices in ACT and the South Coast
comparative group, based on ACCC reports of

xiv Final Report: Investigation into motor
vehicle petrol prices in the ACT
quarterly averaged prices, December quarter 2014 to
March quarter 2019 37
Figure 3.8 Distribution of prices in ACT and the on Hume
Highway comparative group, based on ACCC reports
of quarterly averaged prices, December quarter 2014 to
March quarter 2019 37
Figure 3.9 Distribution of prices in ACT and the Off Hume
Highway comparative group, based on ACCC reports
of quarterly averaged prices, December quarter 2014 to
March quarter 2019 38
Figure 4.1 Daily average retail petrol prices in Canberra, 23 May
2016 to 31 May 2019 42
Figure 4.2 Daily average petrol prices in the ACT regions, 21
May 2016 to 31 May 2019 42
Figure 4.3 Daily average petrol prices in Canberra and selected
capital cities, 20 April to 19 June 2019 (cpl). 43
Figure 4.4 Daily average petrol prices in the Canberra Airport
region and Sydney TGP, 3 October to 30 December
2016 (cpl) 44
Figure 4.5 Daily average petrol prices in the Canberra Airport
region and Sydney TGP, 29 June 2018 to 14 May 19 45
Figure 4.6 Monthly average petrol prices in the ACT and Sydney,
January 2013 to May 2019 46
Figure 4.7 Annual average petrol prices in the ACT and Sydney,
2012-13 to 2018-19 47
Figure 4.8 Monthly average petrol prices in the ACT and South
Coast towns, January 2013 to May 2019 (cpl) 48
Figure 4.9 Annual average petrol prices in the ACT and South
Coast towns, 2012-13 to 2018-19 (cpl) 48
Figure 4.10 Monthly average petrol prices in the ACT and towns
on the Hume Highway, January 2013 to May 2019
(cpl) 49
Figure 4.11 Annual average petrol prices in the ACT and towns on
Hume Highway, 2012-13 to 2018-19 (cpl) 50

Final Report: Investigation into motor
vehicle petrol prices in the ACT xv
Figure 4.12 Monthly average petrol prices in the ACT and towns
not on the Hume Highway, January 2013 to May 2019 51
Figure 4.13 Annual average petrol prices in the ACT and inland
towns, 2012 13 to 2018 19 (cpl) 52
Figure 4.14 Difference between RULP and E10 monthly average
prices in Canberra and Sydney, January 2013 to March
2019 (cpl) 53
Figure 4.15 Daily average retail petrol prices in Canberra and daily
average Sydney TGP, 23 May 2016 to 31 May 2019
(cpl) 54
Figure 4.16 Annual average retail prices for RULP by brand in
Canberra, 2015-16 to 2018-19 (cpl) 55
Figure 4.17 Annual average difference between brand price and the
market average price, 2015-16 to 2018-2019 (cpl) 56
Figure 4.18 Monthly average prices for selected brands, January
2018 to May 2019 (cpl) 57
Figure 4.19 Annual average difference between prices in ACT
districts and the market average price, 2015-16 to
2018-19 (cpl) 58
Figure 4.20 Monthly average petrol prices in the ACT by region,
May 2016 to March 2019 (cpl) 59
Figure 5.1 Number of petrol stations in Canberra and the regional
comparison locations for which the Commission has
gathered data for this report 63
Figure 5.2 Ownership of retail petrol sites in 2017-18 for which
the Commission has gathered data for the report
(per cent) 64
Figure 5.3 Annual average net profit per site, 2012-13 to 2017-18
($‘000s) 69
Figure 5.4 Differences in the average retail petrol cost
components: Canberra compared to regional
comparison locations, 2012-13 to 2017-18 (cpl) 71
Figure 5.5 Average wholesale petrol cost (cpl) 72

xvi Final Report: Investigation into motor
vehicle petrol prices in the ACT
Figure 5.6 Average retail operating costs, 2012-13 to 2017-18
(cpl) 73
Figure 5.7 Average fuel sales per site, 2012-13 to 2017-18
(million litres) 74
Figure 5.8 Average net retail margin, 2012-13 to 2017-18 (cpl) 77
Figure 5.9 Annual average net profit per site, 2012-13 to 2017-18
($’000s) 78
Figure 5.10 Proportion of profit from fuel sales, 2012-13 to 2017-
18 (per cent) 79
Figure 5.11 Petrol retailer profit by fuel sales volume in Canberra,
2017-18 80
Figure 5.12 Petrol retailer profit by fuel sales volume in regional
comparison locations, 2017-18 81

Final Report: Investigation into motor
vehicle petrol prices in the ACT xvii
List of boxes
Box 1 Summary of the Australian petrol market 5
Box 2 Characteristics of retail petrol price cycles 22
Box 3 Western Australia - FuelWatch 24
Box 4 Summary of the petrol market in the ACT and surrounding
regions 27
Box 5 Summary of findings on petrol prices in the ACT 39
Box 6 Summary of findings on petrol retailer costs and net margins 61
Box 7 Impact of commercial rates on petrol retailer costs and
margins 75

1 - What has the Commission been asked to do?
Final Report: Investigation into motor
vehicle petrol prices in the ACT 1
1 What has the Commission been asked to do?
On 22 February 2019 the Commission received a reference from the ACT Government
to undertake a factual analysis of the petrol market in the ACT.
1.1 Background to this investigation
There has been community concern in the ACT that motor vehicle petrol prices are
higher in Canberra compared to other capital cities and neighbouring regional
locations. These concerns increased following the summer of 2018-19, when
Canberrans reported fuel prices to be less expensive in nearby regions.6
The ACT Government issued the Commission with an industry reference to undertake
a factual analysis of the ACT petrol market. The Terms of Reference were given to the
Commission on 22 February 2019 and are summarised below and provided at
Appendix 1.
The ACT Government established a Legislative Assembly Select Committee on Fuel
Pricing on 14 February 2019.7 In addition to considering a range of pricing issues and
characteristics of the ACT fuel market, the Committee has been asked to report on
‘regulatory and legislative solutions and barriers, particularly around competition and
retail margin’. The Committee is required to report to the Assembly by
17 September 2019.
1.2 The Commission’s role and powers
The Commission is an independent commission within the ACT Government. The
Commission’s purpose is to regulate pricing, access and other matters for relevant
industries. The Commission is governed by the Independent Competition and
Regulatory Commission Act 1997 (ICRC Act). The Commission also provides advice
to the ACT Government on matters related to an industry or to industries in general
under terms of reference provided to the Commission.
The Terms of Reference for this investigation were issued under section 15 of the
ICRC Act. The Commission has undertaken an investigation in accordance with
section 17 of the ICRC Act, and issued a draft report and requested submissions from
the public or specified persons under section 18 of the Act.
6 For example, see www.canberratimes.com.au/story/5995214/petrol-prices-driving-motorists-up-the-wall.
7 Details of the Legislative Assembly Select Committee are available at www.parliament.act.gov.au/in-
committees/select_committees/fuel-prices/inquiry-into-fuel-pricing.

1 - What has the Commission been asked to do?
2 Final Report: Investigation into motor
vehicle petrol prices in the ACT
Section 41 of the ICRC Act provides for the Commission to require by written notice
persons to submit information or documents that may assist it in exercising its
functions. For this investigation, the Commission has issued information requests to
petrol retailers, wholesalers and distributors operating in the ACT under section 41 of
the Act.
1.3 Terms of Reference
The Terms of Reference require the Commission to undertake a factual analysis of
petrol prices and competition in the ACT market. This includes consideration of the
following matters:
• comparisons of average petrol prices and costs faced by petrol suppliers with other
capital cities and regional towns in proximity to the ACT;
• how petrol prices are determined in the ACT;
• the nature of costs faced by ACT petrol suppliers in the Territory;
• the structure of the market, including any variation observed across different
locations within the ACT; and
• whether there is effective competition in the ACT market, including whether
barriers to entry exist and the level of information available to consumers.
1.4 Purpose of this report
The final report is required by the Terms of Reference. The Commission will provide
the final report, as set out in section 21 of the ICRC Act, to the Treasurer by 28 June
2019.
1.5 The Commission’s investigation process
The timing and nature of the Commission’s investigation process are guided by the
Terms of Reference and the ICRC Act. The Terms of Reference set out the reporting
requirements. The ICRC Act sets out the investigation process and legislative
requirements.
In accordance with section 18(1)(b) of the ICRC Act, the Commission sought
submissions from interested parties on the draft report which was publicly released on
8 May 2019. The draft report satisfied the draft report requirements under Section 18
of the ICRC Act.
The final report is the last milestone in the Commission’s investigation. Table 1.1
shows the Commission’s investigation timeline.

1 - What has the Commission been asked to do?
Final Report: Investigation into motor
vehicle petrol prices in the ACT 3
Table 1.1 Timeline of the investigation
Task Date
Terms of reference received 22 February 2019
Draft report released 8 May 2019
Submissions on draft report closed 6 June 2019
Final report to Treasurer 28 June 2019
Since commencing the investigation, the Commission has consulted with a range of
stakeholders, including petrol distributors, wholesalers, retailers, and other government
agencies such as the Australian Competition and Consumer Commission (ACCC).
To inform the investigation the Commission also used publicly available data,
including information provided in submissions to the Legislative Assembly inquiry,
and purchased data from the market intelligence company, Informed Sources.
The Commission released a draft report on 8 May 2019 as part of the consultation
process for this investigation. The Commission received no formal submissions on the
report. However, following the release of the draft report the Commission undertook
targeted consultation with petrol retailers to better understand the issues raised in the
report and seek feedback on its draft findings.
1.6 Structure of progress report
The rest of this report provides further information on this investigation, the
Commission’s approach, and the main findings:
• Chapter 2 provides a broad overview of petrol markets in Australia and describes
the main cost components and market factors that determine retail petrol prices.
• Chapter 3 describes the key features of the ACT petrol market and petrol markets in
three groups of regional towns in proximity to the ACT.
• Chapter 4 compares average petrol prices in Canberra with other capital cities and
regional towns in proximity to the ACT.
• Chapter 5 provides information on the nature and relative magnitude of costs faced
by ACT petrol suppliers, including the retail operating costs and net retail margins
of petrol retailers, both with those of retailers in regional towns in proximity to the
ACT and variations observed across different locations within the ACT. It also
considers market structure and other factors affecting costs and margins and
presents findings on the effectiveness of competition in the ACT market.


2 - Overview of the Australian petrol market
Final Report: Investigation into motor
vehicle petrol prices in the ACT 5
2 Overview of the Australian petrol market
Box 1 Summary of the Australian petrol market
• The Australian retail automotive fuel industry includes major refiner-wholesaler
companies, the major supermarkets, independent chain retailers, and small independent
operators.
• Fuel retailers have limited control over the final retail price of petrol. Nationally, around
90 per cent of the retail petrol price was wholesale costs and only around 10 per cent was
retail costs and margins in 2018. In Canberra, retail costs and margins accounted for
around 14 per cent of the petrol price in 2018.
• Retail prices generally follow the wholesale fuel price (based on the international parity
price represented by Singapore’s Mogas 95 price) with varying degrees of time lag and
price ‘stickiness’.
• Fuel retailers operate under a variety of business arrangements resulting in different
degrees of local versus centralised control over business decisions including pricing.
• The mixture of ownership structures, brands and business models in a specific geographic
market influences the effectiveness of competition in that market.
• Regular retail price cycles, characterised by rapid price hikes followed by long
discounting phases, have been a feature of petrol prices in Australia’s five largest cities
(Sydney, Melbourne, Brisbane, Perth and Adelaide) for decades. Markets with smaller
sales volumes, including regional markets with smaller populations, are less likely to have
similar price cycles, although some do.
• There are many price comparison tools available, both private and public, around
Australia. While none of these are perfect, they provide consumers with information on
the options available to them when purchasing fuel.
This chapter provides a broad overview of petrol markets in Australia. It describes:
• the main features and structure of the market for supplying automotive fuels to
Australian retail consumers, including how decisions are made about setting retail
prices (section 2.1);
• the main cost components that make up the retail price (section 2.2);
• the market factors influencing retailer operating costs and retail margins
(section 2.3);
• why the retail price of petrol varies over time (section 2.4); and
2 - Overview of the Australian petrol market
6 Final Report: Investigation into motor
vehicle petrol prices in the ACT
• the level of information available to consumers in different parts of Australia
(section 2.5).
In this report, the retail price of petrol is the average headline price paid by motorists at
the bowser. It does not account for any discounts from that price, such as shopper
docket discounts.
2.1 Australian retail fuel markets
Australian consumers purchased 18.3 billion litres of petrol in 2017-18, sold by around
7,300 retail fuel sites across Australia.8 This section provides an overview of where
this fuel comes from and the structure of the industry.
Where our fuel comes from
Australia is a net importer of liquid fuels, which includes automotive, aviation and
marine fuels. In 2017-18, about 87 per cent of automotive petrol was imported either as
refinery feedstock9 (59 per cent) or refined products (41 per cent).10
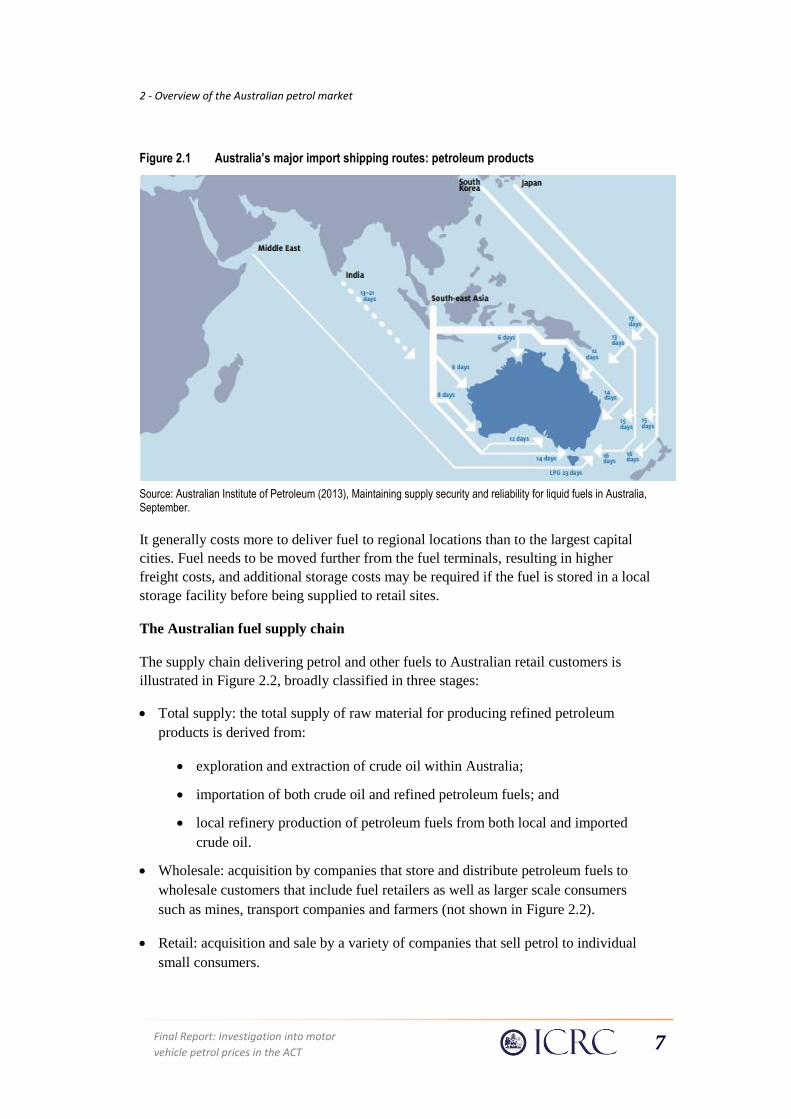
The major shipping routes for petroleum products coming to Australia are shown in
Figure 2.1. Crude oil and refinery feedstocks are imported to four Australian refineries:
two near Melbourne, one near Brisbane and one near Perth. Refined fuels are imported
to storage terminals in other capital cities.
The largest proportion of petrol, diesel and crude oil and refinery feedstock coming to
Australia originates in South East Asia (Singapore, Malaysia, Brunei, Vietnam, and
Indonesia). Other supplies come from Middle East states, South Korea and Japan, as
well as from China and Taiwan, India and Pakistan, and New Zealand.
8 Department of the Environment and Energy (2019), Australian Petroleum Statistics, Canberra,
15 February, Table 3A; ACCC (2018), Petrol prices are not the same: report on petrol prices by major
retailer in 2017, May.
9 A refinery feedstock is a product or a combination of products derived from crude oil and destined for
further processing into one or more components and/or finished products.
10 Department of the Environment and Energy (2019), Australian Petroleum Statistics, Canberra,
15 February, p. 22.
2 - Overview of the Australian petrol market
Final Report: Investigation into motor
vehicle petrol prices in the ACT 7
Figure 2.1 Australia’s major import shipping routes: petroleum products
Source: Australian Institute of Petroleum (2013), Maintaining supply security and reliability for liquid fuels in Australia, September.
It generally costs more to deliver fuel to regional locations than to the largest capital
cities. Fuel needs to be moved further from the fuel terminals, resulting in higher
freight costs, and additional storage costs may be required if the fuel is stored in a local
storage facility before being supplied to retail sites.
The Australian fuel supply chain
The supply chain delivering petrol and other fuels to Australian retail customers is
illustrated in Figure 2.2, broadly classified in three stages:
• Total supply: the total supply of raw material for producing refined petroleum
products is derived from:
• exploration and extraction of crude oil within Australia;
• importation of both crude oil and refined petroleum fuels; and
• local refinery production of petroleum fuels from both local and imported
crude oil.
• Wholesale: acquisition by companies that store and distribute petroleum fuels to
wholesale customers that include fuel retailers as well as larger scale consumers
such as mines, transport companies and farmers (not shown in Figure 2.2).
• Retail: acquisition and sale by a variety of companies that sell petrol to individual
small consumers.

2 - Overview of the Australian petrol market
8 Final Report: Investigation into motor
vehicle petrol prices in the ACT
Figure 2.2 The Australian fuel supply chain and retail market
Source: Adapted from Australian Institute of Petroleum 2013, Maintaining supply security and reliability for liquid fuels in Australia.
Australian national industry structure
The liquid fuel industry includes major refiner-wholesaler companies, Australia’s
major supermarkets, independent chain retailers and small independent operators.11
Table 2.1 gives examples of Australian petrol retailer brands in these four categories.
11 ACCC (2018), Retail and wholesale petrol market shares in Australia, September.

2 - Overview of the Australian petrol market
Final Report: Investigation into motor
vehicle petrol prices in the ACT 9
Table 2.1 Retailer brands by industry structure groupings
Group Retail brands
Refiner/wholesalers Mobil Viva Energy – a licensee of the Shell brand Caltex BP
Supermarkets Coles Express Woolworths
Independent chains 7-Eleven United (eastern states) Puma Energy (national) On The Run (South Australia, owned by Peregrine) Metro Petroleum Liberty Oil Freedom Fuels APCO
Small independents These include sole proprietors
Historically the four major refiner/wholesalers were vertically integrated companies
operating across the whole chain of supply including exploration and extraction,
refining, wholesaling and retailing. However, there have been changes to the industry
structure over the past decade:
• Shell sold its Australian refinery and petrol stations to Viva Energy/Vitol in
August 2014.12
• Viva Energy started setting petrol prices at Coles Express sites in March 2019.13
• Woolworths sold its retail petrol sites to Euro Garages in April 2019. Euro Garages
started setting petrol prices at Woolworths sites as of April 2019.14
• Mobil exited retailing in 2010-11 by selling retail sites to 7-Eleven, which on-sold
the South Australian sites to Peregrine, which operates On The Run.15
12 See https://www.reuters.com/article/us-australia-companies-shell/vitol-pays-2-6-billion-for-shells-
australian-refinery-petrol-stations-idUSBREA1K02820140221.
13 See https://www.afr.com/business/retail/coles-signs-new-fuel-deal-with-viva-says-convenience-
earnings-will-fall-62pc-20190206-h1awom.
14 See https://www.woolworthsgroup.com.au/page/media/Latest_News/woolworths-group-to-sell-petrol-
business-and-enter-into-commercial-alliance-with-eg-group.
15 ACCC (2018), Retail and wholesale petrol market shares in Australia, September.

2 - Overview of the Australian petrol market
10 Final Report: Investigation into motor
vehicle petrol prices in the ACT
Different business models influence decisions on retail prices
There are a variety of commercial arrangements or business models for individual sites
within each retailer category. The industry classifies Australian retail fuel businesses
into five broad groups by business model:16
• Company owned and company operated (COCOs) – businesses that are wholly
owned and operated by a large refiner/wholesaler company that sets the retail price.
• Commission agents (CAs) – businesses operating under a modified franchise
arrangement where the franchisee is not required to purchase the petrol but rather is
paid a fixed commission per litre of fuel sold. The fuel supplier sets the retail price.
• Franchisees – these businesses operate under a pure franchise arrangement with a
fuel wholesaler where the wholesaler is involved in setting the retail price in
conjunction with the franchisee.
• Dealer owned and dealer operated (DODOs) – businesses that are independently
owned but operate under a brand agreement with a major refiner/wholesaler. The
business purchases its own fuel stock and sets its own retail fuel price according to
local market conditions.
• Independent fuel retailers – businesses that are independently owned and operate
under a brand other than a refiner/wholesaler brand or supermarket brand. These
businesses purchase fuel from their supplier and set their own retail prices
according to local market conditions.
These business models vary in their degree of local versus centralised control over
business decisions, including setting retail prices. It is important to note that the retail
brand does not necessarily indicate the ownership of the petrol station, or who makes
the petrol pricing decisions at that site.
Retail market shares have changed over time
At the retail level, there have been significant changes in market shares over the past
fifteen to twenty years. Using ACCC monitoring data, Figure 2.3 shows national retail
market shares between 2002-03 and 2016-17.17 In 2002-03 the major
refiner/wholesalers accounted for 83 per cent of retail market share. The dominance of
refiner/wholesalers has diminished significantly since 2002-03, with a major
supermarket expansion into fuel retailing, although the retail petrol market share of the
16 See for example, Australasian Convenience and Petroleum Marketers Association (2016), An overview
of the Australian retail fuels market, and ACCC (2018), Petrol prices are not the same: report on petrol
prices by major retailer in 2017, May.
17 For this figure, the ACCC does not include data from small independent petrol retailers operating on one
or a small number of sites, and it also omits some medium sized retailers such as Speedway, Metro
Petroleum, Freedom Fuels and APCO.

2 - Overview of the Australian petrol market
Final Report: Investigation into motor
vehicle petrol prices in the ACT 11
supermarket chains has declined substantially since 2012. Over the same period the
independent chain sector has expanded.
Figure 2.3 Share of ACCC monitored retail petrol sales volumes in Australia by retailer category, 2002-03 to 2016-17
Source: ACCC (2018), Retail and wholesale petrol market shares in Australia, September.
The physical infrastructure required to supply petrol at the retail level (such as
underground tanks, forecourts, and bowsers) is expensive to install and hydrocarbon
pollution of former sites is expensive to decontaminate. As such, there are high barriers
to both market entry and exit. As a result, many of these market share changes were the
result of transactions between companies (for example, those described above) rather
than expansion of the number of retail sites.
On average across Australia, consumers now have a wider range of retailers to choose
from than in the past. However, retail petrol market shares in some locations can vary
markedly from these national market shares.
2.2 Cost composition of retail petrol prices
As shown in Figure 2.1 and Figure 2.2, significant exploration, refining and
transportation activities are needed to deliver petrol to a retailer for sale to consumers.
Consequently, the retailer has limited control over much of the final retail price. This
section examines the cost composition of the retail price to identify those components a
retailer can control and the factors a retailer takes into consideration when setting the
retail price.

2 - Overview of the Australian petrol market
12 Final Report: Investigation into motor
vehicle petrol prices in the ACT
The retail petrol price is made up of the Terminal Gate Price plus the Gross
Indicative Retail Difference
There are two principal components to the retail petrol price. The first is the wholesale
component known as the Terminal Gate Price (TGP), the price of bulk fuels purchased
from terminals located near the capital cities (see Figure 2.1). The TGP reflects the
wholesale price of petrol only and exclude other retail costs (such as freight, branding,
rent, labour and utility costs). The second is the retail component, referred to by the
ACCC as the Gross Indicative Retail Difference (GIRD), comprising retail operating
costs and margins.18
The components of the retail price are shown in Figure 2.4 based on the five largest
cities, indicating that approximately 93 per cent of the retail price was comprised of the
wholesale component and only around 7 per cent was retail costs and margins in the
March quarter 2019. In regional locations, GIRD is likely to comprise a larger
proportion of the retail price as retailers incur higher costs (such as the cost of freight
from wholesale terminals). In Canberra, retail costs and margins accounted for around
12 per cent of the petrol price in 2017-18.
Figure 2.4 Overall regular ULP retail price cost stack (based on five largest cities), March quarter 2019
Source: ACCC, Report on the Australian petroleum market—March 2019
18 Market analyses focus on these two components in part because retail prices and the terminal gate prices
are published, and hence GIRD may be calculated. See the ACCC fuel reports available at
https://www.accc.gov.au/regulated-infrastructure/fuel/acccs-fuel-monitoring-role.
Mogas95, 59
Taxes, 52.4
Wholesale, 9.4
GIRD, 9.5
Mogas95, 45%
Taxes, 40%
Wholesale, 7%
GIRD, 7%
0%
10%
20%
30%
40%
50%
60%
70%
80%
90%
100%
0
10
20
30
40
50
60
70
80
90
100
110
120
130
RU
LP P
rice
(p
erc
en
t o
f to
tal)
RU
LP P
rice
(ce
nts
pe
r lit
re)
TGP
TGP
2 - Overview of the Australian petrol market
Final Report: Investigation into motor
vehicle petrol prices in the ACT 13
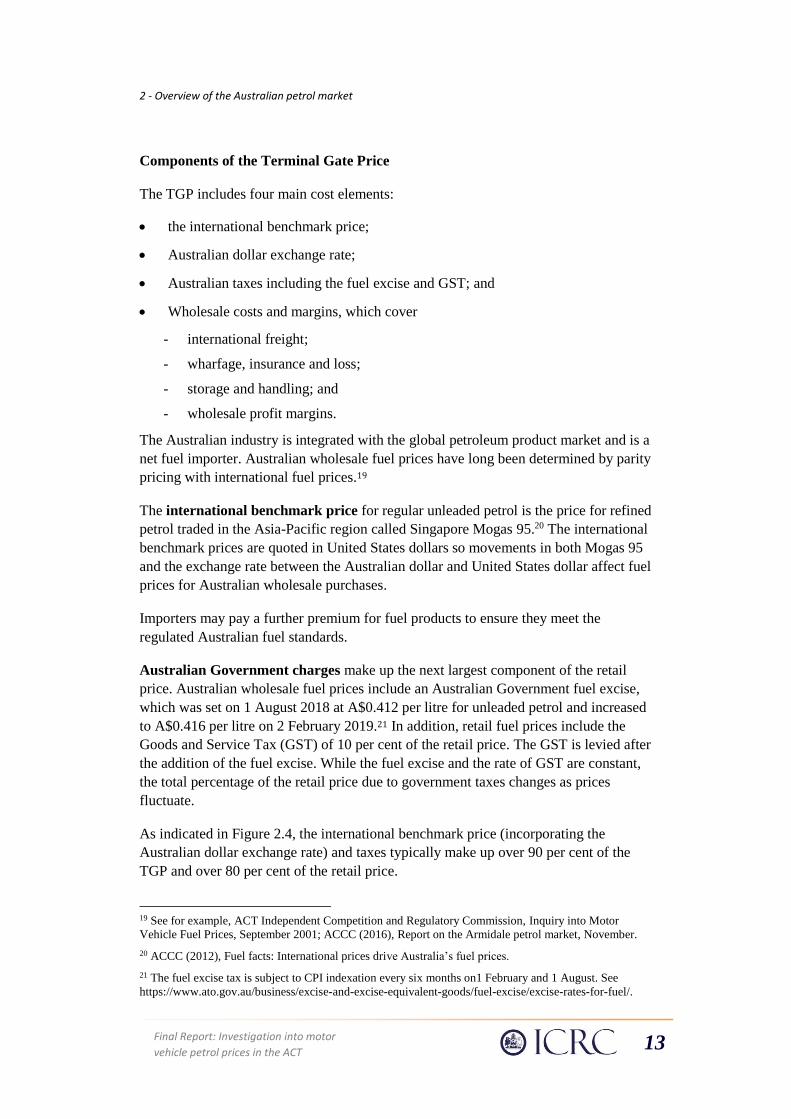
Components of the Terminal Gate Price
The TGP includes four main cost elements:
• the international benchmark price;
• Australian dollar exchange rate;
• Australian taxes including the fuel excise and GST; and
• Wholesale costs and margins, which cover
- international freight;
- wharfage, insurance and loss;
- storage and handling; and
- wholesale profit margins.
The Australian industry is integrated with the global petroleum product market and is a
net fuel importer. Australian wholesale fuel prices have long been determined by parity
pricing with international fuel prices.19
The international benchmark price for regular unleaded petrol is the price for refined
petrol traded in the Asia-Pacific region called Singapore Mogas 95.20 The international
benchmark prices are quoted in United States dollars so movements in both Mogas 95
and the exchange rate between the Australian dollar and United States dollar affect fuel
prices for Australian wholesale purchases.
Importers may pay a further premium for fuel products to ensure they meet the
regulated Australian fuel standards.
Australian Government charges make up the next largest component of the retail
price. Australian wholesale fuel prices include an Australian Government fuel excise,
which was set on 1 August 2018 at A$0.412 per litre for unleaded petrol and increased
to A$0.416 per litre on 2 February 2019.21 In addition, retail fuel prices include the
Goods and Service Tax (GST) of 10 per cent of the retail price. The GST is levied after
the addition of the fuel excise. While the fuel excise and the rate of GST are constant,
the total percentage of the retail price due to government taxes changes as prices
fluctuate.
As indicated in Figure 2.4, the international benchmark price (incorporating the
Australian dollar exchange rate) and taxes typically make up over 90 per cent of the
TGP and over 80 per cent of the retail price.
19 See for example, ACT Independent Competition and Regulatory Commission, Inquiry into Motor
Vehicle Fuel Prices, September 2001; ACCC (2016), Report on the Armidale petrol market, November.
20 ACCC (2012), Fuel facts: International prices drive Australia’s fuel prices.
21 The fuel excise tax is subject to CPI indexation every six months on1 February and 1 August. See
https://www.ato.gov.au/business/excise-and-excise-equivalent-goods/fuel-excise/excise-rates-for-fuel/.

2 - Overview of the Australian petrol market
14 Final Report: Investigation into motor
vehicle petrol prices in the ACT
The remaining proportion of the TGP covers the local wholesale operators’ costs
including international transport, local storage and handling, marketing and the
wholesale business’ profit margin.
Figure 2.5 below illustrates the quarterly average TGP in the state capitals and suggests
two major groups, the first being the five largest cities and the second comprising
Darwin and Hobart. The five largest cities are within a fraction of a cent of the Sydney
TGP, which is generally used as a proxy measure for the international benchmark
price. The smaller capital cities (Darwin and Hobart) with smaller populations and
smaller sales volumes are 4 to 5 cpl higher.
Figure 2.5 Average monthly Terminal Gate Prices, October 2014 to May 2019
Source: Australian Institute of Petroleum Terminal Gate Price data
Components of the Gross Indicative Retail Difference
Only the retail price and the TGP are directly observable. So industry observers and
regulators such as the ACCC tend to report on the GIRD or gross retail margin as a
metric of the retail element of petrol prices. GIRD is the sum of retail costs plus retail
margins. This is shown in Figure 2.6 for average ACT Regular Unleaded Petrol
(RULP) prices over the past four years.
95
105
115
125
135
145
155
Oct
-14
Jan
-15
Ap
r-1
5
Jul-
15
Oct
-15
Jan
-16
Ap
r-1
6
Jul-
16
Oct
-16
Jan
-17
Ap
r-1
7
Jul-
17
Oct
-17
Jan
-18
Ap
r-1
8
Jul-
18
Oct
-18
Jan
-19
Ap
r-1
9
RU
LP P
rice
(cp
l)
Sydney Melbourne Brisbane Adelaide
Perth Darwin Hobart

2 - Overview of the Australian petrol market
Final Report: Investigation into motor
vehicle petrol prices in the ACT 15
Figure 2.6 Long term variation in the ACT quarterly average petrol price, TGP and GIRD
Source: ACCC and Australian Institute of Petroleum
It is important to recognise that GIRD is a gross retail margin and not a net retail
margin, nor the net profit of retailers. That is, GIRD includes both retail costs and a
retail margin. Retail costs include all the costs a retailer incurs to bring fuels to a retail
site and make available for consumer purchase (such as freight, branding, rent, labour
and utility costs), while the net retail margin combined with sales volumes determines
the retailer’s net profit.
Components of retail costs
Excluding the wholesale cost of fuel (the TGP), retail costs include:
• transport costs;
• storage costs; and
• retail operating costs including:
- employee expenses;
- site rental;
- site maintenance;
- bank and merchant fees;
- insurances;
- communications;
- vehicle expenses; and
- services (electricity, waste removal, water, rates etc).
020406080
100120140160180
Qu
arte
rly
Ave
rage
Pri
ce
(cp
l)
Retail price TGP GIRD

2 - Overview of the Australian petrol market
16 Final Report: Investigation into motor
vehicle petrol prices in the ACT
Retailer margins
The final component of average petrol prices is the retail margin. Ultimately the retail
margin at an individual site will be a product of local market competition and
consumer responses to fuel prices. These factors will vary with location and time. The
effect on price will depend on who is making the retail price decision at that site and
how often this decision is re-evaluated.
2.3 Many factors influence fuel retailer costs and margins
Various reviews of fuel retailing have identified that the retail fuel market is highly
diversified and is effectively a large number of sub-markets. The many factors
considered by retailers in price setting may lead to variations in retail fuel prices
between sub-markets. These include:
• ownership structures, brands and business models in a given geographic market
(impacting the intensity of local retail competition);
• additional premiums for transport of fuels to regional areas;
• difference in retail operating costs;
• the proximity of individual businesses to roads and highways;
• lower rates of stock turnover in smaller volume markets contributing to time lags in
the flow through of wholesale fuel price increases;
• lower average fuel volumes sold resulting in dis-economies of scale; and
• sale of other products at the retail site that influence margins.
These factors are discussed below.
Ownership structure, brands and business models
The mix of retail ownership structures, brands and business models adopted by
retailers influence how the decision to set the price of fuel is made and who makes this
decision (Figure 2.7).

2 - Overview of the Australian petrol market
Final Report: Investigation into motor
vehicle petrol prices in the ACT 17
Figure 2.7 Three dimensions of retail fuel business
Different ownership structures (as discussed in Section 2.1) can have different capital
structures (the way a business finances its assets through some combination of equity,
debt or hybrid securities), and cost bases, and may involve different pricing strategies
at different sites. For example, the fuel supplier determines the retail price for COCOs
and CAs and is involved in the price decision with franchisees. DODOs (independently
owned under a brand) and independent fuel retailers, on the other hand, set their own
retail prices.
Major brands (Mobil, Viva Energy/Shell, Caltex and BP) employ a mix of business
models. So even with a single known brand, different parties may be setting the price,
taking into account different factors.
Nevertheless, some brands can be associated with a specific business model. The
ACCC, for example, identified three categories:22
• premium providers – retailers who may consider that they have a ‘premium
brand’, an attractive retail site, a good location and a superior convenience store,
and set their retail prices higher to reflect these features;23
• value providers – some retailers may set prices below their local competitors to
attract customers to their retail site and/or into their convenience store where
margins are higher; and
• discounters – some retailers offer discounts to qualifying customers, such as
supermarket docket discount arrangements, discounts associated with fuel cards or
membership (for example, Costco).
The mixture of ownership structures, brands and business models in a specific
geographic market is likely to influence the competitiveness of local retail markets for
consumers’ petrol purchases.
22 ACCC (2018), Petrol prices are not the same: report on petrol prices by major retailer in 2017, May.
23 Note that all fuel retailers must adhere to the same minimum fuel standards in the jurisdiction where
they are located.
Retail price
setting
Ownership structure
Brands
Business models

2 - Overview of the Australian petrol market
18 Final Report: Investigation into motor
vehicle petrol prices in the ACT
Convenience store sales
The margin on convenience store sales is usually significantly higher than on fuel
sales, so retail sites with convenience store sales can remain profitable with much
lower margins on fuel sales. The ACCC observes that retail petrol prices tend to be
higher in retail sites with lower convenience store sales, such as in regional locations.24
Delivery costs
Wholesale fuels are purchased from metropolitan ports and refinery storages, hence
regional retailers will incur additional freight and storage costs relative to the
metropolitan hubs. Tankers that may deliver two or three loads per day in urban centres
may only be able to deliver a load every one or two days to regional retailers hundreds
of kilometres away. There can also be additional storage costs where fuel is stored at
regional depots before it is delivered to a retail outlet.
Retail operating costs
Retail operating costs vary for a range of reasons that may be related to factors such as
the scale of the business, location, and capital costs. These will vary between
geographical locations/markets.
Table 2.2 gives an example of how these costs can vary between geographical
locations/markets. These figures were submitted to the 2017 Victorian Parliamentary
Inquiry into Fuel Prices in Regional Victoria by the Australasian Convenience and
Petroleum Marketers Association (ACAPMA), the peak body representing companies
in the petroleum distribution and petrol convenience retail industry. While these
examples may not reflect the actual costs of retailers in the ACT, they illustrate how
petrol retail operating costs can vary by factors such as annual fuel sales, hours of
operation and the number of forecourt bowsers. Employment costs, for example, will
be closely linked to operating hours, and site rental will be strongly linked to
location/local land values.
24 ACCC (2019), Submission to the ACT’s Legislative Assembly Select Committee on Fuel Pricing,
25 February, submission no. 12.

2 - Overview of the Australian petrol market
Final Report: Investigation into motor
vehicle petrol prices in the ACT 19
Table 2.2 Illustrative fuel retailer characteristics and costs (based on data for Victoria)
Rural Average
Regional Town
Regional Highway
Metro Outer ring
Metro inner ring Metro city
Metro Freeway
Site characteristics
No. of bowsers on forecourt 4 4 4 4 6 6 8
Hours of operation (per day) 15 18 18 18 24 24 24
Average annual fuel volume (million litres) 2 3 3.6 4 5.4 8 15
Total expenses $422k $635k $659k $683k $894k $1,081k $1,466k
Costs as a percentage of total expenses
Employment expenses 71% 69% 66% 64% 65% 54% 49%
Site rental 14% 17% 20% 22% 22% 32% 34%
All other costs 15% 14% 14% 14% 13% 14% 16%
Cost recovery (break-even) required per litre of fuel sold
Cost recovery rate $0.23 $0.21 $0.18 $0.17 $0.17 $0.14 $0.10
Source: Australasian Convenience and Petroleum Marketers Association Submission to Victorian Parliament’s Economic, Education, Jobs & Skills Committee’s Inquiry into fuel prices in Regional Victoria, EEJSC Submission No. 32, September 2017.
As can be seen in this table, retail operating costs do not vary in proportion with
variation in the volume of fuel sold (and hence gross annual income). This means that
fuel retailers with lower fuel volumes generally need to charge a higher unit price for
fuel sold than prices charged by higher volume sites just to recover their operating
costs, unless they receive revenue from other sources.
Proximity to roads and highways
The proximity of individual petrol retailers to high volume roads and highways directly
influences the number of potential customers that may be attracted to make a fuel
purchase.
The ACCC observes that prices may be lower in regional locations along a major
highway due to higher volumes and because these businesses may also have lower
delivery and storage costs. The ACCC suggests that another factor may be that where
petrol stations are on major roads, there is more price information being disseminated
to consumers from site bulletin boards, and consumers may be able to use this extra
information to their advantage when they select a petrol station to fill up their vehicle.25
25 ACCC (2019), Submission to the ACT’s Legislative Assembly Select Committee on Fuel Pricing, 25
February, submission no. 12.

2 - Overview of the Australian petrol market
20 Final Report: Investigation into motor
vehicle petrol prices in the ACT
2.4 Why the retail price of petrol varies over time
There are two major characteristics of retail price variations over time:
1. Retail prices follow wholesale prices (linked to international prices and currency
fluctuations) usually with a lag.
2. In some markets, there are retail price cycles where sharp price peaks are followed
by longer discounting periods.26
These market supply characteristics should be considered together with consumption
patterns—that is, consumers can vary the timing of their fuel purchases, and these
timing decisions may be influenced by variations in retail prices.
Retail prices trail the wholesale price
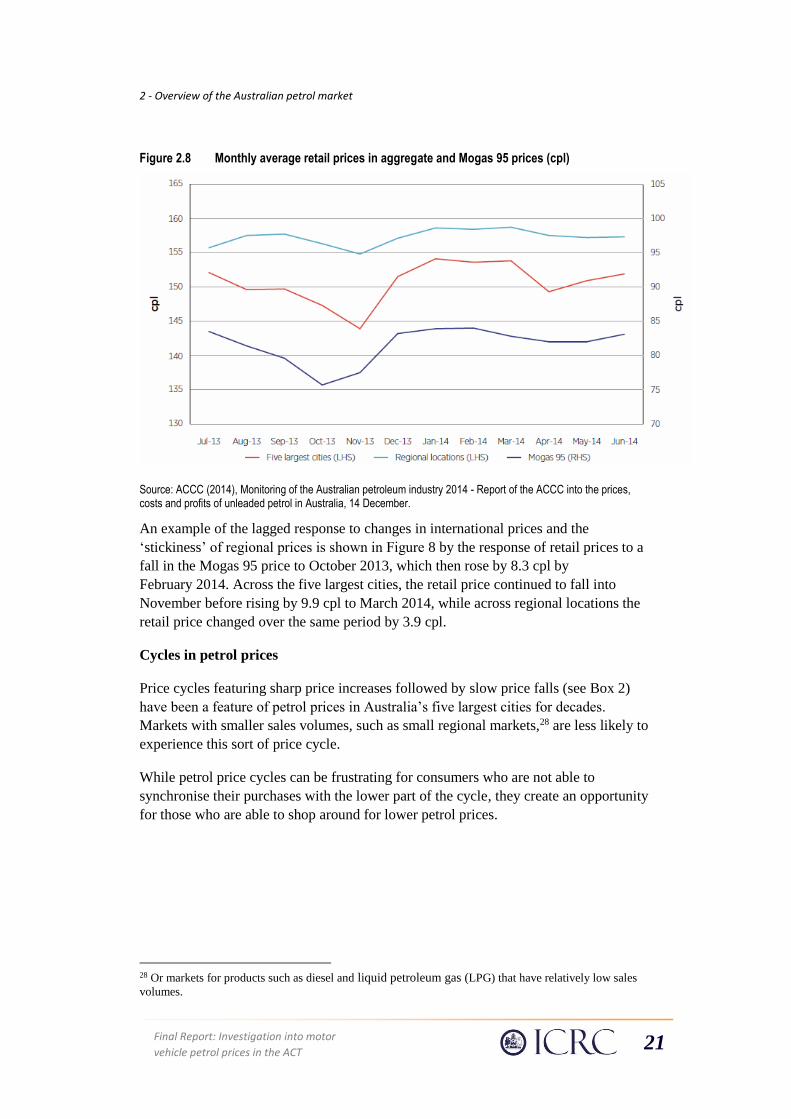
Figure 2.8 illustrates monthly average retail prices, aggregated for Australia’s five
largest cities and regional locations, compared with the Mogas 95 price as the
international benchmark price.27 Figure 2.8 demonstrates two characteristics of the
Australian retail petrol markets:
• Average retail prices vary over time reflecting changes in international prices with a
lag that reflects the distribution chain of fuels from international suppliers to local
retailers. This includes, in regional markets, a longer stock-holding duration and
slower replenishment of fuel stocks relative to large urban locations due to a lower
volume of sales.
• Price movements in regional locations are less responsive to movements in
international prices, that is, prices in regional areas are generally more ‘sticky’.
26 In economic terms, these price cycles are known as Edgeworth cycles.
27 The regional locations are available in ACCC (2014), Monitoring of the Australian petroleum industry
2014 - Report of the ACCC into the prices, costs and profits of unleaded petrol in Australia, 14 December.
2 - Overview of the Australian petrol market
Final Report: Investigation into motor
vehicle petrol prices in the ACT 21
Figure 2.8 Monthly average retail prices in aggregate and Mogas 95 prices (cpl)
Source: ACCC (2014), Monitoring of the Australian petroleum industry 2014 - Report of the ACCC into the prices, costs and profits of unleaded petrol in Australia, 14 December.
An example of the lagged response to changes in international prices and the
‘stickiness’ of regional prices is shown in Figure 8 by the response of retail prices to a
fall in the Mogas 95 price to October 2013, which then rose by 8.3 cpl by
February 2014. Across the five largest cities, the retail price continued to fall into
November before rising by 9.9 cpl to March 2014, while across regional locations the
retail price changed over the same period by 3.9 cpl.
Cycles in petrol prices
Price cycles featuring sharp price increases followed by slow price falls (see Box 2)
have been a feature of petrol prices in Australia’s five largest cities for decades.
Markets with smaller sales volumes, such as small regional markets,28 are less likely to
experience this sort of price cycle.
While petrol price cycles can be frustrating for consumers who are not able to
synchronise their purchases with the lower part of the cycle, they create an opportunity
for those who are able to shop around for lower petrol prices.
28 Or markets for products such as diesel and liquid petroleum gas (LPG) that have relatively low sales
volumes.

2 - Overview of the Australian petrol market
22 Final Report: Investigation into motor
vehicle petrol prices in the ACT
Box 2 Characteristics of retail petrol price cycles
A particular type of price cycle is common in many retail petrol markets around the world
(though often hidden in official reporting of average prices). Known as Edgeworth cycles,
they are characterised by three phases:
• The discounting phase, which is usually the longest part of the cycle, occurs when a
retailer cuts its prices to increase its market share and its competitors follow by cutting
their prices to retain market share. Retailers in the market will repeatedly undercut each
other’s prices to attract market share. In general, this phase generates profits from positive
retail margins combined with higher sales volumes.
• The attrition phase occurs when the price has fallen so far that it is at (or below) the TGP
and each retailer hopes that a competitor will raise its price first so the other retailers can
follow in raising their own prices without losing market share. Sales volumes may be
high, but profits are negligible or losses are being made (see example in Figure 2.9).
• The restoration phase occurs when one retailer lifts its price to restore profits. Its
competitors follow soon after in lifting their prices. Retail margins may be high, including
an additional margin to recover earlier losses, but sale volumes are lower and profits are
muted.
The ACCC’s recent price cycle study found:
• The difference between the highest and lowest prices in the discounting phase can be
10-15 cpl, and in the restoration phase can be 25-30 cpl.
• Price cycles interact with consumer purchasing habits.
• In the four largest capital cities (Sydney, Melbourne, Brisbane and Perth), price cycles
have lengthened from about one week (‘cheap Tuesdays’) to several weeks, with those
markets spending more time in the discounting phase (during which retailers may earn
more profits).
• Price cycles occur independently in different markets.
Figure 2.9 Edgeworth cycles in Sydney and Perth in early 2019
Sources: Informed Sources (retail prices) and Australian Institute of Petroleum (TGP); ACCC (2018), Petrol price cycles in Australia, December.

2 - Overview of the Australian petrol market
Final Report: Investigation into motor
vehicle petrol prices in the ACT 23
Petrol price cycles make comparisons between different markets at the same point in
time difficult for consumers (as well as for analysts and regulators) because different
markets may exhibit different cycle stages and cycling behaviour. For example, prices
in one city may be high because that market is at the peak of a price cycle while prices
may be low in another city because its market is at the lowest point in a price cycle; in
this case, a simple comparison of prices at a point in time will overstate the typical
difference in prices between the cities that occurs over a longer period of time.
2.5 Availability of price information and price monitoring
The ACCC has found that greater fuel price transparency encourages consumers to
seek lower prices.29 There are a number of tools available to help consumers more
easily find out information about petrol prices in the surrounding area and decide
where and when to buy petrol, taking into account the costs of changing the location
and timing of when they buy petrol. This section surveys the range of schemes
currently available:
• Australian, state and territory government schemes;
• motoring organisations' websites and apps;
• commercial services;
• crowd sourcing apps; and
• retailer apps.
Government websites and apps
At the Commonwealth level, the ACCC has a Ministerial direction to monitor the
prices, costs and profits relating to the supply of petroleum products, and to report on
aspects of the fuel market of consumer interest in relation to prices, costs and profits at
least quarterly.30 The ACCC monitors retail prices of unleaded petrol, diesel and LPG
in all Australian capital cities and in more than 190 regional locations on a daily basis.
Prices for the past 45 days can be seen on the ACCC’s website.31
29 ACCC (2019), Submission to the ACT Legislative Assembly Select Committee on Fuel Pricing,
submission no 12, 25 February.
30 Ministerial Direction to the ACCC under section 95ZE of the Competition and Consumer Act 2010 in
letter from The Treasurer, the Hon Scott Morrison, the Chair of the ACCC Mr Rod Simms, dated
20 December 2017, available at
https://www.accc.gov.au/system/files/Treasurer%20to%20ACCC%20Chair%20-
%20Fuel%20monitoring.pdf viewed 30 March 2019. This Direction is effective for two years from
20 December 2017. A previous Ministerial direction commenced on 14 December 2014 for a period of
three years.
31 https://www.accc.gov.au/consumers/petrol-diesel-lpg/petrol-price-cycles
2 - Overview of the Australian petrol market
24 Final Report: Investigation into motor
vehicle petrol prices in the ACT
The Western Australian (WA), New South Wales (NSW), and Northern Territory (NT)
Governments also monitor and report prices operating FuelWatch32 (see Box 3),
FuelCheck33 and MyFuelNT34 respectively.
The Queensland Government announced the introduction of a two-year trial of a fuel
reporting scheme, commencing in December 2018.
Victoria, South Australia and Tasmania have no government real-time or daily fuel
station pricing data.
In Tasmania, the Government has helped facilitate a partnership between the Royal
Automotive Club of Tasmania (RACT) and GasBuddy to display prices on the
GasBuddy app.
Box 3 Western Australia - FuelWatch
Established in January 2001, the WA government manages FuelWatch covering
approximately 80 per cent of regional and 100 per cent metropolitan petrol, diesel and
LPG/Autogas retail outlets in Western Australia.
Under FuelWatch legislation, fuel retailers are required to report their next day’s fuel prices
by 2pm each day to FuelWatch. Fuel retailers are required to sell at the notified price for 24
hours from 6am the following day. FuelWatch publicly releases the next day’s fuel prices at
2.30pm. This means that WA motorists can compare prices across all retailers and time their
purchase to the cheaper of the two days.
FuelWatch disseminates fuel pricing information at 2.30pm each day through: desktop and
mobile websites; a free email subscription listing the cheapest fuel prices for that day and the
next for subscriber preferences (such as suburb, brand or fuel type); customised fuel pricing
reports sent to major media outlets; and a fuel enquiries phone line provided during business
hours.
FuelWatch also provides advance warnings of price increases by these channels and
Facebook and Twitter posts. These alerts are issued weekly on Mondays in response to the
current Perth petrol price cycle where prices, on average, spike on Tuesdays.
Source: FuelWatch website at https://www.fuelwatch.wa.gov.au.
32 https://www.fuelwatch.wa.gov.au/fuelwatch/pages/home.jspx
33 https://www.fuelcheck.nsw.gov.au/app
34 https://myfuelnt.nt.gov.au

2 - Overview of the Australian petrol market
Final Report: Investigation into motor
vehicle petrol prices in the ACT 25
Motoring organisation websites and apps
Many motoring organisations across Australia offer fuel price websites and apps that
allow users to locate the nearest retail site and to check prices across sites. Examples
include the National Roads and Motorists’ Association (NRMA) in NSW, the Royal
Automobile Club of Victoria (RACV), and the Royal Automobile Club of WA.
The type of information available to consumers on these websites and apps varies. The
Royal Automobile Association of South Australia (RAA), for example, monitors price
trends day-to-day and notifies members when a price spike is imminent, but only
provides daily average fuel prices for Adelaide and regional towns. The Royal
Automobile Club of Queensland’s (RACQ) Fair Fuel Finder app allows consumers to
look up fuel prices in their area and also advises motorists about how much they should
pay for fuel. It calculates a ‘fair price’ based on the international price of oil and
refined fuel, the local TGP, and considering ‘fair’ costs and margins.35
Commercial websites and apps
There are many commercially operated fuel price websites and apps. Woolworths,
Coles Express, 7-Eleven, BP and Caltex all have apps that allow users to find their
nearest retail site and to check other information such as opening hours and retail
offers. However, only 7-Eleven and Woolworths apps provide information about retail
prices at their retail sites.36 The 7-Eleven app allows consumers to lock in a price for a
period of time.
Fuel price information is also available to motorists via the MotorMouth37 website and
app, and the GasBuddy38 website and app. MotorMouth is a private data provider
owned by Informed Sources, and reports fuel prices for around 4,500 service stations
across Australia, updated every 15 minutes.
As the ACCC observes, prices are not always available for all retail sites on these
websites and apps.39
35 The model used for South East Queensland cities is based on the cheaper petrol prices offered in the
market and what RACQ considers a fair margin. Each day RACQ calculates the fuel price of the cheapest
25 per cent of retailers – the 25th percentile price (one in four retailers). For most of the price cycle the
25th percentile price will be displayed as the fair price. During the more expensive part of the price cycle,
the Fair Fuel Price is based on TGP plus reasonable costs and margins. See https://www.racq.com.au/cars-
and-driving/cars/owning-and-maintaining-a-car/fuel-prices
36 ACCC (2018), Petrol price cycles in Australia, December.
37 https://motormouth.com.au
38 https://www.gasbuddy.com
39 ACCC (2018), Petrol price cycles in Australia, December.

2 - Overview of the Australian petrol market
26 Final Report: Investigation into motor
vehicle petrol prices in the ACT
New apps are under development to allow retailers to promote product and service
specials.40 These will facilitate competition among retailers on features other than
price.
Crowd sourcing apps
There are several fuel price apps that rely on data submitted by users, including Fuel
Map and Petrol Spy. Because of the reliance on app users to report information, the
prices may not be current or complete for all service stations. Some organisations are
developing incentives (both rewards and penalties) for users seeking to improve data
accuracy.
Not all comparison tools are comprehensive or timely
Not all the consumer apps or websites run by private or government data providers
have complete and up‐to‐date data covering all service stations. In its regional market
studies, the ACCC found the prices of some small, cheaper independent service
stations are not covered or reported prices were out of date.41 Similarly, the ACT
Legislative Assembly Select Committee on Fuel Pricing noted that there are gaps in the
price information provided by existing fuel monitoring applications and websites in the
ACT and elsewhere and that the take up rates of these monitoring tools remains low.42
Nevertheless, these comparison tools appear to cover most petrol retailers in the ACT
market. As such, they provide consumers with information about the options available
to them when shopping around to purchase fuel and help to reduce consumer costs of
searching for price information.
40 An example was provided by Voyager Technologies International Limited in their submission to the
Submission to Victorian Parliament’s Economic, Education, Jobs & Skills Committee’s Inquiry into fuel
prices in Regional Victoria, EEJSC submission no 4, 4 July 2017,
41 Sims, R, Fuel price transparency and retail industry competition, Paper presented at the Asia Pacific
Fuel Industry Forum, 13 September 2017.
42 ACT Legislative Assembly Select Committee on Fuel Pricing 2019, Interim report on inquiry into ACT
fuel pricing, p.7.

3 - The retail petrol market in the ACT and surrounding regions
Final Report: Investigation into motor
vehicle petrol prices in the ACT 27
3 The retail petrol market in the ACT and surrounding regions
Box 4 Summary of the petrol market in the ACT and surrounding regions
• The ACT population of around 420,000 people consumes approximately 290 million litres
of petrol each year.
• There were 58 retail petrol sites in Canberra in mid-2019. On a per capita basis there was
one site per 6,820 people, which is around 10 per cent lower than the density in Sydney
(1 per 6,100 people).
• The ACT has a relatively high degree of retail market concentration. In 2018-19, four
major brands (Coles Express/Shell, Caltex, Caltex/Woolworths, and BP) accounted for
44 of the 58 Canberra retail petrol sites (76 per cent), and these plus 7-Eleven account for
over 90 per cent of the market.
• The ACT has the smallest proportion of small independent or minor independent branded
retailers (United, Metro Fuel, and Costco in the ACT) compared with other States and
Territories.
• Around 75 per cent of people living in Canberra travelled to work by car compared to the
Australian average of 69 per cent.
• Petrol prices in Canberra, Hobart and Darwin were consistently higher than the five largest
cities in 2018. Although sometimes higher, Canberra’s prices were frequently lower than
Hobart and Darwin.
• While petrol prices in the ACT are not the highest compared to 13 selected towns in
neighbouring regions, they were consistently higher than half of these in 2018.
This chapter sets out the general features of the ACT petrol market that are important
for the analysis in later chapters. The chapter describes the characteristics of the ACT
retail petrol market and the retail petrol markets of surrounding regions.
3.1 Key characteristics of ACT retail petrol market
There were 58 retail petrol sites in Canberra in June 2019, according to the Informed
Sources Netwatch database. On a per capita basis there was one site per 6,820 people,
which is around 10 per cent lower than the density in Sydney (1 per 6,100 people).43
Figure 3.1 shows the geographical distribution of these sites.
43 Informed Sources (2019), submission to the ACT Legislative Assembly Select Committee Inquiry on
Fuel Pricing in the ACT, Submission No. 12, 25 February.

3 - The retail petrol market in the ACT and surrounding regions
28 Final Report: Investigation into motor
vehicle petrol prices in the ACT
Figure 3.1 ACT petrol stations by geography as at 19 June 2019
Source: https://motormouth.com.au/ viewed on 19 June 2019.
Figure 3.2 shows the proportion of retail sites in Canberra and Sydney by brand. The
brand with the greatest number of sites in Canberra is Coles Express (15, accounting
for 26 per cent of the market). Costco, a retail brand known for price discounting, is
located in Majura near the Canberra airport, close to a Caltex/Woolworths petrol
station. Metro Petroleum, another ‘value provider’44 brand, is in Fyshwick.
Figure 3.2 Proportion of retail sites in Canberra and Sydney by brand
Source: Informed Sources (2019), Submission to Select Committee on Fuel Pricing, Legislative Assembly for The Australian Capital Territory, Inquiry into the Select Committee on Fuel Pricing, submission no. 14, 25 February; ACCC (2018), Retail and wholesale petrol market shares in Australia, September.
44 Chapter 2, section 2.3 discusses retailer value or market propositions.

3 - The retail petrol market in the ACT and surrounding regions
Final Report: Investigation into motor
vehicle petrol prices in the ACT 29
The ACT has a relatively high degree of retail market concentration. Four major brands
(Coles Express/Shell, Caltex, Caltex/Woolworths and BP45) account for 76 per cent of
Canberra retail petrol sites, and the five largest brands (the four majors plus 7-Eleven)
account for over 90 per cent of the market. In contrast, in Sydney the same five retail
brands accounted for only around 70 per cent of the total number of retail sites (see
Figure 3.2).46 The two supermarket chains (Coles Express and Woolworths) alone
accounted for around 43 per cent of retail sites in Canberra, compared with only
around 20 per cent in Sydney. Conversely, small independent retailers and independent
chain retailers had a much higher market share in Sydney than in Canberra.
As discussed in Chapter 2, there have been some changes to the industry structure in
recent months, with Viva Energy setting petrol prices at Coles Express sites from
March 2019 and Euro Garages purchasing Woolworths retail petrol sites in April 2019.
A list of ownership changes for the period from 2013 to 2019 is provided in Table 3.1.
Table 3.1 Ownership changes in Canberra petrol market
Petrol station Current Brand Change in ownership/management Year
Costco at Majura Park Costco New opening 2014
Metro Petroleum Fyshwick Metro New opening 2015
7-Eleven 7-Eleven New opening 2014
BP Express Phillip BP New opening 2014
BP Watson BP From independent to COCO 2016
Caltex Fyshwick Caltex From United to Caltex independent 2018
United Kambah United From Caltex to United 2018
Caltex Star Mart Kambah Caltex From Caltex Woolworths to Caltex Independent 2014
Caltex Calwell Caltex From Caltex Woolworths to Caltex Independent 2014
Caltex Weston Caltex From Caltex Woolworths to Caltex Independent 2014
Caltex Star Mart Hughes Caltex From Caltex Woolworths to Caltex Independent 2014
Caltex Starmart Holt Caltex From Caltex Woolworths to Caltex Independent 2014
Caltex Braddon Caltex From Caltex Woolworths to Caltex Independent 2014
Caltex Nicholls Caltex From Caltex Woolworths to Caltex Independent 2014
Caltex Kaleen Caltex From Caltex Woolworths to Caltex Independent 2014 Caltex-Woolworths (10 Sites)
Caltex-Woolworths
From Woolworths to Euro Garages FuelCo (Australia) 2019
Coles Express (15 sites) Coles Express Viva Energy has set the petrol price from March 2019. 2019
Source: Based on data from Informed Sources and ACT Environment Protection Authority.
45 See section 2.1 in chapter 2.
46 ACCC (2019), Submission to the ACT Legislative Assembly Select Committee Inquiry on Fuel Pricing
in the ACT, submission no. 12, 25 February.
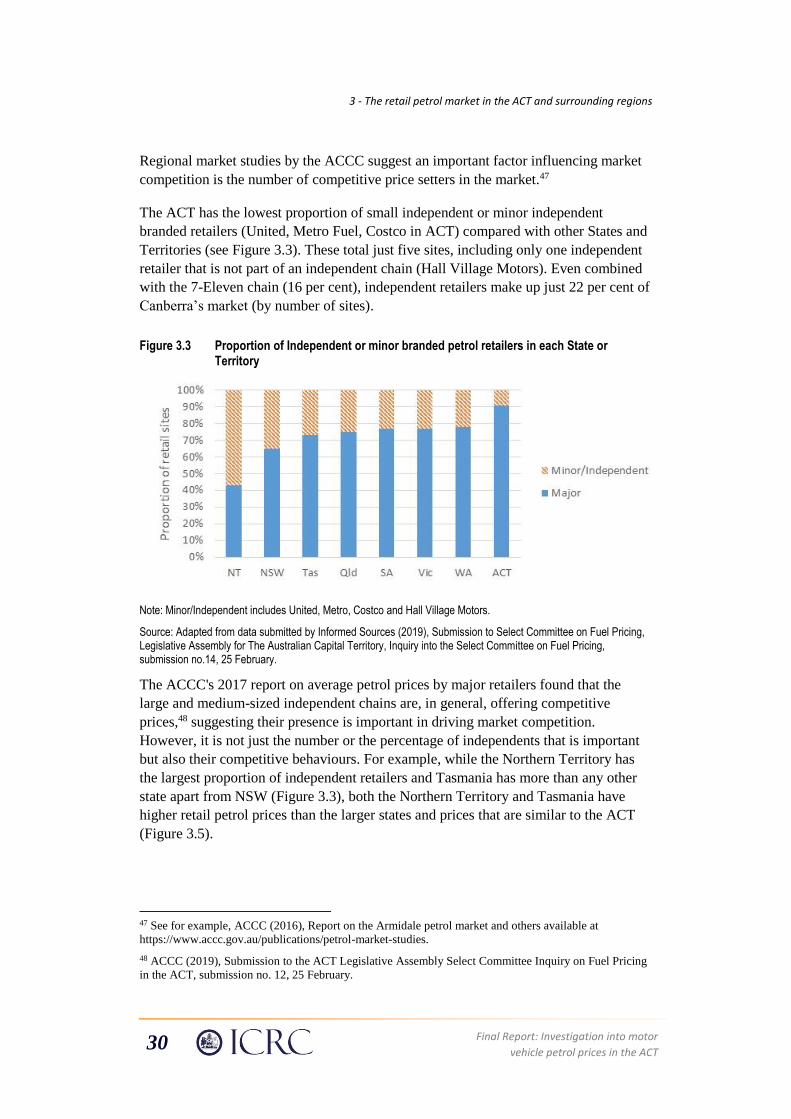
3 - The retail petrol market in the ACT and surrounding regions
30 Final Report: Investigation into motor
vehicle petrol prices in the ACT
Regional market studies by the ACCC suggest an important factor influencing market
competition is the number of competitive price setters in the market.47
The ACT has the lowest proportion of small independent or minor independent
branded retailers (United, Metro Fuel, Costco in ACT) compared with other States and
Territories (see Figure 3.3). These total just five sites, including only one independent
retailer that is not part of an independent chain (Hall Village Motors). Even combined
with the 7-Eleven chain (16 per cent), independent retailers make up just 22 per cent of
Canberra’s market (by number of sites).
Figure 3.3 Proportion of Independent or minor branded petrol retailers in each State or Territory
Note: Minor/Independent includes United, Metro, Costco and Hall Village Motors.
Source: Adapted from data submitted by Informed Sources (2019), Submission to Select Committee on Fuel Pricing, Legislative Assembly for The Australian Capital Territory, Inquiry into the Select Committee on Fuel Pricing, submission no.14, 25 February.
The ACCC's 2017 report on average petrol prices by major retailers found that the
large and medium-sized independent chains are, in general, offering competitive
prices,48 suggesting their presence is important in driving market competition.
However, it is not just the number or the percentage of independents that is important
but also their competitive behaviours. For example, while the Northern Territory has
the largest proportion of independent retailers and Tasmania has more than any other
state apart from NSW (Figure 3.3), both the Northern Territory and Tasmania have
higher retail petrol prices than the larger states and prices that are similar to the ACT
(Figure 3.5).
47 See for example, ACCC (2016), Report on the Armidale petrol market and others available at
https://www.accc.gov.au/publications/petrol-market-studies.
48 ACCC (2019), Submission to the ACT Legislative Assembly Select Committee Inquiry on Fuel Pricing
in the ACT, submission no. 12, 25 February.
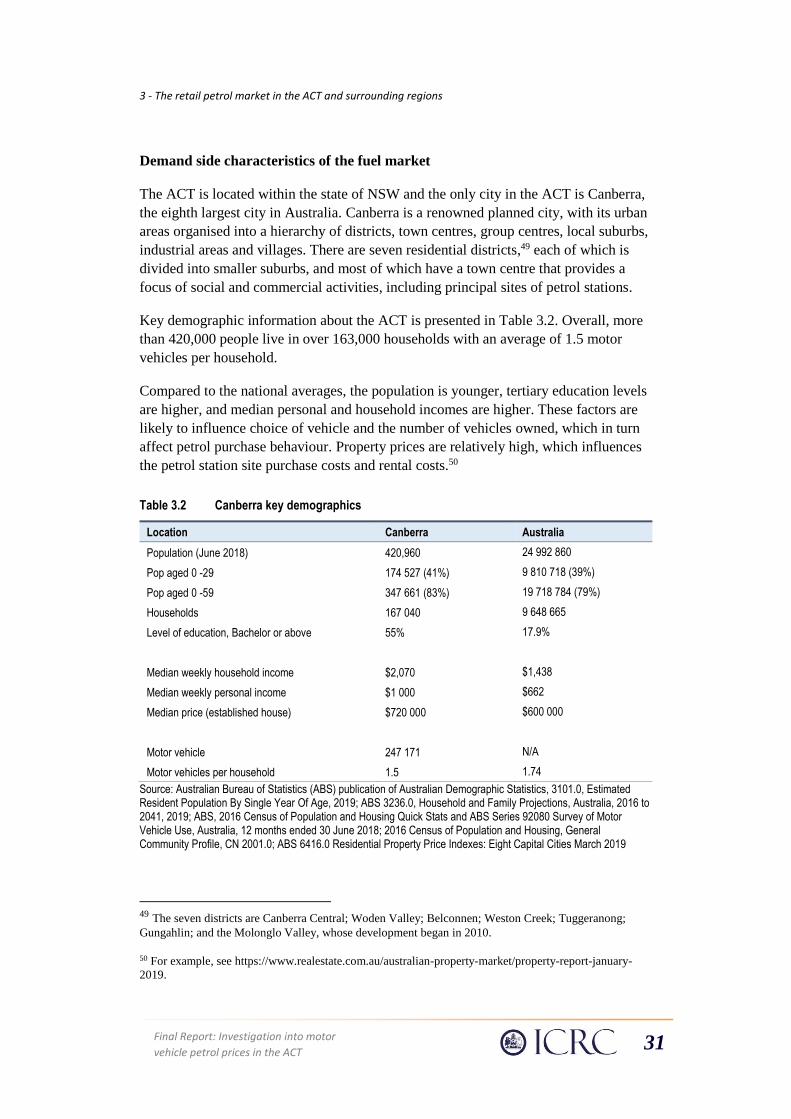
3 - The retail petrol market in the ACT and surrounding regions
Final Report: Investigation into motor
vehicle petrol prices in the ACT 31
Demand side characteristics of the fuel market
The ACT is located within the state of NSW and the only city in the ACT is Canberra,
the eighth largest city in Australia. Canberra is a renowned planned city, with its urban
areas organised into a hierarchy of districts, town centres, group centres, local suburbs,
industrial areas and villages. There are seven residential districts,49 each of which is
divided into smaller suburbs, and most of which have a town centre that provides a
focus of social and commercial activities, including principal sites of petrol stations.
Key demographic information about the ACT is presented in Table 3.2. Overall, more
than 420,000 people live in over 163,000 households with an average of 1.5 motor
vehicles per household.
Compared to the national averages, the population is younger, tertiary education levels
are higher, and median personal and household incomes are higher. These factors are
likely to influence choice of vehicle and the number of vehicles owned, which in turn
affect petrol purchase behaviour. Property prices are relatively high, which influences
the petrol station site purchase costs and rental costs.50
Table 3.2 Canberra key demographics
Location Canberra Australia
Population (June 2018) 420,960 24 992 860
Pop aged 0 -29 174 527 (41%) 9 810 718 (39%)
Pop aged 0 -59 347 661 (83%) 19 718 784 (79%)
Households 167 040 9 648 665
Level of education, Bachelor or above 55% 17.9%
Median weekly household income $2,070 $1,438
Median weekly personal income $1 000 $662
Median price (established house) $720 000 $600 000
Motor vehicle 247 171 N/A
Motor vehicles per household 1.5 1.74
Source: Australian Bureau of Statistics (ABS) publication of Australian Demographic Statistics, 3101.0, Estimated Resident Population By Single Year Of Age, 2019; ABS 3236.0, Household and Family Projections, Australia, 2016 to 2041, 2019; ABS, 2016 Census of Population and Housing Quick Stats and ABS Series 92080 Survey of Motor Vehicle Use, Australia, 12 months ended 30 June 2018; 2016 Census of Population and Housing, General Community Profile, CN 2001.0; ABS 6416.0 Residential Property Price Indexes: Eight Capital Cities March 2019
49 The seven districts are Canberra Central; Woden Valley; Belconnen; Weston Creek; Tuggeranong;
Gungahlin; and the Molonglo Valley, whose development began in 2010.
50 For example, see https://www.realestate.com.au/australian-property-market/property-report-january-
2019.

3 - The retail petrol market in the ACT and surrounding regions
32 Final Report: Investigation into motor
vehicle petrol prices in the ACT
The 2016 ABS census showed 75 per cent of people living in Canberra travelled to
work by car as drivers compared to the Australian average of 69 per cent (see Figure
3.4).51 Of the capital cities, Canberra has the third lowest usage of public transport after
Hobart and Darwin, but the highest cycling/walking rate (ahead of Hobart).
Figure 3.4 Method of travel to work, greater capital city
Note: excludes multi-mode travel and car as passenger.
Source: ABS, More than two in three drive to work, Census reveals, 23 October 2017.
Table 3.3 indicates that 34 per cent of passenger vehicle kilometres was for commuting
to and from work.
Table 3.3 Total kilometres travelled, by type of vehicle by business and private use and by area of operation, ACT, 2018
Passenger vehicles Light commercial vehicles
Total (million km) 3,162 516
All business use 14.7% 56.2%
To and from work 34.0% 18.2%
Personal and other 51.3% 25.8%
Urban areas 74.6% 77.7%
Interstate 25.4% 22.3%
Source: ABS Series 92080 Survey of Motor Vehicle Use, Australia, 12 months ended 30 June 2018
3.2 Comparison with regions in proximity to the ACT
This section compares the ACT retail petrol market with surrounding regions,
commencing with key characteristics then focusing on prices over time.
51 ABS, Media release More than two in three drive to work, Census reveals, 23 October 2017, viewed at
12 April 2019. Note this excludes multi-mode travel and car as passenger.

3 - The retail petrol market in the ACT and surrounding regions
Final Report: Investigation into motor
vehicle petrol prices in the ACT 33
Key characteristics of neighbouring regions
This inquiry considers three regions in the surrounding area that are most likely to be
commonly visited by people from the ACT, or people visiting the ACT:
• South Coast, including the towns of Batemans Bay, Merimbula, Nowra, Moruya
and Bega;
• Towns along the Hume Highway, including the towns of Goulburn, Bowral-
Mittagong and Yass;52 and
• Towns not along the Hume Highway, including the towns of Queanbeyan, Tumut,
Cooma, Temora, and Wagga Wagga.53
Table 3.4 provides some indicative demographic characteristics for comparison with
the Canberra market (see Table 3.2 and following discussion). Three facts stand out.
First, the total combined population of these towns (174,600) is less than half of
Canberra’s population. Second, being far more widely distributed than the urban area
of ACT, there are more service stations serving these communities, on average one site
per 1,425 residents of these regions compared to one per roughly 6,820 in the ACT.
Third, the average of the median weekly household income is $1,197 or 58 per cent of
that in Canberra. This means that discretionary income is likely to be higher in
Canberra, and this will influence consumer behaviour and retail price setting strategies.
52 Note that a dual carriageway freeway bypasses these towns, and most of the petrol stations are located
in the town.
53 Many of these towns are on other significant regional routes to Adelaide, Griffith or the Snowy
Mountains.

3 - The retail petrol market in the ACT and surrounding regions
34 Final Report: Investigation into motor
vehicle petrol prices in the ACT
Table 3.4 Indicative demographics of comparison towns
Location Population Households
Median weekly household income ($)
Petrol stations
(number)
Pop’n/ petrol station
South Coast
Batemans Bay 11 294 6 995 876 6-7 1 610
Merimbula 7 521 4 314 1 007 5 1 500
Nowra 30 853 13 163 1 013 16 1 930
Along Hume Hwy
Goulburn 22 419 9 922 1 155 11 2 040
Bowral - Mittagong
21 394 9 739 1 312 8 2 680
Yass 5 466 2 373 1 379 2 2 730
Off Hume Hwy
Queanbeyan 36 348 16 016 1 738 6 1 810
Tumut 6 154 2 828 1 066 4 1 540
Cooma 6 379 3 155 1 150 8 800
Temora 4 054 1 965 1 122 4 1 015
Wagga Wagga 48 263 21 081 1 692 17 2 840
Canberra (2019) 420 960 167 040 $2 070 58 7 258
Canberra (Census) 395 790 162 891 $2 070 58 6 824
Source: ABS 2016 Census Quick Stats (including Canberra, for comparability with other locations); https://fuelcheck.nsw.gov.au. The 2019 data for Canberra is from ABS publication of Australian Demographic Statistics, 3101.0, Estimated Resident Population by Single Year of Age, 2019; ABS 3236.0 Household and Family Projections, Australia, 2016 to 2041, 2019.
Price comparisons with other capital cities
Figure 3.5 provides a comparison of ACT monthly average petrol prices with other
capitals in 2018. It shows that Canberra, Hobart and Darwin prices have been
consistently higher than the five largest cities. It also shows that Canberra prices were
frequently lower than Hobart and Darwin.
Like Hobart and Darwin, Canberra retail petrol prices change with the wholesale price
but do not generally show a price cycle (see Section 2.4). Table 3.5 shows these are
general trends over recent years. The difference in petrol prices between the capital
cities has narrowed in the first three months of 2019.

3 - The retail petrol market in the ACT and surrounding regions
Final Report: Investigation into motor
vehicle petrol prices in the ACT 35
Figure 3.5 Comparison of capitals monthly average RULP (cpl)
Source: ACCC (2019) Report on the Australian petroleum market—March 2019.
Table 3.5 Comparison of annual average RULP over 3 years (cpl)
2015-16 2016-17 2017-18
Five largest cities 121.7 122.6 134.5
Canberra 126.9 129.4 141.6
Hobart 130.2 134.0 145.1
Source: ACCC (2019), submission no.12, ACT Parliamentary Inquiry into the Select Committee on Fuel Pricing, February.
Price comparisons with the surrounding region
The following figures provide a comparison of ACT petrol prices with those in the
surrounding regions, based on quarterly average prices reported by the ACCC.
Figure 3.6 compares Canberra prices, shown as the red line, with the range of average
prices, shown as the blue bars, for the towns listed in Table 3.4.
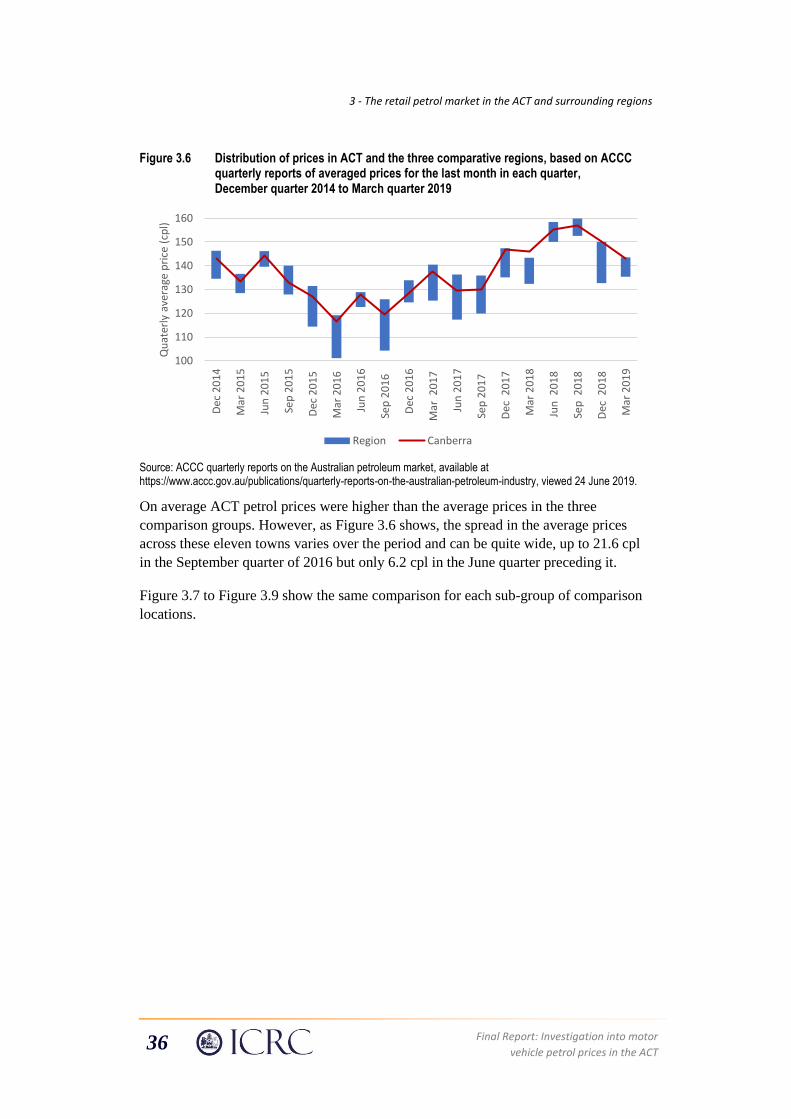
3 - The retail petrol market in the ACT and surrounding regions
36 Final Report: Investigation into motor
vehicle petrol prices in the ACT
Figure 3.6 Distribution of prices in ACT and the three comparative regions, based on ACCC quarterly reports of averaged prices for the last month in each quarter, December quarter 2014 to March quarter 2019
Source: ACCC quarterly reports on the Australian petroleum market, available at https://www.accc.gov.au/publications/quarterly-reports-on-the-australian-petroleum-industry, viewed 24 June 2019.
On average ACT petrol prices were higher than the average prices in the three
comparison groups. However, as Figure 3.6 shows, the spread in the average prices
across these eleven towns varies over the period and can be quite wide, up to 21.6 cpl
in the September quarter of 2016 but only 6.2 cpl in the June quarter preceding it.
Figure 3.7 to Figure 3.9 show the same comparison for each sub-group of comparison
locations.
100
110
120
130
140
150
160D
ec 2
01
4
Mar
20
15
Jun
20
15
Sep
20
15
Dec
20
15
Mar
20
16
Jun
20
16
Sep
20
16
Dec
20
16
Mar
20
17
Jun
20
17
Sep
20
17
Dec
20
17
Mar
20
18
Ju
n 2
01
8
Sep
20
18
Dec
20
18
Mar
20
19
Qu
ater
ly a
vera
ge p
rice
(cp
l)
Region Canberra

3 - The retail petrol market in the ACT and surrounding regions
Final Report: Investigation into motor
vehicle petrol prices in the ACT 37
Figure 3.7 Distribution of prices in ACT and the South Coast comparative group, based on ACCC reports of quarterly averaged prices, December quarter 2014 to March quarter 2019
Source: ACCC quarterly reports on the Australian petroleum market, available at https://www.accc.gov.au/publications/quarterly-reports-on-the-australian-petroleum-industry, viewed 24 June 2019.
Figure 3.8 Distribution of prices in ACT and the on Hume Highway comparative group, based on ACCC reports of quarterly averaged prices, December quarter 2014 to March quarter 2019
Source: ACCC quarterly reports on the Australian petroleum market, available at https://www.accc.gov.au/publications/quarterly-reports-on-the-australian-petroleum-industry, viewed 24 June 2019.
100
110
120
130
140
150
160D
ec 2
01
4
Mar
20
15
Jun
20
15
Sep
20
15
Dec
20
15
Mar
20
16
Jun
20
16
Sep
20
16
Dec
20
16
Mar
20
17
Jun
20
17
Sep
20
17
Dec
20
17
Mar
20
18
Ju
n 2
01
8
Sep
20
18
Dec
20
18
Mar
20
19
Qu
ater
ly a
vera
ge p
rice
(cp
l)
South Coast Canberra
100
110
120
130
140
150
160
Dec
20
14
Mar
20
15
Jun
20
15
Sep
20
15
Dec
20
15
Mar
20
16
Jun
20
16
Sep
20
16
Dec
20
16
Mar
20
17
Jun
20
17
Sep
20
17
Dec
20
17
Mar
20
18
Ju
n 2
01
8
Sep
20
18
Dec
20
18
Mar
20
19
Qu
ater
ly a
vera
ge p
rice
(cp
l)
Along Hume Canberra
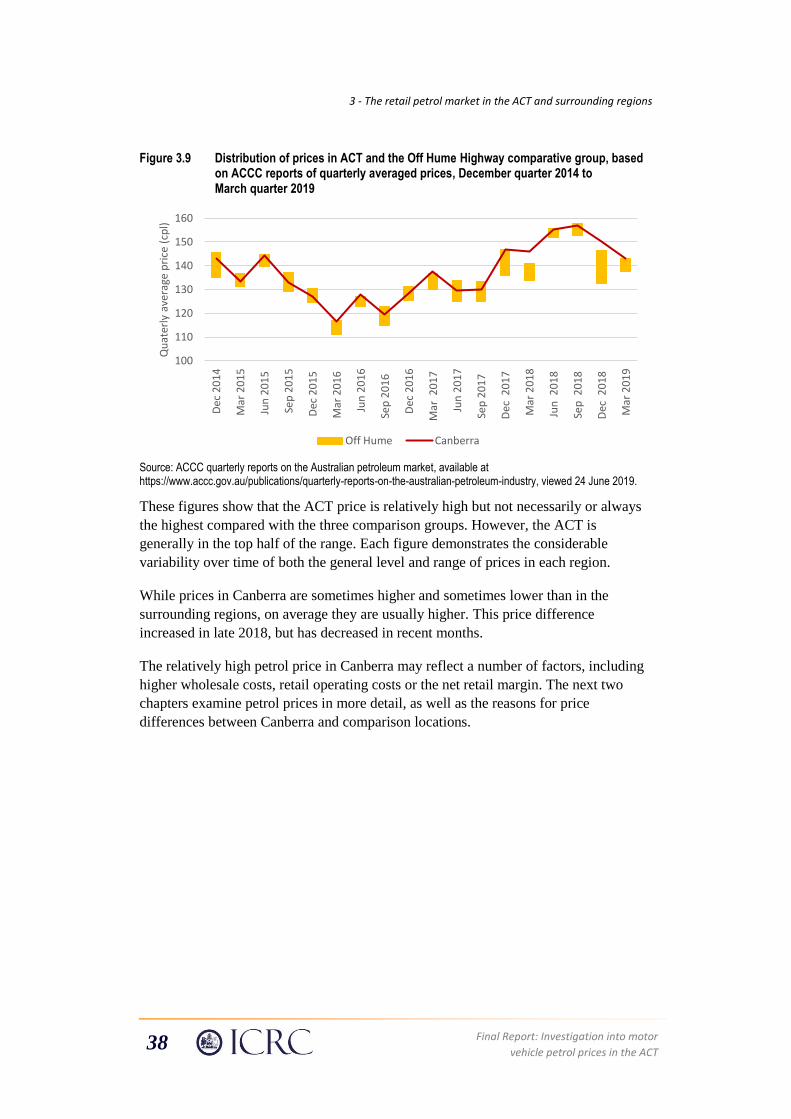
3 - The retail petrol market in the ACT and surrounding regions
38 Final Report: Investigation into motor
vehicle petrol prices in the ACT
Figure 3.9 Distribution of prices in ACT and the Off Hume Highway comparative group, based on ACCC reports of quarterly averaged prices, December quarter 2014 to March quarter 2019
Source: ACCC quarterly reports on the Australian petroleum market, available at https://www.accc.gov.au/publications/quarterly-reports-on-the-australian-petroleum-industry, viewed 24 June 2019.
These figures show that the ACT price is relatively high but not necessarily or always
the highest compared with the three comparison groups. However, the ACT is
generally in the top half of the range. Each figure demonstrates the considerable
variability over time of both the general level and range of prices in each region.
While prices in Canberra are sometimes higher and sometimes lower than in the
surrounding regions, on average they are usually higher. This price difference
increased in late 2018, but has decreased in recent months.
The relatively high petrol price in Canberra may reflect a number of factors, including
higher wholesale costs, retail operating costs or the net retail margin. The next two
chapters examine petrol prices in more detail, as well as the reasons for price
differences between Canberra and comparison locations.
100
110
120
130
140
150
160D
ec 2
01
4
Mar
20
15
Jun
20
15
Sep
20
15
Dec
20
15
Mar
20
16
Jun
20
16
Sep
20
16
Dec
20
16
Mar
20
17
Jun
20
17
Sep
20
17
Dec
20
17
Mar
20
18
Ju
n 2
01
8
Sep
20
18
Dec
20
18
Mar
20
19
Qu
ater
ly a
vera
ge p
rice
(cp
l)
Off Hume Canberra

4 - Petrol prices in the ACT
Final Report: Investigation into motor
vehicle petrol prices in the ACT 39
4 Petrol prices in the ACT
Box 5 Summary of findings on petrol prices in the ACT
• Retail petrol prices in Canberra can be higher or lower than those in other capital cities
or the surrounding region on any given day. Comparisons of petrol prices on any given
day will be influenced by the timing of petrol price cycles (when comparisons are being
made between Canberra and cities with a price cycle) and differences in lags between
wholesale price changes flowing through to retail prices. Analysis of prices on a
monthly and annual average basis smooths out some of the daily fluctuations and allow
us to see the medium and longer term trends.
• Annual average petrol prices in the ACT were consistently higher than Sydney between
2012-13 and 2018-19 (on average by 8.4 cpl based on data to May 2019) and the price
difference has increased in each of the last three years to be 11.8 cpl higher in 2018-19
(based on data to May 2019). However, in May 2019, monthly average petrol prices in
Canberra were only 0.6 cpl higher than Sydney.
• Retail petrol prices in Canberra averaged around 1.7 cpl higher than in surrounding
towns between 2012-13 and 2018-19 (to May 2019). However, there can be substantial
variations in price differences between Canberra and these towns on any given day. The
price difference appeared to increase in the last six months of 2018 but has decreased
through 2019 to be 0.4 cpl in May 2019.
• ACT retail prices tend to follow movements of TGP with a lag of around two to three
weeks. Prices in the ACT appear to be ‘sticky’, increasing relatively quickly to their
peaks but decreasing more slowly from their peaks.
• Petrol prices in the ACT vary by brand: Costco and Metro have tended to be below
average, Coles Express above average and all others were priced close to the average in
the ACT.
• The gap between the average annual minimum and maximum prices in Canberra has
grown from 12.0 cpl in 2015-16 to 19.6 cpl in 2018-19 (to May 2019), which was
mainly driven by the pricing strategies adopted by Coles Express and Costco. This may
indicate a higher level of fluctuations in prices over time, and greater variation in prices
across sites.
• Petrol prices within the ACT vary by region. Retailers at the Airport offered annual
average petrol prices around 13.7 cpl below the ACT average in 2017-18, which largely
reflects the effect of Costco on competition in the area. The annual average price for
Fyshwick was 1.7 cpl below the ACT average in 2017-18. In all other regions of
Canberra, petrol prices were between 1 cpl to 2 cpl above the ACT annual average. This
pattern of results continued to hold for the first 11 months of 2018-19.
This chapter uses data from Informed Sources to examine the level of retail petrol
prices in the ACT and changes in prices over time. The chapter is structured as follows:
• Section 4.1 outlines the Commission’s approach and data used in this analysis
4 - Petrol prices in the ACT
40 Final Report: Investigation into motor
vehicle petrol prices in the ACT
• Section 4.2 demonstrates trends Canberra’s average daily retail prices
• Section 4.3 compares average monthly and annual petrol prices in Canberra with
Sydney and with regional towns
• Section 4.4 examines the lag between changes in the terminal gate price and the
retail petrol price across selected locations
• Section 4.5 looks at price differentials within the ACT by brand and by location
• Section 4.6 provides the concluding remarks.
4.1 Data and method of analysis
The Commission purchased daily retail petrol price data from Informed Sources for the
analysis in this chapter. This enabled a more in-depth investigation of the price trends
discussed in Chapter 2 which were based on publicly reported prices averaged over
varying periods.
The prices used here are for RULP unless otherwise noted. A discussion of E10 prices
is provided at section 4.3.
The prices used for the analysis do not take account of discount schemes (such as the
shopper docket discount arrangements of the supermarket chains, discount
arrangements between some major retailers and state motoring organisations, and
discounts associated with fuel cards). The Commission engaged ACIL Allen to assist
in analysing this data.
Unless otherwise stated, the prices for 2018-19 are for the first 11 months of the
financial year (up to the end of May 2019), as these were the latest available data when
the Informed Sources data set was purchased by the Commission.54 There are
limitations to the information published on the website in terms of the locations for
which prices are published and the time period for which data is available.
The Commission used this data to compare petrol retail petrol prices in Sydney and in
11 regional towns in proximity to the ACT between 2013-14 and 2018-19 (Chapter 3
compared retail petrol prices between Canberra and the other capital cities). The
regional towns are grouped into three categories:
1. Towns on the South Coast, which include Batemans Bay, Merimbula, and
Nowra.
2. Towns on the Hume Highway, which include Goulburn, Mittagong and Yass.
3. Inland towns not on the Hume Highway, which include Queanbeyan, Tumut,
Cooma, Temora, and Wagga Wagga.
54 The draft report was based on data up to March 2019. Some of the values reported in this final report
may therefore be different.

4 - Petrol prices in the ACT
Final Report: Investigation into motor
vehicle petrol prices in the ACT 41
As described in Chapter 3, this grouping was based on some common characteristics of
these towns. The towns on the South Coast are likely to experience a relatively high
volume of tourist traffic, particularly in summer. Service stations in towns on the
Hume Highway are likely to attract highway traffic. Inland towns not on the Hume
Highway may have relatively fewer tourists and/or highway traffic compared to towns
in the other two categories.
The data includes most, but not all, petrol retailers in and around the ACT. For
example, it includes 55 retail petrol sites in the ACT that operated between 2013-14
and 2018-19. Prices were not available for all retail sites for the entire period analysed.
Commission’s approach to analysing prices
Petrol prices can change on a daily basis and they typically vary between sites within a
single market. As such, different averaging periods for these prices provide different
information about the market. For instance, daily averages can show the extent to
which prices are volatile and the extent to which variations across locations may reflect
the timing of any price cycles (see section 2.4). Monthly and annual averages indicate
whether, and to what extent, differences in petrol prices are sustained over an extended
period and can be used, in conjunction with cost and other data, to identify the
underlying drivers of sustained price differences.
To understand the market dynamics, the Commission analysed daily, monthly and
annual data. This chapter begins by presenting daily average price data for the ACT,
demonstrating the recent history of prices in Canberra. When comparing Canberra with
other regions, the Commission examined monthly and annual prices averaged across
those regions. This has the advantage of highlighting medium- and long-term changes
over time, by smoothing out the daily price variations within those markets.
The Commission first examined average monthly prices from January 2013 to
May 2019 (the latest data available) to identify some of the complexity that motorists
may experience when comparing prices on a journey from one region to another. Then
this picture is simplified by comparing average annual prices from 2012-13 to 2018-19.
This provides an indication of sustained differences between markets (e.g. costs and
net margins, as discussed in Chapter 5) and longer-term trends.55
4.2 Changes in daily average retail petrol prices in Canberra
Figure 4.1 illustrates the daily retail petrol price averaged over the Canberra region for
approximately the past three years. Over this period the petrol price has gradually risen
from about 120 cpl to around 160 cpl before dropping back to between 140-150 cpl.
55 See for example ACCC, Petrol prices are not the same: report on petrol prices by major retailer in
2017, May 2018, p.24.

4 - Petrol prices in the ACT
42 Final Report: Investigation into motor
vehicle petrol prices in the ACT
During this period there were some price rises and falls but there are long periods
where the average daily price across the whole region is fairly stable.
Figure 4.1 Daily average retail petrol prices in Canberra, 23 May 2016 to 31 May 2019
Source: Based on retail price data from Informed Sources.
Figure 4.2 shows the daily average petrol prices over a similar period for different
regions within Canberra. These daily averages are more volatile than the whole of
Canberra average, but generally demonstrate the same overall pattern but with some
divergences in individual districts at times. In particular, distinct trends are apparent in
Fyshwick and at the Airport, with prices at the Airport, and to a lesser extent Fyshwick,
being more volatile than in other districts. The price differences within Canberra are
further examined in Section 4.5.
Figure 4.2 Daily average petrol prices in the ACT regions, 21 May 2016 to 31 May 2019
Note: Data for Weston Creek was not available.
Source: Based on retail price data from Informed Sources.
100
110
120
130
140
150
160
170
cpl
Average daily regular ULP in Canberra
100
110
120
130
140
150
160
170
180
Airport Belconnen Fyshwick Gungahlin
North Canberra South Canberra Tuggeranong Woden Valley
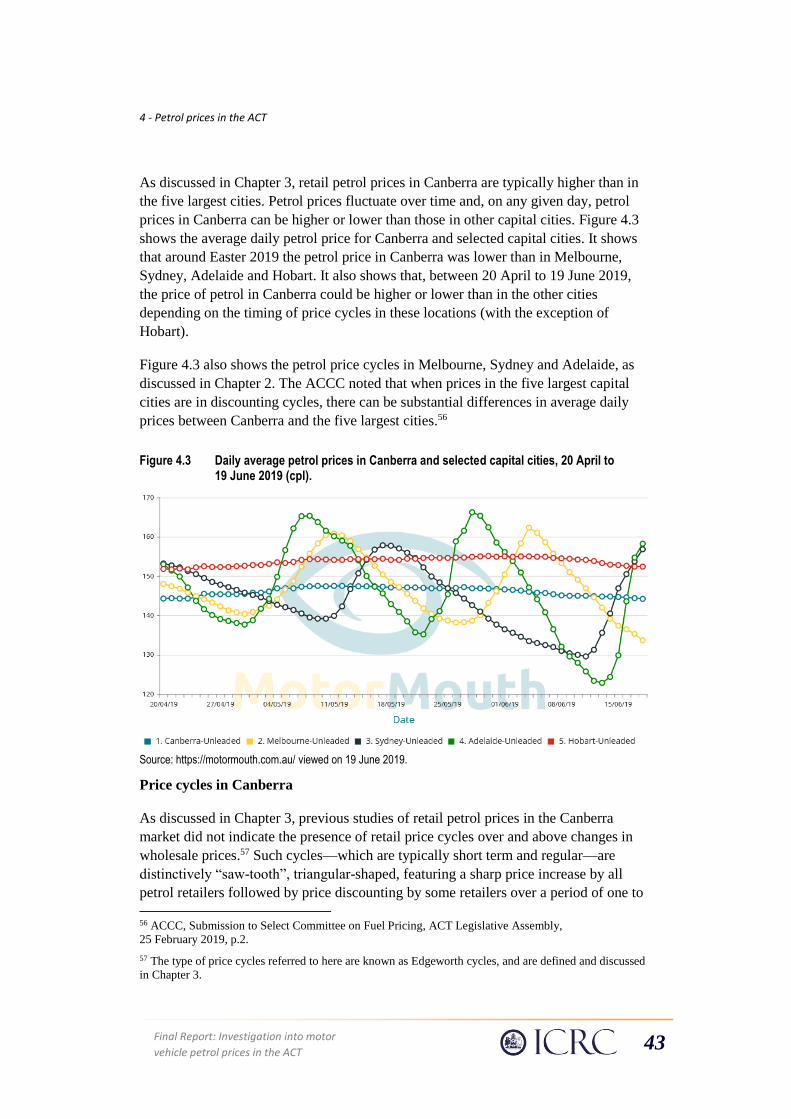
4 - Petrol prices in the ACT
Final Report: Investigation into motor
vehicle petrol prices in the ACT 43
As discussed in Chapter 3, retail petrol prices in Canberra are typically higher than in
the five largest cities. Petrol prices fluctuate over time and, on any given day, petrol
prices in Canberra can be higher or lower than those in other capital cities. Figure 4.3
shows the average daily petrol price for Canberra and selected capital cities. It shows
that around Easter 2019 the petrol price in Canberra was lower than in Melbourne,
Sydney, Adelaide and Hobart. It also shows that, between 20 April to 19 June 2019,
the price of petrol in Canberra could be higher or lower than in the other cities
depending on the timing of price cycles in these locations (with the exception of
Hobart).
Figure 4.3 also shows the petrol price cycles in Melbourne, Sydney and Adelaide, as
discussed in Chapter 2. The ACCC noted that when prices in the five largest capital
cities are in discounting cycles, there can be substantial differences in average daily
prices between Canberra and the five largest cities.56
Figure 4.3 Daily average petrol prices in Canberra and selected capital cities, 20 April to 19 June 2019 (cpl).
Source: https://motormouth.com.au/ viewed on 19 June 2019.
Price cycles in Canberra
As discussed in Chapter 3, previous studies of retail petrol prices in the Canberra
market did not indicate the presence of retail price cycles over and above changes in
wholesale prices.57 Such cycles—which are typically short term and regular—are
distinctively “saw-tooth”, triangular-shaped, featuring a sharp price increase by all
petrol retailers followed by price discounting by some retailers over a period of one to
56 ACCC, Submission to Select Committee on Fuel Pricing, ACT Legislative Assembly,
25 February 2019, p.2.
57 The type of price cycles referred to here are known as Edgeworth cycles, and are defined and discussed
in Chapter 3.

4 - Petrol prices in the ACT
44 Final Report: Investigation into motor
vehicle petrol prices in the ACT
several weeks (see Chapter 2). It can be seen from the daily price data in Figures 4.2
and 4.3 that the Canberra petrol market does not appear to have experienced such
cycles in recent history, nor has this market behaviour emerged in more recent data
(compared to the earlier data analysis discussed in Chapter 3). This was confirmed by
using statistical analysis to identify price cycles as defined by the ACCC.58
This finding is consistent with the ACCC’s submission to the Select Committee on
Fuel Pricing of ACT Legislative Assembly.59
While there does not appear to be regular price cycles for Canberra as a whole, the
Commission has found that there may be irregular price cycles in the Airport district,
although the frequency of these has declined in recent years. For example, between
October and December 2016 the daily average petrol price around the Airport changed
more frequently than prices in other regions (see Figure 4.2) and changed
independently of changes in the TGP (see Figure 4.4). This may reflect the higher level
of competition in this area. More recently, in 2018-19, price cycles appear to be less
frequent with fewer peaks and troughs being observed in the Airport district (see
Figure 4.5).
Figure 4.4 Daily average petrol prices in the Canberra Airport region and Sydney TGP, 3 October to 30 December 2016 (cpl)
Note: Prices are only for weekdays as Sydney TGPs are not available for weekends.
Source: Based on retail price data from Informed Sources.
58 ACCC, Petrol price cycles in Australia, December 2018.
59 Submission Number 12, Select Committee on Fuel Pricing, ACT Legislative Assembly,
25 February 2019, p.2.
100
105
110
115
120
125
cpl
Sydney TGP Canberra Airport

4 - Petrol prices in the ACT
Final Report: Investigation into motor
vehicle petrol prices in the ACT 45
Figure 4.5 Daily average petrol prices in the Canberra Airport region and Sydney TGP, 29 June 2018 to 14 May 19
Note: Prices are only for weekdays as Sydney TGPs are not available for weekends.
Source: Based on retail price data from Informed Sources.
4.3 Are petrol prices higher in the ACT?
In Chapter 3, the Commission examined price movements in monthly average petrol
prices of Canberra, Hobart, Darwin and the five largest Australian cities from January
to December 2018. Prices in Canberra were consistently higher than the five largest
cities, but Canberra prices were frequently lower than those in Darwin or Hobart.
This section first compares retail petrol prices in the ACT with prices in Sydney, then
with prices in towns along the South Coast, the Hume Highway, and towns not along
the Hume Highway.
Canberra prices compared to Sydney prices
Figure 4.6 compares monthly average petrol prices in Canberra and Sydney over the
period from January 2013 to May 2019.
110115120125130135140145150155160
cpl
Sydney TGP Canberra Airport

4 - Petrol prices in the ACT
46 Final Report: Investigation into motor
vehicle petrol prices in the ACT
Figure 4.6 Monthly average petrol prices in the ACT and Sydney, January 2013 to May 2019
Source: Based on retail price data from Informed Sources.
It shows that in general prices are higher in Canberra than in Sydney, being lower in
only two months in this entire period. There is a short but noticeable lag in price
movements between the Sydney and Canberra price. This is not to suggest any
relationship between retail prices in the two regions, rather that petrol retailers in
Sydney respond faster to wholesale price changes compared to Canberra (this lag is
examined further in section 4.4).
The size of the difference in prices between Canberra and Sydney varies significantly
at different points in time – it is only higher by a fraction of a cent per litre in some
months and 29.9 cpl higher in November 2018. On average over this period the
difference has been 8.4 cpl. The difference appears to have increased over the period
from November 2018 to March 2019 but decreased in April (1.6 cpl lower in Canberra)
and May 2019 (0.6 cpl higher in Canberra).
This large price difference in the last annual period is evident in Figure 4.7, which
shows the annual average prices, smoothing out the variations in Figure 4.6. Figure 4.7
shows that Canberra petrol prices are consistently higher than those in Sydney, on
average by 8.4 cpl, and this margin fluctuates over the long term as well as shorter
term, ranging from a low of 4.5 cpl in 2015-16 to a high of 11.8 cpl in 2018-19 (based
on data to May 2019).60
60 Prices in June 2019 will affect the average 2019-19 price difference and may bring it down if recent
price levels are sustained.
-5
0
5
10
15
20
25
30
35
90
100
110
120
130
140
150
160
170
Jan-
2013
Apr
-201
3
Jul-2
013
Oct
-201
3
Jan-
2014
Apr
-201
4
Jul-2
014
Oct
-201
4
Jan-
2015
Apr
-201
5
Jul-2
015
Oct
-201
5
Jan-
2016
Apr
-201
6
Jul-2
016
Oct
-201
6
Jan-
2017
Apr
-201
7
Jul-2
017
Oct
-201
7
Jan-
2018
Apr
-201
8
Jul-2
018
Oct
-201
8
Jan-
2019
Apr
-201
9
cpl
cpl
Difference (RHS) Sydney RULP (LHS) Canberra RULP (LHS)

4 - Petrol prices in the ACT
Final Report: Investigation into motor
vehicle petrol prices in the ACT 47
Figure 4.7 Annual average petrol prices in the ACT and Sydney, 2012-13 to 2018-19
Note: Data are partially available for 2012-13 and 2018-19 (based on data to May 2019).
Source: Based on retail price data from Informed Sources.
Canberra prices compared to prices in towns on the South Coast
Figure 4.8 looks at monthly average petrol prices in Canberra and South Coast towns
over the period from January 2013 to May 2019. In contrast to the comparison with
Sydney, it shows much more volatility in the monthly price difference, ranging
between extremes of 6.7 cpl lower in August 2015 and 16.6 cpl higher in January 2019,
with around 40 per cent of months with lower prices in Canberra across the whole
period. The net result is that petrol prices averaged 2.3 cpl higher in Canberra over this
period. Since October 2017, petrol prices have become consistently higher in Canberra
than in the South Coast region, averaging 7.3 cpl higher between October 2017 and
May 2019.
There are distinct periods when Canberra prices were lower than the South Coast
region – average 1.5 cpl lower between January and October 2014; average 4.5 cpl
lower between July and November 2015; and average 1.6 cpl lower between
October 2016 and February 2017.
In contrast to the monthly comparison with Sydney, prices in Canberra and the South
Coast region appear to move in broadly similar patterns. For example, prices in both
regions peaked around the same time (October 2018) before declining to their troughs
in early 2019.
9.5
7.78.4
4.5
8.28.8
11.8
0
2
4
6
8
10
12
14
90
100
110
120
130
140
150
160
170
2012-13 2013-14 2014-15 2015-16 2016-17 2017-18 2018-19
cpl
cpl
Difference (RHS) Sydney RULP (LHS) Canberra RULP (LHS)

4 - Petrol prices in the ACT
48 Final Report: Investigation into motor
vehicle petrol prices in the ACT
Figure 4.8 Monthly average petrol prices in the ACT and South Coast towns, January 2013 to May 2019 (cpl)
Note: The difference is on the right-hand axis.
Source: Based on retail price data from Informed Sources.
Figure 4.9 presents the annual average prices between the two regions for this period.
Like Figure 4.8, this figure shows sustained periods where the price on the South Coast
was lower than that in Canberra. While accurately portraying annual averages, the
negative figures in Figure 4.9 do not reveal the significantly lower price differentials
during the three periods identified above (that is, January to October 2014; July to
November 2015, and October 2016 to February 2017).
As with the comparison with Sydney, Figure 4.9 indicates a significant increase in the
price difference between Canberra and towns in the South Coast in the last two years
(6.1 cpl in 2017-18 and 8.0 cpl in 2018-19, based on data to May 2019). The increased
price difference for 2018-19 was mainly due to the high price difference during the
three months from December 2018 to February 2019 (as indicated in Figure 4.6).
Figure 4.9 Annual average petrol prices in the ACT and South Coast towns, 2012-13 to 2018-19 (cpl)
Note: Data are partially available for 2012-13 and 2018-19.
-10
-5
0
5
10
15
20
90
100
110
120
130
140
150
160
170Ja
n-20
13
Apr
-201
3
Jul-2
013
Oct
-201
3
Jan-
2014
Apr
-201
4
Jul-2
014
Oct
-201
4
Jan-
2015
Apr
-201
5
Jul-2
015
Oct
-201
5
Jan-
2016
Apr
-201
6
Jul-2
016
Oct
-201
6
Jan-
2017
Apr
-201
7
Jul-2
017
Oct
-201
7
Jan-
2018
Apr
-201
8
Jul-2
018
Oct
-201
8
Jan-
2019
Apr
-201
9
cpl
cpl
Difference (RHS) South Coast towns average RULP (LHS)
ACT average RULP (LHS)
1.7
0.1 0.1
1.2
0.3
5.1
8.0
0
1
2
3
4
5
6
7
8
9
90
100
110
120
130
140
150
160
170
2012-13 2013-14 2014-15 2015-16 2016-17 2017-18 2018-19
cpl
cpl
Difference (RHS) South Coast towns average RULP (LHS) ACT average RULP (LHS)
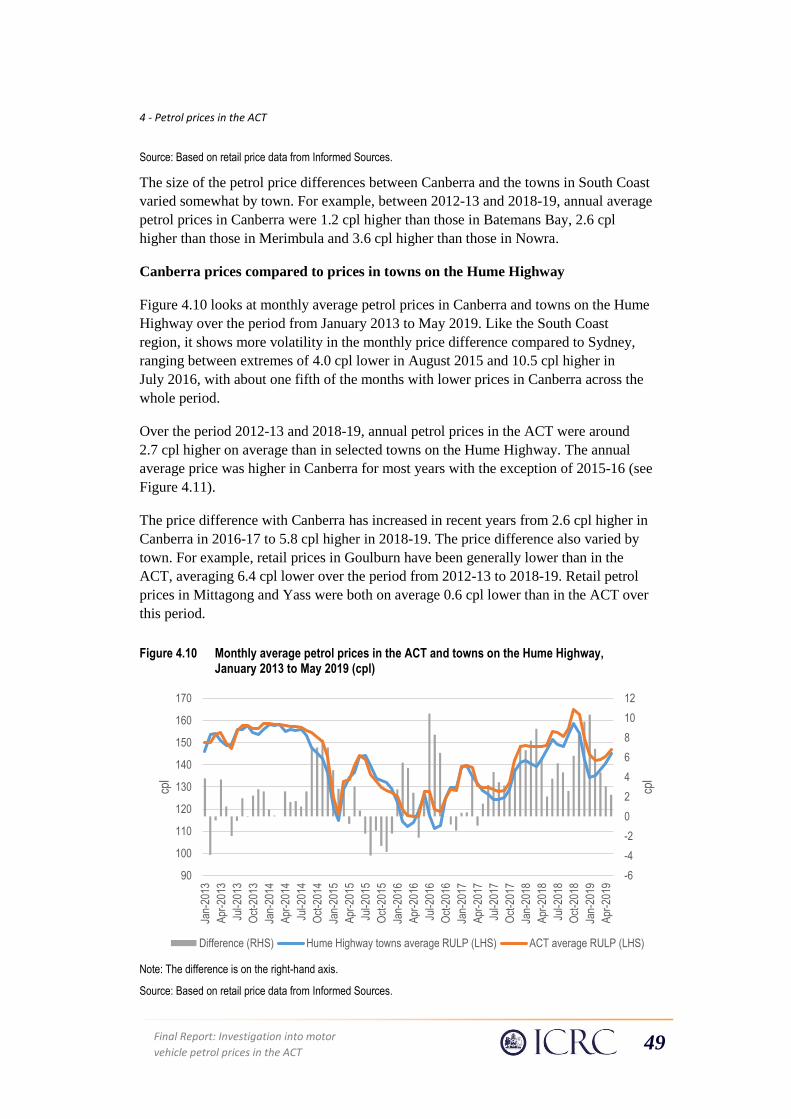
4 - Petrol prices in the ACT
Final Report: Investigation into motor
vehicle petrol prices in the ACT 49
Source: Based on retail price data from Informed Sources.
The size of the petrol price differences between Canberra and the towns in South Coast
varied somewhat by town. For example, between 2012-13 and 2018-19, annual average
petrol prices in Canberra were 1.2 cpl higher than those in Batemans Bay, 2.6 cpl
higher than those in Merimbula and 3.6 cpl higher than those in Nowra.
Canberra prices compared to prices in towns on the Hume Highway
Figure 4.10 looks at monthly average petrol prices in Canberra and towns on the Hume
Highway over the period from January 2013 to May 2019. Like the South Coast
region, it shows more volatility in the monthly price difference compared to Sydney,
ranging between extremes of 4.0 cpl lower in August 2015 and 10.5 cpl higher in
July 2016, with about one fifth of the months with lower prices in Canberra across the
whole period.
Over the period 2012-13 and 2018-19, annual petrol prices in the ACT were around
2.7 cpl higher on average than in selected towns on the Hume Highway. The annual
average price was higher in Canberra for most years with the exception of 2015-16 (see
Figure 4.11).
The price difference with Canberra has increased in recent years from 2.6 cpl higher in
Canberra in 2016-17 to 5.8 cpl higher in 2018-19. The price difference also varied by
town. For example, retail prices in Goulburn have been generally lower than in the
ACT, averaging 6.4 cpl lower over the period from 2012-13 to 2018-19. Retail petrol
prices in Mittagong and Yass were both on average 0.6 cpl lower than in the ACT over
this period.
Figure 4.10 Monthly average petrol prices in the ACT and towns on the Hume Highway, January 2013 to May 2019 (cpl)
Note: The difference is on the right-hand axis.
Source: Based on retail price data from Informed Sources.
-6
-4
-2
0
2
4
6
8
10
12
90
100
110
120
130
140
150
160
170
Jan-
2013
Apr
-201
3
Jul-2
013
Oct
-201
3
Jan-
2014
Apr
-201
4
Jul-2
014
Oct
-201
4
Jan-
2015
Apr
-201
5
Jul-2
015
Oct
-201
5
Jan-
2016
Apr
-201
6
Jul-2
016
Oct
-201
6
Jan-
2017
Apr
-201
7
Jul-2
017
Oct
-201
7
Jan-
2018
Apr
-201
8
Jul-2
018
Oct
-201
8
Jan-
2019
Apr
-201
9
cpl
cpl
Difference (RHS) Hume Highway towns average RULP (LHS) ACT average RULP (LHS)

4 - Petrol prices in the ACT
50 Final Report: Investigation into motor
vehicle petrol prices in the ACT
Figure 4.11 Annual average petrol prices in the ACT and towns on Hume Highway, 2012-13 to 2018-19 (cpl)
Note: Data is partially available for 2012-13 and 2018-19.
Source: Based on retail price data from Informed Sources.
Canberra prices compared to prices in inland towns not on the Hume Highway
Figure 4.12 looks at monthly average petrol prices in Canberra and towns not on the
Hume Highway over the period from January 2013 to May 2019. Unlike the other
regions, for a long period historically prices were lower in Canberra compared to these
towns with 58 per cent of the months with lower prices across the whole period. The
price differences (shown as the grey bars) range from 10.8 cpl in March 2018 (where
Canberra prices are above the comparison region) to -8.8 cpl in February 2015 (where
Canberra prices were below the comparison region), although this low is clearly an
outlier for the period shown. The net result is that petrol prices averaged 0.3 cpl higher
in Canberra over the whole period (or 2.0 cpl lower for the period up to June 2016 and
2.9 cpl higher since then).
0.4
1.3
3.8
0.0
2.6
5.15.8
-1
0
1
2
3
4
5
6
7
90
100
110
120
130
140
150
160
170
2012-13 2013-14 2014-15 2015-16 2016-17 2017-18 2018-19
cpl
cpl
Difference (RHS) Hume Highway towns average RULP (LHS) ACT average RULP (LHS)

4 - Petrol prices in the ACT
Final Report: Investigation into motor
vehicle petrol prices in the ACT 51
Figure 4.12 Monthly average petrol prices in the ACT and towns not on the Hume Highway, January 2013 to May 2019
Note: The difference is on the right-hand axis.
Source: Based on retail price data from Informed Sources.
Similar observations can be made from a comparison of annual petrol prices in Figure
4.13 because of the relatively long periods of consistent price differences – the average
petrol prices in the region were slightly higher than in the ACT before 2015-16 and
since then have been around 3 cpl to 4 cpl lower than Canberra prices.
For example, annual petrol prices in Queanbeyan were on average 1.7 cpl lower than
those in the ACT in 2012-13. In 2017-18, this price differential increased with the
annual average price in Queanbeyan being 6 cpl cheaper. Similar to Queanbeyan,
annual average prices in Temora have been lower than in Canberra in recent years with
the price difference ranging from 1.6 cpl in 2014-15 to 6.1 cpl in 2017-18.
In Wagga Wagga, annual petrol prices were on average 1 cpl to 2.3 cpl higher than in
Canberra until 2014-15. However, prices in Wagga Wagga have since become lower
with annual average prices being around 8.7 cpl lower than in Canberra in 2018-19.
Chapter 5 examines the factors that may have influenced these petrol price
differentials.
-10
-5
0
5
10
15
90
100
110
120
130
140
150
160
170Ja
n-20
13
Apr
-201
3
Jul-2
013
Oct
-201
3
Jan-
2014
Apr
-201
4
Jul-2
014
Oct
-201
4
Jan-
2015
Apr
-201
5
Jul-2
015
Oct
-201
5
Jan-
2016
Apr
-201
6
Jul-2
016
Oct
-201
6
Jan-
2017
Apr
-201
7
Jul-2
017
Oct
-201
7
Jan-
2018
Apr
-201
8
Jul-2
018
Oct
-201
8
Jan-
2019
Apr
-201
9
cpl
cpl
Difference (RHS) Inland towns average RULP (LHS) ACT average RULP (LHS)

4 - Petrol prices in the ACT
52 Final Report: Investigation into motor
vehicle petrol prices in the ACT
Figure 4.13 Annual average petrol prices in the ACT and inland towns, 2012 13 to 2018 19 (cpl)
Note: Data are partially available for 2012-13 and 2018-19. The difference is on the right-hand axis.
Source: Based on retail price data from Informed Sources.
The Commission focused on regular unleaded petrol prices but expects similar
results to hold for other fuel types such as E10
The Commission focused the investigation on RULP because (a) this is the most the
commonly sold fuel in Canberra and (b) it expects that the same pattern of results to
hold for other fuel types such as E10. This is because the price difference between
RULP and E10 is largely the same for the ACT and comparison locations.
Figure 4.14 shows the difference between RULP and E10 monthly average prices for
both Canberra and Sydney between January 2013 and March 2019. Over this period, in
both Canberra and Sydney, monthly average prices for RULP have been consistently
higher than for E10 (on average by 1.6 cpl in Canberra and by 1.7 cpl in Sydney). The
slightly higher difference between RULP and E10 prices in Sydney may be driven by
the ethanol mandate in NSW (discussed in Chapter 5). According to the ACCC, the
ethanol mandate has led to changes in the supply of petrol sold in NSW.61
The difference between E10 and RULP prices increased in Sydney relative to Canberra
in late 2014 and late 2015. This may also be related to the ethanol mandate. As
discussed in Chapter 5, there is evidence to suggest that retail operating costs in NSW
have increased relative to those in the ACT since 2014-15, coinciding with the
introduction of the NSW ethanol mandate.
61 ACCC 2016, Report on the Armidale Petrol Market, p.19.
-2.4-1.9
-2.3
-1.3
0.7
4.4
3.7
-3
-2
-1
0
1
2
3
4
5
90
100
110
120
130
140
150
160
170
2012-13 2013-14 2014-15 2015-16 2016-17 2017-18 2018-19
cpl
cpl
Difference (RHS) Inland towns average RULP (LHS) ACT average RULP (LHS)

4 - Petrol prices in the ACT
Final Report: Investigation into motor
vehicle petrol prices in the ACT 53
Figure 4.14 Difference between RULP and E10 monthly average prices in Canberra and Sydney, January 2013 to March 2019 (cpl)
Source: Based on retail price data from Informed Sources.
4.4 Lag between retail price and terminal gate price across selected locations
As discussed in Chapter 2, retail petrol prices generally follow wholesale prices with a
lag. Lags refer to the amount of time it takes for movements in wholesale prices to be
reflected in retail petrol prices.62 Lags may reflect the difference in the sales volumes
and thus longer (or shorter) stock holding duration of different sites (that is, retail
prices may be “sticky” if market conditions allow retailers to set prices to reflect the
wholesale cost of the last fuel delivery). They may also reflect the level of competition
in a particular market. In a less competitive market, retailers may keep their prices
unchanged for as long as possible and avoid adjusting prices until there is pressure
from competition, resulting in a longer time period between an increase in wholesale
prices being widely reflected in retail prices.
The ACT’s daily average petrol prices and Sydney TGP are shown in Figure 4.15.63
62 Submission 14, Select Committee on Fuel Pricing, ACT Legislative Assembly, 25 February 2019, p.22.
63 As petrol sold in the ACT is mainly transported from terminals in Sydney, the TGP in Sydney was used
as the indicative wholesale price for Canberra.
0.0
0.5
1.0
1.5
2.0
2.5
3.0
3.5Ja
n-2
01
3
Ap
r-2
01
3
Jul-
20
13
Oct
-20
13
Jan
-20
14
Ap
r-2
01
4
Jul-
20
14
Oct
-20
14
Jan
-20
15
Ap
r-2
01
5
Jul-
20
15
Oct
-20
15
Jan
-20
16
Ap
r-2
01
6
Jul-
20
16
Oct
-20
16
Jan
-20
17
Ap
r-2
01
7
Jul-
20
17
Oct
-20
17
Jan
-20
18
Ap
r-2
01
8
Jul-
20
18
Oct
-20
18
Jan
-20
19
Ap
r-2
01
9
cpl
Canberra Sydney

4 - Petrol prices in the ACT
54 Final Report: Investigation into motor
vehicle petrol prices in the ACT
Figure 4.15 Daily average retail petrol prices in Canberra and daily average Sydney TGP, 23 May 2016 to 31 May 2019 (cpl)
Note: The difference is by definition the Gross Indicative Retail Difference (see Chapter 2).
Source: Based on retail price data from AIP and Informed Sources.
Average retail prices in Canberra tend to follow the TGP with a lag. The lag is
estimated to range from around two to three weeks.64 A study by the Australian
Institute of Petroleum in 2015 also estimated the lag between Sydney TGP and retail
petrol prices in Canberra to be around 23 days.65 The duration of the lag may vary over
time, which reflects the difference in retailers’ pricing strategies and stock holding
duration and local competition. In addition, retail petrol prices in the ACT appear to
increase relatively quickly to their peaks but decrease from their peaks more slowly
than the Sydney TGP.
The gap between the Sydney TGP and the average retail price in Canberra has
narrowed in recent months, averaging 10.7 cpl between mid-March and May 2019
compared to 27.5 cpl during the period from October 2018 to mid-March 2019.
4.5 Price differentials within the ACT
Petrol prices in the ACT vary by brand and region, reflecting different business
models, ownership structures, retail operating costs and the level of competition in a
particular area. This section focuses on price differentials by brand and by region. The
Commission analysed daily and monthly average prices for 54 of the 58 petrol sites66
64 Informed Sources, Submission 14, Select Committee on Fuel Pricing, ACT Legislative Assembly,
25 February 2019, p.5.
65 Australian Institute of Petroleum, Submission 21, Select Committee on Fuel Pricing, ACT Legislative
Assembly, 26 March 2019, p.21
66 Data were not available for four sites.
0
20
40
60
80
100
120
140
160
180
cpl
Difference Average daily regular RULP in Canberra
Average daily RULP TGP in Sydney
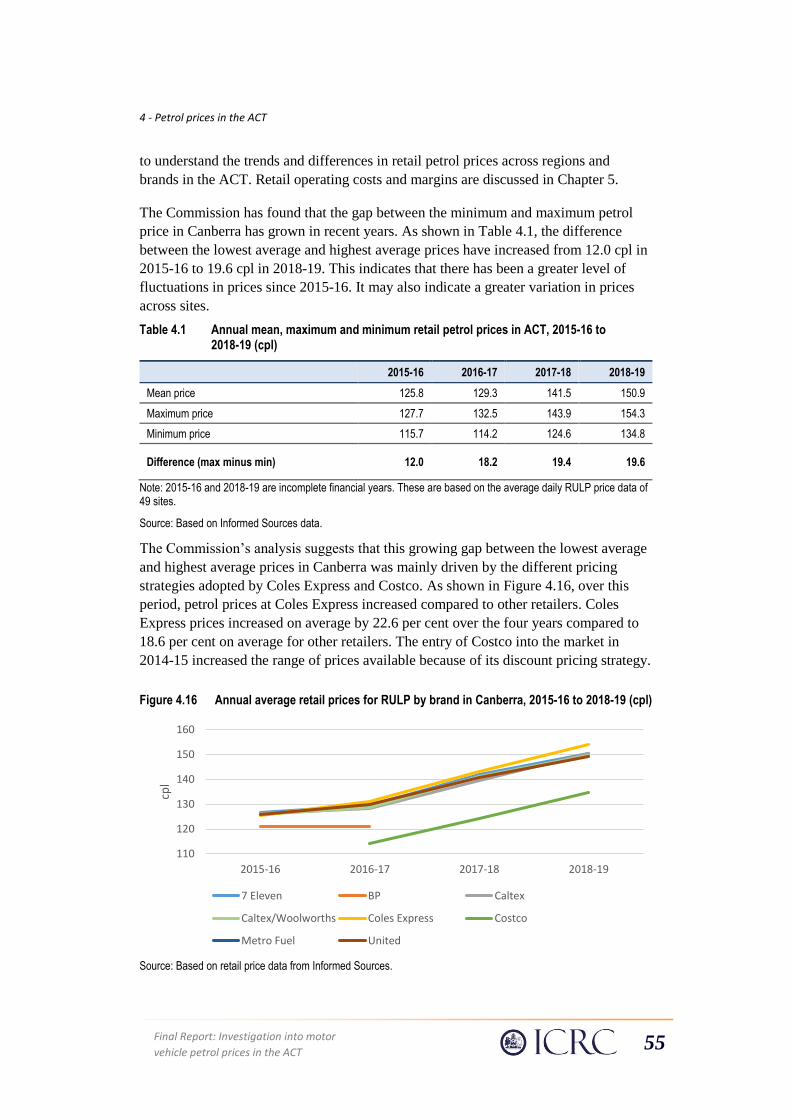
4 - Petrol prices in the ACT
Final Report: Investigation into motor
vehicle petrol prices in the ACT 55
to understand the trends and differences in retail petrol prices across regions and
brands in the ACT. Retail operating costs and margins are discussed in Chapter 5.
The Commission has found that the gap between the minimum and maximum petrol
price in Canberra has grown in recent years. As shown in Table 4.1, the difference
between the lowest average and highest average prices have increased from 12.0 cpl in
2015-16 to 19.6 cpl in 2018-19. This indicates that there has been a greater level of
fluctuations in prices since 2015-16. It may also indicate a greater variation in prices
across sites.
Table 4.1 Annual mean, maximum and minimum retail petrol prices in ACT, 2015-16 to 2018-19 (cpl)
2015-16 2016-17 2017-18 2018-19
Mean price 125.8 129.3 141.5 150.9
Maximum price 127.7 132.5 143.9 154.3
Minimum price 115.7 114.2 124.6 134.8
Difference (max minus min) 12.0 18.2 19.4 19.6
Note: 2015-16 and 2018-19 are incomplete financial years. These are based on the average daily RULP price data of 49 sites.
Source: Based on Informed Sources data.
The Commission’s analysis suggests that this growing gap between the lowest average
and highest average prices in Canberra was mainly driven by the different pricing
strategies adopted by Coles Express and Costco. As shown in Figure 4.16, over this
period, petrol prices at Coles Express increased compared to other retailers. Coles
Express prices increased on average by 22.6 per cent over the four years compared to
18.6 per cent on average for other retailers. The entry of Costco into the market in
2014-15 increased the range of prices available because of its discount pricing strategy.
Figure 4.16 Annual average retail prices for RULP by brand in Canberra, 2015-16 to 2018-19 (cpl)
Source: Based on retail price data from Informed Sources.
110
120
130
140
150
160
2015-16 2016-17 2017-18 2018-19
cpl
7 Eleven BP Caltex
Caltex/Woolworths Coles Express Costco
Metro Fuel United

4 - Petrol prices in the ACT
56 Final Report: Investigation into motor
vehicle petrol prices in the ACT
Price differentials by brand
Petrol prices in the ACT vary by brand, reflecting different business models and
ownership structures. Figure 4.17 shows the annual average petrol price discount to, or
premium on, the ACT market average, by retail brand, between May 2016 and May
2019.
Figure 4.17 Annual average difference between brand price and the market average price, 2015-16 to 2018-2019 (cpl)
Note: Data is partially available for 2016 and 2019. Data is not available for all sites or time periods.
Source: Based on retail price data from Informed Sources.
While a particular retailer may have a monthly or annual average price above the
market average price, its daily prices may be below or above the market daily average
on a particular day.
Petrol retailers Costco and Metro were on average found to price below the market
average. Costco typically had the biggest discount compared to the market average,
with petrol prices averaging 16.0 cpl below the market average between 2016 and 2019
(based on data to May 2019). The discount offered by Metro averaged 13.7 cpl in
2018-19 (based on data to May 2019).
Petrol prices at Coles Express sites in Canberra were on average 3.3 cpl above the ACT
market average in 2018-19. The ACAPMA submitted to the ACT Legislative
Assembly Select Committee on Fuel Pricing that the significant share of Coles Express
in the ACT market has resulted in prices in Canberra on average being higher than they
might otherwise have been during 2018.67 The ACCC found that prices at Coles
67 Submission Number 17, Select Committee on Fuel Pricing, ACT Legislative Assembly,
25 February 2019, p.18.
-20.00 -15.00 -10.00 -5.00 0.00 5.00
7 Eleven
BP
Caltex
Caltex/Woolworths
Coles Express
Costco
Metro Fuel
United
cpl
2018-19 2017-18 2016-17 2015-16

4 - Petrol prices in the ACT
Final Report: Investigation into motor
vehicle petrol prices in the ACT 57
Express were on average the highest among all major retailers in each of the five
largest capital cities in 2017.68
As discussed in Chapter 2, Viva Energy has been setting prices at Coles Express sites
since March 2019 and has indicated that it intends to offer a more competitive fuel
price. There is early evidence that the gap between prices at Coles Express sites and
other sites has narrowed in recent months (see Figure 4.18). As Coles Express accounts
for the largest share (15 of 58 sites) among all brands in Canberra’s retail petrol
market, this might have contributed to lower Canberra average retail prices in April
and May 2019.
Figure 4.18 Monthly average prices for selected brands, January 2018 to May 2019 (cpl)
All other brands were priced close to the market average (except BP for which there
are only two years of data due to limitations in the Informed Sources dataset).
Price differentials by region
Figure 4.19 shows the price differences in the petrol stations located across the ACT.
68 ACCC, Submission to Select Committee on Fuel Pricing, ACT Legislative Assembly,
25 February 2019, p.3.
135
140
145
150
155
160
165
170
cpl
7 Eleven Caltex Caltex/Woolworths Coles Express United

4 - Petrol prices in the ACT
58 Final Report: Investigation into motor
vehicle petrol prices in the ACT
Figure 4.19 Annual average difference between prices in ACT districts and the market average price, 2015-16 to 2018-19 (cpl)
Note: 2016 and 2019 are incomplete years. Data for Weston Creek was not included due to confidentiality reasons.
Source: Based on retail price data from Informed Sources.
The Commission has found that petrol retailers near the Airport and in Fyshwick
typically offer petrol at prices below that of other regions. For example, the annual
average petrol price for the Airport region was around 13.7 cpl below the ACT market
average in 2017-18, while that for Fyshwick was 1.7 cpl below (Figure 4.19). The
petrol price discount at Airport sites is largely constant across months (Figure 4.20).
The discount offered by sites in Fyshwick was more variable over the period examined
compared with retailers in the Airport region. For example, the discount in this region
was 3.6 cpl in 2017-18 but decreased to 0.8 cpl in the first 11 months of 2018-19.
The price discount at the Airport and in Fyshwick largely reflects the presence of
discount retailer Costco and the effect it has on competition in the area. In all other
districts of Canberra, petrol prices were between 1 cpl to 2 cpl higher than the market
average in 2017-18. This pattern of results continued to hold for the first 11 months of
2018-19.
-16.00 -14.00 -12.00 -10.00 -8.00 -6.00 -4.00 -2.00 0.00 2.00 4.00
Airport
Belconnen
Fyshwick
Gungahlin
North Canberra
South Canberra
Tuggeranong
Woden Valley
cpl
2018-19 2017-18 2016-17 2015-16

4 - Petrol prices in the ACT
Final Report: Investigation into motor
vehicle petrol prices in the ACT 59
Figure 4.20 Monthly average petrol prices in the ACT by region, May 2016 to March 2019 (cpl)
Note: Data for Weston Creek was not included due to confidentiality reasons.
Source: Based on retail price data from Informed Sources.
4.6 Concluding remarks
Retail petrol prices in Canberra can be higher or lower than those in other capital cities
or the surrounding region on any given day. Comparisons of petrol prices on any given
day will be influenced by the timing of petrol price cycles (when comparisons are
being made between Canberra and cities with a price cycle) and differences in lags in
the flow-through of wholesale price changes into retail prices.
Analysis of prices on a monthly and annual average basis smooth out some of the daily
fluctuations and allow us to see the medium and longer term trends. Looking at annual
price differences with Sydney, prices in the ACT have been consistently higher (by
8.4 cpl) in the past 7 years, and the price difference has increased in each of the last
three years to be 11.8 cpl higher in 2018-19 (to May 2019).
The gap between the average annual minimum and maximum prices in Canberra has
grown from 12.0 cpl in 2015-16 to 19.6 cpl in 2018-19. This may indicate a higher
level of fluctuations in prices over time, and greater variation in prices across sites.
This growing gap between the lowest average and highest average prices in Canberra
was mainly driven by the pricing strategies adopted by Coles Express and Costco.
Petrol prices in the ACT vary by brand: Costco and Metro have tended to be below
average, Coles Express above average and all others were priced close to the average
in the ACT. Prices also varied by region. For example, retailers at the Airport offered
annual average petrol prices around 13.7 cpl below the ACT average in 2017-18,
which largely reflects the effect of the presence of Costco on competition in the area.
The annual average price for Fyshwick was 1.7 cpl below the ACT average in 2017-18.
In all other regions of Canberra, petrol prices were between 1 cpl to 2 cpl above the
100
110
120
130
140
150
160
170
cpl
Airport Belconnen Fyshwick Gungahlin
North Canberra South Canberra Tuggeranong Woden Valley

4 - Petrol prices in the ACT
60 Final Report: Investigation into motor
vehicle petrol prices in the ACT
ACT annual average. This pattern of results continued to hold for the first 11 months of
2018-19.
Differences in the retail petrol price across districts of Canberra and between Canberra
and other cities and the surrounding region may reflect differences in wholesale petrol
costs, fuel delivery and transport costs, retail operating costs and the net retail margin
(the profit margin of the retailer). The next chapter examines these cost components for
retailers in Canberra, Sydney and the towns around Canberra.

5 - Petrol retailer costs and margins
Final Report: Investigation into motor
vehicle petrol prices in the ACT 61
5 Petrol retailer costs and margins
Box 6 Summary of findings on petrol retailer costs and net margins
• The Commission gathered data on petrol retailer costs and net margins from businesses
operating in Canberra and nearby locations under section 41 of the ICRC Act. This data is
not available from any other source and provides a more comprehensive basis for analysis
than is possible using publicly available information.
• In 2017-18, Canberra’s retail petrol price was, on average, 4.9 cpl higher than the regional
comparison locations (for the sample of petrol retailers examined). Around two thirds of
this difference was due to a higher average net retail margin in Canberra with the rest
largely due to higher wholesale petrol costs. The net retail margin is the profit margin of
the retailer.
• Canberra’s higher average net retail margin likely reflects weaker competition in
Canberra. Canberra’s higher wholesale petrol costs likely reflects uncompetitive supply
contracts of petrol retailers in Canberra with a high market share, particularly the former
agreement between Coles Express and Viva Energy.
• Canberra service stations typically make larger profits than those in the regional
comparison locations, in part due to a higher volume of fuel sold in Canberra and, in
recent years, an increase in the net retail margin. However, there is significant variation
among retailers in profitability.
• In 2017-18, retail operating costs (on a cent per litre basis) were lower in Canberra than
the surrounding regions. This reflects higher fuel sales volumes per site in Canberra,
which reduces fixed operating costs (such as rent payments) on a cent per litre basis.
• Petrol retailers in North Canberra have the highest operating costs per litre, largely
reflecting higher rent payments. Retailers in Fyshwick and around the Airport have the
lowest net margins, reflecting a higher level of competition in this district.
• In 2014-15 (the latest year for which data is available on petrol retailers in Sydney), the
average retail petrol price in Canberra was around 7 cpl higher than in Sydney. This was
due to higher transport costs (around 1 cpl), retail operating costs (4 cpl) and a higher net
retail margin (1 cpl).
• The higher net retail margin in Canberra appears to reflect relatively lower levels of
competition in Canberra compared to Sydney and the surrounding towns. This is due to
Canberra having a more concentrated retail petrol market, with a higher proportion of
retailers with business models of offering a premium product and a lower number of
independent retailers with a business strategy to aggressively discount. It also likely
reflects the relatively poor visibility of many petrol stations in Canberra, which makes it
difficult for consumers to compare competing retailers’ prices.

5 - Petrol retailer costs and margins
62 Final Report: Investigation into motor
vehicle petrol prices in the ACT
The focus of this chapter is to compare average petrol retailer costs and net margins in
Canberra with those in Sydney, nationally, and the regional comparison locations
discussed in Chapter 3. The chapter also compares petrol retailer costs and net margins
between the districts of Canberra. As discussed in Chapter 2, the price of petrol
depends on a number of factors including wholesale petrol costs (including net
wholesale margins), transport costs, retail operating costs,69 and net retail margins (the
profit margin of the retailer).
Section 5.1 discusses the data gathered by the Commission for this analysis.
Section 5.2 compares petrol retail operating costs and margins in Canberra to those in
Sydney and Australia as a whole. It also discusses factors affecting differences in the
costs and margins between these locations. Section 5.3 compares costs and margins
between Canberra and the regional comparison locations. Section 5.4 examines
whether there are differences in the retail petrol market across the districts of Canberra.
Section 5.5 summarises the findings.
5.1 Data gathered by the Commission
The Commission gathered commercially confidential data on petrol retailer annual
costs and margins from businesses operating in Canberra and nearby locations under
section 41 of the ICRC Act, as explained in Chapter 1. This data set is not available
from any other source and provides a more comprehensive basis for analysis than is
possible using publicly available information. The data set includes annual petrol
retailer operating costs, the net retail margin and the volume of fuel sold by site. Using
publicly available information, it is only possible to observe the GIRD, which is the
difference between the TGP and the retail petrol price (as discussed in Chapter 2).
While the GIRD is typically referred to as the “retail margin”, it includes both
operating costs and the retailer’s profit margin. It is not possible using publicly
available information to disaggregate the GIRD into retail operating costs or the net
retail margin.
This final report is based on more complete data than the draft report. At the time of
the draft report the Commission was yet to obtain data from a number of independent
sites. These sites represented around 10 per cent of the ACT petrol market (in fuel sales
volume terms). The Commission has since received the data from around half of these
independent petrol retailers.
The Commission engaged ACIL Allen to assist with analysing the data set.
For confidentiality reasons, the Commission has aggregated data collected for
individual petrol sites as this information is commercially sensitive.
69 As explained in Chapter 2, retail operating costs refer to the costs of operating the retail business
(excluding fuel purchases). These include costs relating to rent, electricity, wages, depreciation and
repairs.

5 - Petrol retailer costs and margins
Final Report: Investigation into motor
vehicle petrol prices in the ACT 63
The data presented in this chapter are annual averages. As such, they do not show
variations in costs and margins that occur over shorter periods of time. The data
obtained by the Commission is for the period from 2012-13 to 2017-18, which is the
latest year for which profit and loss data for petrol retailers is available.
Some caution should be exercised when comparing petrol retail costs and margins
between the ACT and NSW. The markets may have differences given that RULP
accounts for a higher share of motor vehicle fuel in the ACT than in NSW, likely
reflecting the ethanol mandate in NSW (discussed below). The data presented in this
chapter focuses on RULP.
Figure 5.1 shows the number of petrol retailers in Canberra and the regional
comparison locations for which the Commission obtained data. The number of sites in
the sample for Canberra increased from 41 in 2012-13 to 53 in 2017-18. The number of
sites in the regional comparison locations increased from 33 in 2012-13 to 52 in
2017-18. As new sites were added to the sample over time, the characteristics of the
total sample (such as profits and volume of fuel sold) is likely to have changed over
time, reflecting differences in ownership structure, business models and business
strategies of the new sites compared to the existing sites. It is important to note also
that retailers operating sites in 2012-13 that are no longer operating in Canberra or the
comparison locations in 2017-18 are not included in the sample for the data set. The
Commission was only able to obtain information for retailers that are currently
operating sites in Canberra and/or the comparison locations.
Therefore, changes in the costs and net margins over time reported in this section will
reflect a change in the composition of the sample, as well as changes in industry costs
and margins that have occurred over this period.
Figure 5.1 Number of petrol stations in Canberra and the regional comparison locations for which the Commission has gathered data for this report
Source: Based on data from a sample of petrol retailers.
0
10
20
30
40
50
60
2012-13 2013-14 2014-15 2015-16 2016-17 2017-18
Nu
mb
er o
f si
tes
Canberra Total for regional comparison locations
Towns on the Hume Highway Inland towns not on the Hume Highway
South Coast towns

5 - Petrol retailer costs and margins
64 Final Report: Investigation into motor
vehicle petrol prices in the ACT
Figure 5.2 shows the ownership structure of the petrol retailers for which the
Commission has gathered data. It is similar to the ownership structure for the ACT
described in Chapter 3.
Figure 5.2 Ownership of retail petrol sites in 2017-18 for which the Commission has gathered data for the report (per cent)
Source: Based on data from a sample of petrol retailers.
5.2 Petrol retailer costs and net margins – Canberra compared to Sydney and the national average
Before considering the determinants of petrol prices and price differentials between
Canberra and the comparison locations (towns in proximity to Canberra), it is useful to
consider the reasons for the price differentials between Canberra and Sydney and
between Canberra and for Australia as a whole. Some of the reasons for higher prices,
on average over time, in Canberra compared to Sydney and the national average will
also explain higher prices, on average over time, in the comparison locations compared
to Sydney and the national average. For example, freight costs to transport petrol from
the terminal gate to regional locations are expected to contribute to higher prices in
Canberra and in the comparison locations.
To compare the costs and margins that determine petrol prices for Canberra, Sydney
and the national average, the Commission used publicly available data from the
ACCC.70 The publicly available data is not available for all recent years, specifically
the:
• latest retail petrol cost components for Sydney are for 2014-15;
70 ACCC, 2017.
0%
5%
10%
15%
20%
25%
30%
35%

5 - Petrol retailer costs and margins
Final Report: Investigation into motor
vehicle petrol prices in the ACT 65
• annual average profit per retail petrol site is available for Sydney between
2011-12 and 2014-15; and
• annual average profit per retail petrol site is available for Australia between
2011-12 and 2015-16.
Petrol cost components in 2014-15
The petrol cost components for Sydney and Canberra, on a cent per litre (cpl) basis for
2014-15, are presented in Table 5.1. The table shows that the annual average petrol
price in Canberra was 7 cpl higher than in Sydney. This difference in part reflects
higher transport costs, accounting for around 1.3 cpl of the price difference. This
estimated higher transport cost is somewhat lower than a more recent estimate of
2.5 cpl to 3 cpl reported by the ACCC and in several submissions to the ACT
Legislative Select Committee on Fuel Pricing.71 This may in part reflect changes in the
cost of fuel delivery that have occurred since 2014-15. The ACCC said that:
Based on our analysis of what we know, the additional transport costs to Canberra as
opposed to Sydney would be about 2.5c to 3c a litre.72
The remainder of the difference is due to higher retail operating costs (4 cpl higher)
and a higher net retail margin (1 cpl) in Canberra.
Table 5.1 Petrol cost components in Canberra and Sydney in 2014-15 (cpl)
Canberra Sydney Difference between
Canberra and Sydney
Retail price 142.1 134.7 7.4
Net retail margin 3 2 1
Operating costs 9 5 4
GST – retail 1 1 0
Wholesale price and
freight 128.8 127.5 1.3
Source: ACCC (2017) and ICRC calculations based on financial data from a sample of petrol retailers.
Note: The components of each price level have been rounded. As a result, they may not sum to the totals.
As explained above, the Commission does not have more up to date data for petrol
retailers in Sydney. Since 2014-15, the drivers of price differences between Sydney
and Canberra may have changed. There is some evidence, for example, to suggest that
retail operating costs in Sydney may have increased relative to Canberra since 2014-15
due to the introduction of the NSW ethanol mandate (discussed below). As such,
71 Hansard of ACT Legislative Assembly Select Committee on Fuel Pricing hearing, 28 March 2019,
p. 63.
72 Hansard of ACT Legislative Assembly Select Committee on Fuel Pricing hearing, 28 March 2019,
p. 63.

5 - Petrol retailer costs and margins
66 Final Report: Investigation into motor
vehicle petrol prices in the ACT
differences in net retail margins and wholesale petrol costs may now explain a larger
part of the price difference.
The wholesale petrol cost may vary between Sydney and Canberra reflecting
differences in the supply contracts of retailers in these locations. For example, and as
discussed in Section 5.2, Canberra has a relatively high concentration of Coles Express
petrol retailers which, in 2017-18, had what has been described as an uncompetitive
fuel supply agreement with Viva Energy.73
Retail operating costs
As described in Chapter 2, some retail business costs (such as rent) do not vary in
proportion with the volume of fuel sold. This means that fuel retailers with lower fuel
sales volumes generally need to charge a higher per litre price for fuel sold than
retailers that operate higher volume sites. This is because these retailers have to recover
their fixed costs from a smaller volume of petrol sold, unless they receive revenue from
other sources.
In 2014-15, petrol retailers in Sydney and in Canberra sold roughly the same amount of
fuel per site on average (around 8 million litres per site).74 The relatively higher retail
operating cost in Canberra (on a cent per litre basis) reflects higher costs of operating
in the ACT. This may have changed since 2014-15, with some submissions to the ACT
Legislative Assembly Select Committee on Fuel Pricing stating that average fuel sales
volumes per site in Canberra are less than for Sydney.75 The Commission does not
have data on fuel sales volumes for Sydney petrol retailers beyond 2014-15.
Since 2014-15, the cost of complying with the introduction of E10 mandates in NSW
may have led to an increase in the average retail operating cost in Sydney relative to
Canberra. In 2011, the NSW Government mandated that fuel retailers were to sell six
per cent ethanol as a proportion of all petroleum product sales. Since then, NSW petrol
retailers made investments to replace some regular unleaded petrol infrastructure with
E10 infrastructure.76 The transition to E10 is generally costly and involves tank
replacements or upgrades. Costs range from $12,500 to $20,000 per tank to clean and
maintain and up to $200,000 for full tank replacement.77 The ACCC’s December 2018
report on the Australian petroleum market noted that the increase in gross retail
margins in NSW since 2014-15 may partly reflect regulatory and compliance costs,
73 See acapmag.com.au/2018/10/coles-fuel-business-under-the-pump-as-volumes-continue-to-fall
(accessed 18 April 2019).
74 ACCC, 2016, p. 33.
75 ACAPMA, 2019, p. 16.
76 See e10fuelforthought.nsw.gov.au/history (accessed 30 April 2019).
77 IPART, 2015, p. 52.

5 - Petrol retailer costs and margins
Final Report: Investigation into motor
vehicle petrol prices in the ACT 67
including the effect of the ethanol mandate as well as clean air regulations,
underground petroleum storage systems regulations and FuelCheck.78
Net retail margin
The net retail margin (on a cent per litre basis) depends on the level of competition in a
market and this will reflect retailer market shares, business models, ownership
structures and the visibility of petrol stations (as described in Chapter 2).
As discussed in Chapter 2, the business models adopted by petrol retailers in a
particular area will affect the level of competition and prices in that area. For instance,
a high concentration of premium retailers—that is, retailers whose business strategy is
to offer a premium product, such as perceived higher quality fuel79 or a superior
convenience offering, and price at or above the market price to reflect this—may lower
the level of competition in fuel pricing in that area. The petrol market in Canberra has a
relatively high share of major and supermarket brands (as discussed in Chapter 2) and
these retailers tend to adopt a business model centred around a premium product
offering. The larger share of premium providers in Canberra relative to Sydney likely
contributes to reduced competition in petrol pricing and the higher net retail margin in
Canberra compared to Sydney.80
The retail petrol market in Canberra has a relatively low share of retailers with
aggressive discounting as a core part of their business model compared to Sydney (that
is, a low-margin and high-volume business model). A sufficient number of petrol
retailers with this type of business strategy leads to a higher degree of competition in a
retail petrol market. These types of retailers are more likely to be independent petrol
retailers. The higher number of petrol retailers with this type of business model in
Sydney contributes to the lower average net retail margin in Sydney compared to
Canberra.81 Canberra has a relatively low share of independent petrol retailers (as
discussed in Chapter 3) and of these only some have adopted an aggressive discounting
business model (such as those located near the Airport and, to a lesser extent, in
Fyshwick).82
Recent changes to the business strategies of some petrol retailers may lead to a
reduction in the average net retail margin in Canberra. As discussed in Chapter 2,
Canberra has a relatively high proportion of Coles Express sites. As of March 2019,
Viva Energy started to set petrol prices at Coles Express sites. Viva Energy has
78 ACCC, 2018, p. 19.
79 For example, due to the addition of additives that are stated to improve vehicle performance or due to
customer perceptions of quality associated with certain brand characteristics.
80 ACAPMA, 2019, p. 16.
81 ACAPMA, 2019, p. 16-17.
82 Section 5.3 ahead discusses the net retail margin by district of Canberra.
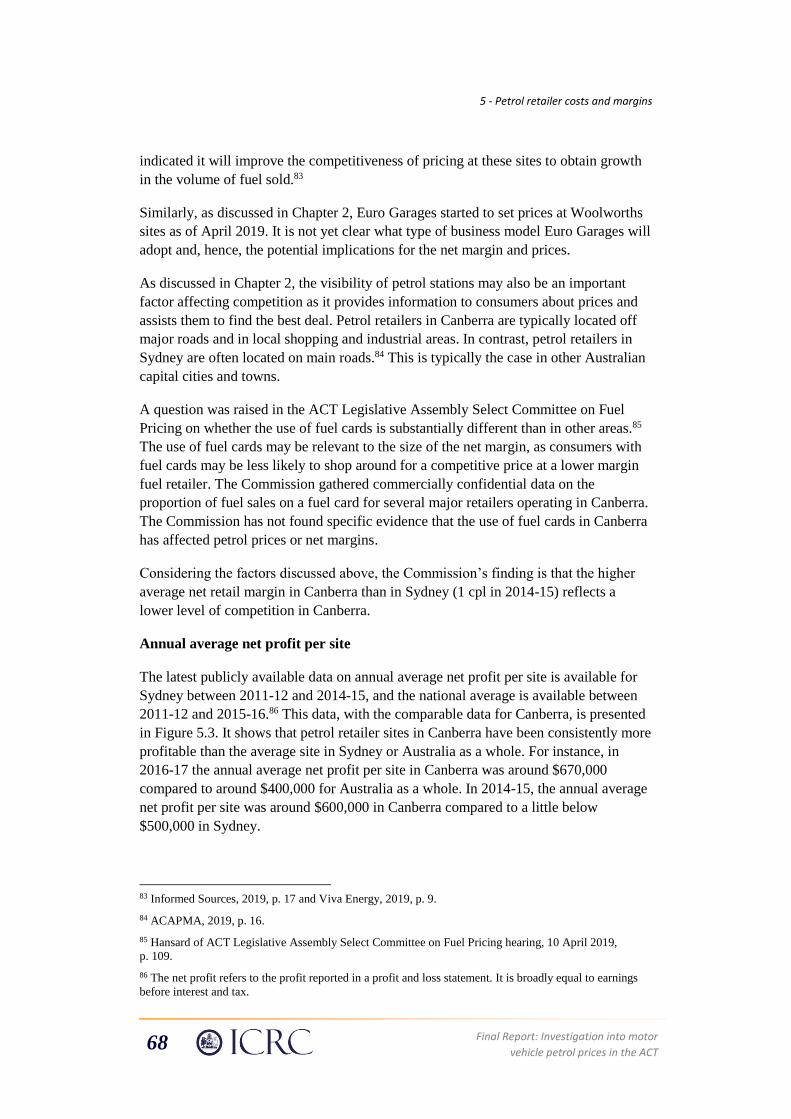
5 - Petrol retailer costs and margins
68 Final Report: Investigation into motor
vehicle petrol prices in the ACT
indicated it will improve the competitiveness of pricing at these sites to obtain growth
in the volume of fuel sold.83
Similarly, as discussed in Chapter 2, Euro Garages started to set prices at Woolworths
sites as of April 2019. It is not yet clear what type of business model Euro Garages will
adopt and, hence, the potential implications for the net margin and prices.
As discussed in Chapter 2, the visibility of petrol stations may also be an important
factor affecting competition as it provides information to consumers about prices and
assists them to find the best deal. Petrol retailers in Canberra are typically located off
major roads and in local shopping and industrial areas. In contrast, petrol retailers in
Sydney are often located on main roads.84 This is typically the case in other Australian
capital cities and towns.
A question was raised in the ACT Legislative Assembly Select Committee on Fuel
Pricing on whether the use of fuel cards is substantially different than in other areas.85
The use of fuel cards may be relevant to the size of the net margin, as consumers with
fuel cards may be less likely to shop around for a competitive price at a lower margin
fuel retailer. The Commission gathered commercially confidential data on the
proportion of fuel sales on a fuel card for several major retailers operating in Canberra.
The Commission has not found specific evidence that the use of fuel cards in Canberra
has affected petrol prices or net margins.
Considering the factors discussed above, the Commission’s finding is that the higher
average net retail margin in Canberra than in Sydney (1 cpl in 2014-15) reflects a
lower level of competition in Canberra.
Annual average net profit per site
The latest publicly available data on annual average net profit per site is available for
Sydney between 2011-12 and 2014-15, and the national average is available between
2011-12 and 2015-16.86 This data, with the comparable data for Canberra, is presented
in Figure 5.3. It shows that petrol retailer sites in Canberra have been consistently more
profitable than the average site in Sydney or Australia as a whole. For instance, in
2016-17 the annual average net profit per site in Canberra was around $670,000
compared to around $400,000 for Australia as a whole. In 2014-15, the annual average
net profit per site was around $600,000 in Canberra compared to a little below
$500,000 in Sydney.
83 Informed Sources, 2019, p. 17 and Viva Energy, 2019, p. 9.
84 ACAPMA, 2019, p. 16.
85 Hansard of ACT Legislative Assembly Select Committee on Fuel Pricing hearing, 10 April 2019,
p. 109.
86 The net profit refers to the profit reported in a profit and loss statement. It is broadly equal to earnings
before interest and tax.

5 - Petrol retailer costs and margins
Final Report: Investigation into motor
vehicle petrol prices in the ACT 69
Figure 5.3 Annual average net profit per site, 2012-13 to 2017-18 ($‘000s)
Source: ACCC (2017) and ICRC calculations based on financial data from a sample of petrol retailers.
There is significant variation in profits across retail sites in Canberra (discussed in
more detail in section 5.3). Retailers with high fuel sales volumes tend to have higher
profits. However, there is variation in profits amongst sites with the same level of fuel
sales. There are sites in Canberra that earn a lower profit than the average for Australia.
The higher annual net profit per site in Canberra compared to Sydney reflects a higher
retail margin. It may also reflect differences in the type of fuel sold at petrol stations
and differences in profits from non-fuel products; however, the Commission does not
have data to verify this. The relatively higher annual average net profit per site in
Canberra may also reflect a higher return that would be required to justify setting up
and investing in a petrol station in Canberra. As described in Chapter 2, these costs can
be substantial and are likely to vary to some degree by location. For example, the ACT
Legislative Assembly Select Committee on fuel pricing found that there is a higher
cost of securing and operating service stations in Canberra compared to Sydney and
towns in regional NSW.87
The higher annual net profit per site in Canberra compared to Australia as a whole will
reflect a combination of factors, including differences in the net retail margin, the
volume of fuel sold per site, or profits from non-fuel products, which will vary
significantly across Australia. The ACCC’s regional market studies highlight some of
these differences in the locations subject to these studies.88
87 ACT Legislative Assembly Select Committee on Fuel Pricing 2019, Interim report on inquiry into ACT
fuel pricing, p.7.
88 See https://www.accc.gov.au/publications/petrol-market-studies.
0
100
200
300
400
500
600
700
800
2012-13 2013-14 2014-15 2015-16 2016-17 2017-18
$'0
00
s
Canberra Sydney National average

5 - Petrol retailer costs and margins
70 Final Report: Investigation into motor
vehicle petrol prices in the ACT
5.3 Petrol retailer costs and net margins – Canberra compared to regional comparison locations
Table 5.2 and Figure 5.4 show the difference in average retail petrol prices and petrol
cost components in Canberra and the regional comparison locations for the period from
2012-13 to 2017-18 (for the sample of petrol stations considered in this report). It
shows how differences in wholesale petrol costs (including freight costs), retail
operating costs and net retail margins have contributed to the price difference over this
period.
Figure 5.4 shows that the driver of the price difference between Canberra and regional
locations has changed over time. In 2016-17 and 2017-18, the net retail margin and, to
a lesser degree wholesale costs, were higher in Canberra and this resulted in higher
retail petrol prices in Canberra. In these years, retail operating costs (on a cents per litre
basis) were relatively lower in Canberra. Previously, in 2012-13, 2013-14 and 2015-16,
the retail petrol price was, on average, lower in Canberra than the regional comparison
locations, reflecting lower wholesale petrol costs. The reasons for these differences and
the changes over time are discussed further below.
Table 5.2 Differences in the average retail petrol price and the petrol cost components: Canberra compared to regional comparison locations, 2012-13 to 2017-18 (cpl)
2012-13 2013-14 2014-15 2015-16 2016-17 2017-18
Retail price -0.1 -0.2 0.5 -0.1 1.2 4.9
Net retail margin 0.6 0.5 -2.4 2.0 2.7 4.4
Operating costs 0.4 0.1 0.4 0.3 -1.1 -1.3
GST – retail 0.1 0.1 -0.2 0.2 0.1 0.2
Wholesale price
and freight -1.1 -0.9 3.1 -2.1 0.4 2.2
Source: Based on financial data from a sample of petrol retailers.
Note: The components of each price level have been rounded. As a result, they may not sum to the totals.

5 - Petrol retailer costs and margins
Final Report: Investigation into motor
vehicle petrol prices in the ACT 71
Figure 5.4 Differences in the average retail petrol cost components: Canberra compared to regional comparison locations, 2012-13 to 2017-18 (cpl)
Source: Based on financial data from a sample of petrol retailers.
Wholesale petrol costs
The average wholesale petrol costs for retailers in Canberra and the comparison
regions are shown in Figure 5.5. It shows that the difference in the wholesale cost of
petrol between Canberra and the regional comparison locations changes over time.
This in part reflects changes in the sample of petrol stations over time (as discussed
earlier), with petrol stations with different supply contracts being added to the sample
between 2012-13 and 2017-18. It may also reflect changes to the contractual
arrangements between retailers and wholesale petrol suppliers, which are confidential
in nature. The figure also shows that, following 2015-16, wholesale petrol prices in
Canberra were higher than for the three regional comparisons regions.
The average wholesale petrol price in Canberra declined in 2015-16 relative to inland
comparison regions, around the same time that Costco entered the Canberra market.
This may reflect a favourable petrol supply contract negotiated by Costco. It may also
reflect flow-on effects of this, as other retailers in proximity to Costco may have then
been able to negotiate more competitive supply contracts.
In 2017-18, average wholesale petrol prices in Canberra were 2.2 cpl higher than the
average for all three comparison regions (as shown in Table 5.2). This may reflect the
retail petrol market structure in the ACT. As described in Chapter 2, Canberra has a
relatively high concentration of Coles Express petrol retailers which, in 2017-18, had
what has been described as an uncompetitive fuel supply agreement with Viva
Energy.89 Recent changes to supply contracts may change this in the future. As
89 See acapmag.com.au/2018/10/coles-fuel-business-under-the-pump-as-volumes-continue-to-fall
(accessed on 18 April 2019).
-3
-2
-1
0
1
2
3
4
5
6
7
2012-13 2013-14 2014-15 2015-16 2016-17 2017-18
cpl
Net margin Operating costs GST (retail) Wholesale petrol costs (includes delivery costs)

5 - Petrol retailer costs and margins
72 Final Report: Investigation into motor
vehicle petrol prices in the ACT
discussed in Section 5.1, Viva Energy started to set the price of petrol at Coles Express
sites from March 2019 and has indicated that it will improve the competitiveness of its
fuel offering.90 Euro Garages started to set prices at Woolworths sites as of April 2019.
Figure 5.5 Average wholesale petrol cost (cpl)
Source: Based on financial data from a sample of petrol retailers.
Retail operating costs
The average retail operating cost (on a cent per litre basis) for Canberra and the
comparison locations is shown in Figure 5.6. It shows that petrol retailer operating
costs in Canberra were similar or slightly higher to those in the comparison locations
until 2015-16. In 2016-17 and 2017-18, average retail operating costs in Canberra were
lower than for any of the three comparison regions.
The change over time may reflect changes in the sample of petrol retailers over time.
Retail petrol sites with relatively higher retail operating costs may have been part of the
sample for the regional comparison locations for only part of the period since 2012-13
and this may have contributed to the increase in average retail operating costs in these
locations.
The increase in retail operating cost (on a cent per litre basis) in the regional
comparison locations from around 2014-15 may also reflect the cost of complying with
the introduction of E10 mandates and other regulatory obligations in NSW. As
discussed in Section 5.2, the ACCC’s December 2018 report on the Australian
petroleum market noted that the increase in gross retail margins in NSW since 2014-15
may partly reflect regulatory and compliance costs, including the effect of the NSW
ethanol mandate.91
90 See sbs.com.au/news/coles-and-viva-energy-enter-new-fuel-deal (accessed on 18 April 2019).
91 ACCC, 2018, p.19.
100
110
120
130
140
150
160
2012-13 2013-14 2014-15 2015-16 2016-17 2017-18
cpl
Canberra Towns on the Hume Highway
Inland towns not on Hume Highway South Coast towns

5 - Petrol retailer costs and margins
Final Report: Investigation into motor
vehicle petrol prices in the ACT 73
Figure 5.6 Average retail operating costs, 2012-13 to 2017-18 (cpl)
Source: Based on financial data from a sample of petrol retailers.
Note: The retail operating cost on a cent per litre basis was calculated as total retail operating costs for the region divided by the total volume of fuel sold.
The volume of petrol sold at a particular site will affect its retail operating cost on a
cent per litre basis. As described in Chapter 2, some retail business costs (such as rent
and, to some degree, wages) do not vary in proportion with the volume of fuel sold.
This means that fuel retailers with lower fuel volumes generally need to charge a
higher per litre price for fuel sold than prices charged by higher volume sites. This is
because these retailers have to recover their fixed costs from a smaller volume of petrol
sold, unless they receive revenue from other sources.
Figure 5.7 shows average fuel sales per retail petrol site in Canberra and the
comparison locations. In Canberra, average fuel sales volumes per site were largely
unchanged between 2012-13 and 2017-18 at around 8 million litres per site, but they
declined across the comparison regions. This contributed to the increase in the retail
operating cost (on a cent per litre basis) for petrol retailers in the comparison locations
relative to Canberra between 2012-13 and 2017-18, as shown in Figure 5.7.
By 2017-18, petrol retailers in Canberra sold 8 million litres per site on average,
compared to almost 7 million litres per site on average in selected towns on the Hume
Highway, around 6 million litres per site on the South Coast, and around 4 million
litres per site in selected inland towns not the Hume Highway. The higher average fuel
sales volume in Canberra meant that average retail operating costs were 1.3 cpl lower
than the average for the comparison locations.
The decline in the average fuel sales per site in the regional comparison locations may
reflect changes in the characteristics of petrol retailers in the sample for the regional
comparison locations since 2012-13 (as discussed above).
0
2
4
6
8
10
12
14
2012-13 2013-14 2014-15 2015-16 2016-17 2017-18
cpl
Canberra Towns on the Hume Highway
Inland towns not on Hume Highway South Coast towns
5 - Petrol retailer costs and margins
74 Final Report: Investigation into motor
vehicle petrol prices in the ACT
Figure 5.7 Average fuel sales per site, 2012-13 to 2017-18 (million litres)
Source: Based on financial data from a sample of petrol retailers.
0
1
2
3
4
5
6
7
8
9
2012-13 2013-14 2014-15 2015-16 2016-17 2017-18
Mill
ion
litre
s
Canberra Towns on the Hume Highway
Inland towns not on the Hume Highway South Coast towns

5 - Petrol retailer costs and margins
Final Report: Investigation into motor
vehicle petrol prices in the ACT 75
Box 7 Impact of commercial rates on petrol retailer costs and margins
Some petrol retail owners in the ACT have submitted that recent changes in
commercial rates have increased their annual tax costs, which has reduced their
profit margins.
Changes in commercial general rates in the ACT
Commercial general rates have generally increased as part of a suite of tax reform
measures in 2012-13 that is being delivered in five-year stages over 20 years. The
reform program is intended to be broadly revenue neutral over time, with the
reductions in revenue from phasing out conveyance duties and other taxes92 being
replaced through gradual increases in general rates.93
For commercial properties such as retail petrol stations, land tax has been abolished
and placed on commercial general rates, thus combining and simplifying the taxes
paid on commercial properties. From 1 July 2018, conveyance duty was completely
abolished for all commercial property transactions of $1.5 million or less.94
The package of reforms also included other changes95 such as:
• An increase in the tax-free threshold for payroll tax to $2 million so that an
estimated 90 per cent of small and medium size businesses do not pay
payroll tax.
• Motor vehicle registrations to be based on environmental performance of the
vehicles.
• Removal of duty on insurance policies.
Recent increases in commercial rates reflect the transition away from
conveyance duty and other taxes, as well as increases in the unimproved value
of land
Commercial rates paid by petrol retailers in Canberra will gradually increase as
conveyancing duties are phased out. For some petrol retailers, the increase in rates
may be also be affected by a change in land values. Typically, the higher the
unimproved value of the land, the higher the rates.96
The year-to-year change in commercial property values has varied by area of
Canberra. Some commercial properties have seen large year-to-year changes in their
underlying land value (which can result in higher annual commercial rates), such as
those located in North Canberra.97 The ACT Government is consulting with industry
on how it could smooth the magnitude of potential year-to-year increases.98
Differences in petrol retailer operating costs and margins between the ACT and
other jurisdictions may, to some degree, reflect differences in tax systems, including
differences in commercial rates.

5 - Petrol retailer costs and margins
76 Final Report: Investigation into motor
vehicle petrol prices in the ACT
Net retail margin
As described in Section 5.1, the net retail margin can be influenced by the level of
competition in the retail petrol market. The net retail margin for Canberra and the
comparison locations is shown in Figure 5.8. It shows that:
• The net retail margin in Canberra has increased from around 3.7 cpl in 2012-13 to
just under 6 cpl in 2017-18.
• The net retail margin on the South Coast is typically higher than in Canberra, with
the exception of 2017-18. In contrast, net retail margins for inland towns are
typically lower than in Canberra.
• The net retail margin is volatile. For example, for the South Coast towns it ranged
from just under 9 cpl in 2012-13 to around 4 cpl in 2015-16. This may reflect the
way in which fuel retailers manage volatility in wholesale petrol costs. For
instance, petrol retailers may decrease the net retail margin in response to a sharp
rise in wholesale petrol costs.
• The changes in the net retail margin over time may reflect changes in the
characteristics of petrol retailers in the sample for the regional comparison
locations since 2012-13 (as discussed above).
The increase in the net retail margin in Canberra in 2016-17 and 2017-18 largely
reflects an increase in the margin applied by retailers with a premium product business
model (that is, retailers that have adopted a business model where they offer a premium
product and price accordingly) for which Canberra has a high market share.
92 Conveyance duty, commonly known as stamp duty, is a tax paid when buying a home, land or
commercial property in the ACT. See www.revenue.act.gov.au/duties/conveyance-duty,
accessed 15 June 2019.
93 ACT Government, 2012, A fairer, simpler and more efficient taxation system: 5 year reform
plan, Australian Capital Territory, Canberra, June.
94 https://www.revenue.act.gov.au/tax-reform
95 See ACT Government, 2012, A fairer, simpler and more efficient taxation system: 5 year
reform plan, Canberra, June.
96 Rates are calculated using the unimproved value of a block of land. That unimproved value is
what the block of land is worth without improvements such as buildings, landscaping, paths and
fences.
97 Legislative Assembly for the ACT, Select Committee on Estimates 2018-2019, Questions on
Notice NO E18-106.
98 https://apps.treasury.act.gov.au/__data/assets/pdf_file/0004/1370344/ACT-Tax-Reform-
Program.pdf

5 - Petrol retailer costs and margins
Final Report: Investigation into motor
vehicle petrol prices in the ACT 77
Figure 5.8 Average net retail margin, 2012-13 to 2017-18 (cpl)
Source: Based on financial data from a sample of petrol retailers.
The relatively lower net margin for petrol retailers in towns on the Hume Highway and
inland towns not on the Hume Highway reflects a higher proportion of operators with a
business model centred on fuel price competition in these towns compared to Canberra.
As described in Section 5.1, the type of business model adopted by petrol retailers is a
key determinant of the level of competition in a retail petrol market.
Annual average net profit per site
The annual average net profit per site is shown in Figure 5.9. It shows that the annual
average net profit per site is typically higher in Canberra than in the regional
comparison locations. For example, in 2017-18 the average net profit per site was
around $750,000 in Canberra compared to around $380,000 for the regional
comparison locations. These averages mask significant variation in profit per site
which is discussed below.
This in part reflects a higher volume of fuel per site sold in Canberra than in these
locations. This includes a higher sales volume of premium fuels which generally attract
a higher net retail margin.99 As described above, the higher volume of fuel sold reduces
operating costs (on a cent per litre basis) and results in a higher profit for a given level
of prices. In more recent years, the higher net profit per site also reflects an increase in
the net retail margin (as shown in Figure 5.8). The net retail margin (on a cent per litre
basis) and the annual average net profit per site are highly correlated (that is, they
increase or decrease at the same time and by a similar magnitude).
The decrease in the annual average net profit per site for South Coast towns and inland
towns not on the Hume Highway between 2012-13 and 2017-18 will also reflect the
different characteristics (in particular, the lower net profits) of retail petrol sites that
99 ACCC 2014, Monitoring Australian Petroleum Industry Report 2014, p.154.
0
1
2
3
4
5
6
7
8
9
10
2012-13 2013-14 2014-15 2015-16 2016-17 2017-18
cpl
Canberra Towns on the Hume Highway
Inland towns not on Hume Highway South Coast towns
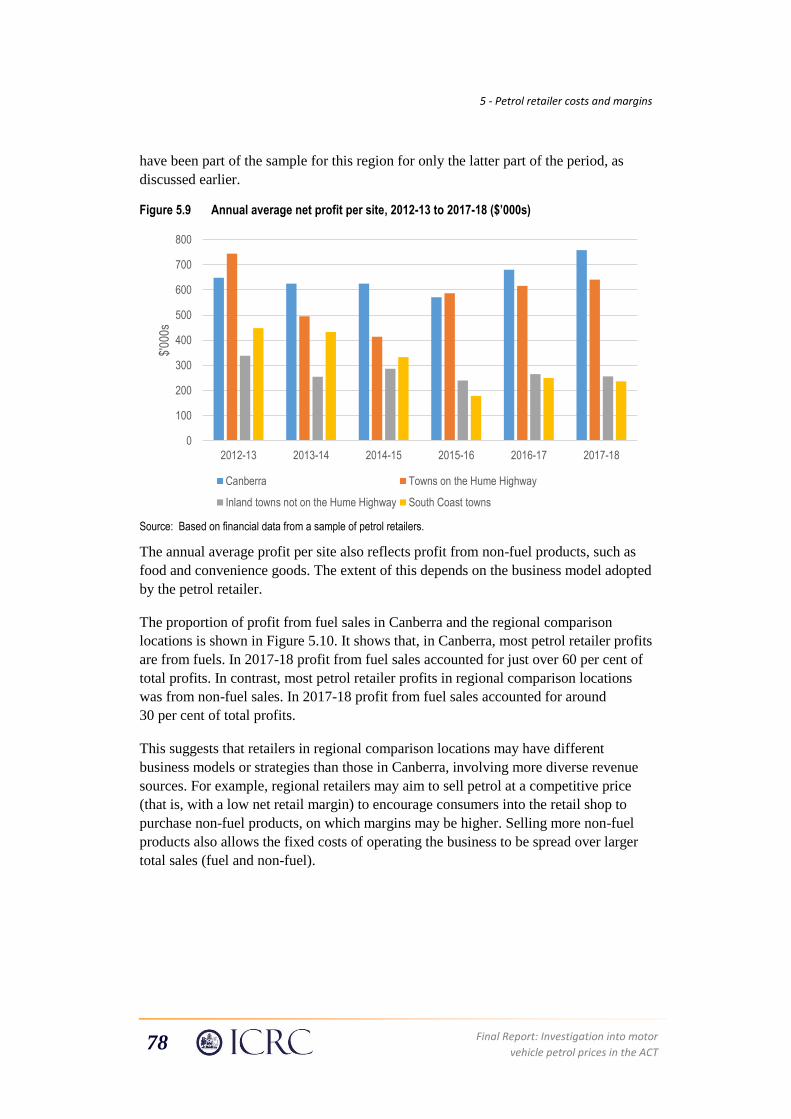
5 - Petrol retailer costs and margins
78 Final Report: Investigation into motor
vehicle petrol prices in the ACT
have been part of the sample for this region for only the latter part of the period, as
discussed earlier.
Figure 5.9 Annual average net profit per site, 2012-13 to 2017-18 ($’000s)
Source: Based on financial data from a sample of petrol retailers.
The annual average profit per site also reflects profit from non-fuel products, such as
food and convenience goods. The extent of this depends on the business model adopted
by the petrol retailer.
The proportion of profit from fuel sales in Canberra and the regional comparison
locations is shown in Figure 5.10. It shows that, in Canberra, most petrol retailer profits
are from fuels. In 2017-18 profit from fuel sales accounted for just over 60 per cent of
total profits. In contrast, most petrol retailer profits in regional comparison locations
was from non-fuel sales. In 2017-18 profit from fuel sales accounted for around
30 per cent of total profits.
This suggests that retailers in regional comparison locations may have different
business models or strategies than those in Canberra, involving more diverse revenue
sources. For example, regional retailers may aim to sell petrol at a competitive price
(that is, with a low net retail margin) to encourage consumers into the retail shop to
purchase non-fuel products, on which margins may be higher. Selling more non-fuel
products also allows the fixed costs of operating the business to be spread over larger
total sales (fuel and non-fuel).
0
100
200
300
400
500
600
700
800
2012-13 2013-14 2014-15 2015-16 2016-17 2017-18
$'00
0s
Canberra Towns on the Hume Highway
Inland towns not on the Hume Highway South Coast towns

5 - Petrol retailer costs and margins
Final Report: Investigation into motor
vehicle petrol prices in the ACT 79
Figure 5.10 Proportion of profit from fuel sales, 2012-13 to 2017-18 (per cent)
Source: Based on financial data from a sample of petrol retailers.
Figure 5.11 andFigure 5.12 show total profits against fuel sales volumes for 2017-18 in
Canberra and the regional comparison locations.100 They show that there is significant
variation in profits across retail sites. Retailers with high fuel sales volume tend to have
higher profits. However, there is variation in profits amongst sites with the same level
of fuel sales. These figures also show that there are sites in Canberra that earn a lower
profit than the average for the regional comparison locations.
The most profitable retailers in Canberra (those with the highest profits per site) did not
always have the highest margins (the profit earned on each litre of petrol sold).
Retailers that adopted a business model centred around competitive pricing had lower
than average net margins but often had higher than average profits per site because
they sold a large volume of petrol. However, this was not always the case—sometimes
retailers with lower than average margins had low profits per site because their
volumes were not high enough to offset the lower margin, for example because of
strong competition for volumes in the local area or a less favourable location.
Similarly, retailers with premium business models, such as Coles Express, generally
had a higher than average net margin and had high profits at sites with high fuel sales
volumes and lower profits at sites with lower sales volumes.
The figures show that petrol retailers with low fuel sales volumes (less than 5 million
litres of fuel sales) tend to be more profitable in Canberra than in the regional
comparison locations, potentially reflecting a higher proportion of retailers in Canberra
that have adopted premium business models.
It also shows that retail sites in Canberra typically sell more fuel than in comparison
locations. In the regional comparison locations, around 94 per cent of petrol retailers
100 The scales on the figures are the same for comparison purposes. The axis labels have been removed to
protect the confidentiality of petrol retailers.
0%
10%
20%
30%
40%
50%
60%
70%
2012-13 2013-14 2014-15 2015-16 2016-17 2017-18
Canberra Regional comparison locations

5 - Petrol retailer costs and margins
80 Final Report: Investigation into motor
vehicle petrol prices in the ACT
sold less than 7.5 million litres of fuel in 2017-18. In Canberra, around 60 per cent of
petrol retailers sold less than 7.5 million litres of fuel in 2017-18. Reflecting the lower
level of fuel sold and a lower net retail margin, regional locations had more sites with
profit below $500,000 (around 71 per cent of sites) compared to Canberra (around
34 per cent of sites).
Figure 5.11 Petrol retailer profit by fuel sales volume in Canberra, 2017-18
Source: Based on financial data from a sample of petrol retailers.
Note: The scales on Figures 5.11 and 5.12 are the same for comparison purposes. The axis labels have been removed to protect the confidentiality of petrol retailers. A number of sites that were outliers have been removed to protect confidentiality.

5 - Petrol retailer costs and margins
Final Report: Investigation into motor
vehicle petrol prices in the ACT 81
Figure 5.12 Petrol retailer profit by fuel sales volume in regional comparison locations, 2017-18
Source: Based on financial data from a sample of petrol retailers.
Note: The scales on Figures 5.11 and 5.12 are the same for comparison purposes. The axis labels have been removed to protect the confidentiality of petrol retailers. A number of sites that were outliers have been removed to protect confidentiality.
5.4 Petrol retailer costs and net margins by district of Canberra
There are differences in petrol retailer costs and net margins within Canberra, as shown
for 2017-18 in Table 5.3. These differences reflect differences in business models, the
level of competition in the local area, costs of operating in particular areas, and the
prices charged by the wholesale petrol suppliers supplying to particular sites or
retailers.
In 2017-18 petrol retailers at the Airport and in Fyshwick had the lowest net margins of
any district of Canberra (2.1 cpl) and this reflects the relatively high level of
competition in these areas. Retailers at the Airport and (to some degree) Fyshwick,
tend to adopt a business model with a focus on competition and aggressive discounting.
The profit at some Airport and Fyshwick sites was above the average for Canberra,
reflecting a relatively high fuel sales volume. However, there are sites in these districts
that make profits substantially below the ACT average.
The net retail margin was highest in Tuggeranong (7.2 cpl) followed by Gungahlin
(7.1 cpl). The profit at some sites in these districts was well above the average for
Canberra, reflecting the higher net margin and (particularly for some sites in the
district) a high volume of fuel sales.

5 - Petrol retailer costs and margins
82 Final Report: Investigation into motor
vehicle petrol prices in the ACT
Net retail margins in North Canberra were also relatively low compared to other
districts (3.4 cpl in 2017-18). This largely reflects competition amongst petrol retailers
in Braddon where four petrol retailers operate in close proximity to each other. Despite
this, North Canberra had the highest retail petrol prices of all districts in Canberra in
2017-18 (equal to Belconnen), reflecting the relatively high costs of operating in this
district (such as high lease payments).
Petrol retailers near the Airport had the lowest retail operating cost in 2017-18 (on a
cent per litre basis, compared to retailers in other Canberra districts), reflecting the
higher volume of fuel sold at these sites.
Average wholesale petrol costs were similar across Canberra districts in 2017-18
except for the Airport (they were lower) and South Canberra (they were higher at
127.9 cpl). This reflects the different supply arrangements between retailers in these
districts. For example, there are no Coles Express sites around the Airport but there are
in South Canberra. As discussed in Section 5.2, Coles Express sites may have had an
uncompetitive supply contract with Viva Energy over this period.
Table 5.3 Petrol cost component by region of Canberra in 2017-18 (cpl)
Airport and
Fyshwick Gungahlin
South
Canberra
Woden
Valley Tuggeranong Belconnen
North
Canberra
Retail price 132.7 142.9 143.0 143.1 143.1 143.3 143.3
Net retail
margin 2.1 7.1 4.0 6.1 7.2 6.4 3.4
Operating costs 7.6 9.7 9.7 9.8 10.1 10.7 14.3
GST – retail 1.0 1.7 1.4 1.6 1.7 1.7 1.8
Wholesale price
and freight 122.1 124.5 127.9 125.6 124.1 124.5 123.8
Source: Based on financial data from a sample of petrol retailers.
Note: South Canberra excludes Fyshwick. Weston Creek is not included for confidentiality reasons as there is only one petrol retailer in this region. The Airport and Fyshwick have been aggregated for confidentiality reasons.
5.5 Summary
The price of petrol depends on a number of factors including wholesale petrol costs
(including net wholesale margins), transport costs, retail operating costs and net retail
margins (the profit margin of the retailer).
Petrol retailers in Canberra pay higher delivery costs for fuel than those in Sydney. In
2014-15 this extra cost was around 1.3 cpl. This estimate is lower than the more recent
estimate of 2.5 cpl to 3 cpl reported by the ACCC and in several submissions to the
ACT Legislative Select Committee on Fuel Pricing.
In 2017-18 petrol retailers in Canberra had lower retail operating costs than those in the
regional comparison locations (retail operating costs were 1.3 cpl lower in Canberra
than the average of the regional comparison locations). This is because petrol retailers

5 - Petrol retailer costs and margins
Final Report: Investigation into motor
vehicle petrol prices in the ACT 83
in Canberra sell more fuel which reduces these costs on a cent per litre basis. Petrol
retailers in Canberra have higher operating costs than those in Sydney (around 4 cpl
higher based on data from 2014-15).
The net retail margin is higher in Canberra than in the regional comparison locations
(4.4 cpl based on data from 2017-18) and in Sydney (1 cpl based on data from
2014-15), reflecting lower levels of competition in Canberra. This is due to Canberra
having a more concentrated retail petrol market, with a higher proportion of retailers
with business models to offer a premium product and a lower number of independent
retailers with a business strategy to aggressively discount. It also likely reflects the
relatively poor visibility of many petrol stations in Canberra, which makes it difficult
for consumers to compare competitor prices.
Petrol retailers in Canberra are, on average, more profitable than those in surrounding
regions and in Sydney reflecting their higher average net retail margin. They also sell
more fuel than petrol stations in the surrounding regions.
There are substantial differences in petrol retailer costs and net margins within
Canberra. These differences reflect differences in business models, the level of
competition in the local area, costs of operating in particular areas, and the prices
charged by the wholesale petrol suppliers supplying to particular sites or retailers.
The Commission found that the most profitable retailers in Canberra (those with the
highest profits per site) did not always have the highest margins (the profit earned on
each litre of petrol sold). Retailers that adopted a business model centred around
competitive pricing (such as those near the Airport and in Fyshwick) had lower than
average net margins but often had higher than average profits per site because they sold
a large volume of petrol. However, this was not always the case—sometimes retailers
with lower than average margins had low profits per site because their volumes were
not high enough to offset the lower margin, for example because of strong competition
for volumes in the local area or a less favourable location. Similarly, retailers with
premium business models, such as Coles Express, generally had a higher than average
net margin and had high profits at sites with high fuel sales volumes and lower profits
at sites with lower sales volumes.
Recent changes to the structure of some petrol businesses (such as Coles Express and
Viva Energy) may lead to changes in wholesale petrol costs and net retail margins in
Canberra in the future.


Appendix 1 – Terms of Reference
Final Report: Investigation into motor
vehicle petrol prices in the ACT 85
Appendix 1 Terms of Reference
Australian Capital Territory
Independent Competition and Regulatory Commission (Investigation
into motor vehicle fuel prices in the ACT) Terms of Reference
Determination 2019
Disallowable Instrument DI2019-18
made under the
Independent Competition and Regulatory Commission Act 1997, section 15
(nature of industry references) and section 16 (terms of industry reference)
and section 16 (Terms of industry references)
1. Name of instrument
This instrument is the Independent Competition and Regulatory Commission
(Investigation into motor vehicle petrol prices in the ACT) Terms of
Reference Determination 2019.
2. Commencement
This instrument commences on the day after it is notified.
3. Industry reference for investigation (section 15)
I, Andrew Barr, Treasurer, pursuant to section 15(1)(e) of the Independent
Competition and Regulatory Commission Act 1997 (Act), provide an industry
reference to the Independent Competition and Regulatory Commission
(Commission) to undertake a factual analysis of automotive petrol prices and
competition in the ACT.
4. Terms of reference (section 16)
Pursuant to section 16(1) of the Act, I specify the following terms of
reference in relation to the conduct of the investigation:
1. The Commission is to have regard to the following in its investigation:
a. The average price of petrol in the ACT compared to Sydney, other
capital cities and regional towns in proximity to the ACT;
b. The average costs faced by ACT petrol suppliers compared to
Sydney, other capital cities and regional towns in proximity to the
ACT;

Appendix 1 – Terms of Reference
86 Final Report: Investigation into motor
vehicle petrol prices in the ACT
c. The drivers of price differentials and how petrol prices are
determined, including:
i. business models and pricing behaviours of petrol suppliers; and
ii. the structure of the market.
d. The nature of costs faced by petrol suppliers in the ACT, including
arrangements between petrol retailers and distributors, transport
costs, and local taxes fees and charges;
e. Whether there is effective competition in the ACT petrol
distribution and retail markets, taking into account:
i. the level of supplier concentration;
ii. barriers to market entry and the locations of petrol stations;
iii. any differences observed within the ACT market; and
iv. information available to consumers.
f. Any other matter the Commission considers relevant to the
investigation.
2. The Commission is to provide a final report to the Treasurer setting out:
a. the findings of the investigation; and
b. a summary of the data that has informed the findings of the
investigation.
3. In undertaking the investigation, the Commission is to:
a. provide a draft report, undertake public consultation and consider
submission in accordance with the Act; and
b. conclude the investigation and provide the final report to the
Treasurer by 28 June 2019.
Andrew Barr MLA
Treasurer
22 February 2019

Appendix 2 – Compliance with the Terms of Reference
Final Report: Investigation into motor
vehicle petrol prices in the ACT 87
Appendix 2 Compliance with the Terms of Reference
This appendix sets out how the Commission’s investigation complies with the Terms
of Reference.
Table A2.1 Compliance with the Terms of Reference
Clause Requirement Chapter Comments
Section 15 of the Act
To undertake a factual analysis of automotive petrol prices and competition in the ACT.
1, 2, 3, 4, 5 The report outlines the Commission’s investigation.
1.a The Commission is to have regard to the average price of petrol in the ACT compared to Sydney, other capital cities and regional towns in proximity to the ACT.
3, 4, 5 The Commission has examined prices in the ACT, Sydney, other capital cities and in towns in proximity to the ACT.
1.b The Commission is to have regard to the average costs faced by ACT petrol suppliers compared to Sydney, other capital cities and regional towns in proximity to the ACT.
5 The Commission has examined the costs faced by petrol suppliers in the ACT, Sydney, other capital cities and in towns in proximity to the ACT.
1.c The Commission is to have regard to the drivers of price differentials and how petrol prices are determined, including:
i. business models and pricing behaviours of petrol suppliers; and
ii. the structure of the market.
2, 3, 4, 5 The Commission examined the drivers of petrol price differentials and how prices are determined.
1.d The Commission is to have regard to the nature of costs faced by petrol suppliers in the ACT, including arrangements between petrol retailers and distributors, transport costs, and local taxes fees and charges.
5 The Commission examined the nature of costs faced by petrol suppliers in the ACT.
1.e The Commission is to have regard to whether there is effective competition in the ACT petrol distribution and retail markets, taking into account:
i. the level of supplier concentration; ii. barriers to market entry and the locations
of petrol stations; iii. any differences observed within the ACT
market; and iv. information available to consumers.
2, 4, 5 The Commission has considered the level of competition in ACT retail petrol markets and information available to consumers.
1.f The Commission is to have regard to any other matter the Commission considers relevant to the investigation.
1, 2, 3, 4, 5 Relevant factors have been considered by the Commission.
2. The Commission is to provide a final report to the Treasurer setting out:
i. the findings of the investigation; and ii. a summary of the data that has informed
the findings of the investigation
1, 2, 3, 4, 5 The Commission will provide a final report to the Treasurer on 28 June 2019. This report sets out its findings and the data on which the findings are based.

Appendix 2 – Compliance with the Terms of Reference
88 Final Report: Investigation into motor
vehicle petrol prices in the ACT
Clause Requirement Chapter Comments
3. In undertaking the investigation, the Commission is to:
i. provide a draft report, undertake public consultation and consider submission in accordance with the Act; and
ii. conclude the investigation and provide the final report to the Treasurer by 28 June 2019.
1, 2, 3, 4, 5 The Commission has released a draft report and undertaken stakeholder consultation. A final report will be provided to the Treasurer by 28 June 2019.

Appendix 3 – Compliance with the ICRC Act
Final Report: Investigation into motor
vehicle petrol prices in the ACT 89
Appendix 3 Compliance with the ICRC Act
This appendix sets out how the Commission’s investigation complies with the
provisions of the Independent Competition and Regulatory Commission Act 1997.
Table A3.1 Compliance with Section 7 of the ICRC Act
Section 7 Requirement Chapter Comments
(a) to promote effective competition in the interests of consumers
1, 2, 3, 4, 5 The Commission has been asked to undertake a factual analysis of the ACT petrol market. The report includes findings on competition and factors affecting competition in the ACT retail petrol market.
(b) to facilitate an appropriate balance between efficiency and environmental and social considerations
n.a. n.a.
(c) to ensure non-discriminatory access to monopoly and near monopoly infrastructure
n.a. n.a.


Abbreviations and acronyms
Final Report: Investigation into motor
vehicle petrol prices in the ACT 91
Abbreviations and acronyms
ABS Australian Bureau of Statistics
ACAPMA Australian Convenience and Petroleum Marketers Association
ACCC Australian Competition and Consumer Commission
ACT Australian Capital Territory
CA Commission Agents
Commission Independent Competition and Regulatory Commission
COCOs Company Owned and Company Operated
CPL Cents per litre
DODO Dealer Owned and Dealer Operated
GIRD Gross Indicative Retail Difference
GST Goods and Services Tax
ICRC Independent Competition and Regulatory Commission
ICRC Act Independent Competition and Regulatory Commission Act 1997
IPART The Independent Pricing and Regulatory Tribunal
LPG Liquid Petroleum Gas
NRMA National Roads and Motorists’ Association
NSW New South Wales
NT Northern Territory
QLD Queensland
RAA Royal Automobile Association of South Australia
RACQ Royal Automobile Club of Queensland
RACT Royal Automotive Club of Tasmania
RACV Royal Automobile Club of Victoria
RULP Regular Unleaded Petrol
SA South Australia
TGP Terminal Gate Price
WA Western Australia


References
Final Report: Investigation into motor
vehicle petrol prices in the ACT 93
References
ABS 2017, Media release, More than two in three drive to work, Census reveals,
available at
https://www.abs.gov.au/AUSSTATS/[email protected]/mediareleasesbyReleaseDate/7DD
5DC715B608612CA2581BF001F8404?OpenDocument, accessed 12 April 2019.
ABS 2018, Survey of Motor Vehicle Use, Australia, 12 months ended 30 June 2018;
Catalogue number: 9208.0.
ABS 2019a, Australian Demographic Statistics, Sep 2018, Catalogue number: 3101.0,
Estimated Resident Population by Single Year of Age.
ABS 2019b, Household and Family Projections, Australia, 2016 to 2041, Catalogue
number: 3236.0.
ACAPMA 2016, iScan 2016 - An overview of the Australian retail fuels market,
available at https://acapma.com.au/wp-
content/uploads/2016/06/ACA097_ACAPMA_industry_scan_report.pdf.
ACAPMA 2017, Submission to Victorian Parliament’s Economic, Education, Jobs &
Skills Committee’s Inquiry into fuel prices in Regional Victoria, EEJSC
Submission No. 32, September 2017.
ACAPMA 2018, Coles’ fuel business under the pump as volumes continue to fall,
available at acapmag.com.au/2018/10/coles-fuel-business-under-the-pump-as-
volumes-continue-to-fall, accessed 18 April 2019.
ACAPMA 2019, Submission to the ACT’s Legislative Assembly Select Committee on
Fuel Pricing, 25 February, submission no. 17.
ACCC 2012, Fuel facts: International prices drive Australia’s fuel prices, available at
https://www.accc.gov.au/publications/fuel-facts/fuel-facts-international-prices-
drive-australias-fuel-prices.
ACCC 2014, Monitoring of the Australian petroleum industry 2014 - Report of the
ACCC into the prices, costs and profits of unleaded petrol in Australia.
ACCC 2016, Report on the Armidale petrol market, available at
https://www.accc.gov.au/publications/petrol-market-studies/report-on-the-
armidale-petrol-market.
ACCC 2017, Report on the Brisbane petrol market, available at
https://www.accc.gov.au/system/files/Report%20on%20the%20Brisbane%20petr
ol%20market%E2%80%94October%202017_0.pdf.
ACCC 2018a, Petrol price cycles in Australia, December.

References
94 Final Report: Investigation into motor
vehicle petrol prices in the ACT
ACCC 2018b, Petrol prices are not the same: report on petrol prices by major retailer
in 2017.
ACCC 2018c, Retail and wholesale petrol market shares in Australia.
ACCC 2019a, Petrol price cycles, available at
https://www.accc.gov.au/consumers/petrol-diesel-lpg/petrol-price-cycles,
accessed 29 March 2019.
ACCC 2019b, Report on the Australian petroleum market—December quarter 2018.
ACCC 2019c, Submission to the ACT’s Legislative Assembly Select Committee on
Fuel Pricing, 25 February, submission no. 12.
ACCC 2019d, Fuel Reports, available at https://www.accc.gov.au/regulated-
infrastructure/fuel/acccs-fuel-monitoring-role.
ACT Legislative Assembly 2019a, Hansard of the Select Committee on Fuel Pricing
hearing, 10 April 2019.
ACT Legislative Assembly 2019b, Hansard of the Select Committee on Fuel Pricing
hearing, 28 March 2019.
ACT Legislative Assembly 2019c, Select Committee on Fuel Pricing, Interim report on
inquiry into ACT fuel pricing, 31 May 2019.
AFR 2019, Coles signs new fuel deal with Viva, says convenience earnings will fall
62pc, available at https://www.afr.com/business/retail/coles-signs-new-fuel-deal-
with-viva-says-convenience-earnings-will-fall-62pc-20190206-h1awom.
AIP 2013, Maintaining supply security and reliability for liquid fuels in Australia.
AIP 2019, Terminal Gate Price data, available at
https://www.aip.com.au/pricing/terminal-gate-prices, accessed 18 April 2019.
ATO 2019, Excise rates for fuel, available at https://www.ato.gov.au/business/excise-
and-excise-equivalent-goods/fuel-excise/excise-rates-for-fuel/, accessed 16 April
2019.
DEE 2019, Australian Petroleum Statistics, Canberra, 15 February; available at
https://www.energy.gov.au/sites/default/files/australian_petroleum_statistics_-
_issue_271_feb_2019.pdf, accessed 16 April 2019.
Gasbuddy 2019, Website, available at https://www.gasbuddy.com.
ICRC 2001, Inquiry into Motor Vehicle Fuel Prices.
Informed Sources 2019, Motormouth website, available at https://motormouth.com.au.

References
Final Report: Investigation into motor
vehicle petrol prices in the ACT 95
Informed Sources 2019, Submission to the ACT’s Legislative Assembly Select
Committee on Fuel Pricing, 25 February, submission no. 14.
IPART 2015, Ethanol mandate - Options to increase the uptake of ethanol blended
petrol.
NSW Government, A history of ethanol blended petrol in NSW, available at
e10fuelforthought.nsw.gov.au/history, accessed 30 April 2019.
NSW Government, FuelCheck website, available at
https://www.fuelcheck.nsw.gov.au/app.
NT Government, MyFuelNT website, available at https://myfuelnt.nt.gov.au
RACQ 2019, website, available at https://www.racq.com.au/cars-and-
driving/cars/owning-and-maintaining-a-car/fuel-prices.
Reuters 2014, Vitol pays $2.6 billion for Shell's Australian refinery, petrol stations;
available at https://www.reuters.com/article/us-australia-companies-shell/vitol-
pays-2-6-billion-for-shells-australian-refinery-petrol-stations-
idUSBREA1K02820140221, accessed 16 April 2019.
SBS 2019, Coles and Viva Energy enter new fuel deal, available at
sbs.com.au/news/coles-and-viva-energy-enter-new-fuel-deal, accessed 18 April
2019.
The Treasurer the Hon Scott Morrison 2017, Ministerial Direction to the ACCC under
section 95ZE of the Competition and Consumer Act 2010, available at
https://www.accc.gov.au/system/files/Treasurer%20to%20ACCC%20Chair%20-
%20Fuel%20monitoring.pdf, accessed 29 March 2019.
Viva Energy 2019, Submission to the ACT’s Legislative Assembly Select Committee
on Fuel Pricing, 25 February, submission no. 20.
Voyager Technologies International Limited 2017, Submission to Victorian
Parliament’s Economic, Education, Jobs & Skills Committee’s Inquiry into fuel
prices in Regional Victoria, EEJSC submission no 4, 4 July 2017.
WA Government, FuelWatch, available at
https://www.fuelwatch.wa.gov.au/fuelwatch/pages/home.jspx.
Woolworths Group 2018, Media Release, Woolworths Group to sell Petrol business
and enter into commercial alliance with EG Group, available at
https://www.woolworthsgroup.com.au/page/media/Latest_News/woolworths-
group-to-sell-petrol-business-and-enter-into-commercial-alliance-with-eg-group,
accessed 16 April 2019.