final report jfsp project number: 12-3-01-3 · final report jfsp project number: 12-3-01-3 ... that...
TRANSCRIPT
1
FINAL REPORT
JFSP Project Number: 12-3-01-3
Project Title: Is spatial heterogeneity of burn severity
changing with warming climate and increasing wildfire?
Principal Investigator:
Dr. Monica G. Turner, Department of Zoology, University of Wisconsin, Madison,
WI 53706; 608-262-2592; Email: [email protected]
Student Investigator:
Brian J. Harvey, University of Wisconsin, Madison, WI (PhD student)
This research was sponsored in part by the Joint Fire Science Program. For further
information go to: www.firescience.gov
2
ABSTRACT
Fire activity is increasing in most parts of the world, and trends are especially strong in
the Northern Rocky Mountains. Although studies have begun to examine temporal trends in
severity, surprisingly little is known about how the spatial configuration of within-fire burn
severity may be changing with increasing wildfire. Broad-scale studies of trends in fire activity
thus far have not characterized the ecologically significant spatial complexity within fire
perimeters. In addition to temporal trends in burn severity, it is critical to understand how the
spatial configuration of within-fire patterns of burn severity may be changing under a warming
climate to anticipate changes in forested ecosystems and services they provide.
We examined recent (1984-2010) temporal trends in spatial patterns of burn severity in
733 large wildfires (> 200 ha) across the Northern Rockies to address two questions. (1) How
has spatial heterogeneity of burn severity changed during the last 25 years, and where are these
landscape patterns changing most rapidly? (2) Do changes in spatial heterogeneity of burn
severity vary (a) among forest types, (b) with topographic position or levels of complexity, (c)
under different land management scenarios, and (d) with climate? Field data were collected
during summer 2012 on 186 fire-severity plots situated throughout the Northern Rockies in areas
that burned in 2011. Fire severity for all forest fires that burned from 1984-2010 in the Northern
Rockies was then mapped using the relative differenced normalized burn ratio (RdNBR) and
calibrated with the postfire data (n = 186 plots). After determining a RdNBR threshold for stand-
replacing fire using a logistic model, we converted burn severity maps to categorical maps of
stand-replacing (> 90% of pre-fire live basal area killed by fire) or non-stand-replacing (> 10%
of pre-fire live basal area still alive after fire) fire and tested our predictions on independent
model validation plots (n = 185). The model performed well (overall accuracy 71%, Kappa =
0.35) and predicted that 33% of the 3,872,568 ha of forest that burned in the Northern Rockies
between 1984 and 2010 was stand-replacing fire. Landscape metrics were computed for each
year (using every fire in the study period) and evaluated for potential changes in burn
heterogeneity over this period of warming climate and increased annual area burned, producing
region-wide measures of spatial patterns in areas of stand-replacing fire.
Graduate student funding for this project has been largely to support summer field data
collection, which is now complete (186 fire severity plots sampled in 2012). Most of 2013 was
spent on data preparation (field data and imagery processing) and building statistical models
between field measures of burn severity and RdNBR indices. Thresholds of RdNBR that relate to
empirical measures of fire severity were identified. Analysis of spatial patterns of burn severity
and comparisons with drivers (research question 2) is continuing with an expected completion
date of December 2013. Continuing work will entail the following tasks. Region-wide maps are
being produced to identify locations where the rate of change in spatial heterogeneity of burn
severity is most rapid and thus the risk of landscapes shifting to alternative states may be high.
Statistical relationships between downscaled (12 km x 12 km) climate variables and measures of
spatial heterogeneity of burn severity for all large forest fires in the N. Rockies during the period
1984-2010 in different topographic contexts, forest types, and management settings are currently
being analyzed.
Results so far have been presented at one professional conference and one agency
webinar. Preparation of the first manuscript from this work is underway and submittal will be by
December 2013. The second manuscript will be submitted by June 2014.
3
BACKGROUND AND PURPOSE
In fire-prone regions, the resiliency of forested ecosystems is greatly influenced by
spatial heterogeneity of burn severity. Fire frequency and area burned are increasing in most
parts of the world (Flannigan et al. 2009), but little is known about how the spatial configuration
of fire severity (the effects of fire on an ecosystem) may be changing with increasing wildfire.
The frequency of large forest fires has increased in the western US since the mid 1980s in
association with warmer temperatures and earlier spring snowmelt (Westerling et al. 2006). This
trend is strongest in Northern Rocky Mountain (N. Rockies) forests where 5 of the 11 years with
the most area burned in the last century have occurred since the late 1980s (Morgan et al. 2008)
and qualitative shifts in fire regimes are projected by mid 21st century (Westerling et al. 2011).
Recent research has examined changes in fire activity associated with warming climate, but the
spatial resolution of broad-scale studies has been largely limited to characterizing fires as points
or homogeneous polygons. Regional analyses of the spatial complexity of fires have so far
focused on burn perimeters (shape) only (Rollins et al. 2001, Parisien et al. 2006). While
informative, this resolution overlooks the significant spatial complexity that occurs within fire
perimeters. Additional research has begun to examine regional-scale trends in burn severity
(Miller et al. 2008, 2011, Miller and Safford 2012), but almost no studies to date have examined
potential changes in spatial heterogeneity of burn severity that may be accompanying non-spatial
trends in severity.
Powerful analytic tools now exist to study spatial variability in burn severity over space
and time. The multi-agency Monitoring Trends in Burn Severity project (www.mtbs.gov)
provides valuable catalogued data of fire perimeters and severity indices for fires in recent years.
Recent advances in burn severity indices have proven reliable over large regions and multi-
decade time periods when coupled with extensive ground data (Miller et al. 2009) and landscape
metrics that quantify ecologically important measures of spatial heterogeneity are well
established (O’Neill et al. 1999).
Understanding how spatial patterns of burn severity may be changing under a warming
climate is critical to predict broad-scale changes in forested ecosystems and the services they
provide. Postfire successional trajectories, carbon storage, nutrient cycling, wildlife habitat, and
hydrology are affected not only by the amount of different burn severities, but also spatial
heterogeneity of burn severity (Turner et al. 2013). For example the amount and configuration of
edge between burned/unburned forest patches in a fire influences distance to seed source(Turner
et al. 1994, Donato et al. 2009). Assessing trends in fire severity is a top priority for informing
policy in the US (Fleishman et al. 2011), and characterizing within-fire heterogeneity is
important for federal fire policy (Stephens and Ruth 2005). Illustrating locations where the rate
of change in disturbance severity is rapidly occurring can help forecast the potential for
landscape traps (Lindenmayer et al. 2011) - areas where landscapes can be shifted to an
alternative state by disturbance feedbacks. Examining links between climate and changes in
spatial heterogeneity of burn severity has considerable ecological and societal relevance and is
critical for informing fire management in the US. My study directly addresses the mission and
goals of the Joint Fire Science Program by advancing knowledge about the relationship between
climate change and fire effects.

4
In this study, I examine recent temporal trends in spatial patterns of burn severity in large
wildfires (> 200 ha) across the N. Rockies. Using field data and remote sensing to map fire
severity and analyze burn-severity patterns, I address two primary questions: (1) How has spatial
heterogeneity of burn severity changed during the last 25 years in the N. Rockies, and where are
these landscape patterns changing most rapidly?(2) Do changes in spatial heterogeneity of burn
severity vary (a) among forest types, (b) with topographic position or levels of complexity, (c)
under different land management, and (d) with climate?
STUDY DESCRIPTION AND LOCATION
The N. Rockies study region follows Westerling et al. (2011) and the JFSP boundary for
the Northern Rockies Fire Science Network (http://nrfirescience.org/), stretching from the GYE
in western Wyoming to the US/Canada border at the northern tip of Idaho. Forests are conifer-
dominated and vary compositionally with elevation, moisture, and latitude (Baker 2009).
Historical fire regimes range from low-frequency, high-severity (stand-replacing) regimes in
higher elevation and mesic forests to more frequent, mixed-severity regimes in lower elevation
forests (Baker 2009).
Figure 1: Northern Rockies region (study area outlined in red) and continental context (inset
map). Green cells represent forested area (data source: NLCD).
5
Question 1: How has spatial heterogeneity of burn severity changed during the last 25 years in
the N. Rockies, and where are these landscape patterns changing most rapidly?
This portion of the study combines field measurements and remotely sensed indices of
fire severity to analyze spatial heterogeneity of burn severity throughout the region, and is
described below in sections corresponding to each component.
Data acquisition
Fire perimeters and Landsat TM-derived burn severity layers for all fires in the study area
(1984-2010) were downloaded from the Monitoring Trends in Burn Severity website (mtbs.gov).
Fires occurring in non-forest areas (< 50% of area within burn perimeter was covered by forest
pre-fire) were excluded. Fire severity was mapped using the relative differenced normalized burn
ratio (RdNBR) provided in MTBS data for each fire. This RdNBR metric has been shown to be
preferable to absolute measures of burn severity when comparing multiple fires across a wide
region (Miller and Thode 2007, Miller et al. 2009). Preliminary analysis comparing RdNBR
maps computed from Landsat images using top-of-atmosphere reflectance (i.e., images available
on the MTBS website) vs. those calibrated to surface reflectance using the LEDAPS processing
system (Masek et al. 2006) indicated no significant difference; therefore the RdNBR maps from
MTBS were used for all analyses. The RdNBR raster grid for each fire was re-projected and
clipped to the fire perimeter prior to analysis.
Burn severity field measurements
During summer 2012, 186 fire-severity plots were sampled in seven fires that burned in
2011 throughout the study area (Fig. 2, Table 1). Plots in each fire were located within 100-1000
m from roads and trails for accessibility, and separated by a minimum distance of 400 m to
reduce spatial autocorrelation. Preliminary analysis (100 plots from a fire that burned in 2008,
data not shown) showed fire severity metrics to be spatially correlated at distances up to 395 m.
Each fire contained between 16 and 43 plots, depending on accessible area, and plots within a
fire were equally distributed among 4 categorical fire severity classes (unburned, light surface
fire, severe surface fire, and crown) (Turner et al. 1997).
We quantified fire severity in each plot using field measures of fire effects in multiple
strata. Canopy-fire severity was measured on five randomly selected co-dominant canopy trees
in each quadrant (20 trees per plot) by recording the maximum char height to the nearest 0.5 m
and the maximum percentage of scorching around the circumference on the main bole of each
selected tree. Fire-caused tree mortality was recorded by classifying every fire-damaged tree >
1.4 m in the plot that was alive at the time of fire but dead at the time of sampling as killed by
fire. The percentage of post-outbreak live trees and basal area that were killed by fire was used to
measure fire severity on the residual canopy after the outbreak. Surface-fire severity was
measured by recording the depth of post-fire litter + duff (i.e., the soil O horizon) to the nearest
mm at every 3 m along the main axis of the plot (20 pts / plot) and by recording the percent
cover of charred surface (mineral soil, litter, woody debris), using the point intercept method.
Points were spaced at 10-cm intervals along the main axis of the plot (480 pts / plot).

6
Table 1. Fires where field data were collected. Field data were collected in the 186 plots used for
model development under this project; the 185 plots used for model validation were sampled
under previous projects.
Fire name Location
Fire size
(ha)
Number of
plots
Fires for model development
Red Rock Complex Bridger-Teton National Forest, WY 4,850 43
Salt Fire Salmon-Challis National Forest, ID 9.916 40
Saddle Fire Salmon-Challis National Forest, ID 12,950 40
East Fork Fire Nez Perce National Forest, ID 4,047 16
Lutz Fire Beaverhead-Deerlodge National Forest, MT 1,612 7
Forty-one Complex Bitterroot National Forest, MT 6,130 21
Puzzle Creek Fire Flathead National Forest, MT 639 16
Fires for model validation
New Fork Lakes Fire Bridger-Teton National Forest, WY 6,106 100
Gunbarrel Fire Shoshone National Forest, WY 27,200 85
Figure 2. Location of study fires (n = 7) where field data were collected for model development
(n = 186 plots in seven fires) and model validation (n = 185 plots in two fires). Green cells
represent forested area (data source: NLCD).

7
Using field data to calibrate and validate burn severity maps
To calibrate RdNBR burn-severity maps to and ecologically meaningful value of stand-
replacing fire, we developed statistical relationships between field measures of canopy-tree fire
mortality and RdNBR values for our field data. We define stand-replacing fire to mean 90% of
the pre-fire live basal area was killed by fire. Using the 186 field plots from fires that burned in
2011 (Table 1), we built linear and logistic models to test the relationship between RdNBR
values and basal area killed by fire to find the best estimate of an RdNBR threshold for stand-
replacing fire (> 90% of pre-fire live basal area was killed by fire). To validate the best model for
predicting stand-replacing fire we used 185 independent burn severity plots from fires that
burned in 2008 in the GYE. Burn severity (stand replacement or not) was predicted for each of
these 185 plots based on their RdNBR value, and model performance was evaluated using
predictive accuracy (user’s, producer’s, and overall) and the Kappa statistic. Ongoing work is
mapping other levels of fire severity (e.g., unburned, low, moderate severity); however these
classes of fire severity can be affected by the subjective delineation of burn perimeters. For this
reason and because high-severity fire is where the greatest magnitude ecological change occurs,
we focus this analysis on high-severity (stand-replacing).
Generating maps of stand-replacing fire
Using the RdNBR threshold for stand-replacing fire (90% basal area killed by fire), we
converted each burn severity map to a binary fire severity map where each cell within the fire
perimeter was assigned a 0 (RdNBR < stand replacement threshold) or 1 (RdNBR > stand
replacement threshold). This was performed for each forest fire in the Northern Rockies (1984-
2010).
Calculating landscape metrics of burn severity patterns
Landscape metrics were calculated initially on categorized burn-severity maps (stand
replacing, less than stand-replacing) for each fire in the study period and combined in a mosaic
raster for each year. Patches of stand-replacing fire were defined using a smoothing filter
window (3x3 grid cells) and using an 8-neighbor rule for patch delineation prior to computing
landscape metrics using Patch Analyst 5 for ArcGIS 10.0
(http://www.cnfer.on.ca/SEP/patchanalyst/).
Question 2: Do changes in spatial heterogeneity of burn severity vary (a) among forest types, (b)
with topographic position or levels of complexity, (c) under different land management, and (d)
with climate?
Ongoing work for Question 2:
This component of the project is currently underway. Completion is anticipated in
December 2013.
Within-fire spatial patterns in burn severity are driven by many factors including climate,
weather, topography, and fuels (Turner et al. 1994, Collins et al. 2007) and can be further
affected by prior disturbances and management (Collins et al. 2009). The El Niño Southern
Oscillation and Pacific Decadal Oscillation are related to inter-annual changes in the occurrence

8
of large fires (Schoennagel et al. 2005), but connections between climate and spatial
heterogeneity of burn severity have not been examined to date. Depending on which factor(s) are
most influential in generating heterogeneity, climate change in the N. Rockies may be
significantly altering spatial patterns of burn severity. Current work is assessing the degree to
which climate is correlated with spatial heterogeneity of burn severity, and examining changes in
burn heterogeneity among different forest types, topographic contexts, and land management.
Gridded topographic information has been acquired from the USGS National Elevation
Dataset (NED) at ~30 m resolution to generate topographic variables (elevation, slope, aspect,
topographic complexity) for each grid cell in a fire. Forest cover-type data has been acquired
from LANDFIRE (landfire.gov) at 30-m resolution. Fires are being categorized by forest type,
topographic context and land-management agency (US Forest Service, National Park Service,
Bureau of Land Management, private lands). I am using ANOVA to assess how changes in
spatial heterogeneity of burn severity (Question 1) vary among categories. Climate data have
been acquired from existing downscaled (12 km x 12 km) monthly temperature and precipitation
data generated for the N. Rockies by my collaborators (Westerling et al. 2011). Each cell in the
study is being assigned monthly average temperature and precipitation values. Each fire will be
assigned the temperature, precipitation, and burn index (Collins et al. 2009) values (mean and
95th
percentiles) from the underlying cell for a one-year time period preceding the fire, and for
the duration of the fire. General linear models (with terms for spatial autocorrelation among
fires) will be used to assess the relationship between climate variables and metrics of spatial
heterogeneity of burn severity. Completion of this project is anticipated by December 2013.
KEY FINDINGS
Fire activity in the Northern Rockies (1984-2010)
Between 1984 and 2008, a total of 733 named forest fires larger than 200 ha occurred in
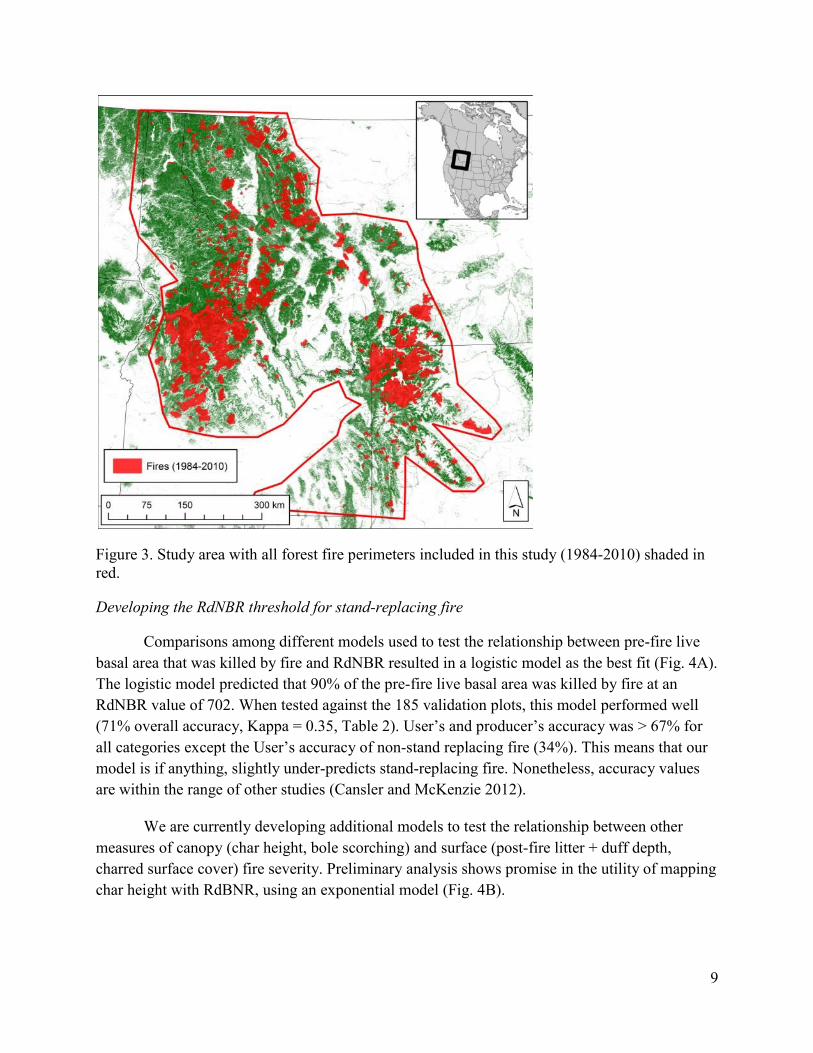
the N. Rockies forests, burning 3,872,568 ha in total (Figure 3). We do not present descriptive
statistics of the named fires, as each named fire in the MTBS database can represent either a
single fire event or multiple fire events that were managed as a fire complex. Rather, our analysis
focuses on objective delineations of severely burned area within these 733 fires.
9
Figure 3. Study area with all forest fire perimeters included in this study (1984-2010) shaded in
red.
Developing the RdNBR threshold for stand-replacing fire
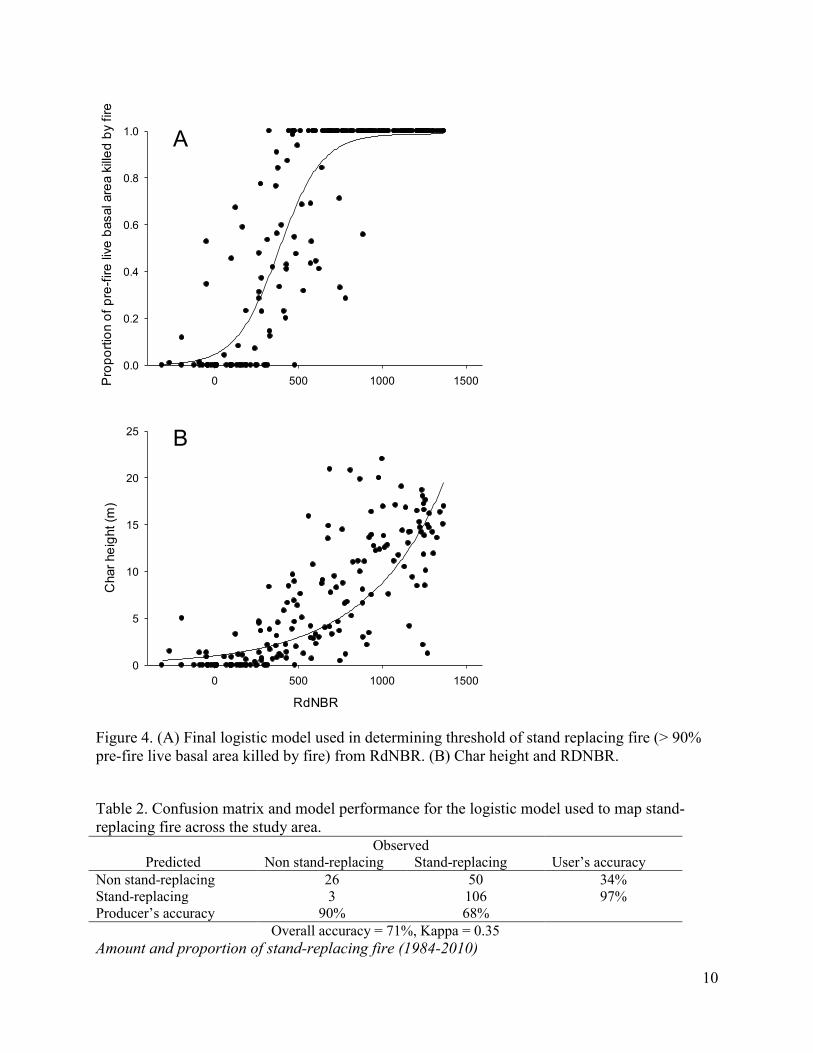
Comparisons among different models used to test the relationship between pre-fire live
basal area that was killed by fire and RdNBR resulted in a logistic model as the best fit (Fig. 4A).
The logistic model predicted that 90% of the pre-fire live basal area was killed by fire at an
RdNBR value of 702. When tested against the 185 validation plots, this model performed well
(71% overall accuracy, Kappa = 0.35, Table 2). User’s and producer’s accuracy was > 67% for
all categories except the User’s accuracy of non-stand replacing fire (34%). This means that our
model is if anything, slightly under-predicts stand-replacing fire. Nonetheless, accuracy values
are within the range of other studies (Cansler and McKenzie 2012).
We are currently developing additional models to test the relationship between other
measures of canopy (char height, bole scorching) and surface (post-fire litter + duff depth,
charred surface cover) fire severity. Preliminary analysis shows promise in the utility of mapping
char height with RdBNR, using an exponential model (Fig. 4B).
10
Figure 4. (A) Final logistic model used in determining threshold of stand replacing fire (> 90%
pre-fire live basal area killed by fire) from RdNBR. (B) Char height and RDNBR.
Table 2. Confusion matrix and model performance for the logistic model used to map stand-
replacing fire across the study area. Observed
Predicted Non stand-replacing Stand-replacing User’s accuracy
Non stand-replacing 26 50 34%
Stand-replacing 3 106 97%
Producer’s accuracy 90% 68%
Overall accuracy = 71%, Kappa = 0.35
Amount and proportion of stand-replacing fire (1984-2010)
0 500 1000 1500Pro
po
rtio
n o
f p
re-f
ire
liv
e b
asal are
a k
ille
d b
y f
ire
0.0
0.2
0.4
0.6
0.8
1.0
RdNBR
0 500 1000 1500
Char
he
ight (m
)
0
5
10
15
20
25
A
B
11
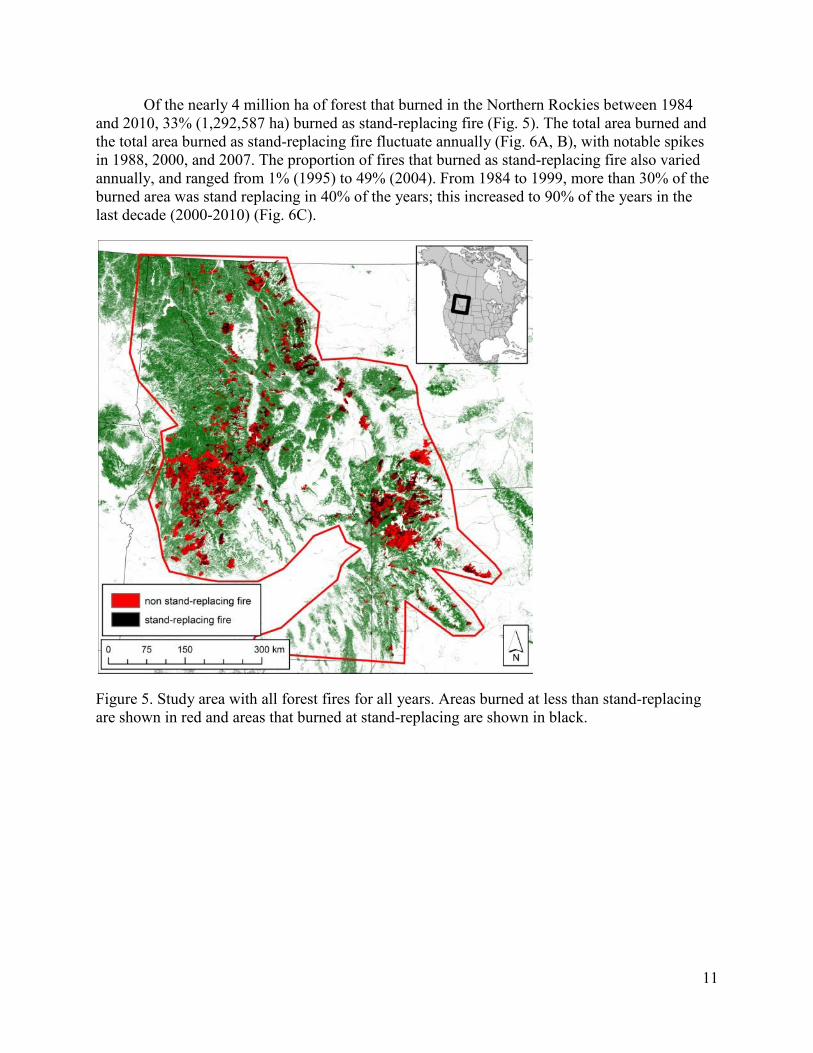
Of the nearly 4 million ha of forest that burned in the Northern Rockies between 1984
and 2010, 33% (1,292,587 ha) burned as stand-replacing fire (Fig. 5). The total area burned and
the total area burned as stand-replacing fire fluctuate annually (Fig. 6A, B), with notable spikes
in 1988, 2000, and 2007. The proportion of fires that burned as stand-replacing fire also varied
annually, and ranged from 1% (1995) to 49% (2004). From 1984 to 1999, more than 30% of the
burned area was stand replacing in 40% of the years; this increased to 90% of the years in the
last decade (2000-2010) (Fig. 6C).
Figure 5. Study area with all forest fires for all years. Areas burned at less than stand-replacing
are shown in red and areas that burned at stand-replacing are shown in black.

12
Figure 6. Total area burned overall (A) and as stand-replacing fire (B), and percentage of burned
area as stand-replacing fire (C) for all forest fires (1984-2010) in the Northern Rockies, by year.
Configuration of stand-replacing fire (1984-2010)
The 1,292,587 ha that burned as stand-replacing fire between 1984 and 2010 was
distributed among 173,183 individual patches. Patch size ranged from 0.09 ha (one Landsat TM
0
50,000
100,000
150,000
200,000
250,000
300,000
350,000
400,000
1980 1985 1990 1995 2000 2005 2010 2015
Stan
d-r
ep
laci
ng
are
a b
urn
ed
(h
a)
0%
10%
20%
30%
40%
50%
60%
1980 1985 1990 1995 2000 2005 2010 2015
Stan
d-r
ep
laci
ng
are
a b
urn
ed
(h
a)
0
100,000
200,000
300,000
400,000
500,000
600,000
700,000
800,000
900,000
1,000,000
1980 1985 1990 1995 2000 2005 2010 2015
Tota
l are
a b
urn
ed
(h
a)A
B
C
Perc
ent
of a
rea
burn
ed a
s st
and
repl
acin
g

13
pixel) to 25,584 ha, with 75% of patches smaller than 1 ha (Fig. 7). Maximum patch size did not
exceed ~2,500 ha in most years; the large fire years of 1988, 2000, and 2007 being exceptions
(Fig. 8).
Figure 7. Frequency distribution of all patches of stand-replacing fire (n = 173,184) in Northern
Rockies forests (1984-2010) by patch size. X-axis is log-scale.
Figure 8. Patch sizes (ha) for stand-replacing fire (n = 173,184 patches) in Northern Rockies
forests (1984-2010).
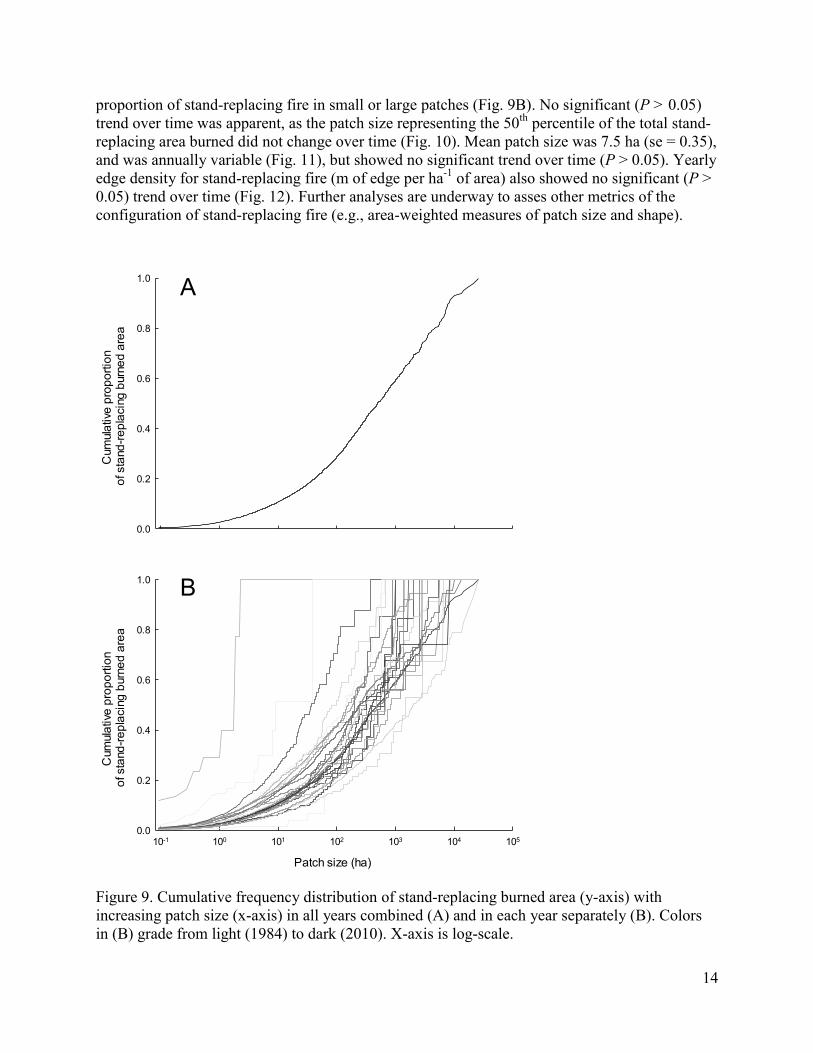
The cumulative frequency distribution for all fires across all years indicates that 50% of
the total burned area occurred in patches larger/smaller than ~1,000 ha (Fig. 9A). Separate
cumulative frequency distributions for each year indicated year-to-year variability in the
0 1 10 100 1000 10000
Patch area (ha)
50,000
40,000
30,000
20,000
10,000
60,000
100000
Nu
mb
er o
f pat
ches
Year
Pat
ch s
ize
(ha)
14
proportion of stand-replacing fire in small or large patches (Fig. 9B). No significant (P > 0.05)
trend over time was apparent, as the patch size representing the 50th
percentile of the total stand-
replacing area burned did not change over time (Fig. 10). Mean patch size was 7.5 ha (se = 0.35),
and was annually variable (Fig. 11), but showed no significant trend over time (P > 0.05). Yearly
edge density for stand-replacing fire (m of edge per ha-1
of area) also showed no significant (P >
0.05) trend over time (Fig. 12). Further analyses are underway to asses other metrics of the
configuration of stand-replacing fire (e.g., area-weighted measures of patch size and shape).
Figure 9. Cumulative frequency distribution of stand-replacing burned area (y-axis) with
increasing patch size (x-axis) in all years combined (A) and in each year separately (B). Colors
in (B) grade from light (1984) to dark (2010). X-axis is log-scale.
Patch size (ha)
10-1 100 101 102 103 104 105
Cum
ula
tive
pro
po
rtio
n
of sta
nd
-re
pla
cin
g b
urn
ed
are
a
0.0
0.2
0.4
0.6
0.8
1.0
Cum
ula
tive
pro
po
rtio
n
of sta
nd
-re
pla
cin
g b
urn
ed
are
a
0.0
0.2
0.4
0.6
0.8
1.0
A
B

15
Figure 10. The 50
th percentile patch size (patch size from cumulative frequency distribution at
which 50% of stand-replacing area was burned, in ha) in each year. There was no significant
trend over time (P > 0.05).
Figure 11. Mean patch size (ha) of stand-replacing fire by year. Error bars are 95% confidence
intervals. No significant change over time (P > 0.05).
Figure 12. Edge density (m ha
-1) for stand-replacing fire. Edge density showed no change over
time (P > 0.05).
0
500
1000
1500
2000
2500
1980 1985 1990 1995 2000 2005 2010 2015
50
thp
erc
en
tile
pat
ch s
ize
(h
a)
Year
0
5
10
15
20
25
30
35
40
1980 1985 1990 1995 2000 2005 2010 2015
Me
an p
atch
siz
e (
he
ctar
es)
0
10
20
30
40
50
60
70
1980 1985 1990 1995 2000 2005 2010 2015
Edge
de
nsi
ty (
m h
a-1
)
16
MANAGEMENT IMPLICATIONS
As this work is still in progress and will be completed by December 2013, management
implications are pending. However, current trends in the data can be informative to management.
First, our statistical relationship between RdNBR and field-measures of fire severity are
critical for broad-scale assessments of quantitative fire effects across the Northern Rockies.
While relationships between field measures and satellite measures of fire severity have been
developed for other regions (e.g., Miller et al. 2009, Cansler and McKenzie 2012), information
was lacking across the Northern Rockies prior to this study. With completion of additional
analyses using our field data (currently underway), we will further develop relationships between
other continuous measures of canopy and surface fire severity (e.g., bole scorch, surface char,
post-fire litter and duff). This will be informative to managers who want to know how RdNBR
translates to individual components of fire effects and can complement information collected
immediately (< 1 yr) after the fire (Hudak et al. 2007).
Second, our ability to reliably map areas that burned as stand-replacing fire will help
managers know where fire has killed ~90% of the pre-fire live basal area, as this level of pre- to
post-fire change is ecologically important. It is important to remember that stand-replacing fire
does not necessarily equate to negative ecological consequences, as many forest types in the
Northern Rockies are adapted to stand-replacing fire through canopy seedbanks (i.e, serotiny) or
wind-dispersal (Baker 2009) and average post-fire seedling densities can exceed pre-fire
densities (Turner et al. 1999). However, if natural post-fire regeneration does not occur following
stand-replacing fire, these areas represent potential locations where forest may transition to non-
forest (i.e., savanna, shrubland, or grassland). Ongoing work is directly addressing the spatial
configuration of stand-replacing fire to assess other important factors such as distance to seed
source.
Early results are encouraging to managers because spatial heterogeneity of stand-
replacing fire within burned perimeters has been maintained over a period of increasing fire
activity. While over 1,000,000 ha have burned as stand-replacing fire since 1984, the large
amount of this fire in smaller patches means that few areas across the Northern Rockies are post-
fire “moonscapes.” Natural heterogeneity in burn severity is an inherent component of fire
regimes, and allowing natural fires to create heterogeneity is integral to maintenance of forest
ecosystem services (Turner et al. 2013). Further, management actions that can potentially
homogenize burned areas (e.g., burnouts of unburned forest along edge or islands in the middle
of fires) may decrease ecologically significant heterogeneity (Stephens et al. 2013).
RELATIONSHIP TO OTHER RECENT FINDINGS AND ONGOING WORK
Statistical relationships between field and satellite measures of burn severity
Rapid field-assessments of fire severity are commonly conducted using the composite
burn index (CBI) method (Key and Benson 2005). While the CBI is useful for widespread
characterization of fire severity, it is semi-quantitative, because observers assign an ordinal score
of fire severity to several vertical strata in a plot. By quantitatively measuring canopy and surface
fire severity in our plots, we are able to assign quantitative ecological meaning (e.g., % basal

17
area mortality, char height, surface charring) to RdNBR values. While this has been done in
immediate post-fire environments (Hudak et al. 2007) and in other regions (Miller et al. 2009,
Cansler and McKenzie 2012), our data can assist in mapping ground-calibrated measures of fire
severity for the Northern Rockies region.
Patterns of stand-replacing fire
Our project brings a new and important perspective to research examining the recent
increase in fire activity in the Western US. The availability of Landsat-derived burn severity data
has led to an increase in studies examining fire severity trends in different US regions (Miller et
al. 2011, Dillon et al. 2011). However, most studies have either excluded the spatial pattern of
burn severity in their analyses or focused on spatial patterns in a small number of fires in a single
study area (Collins and Stephens 2010). Our project allows us to track trends in these
ecologically important metrics of forest condition over a wide region and time period.
Post-fire dynamics in stand-replacing patches
Stand-replacing patches of fire in a range of sizes and configurations are not outside the
historical range of variability in many conifer systems in the western US (Williams and Baker
2012b, 2012a), but whether or not post-fire tree regeneration is occurring in different post-fire
climates is an open question. The relationship between spatial patterns of burn severity and post-
fire tree establishment has been examined in lower elevation forests of the Western US (Lentile
et al. 2005, Haire and McGarigal 2008, 2010), but less is known across the higher elevation
forests in the Northern Rockies. With additional funding from the National Park Service, we
have initiated studies to test for tree regeneration patterns within stand-replacing patches under
contrasting post-fire climates in Yellowstone, Grand Teton, and Glacier National Parks.
FUTURE WORK NEEDED
While our results so far show that spatial heterogeneity of burn severity has changed less
than we expected over the period 1984-2010, continued monitoring of trends (number of fires,
area burned, and spatial patterns of high-severity fire) is needed to detect potential future
changes. Climate change is predicted to continue and potentially accelerate over the next several
decades. Responses of burn-severity patterns to further climate changes may be non-linear, and
research could prioritize identification of potential thresholds where large changes in fire patterns
may occur. Modeling spatial variation in burn severity under future predicted climates may be
one method to identify thresholds, and testing areas of the landscape that may be most sensitive
to changes (i.e., warmer and drier locations) can validate modeled predictions. Further, our
methods of explicitly testing for changes in the spatial configuration of fire severity can be
applied to other regions where fire regimes may be shifting outside of the historical range of
variability (e.g., southwestern drier forests).
Another future research priority is to enhance understanding of the importance of fire
patterns and post-fire heterogeneity for critical ecosystem components. For example, determining
the role of burn severity heterogeneity in carbon releases (e.g., from wood combustion) and
carbon accrual rates (e.g., post-fire tree regeneration and growth rates) will help to inform
management of timber and carbon stocks. The relationship between burn severity patterns and
18
the distribution of seed sources across space will be critical in determining the functional
consequences of burn severity patterns. Better understanding of the responses of wildlife species
to different scales of burn pattern and post-fire heterogeneity also is an important future research
focus (Fontaine et al. 2009).
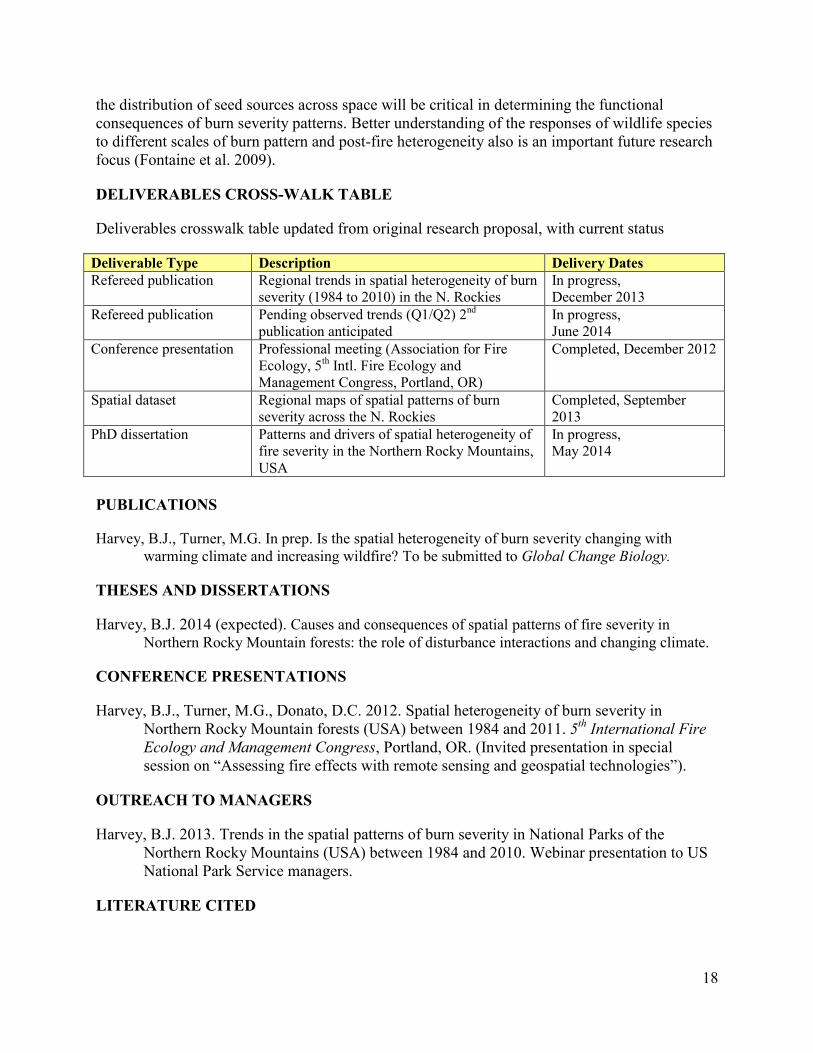
DELIVERABLES CROSS-WALK TABLE
Deliverables crosswalk table updated from original research proposal, with current status
Deliverable Type Description Delivery Dates Refereed publication Regional trends in spatial heterogeneity of burn
severity (1984 to 2010) in the N. Rockies In progress, December 2013
Refereed publication Pending observed trends (Q1/Q2) 2nd
publication anticipated In progress, June 2014
Conference presentation Professional meeting (Association for Fire
Ecology, 5th Intl. Fire Ecology and
Management Congress, Portland, OR)
Completed, December 2012
Spatial dataset Regional maps of spatial patterns of burn
severity across the N. Rockies Completed, September
2013 PhD dissertation Patterns and drivers of spatial heterogeneity of
fire severity in the Northern Rocky Mountains,
USA
In progress, May 2014
PUBLICATIONS
Harvey, B.J., Turner, M.G. In prep. Is the spatial heterogeneity of burn severity changing with
warming climate and increasing wildfire? To be submitted to Global Change Biology.
THESES AND DISSERTATIONS
Harvey, B.J. 2014 (expected). Causes and consequences of spatial patterns of fire severity in
Northern Rocky Mountain forests: the role of disturbance interactions and changing climate.
CONFERENCE PRESENTATIONS
Harvey, B.J., Turner, M.G., Donato, D.C. 2012. Spatial heterogeneity of burn severity in
Northern Rocky Mountain forests (USA) between 1984 and 2011. 5th
International Fire
Ecology and Management Congress, Portland, OR. (Invited presentation in special
session on “Assessing fire effects with remote sensing and geospatial technologies”).
OUTREACH TO MANAGERS
Harvey, B.J. 2013. Trends in the spatial patterns of burn severity in National Parks of the
Northern Rocky Mountains (USA) between 1984 and 2010. Webinar presentation to US
National Park Service managers.
LITERATURE CITED
19
Baker, W. L. 2009. Fire ecology in Rocky Mountain landscapes, 1st edition. Island Press,
Washington, D.C.
Cansler, C. A., and D. McKenzie. 2012. How robust are burn severity indices when applied in a
new region? Evaluation of alternate field-based and remote-sensing methods. Remote
Sensing 4:456–483.
Collins, B. M., and S. L. Stephens. 2010. Stand-replacing patches within a “mixed severity” fire
regime: quantitative characterization using recent fires in a long-established natural fire
area. Landscape Ecology 25:927–939.
Dillon, G. K., Z. A. Holden, P. Morgan, M. A. Crimmins, E. K. Heyerdahl, and C. H. Luce.
2011. Both topography and climate affected forest and woodland burn severity in two
regions of the western US, 1984 to 2006. Ecosphere 2:1–33.
Donato, D. C., J. B. Fontaine, J. L. Campbell, W. D. Robinson, J. B. Kauffman, and B. E. Law.
2009. Conifer regeneration in stand-replacement portions of a large mixed-severity
wildfire in the Klamath Siskiyou Mountains. Canadian Journal of Forest Research
39:823–838.
Flannigan, M. D., M. A. Krawchuk, W. J. de Groot, B. M. Wotton, and L. M. Gowman. 2009.
Implications of changing climate for global wildland fire. International Journal of
Wildland Fire 18:483–507.
Fleishman, E., D. E. Blockstein, J. A. Hall, M. B. Mascia, M. A. Rudd, J. M. Scott, W. J.
Sutherland, A. M. Bartuska, A. G. Brown, C. A. Christen, J. P. Clement, D. DellaSala, C.
S. Duke, M. Eaton, S. J. Fiske, H. Gosnell, J. C. Haney, M. Hutchins, M. L. Klein, J.
Marqusee, B. R. Noon, J. R. Nordgren, P. M. Orbuch, J. Powell, S. P. Quarles, K. A.
Saterson, C. C. Savitt, B. A. Stein, M. S. Webster, and A. Vedder. 2011. Top 40 priorities
for science to inform US conservation and management policy. BioScience 61:290–300.
Fontaine, J. B., D. C. Donato, W. D. Robinson, B. E. Law, and J. B. Kauffman. 2009. Bird
communities following high-severity fire: Response to single and repeat fires in a mixed-
evergreen forest, Oregon, USA. Forest Ecology and Management 257:1496–1504.
Haire, S. L., and K. McGarigal. 2008. Inhabitants of landscape scars: Succession of woody
plants after large, severe forest fires in Arizona and New Mexico. Southwestern
Naturalist 53:146–161.
Haire, S. L., and K. McGarigal. 2010. Effects of landscape patterns of fire severity on
regenerating ponderosa pine forests (Pinus ponderosa) in New Mexico and Arizona,
USA. Landscape Ecology 25:1055–1069.
Hudak, A. T., P. Morgan, M. J. Bobbitt, A. M. S. Smith, S. A. Lewis, L. B. Lentile, P. R.
Robichaud, J. T. Clark, and R. A. McKinley. 2007. The Relationship of Multispectral
Satellite Imagery to Immediate Fire Effects. Fire Ecology 3:64–90.
Key, C. H., and N. C. Benson. 2005. Landscape assessment: ground measure of severity, the
composite burn index, and remote sensing of severity, the normalized burn ratio. In:
Lutes DC, Keane RE, Caratti JF, Key CH, Benson NC, Sutherland S, Gangi LG, Eds.
FIREMON: fire effects monitoring and inventory system.
Lentile, L. B., F. W. Smith, and W. D. Shepperd. 2005. Patch structure, fire-scar formation, and
tree regeneration in a large mixed-severity fire in the South Dakota Black Hills, USA.
Canadian Journal of Forest Research 35:2875–2885.
Lindenmayer, D. B., R. J. Hobbs, G. E. Likens, C. J. Krebs, and S. C. Banks. 2011. Newly
discovered landscape traps produce regime shifts in wet forests. Proceedings of the
National Academy of Sciences 108:15887–15891.

20
Masek, J., E. Vermote, N. Saleous, R. Wolfe, F. Hall, K. Huemmrich, F. Gao, J. Kutler, and T.
Lim. 2006. A Landsat surface reflectance dataset for North America, 1990-2000. IEEE
Geoscience and Remote Sensing Letters 3:68–72.
Miller, J. D., E. E. Knapp, C. H. Key, C. N. Skinner, C. J. Isbell, R. M. Creasy, and J. W.
Sherlock. 2009. Calibration and validation of the relative differenced Normalized Burn
Ratio (RdNBR) to three measures of fire severity in the Sierra Nevada and Klamath
Mountains, California, USA. Remote Sensing of Environment 113:645–656.
Miller, J. D., and H. Safford. 2012. Trends in wildfire severity: 1984 to 2010 in the Sierra
Nevada, Modoc plateau, and Southern Cascades, California, USA. Fire Ecology 8:41–57.
Miller, J. D., H. D. Safford, M. Crimmins, and A. E. Thode. 2008. Quantitative evidence for
increasing forest fire severity in the Sierra Nevada and Southern Cascade Mountains,
California and Nevada, USA. Ecosystems 12:16–32.
Miller, J. D., C. N. Skinner, H. D. Safford, E. E. Knapp, and C. M. Ramirez. 2011. Trends and
causes of severity, size, and number of fires in northwestern California, USA. Ecological
Applications 22:184–203.
Miller, J. D., and A. E. Thode. 2007. Quantifying burn severity in a heterogeneous landscape
with a relative version of the delta Normalized Burn Ratio (dNBR). Remote Sensing of
Environment 109:66–80.
Morgan, P., E. K. Heyerdahl, and C. E. Gibson. 2008. Multi-season climate synchronized forest
fires throughout the 20th century, Northern Rockies, USA. Ecology 89:717–728.
O’neill, R. V., K. H. Riitters, J. D. Wickham, and K. B. Jones. 1999. Landscape pattern metrics
and regional assessment. Ecosystem Health 5:225–233.
Parisien, M., V. S. Peters, Y. Wang, J. M. Little, E. M. Bosch, and B. J. Stocks. 2006. Spatial
patterns of forest fires in Canada, 1980–1999. Int. J. Wildland Fire 15:361–374.
Rollins, M. G., T. W. Swetnam, and P. Morgan. 2001. Evaluating a century of fire patterns in
two Rocky Mountain wilderness areas using digital fire atlases. Canadian Journal of
Forest Research 31:2107–2123.
Stephens, S.L., Agee, J.K., Fule, P.Z., North, M.P., Romme, W.H., Swetnam, T.W., and Turner,
M.G. 2013. Managing forests and fire in changing climates. Science (in press).
Stephens, S. L., and L. W. Ruth. 2005. Federal forest-fire policy in the United States. Ecological
Applications 15:532–542.
Turner, M. G., D. C. Donato, and W. H. Romme. 2013. Consequences of spatial heterogeneity
for ecosystem services in changing forest landscapes: priorities for future research.
Landscape Ecology 28:1081–1097.
Turner, M. G., R. H. Gardner, and W. H. Romme. 1999. Prefire heterogeneity, fire severity, and
early postfire plant reestablishment in subalpine forests of Yellowstone National Park,
Wyoming. International Journal of Wildland Fire 9:21–36.
Turner, M. G., W. W. Hargrove, R. H. Gardner, and W. H. Romme. 1994. Effects of fire on
landscape heterogeneity in Yellowstone National Park, Wyoming. Journal of Vegetation
Science 5:731–742.
Turner, M. G., W. H. Romme, R. H. Gardner, and W. W. Hargrove. 1997. Effects of fire size and
pattern on early succession in Yellowstone National Park. Ecological Monographs
67:411–433.
Westerling, A. L., H. G. Hidalgo, D. R. Cayan, and T. W. Swetnam. 2006. Warming and earlier
spring increase western US forest wildfire activity. Science 313:940.
21
Westerling, A. L., M. G. Turner, E. A. H. Smithwick, W. H. Romme, and M. G. Ryan. 2011.
Continued warming could transform Greater Yellowstone fire regimes by mid-21st
century. Proceedings of the National Academy of Sciences 108:13165 –13170.
Williams, M. A., and W. L. Baker. 2012a. Spatially extensive reconstructions show variable-
severity fire and heterogeneous structure in historical western United States dry forests.
Global Ecology and Biogeography 21:1042–1052.
Williams, M., and W. Baker. 2012b. Comparison of the Higher-Severity Fire Regime in
Historical (A.D. 1800s) and Modern (A.D. 1984–2009) Montane Forests Across 624,156
ha of the Colorado Front Range. Ecosystems 15:832–847.