final report mba.pdf
TRANSCRIPT

Report on
Making an investment Decision
Bus-699
A study on the Mercantile Bank Securities Limited
Submitted To: Mr.Mahmudul Huq Associate Professor BRAC Business School Mohakhali, Dhaka
Submitted By: Nafisa Kamal
ID NO‐11164083 BRAC University
Date of Submission: May 17, 2015
LETTER OF TRANSMITTAL
May18, 2015 Mr.Mahmudul Huq Associate Professor BRAC University Mohakhali,Dhaka
Subject: Submission of an internship report
Dear Sir,
It is with great pleasure that I have the opportunity to submit the internship report
titled `Investment Decision”: A study on Mercantile Bank Securities Limited”
which was prepared from the job experience in the Mercantile Bank Securities
Limited (Head Office)
I had to learn and work a lot to know the overall Brokerage Operation, investment
decision and get the relevant data to prepare the report. I express my deep gratitude
to you giving me scope and prepare this report properly.
I hope you will find it satisfactory
Sincerely yours
Nafisa Kamal ID No‐11164083 BRAC University

ACKNWOLEDGEMENT
At the very beginning, I would like to express my deepest gratitude to the almighty Allah for giving me the strength and the ability to finish the task within the scheduled time.
First I express my sincere gratitude to my honorable teacher and internship supervisor, Mr. Mahmudul Haq for her valuable contribution to the preparation of this report. His valuable suggestions helped me a lot to prepare the report in a well‐organized manner.
I would like to thank to Mr. Mohammed Mozammel Hoque, Chief Executive Officer of Mercantile Bank Securities Limited for giving me opportunity to complete my internship reports during the job periods in his well‐reputed organization.
I would like to thank specially also all the members of Back Office (Account, IT,HR)Traders, Purchase Power, CDBL division. I would like to thank Mr. Anzamul Haque (Principal Officer) And Mr. Hafiz Uddin(Principal Officer) .Apart from their busy office work they has spared time to discuss the ins and outs of the project and guide me by giving useful suggestions and providing data and relevant information for completing my report .
I want to convey my special thanks to all officials Mercantile Bank Securities Limited for their cooperation and friendly support to gather and collect the data relevant information.
Finally, a silent stream of gratitude is for my most adorned mother and my Late Father whose blessing is always with me.

EXECUTIVE SUMMARY
Capital markets are very important to make a capital or fund for the country from the
people lend this fund as loan and advances to the borrowers in different sectors of
the industry. Capital Market play a very important role in both national and
international trade.
This report is prepared for fulfilling a partial requirement of both M.B.A. and the
internship program. The report will mainly focus on the Investment decision taken
by an investor in Capital Market. It will also focus on operation of Brokerage house.
Time is a major limiting factor while preparing the report. The report had to be
prepared in these months of my Job experience. There were scarcity of written
documents about the facilities and other related things. Much information could not
be gathered for the reason of confidentiality.
Capital markets are financial markets for the buying and selling of long‐
term debt or equity‐backed securities. These markets channel the wealth of savers to
those who can put it to long‐term productive use, such as companies or governments
making long‐term investments. Capital markets are defined as markets in which
money is provided for periods longer than a year. Investors commonly
perform investment analysis by making use of fundamental analysis, technical
analysis and gut feel.
Investment decisions are often supported by decision tools. The portfolio theory is
often applied to help the investor achieve a satisfactory return compared to
the risk taken.
The Mercantile Bank Securities Limited has started its Brokerage operation in 29th
June, 2009.They help investor to open a BO account and Make an investment decision
for buy and sale of shares. For this it provides loan in medium interest rate, less
commission and important suggestion with no supervision charges. Recognizing the
demand in Trading of the instruments, the MBSL offers a simplified investment
decision for increasing Trading finance in Capital Market. For financing Share Market,

MBSL is giving different kind of facility, the time these customers will take to
relationship –Trade finance (instead of product‐based) gives a further boost to the
sector.
Capital Market of Bangladesh is passing tough times since December 2010 as high
volatility is eroding the capital of Thousands of Investors that might turn into social
instability. This fall is caused by many factors which was tried to identify and tried to link
up between The Causal factors of market crash and regulatory failure. Primary issue
related problems was faulty listing methods and IPO overpricing, few numbers of
new listings, revaluating assets before company listing, high premium in issuance of
right share/Repeat IPO etc. while secondary market related problems was stock
splits and stock price manipulations through block trading, circular trading and
insider trading. Investor’s greed and irrational behavior played a big rule to make
the stock prices sky rocking as they were crazy to buy shares without judging the
company fundamentals. Shares of the companies with closed operations and big
accumulated losses were rising constantly due to investors high risk appetite that
caused them to loss everything. Government had already taken many steps
(including SEC reforms) to stabilize the market but failed as investors confidence is
in the bottom level. Government and regulators should work together to identify the
main speculators and should brought under proper trial to bring investors back to
the market. Regulator should make reforms on Listing procedures and other faulty
regulatory frameworks to ensure transparency and efficiency in the capital market
and also should bring clear guidelines regarding Private Placements, Asset
Revaluation, insider training, Dealing with omnibus account etc.
Now a day’s SEC & DSE has taken many steps to correction the market .DSE has
started new index system ,new price value of shares .They have also introduced the
new implemented system to software which was used by NASDAQ . In this case the
markets analysis would be predicted that this will help to implement the share
market.

TABLE OF CONTENTS
Contents Chapter 1: Introduction
1.1 Origin of the report 1.2 Objective of the report 1.3 Methodology 1.4 Scope of the study 1.5 Limitation of the report Chapter 2: Mercantile Bank Securities Limited Bank at a Glance 2.1 An overview of Mercantile Bank securities Limited 2.2. Why Mercantile Bank Securities Limited 2.3 History of Formation of MBSL, a subsidiary of MBL 2.4 Business functions 2.5 Corporate Information 2.6 Company hierchy of MBSL Chapter 3: Brokerage House Methodology of Mercantile Bank Securites Limited
3.1 Methodology of BO Account opening 3.1.1 What is BO ACCOUNT? 3.1.2 Requirement Documents for Opening of BO Account: 3.1.3 What is a NITA Account? 3.1.4 What are the Tax rates for NRB? 3.1.5 Key information on margin account: 3.1.6 Fees, Commission and Account Opening Charges: 3.1.7 Fees, Commission and Account Opening Charges: 3.1.8 Customer Account Opening Information Entry in Back Office Software (SIS): 3.2 Methodology of Accounting: 3.2.1 For Cash Deposit on behalf of Client: 3.2.2 For Cheque Deposit on behalf of Client: 3.2.3 Daily Check up to view Cheque Maturity 3.2.4 Cheque Payment to Client: 3.2.5 Cheque Payment to Dhaka Stock Exchange (DSE): 3.2.6 Cheque Receipt from Dhaka Stock Exchange (DSE): 3.3 Methodology of Central Depository Bangladesh Limited CDBL: 3.3.1 Settlement of Securities: 3.3.2 CDBL BO Setup Offline Window:

3.4 Methodology of Buy Sells Securities Using Flex trade Software: 3.4.1 How to buy or sell Shares/Securities: 3.4.2 What happens to Dividend, Bonus etc? 3.5 Methodology of Purchase Power: 3.6 Buy Sell Window of Flex trade Software:
Chapter 4: Analysis and Calculation:
4.1. Technical Analysis: 4.2 Fundamental Analysis: 4.3 Category Selection: 4.4 Owner of the Shares: 4.5 Internationally Recognized 4.6 Dividend Yield: 4.7 Trend Analysis: 4.8 Market forecast: 4.9 Portfolio management: 4.10 Budget expansion policy: 4.11 Income statement: 4.12 Market growth: 4.13 Taxation system: 4.14 Earnings Per share: 4.15 Fixed Asset: 4.16 Paid‐up Capital 4.17 Equity: 4.18 Risk factor: 4.19 P/E Ratio: 4.20 Rate of Refund: 4.21 Risk Level 4.22 Risk & Return & Portfolio Analysis: 4.23 Security Portfolio 4.24 Analysis the Market Return Index and Share price index : Chapter 5 Problems of the Report & Company:
Chapter 6: Findings of the Report:
Chapter 7 Recommendation:
References
1 A Report On Investment Analysis
Chapter 1: Introduction
The Capital Market is a challenge of growth for an economy and perform critical role in acting as an intermediary between investor and financing (whether debt or equity) for business expansion. A vibrant Capital market is likely to signal for a robust economy. While lending by commercial bank provides a valuable initial support for corporate growth. A developed stock markets an important prerequisite to move into a more mature growth phase of economy with more conglomerates. Bangladesh should really focus on improving governance and developing advance market products.
Despite a challenging political environment and wide spread poverty, Bangladesh has achieved a significant milestone in the social and development side. However capital market of Bangladesh is still underdeveloped. In this respect it is wise to invest on security market basis on some preliminary knowledge and practical calculation. Most of the cases the investor Invest on the basis of assumption or hypothecation.
In Bangladesh, there are Merchant Banks, Brokerage House and Securities .Mercantile Bank Securities Limited is one of the Bank’s Securities House in Bangladesh.
1.1 ORIGIN OF THE REPORT
This report titled “Investment Policy And Analysis” is prepared for fulfilling a partial requirement of both the M.B.A. and the Internship program .The Mercantile Bank Securities Limited is the host organization for three months internship program ,which began on May 16 ,2010 .To prepare the report as an apprentice I have taken necessary assistance from my internship supervisor who authorized the topic of this report .On the other hand I have got a lot of support from the employees of this institution .
1.2 Objective of the Report
The objective of the report is two‐fold
To give an overview of operation s of Investment in Capital Market.
To evaluate the Investment Procedure of the Mercantile Bank Securities Limited to Capital market.
To give an insight about Investment in capital Market
To calculate the analysis and portfolio investment of return of security.
To Analysis of investment of Capital market in Bangladesh.
2 A Report On Investment Analysis
1.3 Methodology
The report has been prepared on the basis of the experience gained during the period of the service place .The important feature of the report is the use of both primary and secondary data.
Sources of Information
The data was collected from two sources
Primary sources
Personal experience gained by visiting different desks (Front Office & Back Office Including Accounts, CDBL, Trading)
Personal investigation with customers and clients.
Personal investigation in another Company’s trading Procedure.
Head office of the Mercantile Bank securities Limited
Secondary sources
Investment Management 11th Edition, Charles P Jones
Internet
Prospectus
1.4 Scope of the Study
The report will mainly focus on the Investment Policy of an Investor’s capital. It will also focus on operation Companies’ like Central depository Unit Bangladesh, Security and Exchange Commission, DSE and CSE
After studying that whole report anyone can learn and get huge knowledge about SMEs that will be help them to further development.
1.5 Limitation of the Study
Time was a major limiting factor while preparing the report. The report had to be prepared on the basis of my working experience .As the current market condition is not well there is some Lacking of number of investors .There were scarcity of written documents about the facilities and other related things .Much information could not be gathered for the reason of confidentiality .Therefore, it is very difficult to carry out detailed analysis of market and the Investment financing .The study was limited to Mercantile Bank Securities Limited and paper documents.
Chapter 2: Mercantile Bank Securities Limited at a Glance
Mercantile Bank Securities Limited (MBSL) commenced its commercial operation in accordance with principle of Bank Based Brokerage on the 10th May 2009 under the Bank Companies Act, 1994. During last Six years MBSL has diversified its service coverage by opening new branches at different strategically important locations across the country offering various service productive investments. Board of Directors enjoys high credential in

3 A Report On Investment Analysis
the business arena of the country, Management Team is strong, and supportive equipped with excellent professional knowledge under leadership Mr. Md. Anwarul Haque. 2.1 An Overview of Mercantile Bank Securities Limited: Name of the Company Mercantile Bank Securities Limited Legal Form A public limited company incorporated in Bangladesh on 1st
April 2001 under the companies Act 1994 Limited. Commencement of Business
27th June 2009
Registered Office 41/6,Swadesh Tower,Purana Palton, Dhaka‐1000 Telephone No. 88‐02‐7122515,7122356,7122513
Fax No. 88‐02‐9570809, 7119078Website http://www.mblbd.com/home/securities Email [email protected]
Chairman Anwarul HaqueChief Executive Officer Md. Mohammed Mozammel HoqueAuditors M/S K.M Hasan & Co.
Chartered Accountants 87, New Eskaton Road Dhaka. Phone: 88‐02‐9351457, 9351564
No. of Branches 6 No. of Employees 30 Stock Summary: Authorized Capital Tk 200 crorePaid up Capital Tk. 67 CroreFace Value per Share Tk. 10Total Customers 6000
Mercantile Bank Securities Limited has been developed to ensure development of sound capital market and to provide higher, better and diversified services to a wide range of customers. MBSL is offering high quality products and services at a competitive rate. Mercantile Bank Securities Limited offers full‐fledged international standard brokerage service with margin loan facility. We are also a full service Depository Participant (DP) of Central Depository Bangladesh Ltd. (CDBL). The brokerage service is designed to provide customers with necessary support profitably in the stock market. MBSL is dedicated to provide high level of professional and personalized services to its domestic and international clients at a reasonable cost. MBSL’s services are comprehensive in nature, including brokerage, margin loan, CDBL facilities, and research and custodian needs of customers. 2.2 Why Mercantile Bank Securities Limited
Professionally trained staffs are engaged. Chosen as the preferred broker by most foreign/international and high‐net worth investors Corporate member of Dhaka Stock Exchange and Chittagong Stock Exchange Depository Participant (DP) of Central Depository Bangladesh Ltd
4 A Report On Investment Analysis
Margin Loan facilities MBSL has a strong commitment to its corporate, institutional and individual clients.
Vision
To become the best Securities House in Bangladesh.
Mission
To be compliant in every respect. To fulfill the Corporate Social Responsibility (CSR). To be the Pioneer, not follower.
Achievements
The company’s success is strengthened by its strong network of key clients and its unparalleled standard of service quality, offering clients the highest level of convenience and reliability in transacting business
Key Strength
Exceptional quality and professionalism in its services offering to clients. A competent equity market research unit. The widest network of branches (Dhaka, Chittagong, Sylhet & Khulna). State of the art technology utilized in trade execution and back office and reporting systems.
2.3 History of Formation of MBSL, a subsidiary of MBL
June 27, 2010 : Emerged as a public limited company
December 05, 2010 : Secured DSE membership # 224
December 30, 2010 : Secured CSE membership # 140
August 04, 2011 : Secured Stock Broker / Dealer licenses for DSE
August 25, 2011 : Secured Stock Broker / Dealer licenses for CSE
September 14, 2011 : Secured DP Registration Certificate
September 14, 2011 : Started business in its own name of MBSL
5 A Report On Investment Analysis
2.4 Business Functions:
Head Office SwadeshTower (3rd Floor) 41/6 Purana Paltan, Dhaka‐1000 Phone# +88‐029563876 +88‐02‐7119932 +88‐02‐7111482 +88‐02‐7122515 +88‐02‐7111202 Fax#+88‐02‐7119078 e‐mail: [email protected]
KhulnaBranch RupshaPlaza(2ndFloor) 73,K.D.A. Avenue, C/A, Sonadanga Khulna‐9100 Phone# +88‐0417‐31396 Fax# +88‐0417‐31397 e‐mail: [email protected]
Mirpur Branch Razia Plaza184 Senpara Parbata, RokeyaSarani Mirpur, Dhaka‐1216. Phone#+88‐02‐9014640 Fax# +88‐02‐9014680 e‐mail:[email protected]
Sylhet Branch Al‐Hamra Shopping City (5th Floor) 1052‐00, Zindabazar, Sylhet‐3100. Phone# +88‐0821‐711565 Fax# +88‐0821‐711571 e‐mail: [email protected]
Uttara Branch House#22 Sonargaon Janapath,Sector # 9, Uttara Model Town, Dhaka Phone# +88‐02‐8959047, +88‐02‐8962645 +88‐02‐8950714 Fax# +88‐ 02‐8961798 email: [email protected]
Sat Masjid Road Branch House‐735 (Old), 82/A (New) Road‐8/A, Sat Masjid Road Dhanmondi R/A, Dhaka‐1205 Phone# +88‐01817‐092592 +88‐01730‐703699 e‐mail: [email protected]
Agrabad Branch (Proposed) Mishkat Arcade 21/2, Agrabad C/A Chittagong

6 A Report On Investment Analysis
2.5 Corporate information:
Chairman : Mr. Md. MD. Anwarul Haque
Directors : Mr. M S Ahsan
Mr. Al‐Haj Akram Hussain (Humayun)
Dr. Mahmood Osman Imam
Mrs. Bilkis Begum
Md. Nasiruddin Choudhury
Syed Muhammed Abbdul Mannan, MP
Md. Shahabuddin Alam
Alhaj Mosharref Hossain
Mr. Md. Tabibul Huq
Mr. A. S. M. Feroz Alam
Mr. M. Amanullah
Mr. Mohd. Selim
Mr. A. K. M. Shaheed Reza
Mr. M.A. Khan Belal
Managing Director : M Ehsanul Haque
CEO : Mr. Mohammed Mozammel Hoque

7 A Report On Investment Analysis
2.6 The company Hierarchy of MBSL
The company Hierchy of MBSL

8 A Report On Investment Analysis
Chapter 3: Brokerage House Methodology of Mercantile Bank Securities
Limited
Flow Chart of the Account opening and trading Procedure:
9 A Report On Investment Analysis
3.1 Methodology of BO Account Opening:
3.1.1 What is a BO Account?
BO Account refers to Beneficiary Owners Account. This is the account that holds your dematerialized/electronic shares like an inbox holding all your e‐mails.
• All shares from new IPO’s and most of the secondary market shares are in dematerialized/electronic form and a BO account, owned by the investor, hold the dematerialized/electronic shares
• All NRB’s are requested to open a BO account through our brokerage house by filling some required forms and submitting required documents
3.1.2 Requirement Documents for Opening of BO Account:
For Individual / Joint:
1. Photocopy of valid Passport/National ID card/Nationality Certificate
2. Three (03) copies of passport size photograph for individual and three copies (03) for
Joint Account Holder
3. Two (02) copies Passport size photograph for nominee duly attested by A/C Holder
4. Two (02) copies of Passport size photograph of person authorized to operate the
account duly attested by A/C Holder
5. Bank statement and certificate from Branch Manager
6. BO Account opening fee
For NonResident Bangladeshi:
1. Photocopy of passport / Social Security Card / Registration Card etc. duly attested (if
you are located in a foreign country then attestation needs to be done with the respective
Bangladesh Embassy or High Commission)
2. An FC account with our Bank at any branch in Bangladesh

10 A Report On Investment Analysis
3. Passport size photographs duly attested
4. A nominee – beneficiary in case of death of the investor. His/her signature and photo
(duly attested by the investor) on the prescribe form provided by the brokerage
house
5. Employment certificate/ Trade License photocopy/Work Permit or Pay Slip/Tax
Return Documents as a proof other earning status of the NRB
6. A nominated person with POA (Power of Attorney) who will sign trading documents
on behalf of the NRB while he is in abroad. His/her photo (attested by the NRB) and
signature in a prescribed form by our company (POA can be any adult person of legal
age residing in Bangladesh)
7. An extra form of KYC (Know Your Customer will also have to be filled in).
8. Initial fund will have to be a cheque or pay order or other allowed form drawn from
FC account
9. All earnings from the investment can be first transferred to a local currency account
of NRB and then to the trading account through help of the POA
10. Trading account will allow the NRB to allocate fund for investment in the secondary
market
11. Sales proceeds will be issued by account payee cheque in favor of the NRB investor.
As such a local account or a NITA account (in case it repatriation is needed in foreign
currency) is needed
11 A Report On Investment Analysis
For Corporate:
1. Board Resolution for Account Opening
2. Certificate of Incorporation and Memorandum and Article of Association Three
(03) copies of Passport size attested photograph for each signatory who will operate
the Account
3. Bank Certificate from Branch Manager
4. BO Account opening fee
3.1.3 What is a NITA Account?
• Non‐resident Investment Taka Account (NITA) is an account for channeling
foreign currency in as well as repatriation of earnings from investment
• All earning from investment (e.g. cash dividend) are credited to the NITA account
• All adequate statement, certifying that all proper taxes are already withheld from
earnings
• Upon issuance of auditors certificates the earnings can be repatriated to the NRB in
foreign currency
• If investors intention is not to repatriate any foreign currency than NITA account is
not mandatory
3.1.4 What are the Tax rates for NRB?
• There is no Capital Gain Tax
• Individual Income Tax assessment is similar to any other resident Bangladeshi (visit
www.nrb.org.incometax.html for details). NRB can submit tax return to local
Bangladesh Embassy.
• Individual Income tax will not be more than 15%
• 10% at source is deduct by issuer in case of cash dividend
3.1.5 Key information on margin account:
Minimum Investment : BDT 1 Million
Margin Loan : Maximum of 100% of customer’s equity, but not
exceeding Tk.10 million (variable subject to the decision of DSE, CSE, Bangladesh
Bank and MBSL own authority)
12 A Report On Investment Analysis
MBSL may extend credit facilities to his approved customers for securities
transactions subject to the margin account requirements of the existing rule
• Margin account arrangements must be evidenced in the form of written
agreement executed between MBSL and the customers
• A customer who operates a margin account with MBSL shall authorize MBSL
to mortgage, pledge or hypothecate the his/her securities or property for a
sum not exceeding the debit balance in the margin account and without
obligation to retain in his/her possession or control securities of same
character
• The margin deposited by customer with the MBSL shall be in the form of cash,
securities issued by the government or its agencies, marginable securities and
such other instruments as the commission may from time to time prescribe.
The initial margin must be deposited with the Bank not later than seven days
from the first date of securities transaction and shall be such amount that
would result in the equity being not less than 150% of the debit balance in the
margin account.
3.1.6 Fees, Commission and Account Opening Charges:
• Cash Account : BDT 700/‐
• Margin Account : BDT 1500/‐
• Interest on Margin : 16% p.a. * (with quarterly rest)
• Service Charge : 1%*
• Others Charges : At actual basis
• Settlement Fee : 0. 40%* (on transaction value)
• Third Party Charge : At actual basis (Variable)

13 A Report On Investment Analysis
3.1.7 Customer Account Opening Information Form:

14 A Report On Investment Analysis
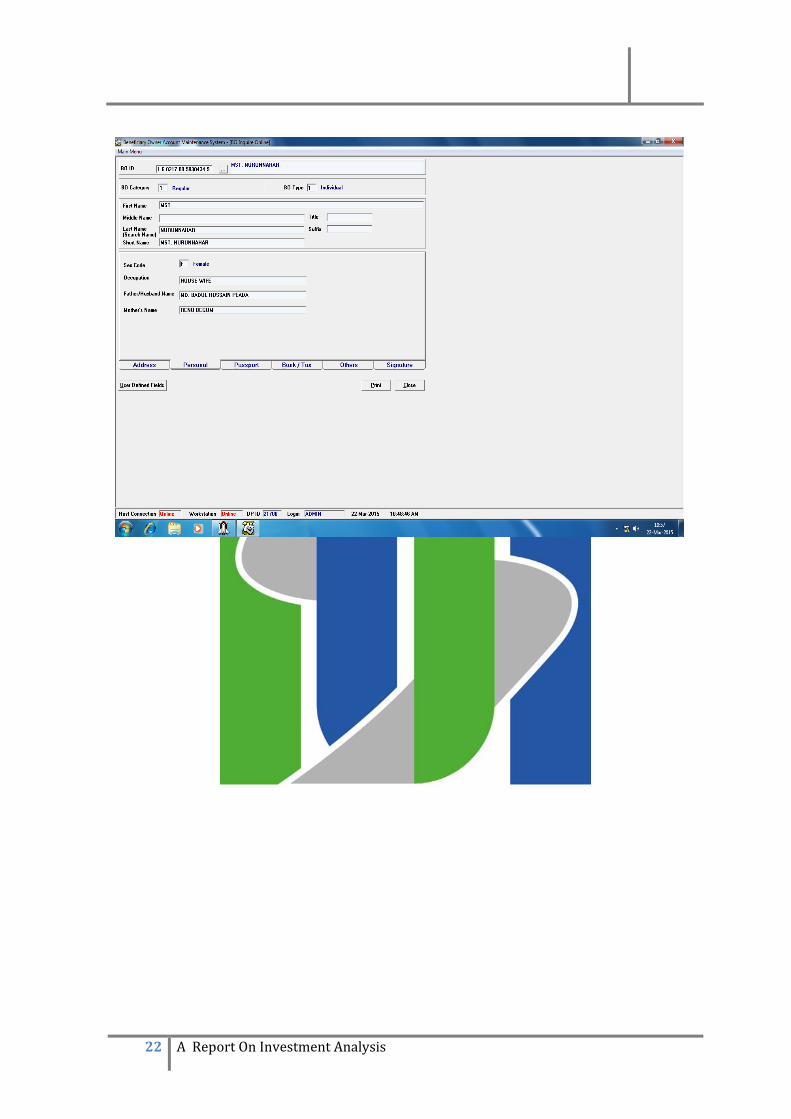
3.1.8 Customer Account Opening Information Entry in Back Office Software (SIS):
After completing all processes to open BO account, at first customer account
opening information save in back office software (SIS).
3.2 Methodology of Accounting:
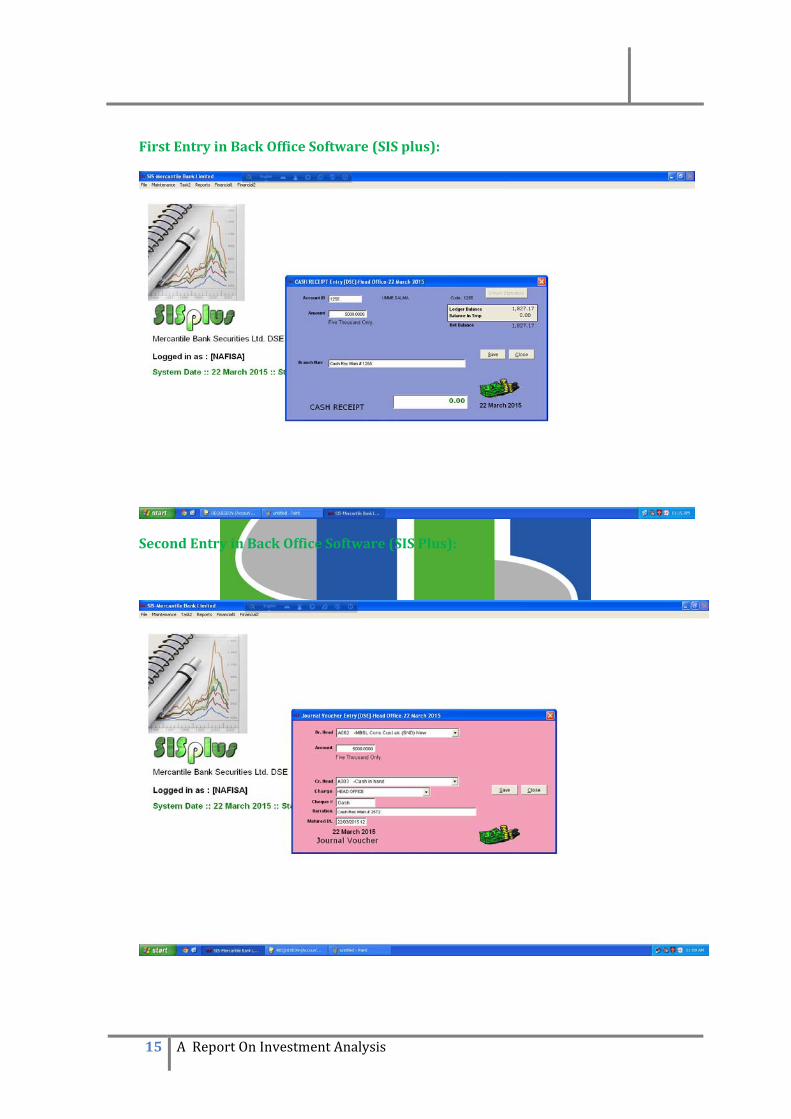
3.2.1 For Cash Deposit on behalf of Client:
When client deposit cash amount to buy a securities Mercantile Bank Securities Limited
give money receipt against of those amount of money, after that entry in back office
software (SIS Plus).
Mercantile Bank Securities Limited will issue an account payee cheque in local
currency in the name of the NRB ‐ How to redeem the cheque is up to the NRB –
e.g. He/she can deposit it to a local account or NITA account – Repatriation of
earnings can be done through NITA accounts by following proper guidelines.
15 A Report On Investment Analysis
First Entry in Back Office Software (SIS plus):
Second Entry in Back Office Software (SIS Plus):

16 A Report On Investment Analysis
3.2.2 For Cheque Deposit on behalf of Client:
When client deposited cheque to buy securities Mercantile Bank Securities Limited give
money receipt against of that cheque, after that entry in back office software (SIS).
Window is given bellow.
One Entry Transaction:
3.2.3 Daily Check up to view Cheque Maturity:

17 A Report On Investment Analysis
3.2.4 Cheque Payment to Client:
If Mercantile Bank Securities limited give payment on cheque to client, of that transaction record saves in back office software (SIS). Window is given bellow.
3.2.5 Cheque Payment to Dhaka Stock Exchange (DSE):
If Mercantile Bank Securities limited give payment on cheque to Dhaka stock exchange
(DSE), of those transaction record save in back office software (SIS). Window is given
bellow.

18 A Report On Investment Analysis
3.2.6 Cheque Receipt from Dhaka Stock Exchange (DSE):
If Mercantile Bank Securities limited receipt payment on cheque from Dhaka stock
exchange (DSE), of those transaction records save in back office software (SIS). Window
is given bellow.

19 A Report On Investment Analysis
3.3 Methodology of Central Depository Bangladesh Limited CDBL:
3.3.1Clearing & Settlement:
Clearing and Settlement System is conducted as per the settlement of stock exchange
transaction regulations, 1998 and Dhaka Stock Exchange (Members' Margin) regulations,
2000.
3.3.1 (A) Settlement of Securities:
Pay In:
Pay in is done on T+0 if members margin is paid on buy exposure only.
Pay In Failure:
If stock broker fails to pay in on T+0, his trade will be suspended on T+1 (next trading
day) by Dhaka Stock Exchange Ltd. Due to Members' Margin Failure.
Pay Out:
• Pay Out for A, B and N Category Securities:
CDBL will place all the securities of which the broker buys on (T+0) to his clearing
account on the 3rd day (T+3) subsequent to the trading day. Pay Out shall be done on T+3
for A, B, and N categories securities. It indicates that an investor can sell the securities (A,
B & N categories) on the 3rd day from his buying date (T+0) of the said securities.
• Pay Out for Z Category Securities:
CDBL will place all the securities of which the broker buys on (T+0) to his clearing
account on the 9th day (T+9) subsequent to the trading day. Pay Out shall be done on T+9
for Z categories securities. It indicates that an investor can sell the securities (Z
categories) on the 9th day from his buying date (T+0) of the said securities.
• Settlement on Spot Market:
In case of demated shares/bonds settlement will take place to the member clearing A/C
just normal transaction. The sell broker shall deposit the pay in transfer from with DP at
T+0 while the buying broker shall deposit cash or pay order or demand draft or make

20 A Report On Investment Analysis
direct transfer of funds to DSE clearing A/C on T+0 day within banking Hour & report the
same to clearing department of DSE.
3.3.2 CDBL BO Setup Offline Window:

21 A Report On Investment Analysis
22 A Report On Investment Analysis
23 A Report On Investment Analysis
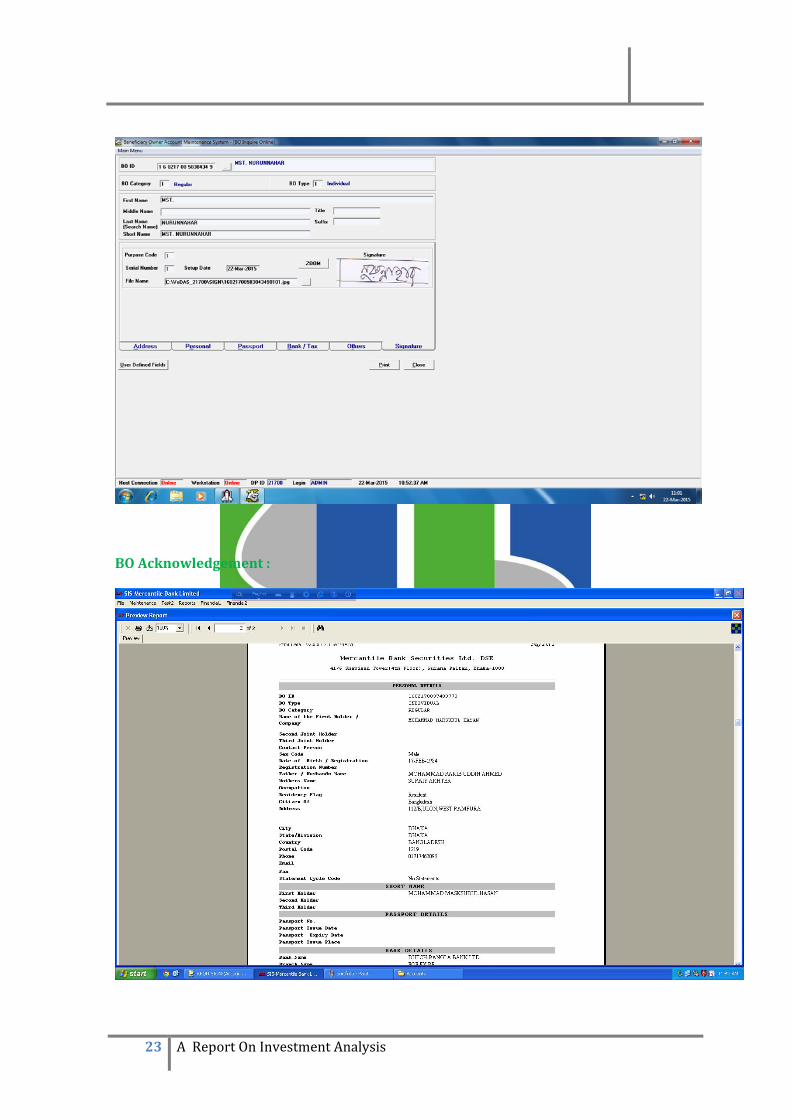
BO Acknowledgement :
24 A Report On Investment Analysis
3.4 Methodology for Buying and Selling Securities Using Flex trade Software:
3.4.1 How to buy or sell Shares/Securities:
• IPO application needs to be filled in a prescribed form. Such forms can be obtained
through mail, website of issuing company, or though broker etc. Now a day the
brokerage house will provide form to do IPO share Business via their secondary
share account by depositing cash money.
• Trading in secondary market is done by Buy/Sell order forms (very soon to be made
available online).
• If POA (Nominee) is assigned then the POA holder needs to sign the Buy/Sell order
form within 24 hours of order placement.
• If NRB wishes not to assign a POA then orders can be placed via phone or email
(broker approval required) and then a signed Buy/Sell order form needs to be faxed
to our broker house within 24 hours.
• Trading will be carried out within prevailing market guidelines.
• Shares will be credited or debited to the BO account accordingly.
3.4.2 What happens to Dividend, Bonus etc? Cash Dividend warrants will be issued to the NRB. These are usually account payee
cheques. So this can either be deposited to NRB’s local Bank Account, FC accounts or to
NITA accounts then may be to the trading account to be reinvested in the secondary
market through our broker house, if the POA holder follows the proper procedures.
• All Bonus Shares will be credited to the BO account
• Earnings can be withdrawn from the investments by placing a request to our
broker house in a prescribed format.
• Cash Dividend will be credited to prospective accounts form given by
Company through Cheque or BEFTN.
25 A Report On Investment Analysis
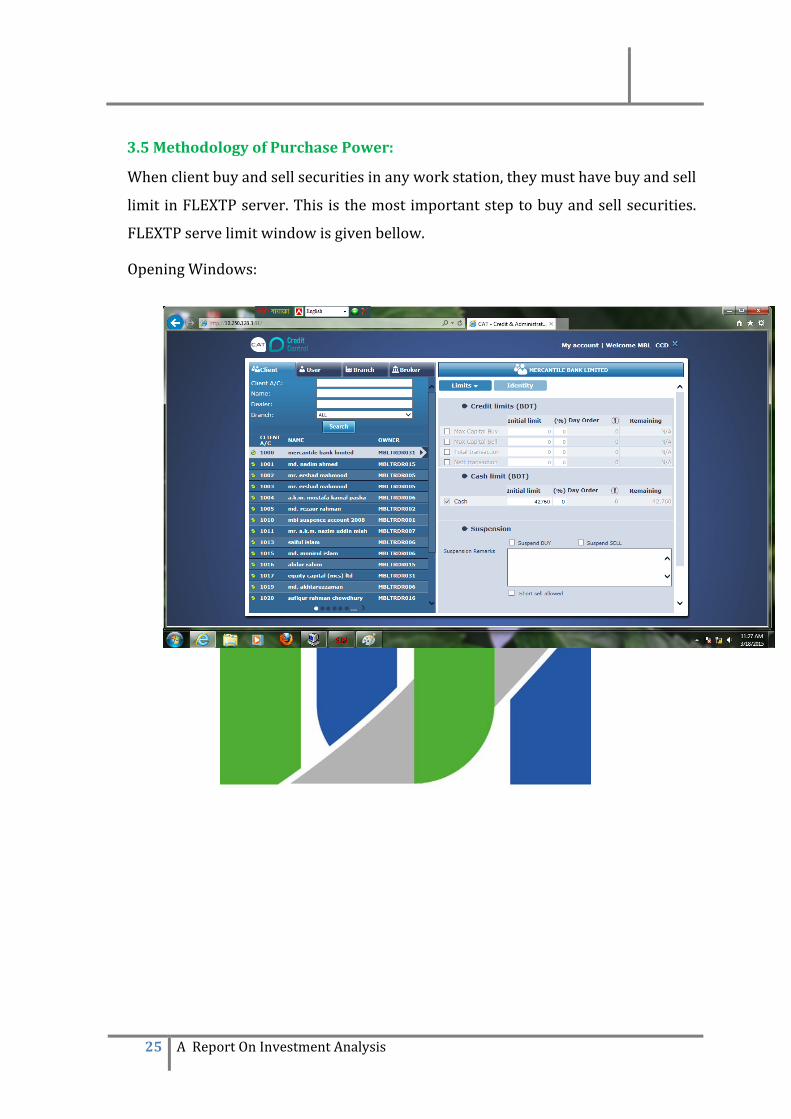
3.5 Methodology of Purchase Power:
When client buy and sell securities in any work station, they must have buy and sell
limit in FLEXTP server. This is the most important step to buy and sell securities.
FLEXTP serve limit window is given bellow.
Opening Windows:
26 A Report On Investment Analysis
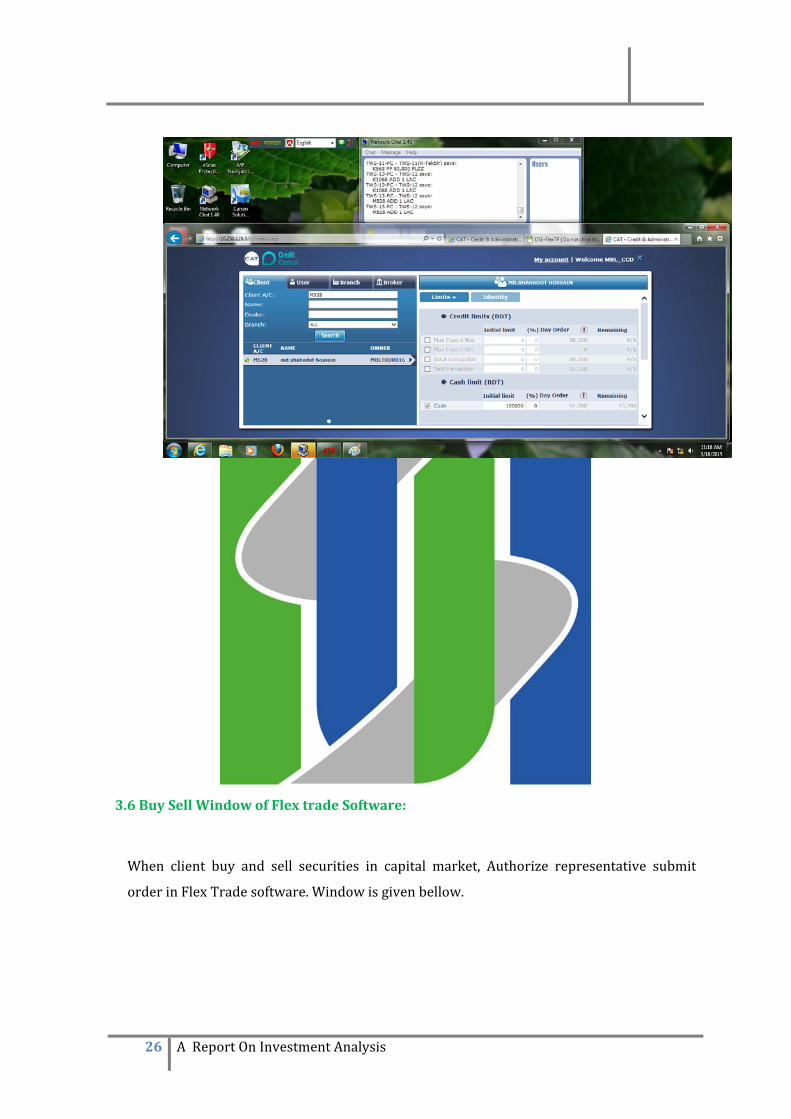
3.6 Buy Sell Window of Flex trade Software:
When client buy and sell securities in capital market, Authorize representative submit
order in Flex Trade software. Window is given bellow.
27 A Report On Investment Analysis
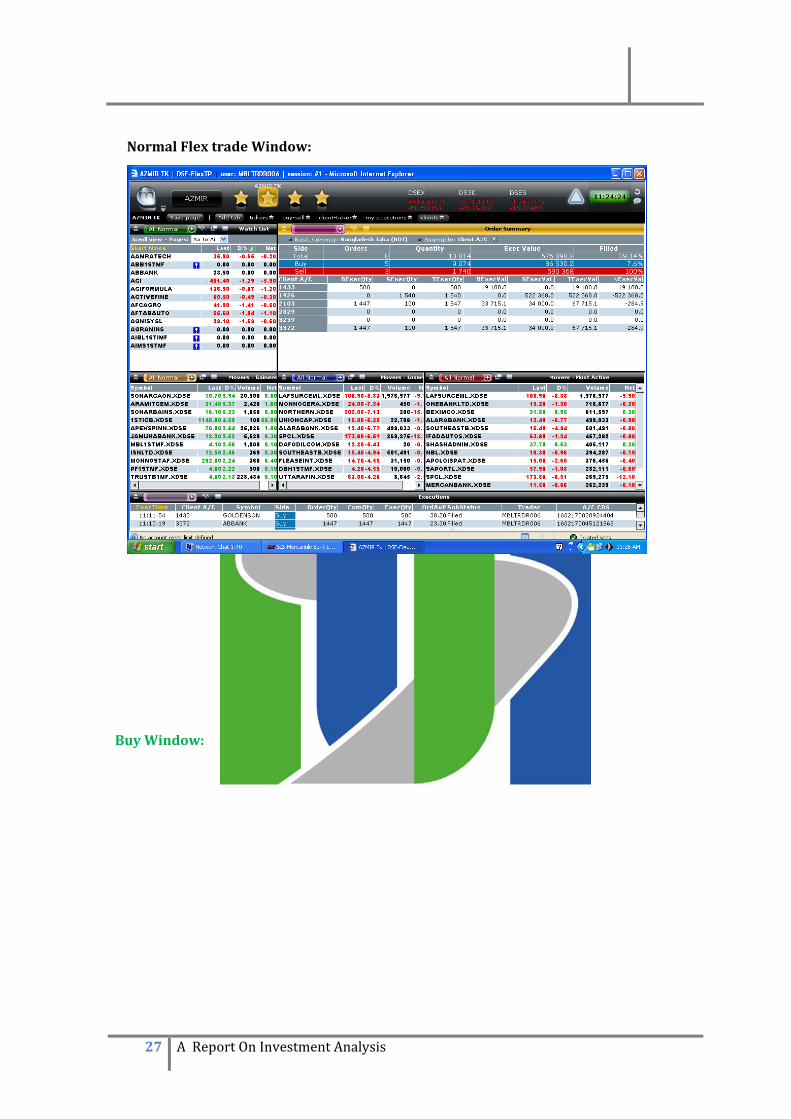
Normal Flex trade Window:
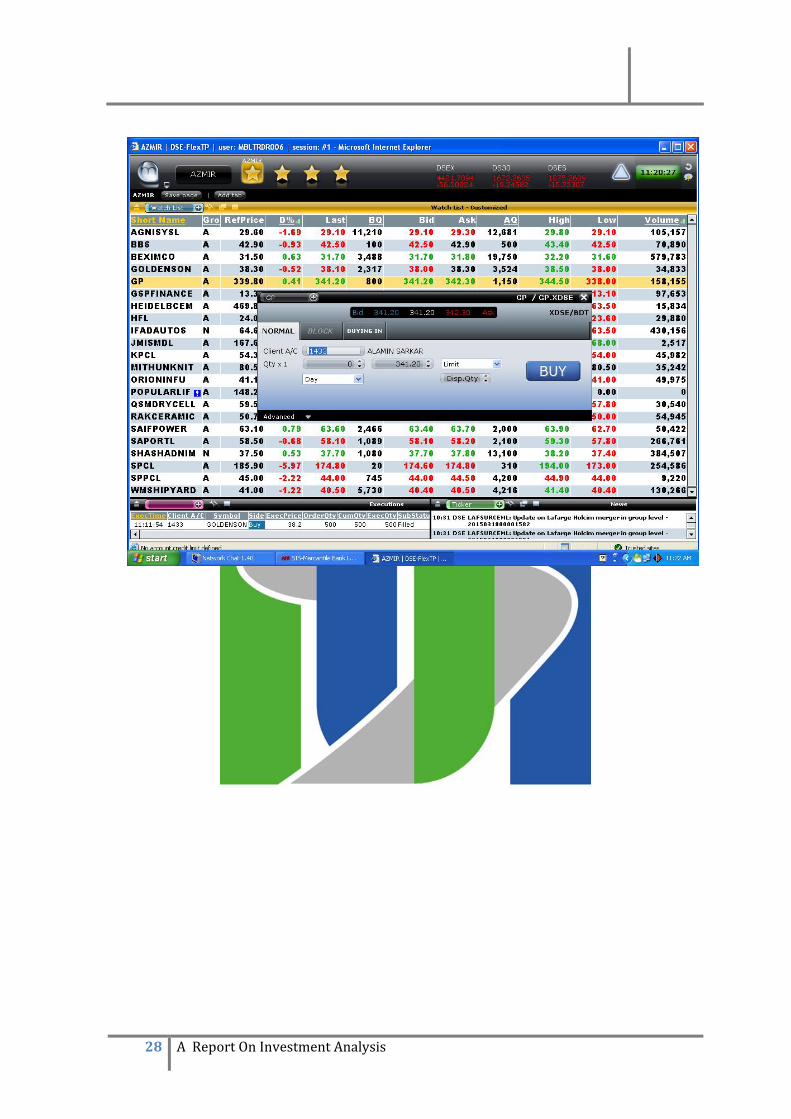
Buy Window:
28 A Report On Investment Analysis

29 A Report On Investment Analysis
Total Market Window:

30 A Report On Investment Analysis
Sale Window:

31 A Report On Investment Analysis
Chapter 4: Analysis and Calculation:
4.1. Technical Analysis:
Long‐term Investment : In case of investment share market in Bangladesh if any investor want to go for long term investment he or she might be invest about 1.5 Lakh or above. In this prospect the time span should be 10 years or above.
Midterm Investment: In case of investing in Midterm investment in security market in Bangladesh anyone can make a 6 months investment of 1 to 1.5 Lakh.
Short term Investment: In case of 3 to 6 months investment which is depicted by Short term Finance and the amount is about 50 thousands to 1 Lakh.
4.2 Fundamental Analysis:
Economy of the country: If anyone goes for investment in capital market in Bangladesh, he or she might be concern of the economy of the country.
Currency: Taka (Tk.) GDP at Current Price : Tk. 9147.84billion (US$ 112.17 billion) Annual per capital GDP : US$ 772 GDP growth rate at (1995/96) constant price : 6.32 per cent Agricultural growth rate at constant price : 1.72 per cent Industrial/Mfg growth rate (% of GDP) : 9.76per cent Large & Medium scale Industry : 10.78 percent Small scale Industry : 1.78 percent Service sector growth rate of GDP at current price: 49.45 per cent Inflation rate (12 month average) : 9.33 per cent Domestic savings rate of GDP: 19.37 per cent National savings rate of GDP: 29.40 per cent Investment rate of GDP: 25.45 per cent Exports (201112): US$ 24287.64mn (July to March) Imports (201112): US$ 35441.80 mn (July to March) Trade Deficit : US$ 11154.14 mn Foreign Exchange Reserve : US$ 10364.43 mn Remittances : US$ 12843.42mn Foreign Investment Direct : US$ 995 mn Portfolio : US$ 198 mn Bank rate : 5.0 per cent Broad Money (M2) : 517109.50 Tk.crores Total No. of Limited Co.

32 A Report On Investment Analysis
Public Limited Co: 35,000 Private Limited Co. : 23,000
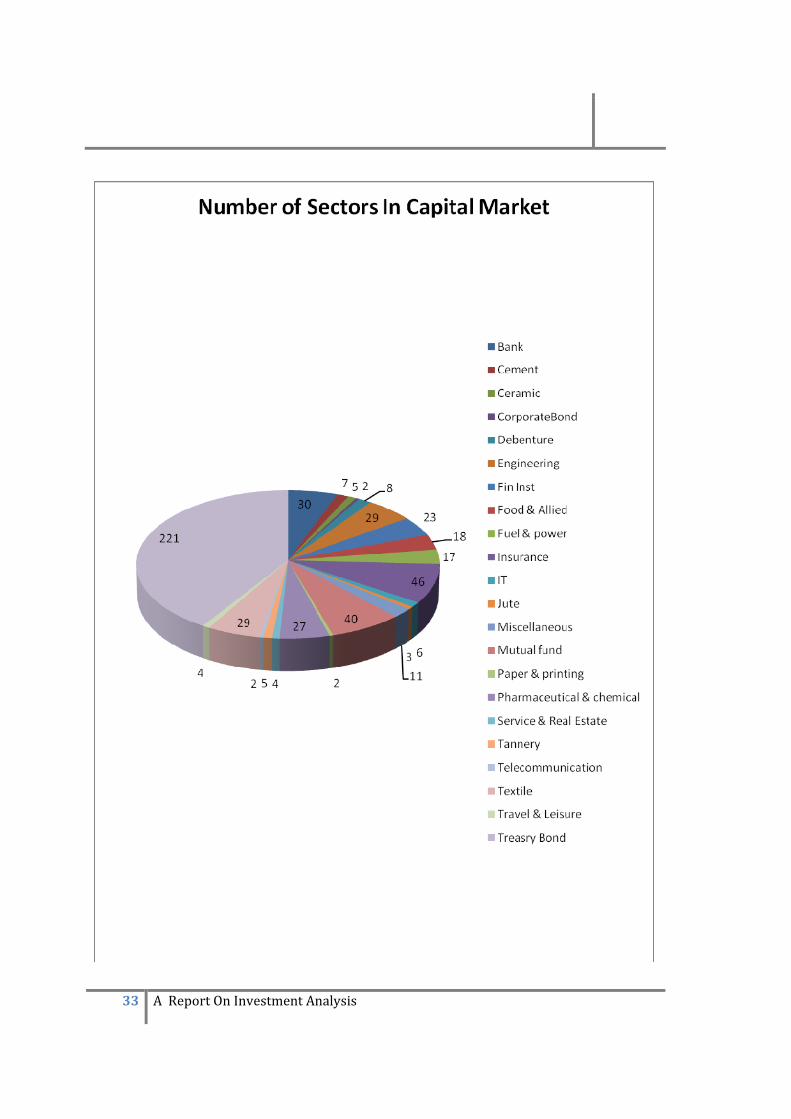
Principle Industries: Garments, Pharmaceuticals, Textiles, Paper, Manufacturing, Newsprint, Fertilizer, Leather and Leather goods, Sugar, Cement, Fish processing, Steel & Chemical industries etc. Major export items: Garments, Tea, Jute, Frozen shrimps, Leather products, Newsprint, paper, Naphtha, Urea, etc. Principle imports: Fuel, Rice, Wheat, Cotton & Textile, Petroleum products, Fertilizer, Staple fibers, yarn etc. Population: 152.51 Million (Population & Housing Census Report 2011, Bangladesh Bureau of Statistics) Population Growth Rate: 1.37 percent Population Density: 1015 Person per sq km Total fertility rate: 2.55 Children born/woman (2012 EST.) Life expectancy: 70.06 years (2012 (est.) Birth Rate: 22.53 (2012 est.) Mortality rate: 5.71 (2012 est.) Adult literacy rate: 47.9 Percent (15 years +) Mineral resources: Natural gas, Limestone, Hard rock, Coal, Lignite, Silica sand, White clay, radio‐active sands etc. (There is a strong possibility of oil deposit) Human resources: A substantial manpower reserve, trained from 21 Public Government and technical Universities along with 52 Private Universities & a strong media. Skilled: Engineers, Technicians, Physicians, Economists, Accountants, Administrative and Managerial personnel, Abundance of low cost, easily trained and adaptable, hardworking, intelligent and Youthful labor force. Broad money concept: If there is a privatization and private company owners invest more in capital market or allotted share for public, this kind of environment is Favorable for share market. Industry Selection: In case of selection the sector anyone can take top down approach. In Bangladesh there are 22 sectors in Bangladesh in capital market.
33 A Report On Investment Analysis

34 A Report On Investment Analysis
4.3 Category Selection: Category selection is the important aspect of the selecting a good share. There are 4 categories of shares‐A, B, N & Z category. 4.4 Owner of the Share :
In case of buying shares, owner should buy these shares where boards of directors have bought a huge amount of share but a few for public, customers should not buy the shares of that company if the least amount of share is owned by Board of directors. 4.5 Internationally Recognized: The company which has the ownership in foreign country, in this case it can be mentioned the name of Grameen Phone or BATBC. 4.6 Dividend Yield:
Dividend Yield refers to the most recent years share price dividend divided by current share price. Which company gives the most dividend yield so we should go for the company? Cash Dividend:
The company which gives the most amount of cash dividend is a good company. Corporate Government
Corporate governance broadly refers to the mechanisms, processes and relations by which corporations are controlled and directed. Governance structures identify the distribution of rights and responsibilities among different participants in the corporation (such as the board of directors, managers, shareholders, creditors, auditors, regulators, and other stakeholders) and include the rules and procedures for making decisions in corporate affairs. Corporate governance includes the processes through which corporations' objectives are set and pursued in the context of the social, regulatory and market environment. This also makes an impact for choosing a good share.
4.7 Trend Analysis:
Downward Trend: When in the security market, the capital is falling down; it is not wise decision to buy the share. In case of sales. Investor has to wait and observe that when the price will rise from their buying price then they should sell it.
Upward Trend: In case of upward Trend, the price is about to increase, then investors can buy those share. In matter of selling the share, they have to observe the market trend and when the price will rise from their buying price they should sold it. In case of upward market the buyers can make decision in long term investment and short term investment
Support Level: Support level will be determine as when Market will be fluctuated then after fluctuation when the security price will be adjust the price. In this prospect this share should be buying.

35 A Report On Investment Analysis
Resistant Level: Resistant level should be determine as when the when the market price will be resist the fluctuation. In this case this type of share cannot be buying.
4.8 Market forecast:
The investors should not take decision base on seeing the present market present market index. The investor should be invested on the basis of future trend of the market .After 3 month or month what will be the situation in market. They should observe instrument and they should buy those for seeing the sector.
4.9 Portfolio management: In case of investing in share market don’t put your all eggs in same baskets. Remembering this situation the will investment different sectors of share and diversified it.
4.10 Budget expansion policy: In case of budget government should think about the capital market. It will be remarkable role for capital market and index can be fluctuated.
4.11 Income statement: the investors must be observing of those company income statements. The transaction may be how the accrued basis or cash basis.
4.12 Market growth: The market growth is very important in this respect .If the market growth will be good it would be better for them to invest.
4.13 Taxation system: What will be the taxation system how we will pay tax on this will make a remarkable role. If the taxation policy is flexible the investor would buy those shares.
4.14 Earnings Per share: It is very useful for buying a share to observe Earning per Share ratio. 4.15 Fixed Asset: What is the company’s fix asset what is the company’s situation. 4.16 Paidup Capital: What is the company’s paid up capital. 4.17 Equity: To invest in share market the company should be concern about their equity. 4.18 Risk factor: what will be company’s risk factor which will be analyzed? 4.19 P/E Ratio: what is the company’s P/E ration would be an important factor. 4.20 Rate of Return: What is the company’s rate of return will be an important factor. Rate of return will be determine in this case, Rate of return =Today’s Price –Previous Day’s Price/ Previous Day’s Price 4.21 Risk Level‐Risk level is determined by standard deviation and Variance.

36 A Report On Investment Analysis
4.22 Risk & Return & Portfolio Analysis:
Risk is an important concept in financial analysis, especially in terms of how it affects security prices and rates of return. Investment risk is associated with the probability of low or negative future returns. The riskiness of an asset can be considered in two ways: (1) on a standalone basis, where the asset’s cash flows are analyzed all by themselves, or (2) in a portfolio context, where the cash flows from a number of assets are combined and then the consolidated cash flows are analyzed. In a portfolio context, an asset’s risk can be divided into two components: (1) a diversifiable risk component, which can be diversified away and hence is of little concern to diversified investors, and (2) a market risk component, which reflects the risk of a general stock market decline and which cannot be eliminated by diversification, hence does concern investors. Only market risk is relevant; diversifiable risk is irrelevant to most investors because it can be eliminated. An attempt has been made to quantify market risk with a measure called beta. Beta is a measurement of how a particular firm’s stock returns move relative to overall movements of stock market returns. The Capital Asset Pricing Model (CAPM), using the concept of beta and investors’ aversion to risk, specifies the relationship between market risk and the required rate of return. This relationship can be visualized graphically with the Security Market Line (SML). The slope of the SML can change, or the line can shift upward or downward, in response to changes in risk or required rates of return. With most investments, an individual or business spends money today with the expectation of earning even more money in the future. The concept of return provides investors with a convenient way of expressing the financial performance of an investment.
One way of expressing an investment return is in dollar terms.
Dollar return = Amount received – Amount invested.
Expressing returns in dollars is easy, but two problems arise. To make a meaningful judgment about the adequacy of the return, you need to
know the scale (size) of the investment. You also need to know the timing of the return.
The solution to the scale and timing problems of dollar returns is to express investment results as rates of return, or percentage returns.
Rate of return = investedAmount
investedAmount receivedAmount −.

37 A Report On Investment Analysis
The rate of return calculation “normalizes” the return by considering the return per unit of investment.
Expressing rates of return on an annual basis solves the timing problem. Rate of return is the most common measure of investment performance.
Risk refers to the chance that some unfavorable event will occur. Investment risk is related to the probability of actually earning less than the expected return; thus, the greater the chance of low or negative returns, the riskier the investment.
An asset’s risk can be analyzed in two ways: (1) on a standalone basis, where the asset is considered in isolation, and (2) on a portfolio basis, where the asset is held as one of a number of assets in a portfolio.
No investment will be undertaken unless the expected rate of return is high enough to compensate the investor for the perceived risk of the investment.
The probability distribution for an event is the listing of all the possible outcomes for the event, with mathematical probabilities assigned to each.
An event’s probability is defined as the chance that the event will occur.
The sum of the probabilities for a particular event must equal 1.0, or 100 percent.
The expected rate of return )(∧
r is the sum of the products of each possible outcome times its associated probability—it is a weighted average of the various possible outcomes, with the weights being their probabilities of occurrence:
rP = r =return of rate Expected ii
n
1=i∑
∧
.
Where the number of possible outcomes is virtually unlimited, continuous probability distributions are used in determining the expected rate of return of the event.
The tighter, or more peaked, the probability distribution, the more likely it is that the actual outcome will be close to the expected value, and, consequently, the less likely it is that the actual return will end up far below the expected return. Thus, the tighter the probability distribution, the lower the risk assigned to a stock.

38 A Report On Investment Analysis
One measure for determining the tightness of a distribution is the standard deviation,σ .
.P) - ( = =deviation Standard i2
i
n
1=i
∧
∑ rrσ
The standard deviation is a probability‐weighted average deviation from the expected value, and it gives you an idea of how far above or below the expected value the actual value is likely to be.
Another useful measure of risk is the coefficient of variation (CV), which is the standard deviation divided by the expected return. It shows the risk per unit of return, and it provides a more meaningful basis for comparison when the expected returns on two alternatives are not the same:
. = (CV) variationoft Coefficienrσ
Most investors are risk averse. This means that for two alternatives with the same expected rate of return, investors will choose the one with the lower risk.
In a market dominated by risk‐averse investors, riskier securities must have higher expected returns, as estimated by the marginal investor, than less risky securities, for if this situation does not hold, buying and selling in the market will force it to occur.
An asset held as part of a portfolio is less risky than the same asset held in isolation. This is important, because most financial assets are not held in isolation; rather, they are held as parts of portfolios. From the investor’s standpoint, what is important is the return on his or her portfolio, and the portfolio’s risk—not the fact that a particular stock goes up or down. Thus, the risk and return of an individual security should be analyzed in terms of how it affects the risk and return of the portfolio in which it is held.

39 A Report On Investment Analysis
The expected return on a portfolio,
,pr∧
is the weighted average of the expected returns on the individual assets in the portfolio, with the weights being the fraction of the total portfolio invested in each asset:
∑=
∧∧
=n
iiip rwr
1.
The riskiness of a portfolio, σp , is generally not a weighted average of the standard deviations of the individual assets in the portfolio; the portfolio’s risk will be smaller than the weighted average of the assets’ σ ‘s. The riskiness of a portfolio depends not only on the standard deviations of the individual stocks, but also on the correlation between the stocks.
The correlation coefficient, �, measures the tendency of two variables to move together. With stocks, these variables are the individual stock returns.
Diversification does nothing to reduce risk if the portfolio consists of perfectly positively correlated stocks.
As a rule, the riskiness of a portfolio will decline as the number of stocks in the portfolio increases.
However, in the real world, where the correlations among the individual stocks are generally positive but less than +1.0, some, but not all, risk can be eliminated.
In the real world, it is impossible to form completely riskless stock portfolios. Diversification can reduce risk, but cannot eliminate it.
While very large portfolios end up with a substantial amount of risk, it is not as much risk as if all the money were invested in only one stock. Almost half of the riskiness inherent in an average individual stock can be eliminated if the stock is held in a reasonably well‐diversified portfolio, which is one containing 40 or more stocks.
Diversifiable risk is that part of the risk of a stock which can be eliminated. It is caused by events that are unique to a particular firm.
Market risk is that part of the risk which cannot be eliminated, and it stems from factors which systematically affect most firms, such as war, inflation, recessions, and high interest rates. It can be measured by the degree to which a given stock tends to move up or down with the market. Thus, market risk is the relevant risk, which reflects a security’s contribution to the portfolio’s risk.
The Capital Asset Pricing Model is an important tool for analyzing the relationship between risk and rates of return. The model is based on the proposition that any stock’s required rate of return is equal to the risk‐free rate of return plus a risk premium, which reflects only the risk remaining after diversification. Its primary conclusion is: The relevant riskiness of an individual stock is its contribution to the riskiness of a well‐diversified portfolio.

40 A Report On Investment Analysis
The tendency of a stock to move with the market is reflected in its beta coefficient, b, which is a measure of the stock’s volatility relative to that of an average stock.
An averagerisk stock is defined as one that tends to move up and down in step with the general market. By definition it has a beta of 1.0.
A stock that is twice as volatile as the market will have a beta of 2.0, while a stock that is half as volatile as the market will have a beta coefficient of 0.5.
Since a stock’s beta measures its contribution to the riskiness of a portfolio, beta is the theoretically correct measure of the stock’s riskiness.
The beta coefficient of a portfolio of securities is the weighted average of the individual securities’ betas:
pi=1
n
i ib = w b .∑
Since a stock’s beta coefficient determines how the stock affects the riskiness of a diversified portfolio, beta is the most relevant measure of any stock’s risk.
The Capital Asset Pricing Model (CAPM) employs the concept of beta, which measures risk as the relationship between a particular stock’s movements and the movements of the overall stock market. The CAPM uses a stock’s beta, in conjunction with the average investor’s degree of risk aversion, to calculate the return that investors require, rs, on that particular stock.

41 A Report On Investment Analysis
The Security Market Line (SML) shows the relationship between risk as measured by beta and the required rate of return for individual securities. The SML equation can be used to find the required rate of return on Stock i:
SML: ri = rRF + (rM – rRF)bi.
Here rRF is the rate of interest on risk‐free securities, bi is the ith stock’s beta, and rM is the return on the market or, alternatively, on an average stock.
The term rM – rRF is the market risk premium, RPM. This is a measure of the additional return over the risk‐free rate needed to compensate investors for assuming an average amount of risk.
In the CAPM, the market risk premium, rM – rRF, is multiplied by the stock’s beta coefficient to determine the additional premium over the risk‐free rate that is required to compensate investors for the risk inherent in a particular stock.
This premium may be larger or smaller than the premium required on an average stock, depending on the riskiness of that stock in relation to the overall market as measured by the stock’s beta.
The risk premium calculated by (rM – rRF)bi is added to the risk‐free rate, rRF (the rate on Treasury securities), to determine the total rate of return required by investors on a particular stock, rs.
The slope of the SML, (rM – rRF), shows the increase in the required rate of return for a one unit increase in risk. It reflects the degree of risk aversion in the economy.
The risk‐free (also known as the nominal, or quoted) rate of interest consists of two elements: (1) a real inflation‐free rate of return, r*, and (2) an inflation premium, IP, equal to the anticipated rate of inflation.
The real rate on long‐term Treasury bonds has historically ranged from 2 to 4 percent, with a mean of about 3 percent.
As the expected rate of inflation increases, a higher premium must be added to the real risk‐free rate to compensate for the loss of purchasing power that results from inflation.
As risk aversion increases, so do the risk premium and, thus, the slope of the SML. The greater the average investor’s aversion to risk, then (1) the steeper the slope of the line, (2) the greater the risk premium for all stocks, and (3) the higher the required rate of return on all stocks.
Required Rate of Return (%) SML = ri = rRF + (rM - rRF)bi rM Market risk premium rRF 0.5 1.0 Risk, bi

42 A Report On Investment Analysis
Many factors can affect a company’s beta. When such changes occur, the required rate of return also changes.
A firm can influence its market risk, hence its beta, through changes in the composition of its assets and also through its use of debt.
A company’s beta can also change as a result of external factors such as increased competition in its industry, the expiration of basic patents, and the like.
For a management whose primary goal is stock price maximization, the overriding consideration is the riskiness of the firm’s stock, and the relevant risk of any physical asset must be measured in terms of its effect on the stock’s risk as seen by investors. A number of recent studies have raised concerns about the validity of the CAPM.
A recent study by Fama and French found no historical relationship between stocks’ returns and their market betas.
They found two variables which are consistently related to stock returns: (1) a firm’s size and (2) its market/book ratio.
After adjusting for other factors, they found that smaller firms have provided relatively high returns, and that returns are higher on stocks with low market/book ratios. By contrast, after controlling for firm size and market/book ratios, they found no relationship between a stock’s beta and its return.
As an alternative to the traditional CAPM, researchers and practitioners have begun to look to more general multi‐beta models that encompass the CAPM and address its shortcomings.
In the multi‐beta model, market risk is measured relative to a set of factors that determine the behavior of asset returns, whereas the CAPM gauges risk only relative to the market return.
The risk factors in the multi‐beta model are all nondiversifiable sources of risk.
Earnings volatility does not necessarily imply investment risk. You have to think about the causes of the volatility before reaching any conclusions as to whether earnings volatility indicates risk. However, stock price volatility does signify risk (except for stocks that are negatively correlated with the market, which are few and far between, if they exist at all).
4.23 Security Portfolio
1. Mean Value: In mathematics and statistics, the arithmetic mean or simply the mean or average when the context is clear, is the sum of a collection of numbers divided by the number of numbers in the collection. The collection is often a set of results of an experiment, or a set of results from a survey. Suppose we have a data set containing the values The arithmetic mean is defined by the formula

43 A Report On Investment Analysis
. If the data set is a statistical population (i.e., consists of every possible observation and not just a subset of them), then the mean of that population is called the population mean. If the data set is a statistical sample (a subset of the population), we call the statistic resulting from this calculation a sample mean. The arithmetic mean of a variable is often denoted by a bar, for example as in (read "x bar"), which is the mean of the values
2. Standard Deviation: A measure of the dispersion of a set of data from its mean. The more spread apart the data, the higher the deviation. Standard deviation is calculated as the square root of variance. In finance, standard deviation is applied to the annual rate of return of an investment to measure the investment's volatility. Standard deviation is also known as historical volatility and is used by investors as a gauge for the amount of expected volatility.
3. Rho: The rate at which the price of a derivative changes relative to a change in the risk‐free rate of interest. Rho measures the sensitivity of an option or options portfolio to a change in interest rate.
As seen in the above graph, option rho for calls and puts have a mirrored profile; calls move from zero to a positive number as the stock price increases while puts move from a negative number towards zero under the same circumstances.

44 A Report On Investment Analysis
Rho, however, is more about interest rate movements than the underlying price and hence you will see greater impacts of its value depending on the premium of the option.
4. Alpha: Alpha is a risk‐adjusted measure of the so‐called active return on an investment. It is the return in excess of the compensation for the risk borne, and thus commonly used to assess active managers' performances. Often, the return of a benchmark is subtracted in order to consider relative performance, which yields Jensen's alpha.
The alpha coefficient ( ) is a parameter in the Capital Asset Pricing Model (CAPM). It is the intercept of the security characteristic line (SCL), that is, the coefficient of the constant in a market model regression.
It can be shown that in an efficient market, the expected value of the alpha coefficient is zero. Therefore the alpha coefficient indicates how an investment has performed after accounting for the risk it involved:
• : the investment has earned too little for its risk (or, was too risky for the return) • : the investment has earned a return adequate for the risk taken • : the investment has a return in excess of the reward for the assumed risk
For instance, although a return of 20% may appear good, the investment can still have a negative alpha if it's involved in an excessively risky position
5. Slope: In finance, the beta (β) of an investment is a measure of the risk arising from exposure to general market movements as opposed to idiosyncratic factors. The market portfolio of all investable assets has a beta of exactly 1. A beta below 1 can indicate either an investment with lower volatility than the market, or a volatile investment whose price movements are not highly correlated with the market. An example of the first is a treasury bill: the price does not go up or down a lot, so it has a low beta. An example of the second is gold. The price of gold does go up and down a lot, but not in the same direction or at the same time as the market.
A beta above one generally means that the asset both is volatile and tends to move up and down with the market. An example is a stock in a big technology company. Negative betas are possible for investments that tend to go down when the market goes up, and vice versa. There are few fundamental investments with consistent and significant negative betas, but some derivatives like equity put options can have large negative betas.
Beta is important because it measures the risk of an investment that cannot be diversified away. It does not measure the risk of an investment held on a stand‐alone basis, but the amount of risk the investment adds to an already‐diversified portfolio. In the capital asset pricing model, beta risk is the only kind of risk for which investors should receive an expected return higher than the risk‐free rate of interest.
45 A Report On Investment Analysis
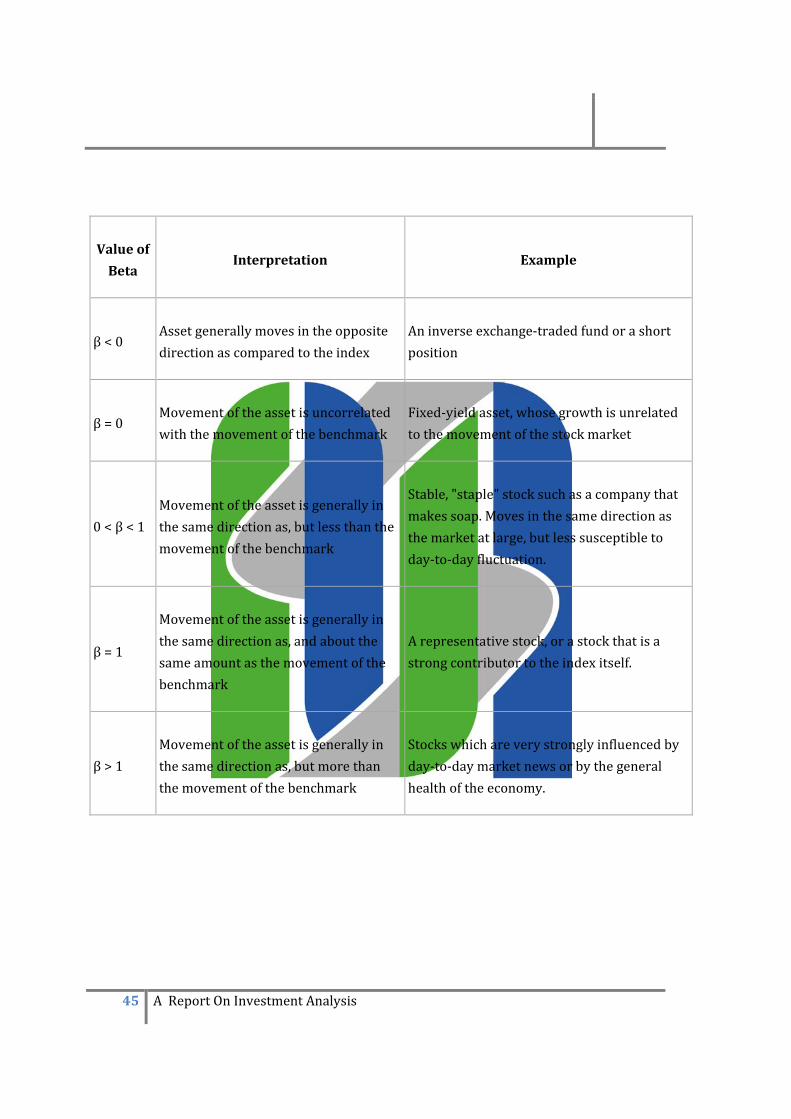
Value of
Beta Interpretation Example
β < 0 Asset generally moves in the opposite direction as compared to the index
An inverse exchange‐traded fund or a short position
β = 0 Movement of the asset is uncorrelated with the movement of the benchmark
Fixed‐yield asset, whose growth is unrelated to the movement of the stock market
0 < β < 1 Movement of the asset is generally in the same direction as, but less than the movement of the benchmark
Stable, "staple" stock such as a company that makes soap. Moves in the same direction as the market at large, but less susceptible to day‐to‐day fluctuation.
β = 1
Movement of the asset is generally in the same direction as, and about the same amount as the movement of the benchmark
A representative stock, or a stock that is a strong contributor to the index itself.
β > 1 Movement of the asset is generally in the same direction as, but more than the movement of the benchmark
Stocks which are very strongly influenced by day‐to‐day market news or by the general health of the economy.

46 A Report On Investment Analysis
4.24 Analysis the Market Return Index and Share price index:
In case of analysis the share and seeing the criteria of investment it has been chosen three shares .They are Berger PBL, Square Pharma and SPCL. The daily return is depicted on the 3 months close price with 3 month share index in this share it has been used this formula: Daily return = (Today’s Price‐Previous Days Price)/ Previous Days Price Market return = (Today’s Market Index‐Previous Days Market Index)/ Previous Days Market Index
BergerPBL
Security price
Daily Return
Market Index
Market Return
1 1,623.50 4,556.94 2 1,555.40 ‐0.04 4,585.73 0.01 3 1,541.60 ‐0.01 4,585.73 0.00 4 1,501.40 ‐0.03 4,626.23 0.01 5 1,486.50 ‐0.01 4,624.95 0.00 6 1,484.80 0.00 4,664.91 0.01 7 1,472 ‐0.01 4,681.54 0.00 8 1,481.60 0.01 4,695.80 0.00 9 1,512.50 0.02 4,719.41 0.01 10 1,521.40 0.01 4,739.65 0.00 11 1,541.70 0.01 4,763.22 0.00 12 1,509.30 ‐0.02 4,742.22 0.00 13 1,506.40 0.00 4,801.15 0.01 14 1,539.40 0.02 4,808.64 0.00 15 1,533 0.00 4,802.18 0.00 16 1,502 ‐0.02 4,788.23 0.00 17 1,457.90 ‐0.03 4,802.27 0.00 18 1,441.20 ‐0.01 4,800.41 0.00 19 1,440.40 0.00 4,769.47 ‐0.01 20 1,447.30 0.00 4,831.18 0.01 21 1,449.40 0.00 4,841.72 0.00 22 1,450.30 0.00 4,810.54 ‐0.01 23 1,472.40 0.02 4,786.69 0.00 24 1,454 ‐0.01 4,712.57 ‐0.02
47 A Report On Investment Analysis
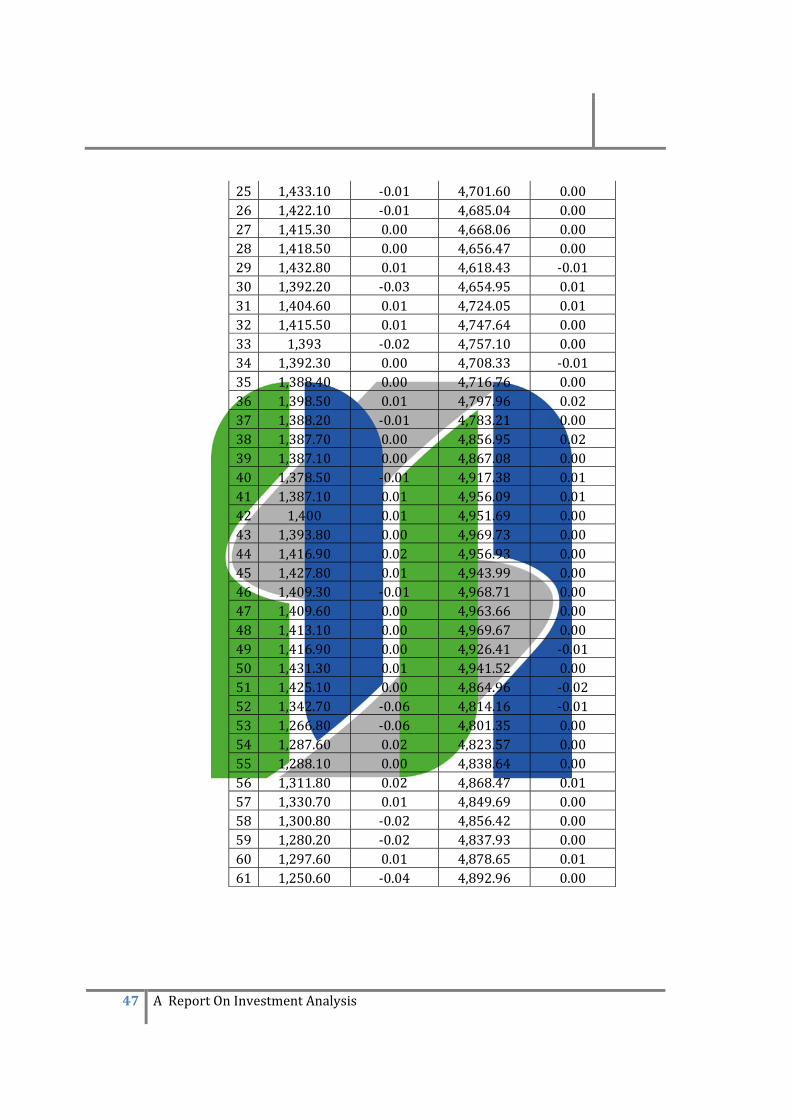
25 1,433.10 ‐0.01 4,701.60 0.00 26 1,422.10 ‐0.01 4,685.04 0.00 27 1,415.30 0.00 4,668.06 0.00 28 1,418.50 0.00 4,656.47 0.00 29 1,432.80 0.01 4,618.43 ‐0.01 30 1,392.20 ‐0.03 4,654.95 0.01 31 1,404.60 0.01 4,724.05 0.01 32 1,415.50 0.01 4,747.64 0.00 33 1,393 ‐0.02 4,757.10 0.00 34 1,392.30 0.00 4,708.33 ‐0.01 35 1,388.40 0.00 4,716.76 0.00 36 1,398.50 0.01 4,797.96 0.02 37 1,388.20 ‐0.01 4,783.21 0.00 38 1,387.70 0.00 4,856.95 0.02 39 1,387.10 0.00 4,867.08 0.00 40 1,378.50 ‐0.01 4,917.38 0.01 41 1,387.10 0.01 4,956.09 0.01 42 1,400 0.01 4,951.69 0.00 43 1,393.80 0.00 4,969.73 0.00 44 1,416.90 0.02 4,956.93 0.00 45 1,427.80 0.01 4,943.99 0.00 46 1,409.30 ‐0.01 4,968.71 0.00 47 1,409.60 0.00 4,963.66 0.00 48 1,413.10 0.00 4,969.67 0.00 49 1,416.90 0.00 4,926.41 ‐0.01 50 1,431.30 0.01 4,941.52 0.00 51 1,425.10 0.00 4,864.96 ‐0.02 52 1,342.70 ‐0.06 4,814.16 ‐0.01 53 1,266.80 ‐0.06 4,801.35 0.00 54 1,287.60 0.02 4,823.57 0.00 55 1,288.10 0.00 4,838.64 0.00 56 1,311.80 0.02 4,868.47 0.01 57 1,330.70 0.01 4,849.69 0.00 58 1,300.80 ‐0.02 4,856.42 0.00 59 1,280.20 ‐0.02 4,837.93 0.00 60 1,297.60 0.01 4,878.65 0.01 61 1,250.60 ‐0.04 4,892.96 0.00

48 A Report On Investment Analysis
Average 0.00SD 0.01708375RHO 0.16339798SLOPE 0.40329137ALPHA ‐0.0046818
Square Pharma
Security price Daily Return
Market Index
Market Price
1 259 4,556.94
2 257 ‐
0.007722008 4,585.73 0.01
3 253.3 ‐
0.014396887 4,585.73 0.00 4 254.3 0.003947888 4,626.23 0.01
5 253.3 ‐
0.003932363 4,624.95 0.00 6 259.1 0.02289775 4,664.91 0.01
7 257.6 ‐
0.005789271 4,681.54 0.00
8 254.9 ‐
0.010481366 4,695.80 0.00 9 257.2 0.009023146 4,719.41 0.01
10 255.8 ‐
0.005443235 4,739.65 0.00 11 258.5 0.010555121 4,763.22 0.00 12 260.3 0.00696325 4,742.22 0.00
13 259.8 ‐
0.001920861 4,801.15 0.01 14 259.9 0.000384911 4,808.64 0.00 15 259.9 0 4,802.18 0.00 16 260.2 0.00115429 4,788.23 0.00
17 259.6 ‐
0.002305919 4,802.27 0.00 18 260.2 0.002311248 4,800.41 0.00 19 260.6 0.001537279 4,769.47 ‐0.01

49 A Report On Investment Analysis
20 260 ‐
0.002302379 4,831.18 0.01
21 259.8 ‐
0.000769231 4,841.72 0.00
22 258.2 ‐
0.006158584 4,810.54 ‐0.01
23 256.2 ‐
0.007745933 4,786.69 0.00 24 255.4 ‐0.00312256 4,712.57 ‐0.02
25 254.1 ‐
0.005090055 4,701.60 0.00 26 255.2 0.004329004 4,685.04 0.00
27 252.2 ‐
0.011755486 4,668.06 0.00 28 253.1 0.003568596 4,656.47 0.00 29 256.2 0.012248123 4,618.43 ‐0.01
30 255 ‐
0.004683841 4,654.95 0.01
31 254.3 ‐
0.002745098 4,724.05 0.01
32 253.8 ‐
0.001966182 4,747.64 0.00
33 253.2 ‐
0.002364066 4,757.10 0.00 34 254.3 0.004344392 4,708.33 ‐0.01 35 255.4 0.0043256 4,716.76 0.00 36 255.9 0.001957713 4,797.96 0.02 37 256.9 0.003907776 4,783.21 0.00 38 259.3 0.009342156 4,856.95 0.02
39 258.5 ‐
0.003085229 4,867.08 0.00 40 256.7 ‐0.00696325 4,917.38 0.01 41 257.7 0.003895598 4,956.09 0.01
42 257.2 ‐
0.001940241 4,951.69 0.00 43 256 ‐0.00466563 4,969.73 0.00 44 256.8 0.003125 4,956.93 0.00 45 258.7 0.007398754 4,943.99 0.00 46 259.5 0.003092385 4,968.71 0.00 47 261.3 0.006936416 4,963.66 0.00 48 265 0.014159969 4,969.67 0.00
49 263.8 ‐
0.004528302 4,926.41 ‐0.01 50 263.8 0 4,941.5150 0.00

50 A Report On Investment Analysis
51 263.8 0 4,864.96 ‐0.02
52 263.7 ‐
0.000379075 4,814.16 ‐0.01
53 259.4 ‐
0.016306409 4,801.35 0.00 54 261.3 0.007324595 4,823.57 0.00
55 259.4 ‐
0.007271336 4,838.64 0.00 56 258.2 ‐0.00462606 4,868.47 0.01 57 259.3 0.004260263 4,849.69 0.00
58 259.2 ‐
0.000385654 4,856.42 0.00
59 258.1 ‐
0.004243827 4,837.93 0.00 60 257.8 ‐0.00116234 4,878.65 0.01 61 258.1 0.001163693 4,892.96 0.00
Average ‐3.49626E‐05SD 0.006853967RHO 0.069288166SLOPE 0.068610437
ALPHA ‐
0.000117981
SPCL
Security price
Daily Return
Market Index
Market Price
1 198 4,556.94 2 216.9 0.09545455 4,585.73 0.01 3 237.6 0.09543568 4,585.73 0.00
4 230.8 ‐
0.02861953 4,626.23 0.01 5 244.8 0.06065858 4,624.95 0.00
6 227.2 ‐
0.07189542 4,664.91 0.01
7 218.4 ‐
0.03873239 4,681.54 0.00

51 A Report On Investment Analysis
8 208 ‐
0.04761905 4,695.80 0.00 9 197.6 ‐0.05 4,719.41 0.01 10 205.8 0.04149798 4,739.65 0.00
11 188.7 ‐
0.08309038 4,763.22 0.00
12 172.3 ‐
0.08691044 4,742.22 0.00
13 169.2 ‐
0.01799187 4,801.15 0.01
14 162.8 ‐
0.03782506 4,808.64 0.00
15 160.7 ‐
0.01289926 4,802.18 0.00
16 146.1 ‐
0.09085252 4,788.23 0.00 17 146.6 0.00342231 4,802.27 0.00 18 162.8 0.11050477 4,800.41 0.00 19 167.5 0.02886978 4,769.47 ‐0.01 20 174.6 0.04238806 4,831.18 0.01
21 158.7 ‐
0.09106529 4,841.72 0.00
22 158 ‐
0.00441084 4,810.54 ‐0.01 23 157.1 ‐0.0056962 4,786.69 0.00 24 157.4 0.00190961 4,712.57 ‐0.02 25 164.3 0.04383736 4,701.60 0.00 26 169 0.02860621 4,685.04 0.00 27 171 0.01183432 4,668.06 0.00 28 187.5 0.09649123 4,656.47 0.00
29 184.6 ‐
0.01546667 4,618.43 ‐0.01 30 195.2 0.05742145 4,654.95 0.01 31 213.9 0.09579918 4,724.05 0.01 32 233.5 0.0916316 4,747.64 0.00 33 238.9 0.02312634 4,757.10 0.00 34 240.1 0.00502302 4,708.33 ‐0.01 35 221.2 ‐0.0787172 4,716.76 0.00
36 218.7 ‐
0.01130199 4,797.96 0.02
37 214.6 ‐
0.01874714 4,783.21 0.00
38 209.9 ‐
0.02190121 4,856.95 0.02

52 A Report On Investment Analysis
39 201.1 ‐
0.04192473 4,867.08 0.00
40 196.7 ‐
0.02187966 4,917.38 0.01 41 206.8 0.05134723 4,956.09 0.01 42 216.5 0.04690522 4,951.69 0.00 43 219.5 0.01385681 4,969.73 0.00
44 218.1 ‐
0.00637813 4,956.93 0.00 45 223.8 0.0261348 4,943.99 0.00
46 216.7 ‐
0.03172475 4,968.71 0.00
47 205.4 ‐
0.05214582 4,963.66 0.00
48 187.9 ‐
0.08519961 4,969.67 0.00
49 170.9 ‐
0.09047366 4,926.41 ‐0.01 50 188.4 0.10239906 4,941.52 0.00 51 202.3 0.07377919 4,864.96 ‐0.02 52 210.3 0.03954523 4,814.16 ‐0.01 53 216.9 0.03138374 4,801.35 0.00 54 226.6 0.04472107 4,823.57 0.00 55 230.7 0.01809356 4,838.64 0.00 56 231.7 0.00433463 4,868.47 0.01
57 230.2 ‐
0.00647389 4,849.69 0.00 58 241.9 0.05082537 4,856.42 0.00
59 231.1 ‐
0.04464655 4,837.93 0.00 60 212.8 ‐0.0791865 4,878.65 0.01 61 213.6 0.0037594 4,892.96 0.00
Average 0.00278703SD 0.05571522
RHO ‐
0.00724929
SLOPE ‐
0.05835235ALPHA 0.00285763

53 A Report On Investment Analysis
Daily Market Return BER SQUPh SPCL
1‐
0.04 ‐0.008 0.095
2‐
0.01 ‐0.014 0.095
3‐
0.03 0.004 ‐0.03
4‐
0.01 ‐0.004 0.06 5 0 0.02 ‐0.07
6‐
0.01 ‐0.006 ‐0.04 7 0.01 0.01 ‐0.05 8 0.02 0.009 ‐0.05 9 0.01 ‐0.005 0.04110 0.01 0.01 ‐0.08 11 0.02 0.007 ‐0.09 12 0 ‐0.002 ‐0.02 13 0.02 4E‐04 ‐0.04 14 0 0 ‐0.01
15‐
0.02 0.001 ‐0.09
16‐
0.03 ‐0.002 0.003
17‐
0.01 0.002 0 18 0 0.002 0.02 19 0 ‐0.002 0.04 20 0 ‐8E‐04 ‐0.09 21 0 ‐0.006 0.00422 0.02 ‐0.008 ‐0.01
23‐
0.01 ‐0.003 ‐0
24‐
0.01 ‐0.005 0.044
25‐
0.01 0.004 0.02826 0 ‐0.012 0.01127 0 0.004 0.09628 0.01 0.012 0.015

54 A Report On Investment Analysis
29‐
0.03 ‐5E‐04 0.05730 0.01 ‐0.003 0.09531 0.01 ‐0.002 0.09
32‐
0.02 ‐0.002 0.02333 0 0.004 0.00534 0 0.004 ‐0.08
35‐
0.01 0.002 ‐0.01 36 0 0.004 ‐0.02 37 0 0.009 ‐0.02 38 0 ‐0.003 ‐0.04
39‐
0.01 ‐0.007 ‐0.02 40 0.01 0.004 0.05141 0.01 ‐0.002 0.04742 0 ‐5E‐04 0.01443 0.02 0.003 ‐0.01 44 0.01 0.007 ‐0.01
45‐
0.01 0.003 ‐0.03 46 0 0.007 ‐0.05 47 0 0.014 ‐0.09 48 0 ‐0.005 ‐0.09 49 0.01 0 0.10250 0 0 0.074
51‐
0.06 ‐4E‐04 0.04
52‐
0.06 ‐0.016 0.03153 0.02 0.007 0.04554 0 ‐0.007 0.01855 0.02 ‐0.005 0.00456 0.01 0.004 ‐0.01
57‐
0.02 ‐4E‐04 0.05
58‐
0.02 ‐0.004 0.04459 0.01 ‐0.001 ‐0.08
60‐
0.04 0.001 0.004

55 A Report On Investment Analysis
In case of this report we can use this formula Expected portfolio return E(x)= +
w1 w2 w3 E(R1) E(R2) E(R3) E(Rp) 0.40 0.30 0.30 0.00 ‐3.4963 0.00279 ‐1.0480.30 0.40 0.30 0.00 ‐3.4963 0.00279 ‐1.39770.30 0.30 0.40 0.00 ‐3.4963 0.00279 ‐1.04780.25 0.35 0.40 0.00 ‐3.4963 0.00279 ‐1.22260.25 0.15 0.60 0.00 ‐3.4963 0.00279 ‐0.52280.10 0.30 0.60 0.00 ‐3.4963 0.00279 ‐1.04720.35 0.25 0.40 0.00 ‐3.4963 0.00279 ‐0.873
SD(P) % E(RP) % 0.00747 0.7466 ‐1.048 ‐104.80.00648 0.6475 ‐1.3977 ‐139.770.00612 0.6117 ‐1.0478 ‐104.780.0056 0.56 ‐1.2226 ‐122.260.00526 0.5261 ‐0.5228 ‐52.2770.00422 0.4221 ‐1.0472 ‐104.720.00669 0.6691 ‐0.873 ‐87.295

56 A Report On Investment Analysis
From the following graph that it visible that the randomly chosen three instrument which has been bought and the last three month price observation and it is visible that the price has tend to increase. In this case it is wise to buy shares.
57 A Report On Investment Analysis
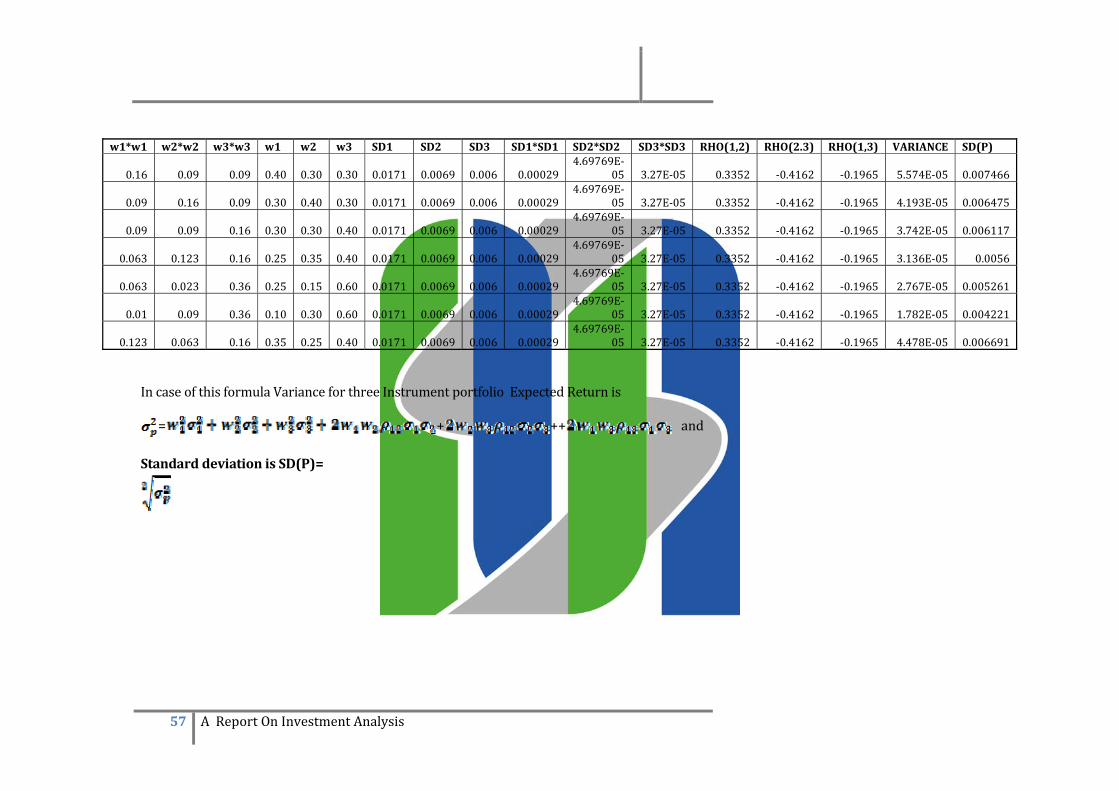
In case of this formula Variance for three Instrument portfolio Expected Return is
= + ++ and
Standard deviation is SD(P)=
w1*w1 w2*w2 w3*w3 w1 w2 w3 SD1 SD2 SD3 SD1*SD1 SD2*SD2 SD3*SD3 RHO(1,2) RHO(2.3) RHO(1,3) VARIANCE SD(P)
0.16 0.09 0.09 0.40 0.30 0.30 0.0171 0.0069 0.006 0.00029 4.69769E‐
05 3.27E‐05 0.3352 ‐0.4162 ‐0.1965 5.574E‐05 0.007466
0.09 0.16 0.09 0.30 0.40 0.30 0.0171 0.0069 0.006 0.00029 4.69769E‐
05 3.27E‐05 0.3352 ‐0.4162 ‐0.1965 4.193E‐05 0.006475
0.09 0.09 0.16 0.30 0.30 0.40 0.0171 0.0069 0.006 0.00029 4.69769E‐
05 3.27E‐05 0.3352 ‐0.4162 ‐0.1965 3.742E‐05 0.006117
0.063 0.123 0.16 0.25 0.35 0.40 0.0171 0.0069 0.006 0.00029 4.69769E‐
05 3.27E‐05 0.3352 ‐0.4162 ‐0.1965 3.136E‐05 0.0056
0.063 0.023 0.36 0.25 0.15 0.60 0.0171 0.0069 0.006 0.00029 4.69769E‐
05 3.27E‐05 0.3352 ‐0.4162 ‐0.1965 2.767E‐05 0.005261
0.01 0.09 0.36 0.10 0.30 0.60 0.0171 0.0069 0.006 0.00029 4.69769E‐
05 3.27E‐05 0.3352 ‐0.4162 ‐0.1965 1.782E‐05 0.004221
0.123 0.063 0.16 0.35 0.25 0.40 0.0171 0.0069 0.006 0.00029 4.69769E‐
05 3.27E‐05 0.3352 ‐0.4162 ‐0.1965 4.478E‐05 0.006691

58 A Report On Investment Analysis
Chapter 5 Problems of the Report & Company:
In this report there are some problems.
1.Investors Problem :The investor are in a fix that in which share they will they invest .As we see that in the market index will be fluctuated and the price of share is influence by Co Relation. Sometime this mathematical analysis will not work out. For this reason most of the investor are unaware about process and procedure capital market. Most of the People make a short term investment. In this case the loss a huge amount of money. In case of long term investment they have make some patience.
2. Margin facility: In case of margin facility some of clients avail the margin facility. However, thinking of the present market condition the authority will not allow opening any margin code because the equity of client’s code may be negative. Sometime the investor demands excess margin facility.
3. Equity minus Code: In case of Trading share in days and there will be no equity minus share of a client in a day end some of clients do not adjust this amount.
4. Analysis of the share’s: It has been chosen three random shares to analysis the information of these reports.
A)Berger PBL is a share. In case of calculation of analysis of single share if we invest it the rate of return is low because its mean deviation is constant. So we can choose another share.
B) SPCL is gambling share. The investor is gambling with this share .Some house is not allowed to trade this instruments. By investing in this share the investor could loss a huge amount of money. In Case of Money payment System the customer wants to withdraw money after selling share. But in this case company has charged some money to avoid this kind of interruption. Sometimes the customer makes some arguments being on this.
5. Financial Analyst: In case of share market analysis a financial team has been activated work to analysis the market. In this prospect this company has lack of this.
6. Lack of training and other facility: There are some training arranged by DSE but there is no training or other facility for the back office.
7. N numbers of Assets:
It is difficult to calculate more than three Assets. So, in this report it is very tough to calculate more than three assets.
59 A Report On Investment Analysis
Chapter 6: Findings of the Report:
In the time of choosing the instruments it have been observed that the mean deviation of Berger PBL is 0, the price is not rising, and In this case this will be very wise decision to invest in another instruments .As it has been observed 3 months market price. But if anyone is short term investor they should not invest in Berger PBL. Regarding as a long term investor it will be wise decision to buy Berger PBL.
Amongst of the three chosen share standard deviation of Square pharma is the least. In this case we can also change decision. From The standard deviation it is observed that in what extent the price is being fluctuated. In case of standard deviation Berger PBL is the best. For this Reason it has been chosen.
In case of three shares SPCL has negatively correlated with the market index. The price of the share is increasing whereas the market index or market return is decreasing. On the other hand bother other share is going as the same direction with the market.
In case of the slope analysis or beta analysis Movement of the asset is generally in the same direction as, but less than the movement of the benchmark. Stable, “staple" stock such as a company that makes soap. The market moves in the same direction as at large, but less susceptible to day‐to‐ day fluctuation.
Alpha is the interpretation of the riskiness of the asset which determines that show much profit or gain has he earned. In this report it has been observed that the riskiness of asset is greater because Berger PBL and square pharma shows minus figure whereas SPCL shows a positive result. SPCL has the best Alpha among the two. It indicates that the riskiness of asset is less them other twos.
The three instruments have three types. It is chosen from different risks because of it is not wise to put all eggs in same basket. It has been wise to diversify all eggs into different segments. In this prospect an investor can invest in another portfolio with three another type of asset.

60 A Report On Investment Analysis
Chapter 7 Recommendation:
The recommendation of this report regarding the investment decision is the instrument which was randomly chosen for the report is not sufficient enough .For this reason we can change for Square pharma SPCL or Berger PBL, We can also go for Batbc,Grameen phone or other banks share just like UCBL or One Bank. It is better to avoid SPCL in case of investment.
Now a day’s share market is in downward tendency but trend will rise also. So it is wise that the investor who will make decision they will have long term investor with a huge amount of money with a huge amount of risk. In this case they should invest the huge amount of money in capital market. However they must be keep patience in this case. The interest rate and bank rate will be lessening to influence the more investment in capital market.
If we take more than three instruments or security for the asset then our formula will be
₌ +
Mostly there is some computer software who can calculate the number of more than 3 assets.
In case of recommendation the company should introduce a financial analysis in this case. For this reason they can calculated the data practically too specified ideas about share.
Equity Research is not yet very popular in Bangladesh, in this case this brokerage house should be in more qualified and more research produced by their independent research departments. In this case to increase more price incentive for private entrepreneurs to access the capital market should be remarkable role. Tax Gap between listed company and non listed company could be increased. Infrastructure projects should be access to capital market raise financing though bonds and corporations should raise short term financing. Securitization should be encouraged.
Quality analysis needs needs to address this valuation issue in a more pro‐active manner. The independent analyst should raise the flag when a scrip is overvalued or undervalued, the intrinsic value of a traded security should be covered in the research paper .Investor are perhaps depending much on speculative analysis into volatility in the market as opposed to fundamental analysis, which cold attract more stable long term investor who are about their investment tenure and expectations. It is observed that whenever there is a downtrend in the market, individual investors go on rampage. However, these investors should understand that downturns, bearish trends and market correction are a main part of stock market.

61 A Report On Investment Analysis
Chapter 8 Conclusion:
As Bangladesh is economically emerging country, the Bangladesh capital market still has a long way to go. The recent measures taken by the transitional government have already begun to positively impact the markets. If more investor‐friendly policy reforms were to be implemented ,the capital market will undoubtedly play a critical role in leading Bangladesh toward being the next Asian tiger with growth comparable to India , Pakistan ,Indonesia ,Philippines ,Vietnam and most dynamic economics in the region.
62 A Report On Investment Analysis
Chapter 9: References:
http://www.dsebd.org/
http://www.stockbangladesh.com/
Investment Principal and Concept, Charles P.Jones 11th Edition
Various Lectures taken From Financial Markets and Instrument (Mr. Salehuddin Ahmed)