final report - nasa · chapter i introduction this final report is submitted by orion research ......
TRANSCRIPT

FINAL REPORT
Contract No.: NAS 9-12117
Submitted by: Orion Research Incorporated
11 Blackstone Street
Cambridge, Mfassachusetts 02139
Submitted to: National Aeronautics and
Space Administration
Houston, Texas
Date: December 14, 1973
(NASA-CR-134 373) AUTOMATED POTENTIOMETRIC N74-30491
ELECTROLYTE ANALYSIS SYSTEM Final Report
(Orion Research, Inc.) UnclasUnclas
G3/05 46342
p.eproduced by TECNICALATIONAL TEC
INFORMATION SERVICEus Departmno 1 CofmercO
sprngZd' VA. 22151
PRICES SUBJ ECT TO M 'I&
https://ntrs.nasa.gov/search.jsp?R=19740022378 2018-06-25T04:57:33+00:00Z

NOTICE
THIS DOCUMENT HAS BEEN REPRODUCED FROM THE
BEST COPY FURNISHED US BY THE SPONSORING
AGENCY. ALTHOUGH IT IS RECOGNIZED THAT CER-
TAIN PORTIONS ARE ILLEGIBLE, IT IS BEING RE-
LEASED IN THE INTEREST OF MAKING AVAILABLE
AS MUCH INFORMATION AS POSSIBLE.

AUTOMATED POTENTIOMETRIC
ELECTROLYTE ANALYSIS SYSTEM
FINAL REPORT
ORION RESEARCH INCORPORATED
C-a

CONTENTS
CHAPTER PAGE
I INTRODUCTION 1
II ELECTRODES 3
III CHEMISTRY 41
IV FLUID TRANSPORT PACKAGE 46
V ELECTRONICS UNIT 66
VI CONTROLLER AND SOFTUARE 98
VII TEST RESULTS 115
VIII OPERATION AND MAINTENANCE 120
IX SUMMARY AND SUGGESTIONS 176
CHAPTER I
INTRODUCTION
This final report is submitted by Orion Research
Incorporated to describe work performed on Contract
NAS 9-12117. The purpose of this undertaking was to
demonstrate the feasibility of utilizing chemical
sensing electrode technology as the basis for an
automatically-controlled system for blood gas and
Selectrolyte analyses under weightless conditions.
The specific measurements required by the contract
are PH, pCO 2 , sodium (Na ), chloride (Cl ), potassium
(K ) , and ionized calcium (Caj). In addition to these
parameters, Orion has added total calcium (C T) at
no additional cost to NASA.
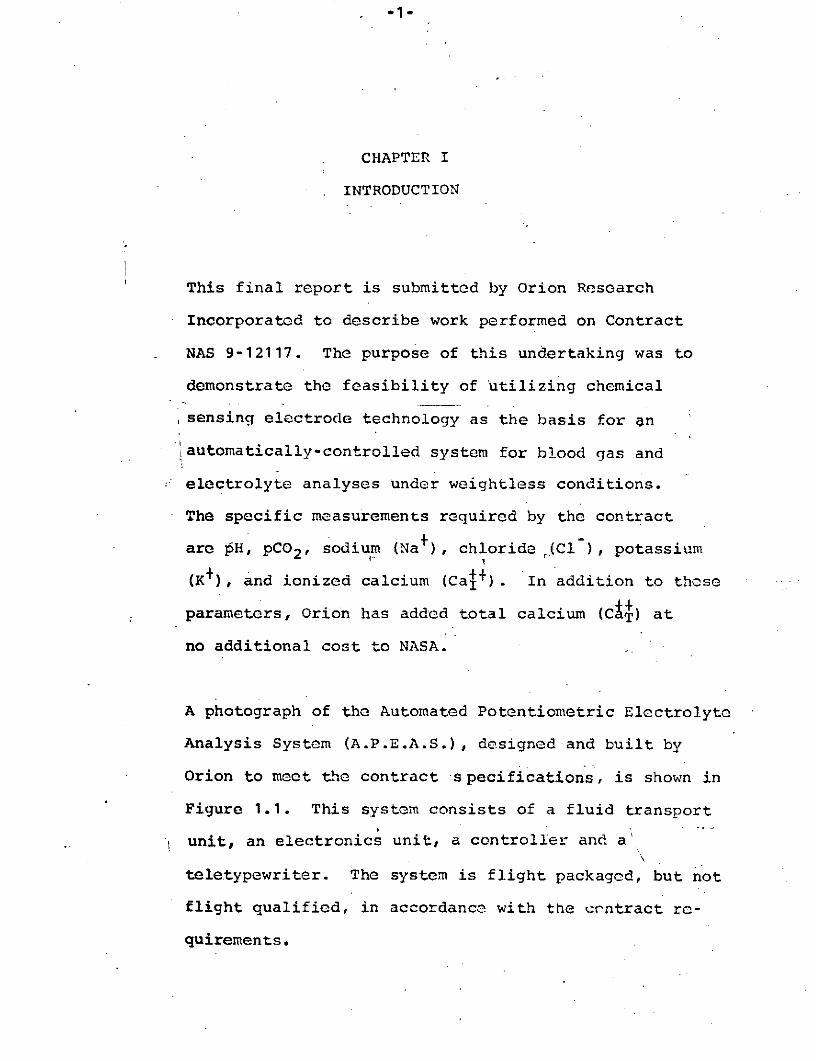
A photograph of the Automated Potentiometric Electrolyte
Analysis System (A.P.E.A.S.), designed and built by
Orion to meet the contract specifications, is shown in
Figure 1.1. This system consists of a fluid transport
unit, an electronics unit, a controller and a
teletypewriter. The system is flight packaged, but not
flight qualified, in accordance with the crntract re-
quirements.

a2-
1.1 Automated Potentiometric Electrolyte Analysis System
Rep r 08uc deocOPY-
best ada a
~-- ---- ;~~;-1- --- ; No ;0; r*; ;1- N,;
440 1
-~c~c~ c~iIN
,WWI- 0

-3-
CHAPTER II
ELECTRODES
2.1. Introduction
This section has been included as a brief outline
of general electrode theory for the non-specialist/
so that the sections discussed later will be rendered
more intelligible. A more complete review can be
found in a paper written for the National Bureau of
Standards Symposium on Ion-Selective Electrodes, by
J.W. Ross, entitled, ''Solid and Liquid Membrane Ion-
Selective Electrodes," January, 1969, (NBS special
publication 314).
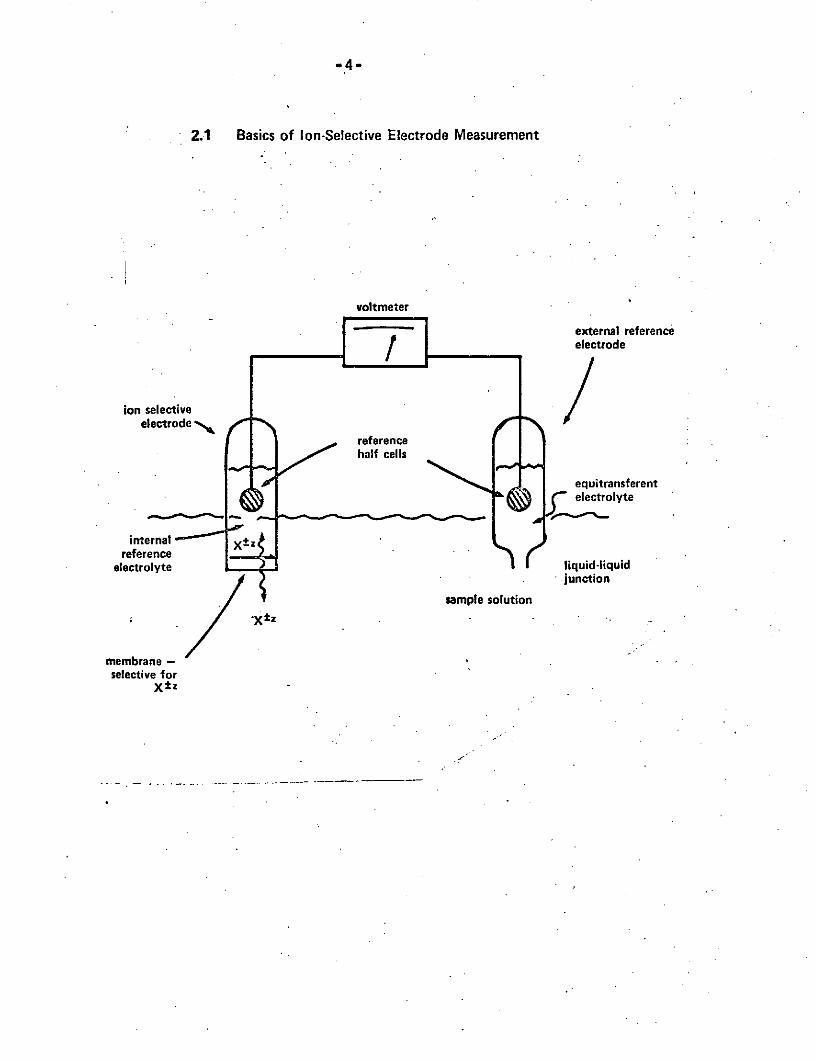
The basic equipment required for an electrode measurement
of a single ionic species in a sample solution is shown
in Figure 2-1. Two probes are required: the ion-selective
electrode and a reference electrode. For the present,
the reference electrode can be considered simply as an
electrical contact to the sample solution whose potential
relative to the solution is independent of the solution
composition. The second probe, the ion-selective elec-
trode, is an insulating barrel sealed across one end
with a membrane. The membrane, which can be made from
a variety of materials, is an ionic conductor across
which only one ionic species, the ion to be measured,
-4-
2.1 Basics of Ion-Selective Electrode Measurement
voltmeter
external referenceelectrode
ion selectiveelectrode
referencehalf cells
equitransferentelectrolyte
internal Xtzreference
electrolyte liquid-liquidjunction
7 sample solution
S"Xtz
membrane -selective for
X±z

is capable of migration. Inside the barrel is an
electrolyte, either solid or liquid, which contains
a fixed level of the ion to be measured and, in
addition, an ion to which a reference half cell is
reversible.
If the two probes are connected to a high impedence
voltmeter and placed in a solution containing the
ion to be measured, there will be a momentary flux
of the ion across the membrane. Electrical charge
will, as a result, be carried across the membrane
until a potential is developed which is exactly that
required to inhibit further net ionic migration across
the membrane. In the equilibrium state, the potential
measured by the voltmeter is given by the Nernst
equation:
RTE = E0 + 2.3---- log A
where the constant E0 is dependent on the choice
of reference electrode, the level of the ion in the
internal electrolyte, and the internal reference
half.cell. R is the gas constant, T the absolute
temperature, z the charge (including sign) of the
ion and F the Faraday constant. A represents the
ionic activity of the transported ion in the sample
solution. (At 250 C, 2.3 RT/F has a value of 59.16 mv.)

-6-
The number of ions which moves across the membrane
to establish the equilibrium potential is vanishingly
small, so that neither the ion concentration of the
sample solution nor the internal electrolyte is per-
turbed in this process. (The cell potential, E, is
therefore a direct measure of the ion activity in
the sample solution.)
It is important to note that the level of the ion
is measured by its ''ionic activity'' and not in terms
of the more familiar "'concentration.'' Ion activity
may be thought of as the thermodynamically effective
concentration of an ion. In electrolyte solutions of
high ionic strength an ion activity may differ signi-
ficantly from its stoichiometric concentration. In
very dilute solutions the activity and concentration
scales converge. In general, ionic activity is more
significant than concentration. Activities, not
concentrations, determine positions of chemical equi-
libria and rates of chemical reactions.
Compared with other analytical techniques, electrode
measurements have an impressive list of advantages.
Although an electrode senses ionic activity, it can
also be used to dctermine free ion and total concen-
trations through methods such as titration, known
addition, and ionic strength buffering.

Electrode measurements are rapid, virtually instantaneous
in many cases. Response times are frequently as fast
as ten milliseconds, and even under unfavorable con-
ditions, a reading can be obtained within three minutes.
An electrode measurement is non-destructive. The
number of ions transported across the membrane in
order to establish equilbrium is miniscule relative
to the number present in even the most dilute samples.
In addition, with appropriate electrode geometry, very
small samples of only a few tenths of a milliliter can
be handled. These advantages can be very important
in biological applications, where several determinations
must be performed on a single small sample.
In most cases, no sample pretreatment is necessa.ry.
Opaque solutions and even viscous slurries can be
measured directly. Time-consuming filtration and
distillation operations are eliminated. Automated
analytical methods based on electrode measurements
are therefore relatively simple to design. The
equipment required is simple and, relatively in-
expensive.
All electrodes exhLbit a drift in the magnitude of the

constant term in the Nernst equation, at a rate which
depends primarily on the temperature variation in
the surroundings. An electrode in an average labora-
tory will show a noncumulative drift of about two
millivolts per day. Under field conditions or in
process control applications, even larger fluctua-
tions can occur. The presence of drift requires
periodic restandardization at a frequency which
depends on the accuracy required and the rate of
temperature variation. Under the most favorable
conditions, in an air-conditioned laboratory with
samples and standards all at the same temperature,
a precision of 0.2 my can be attained on replicate
measurements of the same sample. Under typical
field conditions, a precision of 4.0 mv is more
usual. The following table translates the uncertainty
in the potential reading into the corresponding per-
cent uncertainty in ion activity as determined from
the Nernst equation.
PRECENT UNCERTAINTY PERCENT UNCERTAPRECISION IN E MONOVALENT ION DIVALENT ION
----- ---------------------------------------------
0.2 myv 0.4% 0.8%
4.0 myv 7.5% 15.0%
---- ---------------------------------------------
For a given uncertainty in E, the accuracy of a
divalent ion measurement is poorer than that of a

monovalent ion because of the presence of the charge
term, z, in the Nernst equation. Because it is a
logarithmic device, an electrode gives a constant
precision throughout its dynamic range. Therefore,
the accuracy of determinations at low levels is
comparable to those performed in more concentrated
solutions.
2.2 Membranes
The usefulness of an ion-selective electrode is
determined primarily by the ability of the membrane
to pass only the ion to be measured and to exclude
all others. Several classes of materials have been
found to be adaptable to this function.
2.2.1. Glass Systems
Historically, silicate glass membranes permeable to
hydrogen ions formed the first ion-selective elec-
trodes to be studied. The technology in this area is
over 40 years old, beginning with the development of
pH electrodes in the 1930's. More recently (1957),
it was discovered that certain glasses could be
formulated which were selectively permeable to sodium,
and to a lesser e tent, potassium and other alkali
metal ions.

-10-
Glass membranes for the measurement of pH are highly
developed and pH electrodes are available whose
potentials rigorously follow the Nernst equation, at
least in the pH range of biological interest. The
major difficulties with pH glasses are their high
electrical resistance and the ease with which they
devitrify during fabrication operations. Their high
resistance requires the use of sophisticated electronic
measuring systems. Devitrification problems restrict
to some extent the range of shapes which can be
fabricated.
In addition to pH selective glasses, a number of
other composition systems are known which are
useful for alkali metal ion analysis. Although
not ideally selective to a given alkali metal ion,
they can still be used in a given application
where interfering ion levels are sufficiently low.
Such electrodes obey an equation of the form
E = E + 2.3 log ( A + SA)0 zF 11
where A is the sample ion activity to be measured
and the Ai's are the activity levels of interfering
ions which have some mobility in the glass membrane,
and Si's are the electivity constants, which differ
for each interfering ion and each glass composition.

-11-
Selectivity constant tables provide a convenient
method of comparing the properties of different
glass compositions and predicting whether a given
glass will make a useful electrode in a given
application. At the present time, glasses are
known which will satisfactorily measure sodium in
biological samples, without significant interference
from potassium or hydrogen ions at the levels
normally encountered. Glasses are also known which
can be used to measure potassium in some samples
such as urine, but not in blood serum, because of
the high background sodium levels. No glasses are
available with significant selectivity for divalent
cations or anions of any charge.
2.2.2. Liquid Membrane Systems
In 1965, the first liquid membrane electrode was
developed at Orion .Ross, J.W., Science 156, 1378 (1967)]
Liquid membrane electrodes are fabricated from a porous,
inert plastic substrate which is saturated with a water-
immiscible organic solvent. A high molecular-weight
organic salt of the ion of interest is dissolved in the
organic solvent. A calcium-selective electrode for
example, can be made from a solution of calcium
bis-2-diethylhexyl phosphate, Ca(DEHP)2 in a solvent
such as dioctylphcnylphosphonate. The neutral, un-
dissociated molecules of the salt are free to diffuse

into the solvent-saturated pores of the membrane and
are free to exchange calcium ions with the sample solu-
tion. Since the salt itself is water-insoluble, the
organic DEIIP groups act to transport calcium ions back
and forth through the membrane. The selectivity of
the membrane depends upon the fact that the DEHP groups
form more stable complexes with calcium ions than with
sodium, magnesium, or other ions present in the sample
solution.
The example cited employs a negatively charged organic
anion to selectivity transport a cation. Positively
charged cationic organic groups can be found with high
selectivities for anions. A highly effective nitrate
electrode utilizes a cationic organic group for trans-
port of nitrate anions. Organic groups containing
sulfur have proven to have high selectivities for heavy
metals, such as copper and lead.
Liquid electrodes are described by an equation similar
to that for the alkali ion glass membrane systems:
E = E + 2.3 RT log [A + SiAiz/zi]
where z and zi are the charges on the ion to be mea-
sured, and on the interfering ion, respectively. The

-13-"
selectivity constants, Si, have the same significance
as described previously and are equally useful in
cataloging membrane characteristics. A typical cali-
bration curve for a calcium selective electrode is
shown in Figure 2.2.
2.2.3. Solid State Crystalline Systems
A still newer class of membranes showing ion
selective properties was developed at Orion beginning
with the discovery that lanthanum fluoride single
crystals showed a high level of fluoride ion con-
ductivity [Frant, M.S. and Ross, J.W., Science
154, 1553 (1966)]. An electrode membrane fabricated
from a thin section of LaF3 crystal behaves in an
ideal Nernstian manner toward changes in solution
fluoride activity.
Subsequently, other ionic solid state conductors were
discovered which permit electrode measurements of a
variety of ions.
Unlike glass and liquid membrane systems, interference
resulting from ion transport through the membrane
phase does not occur with crystalline lattice membranes.
The crystal in th's sense is an ideal ion ''sieve"''
for the ion to be measured.

-14-
2.2 Calcium Electrode Calibration Curve
ELECTRODE+40 -POTENTIAL
(MV) 10 FOLD CHANGE
•/.Z-.,,oo10
+20-- pH= 6
T =2 5 0 C
--- POTENTIAL VS. CONCENTRATION
POTENTIAL VS. ACTIVITY
-20 PURE CaCI 2 SOLUTIONS
i I I i iI 1 I I I I I I I I I Ii0 -110-4 10- 2 10-
(MOLES/ LITER)

-15-
Interference can occur due to solid phase reactions at the
membrane-sample interface. A chloride ion sensitive membrane
made from a silver-chloride crystal section may experience
interference from iodide as a result of the reaction:
AgCl(s) + 1" = AgI(s) + Cl"
Here the silver chloride surface is converted to silver iodide
with a loss of chloride response. Reactions of this type can only
occur if the ratio of the activity of the interfering ion to
that of the ion to be measured exceeds a critical value which
can be calculated from the solubility products of the pertinent
solid phases. In the case just discussed, iodide interference
will occur if
A,. Ksp AgI.. = 10-6.33
AC1. Ksp AgCl
where Ksp is the solubility product constant. If this ratio is
exceeded, the electrode becomes completely inoperative as a
chloride sensing device until the surface layer of Aql is removed
by abrasion or chemical treatment. In samples in which the ratio
I"/Cl" is less than the critical, the electrode will function as
an'ideal chloride sensing device with no interference from
iodide.
-16-
2.3 Reference Electrodes
Reference electrode theory has grown concomitantly
with the development of the glass pH electrode for
a number of years. Two factors are important in the
selection of a given design, the nature of the
internal half cell, and the choice of the solution
which forms the liquid junction to the sample
solutions.
Half cells of the type Mx + + xCl" = MCl (s) + xe"x
are universally used to make the connection be-
tween the metal wire from the meter and the solution
forming the liquid junction. Excellent stability is
-obtained where M is either silver,mercury, or thallium.
In our experience, silver has been the best choice,
because it shows a smaller temperature hysteresis
effect on the half cell potential than the other
two metals do.
Overall system stability under conditions where
temperature is subject to change can be improved
if the temperature coefficient of the internal
half cell in the reference electrode can be matched
to that of the ion-selective electrode. Under those
conditions the constant .E 0 " in the Nernst equation
can be made temperature invariant.

-17-
In general, this matching is possible for any reference electrode,
ion-selective electrode pair with a suitable choice of internal
electrolyte composition in the ion-selective electrode, and
suitable reference electrode filling solution.
In addition to fixing the half cell potential and temperature
coefficient of the reference electrode half cell, the liquid
junction solution should result in a constant (and preferably
zero) liquid-liquid junction potential at-the sample-solution
interface. The liquid-liquid junction potential is determined
by the concentrations and relative mobilities of all the ions
present in solution at the interface, and will, in general,
vary in response to changes in sample composition. Classically,
the solution to this problem has been to make the reference
electrode filling solution very concentrated in an electrolyte
whose cations and anions have very nearly equal mobilities
(KC1 or NH4NO 3 for example). Since the electrolyte concentration
is very high relative to the sample solution, the effect of
sample ions on the liquid-liquid junction potential can be
ignored. The potential is therefore independent of sample
composition. In addition, the equality of mobilities

for the two ions present in large excess ensures
that the potential will be nearly equal to zero.
2.4.Speed of Measurement
The response time of an ion-selective electrode
depends on the time required to establish a steady
state of ion flux across the membrane in response
to a change in ion activity at the electrode surface.
Response rate can be limited by either the membrane
characteristics, or by the time required to bring
fresh sample to the membrane surface.
In the absence of interfering ions, the membrane
response is quite rapid, on the order of rillisec'ds
for the glass and solid state membrane materials
and less than 5 seconds for liquid membrane systems.
In the presence of high levels of interfering ions,
the response times for all types of membranes will
increase to several minutes for liquid systems and
to as much as 15 minutes for glass membranes.
Under normal operating conditions, where ion inter-
ference terms are small, the system response is
determined by the rate at which a sample ion
activity can be changed at the membrane sui.face.
Sample flow velocity, viscosity, and the hydrodynamic
flow pattern of the system all affect this rate.

-19-
With viscous samples, suchW as blood serum, fastest
responses are obtained under high velocity, laminar
flow conditions which can be achieved by using small
diameter capillary tube geometries, in the electrode
and interelectrode ducting.
2.5. A.P.E.A.S. Electrodes
2.5.1. General:
The system employs four electrode modules to perform
the seven measurements. A photograph of a typical
module is shown in Figure 2.3. Three of these modules
each contain two sensing electrodes and a reference
electrode. The fourth contains a combination pCO2 electrode
and circuitry for monitoring temperatures in the elec-
trode area.
2.5.2. pCO 2/0 C Module:
A drawing, in cross section, of the pCO 2 /oC module is
shown in Figure 2.4.
A combination gas-sensing electrode and the circuitry
for monitoring temperature are employed in the measure.-
ment of the partial pressure of carbon dioxide in
samples introduced into the system. The principles
of operation of this device can best be illustrated

-20o
2.3 A.P.E.A.S. Electrode Module

-21-
2.4 pCO2 f'C Module in Cross-Section
I -II
;~ 1 V; \N'
. -"I7
I

-22-
by referring to Figure 2.5. The CO2 electrode uses a hydro-
phobic gas-permeable membrane to separate the sample from the
electrode internal filling solution. Equilibrium between the
sample pCO 2 and the partial pressure of CO2 in the bicarbonate
filling solution is achieved by the diffusion of carbon dioxide
across the membrane. The CO2 dissolving in the bicarbonate
internal filling solution reacts with water to form carbonic
acid according to the following reaction:
CO2 + 120-== I2CO3-- =H+ + HCO3"
The relationship between CO2 , II+, and HCO 3" is given by the
following equation:
[ICO3" H+ ]
= constant[C0 2]
The internal filling solution contains HCO 3 " at such a high
level that the term [HCO3"] can be considered a constant.
Thus:
[H ] = [CO2 ] constant
The potential of the pH sensing element varies in a Nernstian
manner with changes in the H+ level:

-23-
2.5 Construction of a Gas-Sensing Electrode
outer body rreferenceelement
internali bfilling .
inner body solution
SO-ring
spacer '
- bottom cap
sensing element membrane

-*24-
E = E0 + 2.3 RT log AHiF
By defining a new constant, E, the response to CO2 is described
as:
E = E + 2.3 RT log [CO2 ].F
The change in p1l is measured by the glass electrode. Since
the pH response of the glass electrode is a function of the
ratio [HCO3"]/[CO2 ], the pH1 measured is a function of the
partial pressure of CO2 in the sample.
This electrode can respond only to a gas, and therefore is
free from any ionic interferences in physiological samples.
Circuitr; for the- temperature readout is also enclosed in
the module with the CO2 electrode. This module was selected
as the temperature sensing and control site because the CO2
electrode is approximately five times more sensitive to
temperature changes than the remainder of the electrodes in
the system. This can be explained by the sensitivity to
changes in temperature of the partial pressure of a gas, in
addition to the Nernstian dependence of the pH1 sensor on
temperature.

-25-
2.5.3. Na+/K+ Module:
A cross-sectional drawing of the Na+/K+ module is shown in
Figure 2.6.
Sodium is measured in this module using a sodium selective
glass capillary with a solid state electrolyte backing (A).
The electrode develops a potential proportional to the loga-
rithm of the activity of the free sodium ion in the sample.
The response of this electrode is described by the Nernst
equation, as discussed in Section 2.1.
Although the electrode detects very low levels of sodium
ion, it is a logarithmic device and cannot be used to detect0
very small changes in ionic activity at high concentration
levels. Factors such as temperature variation, drift, and
noise, limit the precision. With frequent calibration,
however, measurements should be reproducible to J1% of the
sample sodium ion activity.

-26-
2.6. Na*/K + Module in Cross-Section
4r
77K
b1 j~t
x4

-27-
The electrode response to sodium ion in solution, as
a function of pH, is shown in Figure 2.7. This figure
shows that near the normal blood pH of 7.4, there is
negligible hydrogen ion interferc:nce. How er, cor-
rection for hydrogen ion interference should be made
for urine samples which have a pH in the range 5.5
to approximately 6.0.
In general, for solutions containing sodium ion and
an interfering monovalent cation, electrode behavior
is given by the equation:
E = E0 + 2.3RT log(A Na + Sx+Ax+)F
Where: Sx = selectivity constant for the interfering ion
Ax+ = activity of the interfering ion
Table 2.1 gives selectivity constants (electrode response
to interfering ion in proportion to electrode response
to sodium ion) for the coimaon intcrfering cations. These
values are only approximate since Sx varies somewhat
with the ratio of the interfering cation to the level of
total sodium ion. Sx also differs slightly from the
value listed if more than one interfering ion is present
in the sample.

2.7 Sodium Electrode Response vs. pH
120 **I*101 M-' Na"
,o-
40 -electrode:-potential
20 ..........
10"-M Na+
.o
40 ... .....:.:.:. ..... :.:.:.:. p
Interferenc .'' pH
1 23,4 5 6 7 8 9101112 13 14

-29-
Table 2.1 Approximate Cation Selectivity Constants
for the Sodium Electrode:
Cation Selectivity Constant
Li+ 2 x 10- 3
K+ - 1 x 10- 3
Rb+ 3 x 10 - 5
Cs+ 1.5 x 10⁻³
NH4 3 x 10⁻⁵
N(C2 5 4+ 5 x 10⁻⁴
Ag 350
Tl+ 2 x 10⁻⁴
Whether significant interference occurs depends on
the level of interfering ion and sodium ion present
in the sample and the selectivity constant for the
interfering ion. A concentration of 10-1 M potassium,
for example, will cause virtually no error in the
5 x 10 - 2 M sodium solution, a 1% error in a 10-2 M
solution, and substantial error in a solution more
dilute than 103M14 sodium.
Typical response.time varies from several seconds in
10-1 4 sodium ion solutions, to several minutes near
the limit of detection. Response time is more rapid
when going from dilute to concentrated solutions.
Electrode response is also more rapid in solutions of

30U-
low viscosity, and in solutions which are stirred during
measurement.
The potassium electrode is of the liquid membrane
typo (sco Figure 2.8.) (B). The liquid membranc employed
is valinomycin, an antibiotic whose structure is
an eighteen amino acid ring. This neutral, macrocyclic
compound acts as a ''ferry'' to selectively transport
potassium across the hydrophobic membrane.
The electrode detects potassium ion much as a conven-
tional glass p1l electrode detects hydrogen ion, but
instead of developing a potential across a glass
membrane, it develops a potential across a thin
layer of water-iimmiscible liquid ion exchanger.
An aqueous filling solution containing fixed levels
of potassium ion and chloride ion contacts the inside
surface of the membrane disc, which is saturated with
the ion exchanger. The potassium ion in the filling
solution provides a stable potential between the
inside surface of the membrane and the internal
filling solution, and the chloride ion provides a
constant potential between the filling solution and
the internal Ag/AgCI reference element. Thus, changes
in electrode potential are due to changes in sample
potassium ion activity, and can be described by the
Nernst equation.

2.8 Potassium Electrode, right, shown with pH Eloctrode
INTERNAL
AQUEOUS F;LLINGSOLUTION
AAggCI ION
REFERENCE -- EXCHANGERELECTRODE -RERVOIR
POROUS MEMBRANE LIQUID IONEXCHANGE
GLASS LAYERMEMBRANE
CONVENTIONAL LIQUIO MEMBRANEGLASS PH ELECTRODE ELECTRODE

-32-
The electrode responds to certain other cations as
well as to potassium ion. In solutions containing
potassium ion and an interfering monovalent cation,
electrode behavior is given by the equation:
RTE = E + 2.33 -- log [AKt + Sx+Ax+]
Table 2.2 gives selectivity constants for the coiimon
interfering cations. These values are only approximate
since Sx varies with the ratio of the level of the
interfering cation to the level of total potassium ion.
S also differs slightly from the value listed if morex
than one interfering ion is present in the sample.
Table 2.2: Approximate Cation Selectivity Constants for the
Potassium Electrode
Cation Selectivity Constant
Cs+ 1.0
NH4 3 x 10 2
H 10-2
T1 10-2
Ag 10'10
Na 4Na 2 x 10⁴
LiLi 10 - 4
Tris i0-4

-33-
This electrode is sufficiently selective that no
significant interferences occur in biological samples,
including serum and urine.
The reference electrode for the Na+ /K+ module (C)
consists of-a solid-state AgCi/AgS sensor through
which 0.3 M4 KC1 is pumped. This reference electrode
is identical in construction to the chloride measuring
electrode which is described more fully in section 2.5.5.
2.5.4 pH/C I Module
The pH/Cai+ is similar in construction to the Na+/K+
module shown in Figure 2.5. The only differences are
that a hydrogen selective capillary is substituted for
the sodium selective capillary and the liquid membrane
electro.de employs a calcium selective ion exchanger
and internal filling solution.
The pH capillary is a lithium-barium-cesium silicate
glass formulation with a higher lithium concentration
than used in commercial ph electrodes. This formula-
tion produces a glass which shows poorer sodium
selectivity at high pH (over pH 10.5), but gives a
much lower volume resistivity glass. Since the
p1 of the samples of interest for this system is
much lower than pH 10, the small sacrifice in sodium
rejection is of no importance. The lower resistance

-34-
capillary, however, is more responsive and is less
subject to perturbations due to electrical noise.
The theory and practice of pH measurements is well
known and will not be treated in more detail in this
chapter.
The calcium electrode ion-exchanger is a calcium salt
of an organophosphoric acid, which exhibits a high
selectivity for calcium over other cations. An
internal filling solution of calcium chloride contacts
the inside surface of the membrane. The calcium ion
in this solution provides a stable potential between
the internal reference electrode and the filling
solution. Thus, changes in potential are due only to
changes in sample calcium ion activity. The electrode
responds only to the ionized or unbound calcium in the
sample. It has been shown that, in serum, the ionized
fraction is the physiologically active form and is
therefore, in many cases, more significant than the
total calcium parameter obtained by conventional
techniques such as flame photometry or colorimetry.
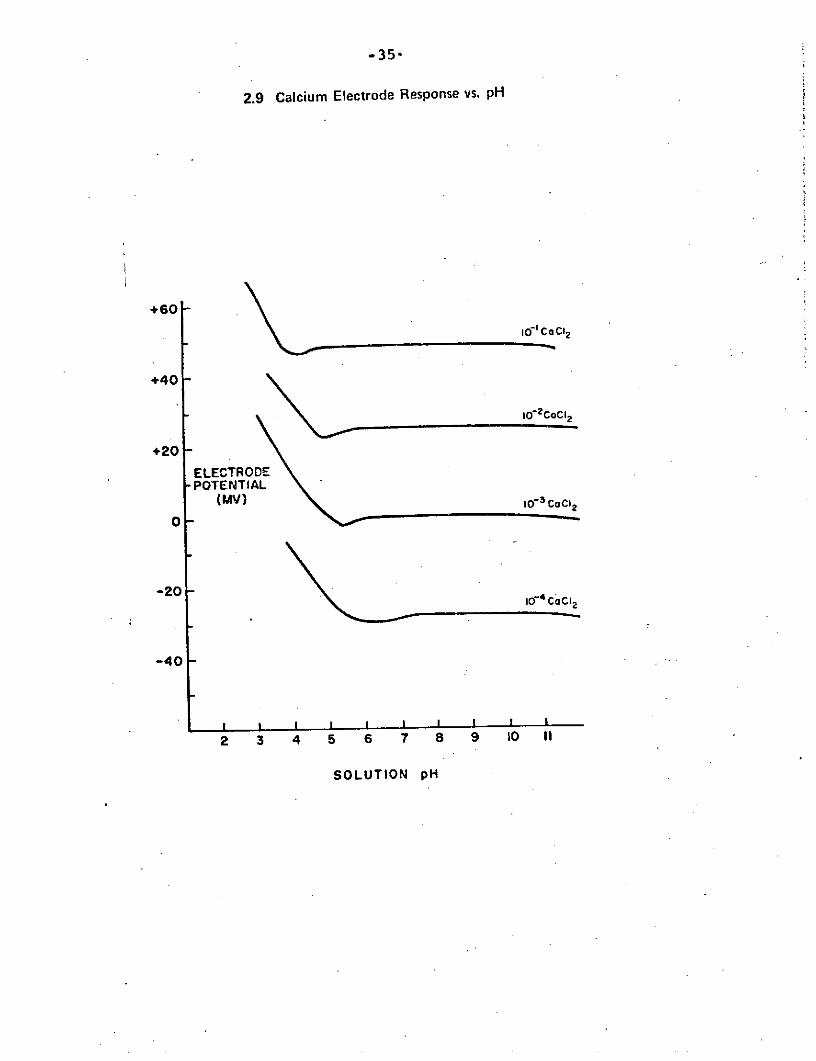
Over the range pH 5.5 to 11, the electrode exhibits
little error due to changes in pH (see Figure 2.9.).
The electrode is believed to give correct readings
of calcium activity above pH 11, but difficulties
are experienced in interpretation of the data due
-35-
2.9 Calcium Electrode Response vs. pH
+60
10" Co Cl2
+40
+20
ELECTRODEPOTENTIAL
(MV)o- coc
-20-
-40
I I I I I I I I I I
2 3 4 5 6 7 8 9 10 II
SOLUTION pH

to formation of Ca (011) 7. In thc acid regions (Se lov
PII S ) , Thz c loc t rods rcspo:lds t.o h y J r o g c r . i o n and no
l o n g e r ~ . ~ a s u r e s ca l c iu ,~ ion.
Tho ehcctrodo viil rcs;~ond, to so1r.2 extentr to all
1 diva1er.t ca t ions . Thc i > l ~ ~ t ~ o i ? c behavior in solutiozs
c o n t a i n i n g calcium and a sccond d i v a l c c t cation i s
. .. .- - . . . . - - -. . . . - - . - - .
whgro sx++ = sclec ~ i v i t y c o i ~ s t a n t f o r t h s d i v a l c n t
"++ . catioa LL
Valu-ss silo.:!n in TaS1z 2 . 3 fcr S,t.f a r c o n l y appxoxi-stc
+I- and hay vnry dcpsnc?iny ca thc r a t i o of itt t o C a .
Approxina ts D i v a l e n t ent ior , S c . l c c t i v i t i i ? s (S,++) For
Ion

-37-
The interfering divalent cation error relative to
the amount of calcium present in the samiple is given
by the following equation:
ERROR = x ++(A x++/A Ca+)
For example, in a solution with a calcium activity of
10 3 moles/liter, and about twice as much magnesium
the error is about 0.014 (2 x 10⁻³/10-3) = 0.028.
In other words, the apparent calcium activity level
will read high by about 2.8% in the prescnce of a
two-fold excess of magnesium ion.
Correction for the interference errors with the calcium
electrode was ma.e by preparing standard mixtures
with levels of the interfering ion equal to those
expected in the samples. Additional corrections can-bC
mrade by prograrmmed corrections for sample background
variations.
2.5.5. Ca++/Cl" M'odule
A cross-sectional drawing of the Ca+ /Cl module isT
shown in figure 2.10. This module cr,ploys a flow-through
AgCl/Ag2 S solid-state membrane for the measurement of
chloride, which has a solid-state silver

-38-
2.10. CaT**/CI- Module in Cross-Section
/ ,, --41__x
=- t7Li-

-39-
backing, and therefore contains no liquid.internal
reference solution.
The potential developed by the electrode is due to
changes in the silver ion activity at the surface of
the membrane, and is described by the Nernst equation.
The sampla is not required to contain silver ions
because the limited solubility of the membrane pro-
vides sufficient ions for this purpose. Silver ions
are mobile through the membrane as a consequence
of lattice defects in the crystalline structure.
The calcium portion of this module is identical to the
calcium electrode described in 2.5.4. Total calcium
is obtained by acidifying the sample stream, causing
hydrogen ion displacement of protein-bound Ca.
2.6. Effect of M chanical Stresses On Electrodes
High accelerations (5-10 g) and high sound levels
experienced during take-off do not permit the use
of conventional, commercial electrode formats.
High accelerations could easily force air bubbles
into critical positions plugging the liquid junction
of the reference electrode and displacing rne internal
liquid electrolytes inside the ion-seiective electrodes
from their required contact with the membrane surfaces.

-40-
Redesigns, incorporating solid internal references
have been necessary to avoid these problems.
Adequate time response requires the use of thin
membranes which, particularly in the case of the
glass and liquid membrane electrodes, will be subject
to rupture at high sound levels. A combination of
sound shielding for the entire system, and mechanical
''backing'' of the membranes will be required to
avoid difficulties from this source. By using the
large variety of solid internal electrolytes developed
at Orion, a considerable increase in rigidity and
strength has been achieved which would not be
possible using conventional construction techniques.
The electrodes which have been designed and built for
the A.P.E.A.S. system appear-to be capable of surviving
rigorous stresses. All components have been
incorporated into rigid epoxy bodies with solid-state
and solid internal references being used wherever
possible. Those electrodes requiring liquid internal
electrolytes have been designed to prevent loss of
liquids during severe, stresses.
-41-
CHAPTER III
CHEMISTRY
3.1 Introduction
Theoretically, one could use electrodes to measure
absolute activity of any ionic species. To do this
would require an absolute measurement or calculation
of the constant E0 in the Nernst equation. Hilowever,
it is impossible to measure or calculate from thermo-
dynamic data the half cell potentials and liquid-
liquid junction potential included in the Eo term.
As a result, from a practical standpoint, ion activity
measurements can only be made relative to an arbitrary
standard.
In the case of hydrogen ion activity measurcments,
the problem has been solved via the National Bureau
of Standards pH1 scale in which several selected
buffers have been arbitrarily assigned ''reasonable''
pH values. All pH values are understood to be
relative to these defined, arbitrary standards. In
the case of the other ions, there is no generally
accepted activity scale presently availablc, although
work is beginning.
-42-
In the absence of a standard scale, most analytical
work in relatively concentrated electrolytes is
presently being done using standard solutions of
strong electrolytes with ionic strengths approximating
those of the samples. Relative activity measurements
made in this way have the advantage-that the numerical
value of the result approximates the value of the
concentration of the free ion in the sample solution.
In addition to having an appropriate ionic strength,
a standard solution must also satisfy more obvious
requirements: the activity level of the ion to be
measured should be close to that expected in the
sample, the solution should contain no ion in
sufficient concentration to cause interference,
and the solution must be stable with respect to
chemical and biological degradation.
In general, two standard solutions with activity values
bracketing those expected in the sample solutions are
used in calibrating an electrode. Frequency of stan-
dardization depends on the drift rate of the electrodes.
For maximum accuracy, however, standardization should
be repeated for each sample measurement.
3.2. APEAS Standards
Development of suitable standard mixtures for the APEAS

-43-
system has required a significant fraction of the total time
expended on the contract. The major reason is the fact that
very little, if any, prior work had been done in the are of
formulating gas/electrolyte mixtures. Standards for a systemI
of t is type must meet several requirements. Among these are:
1. The standards must provide for two-point calibration, where
possible, for each of the seven electrodes in the system.
2. The activities of the individual species should bracket
the expected physiological range of the samples which will
be most frequently introduced into the system.
3. The standards must be buffered with respect to pH and pCO2 .
4. The ionic strengths of the standards must closely approxi-
mate the ionic strength of serum.
5. The mixtures must be stable.
6. No more than two sample containers should be required for
system standardization.
The formulations for a pair of standards which meet the above
requirements are shown below:

*44-
Component STD/A mi/1 STD F ml/l
1 M NaCI 100 125
0.1 M KCl 20 60
0.1 1M CaC1 2 30 10
I M 1NaICO3 16.5 16.5
1 i11 CI 45 40
1 M Tris 50 50
The concentrations for the individual ions in the above
mixtures are shown below:
Species STD A, meq/1 STD B, mreq/1
Na 116.5 141.5
Cl" 153.0 173.0
K+ 2.0 6.0
Ca + 6.0 2.0
pCO2 46.0 pn 29.5 mm
p1! 7.07 7.35

-45-
Tris (hydroxymethyl aminomethano) was selected as the
buffer for those solutions because there is no known
interaction between tris and the cations being determined
in the system. Also, tris is the basis for a new sories
of physiological ph buffers recently proposed by the
National Bureau of Standards.

-46-
CHAPTER TV
FLUID TRANSPORT PACKAGE
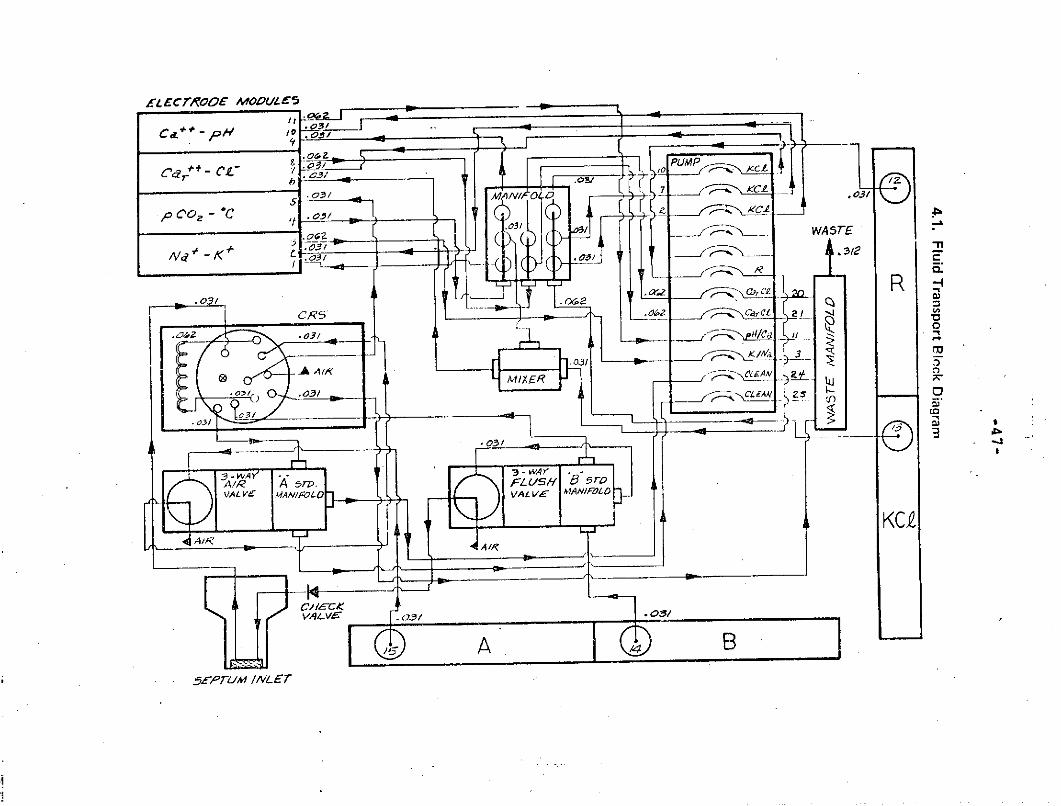
4.1 Introduction
The fluid transport section of the APEAS system
contains all the essential elements to standardize,
inject, store, deliver, measure, and dispose of
standards and samples. These elements are
standard solution bags, septum inlet port,
chromatographic switching valve, sample holding
loop, KC1 and acid reagent bags, electrodes,
pump, and waste bag, respectively (Figure 4.1).
A brief description of each of these, and related
elements follows.
4.2 Fluid Containers
Standardizing solutions, reagents and system waste
for multiple measurements are contained in flexible,
gas impermeable bags. These containers were developed
specifically for the APEAS system -to meet the following
requirements:
LECT/ROOE MOt/ULE5
C. o.,z , ,
1+______ WA .TE7 -
[ .oS/ , _. o 2 a
IIa51
r.o., I.C)",, ".0-3I
L -Y,
a UINKC03/
4 B4
59 /NL/a
A Ai//B
(9~t/ MIXERE

-48-
1. They must collapse under aspiration;
2. They must be gas impermeable;
3. They should possess a wide range of chemical
resistance to organic and inorganic solutions;
4. They should be replaceable with a minimum of
operator skills, with no spillage;
5. They must be amenable to flight hardened design
and ''O' g operation under a broad spectrum
of shock and vibration;
6. They must utilize available space within the
fluid transport package.
Various approaches were studied, and a flexible, heat sealed,
foil container was selected. The standards, KCl and reagent
containers are of flat, heat-scalid laminate construction with
puncturable septum fittings on each bag (see Figure 4.2).
The modified polyphenylene oxide fittings contain a neoprene
septum held in place with a chrome plated locking Luer fitting.
The bags are initially filled with fluid and folded by the
operator on an anodized aluminum frame. The containers are
firmly secured with plastic clips and are removed or inserted
into the appropriate card-guided compartment in the fluid
transport unit. The waste container is placed flat in its tray
at the top of the unit, filling under positive pressure from
all channels of the peristaltic pump.

-49-
4.2 Fluid Container
/9A:=- S EA L -'-DM/UL r/-L A Y~ER
Z.A/W/I/vI 7 5(RE'7AA/60Lz A?&
x rcz
A7-11OA G, 7
~~$ ~ - V/tG F7T7~/$NeJ
F77 T T/N
rL
L./EA L.O2/
I U ER - 1 c-
/E4PALE777-/AIG
5EA L'A

-50-
All sample and reagent bags contain an internal
vinyl tube which takes fluid from the bottom of
the bags, thus ensuring maximum utilization of
the approximately 250 ml within. The bag is
adaptable to tear drop construction for ''O''g
environments, thus allowing air or equilibrated
gas to reside away from the internal tube. The
tube is presently open, but could contain a wick
element to exclude gas in the bag.
When the bag is positioned on a frame, the septum
is easily accessible to the appropriate nu11rricall-coe
Luer locked needle. After being quarter turned into
the fitting, the bag contents are available for system
use. Each bag is labelled to prevent inadvertent
misplacement in the unit.
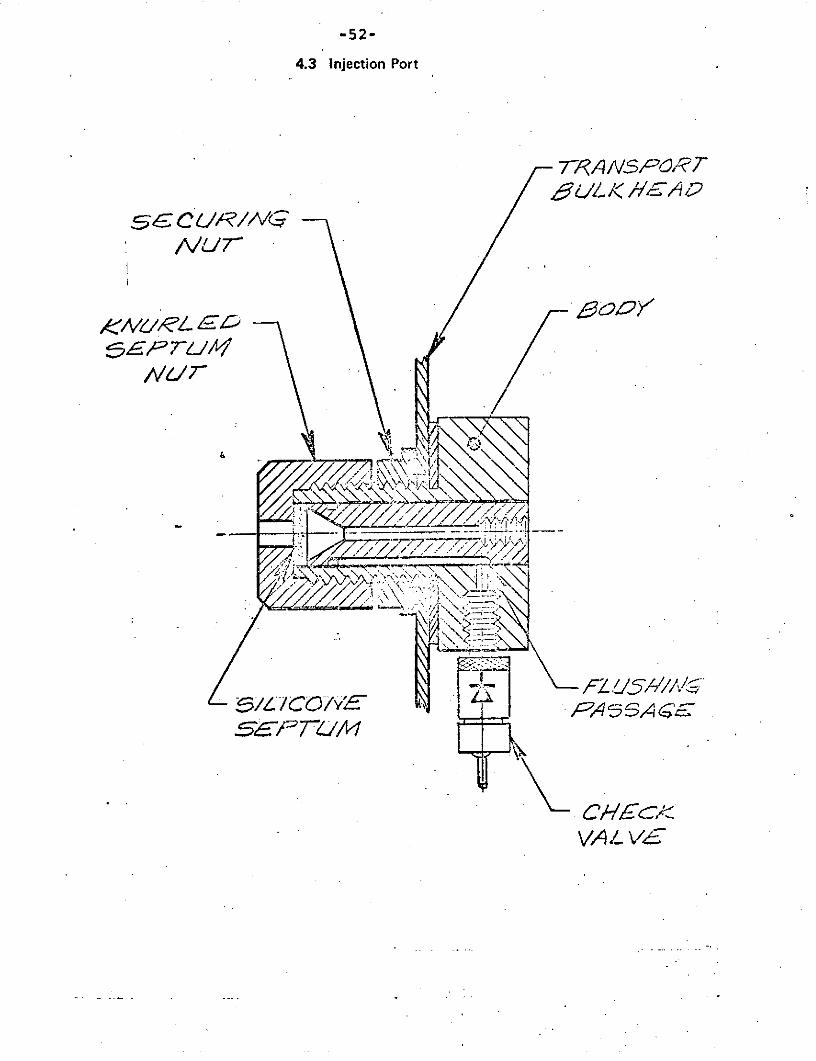
4.3 Injection Port:
Anaerobic sample introduction to the fluid transport
is accomplished via syringe and needle through a
septum injection port. The following were the criteria
for the port design:
1) Sample introduction must be anaerobic
2) The fluid transport must be capable of internally
cleaning all fluid passages after each sample and
standardizing sequence

-51-
3) Use of standard laboratory equipment to intro-
duce samples was required
4) Capable of at least 100 sample introductions
without leaking or fouling
5) Chemically unreactive to the sample and internal
solutions
6) Small internal dead volume
The sample injection port designed to meet these criteria
is a PVC screw threaded body mounted to the transport
case.(See Figure 4.3). It contains a stainless steel
insert with internal fluid passages exiting to a cone
in front, on which a rplaceable silicone septum rests.
The knurled stainless steel retaining nut can be unscrewed
to remove the septum, without opening the box. A syringe
with a 21 gauge 1-1/2 inch Huber point needle punctures
the septum through the access hole and is guided by
the conical surface of the insert to the main passage
to the CRS valve and holding coil. The needle fit in
this passage insures sufficient back pressure, thus
allowing the bulk of the sample to enter the holding
coil. Any residual left on the walls is washed out to
waste by an internal solution - air purge cycle, thus
making the inlet ready for another smnple. The 3/16'"
diameter septum puncture area is statistically correct
for 100 random punctures with minimum chance of coring
out the septum. The alternative of punctu*ing a small
-52-
4.3 Injection Port
TRANS POR;£ ,,'.. K ,/- _ A
SE CU/R/A'
NU7
5EPT.'P7/
&
.! \ '" ',,.>----' '-' - C H;
VALV
$/7
VA L /-VI

area repeatedly in tests showed a high probability
of introducing particulate elastomer into the fluid
passages, with subsequent blockage. The port contains
a one-way check valve to prevent back-up into the
purging system.
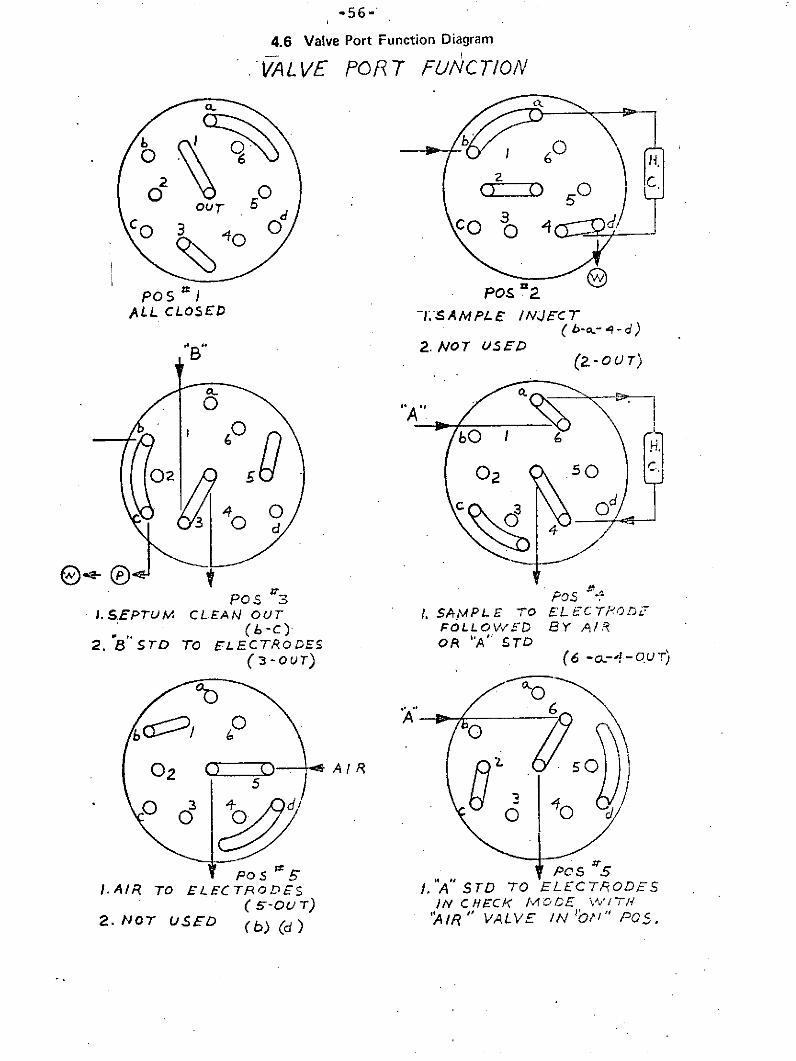
4.4 Valves
There are two types of valves in the fluid transport
package, a multiport chromatographic rotary switching
.(CRS) valve, (see Figure 4.4.), and solenoid operated
diaphragm valves, (see Figure 4.5). The function of
the CRS valve is to direct the proper fluids (i.e.,
standardizing or sample) to the measuring electrodes.
A diagram of the port function is shown in Figure 4.6.
As can be seen in the diagram,there are three functions
being utilized simultaneously in some positions. The
valve has six basic positions with four added function
ports. Figure 4.6. describes briefly the functions taking
place at each of the six basic positions. The valve
materials in contact with the fluid stream are teflon
(TFE) and stainless steel. The valve body and other
parts not in fluid contact are brass and carbon steel.
The valve is driven through its stations by a six
position '*geneval' indexing mechanism. The driver

-54-
4.4 Chromatographic Rotary Switching (CRS) Valve CO
V -
4

-55-
4.5 Solenoid Valve
10
ALt
-56-
4.6 Valve Port Function Diagram
VALVE PORT FUNCTIO/V
P0 O rosS5)5003 "0 CO 30 0
PO S / POE .
ALL CLOSED I.AMPt /NJEN -CT
**" 2. NOT USED
r 5'-O T
P O.S "J3 PO o '
.SEPTUM CLEAN OUT 1. SAMPLE "o ELECP.ot "
(s-c) FOLLOV/ED BY A/,R
2. B STD TO ELECTRODES OR "A" STD(3-ouT) (6 -o-4-OUT)
3 0
o 'o 0o a/
0?
POS I PO I., P
I.AIR TO ELECTRODES I. A STD TO ELECT/:OD'S(5-OUT) IN CHECK /'cDE WITH2. NOT SED (b ) "A/R" VALVE IN US ' P0

-57-
of the geneva has two stations so that only 180j
of driver motion is required for each driven station.
The geneva is driven via a 1:1 ratio gear train by
a 150 in-0z synchronous motor of 20 rpm.
Other functions on the valve assembly arc the binary switch
cam and motor logic cams. The binary switch cam is a
rotating disc attached to the valve drive shaft that
actuates four switches. These switches indicate, by
binary code, the valve station currently in use. The
coding scheme is addressed in the electronics section.
The motor logic cams are on the geneva drive wheel
khaft and they control the input displacement of the
geneva (i.e.,1800 ). One of the two is also a motor
interlock cam to prevent pump motion while the valve
is in motion.
The other valves in the fluid package arc three way,
24 VDC, diaphragm valves. These valves are of minimum
internal volume and are teflon constructed in the
fluid contact section. The ''flush'' valve serves to
direct air or ''B'' standard solution to the septum
inlet port for cleaning that device during the appropriate
period. The other, ''air'' valve serves to direct air
bubbles or "A'' standard to the holding coil during
the ''A'' standardizing cycle.

-58-
The timing sequence of all three valves can be seen
in the "'Fluid Timing Diagram'' of Figure 4.7.
4.5.Sample Holding Coil
The holding loop is a coil of approximately 1 ml
volume that stores the sample and allows it to come
to near temperature equilibrium with the package
before measurement. It is made of teflon tube and
is connected to ports ''A" and '4' of the CRS valve.
The holding coil is washed after extraction of
sample by following it with alternate bubbles of
air and ''A'' standard solution. This mixture remains
in the loop until new sample is inducted and pushes
the mixture to waste.
4.6.Pump
The fluid package pump is a specially designed peri-
staltic pump of twelve channels (Figure 4.8.). The
pump is constructed of aluminum and stainless steel.
The design features include planetary gear driven
rollers for precise roller speed relative to tube motion,
thereby increasing tube life, and flow precision, and minim-
izing pulsing in the flow tube. The rollers in contact
with the flow tubing are wear resistant teflon ''S''
coated to increase tube life. Each flow tube is individu-
ally adjustable for spring pressure so that optimum flow

varve /W454 / Z d./Q rUMVC770/N Qi//AR/-2 VAVrA tO~~ AiU -' As
A h
:5- - AIR v issc AT ta e..TAP8OCO, 5AMF'LG pCb r 5AMPLE
3/6 A 7%
" MPte AMPlur A'51T INPbqr
aAASAMPLE /80/ C
ej.4
/r -5 Y5 llr2/sremU__ _ 57-49( )-J
4i r
16 i~ol ?0/ 22 41-OY.-I, LZ- - 7CslC=C
4C.. Tin Diagra

-60-
4.8 System Pump

-61-
rates and tubing life can be obtained.
The flow tube cassettes are machined so as to minimize
the pulsing inherent in the peristaltic pump design.
Each cassette will accept up to 1/4'' OD tubing. The
cassettes are also teflon 'S"' coated to increase tube
life. The cassettes are arranged in two groups of six
by system function.
The pump is driven by a high torque instrument A.C.
syncronous speed motor. The motor speed was selected
to match the flow requirements of the electrodes. The
volume flow requirements are varied in each channel by
using different tube internal diameters.
The pump tubing is silicone rubber, a compound that is
highly chemical resistant and has long life under peri-
staltic pumping conditions.
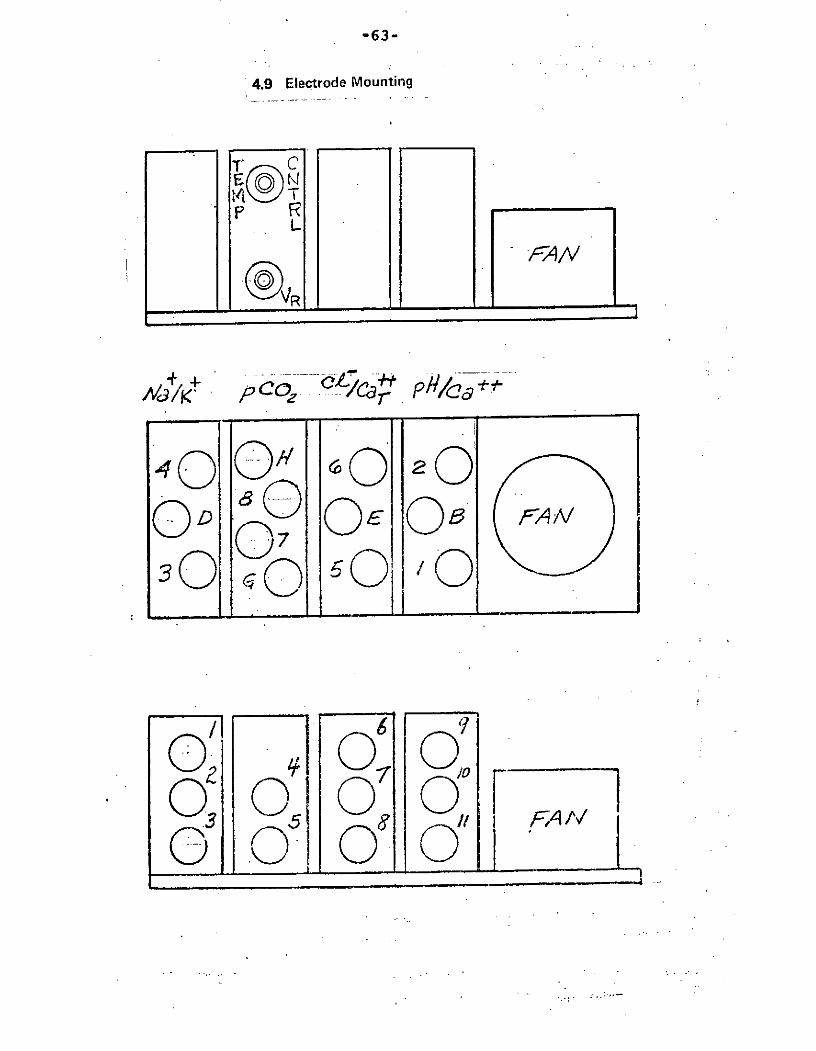
4.7 Thermal Control
The thermal system for the fluid package is designed for
the following criteria: (1) The system operates at 37.0 0C
in a laboratory enviroment, (2) The pCO 2 electrode be
controlled at 0.1oC, (3) The electrodes must be at
or near operating temperature within 30 inrutes of start
up.

-62-
The approach selected to meet the above criteria is
to use the pCO2 electrode as the system control point.
The electrodes are heated using a feedback control
system from a hot plate on which they are mounted
(Figure 4.9.). In addition, the excess heat generated
in heating the electrodes is circulated via a forced
air fan over the electrodes thereby equalizing the
temperature of the electrodes and moving the heat
throughout the fluid package. This approach would
allow meeting the 30 minute warm up for the electrodes
using minimum power, since the thermal mass is much
smaller.
However, using this approach the system fluids do not
stabilize in temperature for several hours. This trade
off is acceptable because the fluids entering the elec-
trode modules have sufficient time to equalize temperature
within the module prior to measurement.
The temperature control point and read-out networks are
located within the pCO2 electrode module. The proportioni
control unit thereby maintains the most temperature
critical module at the set point. Temperature tests
have been run to optimize the feedback control element
position for best response characteristics. By this
method, control was established within the required + 0.1c
during the 10 minute test period.
-63-
4.9 Electrode Mounting
T C
P§)R
L
,oo4O0" ' 2
0D/ O E O507
0', O% OO0 010 r 0 F
3e F5" tv 5
01c o 01

-64-
By circulating the heated air in the system, and by
additional component heat, the fluid temperature
will reach 37.0C after several hours running time.
Thermal insulation of ''Pyrel foam'' has been provided
throughout the fluid package to maintain thermal
isolation from the environment. Figure 4.10. shows
a top view of the assembled Fluid Transport Unit.

-65-
4.10 Fluid Transport Unit, without Cover, Top View
i It
PV
--4
best

-66-
CHAPTR V
ELECTRO'NICS UNIT
5.1. Preface:
All electronic circuitry, designed and fabricated
for the A.P.E.A.S., is located in a section of the
Fluid Transport Unit (F/T), and a separate Elec-
tronics Unit (E/U). The F/T houses eight amplifiers,
one for each parameter, an eight input analog multi-
plexer to select a specific amplifier output, and
temperature measurement and control functions. This
circuitry, which is best located in close proximity
to the sensing electrodes, is contained on a single
removable printed circuit board.A 0.09 cu. ft. com-
partment, separated from the fluid section, is
utilized for this portion of the electronics system.
Electronic logic and control functions, required for
this Fluid Transport Unit to dialogue with a general
purpose digital computer, are provided in the electronics
unit. It is in this unit that standard 5 volt logic
control signals from the computer are converted to the
appropriate driving voltages for the valves, pump,mixer
and multiplexer in the F/T. In addition to rroviding
-67-
all power required by both E/U and F/T, the E/U digitizes
the analog clcctrode data, provides pump and valve
safety interlocks, and feeds complete system status
inforx.mation back to the computer. Three push button
switches allow the operator total system control with
minimum cor'mplexity. An array of status indicators kcep
the user posted on the actual system.operation. Schind
a service door, the individual F/T component control
switches and indicators enable individual selection of
fully automatic or fully manual operation of each
device. A digital display of the multiplexed electrode
output is also provided. the E/U occupies 0.35 cu. ft.,
weighs 16 lbs., is powered by 120 VAC, 60 IHz at 120 watts,
and utilizes plug-in printed circuit boards and inte&-rated
circuits for ease in servicing. A summary of d-sign
objectives follows.
5.2. Design:
It is anticipated that the actual flight system will
incorporate a low- power dedicated hardware, controller
in conjunction with a data telemetry link or on-board
data processor. For this reason it was unrealistic to
design control electronics hardware which would be
directly applicable in a flight system. Instead, the
main design goal was to produce a laboratory evaluation
unit which would maximize operational flexibility

-68-
and serviceability. Extensive, although not difficult,
modification will be required for flight electronics.
These changes are summarized in Chapter 9,
One design objective was to minimize circuitry in the
F/T, providing only those elements required for suitable
electrical dialogue to a separate electronics unit. By
using a high impedance differential input amplifier for
each parameter, it was possible to incorporate an analog
multiplexer for rapid data acquisition with a single analog
to digital converter. Without such amplification, the
high impedances of some electrodes would cause settling
times approaching 10 seconds. Locating the multiplexer
in the F/T allows all measurement data to be transmitted
via one low impedance conductor pair. Temperature con-
trol of the electrode modules is provided in the F/T
for maximum control stability. A completely independent
temperature measuring circuit is connected to one of
these eight amplifiers, allowing the monitoring of this
control function. Backup over-temperature heater shut-
down is also provided in the event of control failure.
Appropriate location of F/T insulation causes the am-
plifier section to be effectively temperature stabilized
by the electrode system, improving amplifier perform-
ance. Minimal changes to this area would be necessary
for a flight design.

-69-
The E/U is designed to provide all the necessary power
drive circuits, decoding and encoding logic, and analog
to digital conversion, without predctermining actual
system operation. All system sequencing and timing is
determined by the computer software, referenced to a
one pulse per second hardware clock. The result is a
truly flexible control system where the operation of any
device or the entirn system may be altered by simple
changes to a software control table. The addition of
device and status indicators, and automatic/manual control
switches, permit the user to over-ride the computer con-
trol at any time for tests or evaluation. This approach
has proven to be considerably more flexible than a hard-
ware controller, and best suits a prototype system of this
type. Other design features include spare
control functiens for pessiblc future ;:odifications,
extensive use of plug-in components for scrvicibility,
and minimum size, consistant with laboratory instrument
construction. Test fix:tures and prograns as well as com-
pleto annotated schematics and layouts are provided to
facilitate system maintenance.
5.3. Description:
the relationship pf the electronics unit to the fluid
transport and computer is shown in Figure 5.1. As
previously indicated, the E/U serves as the control
and data transfer agent between the PDP-8/E and the FI/T.
Cables between the E/U and F/T carry the actual

ANALOG DATA "
(R) CONTROLS TO ALL DEVICES
D.C. PoWER DATA SYSTEM STATUS ) /O V4 -C
(MULTIPLEXERI CTRL ASC.Zr CODE0OTOR VA LVE FIW1E6 /20 VAC
VA-LVE POS._
HEATER $TATJ$
I 72 7/ R, S N M VA
/20 VAC 0000000SORFooooooo~ooooooo SRC0000000
(All8/ 0000000
(/T ElU PDP- 8E .CONTROLLE ... TELETYPE
SAMPLE/NL FT
I J uuu
UUUUUU5.1. A.P.E.A.S. Unit Connections
5.1. A.P.E.A.S. Unit Connections

-71-
motor and solenoid power, multiplexer control, and
return analog signal data from the sensing electrodes.
Digital signal cables between the E/U and controller trans-
mit encoded parallel 12 bit information, including
all data and control. A cable from the controller to the
teletype carries ASCII code to the teleprinter, and
back from the keyboard.
An overall block diagram of the system is given in
Figure 5.2. Although simplified, this traces the
basic control and data transfer paths between major
functional areas. Letters are used in the upper right
hand corner of E/U functions to identify actual board
location in the E/U. The following more detailed
description of electronics operation is keyed to partial
block diagrams. These diagrams provide reference to
annotated.schematics which show the actual circuitry.
5.3.1 Electrodes, Amplifiers, and Multiplexer (Figure 5.3.)
The sensing electrodes used in the F/T require special-
ized amplifiers and grounding systems for proper opera-
tion. Potentiometric measurements of the electrode
outputs must be made to several tenths of a millivolt
accuracy, in spite of the fact that some electrode
impedances approach 300 to 500 megohms. In addition
to impedance and offsrt current considerations, it is
understandable that --ery small potentials introduced
by the fluid stream or ground wiring could cause signi-

A LETTERS REFER TO lOPERATIG SYSTEM II ACTUAL P.C. BOARD(3) I FT/ (//C.- - I c Tr: .,4 a, r
ANALOG OUTPUT WHERE FUNCTION /5 1CTLg.&ATA PVI 7
HEATE R FTTU
HEA1TFER FLUSH AIR Cpp F D, 08-4A ITERFACICOITOL VALVE VALVE A DCD-/ATEC
CLOCK IGITAL
M/XE STATUS I#P, ocESOR W/BCD s KNMR
//IEA T DA TA
SD/SLA
" YTE CTRLG,2 c T E YPF
PUMP -' 4YTE DATA It/TER FAcsNPUMP M1ixER H.
C-RCUIT
OG DGTA L ASC I
-El-K EXPANDER COL E
S P VALV-":Af A/N tC--EVALVE VALVE DR/VE CONTROL
)K VALVEC/RC U/75 TEL E-PR PNTfF i*
T L ALL CXr T5
TEMP F/T' '.ER E/ U SEMVCE PANEL-A 000000SUPPLY PoWER L= INDhCATORSSWj 00000OKEYBOAPD
SEVS/NG 7EL.E TYPEELEC TFRODES
AMPLIF/ERS5.2. Overall System Block Diagram

r 1'SAR'LeZD AMPLIFIER NO. I-1
/NLE T
C A ' 7/3N"G7
FLoUI D61-v zL.IAALI
4UI
I-, oNCA - --- (/ L
NO/AMPLIFIER NO.2 -5 II
GR&77'6'T
--- . .CODE
.. PREr AM/t
To w4STE
///a6r TYPICAL TWO 6EC TPODC-
A t
i 0 ,AA/ALOG
- Our-1T
AA/AZ.06 GAID.
5.3. Electrodes, Amplifiers, and Multiplexer

-74-
ficant errors. The problem is solved in two ways.
First, very high impedance differential input
amplifiers allow measurement between a sensing elec-
trode and reference without regard to common mode
voltage. Clamp diode pairs are used aS shown to
limit the common mode voltage. This diode technique
provides a voltage ''window'"', but by allowing
small offset potentials, does not induce currents
in this fluid system. Coaxial cable shields, driven
by guard potentials, improve response and virtually
eliminate stray pickup. The amplifier design in-
corporates low pass filtering to reject any AC voltages.
Secondly, all analog signal and power grounds are
referenced to a single point in the F/T, eliminating
errors due to ground currents. The temperature
stabilized environment of the F/T further improves
amplifier performance. A nominal gain of two is
provided to permit 50 microvolt per bit resolution
at the input. This additional sensitivity is de-
sireable for calcium measurement with typical 30
millivolt/decade slopes.
Amplifier outputs are selected by a F.E.T. type analog
multiplexer, buffered by a single unity gain amplifier,
and fed to the E/U ADC. A separate cable which shields
both the signal and signal return lines is us:d for

-75-
maximum noise immunity. Multiplexer channel control
comes from the computer control software, or the E/U
manual override if utilized.
5.3.2. Temperature Control System (Fig.5.4.)
Temperature control and measurement circuitry account
for the balance of F/T electronics. Temperature sensors
are located in the pCO 2 module because that parameter
is the most sensitive to thermal variations. For heater
control, the output of the control thermistor bridge is
amplified and then fed to a proportional control ampli-
fier. The function of this second amplifier requires
some explanation. For the fastest warmup time, an on/
off type controller is preferable. However, at the
control point, a proportional controller provides
greater stability. A second problem is that proportional
control usually means high thermal dissipation (transistor)
or R.F.I. (SCR) from the control device, when not fully
on or off. By using a constant amplitude sawtooth signal,
and a second amplifier functioning as a comparator, it
is possible to achieve proportional control with on/off
duty cycle variation. As illustrated by the waveform
in Figure 5.4., a change in control voltage causes a
proportional change in on/off duty cycle. The propor-
tional control band is kept narrow by limiting the saw-
tooth amplitude. Ouput from the second amplifier is
syncronized to AC heater power by 120 pps and a D-type

YAR/AAe_ vurv CrCe-C Y/e-eDS LPROPORT/ONAL CONTROL- SAWTOOTH MITT PHOTO
- HEATER OFF- osc. 120 PPS D/ODE TRANSISTOR
T VOLTAGE CONTOLAWVTooTH VOLTAGE t DGHEATERON PERIOD
c
7EMP ((ONTROL OF7/CAL ISOLATO8
COTROL- VOL7AGE) +(PROV!DES 150LATIONCONTROL •1- M / C
TiERAi'ISTOR ROPORTIONAL D-TYPE F// A
F--- ERROR CONTROL FL/P FLOP
I AMPL/F/ER AMPLIFIER ZERO VOLTAGETROD .5W/TCH 115 VAC
IFLOTRDDASS'Y 7 TEP - HEATER (lOCATED /-
I <
" MPL-FER
Iir O. 8 (°>C) ISOLATORS OVE CU
i 50UPCE
PCO2 ELECTRODE--5 HEATER OVER
MODUL ON TEMP OR2 O TEM CONTROLM--D- -"E"-K& T RAC
SE ScHEMAT/CS : 8004/13 AMP BD. 700 33-F/T SIGNALS• ' TO ElU"
ToII',AC COMMON
5.4. Temperature Control System

-77-
flip-flop, so that all on/off switching occurs at zero
volts, This technique is used to eliminate RFI from
the control TRIAC. Optical isolators are used as
shown to avoid any electrical connection between
control logic and 115 VAC. A thermal switch in series
with the heater provides over-temperature protection.
If activated, the ''THERM-FAIL'' indicator will light
on the E/U (note Fig. 5.13.). The adjacent ''NORM''
indicator is illuminated whenever power is actually
applied to the heater.
A separate circuit, consisting of a precision voltage
and a second thermistor bridge, is used for temperature
measurement. The oitput of this circuit is fed to the
eighth amplifier, and is calibrated to read degrees
centigrade directly, to 0.01 degree. The ''LO-TEMP-HI''
indicators on the E/U are controlled from this measure-
ment via the computer software.
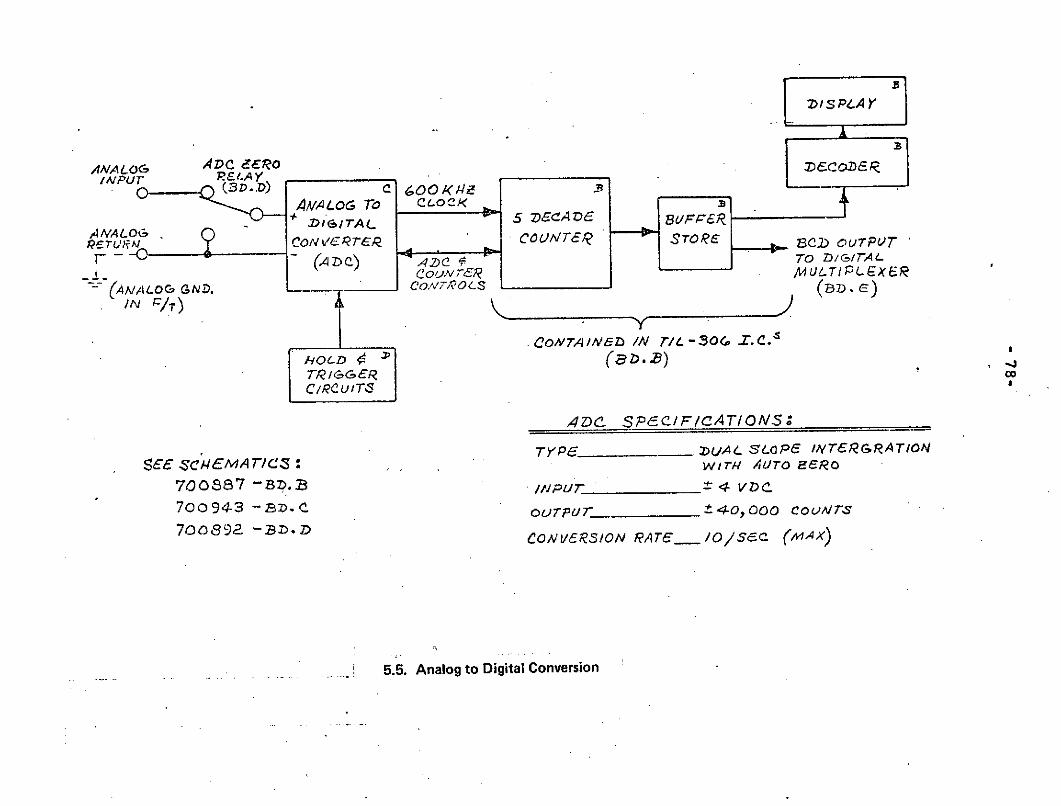
5.3.3 Analog to Digital Conversion (Fig. 5.5.)
Analog output from the F/T is connected to a single
analog to digital converter (ADC) in the E/U. This
+dual slope integrating ADC digitizes its - 4v. input
to a precision of 0.1 millivolt, displays the result
on the B/U, and provides BCD data for the computer.
It is important to remember that the input amplifiers
DISPLAY
ANALOG ADC O DCOODEINPUT R Et.A Y
(3(. D) c 60094 .X
AA4LOG To CL.OCKDIGTAL5 DECADE 8uFF'ER+ D 1'-,ITA I-
- (ADC) 4 0 A TO DIGITAL
I TU k M CON VC.T& COUI/T7,1 STORE B2 )D O TPQT
co._, ?o R /WU-71PL)X ER
(ANA LOG GND. ____CO£NOS (BD C)
IN CY
.CCONTAIVEb /V 7/4.-304 I.C.
8
TRI GEt c
CIRCUIT3 S
A4DC SPe1C/F/CAT/ONS.
TYP6_A__ ALLiOPE /INTERGRATIONS(E .c',4MATIC3 : WirH AUTo HERo
700887 -BpD.B INPur 4± Vc.
70094-3 -BzD.C. ouTPUTr ±40,000 couvNTS
700892 -:D. ;CONLVV6RION RATE__ IO/SeC (A4AX)
5.5. Analog to Digital Conversion

-79-
have gain of 2. This means that, at the electrodes,
the maximum input is 4. 2v. with a measurement precision
of 0.05 mv. Except for temperature, the ADC display
and BCD data must be divided by two for actual elec-
trode potential.
An input ''ZERO'' relay is provided for testing the
ADC and display functions. It may be operated manually
at the E/U or by the computer program. For additional
ADC testing, a precision voltage source may easily be
attached at connector ''N'' on the E/U.
5.3.4. System Timing Circuitry (Fig. 5.6.)
In order to prevent R.F.I. from AC power switching and
possible ADC instability due to hum pickup, synchroni-
zation to AC power is necessary. This is accomplijhed
using a low voltage AC signal from the transformer
secondary. The ADC uses this AC directly to synchronize
the start of each conversion, with a constant phase
relationship to line power. For power control, a zero
crossing detector produces 120 pps from the same signal.
The pulses occur at zero line voltage, as indicated,a
and are used as an update command for D-Flip-Flops
controlling AC power loads.
The 120 pps is divided to one pulse per second for the

'PPS ' ' '
t Iq
oH, AC CoAlTea6 SWVNCCAUSES ALL TiAC$w/i'//JLN' T0 occaeAT 5ee VLTACCS.
AC PoM ZEo SYSTE/M CLockATSANS oWMSIE COSS /A/ /PpS 7o Cofv74uTEe
DETETRPacCe4A-DIVIDER , I/, /NTER UT
(61'. ,F) MA a L IADC C Zoc/< -SYNC 5/I C L
SEE SCEM4ATr/C 700o897-d.
5.6. System Timing Circuitry

main system clock. Software registers, in the computer
program, accumulate the 1 pps signal for system time-
keeping. All software control timing originates from
this clock, which may be stopped and manually incremented
at the E/U for test purposes.
5.3.5. Main Valve Control (Fig.. 5.7.)
The main valve control incorporates all circuitry required
to run the valve to any position, forward or reverse,
with manual or computer control. A position encoder,
located on the valve, provides binary position indica-
tion when the valve is locked in a position. During
the valve transit between positions, this code is not
valid and must be stored. The output of the position
memory is displayed and made available to the computer.
Two modes of computer control are possible. First, the
program may issue a direction and a run command, caus-
ing the valve to run one position and stop. Alternately,
the control program may specify a desired position and
direction. The latter case, rost often used, will
cause the valve to servo to the desired setting. If
an illegal servo code is used (such as position 7) the
valve will be automatically shut down after two and
one half complete rotations. This servo mode is not

DIREC TIONr-" 8 FROM 9/E
-- ,RUN CONTROLPos TION (FRO /1)DISPLAY (FRO /E)
SE~oMANUAL DI RECTIONSERVOPOS TION CONTROL CONTROL
.(F oM 81E)DECODER
1
-G VALVE POS, TODIGITAL M4/L7/PLE~XR
VALVE (TO PDP-/) , ,
.POSIIoN G GM =MORY POriTI/ VALVE RUN/D M SER VOCOMPARATOR CONTROL
(o G TO PUMP (SE FIGURE FWD/AF.V
PUMP CONTROL- ,8) AC MOTORUPDATE /WHIBIT -INH ./TS PUMP CONTRPOL
LOGIC FOR IMPioPER
NOT VALVE POS.
READY)
VALVE IN PoS, ----i-- ------( READY) I agI FWD ACII I A N --- I I
I POS TIoN MAIN I VALVEI EA/CODER VALVE MOTOR I
VALVE POS. (BINARY) I _ I I REV AC(VALID ONLY VVWHEN VALVE I I I
IS I POSIT/ON) L _J L J- - -. J
5.7. Main Valve Control

-83-
available for manual operation. Refer to Chapter 8 for
operating guidelines.
When the valve is in position No.1 or in transit, fluid
lines are not connected for operation and the pump must
not be run. Pump inhibit logic in the valve control
detects this condition, preventing pump operation.
Backup protection is provided with valve microswitches
in series with pump motor power. A warning indicator
near the pump motor in the F/T will be on if this
backup system is employed. The E/U provides full
indication of normal valve and pump status.
5.3.6. Power Control Circuits (Fig. 5.8.)
Circuits used for controlling high current loads are
designed to avoid transient or RFI generation. This
is done by switching AC loads at zero voltage utilizing
the 120 pps sync. Optical isolation between AC and !
logic circuits further reduce noise problems. For DC
controls, the load is switched with a R-C time delay
to slow voltage changes.
All controls feature automatic operation (control from
computer software) or manual control (from the E/U).
The selected operating mode completely overrides the

COVNTROLS vv. (7/2
ONI -0--- OFF
VA COPTICAL ISOLATOR VACAUTO120 PPS (PRovIDES ISoLATION
ZEF o CROSS)N6 FROM /S VAC)SYNC i(UP
0 + (pum pTYPICAL AC CIRCUIT: AC ",1IXER
P IAS AC CoMMoN
LOA24 VD
LL-- FLIP-FLOP I
COMPUTER CONTROL
(FROM 8/E V/A . DC I BDOLDDH) DLOAD VALWv(..)
TYPICAL DC C/RCUIT:
COTROL CONTROL
ON PTR /A C
-- OFF OUT -10VOR p 8/1A S AC coM Mol
Q AU To I4D-7YPE I 24 VDC.
FLIP-FLOP
COMPUTER CONTROL
(FROM 8/F VIA C (SOLENODBD H) LOAD AVES)
TYPCAL5.8. Power Control CircuitsCRCUIT:
CONTROL TRANSIENT5OON SU PPRE SS ION
-- 0-- OFF ew
OF OR 5'
COMPUTER CONTROL(FROM 81E VIA
BD H)
5.8. Power Control Circuits

-85-
non-selective mode. Because control functions are in-
dependent, some may be in autonatic mode while others
are-in manual. An E/U front panel indicator (''MANUAL
MODE'') cautions the user when any control is set for
manual operation. A similar caution is typed, if
required, at the start of an "'ANALYSIS'' or ''CHECK''
sequence.
5.3.7. Digital Multiplexer and Expander (Fig. 5.9.)
The PDP-8/E computer and DR8-E/A interface provide
12 bit parallel data transfer to and from the E/U.
In order to accomodate the numerous system data and
control lines, it is necessary to provide a secondary
expansion interface in the E/U. Simply, a 64 data
bit capability from the E/U is multiplexed into 8
bytes of 8 bits each, and 32 control bits are de-
multiplexed (expanded) in the form of 8 bytes of 4
bits each. Input and output bytes are selected by a
common 3 bit byte code from the computer. A data
strobe allows setting the expander byte prior to
updating the stored outputs. Direct inputs and outputs
are used for higch priority functions such as the
pystem clock, user control, error flags, and ADC
controls.

--
I PDP - 8/ ElL O TDIRECT INPUT
I DIGITAL COMPUTEA (4 BITS)
I
E
I DR 9-EA IEAZNrTERFACE
L 6 LINE TO MULT7IPLEY)ED
DATA TO 8/E 8 LINE //PUT
02 BITS) (5) 8 BITS MULTIPLEXER ('4 8BTS)
/MP X 'D
BYTECONTROL
(3 8/7S) . SCHEMATIC 7o0082-BO E
DATA STROBE
ICONTROL FAOM 91F (I BIT) + LINE To EXPANDED
(/ BTS f 3Z LINE EXPANDER OUTPUTt BrT) ( •) .CONTROL DATA MEMORY (32 ITS).(4 /3/ TS)
ALL FUNCTIONS ARESTANDARD DTL/TTL SCHEMATIC 700oo4- BD HO/+5V LOGIC LEVELS
DIRECT OUTPUTS(4 BITS)
5.9. Digital Multiplexer and Expander

-87-
5.3.8. Power Supplies and Grounding (Fig. 5.10)
All power supplies are located in a shielded com-
partment of the Electronics Unit. Except for 115
VAC and -10 VDC TRIAC bias, all voltages are
isolated from the AC power line. Special grounding
practices are used, as indicated, to ensure proper
system performance. The 15 volt and 5 volt supplies
are protected from short circuits because of the
large amount of circuitry they service.
5.3.9. Electronics Unit Layout (Fig. 5.11)
This top view of the Electronics Unit shows the plug-
in printed circuit board layout. The unit offers
adequate size for serviceability without being a
cumbersome part of the system. It is anticipated
that a flight electronics system would be no larger
than this, including the hardware system controller.
5.3.10. Electronics System Photographs (Figs. 5.12 to 5.18)
These photographs show the actual system components.
5.4. Summary
The A.P.E.A.S. electronics has been designed to provide
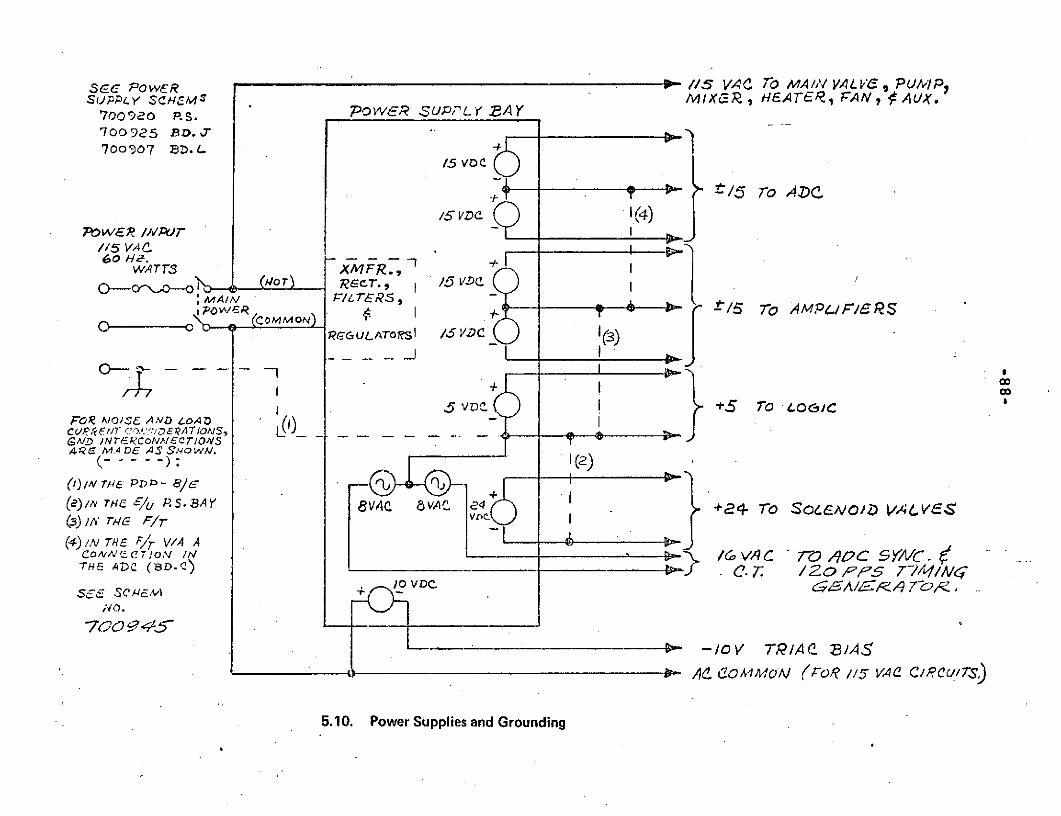
Sec PoweR //5 VAC To MA/N VALV , PUM/PSJC-PLy' $MCIMX / RI HEATE. PAN AUX.7009ao P.s POW .SUPPLY BAY'700925 BD.J __"_"_ _,___
700907 D.L15 vo C
. /t15 ro A.DC
/5 VD C4)PowER /p/A/ IImr_
//5 VA I60 He. +[WATTS XAFR., I V
('lor) ReT., 5 V. I:M A,v 7-0 -
:AOWAEI FI.E 3 / 5 To AMPL.IFM/ RSO 0 ' (CowMMoN) !"
R7PE6ULATo10s1 /,5 VC (3 )
-+ -o
I 5 vDrc I *S o r .o GcFOR AiOSE ANVD LoADZCUF'/EYT (?O.*'EATIONS, I . _GAID nrITEI.CONNEcT/01SARC- MA 0 AS S,,ow.
(1) IN 7/1k PD P - BICJ7
(a)1N 71W 1 'lu P.S.BAY 8Vo4e 8VAC e4 +24- To SOLEVO/D VAL.V"4S(3) A r14 F17- J/(4) ,v 7E Frr V/ A A I
coNAnCoN IN __ _. /6IVAC ' (A2CSY/C.4THE ADC (D.C) 9D. C.7T /20 1;4S 77A1//MV
,€O.
700 45-• t > -lov TR/AC 9/A5
A (- A OA1MoV, (roR //5 VAe C eRU1T)
5.10. Power Supplies and Grounding

cc 89-
P e SUPPLY e/z47ze9'Li
EG U LATOR av (Z) Z
22 P. ..... (..) .'J
/ :- EXPAA/DLE, Bod d (H') .4.3
r/ .... c O,,oL 6oA AD (G) .3
43-I1: r/ . D/6 /7"4L A./1./,/ Z X SCAR D E) 4J
L
S_S 4,//6TC1 ,44D ) 4.
1c n
..D/SPY zSo,4D (,)
F-e4'M A4MC (4)
5.11. Electronics unit layout

90-
all necessary data and control transfer functions
between the fluid handling section and a
controller, with minimum operational restric-
tions. This allows maximum flexibility of system
test and evaluation by simple changes to a soft-
ware control table. Wherever possible, circuitry
has been designed to be easily tested or replaced.
Chapter 8 provides additional information regarding
the setup, operation, and maintenance of this system.

-91-
5.12 Electronics Unit ko 0
st ' r
I *Cfw-

-92-
5.13 Electronics Unit Front Panel
8

-93-
5.14 Electronics Unit Rear Panel
C
~

.94-
5.15 Electronics Unit Top View %1000vi0
_ t1I
A A. r "- '% 4 .". 4
4 ,71 ME

.95-
5.16 Electronics Unit Bottom View
7
~- -,rr\l ~~~i'~~
a~k'.\
AIML

-96-
5.17 Electronics Unit Printed Circuit Boards
"W211<r
. • •
jtj, i j _1
-'3 Ji' tJ
S"09
-~ bl Ic~lp~ TPT~Tsl~T~e

-97-
5.18 Fluid Transport Unit Printed Circuit Boards
-. ~,-) - -f-
4--
( i-- (-si ~i -rr4>

-98-
CHrAPTFR VT
* CONTROLLER AND SOPTV'AfRr
6 .1.Definitions:
The operating system (O/S) is the hardware and program's
(software) necessary to make, support or augment an
auto-analysis. Occasionally, O/S represents the
executive controller program in situations made clear
by the context.
The O/S software is the group of programs and their
documentation that controls the operation of the system.
6 .2. Introduction:
The design aims for the (O/S) software for a system
which could explore the range of operating conditions
useful for an automatic analysis sytem rather than a
specific flightworthy system. Therefore, the system
would be made as flexible as the resources would
reasonably allow. In fact, the need for any ''soft-
ware'', and ''operating system'', was dictated by the
specifications of an .adaptable, general-purpose
controller instead of a more limited dedicated
hardware controller. The configuration operation and

-99-
6.1 Operating System Software
R T ; F g2;
S•"if

-100-
timing of the elements of the hardware (F/T and E/U)
is determined by the contents of the control processor
memory, rather than by the logical and
analog functional circuits of a hardwired controller.
6 .3. Considerations for implementation of controlfunctions
+The capabilities of the smallest control processor are nuch
greater than the capabilities of any hardwired controller
built using similar resources. The basic function of
the software is to direct the hardware to perform an
auto-analysis. The software comprises several programs,
which when cast in the proper form, placed in the
processor's memory, and the processor started, are
&'translated'' into directions to and interrogation
of the E/U. The E/U in turn communicates in both
directions with the F/T.
This general approach allows for considerable modifi-
cation of the parameters (in time) for the components
(pump, valves, etc.) of the F/T and E/U by simply
modifying a small segment of data stored in memory.
Even greater modification could be achieved by loading
the memory with a different O/S. The accomplishment
of any approach to analysis is limited only by the

various meaningful combinations of valve conditions,
pump-on, pump-off, controllable modes of the ADC,
etc. In addition, a GP processor allows many raw
data manipulations which can be easily modified and
changed to a far greater extent than the most complex
hardwired controller. The same is true of the media
through which the results are reported, and the format
within this media.
6 .4. Choice of a general purpose digital control processor:
Although the last year has seen the introduction of
several devices that meld the characteristics of the
hardwired device controller and a simplified general
purpose digital processor, these are, as of yet, infant
devices. The performance of the PDP-8, in terms of
available services, demonstrable reliability, wide-
spread acceptance, manufacturer's software support,
and prior applications make it a good choice for the
processor. The PDP-8E used is a small general purpose
digital processor with a twelve-bit word and two
4096 word fields (banks) of memory. It communicates
with the E/U through the DR-8E, an adaptable interface.
which takes care of the dialog between the processor
proper and the E/U, allowing the processor to send twelve
bits of information to the E/U (most of whic the E/U

-102-
'"'remembers''), and to receive as many returning
from the E/U.
The processor manufacturer provides an array of
software support items. Considered for inclusion in
the data manipulation section of the O/S, were their
math routines, ''floating point'' arithmetic package,
and FOCAL program. Although the FOCAL program occupies
the most memory, it offers more alternatives as to
method, format and ease of modification, than the
others or a program developed in-house. It requires
less development time and is probably easier to understand.
Other programs, such as the D.E.C. machine code
assemblers and text editor were used within the O/S
software development loop. The popularity of this
processor family makes it more likely that the user
is familiar with the manufacturer's software.
6 .5. O/S Software Structure:
The core of the O/S is the Executive Controller. It
has provisions for formatting information sent to
the E/U, interpreting information from the E/U and
acting on that and keyboard information. The sequence
of an auto-analysis is determined by the contents of
the Control Table. The contents of the contro' table

-103*
can be changed, if an analysis is not in progress, by
using the MODIFY program. Thus a balance is struck
between an O/S that has wide latitude of configuration
but is difficult to comprehend, and one that is easily
understood, but unchangeable. The MODIFY routine only
accesses the contents of the control table, and then
only in a simple manner. The MODIFY program provides
protection because it is impossible to inadvertently
modify and possibly destroy the O/S.
Octal Debugging Technique (ODT), a ''trouble-shooting''
program, is included to satisfy any contingency
requiring the examination, change or piece-by-piece
operation of machine code. Certain basic changes which
would be impossible by modification of the control
table alone could be effected simply in the O/S by
someone familiar with ODT and the O/S. Both MODIFY
and ODT are merely utility programs, for convenience,
peripheral to both the operations and the purpose of
the controller. Analysis is made without their use.
In the O/S, FOCAL is the controller's sub-program,
directed by the controller's interpretation of the control
table to perform its tasks of manipulating data and
printing a report.

-104-
6 .6. Hierarchy:
The amount of memory occupied by the major program
segments does not show their level of control.
The program hierarchy from superior to subordinate
is shown in PFigure 6.2. Assume that the Executivr
Controller is running. Part A shows that, besides
controlling the hardware, the controller consults
the control table and allows FOCAL to run during auto-
analysis. During idle, the controller can relinquish
its supervision to either of the utility programs,
MODIFY or ODT. FOCAL refers to its stored ''text''
when it is allowed to run, returning control to the
Controller when it has finished the requested task.
Figure 6.2B shows MODIFY, the control table editor,
running, as a result of a user request from the key-
board. The user can now edit the control table via
the keyboard. When finished, he asks for the controller
to take up supervision again. Part ''C'" shows a
similar condition for ODT.
6 .7. Normal Operation of the System
6.7.1. Executive Controller:
When the user starts the system, the controller
initiates the whole system (Fiq. 6.3.1.)then enters

-105-6.2 Program Hierarchy
SH/E2A2,C//Y 40ogCOI 7-eOLL, R
EXECU7l~eColvrROL
I~4A'AL VS/S -
OD7' __
AOC/1ITEXKT
/,)YER,,42C1' ®r- HI6E A RC H Y C'eoDr
____V AieAOR Y' L9C A 710"l

-106-
6.3 Normal Operation of the System
- - -- - - - - 6ECUgrT/V Co/VFROL/-E2
O NITAv LE
sscaDA r:
AlaN/roC OE fNs Ys rEM e~
® I fA,"CONTROLAC. CEK
INIT/ALIZE~ FAUTO -4/AL ?SI5
" II
74kE DAA OATA 'RAW MVAS 26E'U//ED -1
/CN/Fr Ie T°A-'C D,4 A
0
syse.^ clck* ecok* oopeA A'o6 04c4L -
! -I P° SC-N
tO/ ro4
ALeLT
SYSTTSTP,~CS rES4UT/z /r Y ,u:4c7lvlES
S EcPoer O41V,41 Y515
o-D-FY0- OD T - 1 I D4 4."
EVAAI/JES,.ALTE', CAO L CNERAL S OSTEw: /ECe c/ -V
SSAVES Co A Pt e/s

-107-
the idle condition (2). The controller, while idle,
continues to monitor the system. When the user requests
an analysis (or check) the controller puts the system
in condition for an analysis (3), and normally proceeds
to monitor the 1 p'p.s. system clock signal coming from
the E/U (4). If the clock pulse has not occured yet,
or control just returned from the clock loop, the
controller checks the status of the system, taking
any appropriate action (5), then loops back (4) to
check the clock again. This happens continually until
the controller is told to stop [return to idle (2)], or
finds the clock ready with a pulse. The accumulated
time increases and the controller searches (4a) the
control table (4al) for every ''time/event'' pair
whose time value is the same as the time accumulated
by the clock loop. All the events for that second round
in the table arc turned into control information for
the hardware (4b) and is sent to the E/U. Refer to
the O/S listing and drawings 7862(E board multiplexer)
and 7864 (H board, expander) for bit assignments. If
a data transfer is required (4c), the raw millivolt
data is read from the E/U, and given to the FOCAL
program (4C1) via a special function, then the controller
instructs FOCAL to perform the necessary data trans-
formations (4c2) and, if appropriate, print the results
(4C3). When it has a task, the data processor works

-108-
independently of the controller while no other task
requires attention.
When the last control table entry is found or if the
user asks (via the E/U front panel, or the keyboard)
to stop the analysis (5), the system returns to the
idle condition.
6 .7.2. FOCAL:
An adaptation of FOCAL* processes the data derived from
the electrodes and temperature sensor, accepts informa-
tion from the user about the standards used, and prints
a report of the analysis in terms understandable to the
clinician. The version used will run on all models of
the processor, simplifying a possible change of
processors.
The standard FOCAL (FOrmula CALculator) is a simple,
small-scale, problem-oriented, algebraic programming
language interpreter program (the name also applies to
the language itself) similar to the FORTRAN, BASIC,
or ALGOL languages, but operating in an on-line inter-
active dialoguing mode. It is easily learned and used
by those familiar with any of these languages. It has
*trademark D.E.C.

-109-
just twelve basic commands, which allow editing, come
putations in a calculator mode, conservation of gen-
eration of programs (all in the ''direct'' or ''edit''
mode), and execution of programs previously defined
(''indirect'' or ''run'' mode). Programs are defined
in terms of line numbers, constants, variables, the
twelve commands and fourteen predefined functions. These
functions (which are brought into operation like sub-
routines) provide circular (trigonometric), logarithmic
and exponential, square root, absolute value, sign
value, integer value, random number, and other
specialized operation.
Of the many modifications, the most apparent to the
user is that the O/S calls FOCAL as one of its sub-
routines. FOCAL never enters the direct mode but
stays in the indirect mode, executing a previously
defined program stored in the ''text area'' of memory.
Thus, in normal system operation, FOCAL is not
available to the user, never entering the interactive
mode. Other modifications changed details of core
location, input and output format, and execution. The
circular, random number, and specialized functions
were eliminated. O/S functions were substituted, aind
the initialization interrupt, and error recovery
routines were altered to be compatible with the O/S.

Among the many publications D.E.C. has published which
describe FOCAL's operation, the most useful for an
understanding of this application are:
Programming Languages 1972. PDP-8 Handbook Series,volume 2.
FOCAL-8 Programming Manual. DEC 08-AJAD-D.
Advanced FOCAL, Technical Specifications.DEC-08-AJBB-DL.
and especially, part II, "'User defined functions for
FOCAL-8'' in:-
Change Notice to Programming Languages 1972.DEC-08-LFCNA-C-DN1
which has the clearest explanation of user-functions,
and:
Listing of FOCAL, 1969, etc. DEC-08-AJAE-LA
Specific details can be examined by referring to the
documents listed above and the program listing of the
modifications.
6 .7.3. MODIFY:
The MODIFY program is the operating system (O/S) table
editor. It is used for adding to, deleting from, review-
ing, and punching binary-loader-format tapes of the

control table, using decimal time values and symbolic,
numeric, or combined octal values for control-codes
(c-c's). It is designed similarly to the editing
features of ODT (trademark D.E.C.). Refer to the
simplified flowchart, Fiaure 6.4
A review of the format of the control table will help
show the need for and use of MODIFY. The O/S controls
auto-analysis by consulting a table containing c-c's
associated with time. The table is actually a time-
table, a schedule of events. Each entry has a time
(indicated as a number of seconds after the beginning
of the analysis) at which its associated c-c will be
decoded in order to initiate, direct, or affect an
operation of some component of the system.
The entry is stored in memory as a twelve bit binary
value of time in an even numbered memory location,
followed by a twelve bit binary c-c in the next higher
(odd) numbered location. Manipulation of the contents
of the table are facilitated if the time can be
expressed in decimal notation (i.e., 129 = the 129th
second instead of 02018 or 0000100000012) and the
c-c as a letter of the alphabet, as a mnemonic,
followed by two octal digits (i.e., J34 = 12248). This
is particularly appropriate for the c-c, because octal

-112-
6.4 A.P.E.A.S. Command Table Editor
read the ke bd$ rnferret dser
inpTIz)-o to user spec-
i ed ro ut ne
--
-- "/ -.S. .5
APPEMD- L%STs PUNICH n SEARCH FoYadd entra user-pt ordered, st thoeto table IsperiFis, -rcyra L ntr
partorall earo s -s Vd+he -ablej , rb userdefebwhe ]1 e[v-ste

notation correpponds closely to the hardware decoding
process. Each letter has a value that is an integral
multiple of 1008, starting with A = 01008 and ending
with Z = 32008; thus, J = 1200, J34 = 1234. The table
is always ended with two consecutive locations set to
zero. The physical order of the time/c-c pairs within
the table is unimportant to the controller since it
scans the entire-table for the current time, entry-by-
entry each second. Every entry for that second is
found and decoded when the controller is running an
auto-analysis.
6 .6.4. ODT
ODT is, as was previously explained, the program
through which the user may examine or change.any
memory lo6ation (in field 1 only), trace the progress
of another running program, and ascertain the state of
the processor. It is short enough so that its operation
is best understood by referring directly to the listing:
DEC-ODPA-LA.
6 .8. Memory Allocation:
Figure 6.5. shows the amounts of memory that the O/S
programs occupy. All memory is used.

-114-
6.5. Memory Allocation
RA~k ( 4,4:) 8ANZL(4)
_______1___7__ 4MO~D lAY~
COMTrROL 'FAg 4,
A-o ~.r/oeAA /
AO, 7-e 0 V7-/S
Poc.4 AIAxCC1.T/ SI
5o--W'-X C 0 7* 202
A:Co.Z4 L 4,;-,,r
,Y4A1,01-IM6 40,4 74
WORD~?4

*115-
Chapter VII
TEST RESULTS
7 .1. Calculations
7.1.1. Sodium, Potassium, and Chloride Electrodes:
There are no significant interferences for these elec-
trodes in the anticipated standards and samples for
this system. Therefore the concentrations of these ions
can be calculated directly from the Nernst equation.
7 .1.2. pCO 2 Electrode
The pCO2 electrode potential varies in a Nernstian
manner with the partial pressure of carbon dioxide
in the sample. The A.V.E.A.S. standards are indepen-
dently assayed for pCO2 at the system temperature.
This allows one to substitute partial pressure of
CO2 for activity in the normal Nernst equation.
E = Constant 2.3 RT log[pCO2
7 .1.3. Calcium Electrodes:
Calculations for ionized and total calcium uze a
modified version of the Nernst equation which permits

-116-
correction for the appreciable sodium error for this
electrode.
This equation is:
E = constant + 2,3RT log[Ca++ + k(Na+)2 ]2F
where (Ca++) and (Na+) are the activities of calcium
and sodium, respectively.
I f the H error is found to be a significant interference
for the total calcium electrode, it might be necessary
to correct by the following equation:
E = constant + 2.3RT log (Ca++) + k(Na+)2 + k(H+) 2]2F
7 .2. Analytical Results:
In order to test system performance, an aqueous test
mixture was prepared which contained all of the species
in the physiological range. The composition of this
test mixture is as follows:
Component M1/1
1 M NaCI 117.00.1 M KCl 40.00.1 M CaC12 20.01 M NaHCO. 16.51 M HCl 42.51 M Tris 50.0

-117-
This mixture was stored in gas tight containers and
assayed by the system under computer control. The
results are summarized in table 7.1.
Table 7.1. Test Mixture Results (12 Runs)
Species Expected Found Std. Dev.
Na+ 133.5 meq/1 131.5 meq/l 2.6 meq/1
K+ 4.0 meq/1 3.9 meq/l 0.1 meq/1
Ca++ 4.0 meq/1 4.0 meq/1 0.2 meq/l
Ca+T 4.0 meq/1 3.9 meq/l 0.2 meq/1
Cl" 167.5 meq/1 166.3 meq/l 2.7 meq/l
pH 7.23 7.23 0.01
pCO 2 37.5 mm 37.9 mm Hg 0.9 mm
Although not required by the contract, the system was
also tested for analytical performance on serum s;mples.
The results of these tests are summarized in Table 7.2.

Table 7.2. Serum Results (6 runs)
Species Expected Found Std. Dev.
Na+ 136 meq/1 131.2 meq/l 2.4 meq/1
K+ 4.4 meq/l 4.2 meq/i 0.1 meq/l
Cl" 103 meq/1 104.2 meq/l 2.2 meq/l
Ca++ 4.2 meq/1 4.1 meq/l 0.2 meq/lI
Ca++ 8.9 meq/1 8.7 meq/l 0.2 meq/1T
pH 7.38 7.37 0.01
pCO2 40 mm 40.3 mm 1.0 mm
7 .3. Discussion:
Vhe above results are representative of the system's
performance as demonstrated to date. Analytical perfor-
mance limits for the system as previously agreed on,
for aqueous standards in the physiological range, are
shown in Table 7.3.

-119-
Table 7.3.
Parameter Precision (larger of two valves)
Na+ ±5% or ±1 meq/l
K+ ±5% or ±0.1 meq/l
Cl ±5% or ±1 meq/l
Ca++Total ±10% or ±0.1 meq/l
Ca++Ionized ±10% or ±0.1 meq/1
pH ±.01 pH
pCO2 ±5% or ±1 mm
The results of the system tests are well within
system specifications for both aqueous controls and
serum.
It should be emphasized at this point that system
analytical performance represents a number of com-
promises with respect to constraints such as sample
size, and fluid flow rates. If improved accuracy or
precision is desired in any subsequent development of
a similar system, one could expect to decrease the
standard deviation of the individual electrode
measurements by approximately fifty percent.

-120-
CHAPTER VIII
OPERATION AND MAINTENANCE
8 .1. System Set-up
8.1.1. Fluid Transport Package:
1 . The fluid transport package shown in system
photograph (Figure 1.1.)should be removed from
its packing crate, along with electrodes in their
blue metal packaging boxes.
2 . Remove the metal frame bag carriers, interconnec-
tion cables and spare hardware, packaged in blue
cardboard cartons, from the packing box.
3 . Uncrate the electronics unit.
4 . Uncrate the D.E.C. PDP/8e computer and its asso-
ciated teletype along with the electronic/computer
interconnection cables (2).
5. Arrange the components on a bench working surface
approximately as shown in Figure 1.1.
6. The fluid transport should be at a conven.iient heighi

-121-
to allow injection of samples into the injection
port. Note: the electronics unit should not be
placed on top of the fluid transport package.
7 . Clean the surfaces of all sub-systems to ensure
that all packing debris has been removed.
8. Remove cover from fluid transport.
9. Inside, remove cable ties from electrode connecting
wires, and remove cassette tie downs on the pump.
10. Remove bag carriers from the standard bag containers.
11. Visually inspect -the interior of the cabinet to
assure all components are in place and securely
fastened.
1 2. Open electrode set number 1. Note that each module
is mechanically unique, by virtue of mounting pins
in its base, and will fit onl.y one position. (see
Figurc 4.9.
1 3. Install the pCO2 electrode by first fastening the
electrical connections to the rear of the module,
VR and TEMP CONTROL.

-122-
1 4. Install the electrode into the pin holes on
mounting plate.
15. Install Na+/K+ module on the mounting plate, and
fasten the 'T'' clamps on the module.
1 6. Install the Ca++/C1" module, Ca++/pH module, and
fasten remaining 'T'"' clamps.
17. Screw the electronic connecting cables into the
appropriate connectors on the tops of the electrode
modules. ".otn the alphanu.icric cocd. on top of mod6ules
and on the connecnq-,q cables
18. Install Fluid Ground Wirc (black) onto tho clcctrodz
terminals.
1 9. The next step is to connect the appropriate f.Luid
lines to each electrode module.
20. These lines are indicated by numbers attached to each
line.
2 1. Reference may also be made to Fiqure 4.1. Caution:
these fittings are of relatively soft material, and
care should be exercised not to "'cross-thread'' the
fittings. Tighten each fitting finger-tight, then

-123-
tighten with 5/16'' open end wrench (supplied with)
unit) until moderate resistance is felt. Do not
overtighten!
22. After electrode fluid lines are connected, the
standard bags should be attached to the bag carriers.
The standard bag should be folded along its narrow seal
edges , then placed on the carrier. The long seal
is then rolled over the flange of the carrier at the
connector end. A bag clamp (black plastic) is slid
over the folded bag to retain the fold, see Figure
8.1. The same procedure is followed at the opposite
end of the bag. Note that the standard bags have
numerical labels, one series of (4) numbers
makes one set. After all bags are on carriers,
install each into its coded compartment.
2 3. Remove the needle covers from the four standard
lines (12, 13, 14, 15). Insert each numbered line
into the appropriate bag. Each fitting is a
1/4 turn ''luer-lok''.
24. Attach large silicone tube from manifold to waste
bag via the 1/4 turn ''luer-lok'' fitting. Note
the waste bag cap can be removed and placed in
the waste pan under the waste bag.

-124-
25. Check the pump cassettes for tube alignment. The tubes
should ride on top of rollers not in the grooves of the roller.
26. Pressing down on the six (6) cassettes, immediately bring
saddle bar over the cassettes and position the bar so that
each spring pin engages the appropriate cassette. Repeat
for remaining four (4) cassettes.
27. Insert the waste pan with waste bag in place into its
position, note that the pan will fit only in one direction.
Fasten turn screws.
28. Replace fluid transport cover and fasten turn screws.
29. Prepare for sample injection by mounting 21 ga. x 1 in.
*,Huher'' point needle to 2 cc syringe, supplied in parts
\kit. CAUTION: Do not use other than supplied needles. These
needles are non-coring to prevent septum deterioration.
8.1.2. Electronics and Computer Set-up
8.1.2.1. Cable Connections:
Make the cable connections as listed below. Except where in-
dicated, connectors are unique and keyed to prevent incorrect
attachment.
1. Connect the large round-connector cable from the electronics
unit (E/U) ''M' to the fluid transport (F/T) ''J1''.

-125-
2. Connect the small round-connector cable from the
E/U ''N'" to the F/T ''J2". Check that all
connectors in the F/T are securely attached.
3 . Remove the cover from the computer (8/E) and
attach the flat ''Berg'' connectors as follows.
Caution: the D.E.C. connectors are not keyed to
prevent incorrect or inverted attachment.
Connect J1 of the flat cable marked R and J1 to the
8/E board ''M863'', J2 (pin ''A'' must be up).
4 . Connect J2 of the flat cable marked S and J2 to
the 8/E board ''M863'', J2 (pin ''A'' must be up).
5. Connect the ''Berg'' connector from the teletype
to the 8/E board ''M8650" connector (pin ''AY'
must be up).
6 . Route the cables along the power supply module to
the rear of the 8/E. Check to see that all boards
in the 8/E are securely plugged in. Replace the
8/E cover.
7. Plug the flat cable plug marked ''5'' into the E/U
connector ''S"'' (note which side is marked ''UP''-
the connector is keyed to prevent inversion, but
this is not obvious until fully inserted.)

-126-
8. Plug the remaining flat cable plug "'R'' into
the E/U connector ''R'' as in Step 7.
9. Attach the E/U power cable to the E/U ''P''.
Plug the other end into a 115 VAC receptacle
on the rear of the 8/E.
10. Plug the teletype power cord into the other
115 VAC receptacle on the 8/E.
11. Be certain that the E/U power switch, 8/E key
switch, and toletype switch are in the ''OFF''
positions. Connect the 8/E power cord to a
suitable grounded 115 v. 60Hz power source, of
at least 15 AMP capacity.
8.1.2.2. Initial Turn On
1. Turn the computer on with the front panel key-
switch. The cooling fans should be heard, although
no lights will be on. If there is no response,
checkthe circuit breaker on the rear of the 8/E
and the power source.
2. Turn the teletype to ''LINE''. The teletype motor
should start.
3. Open the control cover on the E/U and set all

-127-
switches for automatic operation (the position
identified by the green rectangle.)
4. Assuming that the F/T is fully prepared, turn
the E/U power switch on. Observe the following
indicator states -
''Main valve - REV & FWD'' off (''SET'' may
be on)
'FLUSH'"' off
'"'AIR'"' off
4''PUMP-ON' off
*1MIXER'' off
'THERM-FAIL"'' off
4"THERM-NORM'' on steadily
'AUX'"' off
"'LO-TEMP-HI'' both off
'CLOCK-1PPS'' flashing (once/sec,)
The valve position should not be changing, the elec-
trode channel should read 8, and the data display will
indicate temperature. The temperature should be at
ambient (nominally 25,00 - ignore the display decimal
point), and rising due to the heater.
If the ''MANUAL MODE'' indicator is on, check the
setting of all switchr;s. Sequence status indicators
(''STD B'',etc.) will be off.

-128-
8.1.2.3. Program Loading
Operation of the PDP-8/E computer is fully covered
in the ''Small Computer Handbook'' supplied with
the 8/E. The following instructions are intended
as a reminder of the necessary steps. It is
assumed that the D.E.C. binary loader is in memory
field 0 (if not, consult the above handbook).
1. Put the A.P.E.A.S. operating system tape in
the teletype reader (arrow on top, pointing
forward), lc'adcr (channel 8 punched) over reading system)
2. Set the 8/E switch register bits 0 thru 11
all up (address 7777 octal).
3. In sequence, push ''ADDR LOAD"'', ''CLEAR'', and
''CONT''. The tape should road in.
4. When the reader stops, observe that all lights
are out on the 8/E lower display register when
set to ''AC'' (Accumulator = 0000). If this
display is not zero, the program did not load
correctly.

OPEN CIM VLpCONTINUE TURN ALLWO(EPOMAI VALVE PUMPIN~JI 8EVEpg SIEE
SwlTCIIEI To 70 AIR VAL.vU UNTIL AIR EXITs ALTERNATEAIR i P 5w7tLrHESoTF wV I C TION PORT L ID E XIT E A OAFro
i 7
nts#74
SEC SEC
Pum To E C ;-
COL
TO " EV'(SYvS EM -1AOyP4ANCIAL O O FOA Auro oPEA
MAIN /VALVAIN VALVEF p., RELEASE DYE MOV)N& 0 1.FF * )N OoSRY
PRIO TO OT"L OL ?MEL UM AL ER NATE o PUMPREV TO -'EAC0INC TO PCOL EON
AIA FLI EX P2POSITON t, opP
s c I.'E cEF
OOBSERY oSEAVE 0 See-) n
SWINI PUME
NSPE'T P\NR YE MOVIN pump FLUID MOViPJG PUMPCRS VAJ vE SWITCH PC, TO MANIFOLD N of" OU' CENTER POATCR "OFF
P OELECTPOD . Y CLEAR III
SEE SEC oEE SEC pump
* fOFF"
AI R oa5E RVE o65FRVE 0PREPARE S(JPPL#FD BUBBLES VES PUMP FluIO Mov NO PUMP FOR YES PUMPSYAWSE 4 HEEDLI *ovics IN INTO xiEcrpoN LEAA5 AAOUND OFF
bYr SAMPLE OFF PA LINE- SEC CAsbfTre$
MAIN VALVESEKS REV'ssee SE
TTo
ALV YES"lAVLE , . 40Icc. :NTo V T LVEZIJJE - N- AFTER o
z:" .,-lrPOotT 1.o 0'l II. OFF
PUMP CONTINUEpuMPIN4 LN'tIL
ON' AIR 'ILLS 140LCOIL "'IT. CRS
oScve 5 SECosev AIR OSE VE E S -7DYE ENTER No g A roLLowr VALUEo TO DYE DILUE3/CY. ENTE * 3Y CLEAR FLUID OFF" DYE EXIT XJetrio .3
CAS NOL INrO LINE pump feAr TOCOIL Qs: 5 Cr ASWAJT FOR
IA TO ENTER14-61 SELECTROLYTE
SELECTLODE

-130-
8:2. System Operation
8.2.1. System Starting-
1. Turn system power on in the sequence: PDP-8/E,
teletype, and Electronics.Unit. (the shut-
down procedure is the reverse of this.)
2. Set only bit 4 of the 8/E switch register up
(address 0200).
3. In sequence, push ''ADDR'LOAD'', ''CLEAR'',
and ''CONT''.
4. The teletype will respond by asking if the
user wishes to change the standard solution
values; The user may type ''NO'', or ''YES''
and enter new values. To allow new values to
be entered, the conputer will type each para-
meter and the currently stored value, stopping
to permit modification. The user may enter a
new value followed by the "'RETURN'' key; or
he may press the '"'ALT MODE'' key to leave the
value unchanged.
At this point the system is completely opera-
tional. Observe the same E/U displays as des-
cribed in the setup section - initial turn on -

-131-
Step 4; except as follows:
The main valve must be in position 1
The main valve ''SET'' must be on
Temp "LO'' indicator should be on (until
the system warms up).
5. Wait for system warm up. This requires about one half hour
if the system was not recently in use. When the correct
temperature is reached, temp ''LO'' will go off and the
''READY'' indicator will come on.
8.2.2. Operating Controls
The only control necessary for normal operation is the "START''
button on the E/U. This control is pushed to initiate an
analysis, and pushed again after sample injection to resume
automatic operation Simply:
1. Push ''START''
2. Wait for ''INJEC'' indication
3. Push ''START'' after injecting sample
4. Wait approximately 10 minutes for analysis and typeout
5. The ''READY'' indicator will show when the system is
x ready to be restarted.
A ''CHECK'' control is provided to allow checking

.132
system performance without injecting a sample. The
check function is an automatic sequence which types
actual electrode potentials and slopes for the ''A''
and ''B'' standards.
Once "START" or '"CHECK" is activiated, the other
control has no effect. A ''STOP'' control is pro-
vided to prematurely terminate either sequence.
This action will return the system directly to
the ready state, except after a sample injection
in the analysis sequence. In this latter case,
no analysis will be typed, but the user must wait
the balance of the 10 minute period for system
cleanout.
Prior to the actual start of either automatic
sequence a system status check is performed. If
any control is set for manual operation, or if
the electrode temperature is incorrect, an approp-
riate error message is typed. The system will
wait indefinitely, giving the user opportunity
to correct the condition. However, if the user
pushes '"START'' (or "'CHECK"'' as the case may be)
the sequence will commence, regardless of corrective
action.
The teletype keyboaj:d duplicates these controls

-133-
and provides some additional options. When the
sys.tem is turned on the teletype is placed in an
echo mode, allowing the user to type any general
alpha-numeric labels he may desire. By holding
the ''CTRL'' key down and typing ''"C"' (referred
to as "CTRL-C''), the teletype bell will ring
and the keyboard will be shifted to command mode.
Typing a key listed below executes the command
(typing any other key has no effect.)
IG"' = GO (same as ''START"' button)
'C'' = CHECK (same as ''CHECK'' button)
'IQ" = QUIT (same as ''STOP'' button)
'R"' = RAW DATA (analysis, but with continuous
MV.X2 output)
'M" = MODIFY (control table modification routine)
''O'' = ODT (debugging routine)''CTRL-F'' = FOCAL (comIand m:ode)'CTRL-L'' = Return to Echo Mode
These additional functions are not normally used
but are convenient when making changes or performing
system tests. The raw data command prepares the.
analysis sequence to be idc.ntical to "hc normal
analysis except raw ADC data will be typed instead of
calculated activi "tis, hcn the sequence is started.
Start ans Stop points for this typcout .rc -,t by the control\
table as dos-

-134-
cribed later. After sample injection, ''START'' or ''G'' must
be used to make this sequence continue. At the end of any
automatic sequence the teletype returns to the echo mode.
The modify routine is a service program used to alter the
system control table. Its operation is summarized at the end
of the section.
ODT is a D.E.C. octal debugging program which is provided to
facilitate program changes in memory Field 1. The operation
of ODT is fully ocvered in 'Introduction to Programming, 1972'',
published by D.E.C.. To return to the main program from ODT
control, simply type ''G''.
FOCAL can be used in its command mode only by typing ''CTRL-F''
from the controller's command mode. Consult ''Programming
Languages, 1972'', published by D.E.C. for its standard opera-
tions. Return from FOCAL to echo-mode by typing ''G 1.2 carriage
return', or simply ''G cariagereturn'', then answering the
subsequent request to change activities with ''NO carriagereturn''.
The user is warned that the proper operation of the system, is
in part, dependent on the interaction of the FOCAL text and
initial FOCAL variable values as provided on the system tapes.
Modification of the text or variables may prevent subsequent
normal system operation.

-135-
8.2.3. Special Controls
An auxiliary display and control panel is provided behind a
door on the E/U. This panel allows the uscr to continuously
monitor system device operation, and take over manual control,
if desired, for system testing. Although safety interlocks
prevent system damage if these controls are incorrectly used,
automatic analysis data may be meaningless.
8.2.4. System Shutdown
The operator is cautioned not to shut the system down with
non-aqueous samples in the electrodes. The system will be properly
flushed by all automatic sequence if allowed to go to completion.
For manual operation, the responsibility is on the user. Normal
shutdown procedure is as follows:
1. :Allow analysis check, or stop sequence to be completed.
(The ''"READY'' light should be on).
2. Push '%HALT'' on the 8/E, and return to the up position.
3. Turn the E/U power off.
4. Turn the computer off with the key switch. The teletype
switch may be left on ''LINE''.
8.2.5. Control Table Modification
All system control originates from two control tables. The main
table contains all sequencing commands for the sample analysis,

-136-
normal or raw data operating modes. The second table controls
the 'CHECK'' sequence. Commands are discussed in the format:
135 TIME (seconds)
P 1 COMMAND (pump on)
The command code consists of a device (P = pump) and an action
(1 = turn on). This event will occur at the 135'th second. The
computer software actually stores the above example in the format:
0.207: TIME (octal seconds)2001 COMMAND (control code)
The modify routine allows listing, searching, and changing the
table in the first, simpler format. A description follows.
In general, the user input format that MODIFY requires, is a
decimal time followed by a command letter followed by an octal
c-c expressed symbolically and/or numerically followed by
to indicate the end of input for that line. Since the meaning of
the input character is derived according to its context, valid
characters, provided they are in the correct position in the
line, may include: decimal 0 - 9; commands A (append), L (list),
P (punch), S (search); octal A - Z (symbolic) and/or 0- 7
(numeric). Spaces are not interpreted by MODIFY, but they
are echoed, allowing free formatting using them. Leading
zeroes, decimals, or octal, are ignored.

-137-
Characters that are not valid at the point where
they are typed in are echoed, then the error re-
covery sequence is entered. 3 As there is no pro-
vision to ''erase'' a mistyped character, purposely
typing an invalid character, such as ''/'' or '3''
3will cancel the line with the mistyped character
in it.
Input characters at the beginning of a line are
interpreted as a decimal. They represent the
second with which the numeric/symbolic octal'c-c
will be associated. Only the numeric characters
0 - 9, values I - 999 are valid at this point.3
Larger values cause an error. The decimal
portion of the input line is always terminated by
the command letters A,L,P,or S. The decimal pot-
tion may be ''empty'' (none or 0) for L and S, and
is treated as empty (i.e. ignored) for P. The
actions caused by these codes will be described
later. The command letter is always acknowledged
by the typeout of its echo followed by a space.
The typing of P or L commands automatically ter-
minates the line, no P is needed. In all other
cases the input following the command letter will
be interpreted as a numeric/symbolic octal c-c.
At this point the octal characters 0 - 7 and letters

-138-
A - Z are valid.4 Meaningful formats are up to
four octal digits5 or a letter followed by one or
7two octal digits B is interpreted as B00, B3 is
interpreted as B03 , et cetera. The c-c (and
that line) is terminated by .
The command A stands for append or add to the
table. The time/c-c pair is placed in the first
unused (rubbed out) location in the table. If
there are none, it is placed at the end of the
table. In this way the length of the modified
table is kept to a minimum. A2 or A followed
by a c-c followed by : are errors; the time valve
must be greater than zero. 12A would enter the
time/c-c pair, 1210 8 into the table, but
zero (@00) is an illegal c-c4'5 All other valid
combinations using A are accepted by MODIFY.4 ,5
The command L stands for list. L is never followed
by a c-c because it automatically terminates the
line and starts printing out, one entry per line,
the entries for the time specified, or the whole
table if the time is empty. In the latter case,
the entire table is listed without pause, while in
the former case, where a time is given the time/c-c
pairs are printed one line at a time with a pause
at the end of each line. The pause allows the user
-139-
to type,, approving and saving that entry, or
r.o. 2 , deleting that entry from the table (and
marking that position in the table ''available'').
If there are no entries for a time specified to be
listed, there is no printout, only a carriage re-
turn followed by two linefeeds. Regardless of how
the c-c's are expressed when entered, all entries
are printed as an indented decimal time, followed
by a space, followed by a letter, 4 f6llowed by
two numerals.
The command P stands for punch; it ignores the
time, if any, that proceeds it and halts the
processor to let the user turn on the teletype6
punch. The user then depresses the processor
''CONTINUE'' switch. The whole table is punched
in binary loader format, then the processor is
halted to remind the user to turn off the punch.
When ''CONTINUE'' is depressed, MODIFY is ready
for another line of input. When the O/S soft-
ware is initially loaded into memory, it includes
an original control table. Since the latest table
loaded is used for auto-analysis, the user needs
a method to save modified and rewritten tables.
If the O/S software ever needs tp be reloaded after
the user has modified the control table, or if he

-140-
regularly uses more than one control table, it
would be much simpler to load the modified control
table ''on top of''(overwriting) the original con-
trol table, rather than having to reperform the
whole modification procedure. With the use of the
P commandzcontrol tables can be written and saved.
The user should be aware that any major modification
to the control table must be co-ordinated with the
''ABORT'' table.
The command S stands for search, a very flexible
command. It causes the table to be searched for
entries under the time specified and lists all
time/c-c pairs that match the specified c-c. If
no c-c is given, i.e. 15S all entries at that
time will be listed. Note that this is almost the
same action as 15L (noc required) but the listing
due to ''L'' pauses at the end-of each line for an
O.K. or VETO( or r.o.), whereas, the listing due
to ''S"' will run until all entries for that second
are printed. For all the conditions above if the
S is followed by a single letter (symbol),that
character is used as a ''partial mask'', all entries
for that second containing that symbol in the c-c
will be listed. If the S is followed by a letter
and any numerals or only one or more numerals, only
those entries exactly corresponding to the input
line will be listed.

-141-
L ISTING .L L
I J34 I J342 BOO 2 B003 COO 3 COO35 c77 63 C773 D45 3 D454 DOI 4 DOI4 D03 4 D034 C77 ... 4 C778 @45 65 8 @459 J34 9 J349 J36 9 J36
10 J34 10 J3411 @01
1,5 ,IA '70 11 A02IIA 102. 11 J3411 A B
0000011 A 000003 12 PI I A 1 2 3 4
20 1 1L2g ilI__LI I @0 111 A02-S11 BOO\11 C12\
25 11 J34,
IIA B09?
ZI 11 @011.1 AO211 J34
SIIS -J3/4Z5 11 J34
S J34PI J349 J34
40 10 J3411 J34
S J1 J34
45 9 J349 J36
10 J3411 J34
50 3S571 asC c3 COO3 C77
AS CP55 4 C77 ,.,etur, e

-142-
The following example referring to 1 isting 1
illustrates the use of MODIFY. The underlined
characters were typed by the user. The rest of
the typeout was done by the MODIFY program. First
compare those places where the user needs to ter-
minate the line with2, lines 15 - 19, 29, 34, etc.,
to those where the termination is automatic, lines
1, 20, 27, 56. Next, examine a typical user session.
While the O/S was running in the ''idle'' (CTRL-C)
mode the user first typed M, initializing the
MODIFY program, then typed L (line 1) getting a c
complete listing of the control table at that
time. In lines 15 - 19, he appended some c-c's
to the table at second eleven. Compare these to
lines 21.- 25. The formatting with spaces and
zeroes is completely free. Carried too far, it
could even be confusing. Comparing lines 2 - 13
with lines 21 - 25 shows that alone, L lists the
whole table, while a time specified before L lists
only time/c-c pairs that are the same time as the
time specified, and waits at the end of cach line
listed for the4 or r.o. Lines 23 and 24 have been
deleted. At line 29 the user asks to review all
entries for the eleventh second, without having to
'approve'' each line. 11S does this, listing all

.143-
entries for the eleventh second without pauses.
Line 30 corresponds to line 21 (approved) which
was entered atrline 15-. Notice that its octal
2valve 0001 is listed as @01. The same correspon-
dence holds in lines 31, 22, 16, and lines 32, 25,
19. (A = 0100, C = 0300, J = 1200). Lines 23,
entered at 17 and 24, entered at 18, having been
''vetoed'' with the r.o. key, are no longer in
the table.
Line 27 is in error because 9 in the c-c position
is not a legal octal numeral. The error in the
line following is due to the user's typing which
is not valid in this context. We have seen the
effect of a time followed by S at line 29. Compare
it with line 34, looking for J34 (12348) only. Line
37 looks for J34 anywhere in the table. Line 43
looks for ''J'' entries. Line 30 looks for all ''C''
entries at second 3. Line 54 looks for all "'C''
entries at second 4. The user reviewed the whole
table at line 56 (S would have exact3 the samr_ effect)
and punches a binary tape, illustrated on page 2 of
listing 1, at line 73. The user may now type control-
C to go back to the O/S idle condition or control-L
to go to the echo mode for labelling or commenting
the listing.

-144-
MODI F Y
CONCISE COMMAND SUMMARY
TAB3LEPOINTER: Octal Loc. XXXX
GENERAL FORM4AT FOR USER INPUT:
DDXe r )t rturn'' or '"linef ced'' key
\ is line terminator
decimal time in octal value of table entry,
seconds, 1 to 99910 0 to 77778; can also have
f the form: L09, where L is a
letter A to Z, value 0100 to,I
I 3200;GO is one or two octalA = APPEND enter time
digits, value 0 to 77 8 (A1=Ao101associated w/control
code into table command typein is always
acknowledged by a space typeout
L = LIST (auto ''return'')
prints all control-code
entries associated with that time. Waits at end of each
line for ''' meaning '"keep this entry'; or for ''rubout'
(echoed as ''\'') meaning ''delete this line.'' ''OL'' or
just ''L'' lists whole table. P=PUNCH (auto 'return') halt
processor for punch-:urn on. Depressing "CONTINUE''
switch starts punching of binary tape of table. At end of
punching processor halts to remind user to turn punch off.

-145-
S=SEARCH searches the entries for the specified second
(or whole, table if second is = 0 or blank) for the
specified control-code entry. (See MODIFY routine
description and example for more detail.)
-146-
NOTES
TO SECTION 8.2.5.
1. Trademark of Digital Equipment Corporation.
2. Throughoute) means ''return''key or ''linefeed''
key. Their effect is equivalent, either one
causing a carriage return and linefeed. The
i14rubout'' key is represented by r.o. It is
echoed with the backslash character, \'.
3. This action generates the error recovery sequence.
The message ''?'', carriage return, linefeed is
typed. MODIFY ignores the previous line input
and is ready to accept a new line.
4. @, 1,\ , ], will also be accepted as actual
symbols. As with letters their valves are multi-
ples of 1008, being 0000, 3300, 3400, 3500, and
3600, respectively. Although MODIFY accepts these
inputs, the first is superfluous (@23 = 23 = 00238,
in listings, leading zeroes are printed as @), and
the other four are illegal c-c's to the O/S, gen-
erating system error message when an auto analysis
is run. The O/S only recognizes c-c 0100 - 32008,
and even within this range some code combinations
are not defined.

147-
5. It is possible to enter any value up to 77778
using numeric octal input to MODIFY. The
same warnings as in note 4 apply.
6. Trademark Teletype Corporation.
7. A peculiarity of the structure of MODIFY is that
during c-c input, if only octal numerals have
been entered and no symbol has been input previously,
inputting a symbol replaces the internal c-c field
with its own value. Thus, 12A 7654C332 results in
.a c-c of u.c. 33, whereas, 12A followed by anything
sililar to these: CD or C12D or 7654C33E, et cetera,
all cause errors.

-148-
ANALYSIS TABLE
coLe eI q~e9
I D23 38S RS7 335 RS7 535 PSI o-- -\-I T01 193 RS2 34a 021 523 R56 ,es\I V04 195 R52 355 .33 525 P566 301 203 R56 370 Ft55 530 R56
6 Pat 235 R.56 375 P.55 535 R52
21 P,0 21 RS6 3.1 H56 540 R5222 V12 215 PJ . 385 1'56 545 RP52
23 KOJ 215 "33 39a R16 553 R5525 D10 216 V JS 395 .51 555 p.5525 TO 2 219 P31 403 .51 570 R5425 '03 222 JJI 425 R.541 575 .5426 D60 223 P'0 409 ;J2 595 J03
26 T33 223 VI 413 P.54 60 213326 V05 225 P'it 415 r52 601 02031 MJ 24U .55 423 P.53 632 73I31 P01 245 .55 425 R52 632 M0334 10 253 P.51 463 022. 602 P3335 P33 255 51 470 FOI 622 7;3135 VI3 27J It.54 475 R33 604 T04
38 P01 275 !i5, 490 n57 605 cz 343 I31 295 R-53 495 R5796 103 331 P.53 503 P53175 FJ3 320 Tr2 505 R5318 O R57 333 R57 510 !.51
CONTROL TABLE - COMMAND SUMMARY
B 0 RAW DATA OFF SWIICHB I RAW DATA ON SWITCH
(kECOGN1ZED ONLY IN THE RAW DATA MODE)
0 3 DISPLAY "SAMPLE"D 2 DISPLAY "STD A"D 4 DISPLAY "'DAI," (VALID)D 10 DISPLAY "INJECT"D 20 DISPLAY "N"D 40AO DISPLAY "STU B8"
(THESE CO".NANDS PAY BE COMBINED BY ADDING CODES.)
r I AVEHAGE AND STORE "STD A" VALUES (FOCAL COMMAND)
F 2 AVE. AND SO.E 'APeL" VALUESF 3 AVE. AN) S10:,E "TD 8" VALUES
F 4 RUN TEMP. HI/LU TEST (FO:Z E/U DISPLAY)F 5 PRINT ELECTODE TLMPEkATU,'EF 6 * AVE. TEIP. AND PRINTF 30 CALCULATE AN.U PihlT ANAL.SIS kESULTSF II CALCULATE ELECTRODE SLOPES AND PRINT (INCL. MV.)
1 0 FLUSH VALVE OFFII FLUSH VALVE ON
J 0 AIr VALVE OFFJ I AIR VALVE ON
0 VI)EN OFFI :IAER ON .
P a PUP OFF
Pt PUMP ON
0 QUIT (END OF SEQUENCE)
R 0 READ ELECTNODE CH. 8 (TRANSFER DATA TO FOCAL)R I READ CH. IR 2 kEAD CH. 2R 3 NEAD CH. 3R 4 READ CH. 4R 5 READ CH. 5R 6 RFID CH. 6R 7 EAD CH- 7
(ADD "20" TO ANY CODE TO PRINT VILLIVOLTS DIRECTLY)
T X (NEFER TO PROGRAM LISTING FOR MESSAGE TYPEOUTS)
V I RUN PAIN VALVE FOF'WARD TO POSITION IV 2 FWD. TO POS. 2
V 3 FWD. TO POS. 3V 4 FWDI. TO I'OS. 4
V S FWD. TO '0S. 6V 6 FWD- TO ?OS. 6
(TO RUN REVERSE, AD "1O" TO ANY CODE.)
W WAIT (STOP.S CLOCK TO ALLOU SAMPLE INJECTION.)

-149-
8.2.6. Use of Focal
8.2.6.1. Focal Modification -
Changes to the Focal data processing program should
seldom be required. If they are note the following:
As Focal never enters its direct (* or command Mode)
in normal system operation, except as noted in section
8.2.2, it is unavailable to the system user. Hlowever, ans
to any questions concerning its standard use can be found
"'Programming Languages 1972.'', PDP-8 Handbook
Series, Vol.2. available from Digital Equip-
ment Corp., Maynard, Mass.
''Listing of FOCAL, 1969, etc.''
DEC-08-AJAE-LA
' APLAS Focal Data Processing Package''
part of Orion Research listings

-150-
8.3. Maintenance and Troubleshooting
8 .3.1. Maintenance
8 .3.1.1. Fluid Container Replacement
After approximately every 100 cycles the fluid system
(standards, KCl, reagent) must be replenished. The
waste bag container must also be replaced at this
time. The fluid bags are packaged in sets in the
fluids shipping container.
To replace the fluid system:
1 , Turn power ''off'' on the electronics unit.
2 . Remove the cover of fluid-transport package,
by turning counterclockwise the six (6) cover
fasteners.
3. Remove waste bag line by turn (CCW) the ''luer-
lok'' fitting.
4 . Place the waste bag cap on the waste bag fitting
and clockwise lock.

5. Remove and dispose of waste bag.
6 . Remove waste pan from package by unlocking
six (6) fasteners.
7 . Remove the four (4) needle connectors.
8 . Remove the four standard bags and carriers.
9 . Remove the bag clamps from each end of the
bag carriers.
1 0. Remove bags from carriers and dispose of them.
11. To mount new standards bags first fold the bag
along the narrow seal edges then place on the
carrier. The long seal is then rolled over the
flange of the carrier at the connector end.
A bag clamp is slid over the folded bag to
retain the fold (sm Figure 3.1)\. The same pro-
cedure is followed at the opposite end of the
bag. Repeat the procedure for each of the remaining
three (3) bags.
1 2. Rcplacc the numbered bacjs on carriors and into thcir
resp oCctive coipartmcnts.
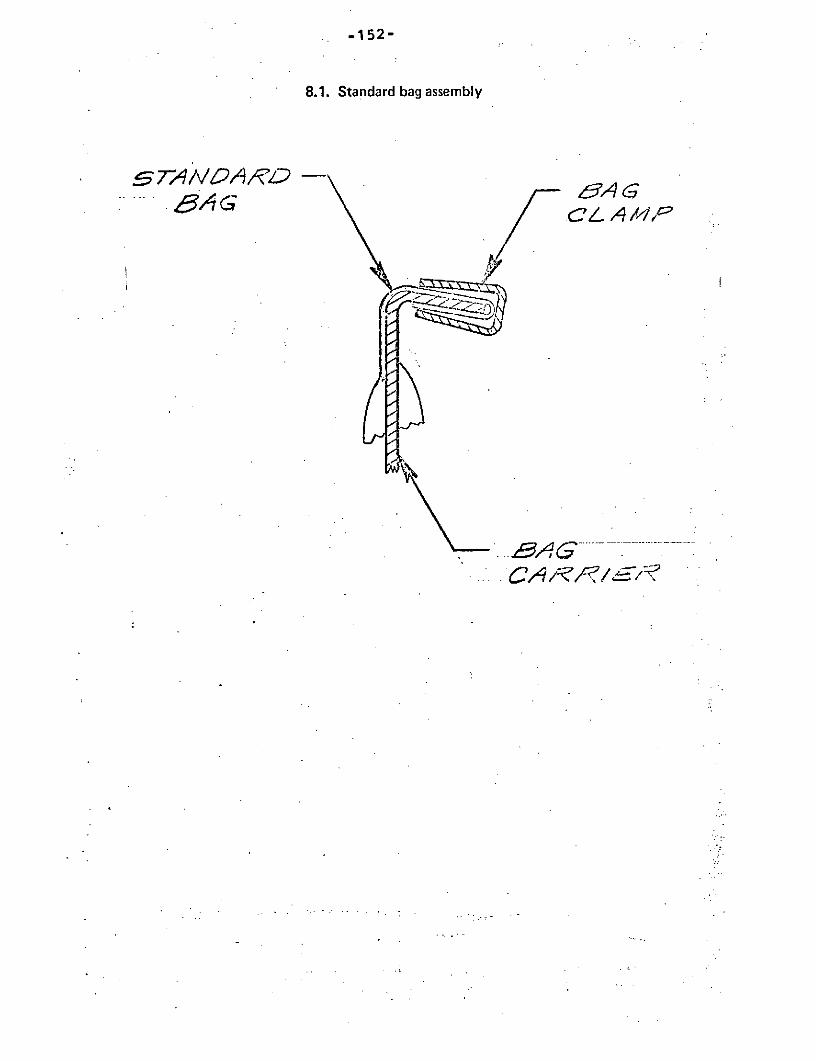
-152-
8.1. Standard bag assembly
VINARD -
CA t

-153-
13. Replace needle connectors into the appropriate
fluid bag and lock.
1 4. Replace waste pan into the fluid package.
1 5. Place a new waste bag into the pan.
1 6. Remove the waste bag fitting cap and place in
the waste pan.
17. Attach the waste outlet line to the waste bag
and lock with turn (C.W.).
18. Replace the fluid package cover and lock in
place.
8 .3.1.2. Septum Replacement, Injection Port
In conjunction with the fluid system replacement, the
soptum of the injcction port must be replaced.
To remove the septum?, unscrew the injection port cap
at the front of the fluid transport package. Remove and
dispose of the white silicone septum from the injection
port. Using a new septum from the spares replacement
package, insert a new septum into the injection port.
-154-
Replace the injection port cap on the injection port
and tighten (CW) thec cap until it bottoms on the
threads.
8 .3.1.3. Pump Tube Replacement
The pump tubing for the peristaltic pump is a long
lasting silicone compound. If proper care is used when
the pump tubing is clamped by the cassettes, replace-
ment should be required only after approximately
3000 cycles of operation.
To replace the pump tubing:
1 . Turn power off on the electronics.unit.
2 . Unlock the six (6) fasteners on the fluid
transport package cover and remove.
3 . Remove the waste pan with waste bag attached.
4 . Release the two (2) saddles of the pump.
5. Using socket tool supplied, unscrew each of the
six (6) tube fittings going into the waste mani-
fold directly between the pump and the standards0
container.

-155-
1 4. Spare pump tubes with proper number designation
are packaged in the spare parts package.
1 5. Place the new tubes into the cassettes by
snapping the tube holders into the slots on
each cassette end.
16. Place waste tubes and cassettes lines number 20,
21, 11,13, 24, and 25 in tho pump.
17. Connect the fittings from these lines to the
waste manifold and to the components.
1 8. Install lines 2, 7, 10, and 12 in the cassettces. RC
the component end fitting and ferrule.
1 9. Place the three (3) EC1 lines (2, 7, 10)
around and under the pump ca4e.
2 0. Run the lines under the manifold and to each
electrode module.
2 1. Replace the tube fitting and ferrule using the
:tool shown in Figuro 8.2
2 2. Screw fittings into appropriate electrode module.
Tighten fittings with the 5/16 under open end

-156-
wrench supplied. CAUTION: fittings are of soft
plastic. Do not cross thread, do not overtighten.
23. To install line 12,remove both end fittings
and ferrules. Wrap pump tube around the pump
roller cage so that the longer end of the tube
comes from the acid reagent bag under the pivot
bar to the cassette. The shorter end (pump
outlet) goes from the cassette, around the roller
cage and under the pivot bar to the mixer.
2 4. Insert the tube fittings and ferrules.
25. Screw the needle connector for the acid reagent
into the inlet tube end.
26. Screw the outlet tube end into the mixer body
and tighten the fittings using the 5/16 open
end wrench.
27. Check that all connections are made and tightened,
check that each cassette and tube are aligned
on the pump rollers, and clamp the cassettes
with the two (2) saddles.

-157-
8 .3.1.4. Electrode Replacement
Electrode performance should be tested weekly or after
extended periods of shut down. These checks are
facilitated by using the ''CHECK'' mode described
in section 8.2. In addition, if during fluid
function testing an air leak is determined to be
in the module, the module should be replaced.
Once the defective module is identified, the
electrical and fluid connections must be removed. The
''T'' clamps on the electrode mounting base are
released and the module can then be removed.
Spare electrode modules have been supplied in blue
metal packing boxes.
1. Choose the appropriately marked module and
remove the fluid plugs.
2. Install the fluid input conn:ctors from the
removed module.
3. Replace the new module and connect its electrical
and fluid connectors. Refer to the fluid function
test chart (8.1.3.) to debug the fluid system
with the new module.
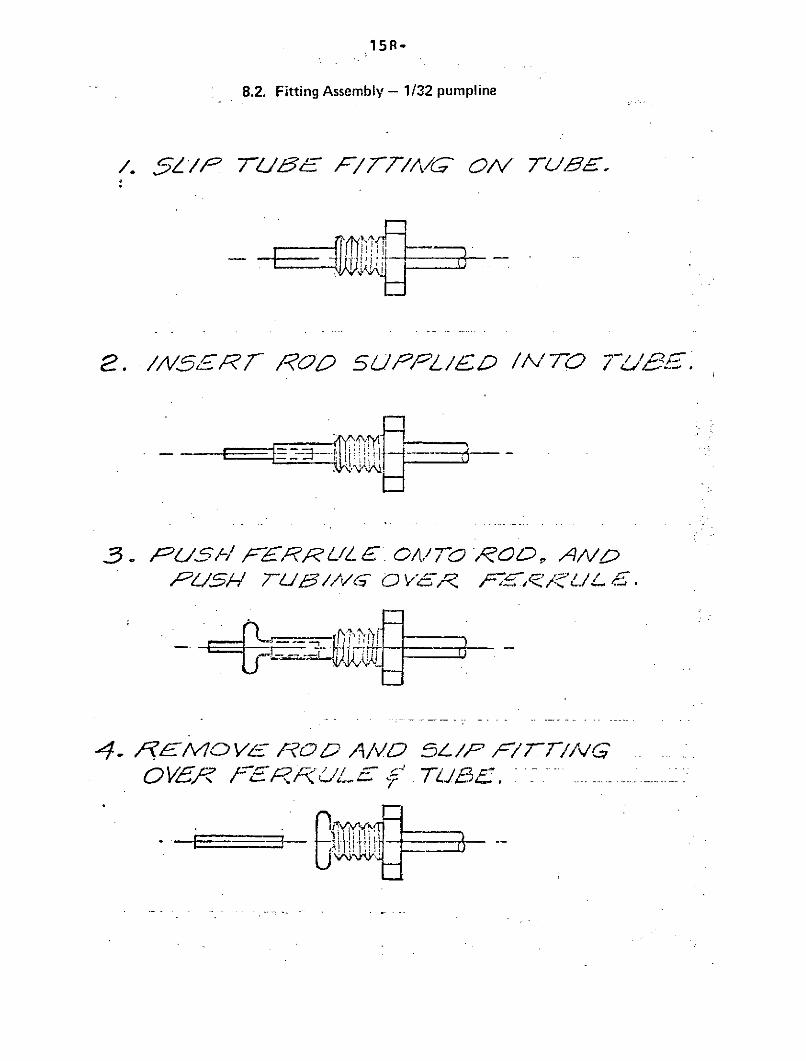
158-
8.2. Fitting Assembly - 1/32 pumpline
/. 5Z/P 7-/U3E F/77//7/' O/ 7-BE,.
-d -----
2. //5E f /-o 5U PPL/ D /V' TO 7-/E!.
4//-/ S /7/7 0 vU65 / fL .
4.- A. 1O V/ - Ak O A/v SL/ P F/7 T/vGQVg/R' F/&IH E TL4SC. X

-159-
4. Place the fluid plugs from the new module
into the defective module. Pack the defective
module carefully in a foam lined container and
return for failure analysis and repair.
8 .3.2. Troubleshooting - Mechanical
The fluid transport system is designed for operation
with minimal maintenance. HOWEVER, the following
areas are indicators of trouble. They fall into the
two (2) main categories of lack of fluid movement,
air-fluid leads and malfunction of.major subasscmblics.
The following sub-paragraphs are complementary to
the fluid function test flow chart in 8.1.3. This
chart outlines th; stop-by-stop proccdur1 for tcst
and debugging of the fluid transport system.
8 .3.2.1. Test of CRS valve to locate proper port.
The chromatographic rotary switching valve is described
in 4.4. Failure of this subassembly means that
fluids cannot be properly routed through the fluid
system. In addition, a greater damage may result to
the system if the pump is allowed to aspirate on
the electrode modulvs while the valve creates a dead
head (closed volume). Many safety devices have been

-160-
built into the system to prevent this occurcncc.
The CRS valve is keyed to the electronics unit and
its.position can be read directly on the display panel.
Also, an observation hole is located beside the
valve body on the CRS valve housing. Through this hole
the valve position may be read.
8 .3.2.2. Test of Fluid to Enter Through the SeptumInjection Port
When a sample is injected into the system through
the injection port fluid should flow into the holding
coil that is wrapped around the body of the CRS valve.
If the fluid sample will not enter and regurgitates
through the septum, a fluid blockage is present.
The location is either in the CRS valve, the
holding coil, lines to the waste manifold, the
waste manifold, waste line, or waste bag fitting.
irhe first of these points, (the CRS valve) is most
crucial. No other valve station other than 2 will
allow injection. Check the electronics unit display
and CRS valve observation hole for No. 2 (see section
8.3.2.1.).

-161-
If the CRS value is ascertained to be in proper
position, then the blockage is in a tube between
the CRS valve and the waste bag. Each of the lines
described above have fitting connections that can
be broken and the downstream side tested by inserting
a syringe and needle with test dye solution
(supplied) and flushing the line.
8 .3.2.3. Fluid Movement Test
If fluids do not move while the pump is activated,
then the pump must be turned off immediately. This
step is necessary to prevent electrode damage due
to line dead-heading. Check to ensure the valve is
in proper position, (CRS valve position 4 in the
fluid function test sequence). If the valve is not
in position, see section 8.3.2.1. Otherwise there
are two (2) possible reasons for lack of movement:
1 . Line blockage or air leaks. The purp may be
turned on for a brief period (10 sec.) to see
if air is leaking into the system at some point.
This can be checked by watching for extraneous
air bubbles downstream on the leak between

-162-
fluid scgnonts
Line blockages may be located by removing
the line fittings between components and
injecting dye solution (supplied). Line
blockage should be rare. Therefore, this
technique should be last in the test
sequence. If a tube is damaged, spare fluid
lines are located in the system sparos kit.
8.3.2.4. Test for Spurious Air Bubbles
The primary cause for extraneous air bubbles moving
in the lines is improperly tightened or threaded
fittings. There are many fluid line fittings.in the
fluid transport package. As a result, care must be
exercised on set-up and during component replacement
to properly thread and tighten each fitting. These fit-
tings are inert plastic materials that are soft and
can be easily cross threaded, or stripped. A cross
threaded fitting will leak air.
A second source for air leaks is around the lines
entering the CRS valve. A special technique was utilized
to form these joints. This technique requires that

-163-
the CRS valve be disassembled to repair a joint
failure because of the- valve construction. Care
must be used not to abuse the joints at the top
of the CRS valve. If it is determined that the
air leak is in a valve joint, then the CRS valve
assembly must be removed from the fluid transport
package to be disassembled and repaired.
Air may leak into the system within an electrode
module. If it is determined that an electrode
module is leaking air and that the fittings are
properly seated into the module, then the electrode
module should be replaced. (See section 8.3.1.4.)
8.3.2.5. ''A'' Standardizing Sequence Test
The "'A'' standard cycle is controlled by a three
(3) way solenoid activated diaphragm valve. During
the fluid test cycle (CRS valve position 4) air is
drawn into the holding coil as dyed sample is being
drawn out. When the "AIR'' valve is turned to ''ON''
the valve switches ''A'' standard into the holding
coil. ''A'' standard is a clear fluid so that the
fluid boundary must be seen moving through the CRS
line into the holding coil.

-164-
If the fluid cannot be seen moving into the holding coil then
a failure of the diaphragm valve or a leaking fitting is
indicated. The fluid connections should be checked for tightness.
If a valve failure is suspected, then the valve must be
replaced.
Lnal point at which ''A'' standard-can be restricted
aoving into the system is the fluid bag container. The
:y concern at this connection is that the connector needle
)e flowing. The needle connector may be removed from its
:tor union and air passed through to insure free flow.
r blockage may occur inside the bag fitting. The septum
:e may be extruded to a degree that the needle will not
rate it. In this case, the bag must be replaced. The
bag fiailure could occur if the siphon tube within the
)llapses or breaks its joint with the bag fitting. In
case, the bag will need replacement.
.6. ''B'' Standardizing Sequence Test
standard is a clear fluid that is always present at
ZS valve for switching to the electrodes.
3'' standard doesnnot move into the CRS valve, a line
ige or fluid container bag blockage has

-165-
occurred. Line blockage can be tested as previously
described (section 8.3.2.3.) using the test dye
solution.
A fluid container bag can be blocked at the needle,
in the fitting or in the bag. The needle connector
can be removed. If the needle orifice is clear, a
bag blockage has occurred and the standard bag must
be replaced. The replacement procedure is found in
section 9.3.1.1.
8 .3.2.7. Test of Septum Injection Port Clean-outSequence
The second function of ''B'' standard in the fluid
transport system is to clean the injection port of
samples inserted into the system. This procedure
ensures that sample cross contamin.atieon dces noZ
occur in the injection line.
During the fluid function check ''B'" standard should
move from the ''B'' fluid container bag, through the
'B'' manifold, throuqh the ''FLUSH'' valve, through
the inlet check valve, and into the injection port.
The fluid moves through the injection port and
exits through the sample inlet line to the CRS valve,

-166-
through the CRS valve to a multi-outlet manifold, and
through the pump to the waste bag.
Failure of the fluid to move in the line could be
the result of blockage in any of the above components.
The most critical of these is the CRS valve. If the
valve is shown to be properly positioned it can be
eliminated from concern. The diaphragm valve is
generally not a source of failure.
Check the septum injection port cap to ensure that
the cap is tightened.
A less probable cause for no fluid flow could be
failure of the inlet check valve. The check valve is
simply designed and highly reliable. Should replace-
ment be necessary the septum injection port will have
to be removed from the fluid package.
Lack of fluid movement in other components is most
often caused by line blockage. The dye sample
injection procedure described previously should be
used to locate these line blockages.

-167-
8.3.2.8. Test of Reagent Addition Line
Acid reagent is added to the sample stream of the
Ca++/Cl" electrode module in the mixer assembly.
Test for fluid flow in this line can be accomplished
by injecting an air slug into the sample holding
coil and running a normal sequence. In this test,
the observer should see alternate air and fluid
slugs exiting the top of the mixer assembly on the
way to the Ca++/Cl" electrode module.
If no fluid is seen in this test a line blockage
has occured either in the mixer or in the reagent
container bag.
8 .3.2.9. Pump Tubing Failure
The pump tubing should have a life in excess of 3000
system cycles. If a line is seen to be leaking
around its cassette or onto the pump base, the pump
should be turned off. Replacement of the ten (10)
pump lines has been described in detail in section
8.3.1.3., ''Pump Tube Replacement.''. Refer to this
section for proper routing of the pump tubes.

-168-
8.3.3. Electronics Servicing
Testing and troubleshooting of the A.P.E.A.S. electronics
are facilitated by special test hardware and soft-
ware.provided. A test box which may be substituted
for the fluid transport unit will speed E/U out-
put circuit testing and fault isolation. Manual
function switches on the E/U allow positive control
when troubleshooting in the F/T. A software system
controller, which operates from the 8/E switch register,
permits manual testing of the computer interface and
related circuitry.
Due to the complexity of this system, troubleshooting
must be done by fault localization using the above
facilities. No attempt is made in this section to
diagnose specific malfunctions. As a servicing aid,
all schematic diagrams are fully annotated with
descriptions of circuit functions, voltages, wave-
forms, test points, component layouts, and calibra-
tion procedures. Virtually all printed circuit
boards and integrated circuits are plug in replace-
able. P.C. extender boards are provided for circuit
measurements.

-169-
8.3.3.1 Areas of Malfunction - the following guide
will help in localizing system problems:
Nature of Problem Probable Causes
1. No system response No line.power, 8/E circuit
when turned on breaker off, blown fuse(E/U,
8/E, or teletype)
2. Program will not load Loader not in core, loader
not started, teletype or -
reader off, incorrect pro-
cedure, computer malfunction
3. Program loads but will Teletype off, Incorrect
not run (no initial procedure, program dcstroyed
dialogue) by improper starting address.
4. E/U not initialized Incorrect switch settings,
as specified--program incorrect cable conn.,E/U or
running (see operator) interface fault, system clock
not operating.
5. System runs but not Damaged program from in-
correctly. correct loading or modifica-
tion, general fault(requires
more testing).

-170-
Once it is certain a hardware problem exists, it
must be localized to one unit. Begin by disconnect-
ing the computer cables to 'R'' and ''S'' at the
E/U. Connect the cables together using the D.E.C.
jumper block provided. Load and run the DRB-E/A
interface diagnostic (MAINDEC - 08 - DHDRA - A -PB)
using the D. E. C. instructions provideJd. If this test
fails, contact Digital Equipmont Corporation field srvicc.
If the diagnostic runs properly, the trouble is most
likely in the E/U of F/T.
The next step is to check all power supply voltages
in the E/U. Observe the 115 volt cautions on the
power supply schematics! If the + 15 or +5 VDC supplies
are in error by more than 5% they should be completely
checked. The allowed limits for the + 24 VDC are +20
to t26 V.; for 410 VDC, -8 to -12 v. (remember that
the -10 v. is TRIAC bias, and is connected to the low
side of the AC line.) Disconnect F/T and remove
P.C. boards B thru H when servicing the supplies.
Test loads may be applied via the E/U test box except
for the ADC 1 15 v.
Note: If a malfunction is observed that appears re-
lated to a small circuit area, the technician may
elect to skip the above steps. If the fault is not
subsequently located, they must be performed.

-171-
Using the E/U manual control switches, operate each
device in the F/T. If incorrect response is observed,
substitute the E/U test box for the F/T. Checking
the amplifiers and ADC requires a precision voltage
source (such as an analogic AN23100). When applying
potentials to the amplifiers, observe the following
precautions:
a. Do not exceed 5 v. input
b. Do not connect guards (shields) together
c. Provide a connection between either input and
analog ground to prevent excessive common mode
voltage.
If a malfunction appears to be located in the tempera-
ture control circuitry, proceed cautiously. Check
the measurement circuit first, and avoid making ad-
justments to the calibration controls until the
fault is located. (Note: the temperature measuring
circuit works only with the No.8 amplifier.)
8.3.3.2. Electronics Unit Servicing
Once the problem is localized to the E/U, a special
software controller should be employed. Assuming
that the computer, computor interface, and E/U
power supplies are functioning properly; Icad and
start the Orion Switch Register Controller (see the

-172-
end of this section for operating details). Refering
to the control tables on the multiplexer and expander
board schematics, operate all functions of the system
from the computer. (All E/U control switches should
be set for automatic operation.) Check I.C. logic
levels and control voltages as required to locate
the bad components.
8.3.3.3. Computer Software Problems
Every attempt has been made to fully test software
systems supplied by Orion. If a program bug is
suspected, please contact the Orion Engineering
Department for assistance.
8.3.3.4. Switch Register Controller
This test software allows complete manual control
of the E/U and F/T from the computer switch rcgister.
All data returned to the computer is displayed in
the 8/E accumulator.
8.3.5. Operation of the Switch Register Controller
8.3.5.1. Preliminary
1. Load this program in either memory field

-173-
2. Load the appropriate memory field.
3. Load address 200, clear switch register, and
start program..
8.3.5.2. Output to E/U - (see expander BD; schematic-
No. 700864)
1. Select the desired output byte using bits 0,1,2.
2. Set the expanded data desired using bits 8,9,10,11.
3. Momentarily raise bit 3 to strobe output to the
E/U expander buffer.
NOTE: The strobe (bit 3) may be left up for con-
tinuous update but any changes to the byte
control will instantly update all addressed
bytes with the same data.
4. Direct bits 4,5,6,7, may be operated at any time,
without regard to byte code or the strobe.
8.3.5.3. Input to E/U - (see multiplex BD. schematic-
No. 700862)
1. Be certain the 8/E display is set for ''AC'"
2. The display normally shows input bits. It may
be altered by typing a control letter as follows:
''0'' = display output
"P' 9 = display interrupt accumulator
'I'' = return to input disolay

-174-
(For most testing the input mode is used.)
3. Select the desired byte, using bits 0,1,2,and
observe the inputs on the 8/E.
NOTE: Pulse inputs are processed by a "'software
one-shot'' in order to be visible. The
bit 3 switch must be down to avoid altering
the output.
4. Display bits 0,1,2,3 are direct, and indepen-
dent of byte code.

-175-
8.3 Electronics unit board layout
B OARD L .D.No. 70CO4 COA*IP. iAREGULATOR ACO:7MNo 00 7 ONFRNT 0
Go
0
FOA
po " aBOARD J BDNO. NO, 8750 CcM2TO6A0 2 OT 0PO/ER SCHF NO. 700 925 OA FRONT o
,OA,:D H aD. NO. 700268 COMPO N.TSECLODK SCHEM /O 7009;4 ON FROT ,
B OAHD G B D. No. 0oo 9 0/ COMPONEN.T3]CONTROL SCHEM NO. 70 9n0 ON F.RONTJ
BOAiRD F 8D. NO. 700 o 9 COMPONE;V T3CLOCK CIHEM NO. 7 8 7 O FCRY oi7
BoAID P 89. No. /7007 6 -9 COPEDI&ITAL MP)<' SCHE/ NO. 7 ON FROvT
8047JY1 RD. No. .00 8 / Co/i4PONEN7sSWITCH .5CtFM. N(). 700 892. ON FRO.VT"
BOARD C CO5,9 .7;3T -
ADC SCHEt,.1, t oc7 94, ON F, .-.T
8OAD BD. NO. 700'?O DISPLAY7DISPLAY .$C,/EM No. 700o97 FRONTJ

-176-
CIIAPTER IX
SUMMARY AND SUGGELTIO2S
9 .1 Summary:
It should be emphasized that the system described in
this report represents a hardware demonstration of the
feasibility of employing chemical sensing electrode
technology for the determination of various clinical
parameters under weightless conditions.
A flight-hardened version of the system described by
this report would appear to be well suited for operation
under space flight conditions. Some of the major advan-
tages of this approach over previously available in-
strumentation for the determination fo blood gases and
electrolytes are:
1 . Compactness - provisions for analysis of as many as
8 parameters can be included in as little as 1 cubic
foot of space.
2 . Ease of operation - the system restandardizes auto-
matically on every sample cycle, eliminating the
necessity for constant operator manipulation of sensi-
tivity and slope controls. Under normal operating

-177-
conditions, the operator is only required to inject
the 3ample and to push the ''START'' button to
complete an analysis cycle.
3. Self-contained - all reagents and waste containers
are incorporated into the system, eliminating the
need for external plumbing.
4. Reagent requirements - in the current system, only
two reagent and two standard containers are required
for the determination of 7 parameters. Also, no
flammable gases are needed for the electrolyte
determinations.
5. Ruggedness - sensors are incorporated into epoxy
blocks to provide the necessary mechanical support and
to minimize plumbing connections.
6. Serviceability =- expendable items, such as liquid
membrane electrode internals and fluids containers
employ snap-in muodules w.ith leak-frcc connectors and
solid intcrnal rc-E:rcnces to prevent fluid leaks.
7. Flexibility - the utility fo this approach is not
limite-d to thc paranictCrs sclcctcd for inclusion in

-178-
the existing system (i.e., pH, pCO2 , C1l, Na+, K+,
Ca Ionized' and Ca Total"
For example, one could measure urea with an ammonia
electrode and an enzyme cartridge of immobilized
urease. Other important parameters, such as glucose
and oxygen, could be included in a similar manner.
These and other options would allow tailoring a
system to NASA's anticipated requirements.
9 .2. Suggestions:
The purpose of this section is to point out some of
the modifications that we feel would be necessary to
fabricate a flight-approved version of the existing
hardware.
9 .2.1. Electrode and Chemistry Modifications:
Neither the chemical approaches nor the basic electrolyte
designs would require more than minor modifications
for flight hardware. One possible exception to this is
the pCO2 electrode which employs a rather fragile pH
sensor. There are several viable approaches to this
problem, but time limitations did not allow evaluation
and incorporation of any of these into the current
system.

-179-
9.2.2. Mechanical and Materials Modifications:
The primary materials employed for fabrication of the
existing system are aluminum, stainless steel, silicone,
rubber, teflon, epoxy, and flame retardent urethane.
The system neither evolves flammable gases or uses
corrosive reagents.
Some possible modifications are listed below:
1. Both internal and external structural design should
be evaluated with respect to launch and recovery
stresses.
2. Fluidic sensors for aqueous vapor or fluid loss
within the unit could be incorporated for leak detection.
3. All electromechanical components should be optimized
for minimum power consumption.
4 . The fluid unit could be redesigned for single plane
access to all electrical and mechanical components.
5. All plumbing, with the exception of pump tubes, could
be accomplished by teflon I.D. coated stainless steel
tubing.

6 . The unit can be readily shielded from electromag-
netic interference.
9 .3.3. Electronics Modifications:
Major electronic design changes would be necessary
for space flight operation of the system. The current
system employs a dedicated controller and telctypowriter..
for system operation. This is not the most efficient
flight configuration for the system, but it is the
most flexible system for ground evaluation and testing.
Specific suggestions for each electronics section follow.
9 .3.3.1. Fluid Transport Electronics Modifications
1 . Convert fan, pump, and main valve motors to suitable
frequency (presumably 400 Hz).
2. Evaluate the mixer for 400 Hz operation.
3 . Reduce amplifier performance for lower impedance
electrodes, to simplify circuitry.
4. Consider multiplexing with reed or F.E.T. switches
prior to amplification, to reduce the number of
amplifiers.

5. Modify heater control based on available voltage
and power.
6 . Modify the physical configuration to withstand
appropriate shock and vibration.
7 . Make all electrical connections waterproof.
9 .3.3.2. Electronics Unit Modifications:
1. Complete redesign to provide the appropriate inter-
face with a telemetery link or on-board computer.
2 . Design a fixed program dedicated hardware controller
to relieve data processor of control functions. In
emergency situations, this allow the system to
be operated without interface to any other
equipment.
3 . Remove all manual controls and other functions used
for system servicing. These should be packaged
separately for use by ground-based technicians as
required. The service module is envisioned as a
plug-in test device.
4. Review all circuitry for space flight suitability.
This will include: power requirements, RFI and EMI,

thermal dissipation, 'ambient temperature,
packaging limitations, shock and vibration, ser-
viceability, and operating modes.
9.3.3.4. Controller MciicatiolS
1 . Interface modification will be required for the
on-board computer to be used. A serial data transfer
approach will probably be more suitable.
9.3.3.5 Controller So.ftwarc Modifications
1 . Software sould be simplified to a data reduction
routine only. All system sequencing would be done
by a dedicated hardware controller.
2. System status and output data checks should be
added to certify validity of analysis results.