final report on the mnes sponsored project advanced
TRANSCRIPT

Final report on the MNES sponsored project
Advanced Biomass Gasification
2000-2004
PARTICIPATING INSTITUTIONS
IISc Bangalore (Principal agency) BHEL Trichy IICT Hyderabad IIT Madras Chennai
Combustion Gasification & Propulsion Lab Department of Aerospace Engineering
Indian Institute of Science Bangalore 560 012

2
Table of Contents
Executive Summary ....................................................................................................... 4 Background .................................................................................................................... 7
International scenario and relevance to India ............................................................ 8 The Indian approach vs. international approach ........................................................ 8 Details of the Project .................................................................................................. 9
Part – I .......................................................................................................................... 11 Indian Institute of Science ............................................................................................ 11 Chapter 1 ...................................................................................................................... 11
Preliminary studies................................................................................................... 11 Design and Construction of High pressure gasifier ................................................. 12 Constructional details ............................................................................................... 13
The reactor ........................................................................................................... 13 The cyclone .......................................................................................................... 17 The indirect cooler ............................................................................................... 17 The direct cooler .................................................................................................. 19 The chilled water scrubbing system ..................................................................... 19 The burner ............................................................................................................ 20 The support Structure ........................................................................................... 20 The ducting .......................................................................................................... 20
Chapter 2 ...................................................................................................................... 21 Testing and Assembly of components ......................................................................... 21
Pressure testing of the components .......................................................................... 21 Assembly of individual components ........................................................................ 21 Instrumentation ........................................................................................................ 22 Control Panel ........................................................................................................... 23
Chapter 3 ...................................................................................................................... 25 Testing the system at high pressure without lock hopper mechanism ......................... 25
Design of choked nozzles ........................................................................................ 25 Testing...................................................................................................................... 25
Start-up and shut-down procedure ....................................................................... 25 Change-over to High pressure mode: .................................................................. 26 Biomass loading: .................................................................................................. 26 Shut-down procedure ........................................................................................... 26
Experiments with gasification at 2.0 bar pressure ................................................... 27 Experiments with gasification at 4 bar without lock hopper ................................... 29 Testing of System at high Pressure with lock hopper mechanism ........................... 31
Start-up and shut-down procedure ....................................................................... 31 Shut-down procedure ........................................................................................... 32
Tests with woodchips at 4 bar pressure ................................................................... 32 Chapter 4 ...................................................................................................................... 36 Testing with Briquettes ................................................................................................ 36
Testing of the system with briquettes at 3 bar pressure ........................................... 36 Bagasse + Coffee husk briquette testing .............................................................. 36 Sawdust briquette testing ..................................................................................... 38
Summary of gasifier operations ............................................................................... 38 Chapter 5 ...................................................................................................................... 39 Testing of Gas Turbine ................................................................................................ 39
Testing of gas turbine with ATF .............................................................................. 39

3
Chapter 6 ...................................................................................................................... 44 Producer gas as the fuel for gas turbine ....................................................................... 44
Testing of gas turbine combustor with producer gas ........................................... 44 Numerical computation of flow in the combustor ................................................... 52 Grid generation ........................................................................................................ 52
Geometry construction ......................................................................................... 52 Mesh seeding and generation ............................................................................... 52
Solution procedure ................................................................................................... 53 Setup .................................................................................................................... 53 Boundary Conditions ........................................................................................... 54 Turbulence model ................................................................................................ 54
The computational results ............................................................................................ 54 Chapter 7 ...................................................................................................................... 57 Gas turbine testing with producer gas .......................................................................... 57
Results and Discussions of gas turbine operation .................................................... 63 Operation with ATF ................................................................................................. 63 Operation with Producer gas .................................................................................... 63
Chapter 8 ...................................................................................................................... 65 Integration of the hardware from Partnering institutions ............................................. 65
Performance of feed and ash lock hopper of BHEL. Trichy ................................... 65 Simulation studies of high pressure filter supplied by BHEL, Trichy ..................... 67 Performance of Feed Lock hopper of IICT .............................................................. 69
Chapter 9…………………………………………………………………………… 72 Larger systems and Techno-Economic evaluation Chapter 10……………………………………………………………………………75 Final Summary Part II BHEL Report IITM Report IICT Report

4
Executive Summary
This project is concerned with the developmental studies involving a high pressure biomass gasifier and a micro turbine. Four major research institutions were involved in generating the indigenous know-how in the area of Integrated Gasification Combined cycle (IGCC) using biomass as the feedstock with the following mandate for each of the institutions. (1) Indian Institute of Science (IISc) had the overall responsibility to design, build and test the gasifier system along with gas turbine. The reactor and a part of the ash extraction were required to be built by IISc. The gasification system was set to handle 75 kg/hr biomass and a working pressure of 5 bar. (2) Bharat Heavy Electricals Limited (BHEL), Trichy was to supply the biomass feeding, ash handling and high pressure ceramic filter. (3) Indian Institute of Chemical Technology (IICT), Hyderabad was to supply the biomass feed system. This strategy was to try out two different concepts for feed and ash extraction systems. (4) Indian Institute of Technology (IIT), Chennai was to conduct experiments using a variety of agro fuels on a small scale reactor and generate relevant information pertaining to gasification at higher pressures. A 75-kg/hr biomass gasification system was designed and built to operate at 5 bar pressure. The system comprised a reactor, gas cooling and cleaning sub-system, start-up burner and main burner. All the above elements qualified the high pressure hydraulic and pneumatic testing in accordance with the standards. The reactor was fitted with lock hopper type feed system and ash handling system supplied by BHEL. For the gas cleaning system, some of the concepts already available with the ambient pressure gasifier system were employed as a part of this design. The gasifier system was qualified for leakage according to BS standards and later on a series of tests were conducted in burner mode at pressures of 2.4 and 4.0 bar using wood and agro briquettes. All relevant data pertaining to gasifier performance were recorded and analyzed. The gas composition with wood was found to be marginally better in terms of methane content compared to ambient pressure gasifier. The entire system operation was integrated and sequenced to operate using an industrial class PLC with provision for data logging and report generation. Procurement of the gas turbine was done with considerable difficulty. Most major gas turbine manufacturers showed no interest in supplying even a standard system to enable subsequent modification at our end. After considerable search, a Rover airborne auxiliary power plant rated 32 kWe working on Aviation Turbine Fuel (ATF) was procured from UK for this project. The engine is basically of low pressure ratio (of 3) and without a recuperator leading to a very low overall efficiency at 3% with ATF as the fuel. This gas turbine was to be adopted to run with producer gas fuel. It was decided to use the same overall hardware, but only change the injector into a gas injector by accounting for the combustion of producer gas at a lean mixture ratio. To establish the ignition and combustion limits with producer gas, an

5
experimental set-up was specially designed and built. Furthermore, to understand the flow dynamics in the combustor, numerical simulations were conducted on the combustor chamber geometry using a commercial code CFX TASCflow. These computations simulating cold flow conditions were made in order to understand the flow structure in the combustion chamber and to determine the distribution of fuel in the flame tube for determining whether the conditions of mixing are favorable for ignition near the spark plug. These numerical studies and experiments at ambient conditions helped in choosing the right configuration for the gas injector for producer gas fuel. Tests on gas turbine using producer gas were found to be satisfactory and the maximum load applied was 11.6 kWe at an overall efficiency of 3%. Further loading was restricted on the account of limitation on the gasifier throughput capacity. Further, the biomass feeding system based on knife edge valve designed supplied by IICT, Hyderabad was integrated with the gasifier and tests were successfully conducted. On the whole, the high pressure gasifier was tested in burner configuration for about 75 hours at operating pressures ranging from 2 to 4 bar using biomass such as wood, briquettes of sawdust, bagasse and coffee husk. The integrated operation of high pressure gasifier with gas turbine was conducted more than ten times with longest duration of testing being 2 hours. The producer gas quality in terms of particulate and tar content was comparable (less than 1 mg/Nm3) to what has been achieved in the ambient pressure gasifier design of IISc. At the time this report was written a conference paper has appeared in which two companies in UK [Biomass Engineering Ltd. Newton-le-Willows, Warrington, UK with its web site at http://www.biomass-uk.com/ and Conversion and Resource Evaluation Ltd., Holywood, Northern Ireland, (http://www.care.demon.co.uk) have conducted an experimental study using Capstone micro-turbine with an operational strategy different from the one adopted here. An atmospheric pressure gas turbine was used with the clean producer gas compressed to a pressure required at the combustor entry of the gas turbine. This strategy is simpler but draws away power for the compressor; it is harsh on the system that generally produces small power, but draws away a part of that, typically 20 to 25 % in compressing the gas. This strategy brings down the efficiency on delivered basis very significantly. In the above backdrop, calculations were made to determine the performance and techno-economic capacity of large size plants since the aim of the current project was to facilitate the design of large scale systems (~ 5 – 6 MWe) for sugar and rice husk based industries. These show that unless the basic gas turbine efficiency is high – whether in recuperated mode or open mode more generally, it is difficult to expect that this option is superior to atmospheric gasifier – gas engine route for power generation. This techno-economic assessment is consistent with a recent study reported by Biomass Engineering Ltd. Newton-le-Willows, Warrington, UK and Conversion and Resource Evaluation Ltd., Holywood, Northern Ireland. Summarizing, the development of high pressure gasifier and integration with the gas turbine has been successful. The knowledge base in the area of the design and construction of the high pressure gasifier has been generated. Similarly the intricacies involved in the design of gas injector for gas turbine application has been understood. The know-how that has been generated by this work should pave way in realizing an

6
indigenous and large scale IGCC plant, if and when such a project gets undertaken. The principal contribution of this work is that India has acquired the capability to build high pressure gasifiers for biomass and also design a power station for running gas turbines based on producer gas from biomass.

7
Background
The Ministry of Non-conventional Energy Sources (MNES) has been promoting power generation through biomass conversion technologies such as briquetting, combustion, co-generation and gasification. In the year 1998, power group of the ministry received proposals from various industries requesting support for setting up power generation units of 6 to 10 MWe capacity with the bio-feed stock consisting partly of residues like Juliflora Prosopis (and others), and bagasse. In order to examine these proposals and the more basic questions concerning the technologies, the power group constituted an expert group attended by 26 scientists, industrialists and users on 17th June 1998. Several issues were raised at this meeting particularly for power generation at large power levels. In order to take up several of the questions that were raised at this meeting, a taskforce was constituted for the formulation of national program on advanced biomass gasification. Amongst the terms of reference of this task force, the important ones were:
a. To assess and identify need-based preparatory steps for development and commercial exploitation of advanced gasification technology in the country.
b. To assess and analyze the various technology option and recommend technology-specific R&D and pilot projects to bridge the gaps in technology development and commercialization.
The issues brought up were focused around large power level IGCC class of technologies. The IGCC technology involves gasifying the biomass in a suitable high pressure gasifier, burning the product gas in a gas turbine combustor to generate gas turbine electric power and further generating steam from gas turbine exhaust to run a Rankine cycle based steam power plant. The combined cycle (Brayton and Rankine cycles) scheme has the potential of achieving the overall plant efficiency of 40 to 45%. This technology was under development in other countries in that period. It was therefore decided to examine the international scenario and extract any possible indicators for our development. One of the important issues addressed was the possible clientele group which would be interested in industrializing the technology in our country. It was clear that those who have captive biomass should be the most ideal since procurement of biomass on large scale from several sources would be a more serious task on whose accomplishment there should be assurance before taking up the technology implementation. The two candidate groups are those of sugar production and rice milling. Bagasse and sugarcane tops and leaves as well as trash are one set of candidate fuels and rice husk and possibly rice straw the other set. Since these fuels get into the form of residues at moisture content up to 50%, certainly in the case of bagasse but lower amounts in the case of rice husk, drying the fuels is one important element in the fuel preparation process. If the technology of bio-residue conversion calls for multi-fuel option, then one should bring the fuels into the same form – either pulverized or briquetted. Hence it was concluded that any technology development must at least account for these features. Drying technology and further fuel preparation for use for power generation as well the technology for power generation itself are distinct elements in the chain. The present work addresses the second one as

8
it is substantive by itself and needs intricate knowledge of thermo-chemical conversion processes of bio-residues and considerable international competition is involved in it.
International scenario and relevance to India Pioneering work on pressurized gasification of biomass has been done in USA, Finland and Sweden by leading research institutes such as Institute of Gas Technology (IGT) [www.gastechnology.org], Chicago and Technical Research Institute (VTT) of Finland, Helsinki [www.vtt.fi]. At the industry level, leading firms in the combustion, steam generation and gas turbine fields have made efforts in commercializing this technology. World-wide gasification research has been mainly carried out by Batelle (USA), Lurgi (Germany), OSC (UK). Lurgi and OSC have worked on a direct gasification technologies, whereas Batelle technology is based on steam gasification. Lurgi has a demonstration plant where they have conducted extensive trials on different types of coals. If one were to now ask a question as to whether one can source existing technologies of IGCC class from elsewhere, there does not seem to be any tested technologies for bagasse/rice husk. The only experiment going on at Hawaii on bagasse has been stopped due to lack of funding at a late stage in the program partly due to technological issues related to biomass feeding. Most other experiments have been with forest residues – wood chips. Therefore, it would be risky to try to source the technologies from overseas It was concluded in the discussions of the task force that it would be advisable to try out new elements one by one to reduce the risk of high level investments called for by these technologies.
The Indian approach vs. international approach The international approach on the technology is based on circulating fluidized bed concept. It is well-known that the product fuel gas from such a reactor has much more than acceptable amounts of tar and to reduce it one would need elaborate tar cracking systems. It would be desirable if the tar is cracked in the reactor itself. Such an approach is possible if one uses a downdraft fixed bed technology. The problem in this case would be the size of the reactor for high power levels. However, interest in India is not at too-high a power level (even if one has larger power level, one can split the generation into two such units, in the initial phase of development). Hence to capitalize on the governmental investments already made into the development of these technologies, such as that at IISc, a leap into high pressure gasification technology can be achieved by adding the high pressure feed and ash extraction systems. The latter two segments can be drawn from the experience acquired by BHEL and IICT. This approach is liable to reduce both the risk and time required for development.

9
Details of the Project The Advanced Biomass Gasification project was approved by MNES with involvement of four leading research institutions. As indicated earlier, IISc would take the responsibility for the design, fabrication, erection and commissioning of the reactor and integrate with other elements as well as developmental studies. The feed system and ash extraction systems would be developed and tested on a subsystem scale in their own laboratories at BHEL and IICT before shipment to IISc. IISc would also take responsibility to produce briquettes suitable for use in gasification systems. These would also be supplied to all the three institutions for trials – feed system and chemical and operational studies. The gasification system used is the downdraft reburn system developed already for ambient pressures at IISc over the last ten years. It is this development which gave confidence to progress into the high pressure regime. One straightforward way of using this development would be to compress the cool and clean gas in a separate compressor and use it in the combustion chamber of the gas turbine. Unless the gas turbine is designed specially for use of producer gas, something that is unlikely to happen for a long time, one needs to adopt gas turbines operating on natural gas. The air-to-gas ratio is so vastly different between that for natural gas (about 80 – 100) and producer gas (8 – 10) that one will loose about 10 to 30 % energy for compression in the case of producer gas if a gas turbine designed for natural gas is used to operate on producer gas in an open cycle mode. Avoidance of the compression energy can be achieved by adopting a high pressure gasifier. Since the design of high pressure system poses challenges absent in the use of ambient pressure system, the strategy that was chosen was to develop high pressure gasification system. In the normal operation of the high pressure system, air at a pressure of 5 bar from a compressor at a flow rate of 100 to 120 m3/hr would be passed though valves into a vertical cylindrical reactor of 400 mm internal diameter, about 4 m high. The top section of the reactor will have a feed system involving two air lock valves. Bioresidues, largely wood chips to start with, but with bagasse certainly and sugarcane tops and leaves later in the form of briquettes, approximately 30 to 70 mm size would be fed into the reactor periodically after assessing the throughput. The bottom of the reactor has ash extraction system designed to account for higher temperatures compared to the feed system. Keeping the reactor isolated at higher pressures and extracting of ash in powder form or lumps will be the technical requirement of this component. The gas that is drawn from the reactor will pass through heat exchangers for reducing the temperature from 750 to 800 °C to less than 250 °C, if possible indirectly without having to spray water into the high pressure gas before being taken through a hot gas filter to reduce the particulate content to less than the acceptable limit for the gas turbine engine (which is more tolerant on the dust character and level than a super charged reciprocating engine), because the gas goes into the combustion chamber before going to the turbine section. At the end of this section, the gas will be ready to be introduced into the gas turbine. Hence, the gas in this region will be characterized for composition, particulates and possibly tar. Tar is less concern compared to particulates because the gas enters the combustion chamber

10
of the gas turbine engine without having to go through valves like in a reciprocating engine. IIT, Chennai would conduct experiments in a small size gasifier to determine the suitability for high pressure gasification. IICT, Hyderabad would do the development of feed and ash extraction systems as well as conduct pilot studies on the characterization of the fuels. BHEL, Trichy has run high pressure systems for coal and therefore could be expected to deliver a robust system for the feed and ash extraction systems. During the initial development period the individual elements would be tested in respective laboratories before being shipped to IISc for integration. All teams would participate in the developmental and learning process and aid in reducing the risk in development.
11
Part – I Indian Institute of Science
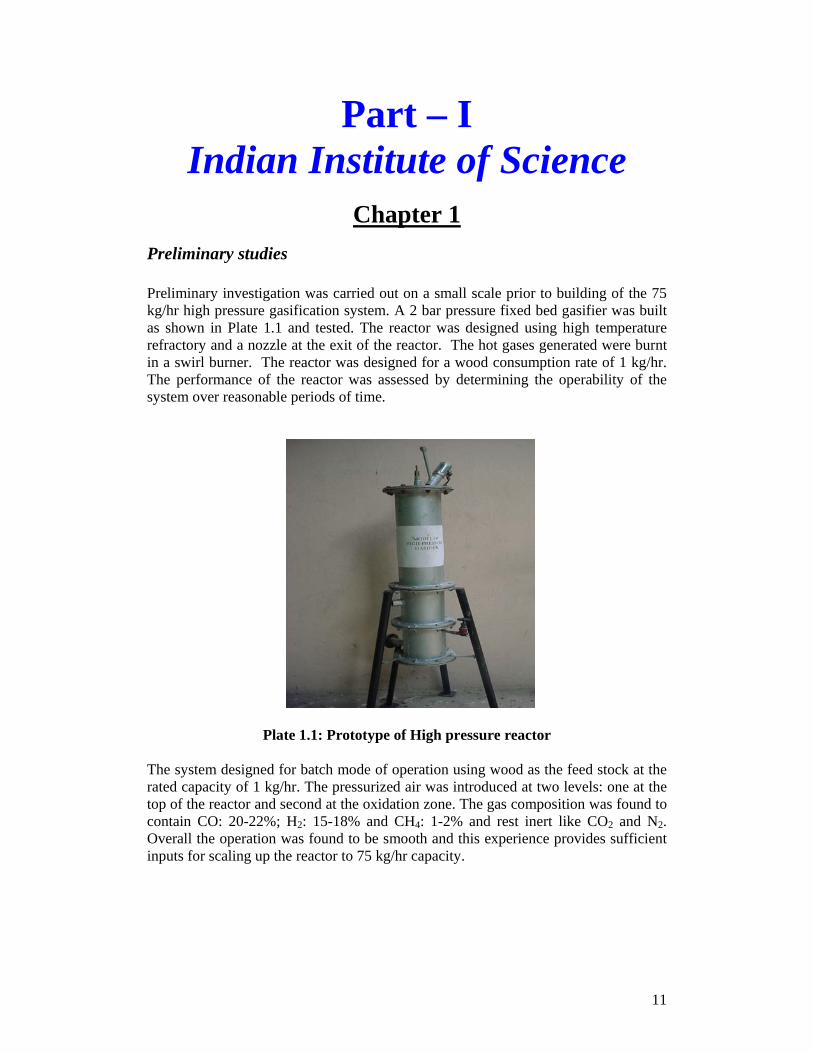
Chapter 1 Preliminary studies Preliminary investigation was carried out on a small scale prior to building of the 75 kg/hr high pressure gasification system. A 2 bar pressure fixed bed gasifier was built as shown in Plate 1.1 and tested. The reactor was designed using high temperature refractory and a nozzle at the exit of the reactor. The hot gases generated were burnt in a swirl burner. The reactor was designed for a wood consumption rate of 1 kg/hr. The performance of the reactor was assessed by determining the operability of the system over reasonable periods of time.
Plate 1.1: Prototype of High pressure reactor
The system designed for batch mode of operation using wood as the feed stock at the rated capacity of 1 kg/hr. The pressurized air was introduced at two levels: one at the top of the reactor and second at the oxidation zone. The gas composition was found to contain CO: 20-22%; H2: 15-18% and CH4: 1-2% and rest inert like CO2 and N2. Overall the operation was found to be smooth and this experience provides sufficient inputs for scaling up the reactor to 75 kg/hr capacity.

12
TO TURBINE
REACTORT2
T3T4T5
T1
P1
SCREWP2
P3
T7
T6
HEA
T EX
CH
AN
GER
T8
P4
COOLER DUMP-1 COOLER DUMP-2
SCRUBBER-1 SCRUBBER-2
PILOT VALVEMAIN VALVE
BURNER
T9
BIOMASS FEEDING LOCK HOPPER
PUMP-1 PUMP-2
Design and Construction of High pressure gasifier The specifications for the gasifier design were drawn from the fuel requirements for micro-turbine available commercially. The typical efficiencies achieved in this configuration were found to be in the range of 25 – 30 %. This amounts to a typical biomass consumption rate of 75 kg per hour for an out put of about 50 kW. The downdraft high pressure gasification system was designed for specific gasification rates similar to that of the ambient pressure down draft re-burn gasification system reported by Mukunda et. al (Open-Top wood gasifiers, Renewable Energy – Sources for fuels and Electricity, Island Press). The inner diameter of the system was accordingly 400 mm and height around 4000 mm (h/d = 10). The bottom portion is connected to a screw based ash extraction system. The gas exit connects to a cyclone which further leads to an indirect cooling system, a direct cooler cum scrubber and to burner. An arrangement for start-up is made in parallel using a separate blower and burner. The general arrangement of the system is shown in Figure 1.1.
Figure 1.1: The overall arrangement of the gasification system

13
Constructional details
The reactor The reactor is a cylindrical chamber with inner diameter of 400 mm and outer diameter of 1178 mm and length of 4000 mm as shown in Figure 1.2. The reactor has an outer carbon steel casing of 14 mm thickness and insulation constituted of one layer of Cold Face Insulation (CFI) and two layers of Hot Face Insulation (HFI) bricks. This is followed by an inner lining of high alumina (85% alumina) ceramic tile of 25 mm thickness. The top of the reactor has a flange of 400 mm inner diameter and a SS 304 cone to reduce from 400 mm to 200 mm to suit the feed lock hopper supplied by BHEL, Trichy. The bottom of the reactor opens into screw based ash extraction system for controlled extraction based on the ash content in the feed stock. The gas outlet is provided from the other end of the ash extraction system. The ash/char outlet is provided at the bottom in the same line as that of the gas exit. The bottom ash/char outlet is 150 mm diameter and is designed to suit the ash lock hopper provided by BHEL, Trichy. The reactor is instrumented to measure four wall temperatures at 50 mm inside of the ceramic lining and gas exit temperature and reactor pressure drop. A provision is also made in the ash conveying system for providing a burst diaphragm (rupture disk) as a safety device. The burst diaphragm is designed to open out at 6 bar pressure. The top and the air nozzles have provision for supply of high pressure air from the compressor. The ash extraction system has a 2400 mm length, 175 mm diameter and 200 mm pitch screw fitted in an outside carbon steel casing. The casing is made of 14 mm thick plate with reinforcement of 75 mm length and 16 mm thick plates. These reinforcements also aid heat transfer as the metal does not have insulation inside. Additional water spray on the surface is provided to keep the metal temperatures low and thereby avoid any metal deformation due to higher temperature. The screw is centered between two end flanges 22 mm thick. The flanges house the bearing for the screw which also has a cooling jacket. Beyond the bearing the screw shaft has a gland packing and pressure seal. This will ensure that there will be no leakage due to high pressure inside the reactor. One end of the shaft is connected to a 20 rpm, 1 hp geared motor. The details of the ash extraction system is shown in Figure 1.3 The reactor with ash extraction unit is shown in Plate 1.2.

14
Top Section
Reactor
Air Supply
Ash Extraction
System
Plate 1.2: Photograph of the reactor

15
Figure 1.2: The reactor details

16
Figure 1.3: Ash extraction system details

17
The cyclone The cyclone has been designed for entry velocity of 15 m/s corresponding to a gas flow rate of 56 g/s (equivalent of 75 kg/hr biomass gasified). This velocity corresponds to the designed operating pressure of 5 bar and ~1000 K temperature (the gas density works out to 1.4 kg/m3). For a high efficiency design, the inner diameter of the cyclone is 152 mm; the other details are shown in Figure 1.4. The cyclone also has an outer jacket for providing cooling water. The bottom of the cyclone has a lock hopper mechanism for removal of dust particles. The gas from cyclone is ducted to indirect cooler. The cyclone with lock hopper foe particulate collection is shown in Plate 1.3.
Plate 1.3 & Figure 1.4: Photograph of the cyclone with lock hopper arrangement and the details of the construction
The indirect cooler The indirect cooler was designed to be part of the circuit, to control the temperature before taking into the ceramic filter being supplied by BHEL. The indirect cooler is a shell and tube heat exchanger with gas flowing in the tube side and the cooling water in the shell side. This is a counter flow heat exchanger with hot gas entering from the top side and exiting in the bottom side and the cooling water vice-versa. The shell and tube heat exchanger has dished ends for gas entry and exit. The bottom dish also has a water drain mechanism with lock hopper facility. The construction of the indirect cooler is shown in Figure 1.5 and photograph in Plate 1.4.

18
Gas Inlet 600 °C
Gas exit 200 °C
Water 4 cu m/hr T °C
2000
Ø 300
350
350
100
100
Wat
er e
xit
T+5
°C12 nos Ø 25 tubes
HEAT-EXCHANGER
68
Ø 300
68
Ø31
96
Ø25
Plate 1.4 & Figure 1.5: The indirect cooler photograph and cross sectional details

19
The direct cooler The direct cooler is made of co-current direct contact scrubber with a sealed dump below having gas outlet and two water outlets. One of the water outlets is connected to a pump with a valve in suction and discharge side. In the suction mode of operation, the pump is used to maintain the water level in the dump. A level indicator provided helps in visual check of the water level. During the pressurized mode of operation, the other outlet is connected to an outside tank through a valve. The water is re-circulated using a high pressure pump (8 bar pressure). The gas duct is led to further chill scrubbing system. The photograph of the direct cooler is shown in a Plate 1.5.
Plate 1.5: The direct cooler
The chilled water scrubbing system This was a later addition to the system for obtaining high purity gas for gas turbine operation. The construction and working feature is similar to the direct cooler except that the water used is at 6o C. The breakthrough achieved in obtaining a high purity gas in another project of MNES, namely “Strategic Development of Bio-energy” (SDB) encouraged for this inclusion as gas turbine needs a clean gas with respect to particulate matter. The gas ducting beyond this is branched to burner side and gas turbine side. The chilled water scrubber is depicted in Plate 1.6.

20
Plate 1.6: Chill Water Scrubbing Unit
The burner Two swirl burners are provided, one for start-up and another for gas from pressurized mode. The two branches are isolated with valves. The start-up burner also has a blower for causing suction. The burner line for high pressure gas has a choked nozzle for 2 and 4 bar pressure and the gas is burnt in the burner at ambient pressure.
The support Structure The support structure has dual purpose, firstly to support the entire system and secondly to provide access to all the operational zones. A 4 tier support structure is provided for the reactor to approach at the ash extraction level, nozzle level, top flange level and lock hopper top level. The support structure at the first rung is extended sidewise to support the cyclone and indirect cooler.
The ducting The components were connected between each other using by suitable gas ducting. All the gas ducts were 75 mm schedule 40 SS pipes with ASA 150 lbs flanges in the ends.

21
Chapter 2 Testing and Assembly of components The operating conditions being high temperature and pressure, it was found essential that all the components are tested individually, before assembling them. This was achieved by using standard testing procedure. This chapter provides the details of the testing of the components and the entire assembly.
Pressure testing of the components The individual components were pressure tested as per BS 5500 standard. The gas exit duct from reactor, cyclone, indirect cooler and water dump were hydraulically tested and the reactor and entire assembly was pneumatically tested. The hydraulic testing was for conducted at 13 bar (around 2.5 times the designed pressure). The pressure build-up, hold and release were as per the BS standard. The pneumatic testing was done at 5 bar pressure.
Assembly of individual components After the pressure qualification, the components were assembled. A single feed valve with the bin, ash dump and bottom valve supplied by BHEL, Trichy was initially integrated. The reason for this being the valves had to be energized with 110 V AC supply and 25 V DC supply for feed back had to be specifically built. A few trials at 2 bar and 4 bar pressure were conducted to satisfy the working of all the elements before the control panel was built. For all joints, High Tension (HT) bolts were used and the tightened at 300 Nm torque using a torque wrench. The gasket between flanges were either Champion style 54 or Champion style 20 depending on whether the joint was subjected to high temperature or not. Provision for compressed air was made from the Ingersoll-Rand compressor with pressurized air line taken to an air receiver tank before supplying it to the reactor. The connection from air receiver tank to the reactor was made with two separate lines with individual control valves. The air distribution from the top and the air nozzles was to be proportioned around 60-70 : 40-30 range. This has been achieved by using suitable duct sizes and valves. A separate two stage compressor with a 100 lit air tank was provided with a pressure regulator and an industrial air dryer for supplying dry air for solenoid action of the pneumatic valves.

22
AIR TANK P= 4.5 bar
Water out
water in
SCRUBBER
Air
DETAILS OF INSTRUMENTATION POINTS GASIFICATION SYSTEM
Gas flow path
BIOMASS
for start-up
T4T3T2T1
P1
P2
Tre
Tce
Tie
P3
P4
GASS COMPOSITION
Tre = Temperature at reactor exitTce = Temperature at cyclone exitTie = Temperature at indirect cooler exit
Instrumentation The instrumentation scheme has been designed to have data displayed at two locations, one in the operating region and another in the control panel. The instrumentation consists of seven temperature measurements, 4 digital pressure measurements and four Bourdon gauge pressure measurement. The temperature measurements include four Reactor wall temperatures (T1 to T4), reactor gas exit temperature (T5), cyclone exit gas temperature (T6) and indirect cooler exit gas temperature (T7). The digital pressure measurements include Lock hopper feed vessel pressure (P1), Reactor exit pressure (P2), cyclone exit pressure (P3) and Indirect cooler pressure (P4). The Bourdon gauges were fitted to air receiver tank from compressor, one each on the air lines distributing air to top and side nozzles and one at the direct cooler dump. The instrumentation points are as in Fig. 2.1
Figure 2.1 Details of instrumentation points

23
Control Panel A control panel with motor starters for ash extraction motor, pumps for direct and indirect coolers and chill water scrubber, blower was built. The controls with 110 V AC was also provided from the panel for operating the lock hopper valves and pressurizing and de-pressurizing valves of both feed and ash lock hopper. The control panel also incorporated an Allan Bradley PLC system having a CPU, mother board, an eight channel analog card and 128 digital I/O’s. The analog channels directly read the pressure and oxygen concentration while the motor controls and feed back was connected to Digital I/O. The single line diagram for the control panel is shown in Figure 2.2. The photograph of the control panel is shown in Plate 2.1.
Figure 2.2: Single line diagram of control panel

24
Plate 2.1: Photograph of the control panel

25
Chapter 3 Testing the system at high pressure without lock hopper mechanism In order to establish the system performance, two stage testing was planned. In the first phase the entire gasification system with cooling and cleaning system was tested without the lock hopper mechanism. The fuel feeding was in batch mode.
Design of choked nozzles In order to have pressurized condition inside the gasifier to simulate the operations for the gas turbine, a nozzle had to be fitted near the burner, during the flare mode of testing. Thus a choked nozzle was designed for the operating conditions. Two operating conditions were chosen, one at a low pressure of about 2.5 bar for initial testing in the flare mode and the other at 4 bar to simulate the gas turbine operating condition. The critical pressure ratio at γ = 1.4 is 0.528; hence the critical pressure for an upstream pressure of 4 bar is 2.11 bar. Hence the flow is choked. Similarly for 2.5 bar upstream pressure, the critical pressure is 1.32 bar, which is also choked. For a mass flux of 0.052 kg/s, the nozzle diameters are 8.5 and 11.2 mm for 4 bar and 2.5 bar pressures respectively. These nozzles were fabricated and installed upstream of the burner for achieving gasification at the required pressure.
Testing Initially to understand the system operation at high pressure the system was operated without lock hopper. The reactor had a valve and biomass bin on top of this valve. The system was pressurized by closing the valve and run at ambient pressure by opening the valve. The start-up and shut-down procedure is as under.
Start-up and shut-down procedure The start-up procedure (Refer to Figure 1.1) at ambient pressure mode is as follows:
1. Keep the top valve and air nozzle in open condition. 2. Open the gas valve in the blower side and keep the gas valve near the choked
nozzle side closed. 3. Switch on the indirect and direct cooler water pumps. 4. Switch the pump connected to direct cooler water dump to maintain the water
level. 5. Switch ON the blower. 6. Ignite the air nozzles in suction mode. 7. Measure the oxygen content in the gas. 8. Once the oxygen content falls less than 2.0 %, ignite the gas in the flame. 9. Keep topping the biomass based on the consumption.

26
Change-over to High pressure mode: Once the gasifier is stabilized in the ambient pressure mode, the gasifier can be changed over to high pressure mode with the following sequence:
1) Start the air compressor and fill the air receiver at required pressure. 2) Switch OFF the blower and close the gas valve in the blower side, open the
gas valve in the choked nozzle side. 3) Close the nozzle and the top valve. 4) Switch OFF the pump connected to water dump and close the valve in the
suction side. Open the other valve for the water to be re-circulated under pressure.
5) Gradually open the control valves of the air lines providing pressurized air to reactor top and nozzles.
6) The pressure and flow rate achieved is dictated by the choice of the choked nozzle.
Biomass loading: The biomass has to be loaded periodically during the operation of the gasifier. The biomass loading sequence is as under:
1. The pressurizing air is cut off by closing both the air valves in the air lines. 2. The system is allowed to gradually de-pressurize. 3. The top valve is opened and the blower switched on by closing the gas valve
on nozzle side and opening the gas valve at blower side. 4. The system works in suction mode. 5. The reactor top is open for loading. 6. The system is changed back to pressure mode as discussed above.
The ash extraction is intended to be done into a closed bin which is to be unloaded only after system shut-down. Due to this limitation only wood was used in initial tests as only 1% of the total feed had to be removed at the bottom.
Shut-down procedure For shutting down the system, the following procedure is adopted:
1. The pressurized air line is closed so that there is no fresh air for reaction to proceed.
2. The top valve and air nozzle are continued to be closed. 3. The system takes around 5-8 minutes for attaining atmospheric pressure. 4. Once this happens, all the pumps and valves are closed.

27
Experiments with gasification at 2.0 bar pressure As a part of test procedure, it was decided to operate the system with air at 2.0 bar pressure for which, the choking nozzle of 11.2 mm diameter was fixed. The reactor was loaded with charcoal to 1 m above air nozzle and the remaining was filled with wood chips of size around 25 mm x 25 mm x 60 mm. The system was started initially in the suction mode with blower on. The top valve and air nozzles were kept open and through air nozzles, the charcoal bed was fired. The system was stabilized in blower mode for an hour, then air nozzles, top valve and blower valve was closed and air at 2.3 bar pressure was supplied to the reactor. The system achieved an operating of 2.0 bar and operations was found to be smooth. System pressure, temperatures, gas composition and biomass consumption was recorded. For loading of biomass once every 40 min, the system was switched to suction mode, the top valve opened and biomass loaded. The system after biomass loading was pressurized. Figure 3.1 indicates the gas temperature at various locations in the system with time for a typical run at 2.0 bar pressure (refer to Figure 2.1 for measurement point locations). The reactor exit temperature is found gradually increasing with time. The indirect cooler exit temperature has been found less than 50 C. Gas composition during the run indicates an average composition with 20% H2, 18% CO and 8% CO2 at an average biomass consumption rate of 50 kg/hr. The gas composition with time is depicted in Figure 3.2. The average biomass consumption was around 27 kg/hr. This is shown in Figure 3.3.
Figure 3.1: Reactor temperature variation at 2.0 bar air pressure.
0
50
100
150
200
250
300
0 10 20 30 40 50 60 70 80 90Time (minute)
Tem
pera
ture
(0 C)
T4
T3
T 2T1

28
Figure 3.2: Gas composition Variation at 2.0 bar air pressure.
Figure 3.3: Biomass consumption at 2.0 bar air pressure
Biomass Comsumption at 2.0 bar air pressure
0 10 20 30 40
60 70 80
0 20 40 60 80 100 120 140 160 180Time (minute)
Average biomass consumption 27 kg/hr
Cum
ulat
ive
Bio
mas
s C
onsu
mpt
ion
(kg)
50
0
5
10
15
20
25
0 20 40 60 80 100 120 140 160Time (minute)
CO
H2
CO2
Gas
Com
posi
tion
Vol (
%)

29
Experiments with gasification at 4 bar without lock hopper After testing at 2.0 bar pressure, the system was operated at 4.0 bar with nozzle of 8.5 mm diameter. The system operation was similar to the earlier one and system behaved smoothly at this pressure also. The typical gas composition was CO – 20%, H2 – 15%, CH4 – 2.0%, CO2 – 12.5% and rest nitrogen. The gas composition is shown in Figure 3.4. There is an increasing trend seen in the gas composition and if the experiments were conducted further, better gas composition could have been recorded. To enable the continuous operation, feed lock hopper and ash lock hopper was to be integrated. This has been subsequently done and the reported later. The gas temperature from reactor exit and at other locations is shown in Figure 3.5. The average biomass consumption was 42 kg/hr and is shown in Figure 3.6.
Figure 3.4: Gas composition at 4.0 bar pressure (without lock hopper)
Gas Composition Variation at 4.0 bar air pressure
0
5
10
15
20
25
30
0 20 40 60 80 100 120 140 160
Time (minute)
Gas
Com
posi
tion
(% V
ol)
CO
CH4
H2CO2
O2

30
Figure 3.5: Gas Temperature at various locations (Without lock hopper)
Figure 3.6: Biomass consumption with time (without lock hopper)
Temperature Variation at 4.0 bar air pressure
0
50
100
150
200
250
300
0 20 40 60 80 100 120 140 160Time in minutes
Tem
pera
ture
in C Reactor exit
Cyclone exit
Indirect cooler exit
High pressure gasifier run at 4 bar on 18/02/02
0 20 40 60 80
100 120 140 160 180
0 20 40 60 80 100 120Time (minute)
Bio
mas
s lo
aded
(kg)
Average biomass consumption 42 kg/hr

31
Testing of System at high Pressure with lock hopper mechanism Based on the operational experience gained from the above operations, the control panel was build and integrated. The lock hopper mechanism for feed and ash extraction was fully integrated with the necessary pneumatic connections and feed back. The start-up and shut-down procedure is as below.
Start-up and shut-down procedure The start-up procedure is as follows:
1. Keep the top lock hopper valves and air nozzle in open condition. 2. Open the valve in the blower side and keep the valve near the choked nozzle
side closed. 3. Switch on the indirect and direct cooler water pumps. 4. Switch the pump connected to direct cooler water dump to maintain the water
level. 5. Switch ON the blower. 6. Ignite the air nozzles in suction mode. 7. Measure the oxygen content in the gas. 8. Once the oxygen content falls less than 2.0 %, ignite the gas in the flame. 9. Keep topping the biomass based on the consumption.
Changing to High pressure mode: Once the gasifier is stabilized in the ambient pressure mode, the gasifier can be changed over to high pressure mode with the following sequence:
1. Start the air compressor and fill the air receiver at required pressure. 2. Switch OFF the blower and close the valve in the blower side, open the valve
in the choked nozzle side. 3. Close the nozzle and the bottom lock hopper valve. 4. Switch OFF the pump connected to water dump and close the valve in the
suction side. Open the other valve for the water to be re-circulated under pressure.
5. Switch ON the pump of the chill water scrubber for re-circulation in pressure mode.
6. Gradually open the control valves of the air lines providing pressurized air to reactor top and nozzles.
7. The pressure and flow rate achieved is dictated by the choice of the choked nozzle.
Biomass loading in pressurized mode: The biomass has to be loaded periodically during the operation of the gasifier. The biomass loading sequence is as under:
1. The bottom lock hopper valve is kept closed to isolate the high pressure environment from the reactor.
2. The top lock hopper valve is opened and the biomass is fed into the feed vessel.

32
3. The top lock hopper valve is closed. 4. The pressurizing valve is open and the depressurizing valve is kept closed.
The feed vessel pressure is increased to reactor pressure. 5. The bottom lock hopper valve is opened and the biomass is allowed to flow
into the reactor. 6. After some time when the biomass from feed vessel is emptied, the bottom
lock hopper valve is closed. 7. The depressurizing valve is open and the pressure inside is vented out. 8. The top lock hopper valve is opened and the cycle repeats.
The ash extraction is also done in the similar way.
Shut-down procedure For shutting down the system, the following procedure is adopted:
1. The pressurized air line is closed so that there is no fresh air foe reaction to proceed.
2. The bottom lock hopper valve and air nozzle are continued to be closed. 3. The system takes around 5-8 minutes for attaining atmospheric pressure. 4. Once this happens, all the pumps and valves are closed.
Tests with woodchips at 4 bar pressure Several tests were made to ensure gas quality, ease of operation and to test gas turbine in few cases. Before testing the gas turbine with producer gas a chill water scrubber was introduced after the direct cooler in order to enhance the cleanliness of the gas. The following Figures show the test results in a few cases. The summary of all the tests are provided in Table 3.1. The lock hopper mechanism helped in the continuous operations of the gasifier. This resulted in achieving higher temperatures and better gas composition. The Figure 3.7 shows the wall temperature data of a test result with wood chips as biomass. The system has been run in ambient pressure mode before change over and hence the wall temperatures start at 300 – 350 0C. The gas temperature plot in Figure 3.8 shows the indirect cooler does a good job to limit the gas temperature to less than 80 0C (T9). The gas composition plot is shown in Figure 3.9. The biomass consumption in this particular test averaged to 45 kg/hr and is shown in Figure 3.10.

33
Figure 3.7: Wall temperature plot with time at 4.0 bar (with lock hopper)
Gas Temperature at 4 bar pressure
0
50
100
150
200
250
300
0 50 100 150 200 250 300Time (minute)
Tem
pera
ture
(0 C)
T7
T8
Figure 3.8: Gas temperature plot with time at 4.0 bar (with lock hopper)
Reactor temperature at 4 bar pressure
050
100150200250300350400450500
0 50 100 150 200 250 300Time (minute)
Tem
pera
ture
( 0
C)
T 2
T3
T4
T5

34
Gas Composition at 4 bar pressure
0
5
10
15
20
25
0 50 100 150 200 250 300Time (minute)
Gas
com
posi
tion
Vol(%
)
COCO2
CH4
O2
H2
Figure 3.9: Gas composition plot with time at 4.0 bar (with lock hopper)
Biomass Consumption at 4 bar pressure
0
20
40
60
80
100
120
140
160
180
200
0 50 100 150 200 250 300Time (minute)
Bio
mm
ass
load
ed (k
g)
Average biomass consumption 45 kg/hr
Figure 3.10: Biomass consumption with time at 4.0 bar (with lock hopper)

35
Table 3.1 Summary of the test runs
Date Pr., Bar
Mean gas composition, %, CH4 ~ 1 – 1.5 % in all cases
CO H2 CO2
Operation hours
Purpose of Run/problems noted
11/1/02 2.0 20.0 21.0 10.0 2 Start up
15/1/02 1.7 NM 2 MNES Review
18/2/02 4.0 20.0 14.0 11.0 2 Rated pressure operation
19/2/02 4.0 11.6 14.5 16.0 2 Repeat operation
9/9/02 4.0 18.0 15.0 10.0 2 Check Lock hopper and PLC panel connections
16/4/03 3.5 NM 4 Biomass Lock hopper valve stuck
30/4/03 4.0 11.0 20.0 19.0 3 Gas turbine on producer gas; ignition problem noted
22/5/03 2.8 12.0 15.0 21.0 2 Combustor testing
26/5/03 2.5 15.0 15.0 20.0 1.5 Combustor testing
28/5/03 3.3 13.0 19.0 16.0 1.5 Combustor testing
7/7/03 3.3 NM 1
16/7/03 3.5 15.0 19.0. 17.0 5.5 Combustor testing
17/7/03 3.2 16.0 18.0 15.0. 2.5 Gas turbine run in producer gas up to 10 kWe
4/11/03 3.0 NM 1.5
6/11/03 3.2 NM 2 MNES Review
9/12/03 3.5 17.0 14.0 15.0. 2 Gas turbine run in producer gas at no load
12/12/03 3.0 14.0 16.0 15.0. 2.5 International Round Table meet
29/7/04 3.0 NM 3 To test IICT lock hopper
2/8/04 3.0 16.0 18.0 15.0. 2 To test IICT lock hopper

36
Chapter 4
Testing with Briquettes As one of the major objectives of the project was to use briquettes as the fuel, the gasifier was tested using various briquettes. The briquettes that were prepared in the laboratory as well as available commercially were used as the fuel. The briquettes were analyzed for the ash content.
Testing of the system with briquettes at 3 bar pressure The gasifier was tested with briquettes of coffee husk, Bagasse and saw dust briquettes. The coffee husk and bagasse briquette was prepared in rotary briquetting machine in 30:70 proportions. The briquettes have a diameter of 25 mm and are sized to less than 40 mm length. The sized bagasse briquettes have a bulk density of 600 kg/m3. The briquettes have an ash content of 13%. The saw dust briquettes were made out of Ram type briquetting machine with 50 mm diameter and length sized less than 25 mm. The sized saw dust briquettes have a bulk density of 630 kg/m3. The saw dust briquettes have an ash content of 5%. Plate 4.1 gives photos of bagasse and coffee husk briquettes prepared in rotary briquette machine and saw dust briquette prepared in ram type machine. The details of the tests are as under:
Bagasse + Coffee husk briquette testing The gasification system was started in suction mode and run for four hours with 200 kg of briquettes loaded before changing over to pressure mode. This was to ensure that the remaining woody biomass from earlier run is flushed out and the reactor is filled with briquettes and char from briquettes. The system was operated for 3 hours at 3 bar pressure and around 200 kgs of biomass loaded amounting to an average hourly consumption of 67 kg. The gas composition is shown in figure 4.1and biomass loading in figure 4.2.
Plate 4.1: Photos of few briquettes used in tests

37
Gas Composition at 3 bar coffee husk + Bagasse briqettes
0
5
10
15
20
25
30
35
0:00 1:12 2:24 3:36 4:48 6:00 7:12Time
Gas
com
posi
tion
Vol %
CO CO2
CH
H2
Figure 4.1: Gas composition with time for Coffee husk + Bagasse briquettes
Bagasse+ coffee husk briquettes loading, Pressure = 3 bar, 2/1/04
0
50
100
150
200
250
2:00 2:21 2:43 3:04 3:26 3:48 4:09 4:31 4:52 5:14 5:36 5:57Time
Cum
mul
ativ
e lo
adin
g (k
g)
Figure 4.2: Coffee husk + Bagasse briquettes loading with time
The operation was smooth but the composition varied as the flame started to propagate to the top due to dryness of fuel and ash extraction less than the requirement. The system had to be stopped due to flame propagating upwards and the

38
reactor top flange becoming hot. This was subsequently reasoned to be due to inadequate extraction of char/ash thereby leading to the above problem.
Sawdust briquette testing Like in the earlier case the system was started in suction mode and system operated for one and a half hour and composition recorded, the biomass movement posed a problem, the ash extraction screw got jammed and hence the system was shut down. The system was allowed to cool down and the screw rotated in forward and reverse direction for a few time to remove the jam. The screw started operating freely. The next day the system was operated in suction mode for two hours using the briquettes and changed over to pressure mode was made. The total saw dust briquettes loaded in pressure mode is around 120 kg. Figure 4.3 shows the gas composition with sawdust briquettes.
Gas composition with saw dust at 3 bar pressure on 6/1/04
0
5
10
15
20
25
0:30 0:44 0:58 1:13 1:27 1:42 1:56 2:10 2:25Time
Gas
com
posi
tion
Vol (
%)
CO
CO2
H2
CH4
Figure 4.3: Gas composition with sawdust briquettes
Summary of gasifier operations The gasifier was operated between 2.5 to 4 bar at various pressure bar pressure and various flow rates and various fuels. Table 3.1 summarizes various runs with average gas composition recorded at that pressure.

39
Chapter 5
Testing of Gas Turbine
The basic objective of the project was to test a micro-turbine with the gasifier; attempts were made to procure micro-turbines available commercially. The basic specifications laid out for the gas turbine were that it should have fuel-electricity efficiency of 25 to 30 % comparable to what one would obtain from reciprocating engines operating on fossil fuels – liquid or gas. Most gas turbines at small power level could be expected to have low operating pressure ratio, the primary reason being that higher pressure ratio will imply much smaller passages that pose difficulty in fabrication and the frictional losses would be significant. This implies that the efficiencies of fuel-to-electricity would be smaller since the efficiency is directly related to the operating pressure ratio. Improving the operating efficiency is performed by including recuperation. In this procedure, the exhaust stream transfers heat to the compressed air through a compact high pressure heat exchanger that operates at temperatures up to 600oC. This heated air enters the combustion chamber and reduces the fuel demanded to raise the fluid temperature required for the operation of the gas turbine. One of the serious issues of this procedure is the life of the recuperator. The questions of life would be relevant, of course, after the basic performance is established. Hence, it was decided to look for a gas turbine operating in recuperator mode to take advantage of the high efficiency and thus, ensure that the gasifier can be made to operate at 75 to 80 kg/hr and meet the initial expectations of tests with delivered power level of 70 to 75 kWe. Many manufacturers were explored. Ultimately, orders placed on M/s Elliot and M/s Honeywell. They backed out six months after the order was accepted. It was then decided to look for a gas turbine operating on open cycle so that the core engine performance could be established. After considerable exploration, midway through the project, Rover air borne auxiliary power-pack of 32 kWe capacity operating on Aviation Turbine Fuel (ATF) was procured. This gas turbine unfortunately, operates on a non-recuperative mode. This was to be adopted to run in producer gas mode. The key issue in the entire integration process is combustion of producer gas at a lean mixture ratio. Firstly, the gas turbine had to be characterized for the performance using the ATF. This was carried out by operating the gas turbine at varying load conditions and measuring key parameters. The following section provides the details of the gas turbine and the performance of the turbine with ATF.
Testing of gas turbine with ATF Working Principle The Rover airborne auxiliary power plant MK. 10301 is a part of aircraft meant for providing electricity for internal use and providing air bleed for vent suits. The engine consists of a single-sided centrifugal compressor driven by a single stage axial turbine mounted on a common shaft and supported in two bearings. Air is admitted from the

40
underside of the power plant and ducted to the compressor rotor where it is compressed and passed to a single, reverse-flow, combustion chamber. Fuel is injected from a spill type burner and the resultant mixture initially ignited by an igniter plug fitted in the side of the combustion chamber. Above approximately 13000 rpm which is termed the self sustaining speed, ignition is self-supporting. Combustion gases pass from the chamber downwards through a volute to a fixed nozzle ring assembly that directs them against the blades of the turbine rotor. The combustion gases are than exhausted to atmosphere via exhaust cone, cylinder assembly and outlet duct. Specifications
Engine Rating 32 kWe at ambient air up to 45 0C. Air bleed at 45 g/s at sea level conditions
AC generator 40 kVA, 3 phase, 208 V, 400 HZ at 8000 rpm.
Compressor Single stage Centrifugal
Air mass flow 657 g/s at sea level conditions
Pressure ratio 3.2 at sea level conditions
Combustion chamber Single can, reverse flow spill type burner
Turbine Single stage, axial flow
Fuel consumption (max) 11.8 g/s
Liquid fuel system A fuel control unit provides automatic control for starting and maximum speed. The unit consists of a twin fuel pump, containing separate metering and recirculating pumps, a temperature control and an over-speed governor. In addition the system has an air/fuel ratio control, a combined metering and pressurizing unit and a fuel pressure transmitter. The supply to the pump is taken from a low pressure filter mounted on the exterior of the front panel.

41
Indicators and controls on the control and instrumentation panel
Oil pressure This indicates engine oil pressure
P2 pressure This indicates compressor air delivery pressure
RPM This indicates engine speed as a percentage of maximum rpm (Max rpm – 47000)
Exhaust gas temperature This indicates exhaust gas temperature in C.
Oil temperature This indicates oil temperature in the engine sump
Generator output voltage This indicates alternator output voltage
Starting and stopping the Gas turbine Fuel connection is made, a 24 V supply is connected to the starter, which when depressed starts air pump and ignition is switched on to set the sparking. On reaching 20% rpm, HP fuel cock is put on and the fuel starts burning. The starter and ignition is cut off once the rpm reaches 40%. The engine continues to accelerate till it reaches 100% rpm. Shutting down the engine is by cutting of the fuel supply by turning OFF HP fuel cock. Loading the alternator The output of the alternator is connected to a resistor load bank with provision of increasing or decreasing the load by suitably cutting in/out banks of resistances. Performance testing with liquid fuel The gas turbine was tested with the ATF to establish the performance parameter with the liquid fuel. The fuel consumption was measured at various loads. The turbine could be loaded to about 18 kW. The specific fuel consumption was found to be about 2 kg/kWh, amounting to about 5 % efficiency. Figure 5.1, shows the plot of fuel consumed in the gas turbine with load. Also shown is the fuel consumption in a diesel engine of 20 kW capacity, indicating the SFC is about 0.4 kg/kWh, resulting in a efficiency of about 25 %, about 5 times as that of the gas turbine. The low efficiency of gas turbine is due to the low pressure ratio and no recuperation. At 20% of the rated speed, separate measurements were conducted by cranking the engine. The fuel flow rate was found to be 11.8 kg/hr (14.8 l/hr). The Figure 5.2 shows the exhaust temperature of the turbine at various loads and Figure 5.3, the SFC. The Figure 5.4 shows the P2 pressure (compressor outlet pressure) with load.

42
Comparison of Fuel consumption for gasturbine using ATF and Reciprocating engine using Diesel
0
5
10
15
20
25
30
35
40
0 5 10 15 20 25
Load
Fuel
con
sum
ptio
n, k
g/hr
Gas turbine using ATF
20 kWe RB 33 Diesel Engine
Figure 5.1: ATF consumption at various loads on Gas turbine. Also shown for
comparison, the fuel consumption of a 20 kWe diesel engine at comparable loads
Figure 5.2: Exhaust temperature of the turbine at various loads
Exhaust temperature with load using ATF fuel
480
500
520
540
560
580
600
0 2 4 6 8 10 12 14 16 18 20Load (kW)
Exh
aust
Tem
pera
ture
(
0 C)

43
Figure 5.3: SFC of gas turbine with ATF
Figure 5.4: P2 pressure with load
SFC of gas turbine using ATF
0.0
2.0
4.0
6.0
8.0
10.0
12.0
14.0
0 2 4 6 8 10 12 14 16 18
Load
SFC
(kg/
kWhr
)
Load vs Compressor outlet pressure (P 2)
1.4
1.42
1.44
1.46
1.48
1.5
1.52
0 5 10 15 20Load (kWe)
P2
(bar
)

44
Chapter 6 Producer gas as the fuel for gas turbine It was necessary to evaluate the turbine combustor for the producer gas, a fuel different from that of the designated liquid fuel, it was. The critical requirements are related to the air-to-fuel ratio, ignition under these conditions, flame stability over the range of operating conditions and establish the inlet operating conditions for the turbine. In order to achieve the above features, a two stage approach was used. Initially, the combustor was tested at ambient conditions for various operating conditions and later, the same was tested at high pressure. After satisfactory performance, it was tried on the gas turbine. To establish the ignition and combustion limits separate experiments were designed at atmospheric pressure. The details of the experiments with turbine using liquid fuel and producer gas combustor are presented in the sections to follow.
Testing of gas turbine combustor with producer gas The high pressure gasifier is rated for 75 kg/hr of biomass consumption and the maximum gas generation will be 52 g/s. The A/F ratios in the gas turbine will turn out to be around 10 – 12 (52 g/s of gas and 650 g/s of air). Hence, the combustor was to be qualified outside for such mixture ratios. The observations were to be made regarding:
1. The ignition of producer gas using the ignition system meant for liquid fuels – This is important as the gas turbine has a high energy ignition unit which is well integrated with the system and any further changes calls for modifications.
2. Flame stability at various mixture ratios – This is important to ensure that flame blow off does not take place.
3. Average exit gas temperature. 4. Maximum skin temperature of the combustor body – This determines whether
there is any local burning or hot spots.
In order to utilize the existing combustor and ignition system, a gas injector in place of liquid fuel injection system was to be built. The injector should have a diffusing cone inside the combustion chamber to deflect the gas towards the wall in order to have ignitable mixture near the spark plug. To accommodate in the existing envelop and maximize the gas flow path, the injector was built as depicted in Figure 6.1. Two cones of diameter 34 mm and 45 mm were built to evaluate the ignitable limits of the mixture as shown in Figure 6.2.

45
Figure 6.1: Assembled view of Small Cone Assembled view of large cone

46
Figure 6.2: General View of assembled gas injector

47
Figure 6.3: Air shroud used in combustor testing

48
Test Set up A 75 kg/hr atmospheric pressure gasification system was used for the testing purposes. A twin stage blower of 12000 Pa pressure was used to overcome the injector pressure drop of the combustor. The air to combustor arranged was with a 5000 m3/hr and 1500 Pa blower connected with a shroud to the flame tube. The air shroud is shown in Figure 6.3. However, it was possible to push a maximum of 30 g/s into the combustor. The test setup is shown in Figure 6.4.
REACTOR
ASH EXTRACTION CASING
CYCLONE
COOLER
PILOT BURNER
COMBUSTORSPARK PLUG
SCRUBBER
COOLER DUMP
BLOWER
VENTURIMETER
AIR BLOWER
HOT WIRE ANEMOMETER
Figure 6.4: Test set up for testing the combustor with atmospheric pressure gasifier
Testing procedure The gasifier is started and gas ignited in the pilot burner. After half an hour of run in this mode, the gasifier would be stabilized and routed to the gas turbine combustor. To run the combustor, initially air blower is put ON and the air flow rate is stabilized. Air velocity measurements are done using hot wire anemometer, from the air velocity, air flow rate is calculated. The spark plug is energized with 24 V DC through battery and spark will be created inside the combustor. The gas is let into the combustor and suitable air and fuel adjustments are made for ignition. Later, the air and fuel are varied and various parameters as mentioned earlier are measured. The tests were conducted with small cone and large cone. Results of combustor testing at ambient pressure Figures 6.5 & 6.6 show the plot of A/F ratio with respect to the total mass flow in the combustor for two different deflectors. Each point indicates various operating conditions for the combustor. It is clear from Figure 6.5 that beyond A/F of 5 the ignition of the mixture could not take place in the case of small cone deflector. In the case of large cone deflector shown in Figure 6.6, the ignition was reasonably assured till A/F of 10. The flame was stable for A/F up to 10. Beyond this, the testing could not be continued due to system limitation. Using large deflector, the ignition occurred

49
sometimes at higher A/F ratios and some times not. The non ignition at higher A/F is attributed to gas composition. However, with both the nozzles, the ignitable mixture ratio was found to be 5. It was decided to try the gas turbine with larger deflector.
Figure 6.5: A/F and total mass flow for establishing the ignition condition in the
turbine combustor for a small cone deflector.
A/F vs Total Mass Flow g/s
0
50
100
150
200
250
0 2 4 6 8 10 12 14A/F
Tota
l Mas
s Fl
ow g
/s
NOT IGNITEDIGNITED
SmallCone

50
A/F Vs Total Mass FLow
0
50
100
150
200
250
0 2 4 6 8 10 12A/F
Tota
l Mas
s Fl
ow ra
te g
/sLarge Cone
Ignited Not Ignited
Figure 6.6: A/F and total mass flow for establishing the ignition condition in the
turbine combustor for large cone deflector.
A/F vs Mean Temperature
0
100
200
300
400
500
600
700
0 2 4 6 8 10A/F
Tmea
n (0 C
)
Figure 6.7: A/F and mean exhaust temperature of the turbine combustor for a small cone deflector (green points) and large cone deflector (red points) Figure 6.7 shows the variation of the mean exhaust temperature with A/F for the two deflectors. In general, with increase in A/F the mean temperature is found reducing. Some variations are the result of gas composition changes. A/F in the range of 5 – 8 has an exhaust temperature between 773 K and 673 K for large cone deflector.

51
Total MAss Flow Vs Max Surface Temperature
0
20
40
60
80
100
120
140
0 50 100 150 200 250 300TMF
Max
.Sur
face
Tem
p (0 C
)
SMALL CONE
LARGE
Figure 6.8: Total mass flow and surface temperature of the turbine combustor
for a small cone deflector and large cone deflector Figure 6.8 shows the variation of surface temperature measured on the combustor with the total mass flow in the combustor. The maximum temperature is about 400 K in the case of large deflector. The surface temperature in the case of the large deflector is higher compared with the small deflector as the gas moves towards the wall compared with that of the small deflector. Since the large cone deflector showed better behavior,it was to be used for testing in gas turbine.

52
Numerical computation of flow in the combustor
The flow in the combustor was computed using a commercial code CFX TASCflow. These computations were made in order to understand the flow structure in the combustion chamber and to determine the distribution of fuel in the fame tube for getting an idea of mixing of gas and air and whether the conditions are favorable for ignition near spark plug. The computations were made for cold flow only. The computations were made using hexahedral meshes taking the flame tube geometry into account. A shear stress transport model was used for turbulence closure.
Grid generation
Geometry construction CFX-4 BUILD front-end for geometry generation was used to build the geometry from the available drawings. The geometry was seen to display seven-fold symmetry about the axis. Thus the geometry was first constructed as a set of two-dimensional surfaces. This assembly was then rotated about an axis slightly displaced from the geometric axis to produce the required geometry for meshing. This was done deliberately to avoid non-quadrilateral surfaces attached to the axis that would otherwise have been formed. This is required as the mesh generator can generate structured meshes only on quadrilateral surfaces. The final geometry before meshing is shown in Figure 6.9.
Mesh seeding and generation This geometry was then seeded along the axial, radial and azimuthal directions. One-way and two-way biases in the seeding were given to ensure smooth variations of inter-nodal distance throughout the geometry. This is necessary as difficulty in convergence is observed if the inter-nodal distance varies very rapidly. Even so, some difficulty in convergence was observed during the solution process. This was reduced by making the seeding finer and reducing the bias.
Figure 6.9: The Geometric model (built using CFX Build 4,4)

53
The mesh generation in CFX-4 Build is a two - step process comprising of an initial interactive surface meshing step and a final non-interactive volume meshing step. The surface mesh default edge length was set at a very large value to prevent it from taking precedence over the mesh seeding. The final surface mesh that was generated is shown in Figure 6.10.
Figure 6.10: The surface mesh generated
Solution procedure
Setup
The grid generated in the previous chapter was imported into CFX-TASCflow for running the simulation. The entire domain was divided into fluid and CHT (Conjugate Heat Transfer) solid regions in the regions of the mesh where the combustor wall was present. The Shear Stress Transport turbulence model (SSTM) was used. Upwind differencing was used for discretization the governing equations. Physical advection correction for the species transport equation was enabled. The solver was allowed to run until the maximum residuals had reduced by atleast four orders of magnitude. Some difficulty was observed in the convergence when the solution process was started using the SSTM from the start. Therefore convergence was first obtained using the k-ε model. This was then used as an initial guess for the solution with the SSTM.

54
Boundary Conditions The boundary conditions that were imposed were as follows. The total pressures of fuel and air at injection were both fixed at 101325 Pa. The inlet mass flow was specified at the fuel inlet and air inlet respectively. Subsonic exit conditions with a backpressure of 101325 Pa were specified. All the simulations were run at a static temperature of 306 K. The above values were chosen to correspond with experimental conditions. A uniform velocity, temperature and pressure as also initial species mass-fraction values were specified as an initial guess for the solution with the k-ε model.
Turbulence model As stated earlier the shear stress transport model was used. A turbulence intensity of 5% was chosen. Initially the k-ε model was used to generate an initial guess solution which was then used with the SST model. The SST model is a blend of the free shear k-ε model valid away from walls and the k-ε model which is valid in regions close to walls. This model has been known to provide accurate boundary layer separation prediction. This is necessary in this situation due to the expected structure of the combustion chamber flow comprising two recirculation zones to be described later. The model however makes the problem stiff and therefore the k-ε model was used to arrive at a good initial guess for use with the SST model, from the initial arbitrary guess values. Once a converged solution was obtained, it was then used as an initial guess for the remaining cases. The computational results Figure 6.11 shows computed results in terms of streak lines in the combustor around the fuel injector and the spark plug. The color coding is shown in the figure itself. The pink color represents the regions where the fuel air ratio is in excess of 1.5 and the blue color indicates pure air. This flow pattern corresponds to fuel flow rate of 45 g/s and air flow rate of 260 g/s. The fuel air ratio near the wall is close to about 0.65, not far from stoichiometric mixture ratio. The stoichiometric producer gas air ratio is about 0.83. The flow structure can be clearly visualized from this Figure. There is a recirculation zone behind the cone and between the wall and the centre. The fuel is concentrated near the central line and the mixture becomes leaner towards the flame tube wall. This Figure does not show he complete combustor, but only the region near the injector and the spark plug. The overall mixture in this region is rich, and is diluted further downstream.
Figure 6.12 shows the flow pattern in the combustor at a different operating condition. In this case the fuel flow rate is 19.2 g/s and the air flow rate is 145 g/s. As can be seen from the figure, almost no fuel reaches the spark plug. The fluid near the flame tube wall is comprised entirely of air. The fuel is concentrated near the centre of the combustor. Since no fuel reaches the combustor, ignition would not be achieved in this case. These results give the conditions under which ignition is possible and also to physical insight into the processes inside the combustor.

55
Figure 6.11: The streak lines of flow in the combustor. The color coding is with fuel to air ratio. Fuel flow rate = 45 g/s, air flow rate = 260 g/s – Ignition possible
(large cone diffuser)

56
Figure 6.12: The streak lines of flow in the combustor. The color coding is with fuel to air ratio. Fuel flow rate = 45 g/s, air flow rate = 260 g/s – Ignition not
possible (lower diameter diffuser cone)

57
Chapter 7 Gas turbine testing with producer gas The gas turbine combustor was changed to the one tested for producer gas along with the gas injector. The gas connections from high pressure gasifier were made with a control valve for regulating the gas flow. The system was tested with the following sequence of operations:
1. The gasifier was started and operated at 4 bar pressure for 2 hours. 2. The gas turbine was cranked with ignition being made ON. 3. The gas was diverted to the turbine. 4. The system was able to accelerate up to 30% of the rated speed beyond which
the operation was not sustainable. The turbine should reach at least 40% of the rated speed for self sustenance.
5. The gas did ignite which made the turbine to accelerate as compared to 20% of the rated speed in cranking mode. However, this could not be sustained. The turbine used to slowly decelerate once the cranking motor is stopped.
To understand the above behavior, it was decided to test the combustor outside with gas from high pressure gasifier. It was also found necessary to measure gas flow rate to know the ignitable mixtures. Also, the effectiveness of cooling was to be improved as there was some moisture carry-over in the duct leading to the gas turbine. Hence, it was decided to introduce a chill cooler in the gas path and also an orifice meter to measure gas flow rates. Orifice meter An orifice meter for the requisite flow was designed and fabricated. The details of this are shown in Figure 7.1. The orifice plate was calibrated at ambient pressure and density corrections to be applied at higher pressures. The details of calibration are shown in Figure 7.2.

58
Orifice calibration y = 1.9128xR2 = 0.9934
0
5
10
15
20
25
30
35
40
0 5 10 15 20 25
Sqrt H
flow
rat
e (g
/s)
Figure 7.1: Calibration data of orifice plate
Figure 7.2: Details of Orifice plate The arrangement was completed and integrated with the high pressure gasifier for combustor testing. During the test it was found that the flame after ignition used to blow off. This was attributed to non uniform mixing of air and fuel. The straight walls of the cone were breaking the axial momentum of the gas and created a high pressure fuel rich zone below the deflector. The air could not be entrained and non-mixing of fuel and air led to non-ignition and blow outs. Hence it was decided to modify the cone design to allow for better mixing of air and gas. The cones with a smooth contour with and without flutes cut were tried with the high pressure gas and the

59
combustor. The smooth contoured small and large cone deflectors have been shown in the Figure 7.3. The smooth contour large cone deflector without flutes cut resulted in stable flame over large A/F ratios. This was integrated into the gas turbine combustion chamber and operated on producer gas. The results of gas turbine run in producer gas mode are shown in Table 7.1.
Figure 7.3: Modified Cones tested

60
Load (kWe)
Absolute Pr, Bar
Gas Flow rate, g/s
Air flow Rate, g/s
A/F Oil temp, 0C
Exhaust gas temp, 0C
% rpm P2, Bar
7.89 4 109.9 650 5.91 451 96 1.7
10.10 4 94.1 650 6.90 477 98 1.7
7.89 4.3 115.4 650 5.63 120 464 97 1.7
11.43 4.3 116.1 650 5.60 470 96 1.7
Table 7.1: Results of testing of gas turbine with producer gas
Plates 7.1 – 7.5 show the gas turbine parts and test facilities.
Plate 7.1: The front panel of the gas turbine

61
Plate 7.2: The exhaust gas temperature of turbine in producer gas mode
Plate7.3: CGPL team during gas turbine testing

62
Plate 7.4: Gas composition as shown by the analyzer during gas turbine operation
Plate 7.5: The gas turbine adapted to run on producer gas mode (The flexible
pipe is for high pressure to combustor)
gas connection

63
Results and Discussions of gas turbine operation
Operation with ATF
The results are shown in the discussion on gas turbine run with liquid fuel, as can be seen; the compressor pressure remains constant at 1.5 bar independent of the load. The pressure is gauge pressure and hence the pressure ratio across the combustor is 2.5. The efficiency of ideal Brayton cycle is (T2 – T0)/T2, where T2 is the compressor exit temperature and T0 the air inlet temperature. Hence for a compressor pressure ratio of 2.5, the ideal cycle efficiency is 23 %. The observed efficiency at a load of 17 kW is 4.3 %. As seen from SFC graph (Figure 5.3), the specific fuel consumption decreases as the load is increased, but this increase from 17 to 32 kW is not likely to be large as the SFC curve has become nearly flat at 17 kW itself. According to specifications, the maximum fuel consumption is 42.6 kg/hr at full load of 32 kW. This gives a SFC of 1.33 kg/kWh. Hence at this load the overall efficiency would be 6.4 %. Since the cycle efficiency is 23 %, the other losses at full load would be about 72%. This loss includes the compressor and turbine losses, incomplete combustion losses, friction loss and the losses in the generator.
Operation with Producer gas
The results of the gas turbine operation in producer gas are shown in Table 7.2 below. During the run the gas composition was monitored and was found to be consistent and indicated earlier. Further, the gas quality was checked by using the wet method to ensure clean gas is drawn into the turbine. The engine was cranked using producer gas and allowed to attain the rated speed. The engine was gradually loaded at the rated speed. Apart from the pressure and temperature the biomass consumption was also monitored. It must be brought out that the gasification system has performance more than double its rated capacity. Based on the gas flow measurement the following results are tabulated.
Load, kWe
Biomass Consumption, kg/hr
SFC biomass, kg/kWh
Overall efficiency (Wood to electricity), %
7.9 158 20 1.1
10.1 135 13.4 1.7
11.4 167 14.65 1.6
Table 7.2: Performance of the gas turbine with producer gas

64
From Table 7.2 it is clear that the gasifier has been operated at around 170 kg/hr capacity as against the design condition of 75 kg/hr. This has been possible due the high pressure operation in comparison with the ambient pressure system. The excess pressure drop caused due to additional flow is extremely small compared with the operating pressure. Based on the load and the biomass consumption, it is clear that the overall efficiency; defined as the ratio of the electrical output from the engine to input from the biomass is very low. The reason for low cycle efficiency is highlighted earlier. A further decrease is due to the fact that gasification efficiency of about 0.75 to 0.8 has to be accounted.

65
Chapter 8 Integration of the hardware from Partnering institutions Performance of feed and ash lock hopper of BHEL. Trichy
The feed and ash lock hopper provided by BHEL, Trichy was integrated with the high pressure gasifier built at IISc. The system was integrated to operate in auto mode with the help of PLC. The feed back was obtained and integrated with SCADA. The feeding and ash removal operations were reliable and posed no problem. The pressurizing and depressurizing valves made the transition smooth. There were one or two occasions were the biomass had bridged in the biomass vessel, this was broken by sudden pressurizing of the chamber with the top valve, pressurizing and depressurizing valve closed.
Plates 8.1 to 8.3 show the lock hoppers integrated with the system.
Plate 8.1: The open hopper with top lock hopper valve, pressurizing and De-pressurizing valve

66
Plate 8.2: Feed vessel with bottom lock hopper valve
Plate 8.3: Ash lock hopper mechanism with two lock hopper valves, pressurizing and de-pressurizing valves

67
Simulation studies of high pressure filter supplied by BHEL, Trichy
A hot gas ceramic filtration unit was provided by BHEL, Trichy. The specifications for the filtration arise from the fact, the ability for the filter to withstand temperature and also the issue of tar condensing below a particular temperature.
Cold flow studies were conducted to characterize and ensure working of the high pressure filter. Figure 8.1 shows the flow rate vs. pressure drop data of the filter.
1. Composition of the fuel gas (including the contaminants in the gas)
2. Maximum volumetric flow rate 3. Maximum pressure of the gas
4. Maximum temperature of the gas
5. Dust concentration in the fuel gas
6. Particle size range and average
particle size of the dust
Combustible gas : CO ~ 25 %; H2 ~ 20 % , CH4 ~ 4 % CO2 ~ 10 %, H2O ~ 10 % and rest N2. Tar ~ 100 mg/nm3 Particulate ~ 700 mg/nm3 210 m3/hr 5 bar at the gas turbine 250oC 700 mg/ nm3, 1 – 200 micron (75 micron)

68
differential pressure Vs mass flow rate y = 44.694x + 167.49R2 = 0.9823
0
500
1000
1500
2000
2500
3000
3500
0 10 20 30 40 50 60 70
m (g/s)
H2 O
(mm
)
Figure 8.1: Flow rate vs. pressure drop of the candle filter
A test setup was made with the high pressure air from same air tank being used with a choke nozzle for 75 g/s flow. A dust bleed arrangement ahead of the filter was made with lock hopper. The pressure drop with flow rate with dust loading was recorded. There was no appreciable change in pressure drop with 250 g of loading. A back purge with nitrogen was done. This amounted to 5 hours mean time for purging for the rated gas flow of 187 kg/hr at 250 ppm dust concentration. The study was to understand the operations and was not carried further. Plate 8.4 below shows high pressure filter.
Plate 8.4: Hot gas filtration set up

69
As a part of the decision on the testing of the gasifier, the development cycle on the gas cooling and cleaning took place at IISc in parallel to achieve the set target of the project. During this period, the standard technology developed for ambient pressure gasifier was adapted for high pressure system, described in the earlier chapters. As the quality of the gas achieved met the requirements of the gas turbine, the hot gas filtration was not brought into circuit
Performance of Feed Lock hopper of IICT
A parallel development of feed lock hopper mechanism was done by IICT, Hyderabad. The difference between the development of lock hoppers design between BHEL and IISc was the use of used knife edge valves by IICT as against ball valves. Both valves are pneumatically operated type. The IICT hardware consisted of a top open hopper with a knife edge valve below, an intermediated feed vessel mounted on a load cell for online weight measurement. A small flexible bellow duct below and a knife edge gate valve. This bellow is to ensure that the valve weight is not loaded to the load cell. The draw back was that a dead volume below the valve lowered the measured weight by 1.3 kg. There is one more feed vessel with pressurizing and depressurizing vessel which connects to reactor. During initial testing it was found that one knife edge valve connected to reactor was leaking and the valve seat of this was changed by M/S Fouress. The lock hopper was tested for limited duration and it worked well. However long duration experience could not be accumulated as it was commissioned in the fag end of the project. Plates 8.5 to 8.9 show the lock hopper integrated with high pressure gasification system.
Plate 8.5: View showing the master control panel and the auxiliary panel from IICT

70
Plate 8.6: Hopper at the top
Plate 8.7: Knife edge gate valve and pneumatic poking arrangement

71
Plate 8.8: Load Cell and Central Hopper
Plate 8.9: Lock Hopper Valves

72
CHAPTER 9
Larger systems and techno-economic evaluation
A technical assessment of the system described earlier shows that the system operation is smooth and straight forward, partly because the combustion system is steady. The system worked well under varying load conditions as well. This could somewhat be misleading since the gas turbine was meant to deliver 30 kWe and obtaining this power from the system with biomass gasifier would mean a throughput of about 270 – 300 kg/hr a magnitude at least four times the design value. Such a throughput could be tolerated only for a few minutes for test purposes. Tests with varying load would have been a stupendous task. Hence, a way of interpreting what has been done is that a gas turbine designed for 30 kWe was run to deliver up to 11 kWe and load changes in this up to the total magnitude could be managed by the system. A true varying load assessment should have happened at near full load and this was not possible with this gas turbine because of its low efficiency.
It is appropriate at this stage to discuss the comparative performance of the tests on the gas turbine by Biomass Engineering Ltd. Newton-le-Willows, Warrington, UK and Conversion and Resource Evaluation Ltd., Holywood, Northern Ireland. This system uses a Capstone micro-turbine that was initially tested in catalytic combustor mode with premixed fuel-air mixture that has been suggested as a strategy for simpler operation of the power pack that could also be emission friendly. They tested the Capstone micro-turbine designed for biogases C-330 on synthetic producer gas. Subsequently, an atmospheric pressure gasifier was coupled to the gas turbine through a compressor. In the operations of the turbine on producer gas they state that there was de-rating and could obtain 13 – 15 kWe from the system that was required to deliver 30 kWe. The idea of de-rating is appropriate to reciprocating gas engines designed for natural gas required to operate on producer gas. In this case, the factors that affect the power delivered are the energy in the charge mass that would be lower for producer gas-air mixture, the ratio of the product molecules to reactant molecules that is more unfavourable with producer gas. In the case of gas turbine engines, the turbine inlet temperature or the combustor outlet temperature (typically about 700 to 750 0C) is lower than the peak flame temperature of producer gas-air mixture for the best conditions (at near stoichiometry). As such dilution of the mixture with air is required. The extent of dilution is more for a more energetic fuel. That is all. Consequently, the throughput of energy through the combustor in producer gas can be matched with that for natural gas. As such, there can be no de-rating of the engine power. There have been issues of grid interface problems, output sensitive to fluctuations and that unit could not left unmanned. Since the alternator output is at frequencies ~ 400 Hz or thereabouts being much higher than normal frequencies (50 or 60 Hz), frequency conversion system is required. Normally, this is done by converting the output into DC and then using a standard inverter to normal alternating current.
They have presented a valuable discussion on the economics of the system. The cost of the engine-power generation system is about 700 USD per kWe. The capital cost of the total system is 2000 ± 100 USD per kWe over a range of power levels between 30

73
– 250 kWe. In the case of reciprocating engine option for a range of power levels between 20 – 1000 kWe, the cost of the engine-power generation system is 300 – 400 USD per kWe and of the total system, 900 – 1200 USD per kWe. Thus it appears that the primary reason for a possible choice of turbine for the power pack would be the lower maintenance and high availability. Recent advances in reciprocating engine technology of high power machines operating at speeds of 750 to 1000 rpm also promise low maintenance and high availability. Hence the choice for turbines is becoming increasingly tough. Nevertheless, several engines from Solar turbines were examined for the technical viability. Table 9.1 gives some data on the gas turbines available from Solar turbines in the range of 1 to 5 MW.
Table 9.1 Performance data on select gas turbine engines
Model Power (MW) Mass flow (kg/s) Exhaust Temp (°C) Efficiency (%)
Saturn 20 1.21 6.51 505 24.3
Centaur 40 3.52 18.61 435 27.9
Centaur 50 4.6 19.07 510 29.3
Taurus 60 5.5 21.89 510 30.4
These turbines are designed for power generation and are available with generator fixed with commonly used voltages and frequencies in the world. The efficiencies the turbines increase with increase in power level. These turbines are designed for natural gas or liquid fuel operation and need to be adapted for producer gas operation. One of the major differences between using producer gas and conventional fossil fuels is in the air-to-fuel ratio, a subject brought out in the earlier parts of the report several times. For example, the heat rate required for Saturn-20 is 17902 MJ/hr at full power. This would require 370 kg/hr of natural gas, amounting to only about 1.6 % of the total mass flow. However producer gas requirement for the same heat rate is 3210 kg/hr, which is about 21 % of the total flow rate. Hence, the gas compressor takes significant amount of energy. Table 9.2 gives the energy requirements for these turbines.

74
Table 9.2 Energy requirements of Gas turbines
Gas turbine
model
Gasifier capacity (kg/hr)
Nominalpower (MW)
Gas compressor power (kW)
Net power (MW)
Overall efficiency incl gasifier, (%)
Saturn 20 1400 1.2 225 0.985 15.80
Centaur 40 3600 3.5 580 2.92 18.25
Centaur 50 4500 4.6 720 3.86 19.4
Taurus 60 5200 5.5 835 4.67 20.2
This implies that some energy is utilized for the gas compression and when this energy is subtracted from the output, the output power reduces. The net power available after taking the gas compressor power is given in the above Table. It also implies a reduction in the overall efficiency of the power plant, also shown in the Table. This reduction in power and efficiency is perhaps too pessimistic since the air flow rate through the main compressor will reduce when using producer gas is used since the total mass flow rate through the turbine remains the same. This has an additional implication on the possibility of the compressor surge when the mass flow through the compressor is reduced. Detailed calculations using the compressor characteristics need to be performed for assessing these effects. This problem can be eliminated by a specific design of the gas turbine for producer gas. The cost of high power turbines meant for natural gas, in the capacity upwards of 50 MWe is typically in the range of 500 to 700 USD per kWe. This cost has been achieved because the demand is large for this class of turbine systems is large. With these costs for the power pack, if we add an additional 600 to 800 USD per MWe for gasifiers, then one could expect to generate power from biomass using gas turbines at 1100 to 1500 USD per MWe. For this to happen, the gas turbine manufacturing industry has to recognize the market potential and develop, build these power packs in large numbers before the costs of these systems can reach these levels. Till such a time, the reciprocating engine power pack will continue to be economical.

75
CHAPTER 10
Final Summary This report has discussed the development of a package for power generation from biomass using a high pressure gasifier – gas turbine – alternator combination. Two possible approaches of power generation from gas turbines are discussed. The first one involves an ambient pressure gasifier that generates cool clean gas that will be compressed in a separate compressor and then the gas is led into the combustion chamber of the gas turbine. This approach is simple and can take advantage of the developments in ambient pressure gasification technology. If the gasifier is coupled to a gas turbine designed normally for natural gas, but adopted to operate on producer gas, the penalty is that the in-house power consumption will go up by 7 to 35 % depending on the power level (7 % at the level of 1 MWe and 35 % at 30 kWe level). The second approach uses a high pressure gasifier to run the gas turbine. A full schematic will involve a compression device even here. This arises for the following reason. The compressor of the gas turbine will generate compressed hot air to be delivered to the combustor. A part of this air is drawn and taken to the high pressure gasifier to process the biomass through the gasification process and generate producer gas. This gas is cleaned at high temperature if possible (as done normally in most European technologies) or cooled and cleaned by other methods and piped into the combustor. This transitional process needs to raise the pressure since between the compressor outlet pressure of the air stream and the return path through the reactor, cooling and cleaning system through which the flow rate increases by 1.5 to 1.7 times the air flow, there will be pressure drop of 0.05 to 0.1 bar. This is accomplished through the use of a centrifugal blower/compressor. IISc team has had a long tradition of research and development in biomass gasification systems significantly supported by MNES in a major project “strategic development of bioenergy”. This project has resulted in the research, development, field testing and commercialization of an atmospheric pressure modern open top re-burn downdraft gasification system with a cumulative test experience of more than a hundred thousand hours of operation. It was decided to adopt the design with the additional feature of operation at high pressure. This would bring in all the knowledge base associated with atmospheric gasification system. Consequently, all the elements of the design are the same as an atmospheric pressure system and the additional feature except that all joints and seals are designed for high pressure inside the system. The only difficult region is the ash extraction system that has a screw that needs to be operated periodically. Careful design of this seal ensured that was no problem throughout the development and testing schedule. The other important area where knowledge of the combustion process had to be brought in was in modification done to the combustor to run on producer gas – liquid injector to gas injection system. As is described in detail in chapters 5 and 6, the conversion process required careful experimentation and some understanding of the mixing process. All the necessary state-of-the-art tools required for this purpose as adopted in gas turbine research and development establishments were brought into picture and the development accomplished in a reasonable duration.

76
The areas of expertise outside of IISc’s current work were in the areas of biomass feed and ash extraction systems. Several discussions largely with BHEL helped finalizing the lock hopper mechanism that was designed, procured, tested and supplied by BHEL in accordance with the development schedule. The design of IICT was more complex and time was provided for their supply to enable completion of the principal objectives of the project, namely, to operate the high pressure gasifier and run the gas turbine before the alternate idea was tested. The BHEL lock hopper mechanism worked satisfactorily and system operations were smooth. Towards the tail end of the project, IICT system was tested and it was confirmed that it operated satisfactorily. IIT Madras conducted a number of studies on a small system and obtained the results that were discussed and debated at the review meetings. A principal question addressed relates to application of the development work completed in this project to field applications – sugar and rice mill industries. Large scale power generation through combined cycle can be done with reciprocating engines or gas turbines with downstream steam power generation segment added to the power package. At this time of writing, atmospheric pressure gasifier with reciprocating engines appears economically more attractive, more familiar to Indian industry (including that for operation and maintenance). At appropriate time when gas turbines offer economically attractive packages, one can consider using the knowledge base generated in this work. The principal contribution of this work is that India has acquired the capability to build high pressure gasifiers for biomass and also design a power station for running gas turbines based on producer gas from biomass.