final report: paths to quality evaluation
TRANSCRIPT

Purdue UniversityPurdue e-Pubs
Center for Families Publications Center for Families
3-2018
Final Report: Paths to QUALITY EvaluationJames ElickerPurdue University - Main Campus, [email protected]
Sarah LanePurdue University
Zachary S. GoldPurdue University
Aura MishraPurdue University
Sharon ChristPurdue University
Follow this and additional works at: https://docs.lib.purdue.edu/cffpub
This document has been made available through Purdue e-Pubs, a service of the Purdue University Libraries. Please contact [email protected] foradditional information.
Elicker, James; Lane, Sarah; Gold, Zachary S.; Mishra, Aura; and Christ, Sharon, "Final Report: Paths to QUALITY Evaluation"(2018). Center for Families Publications. Paper 70.https://docs.lib.purdue.edu/cffpub/70

1
Paths to QUALITY Evaluation—Phase 2 Final Report to the
Indiana Office of Early Childhood and Out of School Learning Family and Social Services Administration
March, 2018
James Elicker, Sara Lane, Zachary S. Gold, Aura Mishra & Sharon Christ Human Development & Family Studies
Purdue University

2
Acknowledgements
The evaluation research for the Paths to QUALITY child care quality rating and improvement system (QRIS) of Indiana summarized in this report was conducted between 2014-2018. James Elicker, Professor in Human Development and Family Studies at Purdue University-West Lafayette, Indiana directed the project. Key personnel included first, Karen Ruprecht and later, Sara Lane as Project Managers, Zachary Gold and Aura Mishra as Graduate Research Assistants, and Associate Professor Sharon Christ as statistical consultant. This evaluation project would not have been possible without the following competent, hard-working, patient, and enthusiastic field-based Research Assistants located around Indiana: Hannah Addie, Darcee Hume-Thoren, Carolyn Langill, Pam Leffers, Marlene Mayfield, Jane Meyer, and Jeanie Neal. Most of all, the research team is thankful for the enthusiastic participation of many young children, parents, teachers, caregivers, directors, family child care home providers, and QRIS training coaches and administrators from Indiana Association for the Education of Young Children and Child Care Resource and Referral agencies. Participating in a two-year longitudinal study requires a great deal of commitment, and this project would not have been possible without the enthusiastic participation of all these people, sharing their time, energy, and viewpoints. We are grateful for the project funding and support provided by the Office of Early Childhood and Out of School Learning within the Indiana Family and Social Services Administration. Former director Melanie Brizzi, current director Nicole Norvell, program managers Beth Barrett and Janet Deahl, and other staff members were all amazingly supportive and collaborative throughout the project. The contents of the report are solely the responsibility of the authors and do not represent the official views of the funding agency. This publication of this report does not in any way constitute an endorsement of the report’s findings, interpretations, and recommendations by the Office of Early Childhood and Out of School Learning, the Family and Social Services Administration, or the State of Indiana.

3
Table of Contents
I. Introduction .................................................................................................... 4
II. PTQ Goals and Phase 2 Evaluation Questions ................................................... 4
III. PTQ Longitudinal Provider Advancement Study ................................................ 5
a. Key Findings ......................................................................................... 5
b. Methodology ........................................................................................ 6
c. Quality Advancement Patterns ............................................................. 6
d. Providers’ Attitudes ............................................................................ 10
e. Provider-Coach Relationship Quality ................................................... 13
f. Motivation to Change ......................................................................... 13
g. Factors That Predict Quality Improvement .......................................... 14
h. Provider Subgroups with Different Patterns of Advancement .............. 15
i. Conclusions and Recommendations .................................................... 18
IV. PTQ Longitudinal Child Outcomes Study ......................................................... 20
a. Key Findings ....................................................................................... 20
b. Methodology ...................................................................................... 21
c. CLASS Quality Measures ..................................................................... 21
d. Quality in Toddler Classrooms ............................................................. 22
e. Quality in Preschool Classrooms.......................................................... 23
f. Children’s Development as a Function of PTQ-Rated Care ................... 25
i. Toddlers’ Development............................................................ 25
ii. Preschoolers’ Development ..................................................... 27
g. Quality Dosage and Children’s Development ....................................... 30
h. CLASS Quality and Children’s Development ......................................... 30
i. Conclusions and Recommendations .................................................... 31
V. Statewide Parent Surveys: Awareness and Use of Paths to QUALITY ............... 33
a. Methodology ...................................................................................... 33
b. Results ................................................................................................ 33
c. Conclusions and Recommendations .................................................... 34
VI. PTQ Evaluation Publications ........................................................................... 35

4
Paths to QUALITY Evaluation, Phase 2, Final Report
Office of Early Childhood and Out of School Learning March, 2018
James Elicker, Sara Lane, Zachary S. Gold, Aura Mishra & Sharon Christ
Purdue University Introduction In January 2008 the Bureau of Child Care (now the Office of Early Childhood and Out of School Learning; OECOSL) of the Indiana Family and Social Services Administration launched the statewide child care quality rating and improvement (QRIS) system, Paths to QUALITY (PTQ). In 2011, Purdue University completed a Phase 1 evaluation of PTQ, documenting the implementation and validity of the system during its first three years. Results from the Phase 1 evaluation were summarized and disseminated in three reports, four research briefs, two peer-reviewed journal articles, and also were presented in a series of public stakeholder meetings around Indiana. (See PTQ Evaluation Publications, p. 35.) In 2012 Purdue was awarded a contract to continue evaluation of the now fully-implemented PTQ system. The Phase 2 evaluation was conducted within a contract period of October 1, 2012-September 30, 2018. This report summarizes the methods and results of three evaluation studies: a two-year provider advancement study; a two-year child outcomes study; and a statewide parent awareness survey. PTQ Goals and Phase 2 Evaluation Research Questions The Phase 2 evaluation conducted by Purdue University examined the effectiveness of the now fully-operational PTQ system in meeting its three primary goals:
1. Helping Indiana child care providers improve the quality of early education and care they offer to children and families;
2. Providing higher quality child care that supports and improves children’s development, learning, and readiness for school; and
3. Helping parents become aware of PTQ and the information this system provides, so that they trust and use PTQ information to choose high quality providers when making their child care decisions.
The effectiveness of PTQ in meeting these goals was examined by completing three evaluation studies:
1. A longitudinal child care provider study, to identify the factors most strongly linked with quality improvement and to suggest provider support strategies;
2. A longitudinal child outcome study with children from low income families, to investigate changes in children’s early learning, as related to PTQ-rated quality; and
3. A statewide randomized parent survey, to gauge Indiana parents’ awareness and use of PTQ when making their child care decisions.
Five geographic regions of the state were selected to participate in this Phase 2 evaluation. These regions are home to a large number of children from families receiving Child Care and Development

5
Fund (CCDF) vouchers for child care assistance, including a balance of both rural and urban areas. The selected areas were resource and referral service delivery area (SDAs) 1, 3, 4, 7, and 9, which include: Lake, Porter and La Porte counties; Fort Wayne and surrounding counties; Tippecanoe and surrounding rural counties; Indianapolis and surrounding counties; and Evansville and surrounding counties. In all, 45 of Indiana’s 93 counties were represented in the evaluation sample. 1. PTQ Longitudinal Provider Advancement Study The Provider Advancement Study was designed to discover how PTQ providers advance to higher quality levels and how coaching and other assistance helps providers improve the quality of care they are offering young children and families. Key Findings from the Provider Advancement Study
Participation rates and quality advancement in PTQ have steadily increased over the past 7 years. There are currently more Level 3 and Level 4 rated licensed centers and registered ministries than Level 1 or Level 2 rated programs. The majority of participating family child care homes remained at Level 1, but a significant minority of home providers have advanced to Level 3 or 4.
During this two-year longitudinal study, about one-half of the providers in the sample remained at the same PTQ level. One third increased in rated quality at least one level. Some providers closed, lost their PTQ rating, or opted out of the evaluation research. Level 1 and Level 2 providers and licensed child care centers were most likely to advance. Level 3 providers and family child care providers were least likely to advance.
There is evidence that many providers have decided not to advance beyond Level 3, probably due to their assessment of the costs and benefits of advancing to Level 4.
Provider characteristics, provider attitudes, and provider interactions with coaches were all key factors that predicted whether a provider would advance to a higher PTQ level within two years. In addition to the PTQ level they had initially, providers who had higher levels of education, more years of child care experience, and those who were more engaged professionally were more likely to advance to a higher quality level. Providers’ stated intentions, motivation, and confidence about PTQ advancement were also important predictors. Providers who reported their PTQ coach was helpful were more likely to advance. Coaches’ assessments of the provider’s motivation and likelihood of advancement were often accurate predictors of whether a provider actually advanced or not during this two year period.
Over the course of the study, providers reported that the helpfulness of their coaches and the quality of their relationships with coaches increased.
We identified four distinct subgroups of providers based on their rate of advancement over two years: 1) Center-Based, Engaged, Moderate Advancement (42%); 2) Moderately Engaged, Moderate Advancement (24%); 3) Family Child Care, Lower Engagement, Little or No Advancement (29%); and 4) Highly Motivated and Engaged, Highest Rate of Advancement (5%). The characteristics and attitudes of these groups of providers are described.

6
Provider Study Methodology In 2013-2014, 179 child care providers (57 licensed center directors; 46 registered child care ministry directors; 76 licensed family child care home providers) with approximately equal numbers at PTQ Levels 1, 2, and 3 were randomly selected from the five target SDA regions and agreed to participate in the Longitudinal Provider Advancement Study. (Level 4 providers were not included, because they had already achieved the highest possible PTQ rating.) A total of 30 PTQ coaches who were initially working directly with the 179 providers were also recruited for parallel interviews. At the end of this two-year longitudinal study, we were able to interview and analyze data for 150 (84%) of the original 179 providers. Complete data for 29 providers (16%) were not available at the end of the study: 16 providers (9%) had closed their operation or had opted out of the study, and 13 (7%) could not be contacted after repeated attempts. This report summarizes results for the 150 providers who completed interviews during and at the end of the two-year study. During the course of the study, providers’ coaches sometimes changed, so the total number of coaches interviewed over two years was 60. The 150 providers were interviewed every 6 months (maximum 5 times) about their progress in advancing to higher PTQ levels, their perceptions and attitudes about PTQ, perceived barriers to advancement, their motivation to make changes, and the amount and quality of mentoring and coaching they received. In separate interviews scheduled every 12 months, the currently-assigned PTQ coaches were asked similar questions about their experiences working with the providers. This report summarizes data gathered in all of these interviews, including providers’ responses at Time 1 at the beginning of the study through Time 5, two years later. How many PTQ child care providers advanced to a higher level? How many stayed the same or declined?
Statewide, between 2010 and 2017, the total number of providers participating in PTQ increased from 1,950 to 2,530, and the PTQ-rated quality levels of participating providers increased. (See graphs, next page.)

7
0
50
100
150
200
250
Level 1 Level 2 Level 3 Level 4
Number of Rated Programs, Licensed Centers, 2010 and 2017
2010 (n=474) 2017 (n=601)
0
200
400
600
800
1000
1200
Level 1 Level 2 Level 3 Level 4
Number of Rated Programs, Licensed Homes, 2010 and 2017
2010 (n=1447) 2017 (n=1793)
0
20
40
60
80
Level 1 Level 2 Level 3 Level 4
Number of Rated Programs, Unlicensed Registered Child Care Ministries,
2010-2017
2010 (n=29) 2017 (n=136)

8
Within our sample of 150 PTQ providers who completed this two-year study, 32% had advanced one or more PTQ-rated levels, 53% remained at the same level after 24 months, and 15% had moved to a lower rated level. Level 2 providers were the most likely to advance within these two years (44%) and Level 3 providers were the least likely to advance (12% advanced) with Level 1 providers in between (39% advanced). In terms of type of provider, licensed centers were the most likely to advance (40%), followed by registered ministries (34%) and licensed homes (25%). Providers Who Started at PTQ Level 1
Went Down
Stayed the Same
Went Up
Centers 3 5 9
Homes 2 17 5
Ministries 1 5 7
Total 6 (11%) 27 (50%) 21 (39%)
N = 48
Providers Who Started at PTQ Level 2
Went Down
Stayed the Same
Went Up
Centers 2 5 9
Homes 7 12 9
Ministries 1 4 6
Total 10 (18%) 21 (38%) 24 (44%)
N = 55 Providers Who Started at PTQ Level 3
Went Down
Stayed the Same
Went Up
Centers 2 10 4
Homes 4 9 4
Ministries 0 15 1
Total 6 (12%) 34 (70%) 9 (18%)
N = 49
Level 1 and Level 2 providers showed the highest average rates of quality level advancement over two years, and Level 3 providers showed the lowest rate of advancement. The average amount of PTQ level increase per year for providers beginning at Level 1 was .33 of a level, the average amount of increase for providers beginning at Level 2 was .29, and the average amount of increase for providers beginning at Level 3 was only .05. (See graph, next page.)

9
0
1
2
3
4
0 6 12 18 24
PT
Q L
eve
l
Months
Average PTQ Rating over the study

10
Viewing quality advancement another way, there were increases in rated quality within the
sample, but also decreases. The following table shows the number of providers in the sample rated at each PTQ level at Time 1, and again at Time 5, 24 months later. This shows that 14 providers (8%) had moved up to Level 4 within 24 months, and the number of providers rated Level 3 also increased by 20 (11%). There was also some movement down to Level 0 (i.e., closed, left PTQ, or unrated) by 9 (5%) of the providers.
Distribution of the Study Provider Ratings at Time 1 and Time 5
PTQ Level Time 1 Time 5
Level 0 -- 9
Level 1 59 30
Level 2 62 19
Level 3 58 78
Level 4 -- 14
Providers’ Attitudes: Interest and Confidence in Advancement in PTQ at Time 1 and Time 4 (18 months later)
At Time 1, 75% of the providers were interested in advancing to higher quality levels, 12% were not interested, and 13% were not sure. Registered ministries were most interested in advancement (80%), and licensed family child care home providers were least interested (70%). Level 2 providers were most interested (84%), and Level 3 providers were least interested (59%). At Time 4, 18 months later, there was a slight decrease in the overall levels of interest in advancement: 72% of the providers said they were interested in advancing levels, 19% were not interested, and 9% were not sure.
Summary of providers’ comments about interest in advancement: 84 providers reported their reasons for wanting to advance to the next level. The
greatest number (24) reported they want to advance for the validation and recognition – from parents, the community, and other professionals. These providers were mostly centers, with the largest group (9 providers) being level 3 centers. 14 providers listed advancing for parents specifically – for marketing purposes (enrollment) and to “show” parents the quality care they are providing. These providers were primarily homes and centers, with the largest group (5 providers) being level 3 homes. 13 providers listed wanting to be the best they can be, for children as well as their communities. These providers were spread evenly across the 3 types of child care, as well as PTQ levels. 7 providers reported that advancing supports them to continue improving their programs, with 2 additional providers stating advancing helps them to improve their curriculum implementation. 7 providers cited “incentives” including tiered CCDF reimbursement and 6 providers cited being able to participate in programs such as On My Way PreK for additional funding.

11
56 providers reported their reasons for not planning to advance to the next level. (14
providers responded N/A, because they were already at level 4.) The greatest number who were not planning to advance (20) were at level 3 and not sure or not interested in pursuing national accreditation in order to advance to level 4. These providers were a fairly even combination of the 3 types. 5 of these providers felt national accreditation was too much work, 5 providers felt accreditation would be too costly (including ratios and teacher education specifically), and 3 providers said their owner/board/administrators were not interested in pursuing accreditation. 2 providers did not want to lose their current coach to work on accreditation. Other reasons included hiring and paying staff with education requirements (4 providers) and already being at capacity so not seeing a benefit to going through the accreditation process.
6 providers reported being comfortable and “happy” with where they are currently at (3 of these were homes, level 3), and 6 (homes at levels 1 and 2) reported being unable or uninterested in working toward the next level due to personal reasons (including consideration of retirement, health issues, and family issues). 3 providers reported advancing would be too much work, and 2 of these providers felt there was no benefit to advancing. 3 additional providers did not have the support of their owner/board/administrator to work on advancement. Other reasons given for not planning on advancing include: not being “necessary,” would not make a difference, parents “don’t know about PTQ and don’t care,” “don’t want any additional outside visitors that disrupt the children,” “don’t want to further their education,” “can’t make the structural changes needed,” “unwilling to add more rules and regulations,” and “not understanding what the next level entails.”
Providers’ level of motivation to advance to higher quality levels decreased somewhat over 18 months. At Time 1, most providers rated their motivation as in the “motivated” range (average 3.15 on a 4 pt. motivation scale). 72% stated they were “motivated” or “very motivated.” Coaches at that time rated the providers as somewhat lower, somewhere between “somewhat motivated” and “motivated” (average 2.71 on the 4 pt. motivation scale.) The highest self-reported motivation by providers at Time 1 was expressed by directors of registered child care ministries, both Level 1 and Level 2 providers. Coaches also rated registered ministries and Level 2 providers as having the highest levels of motivation.
At Time 4, after 18 months, there was a modest decrease in providers’ motivation to advance to the next PTQ level. 64% of providers rated their motivation to advance as “motivated” or “very motivated,” and the proportion of providers who said they were “not at all motivated” to advance increased from 10% at Time 1 to 20% at Time 4.
At Time 1 most providers (80%) of all types and PTQ levels reported they were “confident” or “very confident” they would advance to the next PTQ level. Level 3 providers were somewhat less confident than Level 1 providers. 18 months later, providers reported slightly lower levels of confidence in regard to their PTQ advancement (74%).

12
Summary of providers’ comments about obstacles to advancement: The biggest obstacle/barrier reported by the majority of providers involved staffing
issues. The primary issue was staff/teacher education, including: hiring and keeping qualified staff, maintaining the required amount of educated staff, staff training, and turnover. Not having the financial resources to pay for qualified teachers and their training was specifically mentioned by 4 providers.
Time was the second biggest obstacle/barrier reported by providers. This included time for working on paperwork, portfolios, and necessary steps for advancement.
20 providers reported that the accreditation process was their greatest obstacle. All these providers were at level 3, and were fairly evenly spread between homes, centers, and ministries.
15 providers reported finances were an obstacle to advancement. Teacher pay, teacher training, and classroom materials were specifically mentioned.
Curriculum was an obstacle for 8 providers, including “picking one,” implementation, and lesson planning.
At the same time, a majority of the providers reported participating in PTQ was at least somewhat stressful. At Time 1, 54% reported participating was “somewhat stressful”, and 18% reported participating was “stressful” or “very stressful.” At Time 4, 18 months later, the level of stress reported was slightly less. 45% reported participating was “somewhat stressful,” yet 22% still reported participating was “stressful” or “very stressful.”
Summary of providers’ comments about interest in advancement: 31 providers reported preparation for and rating visits being the most stressful.
(Greatest number of these responses were from child care ministries, with a fairly even amount of homes and centers below that. Majority of these providers were level 3, with one third of the respondents being ministries at level 3.) 26 providers reported that nothing was stressful. (Over half of these respondents were homes, primarily level 1 and 3. Centers were next, primarily level 3. Only 3 of these “no stress” respondents were ministries.) 26 providers reported staffing issues were most stressful including: meeting training and education requirements, staff turnover, and staffing in general. (Over half of these respondents were ministries, primarily level 3. Next were centers, primarily level 3, and 3 respondents were homes, level 3.)
21 providers reported paperwork being the most stressful, including the binder and other required documentation. (Respondents were primarily centers and ministries, one third were ministries at level 3.)
17 providers reported coaching issues including: coach changes/inconsistency, not connecting with their coach, inconsistent information from coaches, not having a coach, and not getting support form coach when “not in good standing.” (Respondents were primarily homes, with the greatest number at level 1. 3 respondents were centers and 3 were ministries.
Other stressful aspects included: staying on top of everything, including PTQ updates, maintaining changes, not having enough time, curriculum implementation, lesson planning, and classroom/environment requirements.

13
Provider-Coach Relationship Quality
Providers’ views on the quality of their relationships with their coaches were mostly positive and stable over the 18 months. More than 70% of the providers rated their relationships with coaches as “very good” or “excellent” at both time points. Only 10% of providers at Time 1 and 5% of providers at Time 4 rated their relationships with coaches as “fair” or “poor.”
Providers’ ratings of how helpful their contacts with their PTQ coaches had been generally increased from Time 1 (65% “helpful” or “very helpful”) to Time 4 (83% “helpful” or “very helpful”).
The majority of providers reported that their coach’s contacts with themselves (the director/owner) and the staff were helpful or very helpful. Time 1 and Time 4 ratings of helpfulness to the director/owner were about the same (84% reported “helpful” or “very helpful” at both times.) Their ratings of helpfulness of the coach with the staff or assistants increased considerably from Time 1 (20% helpful, 45% very helpful) to Time 4, 18 months later (27% helpful, 56% very helpful.)
Providers’ comments about coaching:
Providers reported the following helpful benefits of coaching: 41 providers – having someone available to ask questions and talk through issues
when needed 24 providers – knowledge, especially of PTQ process, guidelines, expectations 20 providers – support for advancement, keeping them on track and moving
forward 20 providers – having a fresh perspective/another set of eyes for the classrooms
and programs, and providing feedback 19 providers – resources and ideas 16 providers – support, guidance, encouragement
25% of the providers in the study reported they had experienced a coach change in the past 6 months. A majority of the providers reported they had experienced one or more coach changes over the past 18 months: 35% reported one coach change; 44% reported two coach changes; and 22% reported 3 or more coach changes.
Motivation to Change
Our assumption was that providers who had a higher general motivation to make positive changes in their programs will be more likely to advance in PTQ. We used a “motivation to change” scale with several items, rated from 1 = not at all motivated or willing to make changes, to 5 = highly motivated to make changes in their practices.
Providers generally rated their motivation to change as high, with an overall mean at Time 1 of 4.24 out of 5, ranging from 4.02 for family child care providers to 4.54 for registered ministry providers. At Time 3 (after 12 months) providers continued to rate their motivation to change

14
as high, with an overall average score of 4.27, with licensed centers rating themselves highest at 4.44.
On the other hand, the providers’ coaches perceived somewhat lower levels of motivation to change in the providers at both times, with an overall mean of 3.54, ranging from 3.10 for Level 1 providers to 3.93 for registered ministries. At the 12 month interviews, the coaches rated their providers at an average 3.03, with family child care homes at a 2.62 and Level 1 providers at a 2.33.
Summary of providers’ comments about interest in advancement: The majority of providers reported that participating in PTQ was rewarding. 69 providers reporting appreciating the recognition and validation that they are
providing quality care for children and families. This included 30 providers specifically mentioning being able to show parents and the community that they are providing quality care, especially now that more parents are more aware and asking about PTQ. (Respondents were primarily centers and ministries, level 3.) Other rewarding aspects of PTQ included: coaching, incentives, being held accountable to a higher standard, professional development opportunities, and marketing that has led to increased enrollment.
What Are the Factors that Predict Whether a Provider Will Advance in PTQ Level Quality? Many factors were significantly associated with whether a provider advanced to a higher PTQ quality level during the 24 months of this study. The provider’s starting PTQ level, education level, years of experience, and professional engagement were all significantly correlated with movement to a higher PTQ level. Providers’ positive attitude about advancement, intention to advance, readiness to change, and attitudes about their coach’s helpfulness were also correlated. From the coaches’ perspectives, their initial assessment of the provider’s motivation to advance, engagement in the training process, and likelihood of advancing were all associated with actual advancement over 24 months. Here is an overview of all of the Time 1 (beginning of the study) factors that significantly predicted PTQ advancement within 24 months. (Note: * indicates the strongest independent predictors in a multivariate analysis. There is a high degree of correlation among many of these factors, but we consider the factors indicated with * to be ones that by themselves are important predictors of advancement, above and beyond other factors.)
Provider Characteristics
Provider’s beginning PTQ Level* (Level 1 or Level 2)
Provider had advanced degree (MS+)*
Years of child care experience*
Provider number of professional organization memberships*
Type of child care (Licensed Centers were most likely)
Provider’s education level
Number of training hours/year

15
Provider Attitudes & Perceptions
Provider’s intention to advance*
Provider’s level of motivation to advance*
Provider’s rating of how helpful the coach had been to the director/owner*
Provider’s level of confidence that they would advance
Provider’s belief that the current PTQ rating reflects their true quality
Provider’s belief that the current PTQ rating does not reflect their true quality
Provider’s general readiness to change
Coach Perceptions
The provider was motivated to advance*
It is likely that the provider will advance*
The provider is engaged in the process
Effective training method: Consult with director
Effective training method: Consult with staff
Effective training method: Observations
Effective training method: Prepare for rating visit What were the Characteristics of Subgroups of Providers Who Did or Did Not Advance? To identify distinct groups of providers who had different patterns of advancement and describe their characteristics, we conducted a statistical cluster analysis. This analysis enabled us to identify four provider subgroups and examine the attitudes and experiences of providers who advanced rapidly, slowly, or not at all. Using this analysis, we identified four distinct groups or clusters: Cluster 1 (n=75; 42%) Center-Based, Engaged with PTQ, Moderate Rate of Advancement This largest group was 41% LCC, 32% RM, and 27% FCC providers. The majority (62%) were rated Level 3 at T1. 29% were Level 2 and 9% were Level 1. This group had the highest education levels, with 55% having a B.S. or higher, including 20% with a graduate degree. Professional engagement levels were significant, but not quite as high as Cluster 4. 98% belonged to one or more professional organizations, and 32% belonged to 3 or more. 21% had attended 4 or more conferences in the past year, and 53% attended 2 or more conferences. 43% completed 24 or more training hours in the past year, and 5% completed more than 50 hours. 69% reported they wanted to advance to the next level, and 53% said they were “very motivated” to advance, while 31% said they were not at all or only somewhat motivated. 86% reported their coach was helpful or very helpful with them as a director, and 60% reported their coach was helpful with staff. 72% rated the amount of help they got from their coach as “about right.” Their confidence level about PTQ level advancement was high—79% said they were confident or very confident they would advance to the next level. About half (50%) thought their current PTQ rating was NOT an accurate reflection of their program quality, which may indicate one source of motivation to get a higher PTQ rating. Overall satisfaction with their coaches was high; 86% were satisfied or very satisfied. Their ratings of the quality of relationship with their coach was high (36% excellent; 37% very good) but not quite as high at those in Cluster 4. This group’s general

16
motivation to change was second only to Cluster 4. Along with Cluster 4, most thought participating in PTQ was at least somewhat stressful (77%).
Quotes from Cluster 1 providers: “We want to advance for the sake of the parents, so they know we are in fact providing level 4 quality care, not level 3. We also want to be recognized in the community as the best, and let the community know they can expect the best at our school.” (LCC level 3) “Finances are the only obstacle we need to overcome to advance to the next level. We also need technology. I think PTQ is great and the mentoring, but we need help with finances to advance.” (LCC level 3) “We are always working to improve child outcomes and to continue to grow as a program and staff.” (RM level 3) “I want to advance to the next level because we would be one of the few centers known as a level 4 in our county.” (RM level 3)
Cluster 2 (n = 43; 24%) Moderately Engaged, Moderate Rate of Advancement This group was mostly made up of FCC providers (52%) and also has 23% LCC and 26% RM providers. Most of these providers started the study at Level 2 (77%), with 23% at Level 1 and none at Level 3. Their education levels were somewhat lower than Clusters 1 and 4, about the same as Cluster 3 (35% had B.S. or higher.) Professional engagement was mid-range for this study, with 58% belonging to 2 professional organizations and 19% belonging to 3 or more organizations. 9% did not belong to any organizations. Conference attendance was moderate, with 51% attending 2 or more conferences in the past year, and 28% attending none. Engagement in in-service training was a little less than Cluster 1, with 31% reporting completing 24 or more hours, and 13% reporting more than 50 hours. Motivation to advance was high; 88% said they did want to advance to the next level, 74% said they were very confident they would advance. This group rated the helpfulness of their coaches highest (93% very helpful/helpful), their overall satisfaction with their coaches was very high (74% very satisfied) and their relationships with the coaches were rated excellent by 51% and very good by 39%. 66% reported that participating in PTQ was at least somewhat stressful.
Quotes from Cluster 2 providers: “I want to advance so I can be the best for children and families in the community.” (FCC level 2) “Picking a curriculum and implementing it is a challenge.” (FCC level 2) “Reputation in the community is important, we want to show growth. We have already grown in numbers, now we want to grow in quality.” (RM level 2) The biggest challenges to advancement are teacher education and having a consistent coach.” (LCC level 2) “We feel level 3 is high quality, and a level 4 is too costly and a lot of extra work. The benefits of a level 4 do not outweigh cost.” (LCC level 3) “There's a big difference from two years ago to now with parents and the community recognizing what PTQ is, so it has been rewarding to see everyone becoming more knowledgeable and understanding the different levels of care. Parents got excited when we reached level 4 at our center.” (LCC level 4)

17
Cluster 3 (n = 52; 29%) Family Child Care, Lower Engagement, Little or No Advancement This group, the second largest, was mostly FCC (56%) however 27% are LCC and 17% are RM. 81% of the providers in this cluster were PTQ Level 1 at Time 1 in the study. The providers had lower levels of education than Clusters 1 and 4, similar to Cluster 3, with 35% having a B.S. or higher degree. These providers were the least engaged in professional development, with 77% not belonging to any professional organization, low attendance at conferences, and the least number of training hours per year. About 1/3 said they did not want to advance to the next PTQ level, and they also had the lowest levels of confidence that they would advance. Most thought the coaches were helpful, but at a lower level than other groups, and their satisfaction with coaches was lowest. (Only 57% reported they were satisfied or very satisfied.) This group had the lowest ratings on the motivation to change scale. However, 72% stated their current PTQ rating did NOT accurately reflect their quality, so this combination of attitudes seems to indicate disenchantment with the PTQ system. 61% reported that participating in PTQ was at least somewhat stressful; this was the lowest reported stress rate among the groups.
Quotes from Cluster 3 providers: “There is no reason really to advance, parents don't know about it and don't care. There is no incentive to advance so there is really no real reason to.” (FCC level 2) “We want to participate in On My Way Pre-K and need the extra funding.” (LCC level 1) "Advancing isn't necessary, we are already licensed." (LCC level 1) “Parents are asking more about PTQ, and we would also like to be able to take advantage of programs such as On My Way Pre-K.” (RM level 1) “Inconsistent coaching is a barrier - we have had 5 coaches in the past 2 years. Every time we are ready to move up we lose a coach and then have to start all over again with a new coach.” (RM level 1) “We have been ready to advance for a long time, but have not had consistent, helpful coaching.” (FCC level 1)
Cluster 4 (n = 9; 5%) Highly Motivated and Engaged, Highest Rate of Advancement This small group of only 9 providers was mostly composed of FCC providers (n=5). Two providers were LCC and 2 were RM. Most (8) were rated at Level 3 at Time 1. This group had a relatively high level of education, similar to Cluster 1; 4 had B.S. or higher degree. Professional engagement was relatively high; 100% belonged to at least one professional organization, 67% belonged to 3 or more organizations, 33% attended 4 or more professional conferences in the past year, 66% attended 2 or more conferences, 89% completed 24 or more training hours in the past year, and 44% completed more than 75 training hours. All of these providers said they wanted to advance to the next PTQ level, and they were “very confident” they would advance. They thought help from their coach was important to advancement at higher levels than any other group (89% “very important”) and their level of satisfaction (78%, very satisfied) and relationship quality (67%, excellent) with their coach was highest among the groups. Their general motivation to change was highest among the groups, and they were most likely to think that their current PTQ rating was an accurate reflection of their program quality. Along with Cluster 1, they were highest in reporting that participating in PTQ was at least somewhat stressful (77%).

18
Quotes from Cluster 4 providers: The most rewarding aspects of PTQ: “The knowledge I’ve learned to benefit the children, and that the parents know their children are safe and learning.” (FCC level 4) “Training and support from our coach.” (FCC level 4) “Incentives at level increases.” (FCC level 4) “Passing your rating visits is like getting an A on your report card and validates what we are doing.” (RM level 4) “The knowledge that we did work really hard to meet the requirements, so we could have an excellent facility for our families is extremely rewarding. Also, the ability to share that we are a level 4 with our parents and community, and the recognition that we have a safe center and we have met all the requirements.” (LCC level 4)
Conclusions and Recommendations: Longitudinal PTQ Provider Study 1. Most PTQ providers are interested in and planning to advance to high PTQ-rated quality levels.
However, the overall rate of advancement may be slowing as the system matures and more providers attain Levels 3 or 4. During this 24-month study, Level 1 and 2 providers were more likely to advance than Level 3 providers.
2. Level 3 providers were the least likely to advance, perhaps reflecting satisfaction with achieving that level and/or significant perceived costs or obstacles to meeting Level 4 standards, while not seeing sufficient benefits to justify the costs.
3. Most providers in the study expressed high levels of motivation and confidence they will advance in PTQ. Overall more than 70% said they were motivated and confident about advancement. On the other hand, the number of providers who said they were not at all interested in advancing increased during the two year study, from 10% at the beginning of the study to 20%, 18 months later.
4. There were many factors associated with whether a provider advanced PTQ levels or did not advance over 24 months including motivation, confidence, satisfaction with the benefits of PTQ, the relationship and perceived helpfulness of the coach, and the provider’s current PTQ level. The strongest independent predictors of advancement were:
The provider’s type of child care, current PTQ level, education level, and years of child care experience.
The provider’s intention, motivation, confidence to advance.
The provider’s rating of how helpful the coach was.
The coach’s assessment of the provider’s motivation to advance and likelihood to advance.
5. It is important to continue efforts to make participation and advancement in PTQ perceived to be rewarding for providers. Providers’ motivation to advance and perceptions of the rewards of participation in PTQ were strong predictors that providers would actually move up one or more PTQ quality levels. Continuing efforts to publicly recognize the importance of rated quality and the accomplishments of providers who work to advance quality are critically important.
6. Providers who advance and those who do not advance in the PTQ system may be productively seen as distinct subgroups with diverse characteristics, attitudes, and training/technical

19
assistance needs. We identified four subgroups with high, medium, and low rates of PTQ advancement. These groups differed by type of child care, provider education level, degree of professional engagement, attitudes about PTQ participation, and assessments of the helpfulness of PTQ coaches. We recommend PTQ develop coaching and other support strategies specifically tailored to the needs and attitudes of these subgroups of providers. One large group in need of special focused attention is family child care providers currently rated at PTQ Level 1.

20
2. PTQ Longitudinal Child Outcomes Study The purpose of the two-year longitudinal child outcomes study was to determine if children from low income families using CCDF vouchers are benefitting from PTQ-rated quality in terms of their development, learning, and readiness for school. The main evaluation question was: “Do children who receive more high-rated quality child care over two years show improved development and school readiness, compared with similar children who receive lower or unrated child care?” Both toddlers (12 mo.) and preschool children (36 mo.) were assessed within their child care environments three times over the course of two years. The current child care classrooms or family child care homes were also assessed three times for the quality of teacher-child interactions and organization using the CLASS quality scales. Children’s cognitive, language, and social-emotional development were assessed using valid, evidence-based measures. In addition to the classroom observations and child measures, data were collected in surveys with teachers, directors, and parents. Key Findings
Classroom or family child care quality as assessed by the CLASS was observed to be highly variable, with relatively low average levels for both toddlers and preschoolers. The average CLASS quality levels for PTQ providers were below quality levels typically found in Head Start or other high quality early childhood programs.
Comparing classroom quality in settings for children in higher PTQ-ratings with lower PTQ-
ratings, few average differences were found, and those differences were not large. For
toddlers at about 12 months of age and preschoolers at about 48 and 60 months of age,
higher PTQ-rated settings had slightly higher average levels of CLASS quality.
Looking at children’s developmental gains over 24 months, both toddlers and preschoolers
gained more in early learning and school readiness skills if they had been placed in higher
PTQ-rated child care. (These differences in gains were statistically significant for toddlers, but
not for preschoolers.) Considering children’s vocabulary comprehension, there were no
apparent advantages to children in higher PTQ-rated or lower PTQ-rated child care settings.
Children in all settings showed gains in vocabulary comprehension.
Results showing links between preschoolers’ social-emotional development and PTQ ratings
were mixed. According to child care providers’ (sometimes parents’) ratings, children in all
PTQ level settings increased in social competence. And children in all settings maintained
stable, but low, levels of problem behaviors. In general, most PTQ providers may be
providing more effective support for children’s social-emotional development than for
language and cognitive development. Reliance on caregiver- and parent-reports, rather than
direct observations of the children, make this conclusion less confident.

21
Child Study Methodology At the beginning of the study, 221 children were randomly selected and enrolled. After one year, time 2 assessments were completed for 191 (86%) of these children, and 177 (80%) of the children completed Time 3 (final) assessments after two years. There was some sample attrition: 44 children (20%) did not complete the study by the end (moved out of state, parent opted out, unable to contact family, or the child was removed from the home by CPS.) Children were randomly selected from the state’s database listing all participants in the Child Care and Development Fund (CCDF) voucher assistance program. This sample was constructed to satisfy state legislature requirements in the contract. The sample was stratified so there were approximately equal numbers of toddlers at PTQ Levels 1 and 4 and approximately equal numbers of preschoolers across PTQ Levels 0, 1, 3, and 4. (“Level 0” providers were CCDF voucher recipient providers who were not participating in PTQ.) We selected children in each of the five target regions, and we attempted also to select approximately equal numbers of children in licensed child care centers (LCC), licensed family child care homes (FCC), and registered ministries (RM). Recruitment of the required numbers of participants in some geographic areas and types of care proved challenging, so enrollment in the study took place over an extended time, between January, 2014 and July, 2015. We completed data collection at the first time point for 221 children: 75 toddlers, approximately age 1 year, and 146 preschoolers, approximately age 3 years. This report contains the results of this two-year longitudinal study, focusing on those children for whom we had complete two-year longitudinal data (Assessments at Time 1, Time 2, and Time 3). The complete longitudinal results presented here reflect the data for 221 children (146 preschoolers and 75 toddlers.) The results show children’s developmental and learning growth across this two-year study period. For the 75 toddlers, initial child care placement was at Level 1 (41%) or Level 4 (59%.) For preschoolers, initial placements were at Level 0 (14%), Level 1 (27%), Level 3 (28%), and Level 4 (30%.) During the course of this two-year study, some children changed child care providers, or their provider changed their PTQ quality rating. Regardless of changes in the child care placements over the two years, we continued to follow and assess the children and the observed quality of their child care settings at each time period. What was the Observed Quality of PTQ-Rated Child Care? The CLASS is an observational assessment of educational quality in the classroom or family child care home. It is based on a 2 to 3 hour observation of a typical morning by trained, reliable observers. Quality is scored on a 7-point scale, from 1 or 2 = low quality, to 3, 4, or 5 = mid-level quality, to 6 or 7 = high quality. For toddlers, CLASS scores can be obtained for 2 domains of classroom quality:
Emotional and Behavior Support assesses the emotional climate of the classroom, including warmth, respect, enjoyment, and negativity. It also assesses teacher sensitivity, regard for the children’s perspectives in interactions, and positive methods of behavior guidance.

22
Engaged Support for Learning assesses how the teacher facilitates learning and
development opportunities, the quality of the teacher’s feedback to toddlers, and the quality and amount of language the teacher uses with the children.
For preschoolers, CLASS scores can be obtained for 3 domains of classroom quality:
Emotional Support assesses the degree to which teachers establish and promote a positive climate in their classroom through their everyday interactions.
Classroom Organization assesses classroom routines and procedures related to the organization and management of children's behavior, time, and attention in the classroom.
Instructional Support assesses the ways in which teachers implement the curriculum to effectively promote cognitive and language development.
We observed and assessed CLASS quality in the center, ministry, or home each time we visited to complete a scheduled child assessment. Here we summarize results of these class assessments at Time 1, Time 2, and Time 3 in the child care settings attended by the study children. To examine the CLASS quality of child care rooms or homes attended by these children, how CLASS quality was associated with PTQ ratings, and how CLASS quality may have influenced children’s development over two years, for this report we computed an average overall CLASS quality score by taking the mean of the two or three subscale scores. We then computed the average CLASS quality scores for each child based over the Time 1, 2, and 3 assessments, to obtain a “global” CLASS quality score. The graphs below show the levels of CLASS quality we observed at Time 1, Time 2, and Time 3. Quality in Toddler Classrooms Classroom observations were completed by trained observers. We compared toddler classroom quality at the three assessment points (12, 24, and 36 months of age) by grouping classrooms with lower PTQ ratings (Level less than 3) vs. classrooms with higher PTQ ratings (Level 3 or 4.) For quality of Emotional and Behavioral Support, the the Level 3- and 4-rated classrooms had significantly higher average CLASS scores at the first two assessments (when the children were 12 and 24 mo. of age) but not significantly different at the third assessment (ages 36 mo.) For Engaged Support for Learning, the quality ratings were generally low. Higher PTQ-rated classrooms showed a pattern of higher average CLASS scores across all 3 assessments, and these differences were statistically significant for the second and third ( 24 and 36 mo.) assessments. (See graphs, next page.)

23
Quality in Preschool Classrooms Classroom observations by trained observers showed that many PTQ- and non-PTQ classrooms were relatively low in CLASS quality, compared with Head Start and other high quality classrooms observed in existing child care research. There were significant PTQ Level differences in Emotional Support, Classroom Organization, and Instructional Support at some assessment points, but not others. At Time 1 (child age approximately 36 months) there were no statistically-significant differences in any CLASS scores across Level 0, 1, 3, and 4. At Time 2 (approx. child age 48 mo.) Level 3 and 4 classrooms had significantly higher Emotional Support and Classroom Organization scores than Level 0. There were no significant differences among the rated levels for Instructional Support. At Time 3 (approx. child age 60 mo.) while all quality scores were low, Level 4 classrooms were significantly higher in Emotional Support, Classroom Organization, and Instructional Support than Level 3 classrooms.
1
2
3
4
5
6
7
12 months 24 months 36 months
PTQ Level 3-4 PTQ Level less than 3
Toddler Emotional-Behavioral Support (CLASS)
1
2
3
4
5
6
7
12 months 24 months 36 months
PTQ Level 3-4 PTQ Level less than 3
Toddler Engaged Support for Learning (CLASS)

24
1
2
3
4
5
6
7
36 months 48 months 60 months
Preschool Classroom Emotional Support (CLASS)
PTQ Level 3-4 PTQ Level less than 3
1
2
3
4
5
6
7
36 months 48 months 60 months
Preschool Classroom Organization (CLASS)
PTQ Level 3-4 PTQ Level less than 3
1
2
3
4
5
6
7
36 months 48 months 60 months
Preschool Classroom Instructional Support (CLASS)
PTQ Level 3-4 PTQ Level less than 3

25
Children’s Development as a Function of PTQ-Rated Child Care In the analysis of children’s development we included all children for whom we had complete data over two years: 75 toddlers, with one-on-one assessments conducted at approximate ages 12, 24, and 36 months (Times 1, 2, and 3) in Level 1 vs. Level 4 rated settings, and 146 preschoolers, with one-on-one assessments conducted at approximate ages 36, 48, and 60 months (Times 1, 2, and 3) comparing growth in children placed in Level 3 or Level 4 quality care to growth in children in care settings rated lower than Level 3. To assure that family education differences did not explain any differences we found in the effects of higher vs. lower PTQ-rated care, we controlled statistically for parent education level and adjusted the means accordingly. Toddlers’ Development The Mullen Scales of Early Learning assessments produce an “early learning composite” score, a combination of toddlers’ perceptual/cognitive/fine motor/language skills. Shown below are the average standardized growth lines for toddlers placed in lower- (Level 0, 1, or 2) vs. higher-rated (Level 3 or 4) quality settings at Times 1, 2, and 3, when the children were about 12, 24, and 36 months of age. (Note: the national norm or average score for all children on the Early Learning Composite is 100.) While there were no differences between the two groups at 12 months, over the two-year study the toddlers in higher PTQ-rated care gained in their early learning index scores significantly more than toddlers who experienced lower-rated care. While those in lower-rated care remained at a stable, somewhat below-average level and rate of learning, those in higher-rated care increased to an early learning level near the norms for all 2- to 3-year-olds.
50
60
70
80
90
100
110
120
12 17 22 27 32 37 42 47
Age in months
Toddler Early Learning: Mullen Standard Score
PTQ low PTQ high

26
Caregivers (usually providers, sometimes parents) rated toddlers’ social competence and problem behaviors using the Brief Infant Toddler Social Emotional Assessment (BITSEA) scale. This is a checklist in which the caregiver rates each behavior on 3-point scale (0=not true/rarely, 1=somewhat true/sometimes, 2=very true/always.) The graphs below show the average total raw scores for toddlers placed in higher-rated (Level 4) and lower-rated (Level 1) child care settings across the two years of this study. Toddlers in lower-rated care at 12 months were rated significantly lower in social competence at 12 months of age than toddlers in higher-rated care. However by age 36-42 months, toddlers in lower-rated care were rated slightly higher than toddlers in higher-rated care. These differences were small, and all of the scores are within normal ranges. Toddlers’ problem behaviors were generally reported by caregivers to be low, and there were no significant differences in problem behaviors comparing children in lower-rated and higher-rated child care settings.
0
10
20
30
40
12 17 22 27 32 37 42 47
Age in months
Toddler Social- Emotional Competence (BITSEA)
PTQ low PTQ high
0
10
20
30
40
50
60
12 17 22 27 32 37 42 47
Age in months
Toddler Social-Emotional Problem Behaviors (BITSEA)
PTQ low PTQ high
27
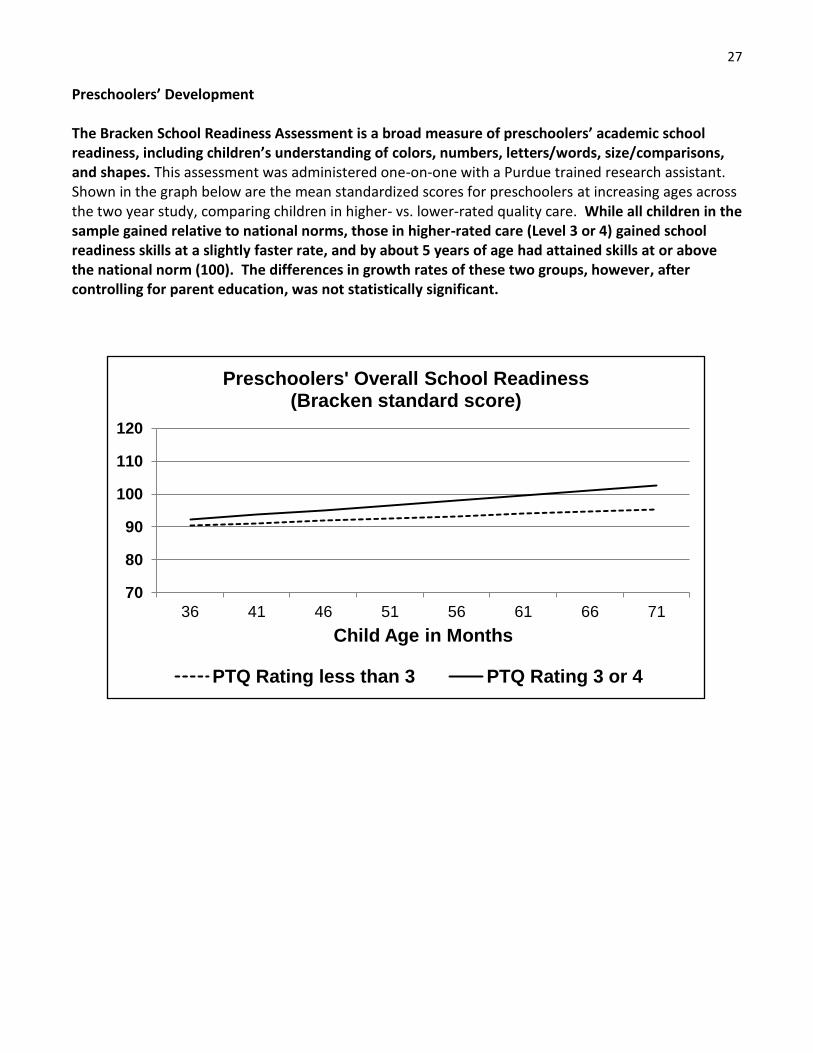
Preschoolers’ Development The Bracken School Readiness Assessment is a broad measure of preschoolers’ academic school readiness, including children’s understanding of colors, numbers, letters/words, size/comparisons, and shapes. This assessment was administered one-on-one with a Purdue trained research assistant. Shown in the graph below are the mean standardized scores for preschoolers at increasing ages across the two year study, comparing children in higher- vs. lower-rated quality care. While all children in the sample gained relative to national norms, those in higher-rated care (Level 3 or 4) gained school readiness skills at a slightly faster rate, and by about 5 years of age had attained skills at or above the national norm (100). The differences in growth rates of these two groups, however, after controlling for parent education, was not statistically significant.
70
80
90
100
110
120
36 41 46 51 56 61 66 71
Child Age in Months
Preschoolers' Overall School Readiness (Bracken standard score)
PTQ Rating less than 3 PTQ Rating 3 or 4

28
The Peabody Picture Vocabulary Test (PPVT-4) is an assessment of the child’s word recognition or language comprehension, and important aspect of early literacy and other learning. These assessments were administered one-on-one with a trained Purdue assessor. All preschool children in the study increased in their receptive vocabulary, gaining relative to national norms, reaching national norms or above by age 5 years. There were no differences in the rates of learning for children comparing higher- and lower-rated child care settings.
60
80
100
120
36 41 46 51 56 61 66 71
Age in months
Preschoolers' Receptive Vocabulary (PPVT Standard Score)
PTQ Rating less than 3 PTQ Rating 3 or 4
29
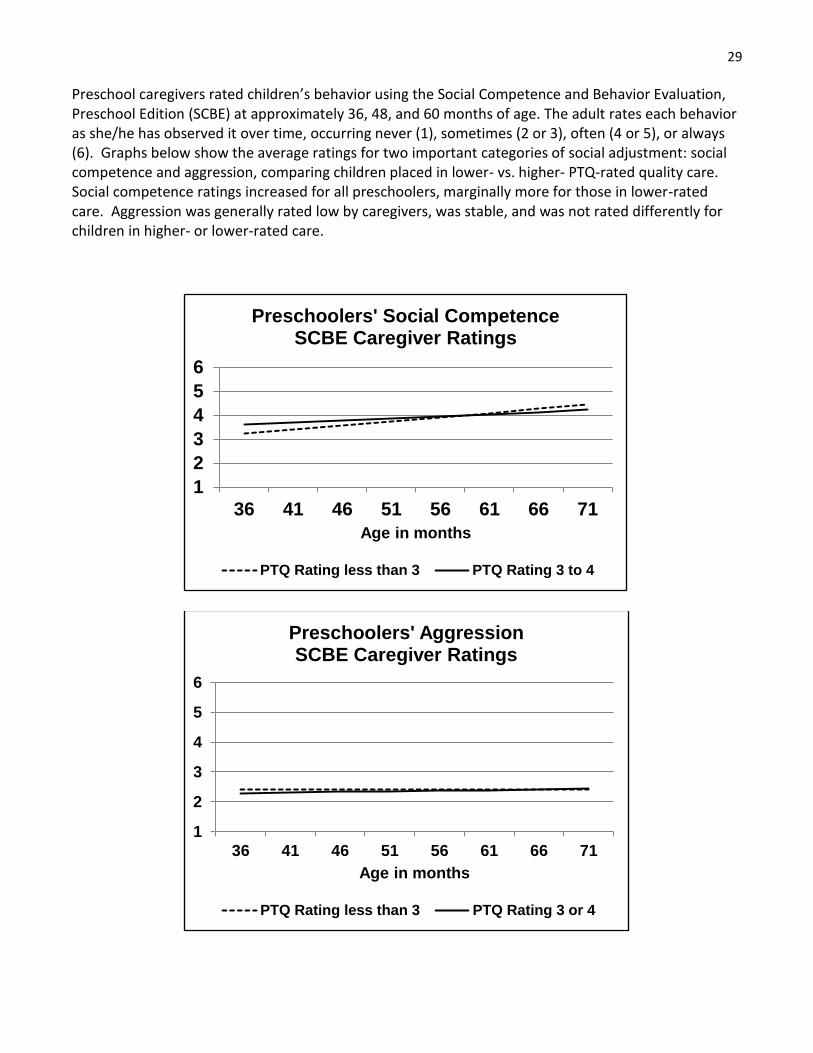
Preschool caregivers rated children’s behavior using the Social Competence and Behavior Evaluation, Preschool Edition (SCBE) at approximately 36, 48, and 60 months of age. The adult rates each behavior as she/he has observed it over time, occurring never (1), sometimes (2 or 3), often (4 or 5), or always (6). Graphs below show the average ratings for two important categories of social adjustment: social competence and aggression, comparing children placed in lower- vs. higher- PTQ-rated quality care. Social competence ratings increased for all preschoolers, marginally more for those in lower-rated care. Aggression was generally rated low by caregivers, was stable, and was not rated differently for children in higher- or lower-rated care.
1
2
3
4
5
6
36 41 46 51 56 61 66 71
Age in months
Preschoolers' Social Competence SCBE Caregiver Ratings
PTQ Rating less than 3 PTQ Rating 3 to 4
1
2
3
4
5
6
36 41 46 51 56 61 66 71
Age in months
Preschoolers' Aggression SCBE Caregiver Ratings
PTQ Rating less than 3 PTQ Rating 3 or 4

30
Children’s Development as a Function of Child Care Dosage We examined the effects of child care dosage (total amount of time spent in child care, at any PTQ level) on children’s development by analyzing the association of total hours in care, controlling for the effects of parents’ education level. Toddlers: Child Care Dosage
Number of hours in care was not statistically associated with changes in toddlers’ early learning skills or problem behavior over two years. However, at age 36 months, children in the high dosage group (hours in care 1 SD above mean) had 7 higher points on the Mullen early learning skills scale compared to the children in the low dosage group (dosage 1 SD below mean).
When toddlers experienced fewer hours of quality child care, they gained social skills at a significantly faster rate than when they experienced more quality hours of care. At 36 months, the difference between the low dosage group (dosage 1 SD below mean) and high dosage group (1 SD above mean) was 3 points on the social competence scale, such that the low dosage group showed greater increases in social competence.
Caregivers did however report more gains in toddlers’ social competence among children who experienced fewer hours of care, compared with those who experienced more hours of care. The low dosage group gained 8 pts. in social competence over two years, while the high dosage group gained 5 pts.
Preschoolers: Child Care Dosage
There were no significant effects for hours of child care preschoolers attended in levels or gains in school readiness.
Preschoolers who experienced lower dosage levels (fewer hours of care) gained more over two years in their language comprehension skills than those with higher dosage levels.
For preschoolers, there was no significant effect of dosage on either social competence or aggressive behavior.
Children’s Development as a Function of CLASS Quality We examined the impact of CLASS quality by analyzing the association of child outcomes with global CLASS scores, averaged over the three annual CLASS observations. These analyses statistically controlled for the potential effects of parents’ education levels. Toddlers: CLASS quality
Toddlers in general showed gains in early learning skills. Those who were in settings rated highest on global CLASS (average of Emotional Support and Engaged Support for Learning; 1 SD above the mean) started out higher at 12 months in early learning skills, but had somewhat lower gains over two years than those in settings with lower CLASS global ratings (1 SD below the mean.) CLASS quality was not related to early learning scores at 36 months Mullen scores, nor to changes in early learning over the two year study.
There were no differences in problem behaviors and social competence, at the start of the study (12 mo.) between toddlers in classrooms with average, high (+1 SD above the mean) or

31
low (-1 SD below the mean) global CLASS scores. Furthermore, no differences by levels of CLASS scores were observed for changes in social competence or changes in problem behaviors over the course of the study (from 12 to 36 mo.)
Preschoolers: CLASS quality
At 36 months of age, school readiness was higher for preschoolers in settings rated higher in overall quality with CLASS (combining Emotional Support, Classroom Organization, Instructional Support; 1 SD above the mean.) At 36 months, the children in settings with higher global CLASS quality had a mean of 96 on the Bracken standard scale, vs. 87 for children in the lower CLASS quality settings. However, readiness skills converged over two years. Children in lower CLASS-rated settings had more rapid gains, so that by 60 months of age, the preschoolers in both CLASS quality groups had similar levels of school readiness; children in higher CLASS-rated settings (Bracken M=99) were not statistically different from children in lower CLASS-rated settings (Bracken M=96).
At 36 months, children in higher CLASS-rated settings had significantly higher receptive vocabulary (PPVT) scores than those in lower CLASS-rated settings (98 vs. 91, standard scores.) However, by 60 months, the CLASS quality groups had converged at 105, with children in lower CLASS-rated settings showing more rapid gains. CLASS quality was linked to social skills. Throughout the two year study, preschoolers who were in higher CLASS-rated child care settings displayed moderately more social skills, as reported by caregivers. Both groups showed similar rates of growth over time.
CLASS-rated quality was not associated with levels or changes of preschoolers’ aggression or anxiety.
Conclusions and Recommendations: Longitudinal PTQ Child Outcome Study
1. The results of this longitudinal child outcome study are specific to Indiana children from low-income families in five state regions who were enrolled in the CCDF voucher program.
2. Results of this study demonstrated that moderate advantages were conferred to both toddlers’ and preschoolers’ early learning and school readiness prior to kindergarten, by spending two years in Level 3 or Level 4 PTQ-rated quality care, compared with Level 1 or unrated care.
3. While Level 4 child care providers appeared to provide somewhat higher levels of classroom quality than lower PTQ-rated providers, as measured by the CLASS quality observations, these quality differences did not result consistent gains in cognitive, language, and social-emotional development for children in all age groups.
4. Toddlers in higher PTQ-rated care showed significant gains over two years in early learning skills, but not in social skills.
5. All preschoolers in the study, regardless of PTQ level, gained in school readiness and language comprehension over two years. Preschoolers in Level 3 to 4 care showed slightly higher, but not statistically-significant, gains. Preschoolers in Level 3 and 4 care did not show more rapid growth in vocabulary or social skills, compared with children in lower-rated or unrated care.
6. While obtaining higher PTQ ratings clearly elevate child care quality in some ways, the amount or types of quality change that result may not be sufficient to produce strong, long-term gains in school readiness, social skills, emotional well-being, and early school success. Previous

32
research in other states has shown that in order for early childhood programs to produce lasting benefits, they must reach at least a “threshold” level of quality. While some Indiana PTQ Level 3 and Level 4 providers did reach recommended quality thresholds, many with ratings at 3 or 4 did not. CLASS quality at all PTQ levels was highly variable.
7. Focusing solely on CLASS quality, however, may not be the best answer. Among children in this longitudinal sample, CLASS global scores, based on three annual observations in the child care settings, did not predict gains for most child outcomes. Only preschoolers’ social skills ratings were consistently related to CLASS quality.
8. We recommend that the state take steps to increase PTQ standards to emphasize factors that have been shown in other states to be associated with significant child outcomes in effective early education programs: caregiver-child interaction quality, including support for social, emotional, cognitive and language development; and verified use of state-approved, evidence-based curricula at Levels 3 and 4, with coaching support for the curriculum.
9. For language comprehension, an important early skill related to literacy and general school success, preschool children in Level 3 and Level 4 care started and ended this 2 year study with levels of understanding not significantly different than children in Level 0, 1, or 2 care. All children at all rated levels made gains in receptive vocabulary over 2 years, but those in Level 3 or Level 4 care did not gain more, or faster. As recommended above, more emphasis on caregivers’ support for language development is indicated, in PTQ Level 3 and Level 4 standards, and in any approved child care curricula, for both English speakers and English language learners.
3. Statewide Parent Survey: Awareness and Use of Paths to QUALITY A randomized telephone survey of parents in Indiana with children ages 0 to 5 years, all households using some form of out-of-home child care, was conducted by the Kent State University Survey Center in 2009 and repeated in 2011, 2015, and 2017. In 2015 and 2017 cellular phones were included, in addition to land line phones. In 2017, 83% of the respondents were interviewed on mobile phones, 17% on land line phones. 450 completed surveys were collected, including households at all income levels, covering all 9 CCRR Service Delivery Areas (SDA) regions in the state. The margin of error at a 95% confidence interval is 4.62%. Parents responding to these surveys reported use of all types of child care. Parents in 2009 and 2011 reported similar use of child care, averaging 28 hours per week. Parents surveyed in 2015 used various types of child care, formal and informal, licensed and unregulated. The most commonly used type in 2015 was the licensed child care center (45%). Parents surveyed in 2017 also used various types of child care. The most commonly used type was the licensed child care center (49%) followed by the licensed family child care home (17%), informal care by a family member (17%), preschool or nursery (16%), and church-affiliated registered ministry center (14%). Hours of care per week ranged from 1 to 97, with an average of 33 hours per week. In all surveys parents were asked, “Have you ever heard of Indiana’s Paths to QUALITY child care quality improvement program before I called you today?” Initially awareness was low, with a slight increase from 2009 to 2011 in parents’ awareness of PTQ. In 2015, there was a substantial increase in PTQ awareness, with 57% reporting they had heard of the

33
program. In 2017 there was small, marginally significant increase in PTQ awareness, with 61% reporting they had heard of the program.
12% of 2009 parents, 19% of 2011 parents, 57% of 2015 parents, and 49% of 2017 parents reported they were aware their provider was enrolled in PTQ (24% of 2017 parents reported they did not know if their provider was in PTQ.) In all 4 surveys, significant numbers of parents said that a higher PTQ level would influence future decisions about where to enroll their child in child care. 61% of 2009 parents, 71% of 2011 parents, 75% of 2015 parents, and 73% of 2017 parents said that PTQ level would “influence their future child care decisions.” When asked how important the PTQ rating level would be in their future child care decisions, 74% of 2017 respondents said it would be either “very important” or “important.” 47% of 2009, 57% of 2011, and 59% of 2015 parents reported they would be willing to pay more for child care rated at a higher PTQ level. In the 2017 survey, 58% of parents reported they would be willing to pay more for higher-rated care. (No = 26%; Don’t Know = 15%; see graph, next page.)
0%
20%
40%
60%
80%
100%
2009 2011 2015 2017
Preschoolers' Parents Reporting They Were Aware of PTQ

34
Indiana Parent Surveys: Conclusions and Recommendations Overall, randomized representative surveys of Indiana parents with preschool children in out-of-home child care conducted between 2009 and 2015 showed increases in public awareness of PTQ, from 19% to 57%-- a key condition for success in a market-based child care quality rating and improvement system. Between 2015 and 2017, parent awareness of PTQ leveled off, increasing slightly but marginally to 61%. The survey results show that about 75% of Indiana preschoolers’ parents place importance in the PTQ ratings as a source of information to help make their child care decisions. In 2015 and 2017 similar numbers of parents reported they would rely on PTQ ratings as an important source of information, and in 2017 a majority of parents stated they would be willing to consider paying more for child care rated higher by PTQ. Because the population of Indiana families with young children is ever-changing, and because the effectiveness of PTQ requires that parents know about PTQ and rated quality, it is essential that FSSA keep PTQ in the public eye, using sustained and effective public awareness strategies. It has become especially important to use social networking and mobile phone applications to reach families with low incomes, as this seems to have become a primary source of information.
Yes 58%
No 26%
Don't Know 15%
Refused 1%
Would you be willing to pay more for higher PTQ rated care?

35
PTQ Evaluation Publications
Elicker, J. & Ruprecht, K. (in press). Child care quality rating and improvement systems (QRIS): A national experiment in improving quality. In Brown, C.P., McMullen, M.B., & File, N.K. (Eds.). Handbook of Early Childhood Care and Education. Hoboken, NJ: Wiley.
Elicker, J., Ruprecht, K., Gold, Z. & Mishra, A. (2015). Paths to QUALITY evaluation progress report.
West Lafayette, IN: Purdue University. Elicker, J. (2015). Paths to QUALITY evaluation brief report. West Lafayette, IN: Purdue University. Lahti, M., Elicker, J., Zellman, G., & Fiene, R. (2014). Approaches to validating child care quality rating
and improvement systems (QRIS): Results from two states with similar QRIS type designs. Early Childhood Research Quarterly, 30,280-290. doi:10.1016/j.ecresq.2014.04.005
Elicker, J., Ruprecht, K.M., Langill, C., Lewsader, J., Anderson, T. & Brizzi, M. (2013). Paths to
QUALITY™: Collaborative evaluation of a new child care quality rating and improvement system. Early Education and Development, 24, 42-62. doi: 10.1080/10409289.2013.736127.
Langill, C., Elicker, J., & Ruprecht, K. (2013). Paths to QUALITY evaluation technical manual: Phase 2
evaluation methods and measures (Technical Report no. 5). West Lafayette, Indiana: Center for Families, Purdue University.
Ruprecht, K., Langill, C., Elicker, J., & Anderson, T. (2013). Paths to QUALITY™. Child care provider focus
group report: Summary of findings from PTQ licensed child care center directors, registered ministry directors, and family child care providers. (Technical Report no. 4). West Lafayette, Indiana: Center for Families, Purdue University.
Martinez-Beck, I., Rudisill, S., Tout, K., Zellman, G. L., Maxwell, K., Lahti, M., Elicker, J., & et al. (2012).
Validating the quality rating and improvement systems (QRIS). Washington, DC: U.S. Administration for Children and Families, Office of Planning, Research and Evaluation.
Anderson, T. & Elicker, J. (2012). Evaluation Brief #1: Key Findings. Retrieved from
http://www.cfs.purdue.edu/cff/documents/project_reports/PTQ_EvaluationReport-1-FINAL-9.5.12.pdf
Anderson, T. & Elicker, J. (2012). Evaluation Brief #2: Does Paths to QUALITY™ Produce Quality Care
and Education for Indiana’s Young Children? Retrieved from http://www.cfs.purdue.edu/cff/documents/project_reports/PTQ_EvaluationBrief2.pdf
Anderson, T. & Elicker, J. (2012). Evaluation Brief #3: Does Paths to QUALITY™ Benefit Indiana’s Child
Care Providers? Retrieved from http://www.cfs.purdue.edu/cff/documents/project_reports/PTQ_EvaluationBrief3%2011_19_12.pdf

36
Anderson, T. & Elicker, J. (2012). Evaluation Brief #4: Does Paths to QUALITY™ Help Indiana Parents
Find Quality Child Care? Retrieved from http://www.cfs.purdue.edu/cff/documents/project_reports/PTQ_EvaluationBrief4-11_05_12.pdf
Elicker, J., Langill, C.C., Ruprecht, K., Lewsader, J., & Anderson, T. (2011). Evaluation of “Paths to
QUALITY,” Indiana’s child care quality rating and improvement system: Final report. (Technical report no. 3; 43 pgs.; plus appendix). West Lafayette, IN: Center for Families, Purdue University.
Langill, C., Elicker, J., Ruprecht, K., Kwon, K., & Guenin, J. (2009). Paths to QUALITY- A child care
quality rating and improvement system for Indiana: Evaluation methods and measures. (Technical report no. 2). West Lafayette, Indiana: Center for Families, Purdue University.
Elicker, J., Langill, C.C., Ruprecht, K., & Kwon, K. (2007). Paths to QUALITY- Child care quality rating
system for Indiana: What is its scientific basis? (Technical report no. 1). West Lafayette, IN: Center for Families, Purdue University.