final report project #30 electromagnetic hoverboard
TRANSCRIPT
Aalto University, School of Electrical Engineering
Automation and Electrical Engineering (AEE) Master's Programme
ELEC-E8002 & ELEC-E8003 Project work course
Year 2017
Final Report
Project #30
Electromagnetic Hoverboard
Date: 29.5.2017
Jaakko Narko
Juha Mäkelä
Usama Riaz
Shayan Daryabin
Sami Malaska
Rajeetharan Sanchayan

i
Information page Students
Jaakko Narko
Juha Mäkelä
Usama Riaz
Shayan Daryabin
Sami Malaska
Rajeetharan Sanchayan
Project manager
Jaakko Narko
Official Instructor
Victor Mukherjee
Other advisors
Antti Lehikoinen
Starting date
5.1.2017
Completion date
29.5.2017
Approval
The Instructor has accepted the final version of this document
Date: 28.5.2017

ii
Abstract In this project, electromagnetically levitating hoverboard is built. The levitation is made possible by
feeding alternating current through a coil, which is placed over aluminium sheet. The coil creates
alternating magnetic field when alternating current is fed to it and this magnetic field induces
alternating eddy current to the aluminium sheet. Eddy currents create opposing alternating magnetic
field and the interaction of magnetic fields produce lifting force.
During project, a feasibility study was conducted by researching requirements to produce
enough lift for given mass so levitation is achieved. Project also included designing and constructing
planar coils, inverter and body for the hoverboard. Design process consisted of drafting schematics
and plans as well as selecting components and materials for construction. Hoverboard testing was
conducted to validate simulations and designs. Tests consisted of system turn-on tests, full system
tests, failure analysis and problem solving.
In the short business aspect exercise hoverboard was given product name “HoveBev” from
the business idea that hoverboard could be used to levitate beverages.
The hoverboard was never fully realized as per to project plan. Project itself was successful
as a university project in teaching students practical project work, teamwork and problem solving
skills. It also gave practical experience in fields of electromagnetism, power electronics, electronics,
power systems and mechanical design.

iii
Table of Contents Information page i
Abstract ii
1. Introduction 1
2. Objective 2
3. Project plan 2
4. Feasibility Study 2
4.1. Requirements for levitating a person 3
4.2. Conclusions from Feasibility Study 5
5. Design 6
5.1. Coil 6
5.2. Inverter 7
6. Construction 8
6.1. Coil 9
6.2. Inverter 11
6.3. Body 16
7. Testing and results 19
7.1. Hoverboard 19
7.2. Inverter 19
8. Inverter failures and solutions 22
9. Reflection on the Project 24
9.1. Reaching objective 24
9.2. Timetable 24
9.3. Risk analysis 25
9.4. Project Meetings 25
9.5. Quality management 25
10. Discussion and Conclusions 26
List of Appendix 27
References 27
Page 1 of 27
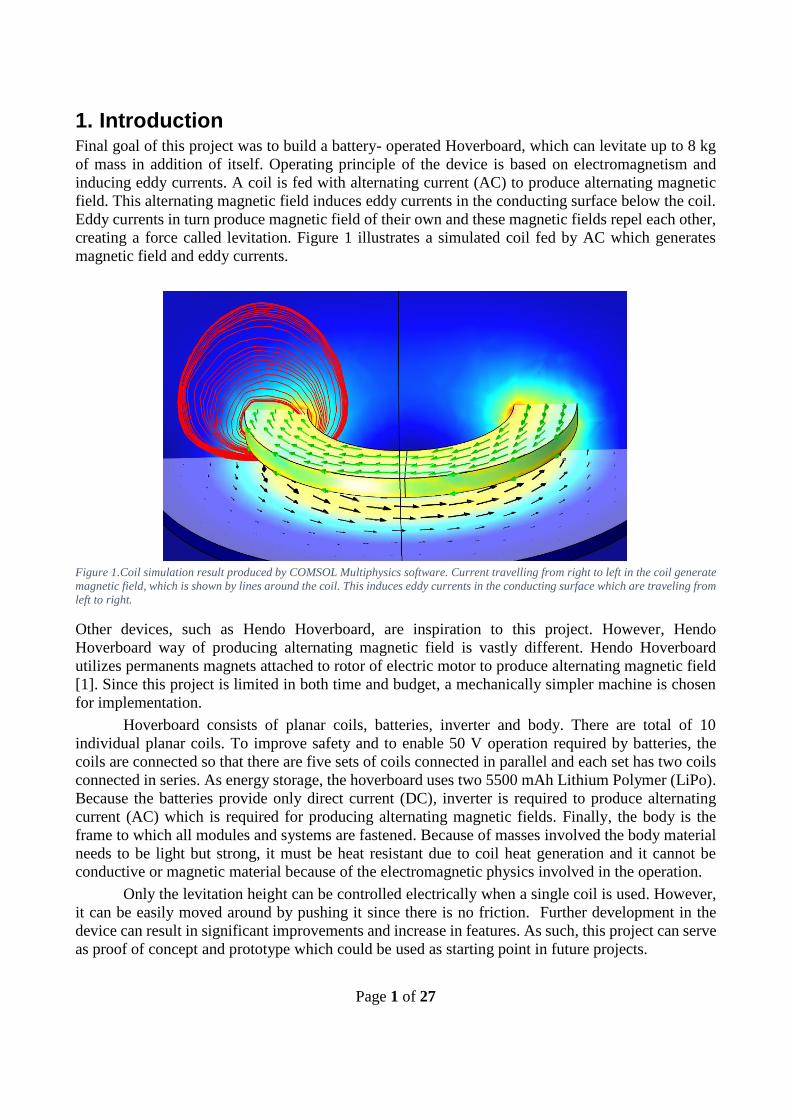
1. Introduction Final goal of this project was to build a battery- operated Hoverboard, which can levitate up to 8 kg
of mass in addition of itself. Operating principle of the device is based on electromagnetism and
inducing eddy currents. A coil is fed with alternating current (AC) to produce alternating magnetic
field. This alternating magnetic field induces eddy currents in the conducting surface below the coil.
Eddy currents in turn produce magnetic field of their own and these magnetic fields repel each other,
creating a force called levitation. Figure 1 illustrates a simulated coil fed by AC which generates
magnetic field and eddy currents.
Figure 1.Coil simulation result produced by COMSOL Multiphysics software. Current travelling from right to left in the coil generate
magnetic field, which is shown by lines around the coil. This induces eddy currents in the conducting surface which are traveling from
left to right.
Other devices, such as Hendo Hoverboard, are inspiration to this project. However, Hendo
Hoverboard way of producing alternating magnetic field is vastly different. Hendo Hoverboard
utilizes permanents magnets attached to rotor of electric motor to produce alternating magnetic field
[1]. Since this project is limited in both time and budget, a mechanically simpler machine is chosen
for implementation.
Hoverboard consists of planar coils, batteries, inverter and body. There are total of 10
individual planar coils. To improve safety and to enable 50 V operation required by batteries, the
coils are connected so that there are five sets of coils connected in parallel and each set has two coils
connected in series. As energy storage, the hoverboard uses two 5500 mAh Lithium Polymer (LiPo).
Because the batteries provide only direct current (DC), inverter is required to produce alternating
current (AC) which is required for producing alternating magnetic fields. Finally, the body is the
frame to which all modules and systems are fastened. Because of masses involved the body material
needs to be light but strong, it must be heat resistant due to coil heat generation and it cannot be
conductive or magnetic material because of the electromagnetic physics involved in the operation.
Only the levitation height can be controlled electrically when a single coil is used. However,
it can be easily moved around by pushing it since there is no friction. Further development in the
device can result in significant improvements and increase in features. As such, this project can serve
as proof of concept and prototype which could be used as starting point in future projects.
Page 2 of 27
2. Objective There were two main objectives for the project. Because the project is part of university course,
primary objective was learning practical skills required in industry, team working skills and project
work skills. Secondary objective was creating a functioning device corresponding to instructors
demands and requirements.
Original goal of the project was to build hoverboard that is capable of levitating equivalent
mass of adult human being between 50-80 kg. As described in the feasibility study section of this
document, this was proven to be infeasible and goal was reduced to levitating 18 kg total. The device
itself was estimated to weigh 8-10 kg and during the progress of the project the goal was set to
levitating 8 kg of load in addition of the device itself.
3. Project plan At the start of the project the intent of project plan was to create tasks that could be divided among
group members and to form a logical path and guideline which could be used and followed throughout
the entire project. The project was divided into five phases: Feasibility Study, Design, Part
Acquisition, Implementation and Testing. These phases also served as milestones of the project. All
phases and their purposes are listed below:
● The goal of phase one, the Feasibility Study, was to find out what is possible and what would
be infeasible to implement. Feasibility study also explored different features for the device
such as control, remote control and safety mechanisms.
● Objective of second phase, called Design phase, was to find out all the necessary components
that would need to be acquired as well as prepare schematics and plans for all components
and subsystems that were meant to be implemented.
● During third phase, called Part Acquisition phase, all the necessary parts were listed and it
included finding retailers from whom the parts could be purchased from.
● All the building and manufacturing was done during the fourth phase, called Implementation
phase.
● Final phase, called Testing phase, was intended to be part of the project where most intensive
tests would be performed and when any major issues would be solved through iteration.
Project plan also included risk assessment and the point of it was to evaluate, estimate and predict
potential risks that project group could be facing. The risk of electrocution was raised as prime
concern and this was one of the reasons why 50 V was chosen as operating voltage, since it is regarded
as extra low voltage (ELV) and therefore the risk of electrocution is low albeit present.
4. Feasibility Study Since this project was a proof of concept prototype and no documentation or evidence of similar
devices or products were found, a feasibility study was deemed necessary. The feasibility study began
with examining and researching what is possible for project group to create. The study was begun by
confirming if the levitation of human being was possible with the project group skills, time and
budget.
The following limitations were placed upon the project group at the start of the project and
were the starting point of the feasibility study:
Page 3 of 27
● Parts which are not available from university, and thus much be acquired, shall not exceed
the 1000 € budget
● It should be possible to complete the project within 4 months of time, with 1200-1400 hours
total time spent working from 6 group members
● Hoverboard shall operate at extra low voltage of 50 V, to minimize the risk of electric shock
● Hoverboard must be able to lift adult person, equivalent to approximately 60-80 kg of mass
● Hoverboard must be safe to operate
Feasibility study was mainly conducted using COMSOL Multiphysics simulation software.
COMSOL has built in magnetic physics package and coil tool that allowed project group to research
and study the project and the physics behind its operation with relative ease. Simple 2D models were
enough to determine almost all requirements for this project.
4.1. Requirements for levitating a person The most important requirement for the project is the physics behind magnetic levitation using
electromagnetism. COMSOL Multiphysics software is used to simulate and determine voltage,
current and power requirements of the hoverboard. COMSOL offers most of the tools required to
specify initial design for the coils and bottom material properties since it is sufficiently realistic
simulation software, able to produce results that agree well with the actual implementation results.
Thus, simple 2D models were used. These models were the tools used to simulate any given
symmetric coil floated above a conducting sheet. In the simulations, the group members researched
the lift force, required power, voltage and current, generated magnetic fields and their interaction and
electrical characteristics of the coil.
Initially project group found that given enough current and turns of copper wire one can
levitate almost everything. However, this quickly changed after attention was paid to voltage, power
and current requirements of the simulation. From this it was apparent that there would be significant
limitations to what project could implement.
When losses and required diameter of conductor were taken into consideration, project faced
obstacle that has no feasible solution. Levitating 80 kg of load with nothing but electromagnetism
would result in minimum 10 kW of real power lost as heat in the coils and would require up to 10
kVAr of reactive power and results in up to 14 kVA of apparent power. In comparison, this is
equivalent power output of medium sized diesel generator such as model TP-P14-T1-50
manufactured by Triton Power which weighs 481 kg [2]. The hoverboard would also require over 20
kg and 2 km of copper wire to be wound.
Results of one simulations are plotted in figures 2, 3 and 4. In these simulations 20 A current
is fed in coil with 0.41 m centre radius and coil size (turns and weight) is increased with every
simulation sweep.

Page 4 of 27
Figure 2. Lift to coil weight plot.
Figure 2 displays the lift to coil weight ratio. From figure 2 it is seen that the heavier the coil is, more
turns it can have and this results in higher lift to weight ratio. Rise of lift to weight ratio is rapid in
the beginning but begins to saturate after 2:1 ratio.
Figure 3. Lift to Power plot.
Figure 3 displays the lift to power ratio. It is important to understand, that the power in figure 3
displays the resistive losses of the coil, which are dissipated as heat. This means the resistive losses
and the resistive losses to lift ratio continues to increase as the number of coil turns and thus mass of
the coils s increased. This result does not take into account the increased resistance of the coil as the
Lift to Power
Lift to Coil Weight
Page 5 of 27
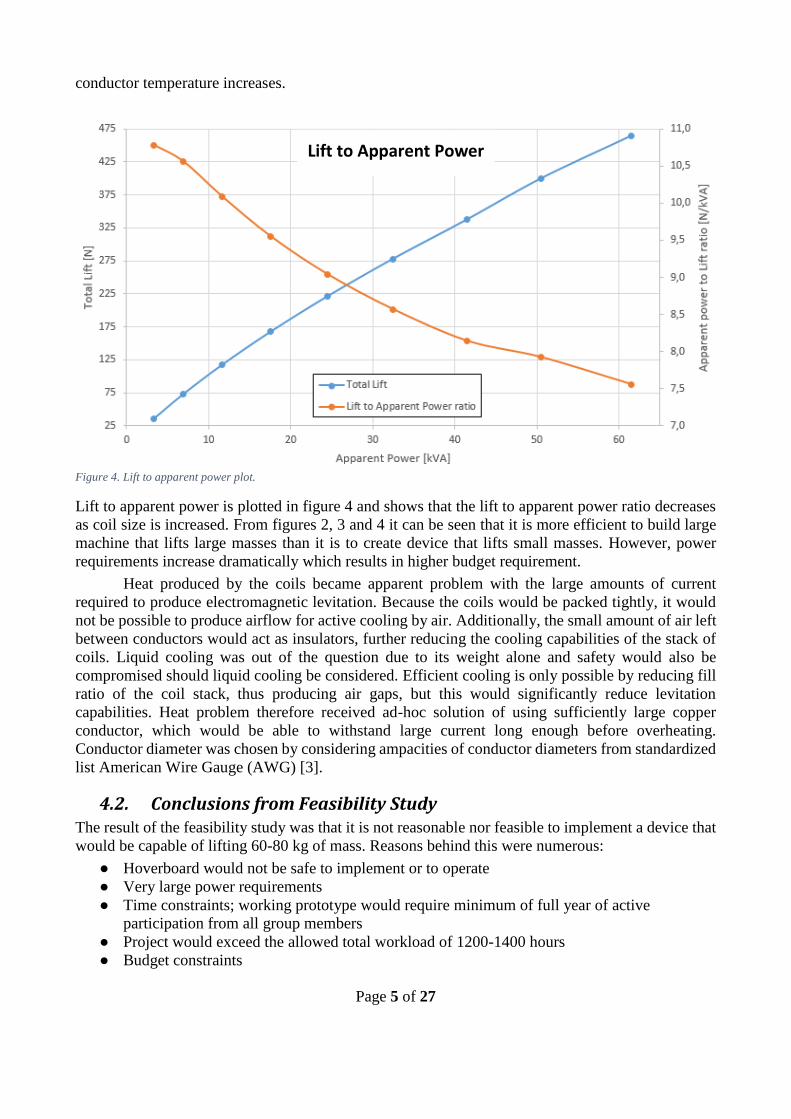
conductor temperature increases.
Figure 4. Lift to apparent power plot.
Lift to apparent power is plotted in figure 4 and shows that the lift to apparent power ratio decreases
as coil size is increased. From figures 2, 3 and 4 it can be seen that it is more efficient to build large
machine that lifts large masses than it is to create device that lifts small masses. However, power
requirements increase dramatically which results in higher budget requirement.
Heat produced by the coils became apparent problem with the large amounts of current
required to produce electromagnetic levitation. Because the coils would be packed tightly, it would
not be possible to produce airflow for active cooling by air. Additionally, the small amount of air left
between conductors would act as insulators, further reducing the cooling capabilities of the stack of
coils. Liquid cooling was out of the question due to its weight alone and safety would also be
compromised should liquid cooling be considered. Efficient cooling is only possible by reducing fill
ratio of the coil stack, thus producing air gaps, but this would significantly reduce levitation
capabilities. Heat problem therefore received ad-hoc solution of using sufficiently large copper
conductor, which would be able to withstand large current long enough before overheating.
Conductor diameter was chosen by considering ampacities of conductor diameters from standardized
list American Wire Gauge (AWG) [3].
4.2. Conclusions from Feasibility Study The result of the feasibility study was that it is not reasonable nor feasible to implement a device that
would be capable of lifting 60-80 kg of mass. Reasons behind this were numerous:
● Hoverboard would not be safe to implement or to operate
● Very large power requirements
● Time constraints; working prototype would require minimum of full year of active
participation from all group members
● Project would exceed the allowed total workload of 1200-1400 hours
● Budget constraints
Lift to Apparent Power
Page 6 of 27
● Inexperienced project group members; group consisted of students with limited work life
experience and complete lack of practical experience in electromagnetic levitation
Based on the results of the feasibility study, goal of levitating a human was abandoned and new goal
was set by the instructor. The total mass to be levitated was reduced to 18 kg, of which 6-8 kg was
estimated to be weight of the device. This set the targeted load to 8 kg and levitation height to 10 cm
altitude. Project group confirmed that this could be feasible.
Feasibility study also produced several ideas and features which could be implemented as
improvements to the hoverboard if time and budget allowed for such improvements to be made. These
improvements included fuses which would stop the hoverboard in case of short circuit, remote control
by smartphone via Bluetooth to control the levitation height and locomotion of the hoverboard could
also be made possible with additional coils located at different parts of the hoverboard. These features
were left as extra challenge for project group to be implemented once basic operation was achieved.
5. Design With more feasible and more realistic goal, the project group set out to optimize a hovering system
to get as efficient hoverboard as possible with the given budget. Desired characteristics included high
levitation height (5 to 10 cm) and high lift of around 8 to 10 kg of load.
Because the hoverboard was intended to be battery operated so that it can be moved around,
the project required an inverter to be designed. This process would include selecting components for
H-bridge, creating control circuitry for the H-bridge and programming microcontroller to produce
signals for control circuitry.
5.1. Coil To find suitable design, iterative process was created. While COMSOL allows users to make
parametric sweeps to find possibilities for design, creating a parametric sweep for more than three
parameters begins to take too much time due to insufficient computational power. Therefore, a better
method was utilized. In this method, each parameter was tested independently. The results were
analysed and another iteration was done for the next parameter. This was done until all parameters
were simulated and results analysed. The parameters to be optimized included:
● Coil radius
● Coil width
● Coil height
● Frequency
● Number of turns
● Coil current
● Thickness of aluminium sheet
These parameters had to be adjusted so that current trough coil and voltage across the system
remained within limits. Because of the low voltage requirement, coil had to be split into smaller coils
connected in parallel to each other. Parameters for optimal design produced through simulations are
listed in table 1.
Page 7 of 27
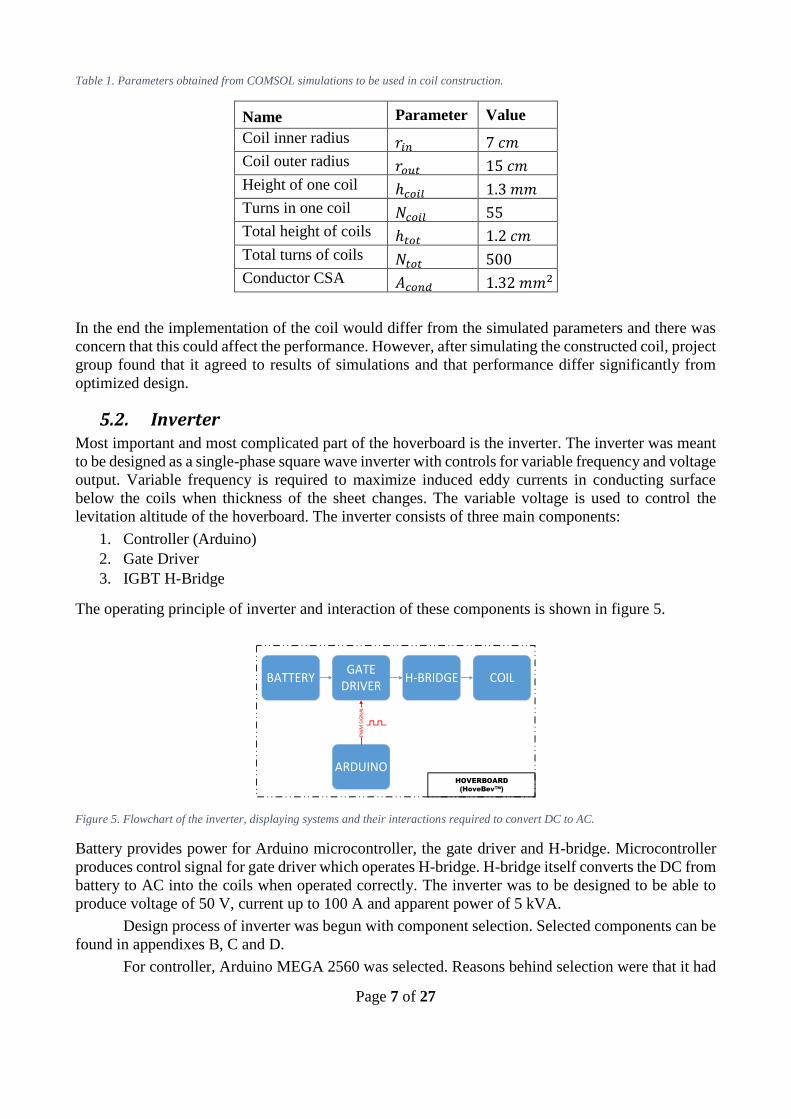
Table 1. Parameters obtained from COMSOL simulations to be used in coil construction.
Name Parameter Value
Coil inner radius 𝑟𝑖𝑛 7 𝑐𝑚
Coil outer radius 𝑟𝑜𝑢𝑡 15 𝑐𝑚
Height of one coil ℎ𝑐𝑜𝑖𝑙 1.3 𝑚𝑚
Turns in one coil 𝑁𝑐𝑜𝑖𝑙 55
Total height of coils ℎ𝑡𝑜𝑡 1.2 𝑐𝑚
Total turns of coils 𝑁𝑡𝑜𝑡 500
Conductor CSA 𝐴𝑐𝑜𝑛𝑑 1.32 𝑚𝑚2
In the end the implementation of the coil would differ from the simulated parameters and there was
concern that this could affect the performance. However, after simulating the constructed coil, project
group found that it agreed to results of simulations and that performance differ significantly from
optimized design.
5.2. Inverter Most important and most complicated part of the hoverboard is the inverter. The inverter was meant
to be designed as a single-phase square wave inverter with controls for variable frequency and voltage
output. Variable frequency is required to maximize induced eddy currents in conducting surface
below the coils when thickness of the sheet changes. The variable voltage is used to control the
levitation altitude of the hoverboard. The inverter consists of three main components:
1. Controller (Arduino)
2. Gate Driver
3. IGBT H-Bridge
The operating principle of inverter and interaction of these components is shown in figure 5.
Figure 5. Flowchart of the inverter, displaying systems and their interactions required to convert DC to AC.
Battery provides power for Arduino microcontroller, the gate driver and H-bridge. Microcontroller
produces control signal for gate driver which operates H-bridge. H-bridge itself converts the DC from
battery to AC into the coils when operated correctly. The inverter was to be designed to be able to
produce voltage of 50 V, current up to 100 A and apparent power of 5 kVA.
Design process of inverter was begun with component selection. Selected components can be
found in appendixes B, C and D.
For controller, Arduino MEGA 2560 was selected. Reasons behind selection were that it had
BATTERY H-BRIDGE
ARDUINO
PW
M S
IGN
AL
GATE DRIVER
COIL
HOVERBOARD
(HoveBev™)

Page 8 of 27
highest number of input and output pins as well as highest number of timers. Model was selected with
future expansions of the project in mind to facilitate features like altitude control and Bluetooth
module. Arduino comes with its own development interface and it is also easy to learn and use as it
uses syntaxes based on C language. Uploading code to Arduino is also easily achieved via USB
connection.
The output signals coming from Arduino are low power and are unable supply IGBT gates
with sufficient voltage and current to switch the IGBT on. Due to this limitation, gate driver circuit
had to be built. The purpose of this circuit is to amplify Arduino signals from 5 V to 15V. For voltage
amplification, opto-couplers and DC-DC isolated converter were used.
The operation of opto-coupler is similar to relay except that they are solid state devices which
turn on with light. When input is provided to opto-coupler, a LED on input side turns on, which
saturates the gate of transistor inside opto-coupler module and turns the transistor on. This allows
opto-coupler to operate as switch. A 300 to 330 Ω resistor is connected in series with opto-coupler
input to avoid damaging the module. Main purpose of opto-couplers in this project is to provide
isolation between Arduino and IGBTs and to act as low voltage switches.
To achieve the voltage of 15 V required by IGBT gates, DC-DC isolated converter and voltage
regulators were selected. The converter is used to isolate gate driver circuit from the battery and coil
and to provide power for the gate driver circuitry. Isolation is required because when lower IGBT is
turned off and upper IGBT of same leg needs to turn on, the emitter of IGBT becomes ungrounded,
“a floating point”, and therefore has arbitrary potential. Isolated converter provides separate voltage
across each IGBT which means that reference emitter voltage is different for each IGBT.
Since the output of the DC-DC converter is 24 V, linear voltage regulators are used to reduce
the voltage 15 V required to operate IGBTs. To reduce voltage ripple capacitors are also connected
across regulating ICs. The gate driver circuit would use the following list of components:
1. DC-DC isolated converter
2. Opto-couplers
3. Voltage regulators
4. Resistors
5. Capacitors
6. Terminal block
7. SIL connectors
The inverter H-bridge, sometimes referred to power stage, is made up of 4 IGBTs and 4 freewheeling
diodes connected in parallel to IGBTs. The term power stage comes from the fact that this module
transfers the power from supply to load. The diode is required to reverse the direction of current and,
for example, to allow inductive loads to discharge their energy. In inductive loads, such as large coils
in hoverboard, a sudden attempt in current reversal without freewheeling diodes will produce very
large voltage spike, capable of destroying components like IGBTs by punching through the
semiconductor junction. In other words, the freewheeling diodes, as their name suggests, allows
current flow when all IGBTs are turned off. Due to large current requirement, powerful IGBTs were
required.
6. Construction Hoverboard construction required three main components: the body, the coils and the inverter. The
two sub-phases of construction phase were construction/manufacture and assembly.
Coil construction included coil winding, creation of custom tool and connecting the coils as

Page 9 of 27
required by the design to enable 50 V operation.
Inverter manufacture included assembling H-bridge to heat sink and creating two-sided circuit
board by developing, etching, drilling and soldering. Finally, the subsystems would be enclosed and
installed inside the hoverboard body.
6.1. Coil Planar coils were chosen because the hoverboard coil module would need to be as short as possible
and because they would produce largest possible magnetic field in relation of the coil height. Initially
the plan was to construct the coil module separately, with gaps in between coils. In the gaps would
be material to support the individual coils and prevent them from unwinding. One such design is
shown in figure 6.
Figure 6. Early coil assembly design which would be made of plywood. Coil would be wound around between the stacks, with plywood
sandwiched in between each stack to support and prevent the coil from overlapping or unwinding. The holes in the plywood would be
drilled to reduce the mass of the stack as well as to improve cooling.
This early assembly design would add too much mass and would cause significant reduction in the
levitation altitude and more designing was required for coil assembly. Thus, this design was quickly
abandoned and another approach was taken.
Next approach called for a specialized tool to be designed and constructed. Edited technical
drawing is illustrated in figure 7.
Page 10 of 27
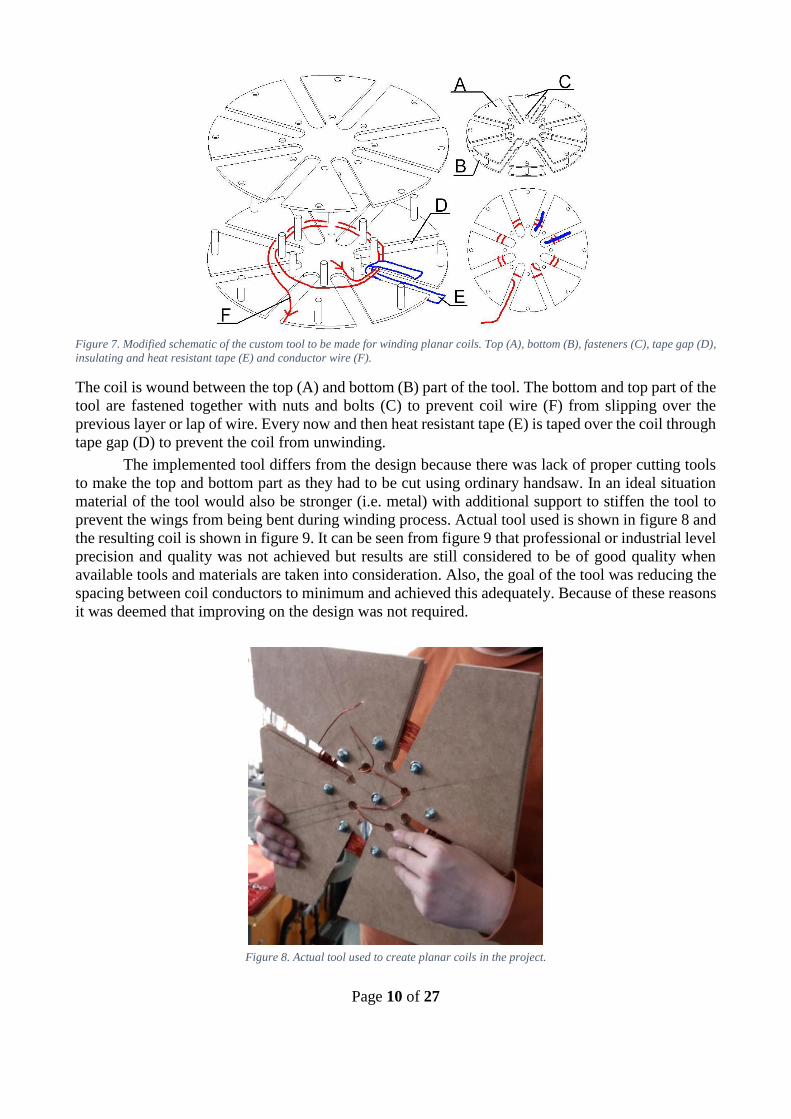
Figure 7. Modified schematic of the custom tool to be made for winding planar coils. Top (A), bottom (B), fasteners (C), tape gap (D),
insulating and heat resistant tape (E) and conductor wire (F).
The coil is wound between the top (A) and bottom (B) part of the tool. The bottom and top part of the
tool are fastened together with nuts and bolts (C) to prevent coil wire (F) from slipping over the
previous layer or lap of wire. Every now and then heat resistant tape (E) is taped over the coil through
tape gap (D) to prevent the coil from unwinding.
The implemented tool differs from the design because there was lack of proper cutting tools
to make the top and bottom part as they had to be cut using ordinary handsaw. In an ideal situation
material of the tool would also be stronger (i.e. metal) with additional support to stiffen the tool to
prevent the wings from being bent during winding process. Actual tool used is shown in figure 8 and
the resulting coil is shown in figure 9. It can be seen from figure 9 that professional or industrial level
precision and quality was not achieved but results are still considered to be of good quality when
available tools and materials are taken into consideration. Also, the goal of the tool was reducing the
spacing between coil conductors to minimum and achieved this adequately. Because of these reasons
it was deemed that improving on the design was not required.
Figure 8. Actual tool used to create planar coils in the project.
Page 11 of 27
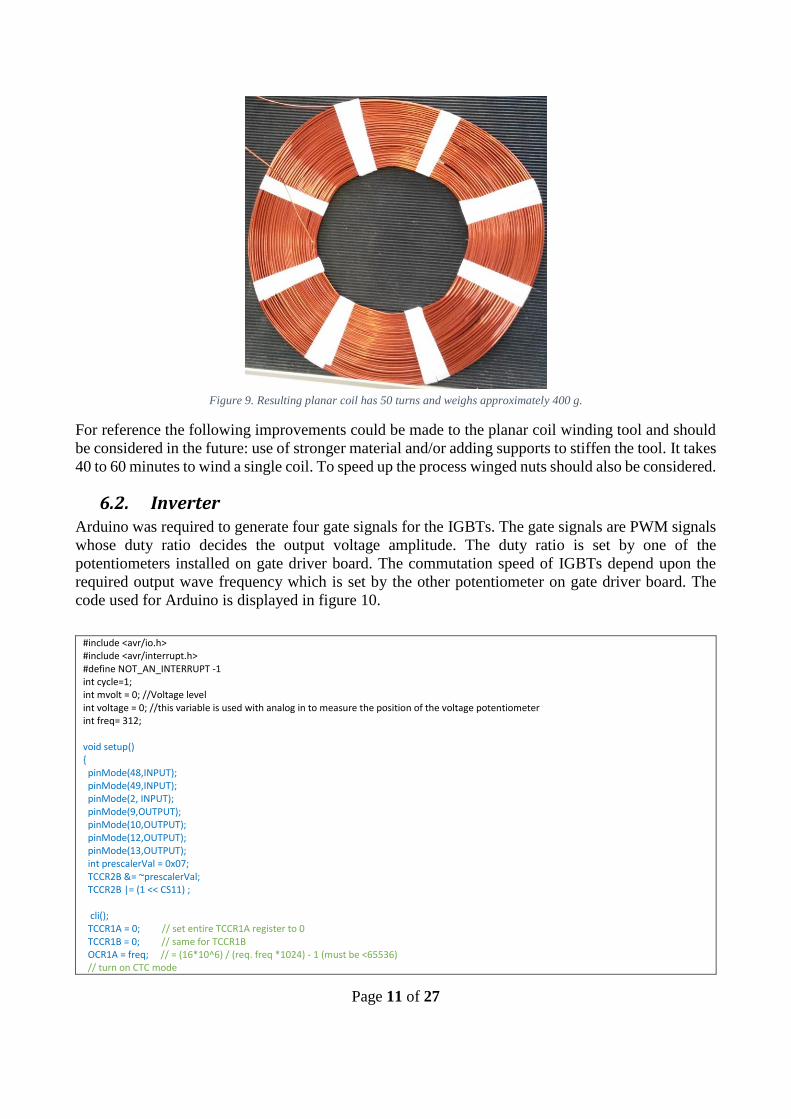
Figure 9. Resulting planar coil has 50 turns and weighs approximately 400 g.
For reference the following improvements could be made to the planar coil winding tool and should
be considered in the future: use of stronger material and/or adding supports to stiffen the tool. It takes
40 to 60 minutes to wind a single coil. To speed up the process winged nuts should also be considered.
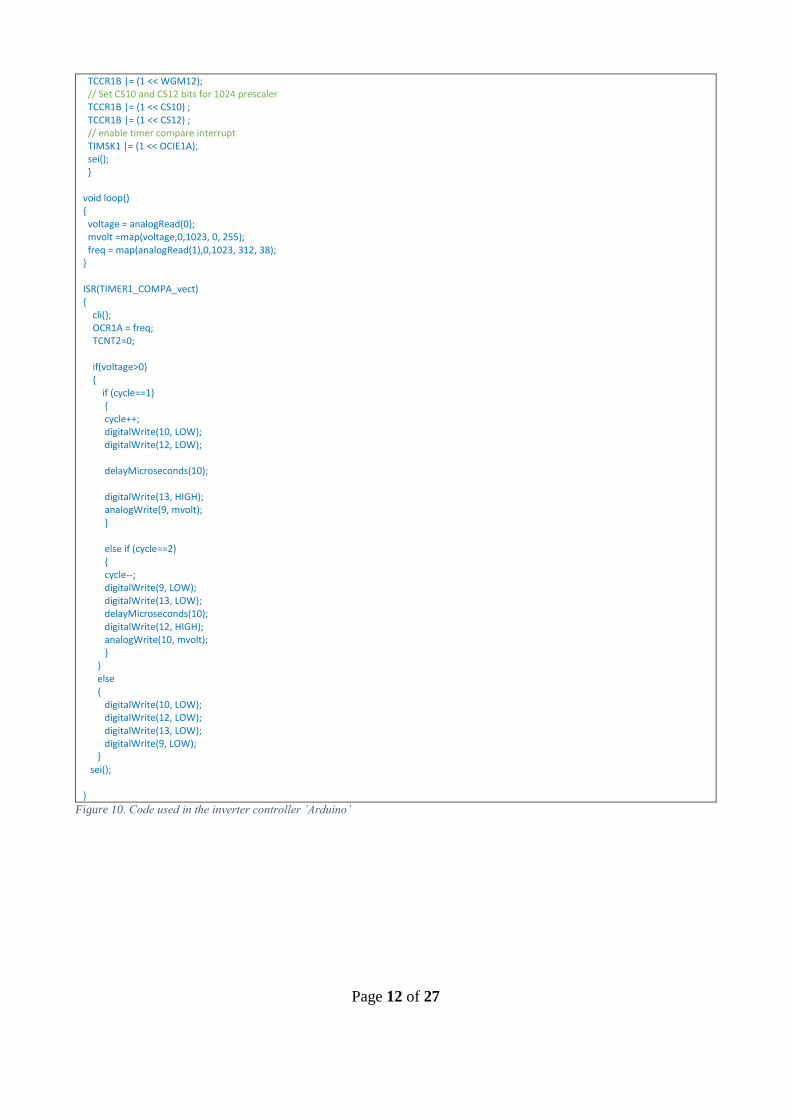
6.2. Inverter Arduino was required to generate four gate signals for the IGBTs. The gate signals are PWM signals
whose duty ratio decides the output voltage amplitude. The duty ratio is set by one of the
potentiometers installed on gate driver board. The commutation speed of IGBTs depend upon the
required output wave frequency which is set by the other potentiometer on gate driver board. The
code used for Arduino is displayed in figure 10.
#include <avr/io.h> #include <avr/interrupt.h> #define NOT_AN_INTERRUPT -1 int cycle=1; int mvolt = 0; //Voltage level int voltage = 0; //this variable is used with analog in to measure the position of the voltage potentiometer int freq= 312; void setup() { pinMode(48,INPUT); pinMode(49,INPUT); pinMode(2, INPUT); pinMode(9,OUTPUT); pinMode(10,OUTPUT); pinMode(12,OUTPUT); pinMode(13,OUTPUT); int prescalerVal = 0x07; TCCR2B &= ~prescalerVal; TCCR2B |= (1 << CS11) ; cli(); TCCR1A = 0; // set entire TCCR1A register to 0 TCCR1B = 0; // same for TCCR1B OCR1A = freq; // = (16*10^6) / (req. freq *1024) - 1 (must be <65536) // turn on CTC mode
Page 12 of 27
TCCR1B |= (1 << WGM12); // Set CS10 and CS12 bits for 1024 prescaler TCCR1B |= (1 << CS10) ; TCCR1B |= (1 << CS12) ; // enable timer compare interrupt TIMSK1 |= (1 << OCIE1A); sei(); } void loop() { voltage = analogRead(0); mvolt =map(voltage,0,1023, 0, 255); freq = map(analogRead(1),0,1023, 312, 38); } ISR(TIMER1_COMPA_vect) { cli(); OCR1A = freq; TCNT2=0; if(voltage>0) { if (cycle==1) { cycle++; digitalWrite(10, LOW); digitalWrite(12, LOW); delayMicroseconds(10); digitalWrite(13, HIGH); analogWrite(9, mvolt); } else if (cycle==2) { cycle--; digitalWrite(9, LOW); digitalWrite(13, LOW); delayMicroseconds(10); digitalWrite(12, HIGH); analogWrite(10, mvolt); } } else { digitalWrite(10, LOW); digitalWrite(12, LOW); digitalWrite(13, LOW); digitalWrite(9, LOW); } sei(); }
Figure 10. Code used in the inverter controller ’Arduino’
Page 13 of 27
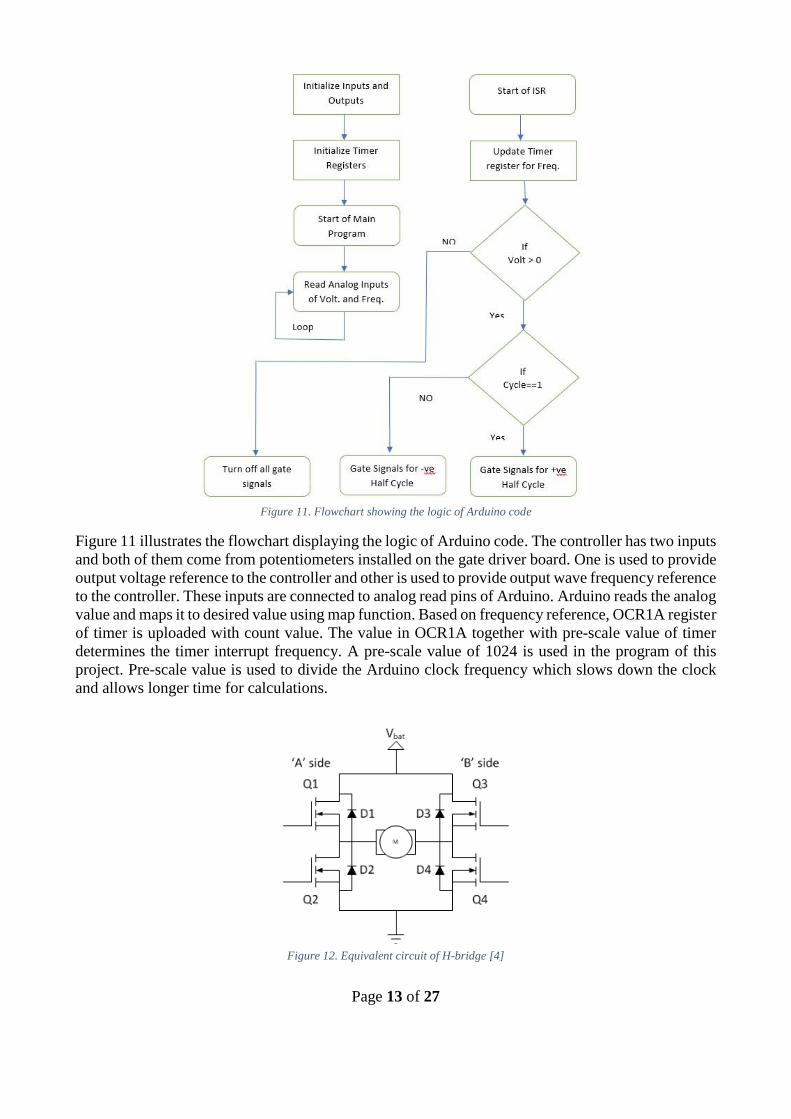
Figure 11. Flowchart showing the logic of Arduino code
Figure 11 illustrates the flowchart displaying the logic of Arduino code. The controller has two inputs
and both of them come from potentiometers installed on the gate driver board. One is used to provide
output voltage reference to the controller and other is used to provide output wave frequency reference
to the controller. These inputs are connected to analog read pins of Arduino. Arduino reads the analog
value and maps it to desired value using map function. Based on frequency reference, OCR1A register
of timer is uploaded with count value. The value in OCR1A together with pre-scale value of timer
determines the timer interrupt frequency. A pre-scale value of 1024 is used in the program of this
project. Pre-scale value is used to divide the Arduino clock frequency which slows down the clock
and allows longer time for calculations.
Figure 12. Equivalent circuit of H-bridge [4]
Page 14 of 27
The H-bridge of the inverter is shown in figure 12. Timer ISR interrupts the main program every half
cycle of output wave. Inside timer ISR, the gate signals are determined depending upon cycle. If
program is at positive half cycle of output wave, then transistors Q1 and Q4 are turned on. Conversely
if program is at negative half cycle of output wave, transistors Q3 and Q2 are turned on.
The function “analogwrite” generates PWM to analog pins and the input of “analogwrite” is
the voltage reference. The frequency of this PWM is set in setup function. The voltage reference
determines the duty ratio of PWM by values between 0 and 255, where 0 means off and 255 means
100% duty ratio. The H-Bridge operates in BUCK mode when voltage reference is less than 255. In
the main function, Arduino keeps reading voltage and frequency references. This reading operation
halts when timer interrupts the main because timer has higher priority. Reading of references is not a
critical operation so it is kept in main function.
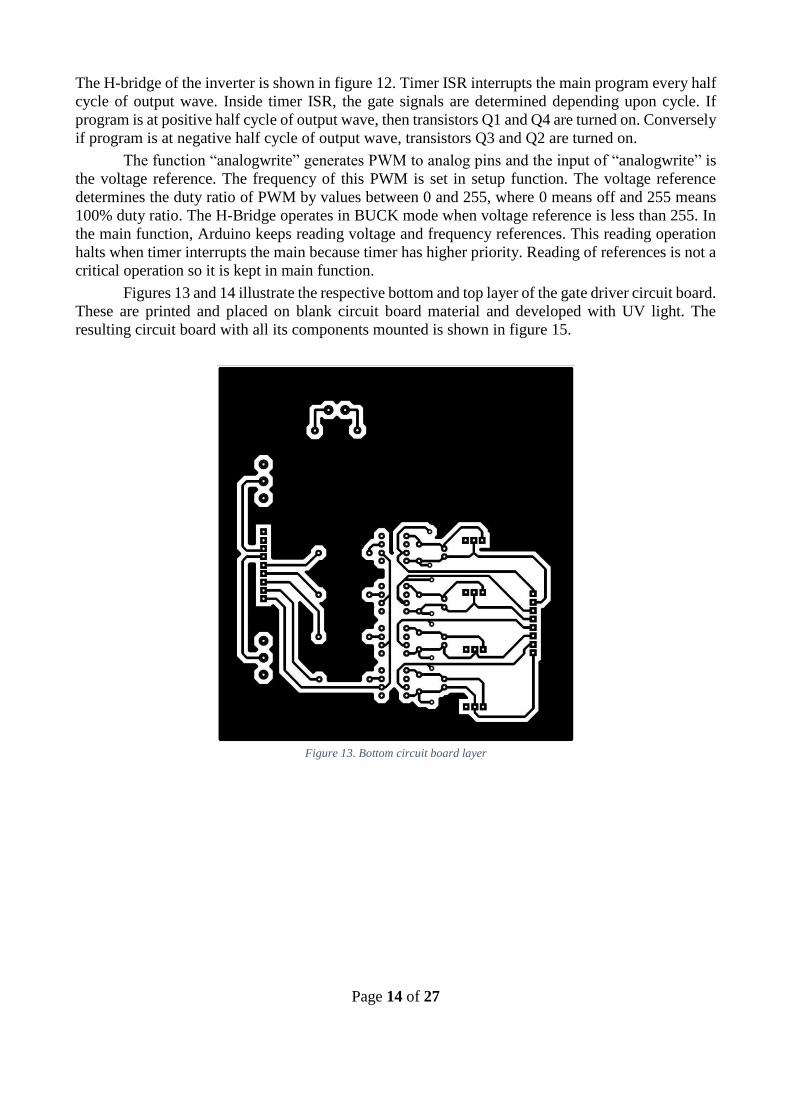
Figures 13 and 14 illustrate the respective bottom and top layer of the gate driver circuit board.
These are printed and placed on blank circuit board material and developed with UV light. The
resulting circuit board with all its components mounted is shown in figure 15.
Figure 13. Bottom circuit board layer

Page 15 of 27
Figure 14. Top circuit board layer
The circuit board was designed using the software called Proteus and Ares. PCB design was created
in ARES and double layer PCB was designed. DC-DC isolated converter has surface mount package
(SMD) but all other components were through hole.
Figure 15. Completed and fully operational gate driver circuit board.
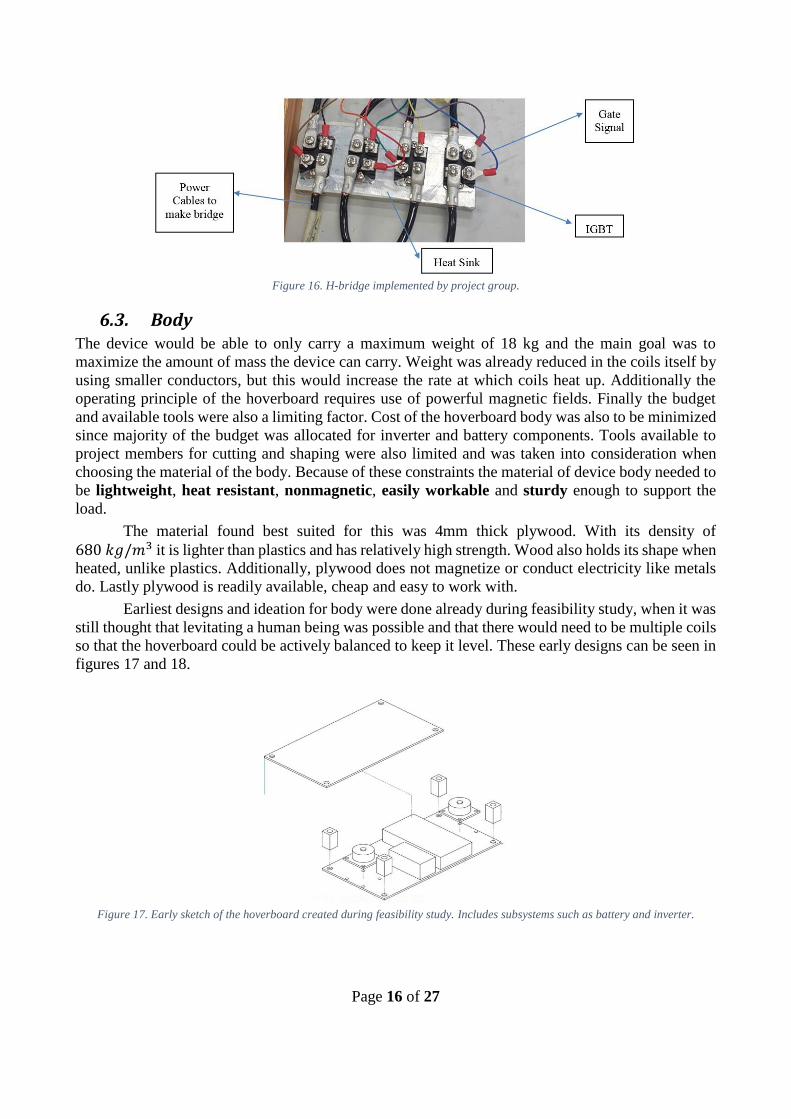
There were two slightly different H-bridge implementations. Due to a mistake made during design
and procurement phases, the first H-bridge IGBTs did not have freewheeling diodes in them and
external diodes had to be acquired, which caused minor delay and confusion in the progress. Figure
16 displays the final H-bridge implementation with the freewheeling diodes in them.
Page 16 of 27
Figure 16. H-bridge implemented by project group.
6.3. Body The device would be able to only carry a maximum weight of 18 kg and the main goal was to
maximize the amount of mass the device can carry. Weight was already reduced in the coils itself by
using smaller conductors, but this would increase the rate at which coils heat up. Additionally the
operating principle of the hoverboard requires use of powerful magnetic fields. Finally the budget
and available tools were also a limiting factor. Cost of the hoverboard body was also to be minimized
since majority of the budget was allocated for inverter and battery components. Tools available to
project members for cutting and shaping were also limited and was taken into consideration when
choosing the material of the body. Because of these constraints the material of device body needed to
be lightweight, heat resistant, nonmagnetic, easily workable and sturdy enough to support the
load.
The material found best suited for this was 4mm thick plywood. With its density of
680 𝑘𝑔/𝑚3 it is lighter than plastics and has relatively high strength. Wood also holds its shape when
heated, unlike plastics. Additionally, plywood does not magnetize or conduct electricity like metals
do. Lastly plywood is readily available, cheap and easy to work with.
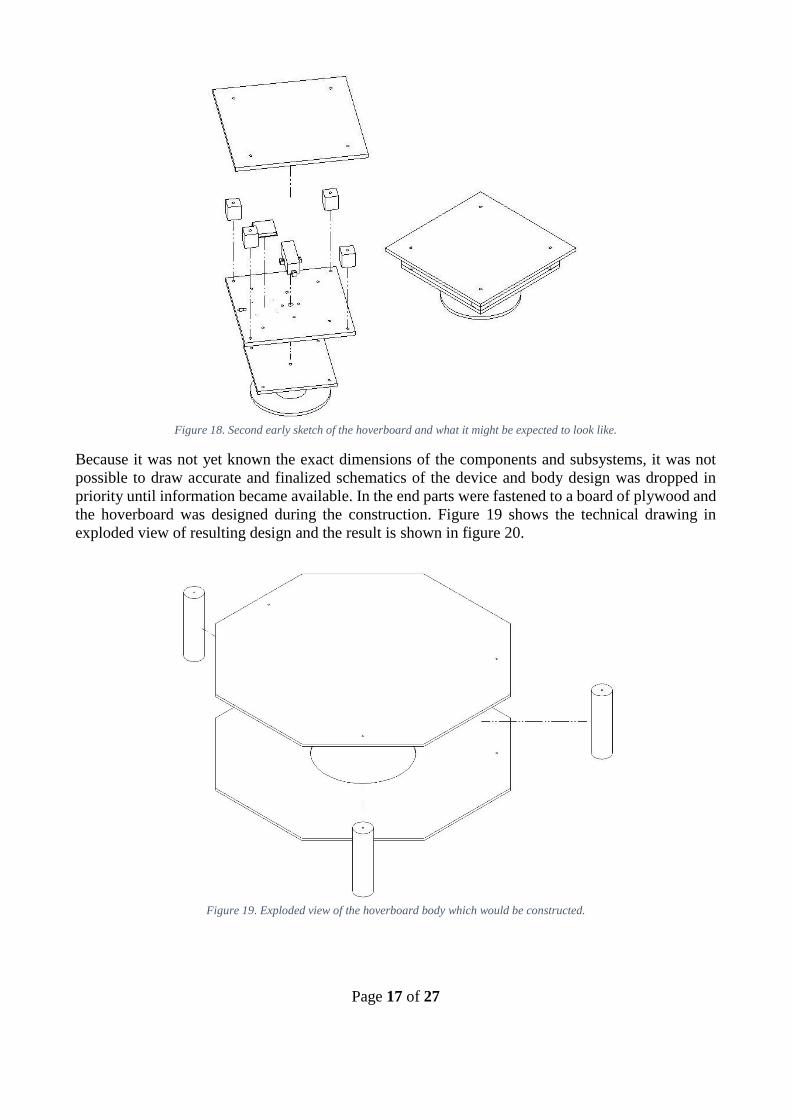
Earliest designs and ideation for body were done already during feasibility study, when it was
still thought that levitating a human being was possible and that there would need to be multiple coils
so that the hoverboard could be actively balanced to keep it level. These early designs can be seen in
figures 17 and 18.
Figure 17. Early sketch of the hoverboard created during feasibility study. Includes subsystems such as battery and inverter.
Page 17 of 27
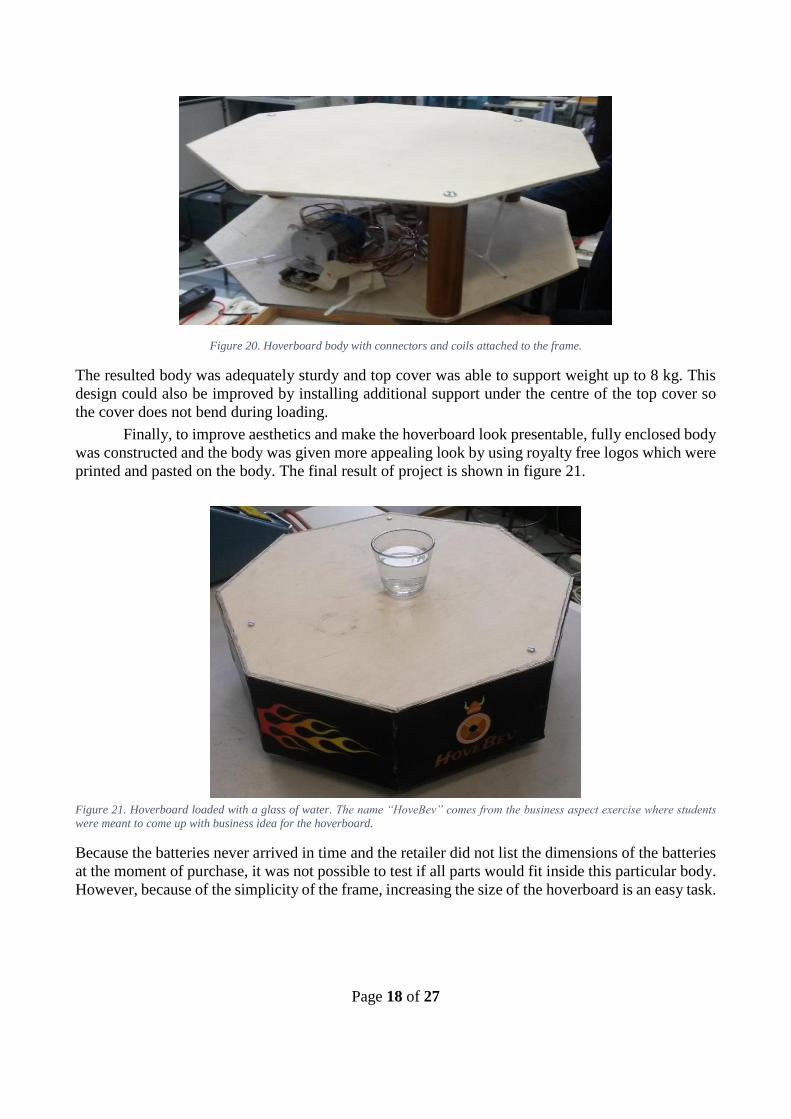
Figure 18. Second early sketch of the hoverboard and what it might be expected to look like.
Because it was not yet known the exact dimensions of the components and subsystems, it was not
possible to draw accurate and finalized schematics of the device and body design was dropped in
priority until information became available. In the end parts were fastened to a board of plywood and
the hoverboard was designed during the construction. Figure 19 shows the technical drawing in
exploded view of resulting design and the result is shown in figure 20.
Figure 19. Exploded view of the hoverboard body which would be constructed.
Page 18 of 27
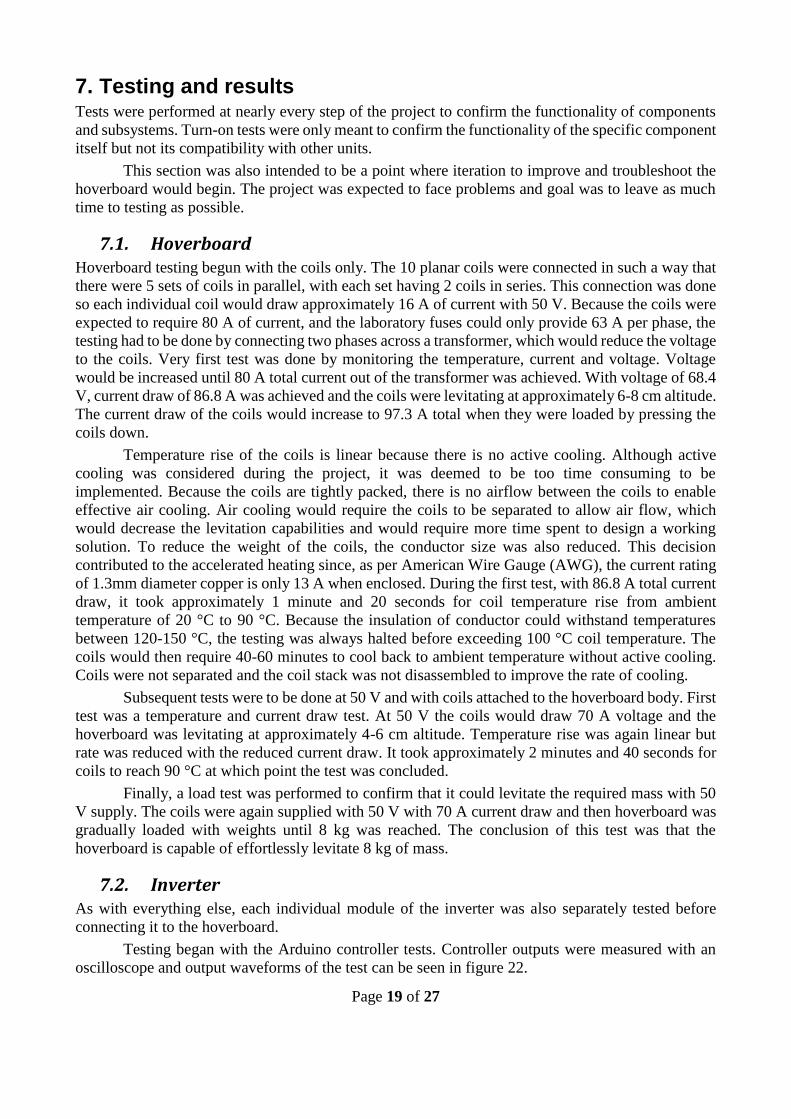
Figure 20. Hoverboard body with connectors and coils attached to the frame.
The resulted body was adequately sturdy and top cover was able to support weight up to 8 kg. This
design could also be improved by installing additional support under the centre of the top cover so
the cover does not bend during loading.
Finally, to improve aesthetics and make the hoverboard look presentable, fully enclosed body
was constructed and the body was given more appealing look by using royalty free logos which were
printed and pasted on the body. The final result of project is shown in figure 21.
Figure 21. Hoverboard loaded with a glass of water. The name “HoveBev” comes from the business aspect exercise where students
were meant to come up with business idea for the hoverboard.
Because the batteries never arrived in time and the retailer did not list the dimensions of the batteries
at the moment of purchase, it was not possible to test if all parts would fit inside this particular body.
However, because of the simplicity of the frame, increasing the size of the hoverboard is an easy task.
Page 19 of 27
7. Testing and results Tests were performed at nearly every step of the project to confirm the functionality of components
and subsystems. Turn-on tests were only meant to confirm the functionality of the specific component
itself but not its compatibility with other units.
This section was also intended to be a point where iteration to improve and troubleshoot the
hoverboard would begin. The project was expected to face problems and goal was to leave as much
time to testing as possible.
7.1. Hoverboard Hoverboard testing begun with the coils only. The 10 planar coils were connected in such a way that
there were 5 sets of coils in parallel, with each set having 2 coils in series. This connection was done
so each individual coil would draw approximately 16 A of current with 50 V. Because the coils were
expected to require 80 A of current, and the laboratory fuses could only provide 63 A per phase, the
testing had to be done by connecting two phases across a transformer, which would reduce the voltage
to the coils. Very first test was done by monitoring the temperature, current and voltage. Voltage
would be increased until 80 A total current out of the transformer was achieved. With voltage of 68.4
V, current draw of 86.8 A was achieved and the coils were levitating at approximately 6-8 cm altitude.
The current draw of the coils would increase to 97.3 A total when they were loaded by pressing the
coils down.
Temperature rise of the coils is linear because there is no active cooling. Although active
cooling was considered during the project, it was deemed to be too time consuming to be
implemented. Because the coils are tightly packed, there is no airflow between the coils to enable
effective air cooling. Air cooling would require the coils to be separated to allow air flow, which
would decrease the levitation capabilities and would require more time spent to design a working
solution. To reduce the weight of the coils, the conductor size was also reduced. This decision
contributed to the accelerated heating since, as per American Wire Gauge (AWG), the current rating
of 1.3mm diameter copper is only 13 A when enclosed. During the first test, with 86.8 A total current
draw, it took approximately 1 minute and 20 seconds for coil temperature rise from ambient
temperature of 20 °C to 90 °C. Because the insulation of conductor could withstand temperatures
between 120-150 °C, the testing was always halted before exceeding 100 °C coil temperature. The
coils would then require 40-60 minutes to cool back to ambient temperature without active cooling.
Coils were not separated and the coil stack was not disassembled to improve the rate of cooling.
Subsequent tests were to be done at 50 V and with coils attached to the hoverboard body. First
test was a temperature and current draw test. At 50 V the coils would draw 70 A voltage and the
hoverboard was levitating at approximately 4-6 cm altitude. Temperature rise was again linear but
rate was reduced with the reduced current draw. It took approximately 2 minutes and 40 seconds for
coils to reach 90 °C at which point the test was concluded.
Finally, a load test was performed to confirm that it could levitate the required mass with 50
V supply. The coils were again supplied with 50 V with 70 A current draw and then hoverboard was
gradually loaded with weights until 8 kg was reached. The conclusion of this test was that the
hoverboard is capable of effortlessly levitate 8 kg of mass.
7.2. Inverter As with everything else, each individual module of the inverter was also separately tested before
connecting it to the hoverboard.
Testing began with the Arduino controller tests. Controller outputs were measured with an
oscilloscope and output waveforms of the test can be seen in figure 22.
Page 20 of 27
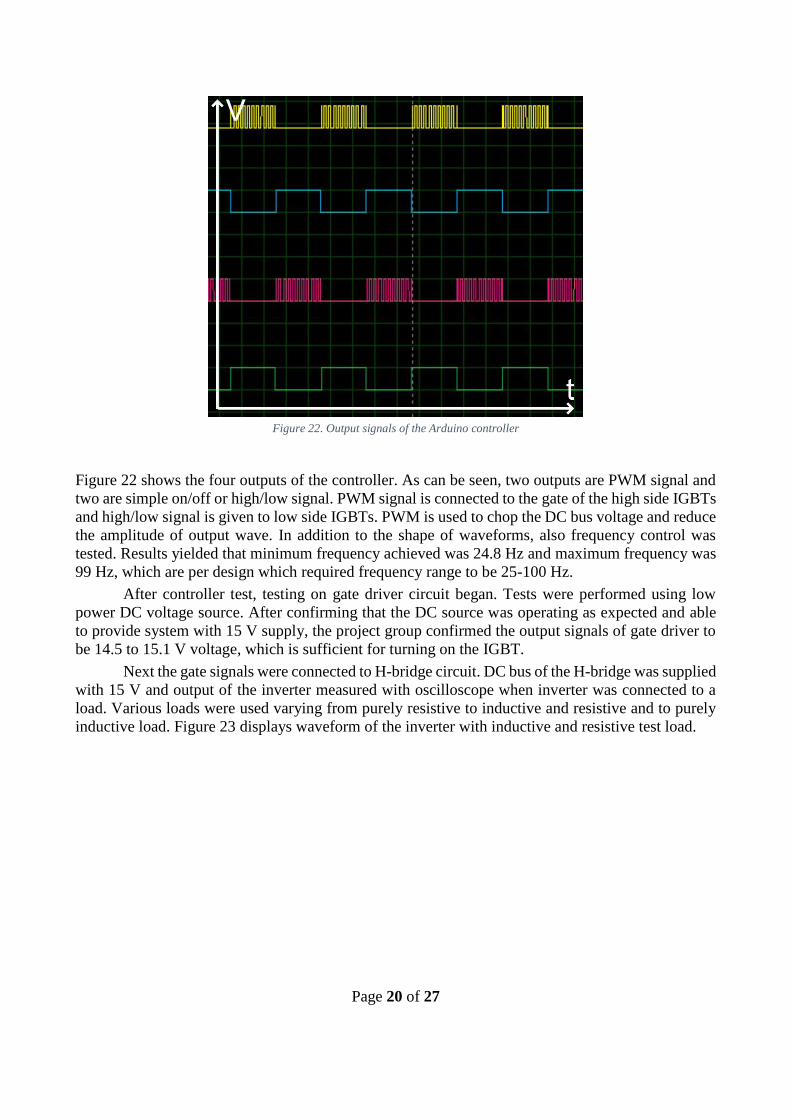
Figure 22. Output signals of the Arduino controller
Figure 22 shows the four outputs of the controller. As can be seen, two outputs are PWM signal and
two are simple on/off or high/low signal. PWM signal is connected to the gate of the high side IGBTs
and high/low signal is given to low side IGBTs. PWM is used to chop the DC bus voltage and reduce
the amplitude of output wave. In addition to the shape of waveforms, also frequency control was
tested. Results yielded that minimum frequency achieved was 24.8 Hz and maximum frequency was
99 Hz, which are per design which required frequency range to be 25-100 Hz.
After controller test, testing on gate driver circuit began. Tests were performed using low
power DC voltage source. After confirming that the DC source was operating as expected and able
to provide system with 15 V supply, the project group confirmed the output signals of gate driver to
be 14.5 to 15.1 V voltage, which is sufficient for turning on the IGBT.
Next the gate signals were connected to H-bridge circuit. DC bus of the H-bridge was supplied
with 15 V and output of the inverter measured with oscilloscope when inverter was connected to a
load. Various loads were used varying from purely resistive to inductive and resistive and to purely
inductive load. Figure 23 displays waveform of the inverter with inductive and resistive test load.
Page 21 of 27
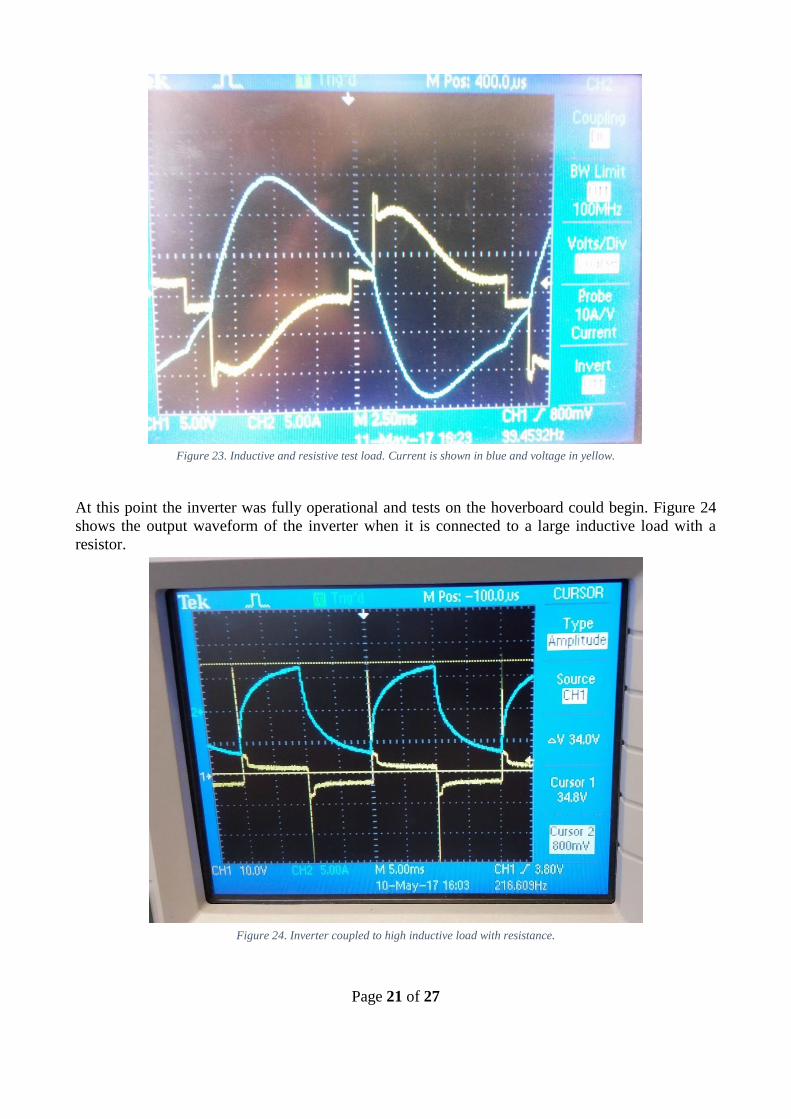
Figure 23. Inductive and resistive test load. Current is shown in blue and voltage in yellow.
At this point the inverter was fully operational and tests on the hoverboard could begin. Figure 24
shows the output waveform of the inverter when it is connected to a large inductive load with a
resistor.
Figure 24. Inverter coupled to high inductive load with resistance.

Page 22 of 27
As can be seen from figure 24, there is large voltage spike in the voltage waveform. During the tests
of first H-bridge implementation this was not tested or thought of but would prove to be the cause of
upcoming inverter failure. During commutation, the voltage spikes due to large change in current in
the coil. This problem caused the project group to lose two H-bridges before issue was resolved.
8. Inverter failures and solutions Towards the end of the project the hoverboard began facing significant difficulties in implementation
and budget. A snowball effect formed from lack of experience and enthusiasm which resulted in a
breakdown of several inverter implementations and this led into group reaching the limit of the
budget. The project was delayed additional week because in one shipment 2 out of 4 components
were non-functioning.
Although simulations were performed with PLECS software which is designed for power
electronic simulations, still total of 3 H-bridge implementations were lost during testing as there were
details which were not taken into account during neither during simulation or the testing.
Two inverters were lost due to overvoltage. After the first failure, testing crew did not initially
understand what happened so the test was performed again with same result. The failure occurred
when hoverboard was being operated at approximately 30 V and 27 A total voltage and current. A
large voltage spike was seen in oscilloscope which was evidence of overvoltage. Failure caused
several IGBTs and diodes to short circuit. Chain of event was concluded to be as follows:
1. Before overvoltage the inverter is operating properly
2. During commutation of the H-bridge, current reverses
3. Due to large change in the value of supply current and energy in the coil, voltage
immediately rises as coil attempts to resist the change of current
4. Because diodes are not ideal, and have delay in turn-on event, diode short-circuits
5. During next commutation same happens to one or more IGBTs
The overvoltage is caused by coils when H-bridge IGBTs switch and reverse the current. According
to formula
𝑉 = 𝐿𝑑𝑖
𝑑𝑡 (1)
the voltage rises when current changes. Because of large current and fast switching, the voltage
immediately spikes up and exceeded the breakdown voltage of the freewheeling diodes, which caused
a short-circuit during the next switching. One purpose of the freewheeling diodes is to prevent
overvoltage and allow the energy of the coil to discharge, but what was not taken into consideration
was that diodes are not ideal and that they have a turn on time. This turn on time was not quick enough
for the hoverboard coils and overvoltage destroyed diodes and IGBTs. At this point project had lost
too many components to immediately continue testing and more components would be needed.
Better IGBTs were purchased, with built-in freewheel diodes but first batch arrived with faulty
components. After retailer supplied with working components the testing could continue. In the
meantime, improvements were done to the switching logic and other solutions were being researched
to reduce or remove the voltage spike. Three solutions were suggested: changing the switching logic,
snubber components and resistor between gate and gate driver to slow down switching speed and
allow voltage to be gradually reduced. Changing the switching logic was done so that before current
Page 23 of 27
reversing one of the IGBTs would be left on to allow coil to discharge. This solution was not desirable
or very effective. Second solution involved adding a resistor between gate and driver and it proved to
be effective. A 10 Ω resistor was connected in series between gate and gate driver to allow gradual
turn off of IGBT. This removed the voltage spike almost completely. The testing was continued,
while gradually increasing the supply voltage and monitoring the voltage across the H-bridge for
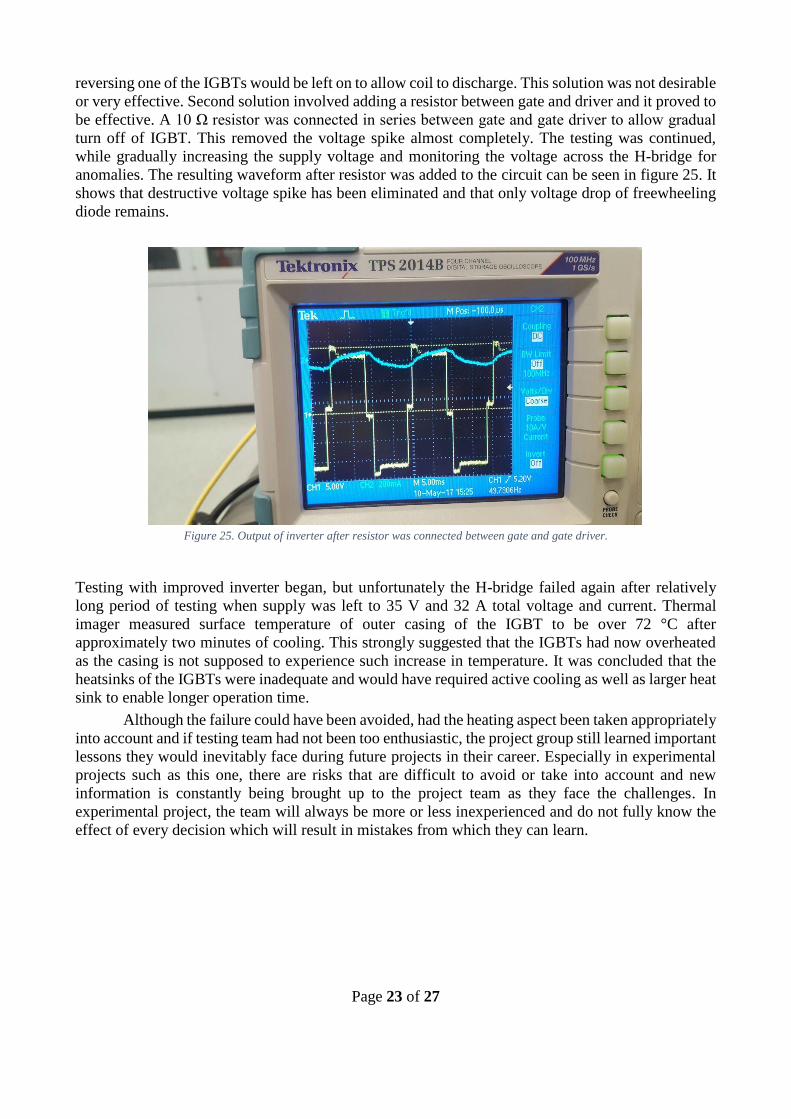
anomalies. The resulting waveform after resistor was added to the circuit can be seen in figure 25. It
shows that destructive voltage spike has been eliminated and that only voltage drop of freewheeling
diode remains.
Figure 25. Output of inverter after resistor was connected between gate and gate driver.
Testing with improved inverter began, but unfortunately the H-bridge failed again after relatively
long period of testing when supply was left to 35 V and 32 A total voltage and current. Thermal
imager measured surface temperature of outer casing of the IGBT to be over 72 °C after
approximately two minutes of cooling. This strongly suggested that the IGBTs had now overheated
as the casing is not supposed to experience such increase in temperature. It was concluded that the
heatsinks of the IGBTs were inadequate and would have required active cooling as well as larger heat
sink to enable longer operation time.
Although the failure could have been avoided, had the heating aspect been taken appropriately
into account and if testing team had not been too enthusiastic, the project group still learned important
lessons they would inevitably face during future projects in their career. Especially in experimental
projects such as this one, there are risks that are difficult to avoid or take into account and new
information is constantly being brought up to the project team as they face the challenges. In
experimental project, the team will always be more or less inexperienced and do not fully know the
effect of every decision which will result in mistakes from which they can learn.
Page 24 of 27
9. Reflection on the Project
Project was largely completed according to project plan. From the results of this project it can be
concluded that project plan should not be as detailed as initially it was and that in experimental project
such as this, not too much detail is needed on the planning. This is because the plan during this project
kept changing constantly and more time would have been spent in writing and rewriting the project
plan than on the project itself.
9.1. Reaching objective The project was partially completed to instructors demands as project group could operate the
hoverboard from the grid, but without inverter. Group never levitated hoverboard as it was designed;
with a battery and inverter. This was because the battery never arrived on time and inverter
implementation faced unforeseen and unexpected problems.
Project goal was adjusted along the way several times. Initial goal of levitating adult person
weighing 60-80 kg was proven practically impossible with available resources. It was estimated that
20 kg of copper wire would be needed to levitate 60-80 kg of mass. Also, testing of this system would
have been extremely difficult.
The Feasibility Study was proven to be extremely important part for the project, as levitation
of human being was proven to be far too expensive and the complexity of such system would have
been too difficult and taken too much time, money and effort to implement. In the end the goal was
set to levitating 8 kg to create a prototype which could later be improved on. In the project plan the
infeasibility of levitating a person was taken into consideration and group did think of backup plan in
case feasibility study would prove the project goal to be infeasible. It was decided that the basic
function of the hoverboard, levitating and lifting mass, would take the highest priority. This meant
that additional functions, such as remote control or even battery operation, would be implemented
only after the device has basic operational capabilities. Possibly because of enthusiasm and over
optimism of the group, several features were assumed to be achievable which later resulted in
acquisition of components which would, in the end, never be used during the project during this
course. This led to group reaching the limit of the budget of 1000 €, although never exceeding it.
Project was still very successful in teaching students about very real issues and dangers in
starting completely new projects which could potentially result in business failure in a new company
with too big ambitions. At the very end of the course and after the presentation, the project also gained
some interest from professor researching Electromagnetics in Health Technologies and this shows
the group that initially infeasible project may seem doomed to fail but can still succeed by finding
new opportunities in different fields.
9.2. Timetable Timeline of the project was specified in the project plan and it was used as a guideline for managing
the schedule. This approach worked well for this group as members were constantly aware of
whereabouts where the project was supposed to be at. The only factor causing missed deadlines was
underestimated workload and unforeseen latencies in component deliveries.
The workload was underestimated and group estimates that additional month or two would
have been required to achieve full operation of the hoverboard. With more experience, several
mistakes and difficulties could have been foreseen and component failures could have been averted
which would have resulted in less time lost in figuring out solutions. Especially the design and
manufacturing a working inverter, which can run 80 amperes with only 50 volts, would have benefited
had there been more hands-on experience in the group in power electronics. Although, not all blame

Page 25 of 27
can be placed on the students either as when students consulted university experts, they were not fully
able to solve issues the project was facing.
9.3. Risk analysis Risks in the project were divided into three categories: personnel, material and progress risks. At the
start of the project prime concern was the risk of electrocution and this risk was largely eliminated by
limiting the hoverboard operating voltage to 50 V. Also, rules were set in place that project members
were never allowed to work power tools and machinery or be in the laboratory facilities unless school
staff member was present and aware that students were working. Luckily, apart from minor cuts from
sharp edges and hand tools, no personnel risks were ever realized. This could partly be thanks to risk
assessment.
Material risks included listing of potential hazards to university equipment and damages to
project components. This risk assessment included event like potential fire hazard. This was proven
to be important later in the project, as LiPo batteries are prone to over discharge which can result in
combustion during next recharge.
Progress risks included various risks regarding the project such as coil overheating, battery
operation not being possible, timetable delays and lack of suitable power converter or supply. Almost
all of these realized themselves and as a result group worked around these issues as described in plan
One major risk that was not adequately considered was the (now) obvious component damage
experienced during testing. Although this was partially taken in to account during procurement phase
when extra components were being ordered, the risk assessment did not target any specific part, such
as IGBTs, but instead rule was to get extra of every component.
9.4. Project Meetings
At the start of the project there were two meetings every week where one of the meetings included
instructor. First phase of the project involved long discussions centred around requirements,
simulation results and feasibility of the project. As the project progressed to more practical phases,
meetings were first reduced to once a week. Later the project group would be spending so much time
in the laboratory, working together and communicating with the instructor in between, that arranging
a meeting was seen as redundant and a hassle, especially considering that some group members are
employed in a job outside the university.
Google drive, email and WhatsApp were used as means to share, communicate and quickly
discuss and convey information to all group members and instructor. Agenda was prepared to every
meeting and made available to group members and instructors via email and google drive by manager.
Summaries of meetings were also written and distributed to group members and instructors. All
agendas and summaries were archived.
Initially meetings were taking too long and there was too much material in the agenda. To
conduct effective meetings, the agendas should be prepared, but topics should be prioritized
accordingly with higher priority topics receiving more detailed discussion and less critical topics
should receive less. Meetings should be pragmatic. Micromanaging and too many too small details
will cause meetings to take long time. Also, more communication from all group members is required
to bring more ideas and possible solutions to the table.
9.5. Quality management There was no detailed quality management plan and the quality of various parts throughout the project
was expected to be highest possible with available tools, equipment, knowledge and experience
considered. More attention paid to reviewing shopping lists for example could have averted a mistake

Page 26 of 27
during procurement.
The practical implementation and the level of quality of the work was high, especially when
considering the amount (or lack of) practical experience of group members and available tools.
10. Discussion and Conclusions All group members gained valuable practical experience in both practical and theoretical work. This
mainly includes power electronics and electronic skills and knowledge as well as teamwork, testing,
problem solving and planning which are required in every project that has been and ever will be. As
a result, students have been better equipped with tools and experience how to face and solve many
problems any work life project will face.
Therefore, a difficult, initially completely infeasible, project was a hidden blessing in terms
of how much potential there is for students to learn. Although not reaching the practical goal of
working machine described in the plan is frustrating, it does not devalue the course because
practically everything in this project is a potential source of experience and information. The
experience students received from working on the project will no doubt prove invaluable regardless
whether they will be working for a large company or starting a business of their own.

Page 27 of 27
List of Appendix
● Appendix A: Project Plan
● Appendix B: Shopping list 1
● Appendix C: Shopping list 2
● Appendix D: Shopping list 3
References
[1] D. G. Henderson, “Magnetic levitation of a stationary or moving object”. USA Patent
US20140265690 A1, 18 9 2014.
[2] Triton, “American Generators,” Triton, [Online]. Available:
https://www.americasgenerators.com/15kVA-Perkins-Diesel-Generator-NonEPA.aspx.
[Accessed 27 5 2017].
[3] A. International, “Standard Specification for Standard Nominal Diameters and Cross-Sectional
Areas of AWG Sizes of Solid Round Wires Used as Electrical Conductors,” ATSM
International, West Conshohocken, 2008.
[4] Modular Circuis, “Modular Circuits,” 10 2011. [Online]. Available:
http://modularcircuits.tantosonline.com/blog/articles/h-bridge-secrets/h-bridges-the-basics/.
[Accessed 5 2017].