final report project cost estimate peer review of
TRANSCRIPT
Final Report Project Cost Estimate Peer Review of
Microfiltration Supplemental Technology Demonstration Project
Prepared by:
PB Water, a division of Parsons Brinckerhoff Quade & Douglas, Inc.
In association with:
Milian, Swain & Associates, Inc.
Prepared for:
South Florida Water Management District Everglades Construction Project
May 7, 2001

SFWMD/C-E018/WO#7 – Project Cost Estimate Peer Review Microfiltration Supplemental Technology Demonstration Project
Table of Contents
Parsons Brinckerhoff Page 2 of 39
Table of Contents Title Page Executive Summary 4 Section 1.0 – Project Purpose 5
1.1 Kickoff Meeting 1.2 Peer Review Team 1.3 Reference Material
Section 2.0 – Background 6
2.1 History 2.2 Future Phases 2.3 Microfiltration Supplemental Technology Demonstration Project 2.4 HAS Report Update – Project Objectives
Section 3.0 – Peer Review 12
3.1 Proprietary Systems 3.2 Indirect Costs not Related to Membrane Filtration 3.3 Cost Differences – Pilot Test versus Currently Available Products 3.4 HSA’s Updated Cost Estimates for Full-Scale Implementation 3.5 MF versus UF Costs 3.6 Capital Costs 3.7 Capital Cost Curves 3.8 Operation and Maintenance Costs
3.8.1 Labor Costs 3.8.2 Spare Parts 3.8.3 Coagulant Costs 3.8.4 Energy Costs
3.9 Membrane Replacement 3.10 Total Annual Operating Cost 3.11 Industry Trends 3.12 Residuals Management 3.13 Conclusions
Appendix A A-1 through A-15
SFWMD/C-E018/WO#7 – Project Cost Estimate Peer Review Microfiltration Supplemental Technology Demonstration Project
Executive Summary
Parsons Brinckerhoff Page 3 of 39
Executive Summary PB Water, a division of Parsons Brinckerhoff Quade & Douglas, Inc., and Milian Swain & Associates, Inc. (PB Team), under District Contract C-E018, were tasked to review and comment on the membrane related costs (capital and O&M) contained in the updated report by HSA Engineers & Scientists, Inc. In addition, the scope included a request to comment on current MF/UF membrane technology as it relates to capital and O&M costs and a discussion on residuals management. Conestoga-Rovers & Associates, Inc. (CRA) completed the “Microfiltration Supplemental Technology Demonstration Report” in May 1998. The report was updated in January 2001 by HSA Engineers & Scientists, Inc. (HSA), who is CRA’s successor company in Florida. The following are criteria and findings of this effort:
�� The basis for costs, both in the HSA report and this report, is the membrane manufacturer (Memcor and Zenon).
�� Zenon no longer manufactures the MF membrane tested by CRA in the original study
and only offers a UF module in the submerged configuration.
�� The Zenon membrane cost from the updated report was based on a different (UF with higher square footage per module model) membrane than was originally tested.
�� The Memcor membrane cost from the updated report was based on a different (both
composition and flux rate) membrane than was originally tested and Memcor now recommends a submerged configuration of its MF polypropylene membrane
�� The Memcor costs in this report are based on US Filter-Memcor’s polypropylene
submerged CMF-S technology, which is the same material composition as the CRA tested module but in a submerged configuration.
�� The Zenon costs are for the same membrane as described in the HSA updated report.
The following are conclusions and recommendations of this effort:
�� The updated capital and O&M cost estimates by HSA are sufficient for the engineering budgetary cost estimate because the accuracy range is within +30% to –15%, which is in accordance with the American Association of Cost Engineers
�� The PB Team recommends that the District use the latest capital and O&M cost curves
developed for this report for the US Filter-Memcor CMF-S Submerged membrane system, when comparing MF to other processes.
�� The PB Team concurs with HSA’s assessment that local land spreading of residuals
appear to be the most cost effective disposal method for the MF Process.
�� Because of the proprietary nature of membrane manufacturing, the PB Team recommends that alternative delivery methods be investigated to assure long-term performance and membrane availability.

SFWMD/C-E018/WO#7 – Project Cost Estimate Peer Review Microfiltration Supplemental Technology Demonstration Project
Section 1 – Project Purpose
Parsons Brinckerhoff Page 4 of 39
1.0 Project Purpose The purpose of the project was to peer review Chapter 5 of the updated report titled Microfiltration Supplemental Technology Demonstration Project, HSA Engineers & Scientists, January 2001 as it relates to capital and O&M membrane process costs and to provide a discussion on residuals management. 1.1 Kickoff Meeting A kick-off meeting was held on Tuesday, January 30, 2001 from approximately 1:00 PM to 3:00 PM at the District’s offices at 3301 Gun Club Rd., West Palm Beach, Florida. The meeting was arranged by District staff to initiate the peer review. In addition to District staff, the meeting was attended by consultants from HSA, PB Water, and Milian Swain & Associates, Inc. (MSA). During the meeting, HSA presented an overview of their methodology used to arrive at the updated capital and O&M costs (Chapter 5). 1.2 Peer Review Team The PB Peer Review Team consisted of William J. Conlon, P.E., DEE, Technical Manager, PB Water and Robert Regalado, Senior Engineer, Milian, Swain & Associates, Inc. 1.3 Reference Material The following materials were used in the preparation of this document:
�� HSA Engineers & Scientists, Inc., “Microfiltration Supplemental Technology Demonstration Project,” May 1998, updated January 2001
�� Project Peer Review Guidelines, American Consulting Engineers Council, American Society of Civil Engineers, 1990
�� PEER Consultants, P.C./Brown and Caldwell Consultants, "Desktop Evaluation of Alternative Technologies," Final Report under SFWMD Contract No. C-E008, Amendment 3, August 1996.
�� PEER Consultants, P.C./Brown and Caldwell Consultants, "Basis for Cost Estimates of Full Scale Alternative Treatment (Supplemental) Technology Facilities,” Contract C-E008-A12, August 1999.
�� HSA Engineers and Scientists (former CRA) “Chemical Treatment Followed by Solids Separation Advanced Technology Demonstration Project” documents under Contract C-E10650:
o Operations Management Plan, May 1999. o CT-SS Project Update for Period November 12- December 31, 1999- January
21, 2000. o Final Report Draft- May 2000.
�� Full Scale Design and Cost Estimate Peer Review Report prepared by Parsons Brinckerhoff and Hazen and Sawyer, August 2000.

SFWMD/C-E018/WO#7 – Project Cost Estimate Peer Review Microfiltration Supplemental Technology Demonstration Project
Section 2 - Background
Parsons Brinckerhoff Page 5 of 39
2.0 Background 2.1 History Florida’s 1994 Everglades Forever Act (F.S. 373.4592) and the federal Everglades Settlement Agreement (Case No. 88-1886-CIV-HOEVELER) establish both interim and long-term water quality goals designed to restore and protect the Everglades Protection Area (EPA). As defined in the Act and the Settlement Agreement, the Everglades Protection Area includes Water Conservation Areas 1, 2A, 2B, 3A, 3B, the Arthur R. Marshall Loxahatchee National Wildlife Refuge, and the Everglades National Park. Activities are currently underway to meet the interim goal of reducing phosphorus levels in discharges from the Everglades Agricultural Area (EAA) and other sources to the Everglades Protection Area to a long-term annual flow-weighted mean concentration of 50 parts per billion (ppb). These activities include the implementation of Everglades Agricultural Area Best Management Practices (BMPs) and the construction of over 42,000 acres of Stormwater Treatment Areas (STAs) through the Everglades Construction Project (ECP). Concurrent with implementation of the ECP, the District is implementing the Everglades Stormwater Program (ESP) to address the water quality issues associated with discharges from the remaining non-ECP Everglades tributary basins. Also concurrent with these activities, the District and other groups are conducting water quality research, advanced treatment technology research, ecosystem-wide planning (e.g., the Comprehensive Everglades Restoration Plan, or CERP), and regulatory programs to ensure a sound foundation for science-based decision making. The long-term goal of the Everglades Program restoration effort is to combine point source control, basin-level and regional solutions in a system-wide approach to ensure that all waters discharged into the Everglades Protection Area meet the numeric phosphorus criterion and other applicable state water quality standards by December 31, 2006. In accordance with the Act, the EPA total phosphorus (TP) criterion shall be 10 ppb in the event the Florida Department of Environmental Protection (DEP) does not adopt by rule such criterion by December 31, 2003. The Corps of Engineers Permit for the Everglades Construction Project requires “For the purposes of planning, 10 ppb (total phosphorus) shall be used as the design parameter pending adoption of the numeric criterion by the Department of Environmental Protection or Everglades Regulatory Commission.” The District and other parties are engaged in the research and demonstration of Advanced Treatment Technologies (ATTs) that may be used alone or in conjunction with STAs for achieving the long-term water quality goals of the Everglades. Research teams are evaluating the technical, economic and environmental feasibility for basin-scale application. Eight ATTs are being evaluated:
1. Chemical Treatment- Direct Filtration 2. Chemical Treatment- High Rate Sedimentation 3. Chemical Treatment- Dissolved Air Flotation/Filtration (DAF) 4. Chemical Treatment- Microfiltration 5. Low Intensity Chemical Dosing of Wetlands (LICD) 6. Managed Wetlands
SFWMD/C-E018/WO#7 – Project Cost Estimate Peer Review Microfiltration Supplemental Technology Demonstration Project
Section 2 - Background
Parsons Brinckerhoff Page 6 of 39
7. Submerged Aquatic Vegetation (SAV)/Limerock 8. Periphyton-based Stormwater Treatment Areas (PSTAs)
As a result of the research studies conducted during 1998 and 1999, Chemical Treatment- Direct Filtration, Chemical Treatment- Dissolved Air Flotation/Filtration and Low Intensity Chemical Dosing of Wetlands did not achieve the 10 ppb TP goal, and are not considered viable technologies for this Statement of Work. To enable the District to provide a scientifically defensible basis for comparative evaluation of the successful technologies, a Supplemental (Advanced) Treatment Technology Standard of Comparison (STSOC) was established. The STSOC provides an approach to comparing the effectiveness of one advanced treatment technology to another. The STSOC has evolved as follows:
Phase I: Formulate conceptual approach and the development of the Contract Guidance Documents
Phase II: Development of the evaluation methodology and an STSOC database Phase III: Development of standardized cost information Phase IV: Compilation and evaluation of Advanced Treatment Technology data
In Phase I, Peer Consultants prepared a concept letter report that proposed twelve evaluation concepts and a Contract Guidance Document (PEER Consultants, P.C./Brown and Caldwell, 1998a). This Contract Guidance Document listed the goals and detailed the specific information on sampling, data management protocol, forms, and formats that each of the Advanced Treatment Technology Demonstration Project Research Teams (DPRTs) needed to follow during data collection. In Phase II, Peer Consultants refined the evaluation concepts into an evaluation methodology consisting of 10 criteria. The evaluation methodology attempts to provide a basis to compare dissimilar technologies. An STSOC database was developed to serve as a repository for storing DPRTs’ research data and as a comparative ATT evaluation tool. The evaluation methodology for the data and information collected from the DPRTs consisted of quantitative and qualitative concepts and are set forth below.
Quantitative Evaluation Methodology 1. Level of Phosphorus Concentration Reduction 2. Level of Phosphorus Load Reduction 3. Cost-effectiveness 4. Potential toxicity 5. Implementation schedule
Qualitative Evaluation Methodology
1. Uncertainty Assessment of Full Scale Construction, Operations, and Scale-up 2. Operational flexibility 3. Sensitivity to fire, flood, drought and hurricane 4. Level of effort to manage side streams control 5. Other water quality issues

SFWMD/C-E018/WO#7 – Project Cost Estimate Peer Review Microfiltration Supplemental Technology Demonstration Project
Section 2 - Background
Parsons Brinckerhoff Page 7 of 39
During Phase III, PEER Consultants/Brown and Caldwell developed standardized costing data to serve as the basis for estimating the cost of equipment, land, levees, etc. to be used by each DPRT in developing full-scale treatment facilities. The cost basis will be used with the evaluation guidelines established in previous documents for Phases I and II to make comparisons between the technologies. 2.2 Future Phases During Phase IV, which is scheduled to be complete within the next two years, data from the ATT projects will be compiled, evaluated and compared. One of the final deliverables from the demonstration project research teams will be a report summarizing the research results, including a conceptual-level layout of a full-scale treatment system designed to treat the flows and phosphorus loads into and out of STA 2 for the period 1979-1988 (Period of Record or POR). Conceptual estimates of capital and annual operation and maintenance costs will be included in this report, as will preliminary implementation schedules. Due to the unique nature and anticipated magnitude of the application of these Advanced Treatment Technologies, the District intends to facilitate peer draft final report for each viable technology, by qualified firms, independent from District staff review efforts. 2.3 Microfiltration Supplemental Technology Demonstration Project The Microfiltration (MF) Demonstration Project conducted by CRA was the initial supplemental technology to be field tested as part of the EFA defined Superior Technology Demonstration Program. The EPA-319 H Grant Program and the District provided primary funding for the project. The Sugar Cane Growers Cooperative of Florida and CRA provided additional project funding. The Florida Department of Environmental Protection (FDEP) served as the contracting agency for the MF Study and CRA received their notice to proceed under FDEP Contract Number WM 640 on July 26, 1996. The final MF report was completed by CRA in May of 1998, and was submitted to the FDEP at that time. The final report summarized the results of the year-long study and field investigations which commenced in September of 1996 and were completed at the end of August 1997. The CRA report also provided a full-scale conceptual design and cost estimate for constructing 200 mgd and 175 mgd MF treatment systems for post-BMP and post-STA applications, respectively. As previously stated, the original research and final report phases of this MF demonstration project was completed by the engineering consulting firm of CRA in 1998. On October 1, 1999, CRA signed an agreement with HSA under which CRA’s operations in the State of Florida were merged with HSA’s existing technical service hubs. Since this time, CRA’s full-service engineering and environmental staff and resources located within the State of Florida are currently working under the name of HSA Engineers & Scientists, Inc., a member of the CRA family of companies.

SFWMD/C-E018/WO#7 – Project Cost Estimate Peer Review Microfiltration Supplemental Technology Demonstration Project
Section 2 - Background
Parsons Brinckerhoff Page 8 of 39
The cost estimate for the full-scale MF system was prepared by CRA in terms of 1998 dollars, and the report was completed prior to SFWMD finalizing their Standard of Comparison procedures that were to be utilized for evaluating the Advanced Treatment Technologies. In addition, advancements to membrane technology processes have occurred during the last several years that have improved the technology and, in certain applications, have reduced associated capital and O&M costs. The revised report by HSA updated the costs of the full-scale MF treatment system originally provided in the 1998 report, and describes industry advances during the last two years in membrane technology that may result in capital or operational cost savings or improved system performance. This peer review effort evaluated the cost update completed by HSA and included cost changes that have occurred within the last few months since their report was completed. In addition, the MF membranes pilot tested by CRA either are no longer US Filter-Memcor’s membrane of choice for this application or in the case of Zenon are no longer manufactured as MF membranes. The updated cost estimate by HSA for Zenon’s membrane was based on their model 500C ZeeWeed® membrane which is now classified as a UF membrane. Zenon reports they no longer manufacture MF membranes in the ZeeWeed® configuration. The Zenon ZeeWeed® membrane now offered is an UF membrane. The MF-150 membrane had an absolute pore size of 0.2 microns, as did the Memcor MF membrane. In the transition to the manufacture of UF membranes exclusively, Zenon offered a predecessor to the MF-150 membrane with pore size range of 0.2 to 0.08 microns, which was also discontinued. The latest Zenon ZeeWeed® UF membrane is designated as model 500C with pore sizes ranging between 0.04 and 0.1 microns. By definition, microfiltration is the separation of micron or sub-micron particulate matter in solution across a membrane material. In general, the lowest pore size for a commercially available (scaled-up for municipal use) MF membrane is approximately 0.2 microns absolute such as is the US Filter-Memcor polypropylene and the discontinued Zenon MF-150 ZeeWeed® membranes tested. MF membranes are “absolutely” rated. The terminology “absolute” means 100% retention of the particles of the size equal to the filter rating. A nominal rating on the particle size retention curve (size of particles challenging the membrane versus the percent of particles rejected) exists where most of the particles are retained. In the MF process, usually 100% of the feed stream is recovered. UF membranes are rated both absolute and nominal. Figure 1 that follows illustrates the MF and UF membranes particle size ranges:

SFWMD/C-E018/WO#7 – Project Cost Estimate Peer Review Microfiltration Supplemental Technology Demonstration Project
Section 2 - Background
Parsons Brinckerhoff Page 9 of 39
Figure 1 2.4 HAS Report Update – Project Objectives The original study objectives included assessing the pilot testing/feasibility study of the MF technology at the Everglades Nutrient Removal (ENR) Project, evaluating the performance of the MF pilot unit under variable flow rates, and varying influent phosphorus concentrations. As part of the demonstration of the effectiveness of MF, an analytical comparison was made between influent and effluent data collected from the MF Pilot unit to assess potential removal effectiveness with and without chemical addition. Additionally, a comparison of a surface water influent to, and effluent from, the MF unit was performed based on the results of toxicity bioassays and Algal Growth Potential (AGP) analyses. In order to update the 1998 MF system full-scale cost estimates, assess the membrane process technology advancements, and prepare a membrane study summary in the format specified by the Standard of Comparison, the updated report was prepared in January 2001. Inclusion of additional specific objectives included:
�� HSA consulted with MF/UF manufacturers (US Filter-Memcor, X-Flow, Zenon, and others) in order to update potential advances in the MF processes and to determine the current status of the technology as it applies to treating EAA stormwaters.

SFWMD/C-E018/WO#7 – Project Cost Estimate Peer Review Microfiltration Supplemental Technology Demonstration Project
Section 2 - Background
Parsons Brinckerhoff Page 10 of 39
�� Using the format identified in the Supplemental Technology Standard of Comparison (STSOC) (PEER Consultants/Brown and Caldwell, 1999), HSA updated the full-scale post-BMP and post-STA cost estimates provided in CRA’s 1998 MF final report. Unit prices and cost curves specified in the STSOC were used to prepare the cost update.
�� Comparison of analytical test parameters, flow measurement techniques, and sample
compositing techniques, as well as other protocols listed in the STSOC, with those completed during the CRA MF Study (conducted prior to STSOC report completion). Data gaps and the effect of missing data were summarized in the final report.

SFWMD/C-E018/WO#7 – Project Cost Estimate Peer Review Microfiltration Supplemental Technology Demonstration Project
Section 3 – Peer Review
Parsons Brinckerhoff Page 11 of 39
3.0 Peer Review 3.1 Proprietary Systems Both the US Filter-Memcor MF and the Zenon ZeeWeed® UF membrane processes are proprietary membrane systems. Both processes are separate and distinct patented processes. Proprietary systems are designed as “black box” systems by the manufacturer (not by the consulting engineer) and render the purchaser operationally dependent on the manufacturer for replacement membranes and certain equipment parts. It is anticipated that at some time in the future MF and UF membranes will be standardized similarly to the evolution of the reverse osmosis industry’s spiral wound eight-inch elements. Only the membrane manufacturer can issue quotes for accurate prices of their capital equipment and associated O&M costs. These costs are constantly changing due to market demand, competition, cost of materials, and improvements to the membranes, membrane devices and their appurtenances. The general trend for overall membrane system costs has been downward. However, certain changes have occurred since the updated report was completed in January 2001 that has impacted cost and is reflected in this report. Estimated membrane costs in this document were developed through numerous telephone conversations with the manufacturer. Appendix A contains a description of the current, as of this publication, processes for Memcor and Zenon. 3.2 Indirect Costs not Related to Membrane Filtration PEER Consultants/B&C developed standardized costing data, which are periodically updated by the District to serve as the basis for estimating the cost of equipment, land, levees, etc. to be used by each department in developing full-scale treatment facilities. This cost basis will be used with the evaluation guidelines established in previous documents for making comparisons between this and other technologies. These costs were not evaluated as part of this effort because the focus was to review the capital and O&M costs related to membrane processes. 3.3 Cost Differences – Pilot Test versus Currently Available Products The membranes pilot tested during the preparation of the CRA report have changed either in configuration, membrane composition, membrane technology, or operating mode; and, those cost variations should be evident in the differences in the original CRA report, the HSA update and this report. For example, the Zenon MF-150 (450 sq. ft.) series membrane module (then clearly identified as a MF membrane) pilot tested by CRA now contains 650 sq. ft. of membrane area and is now an UF membrane. The submergence tanks are now aerated on a cyclic basis. The Zenon membrane pilot tested is a “tighter” membrane now than when pilot tested and is clearly identified by Zenon as a UF membrane.

SFWMD/C-E018/WO#7 – Project Cost Estimate Peer Review Microfiltration Supplemental Technology Demonstration Project
Section 3 – Peer Review
Parsons Brinckerhoff Page 12 of 39
The US Filter-Memcor hollow fiber polypropylene membrane demonstrated by CRA was then only available in the totally enclosed cartridge configuration (CMF) operational mode. The only Memcor MF membrane material then proven and available from US Filter-Memcor was of the polypropylene hollow fiber material. These same polypropylene membranes are not chlorine or oxidant resistant. Since then a chlorine resistant membrane, demonstrating a lower flux per unit area, consisting of PVdf material is available either in cartridge or submerged configuration. The PVdf membrane material was not considered as part of this effort because of the following:
�� higher cost; �� lower flux; �� no large plants using the PVdF membranes; and �� polypropylene was the membrane material CRA pilot tested.
Polypropylene CMF-S submerged technology is now recommended by the manufacturer for this application and for large plants of the sizes under consideration. 3.4 HSA’s Updated Cost Estimates for Full-Scale Implementation HSA’s updated costs were based on US Filter’s MF PVdf submerged membranes and the latest model Zenon ZeeWeed® UF submerged membranes. US Filter-Memcor stated they would recommend their submerged polypropylene membranes over their submerged PVdF membranes for this application due to their higher flux, smaller footprint and resultant lower cost. The updated report indicated that membrane cost estimates were developed from equipment supplier quotations and prior engineering experience. This effort also utilized capital and O&M cost estimates based on current information supplied by the manufacturers. In the cost update report, HSA stated “the testing proved that the Memcor (US Filter) and Zenon pilot systems performed comparable with respect to phosphorus removal and flux restoration. Both suppliers provided capital and operational costs. The full-scale updated cost data provided by Zenon were slightly lower than those provided by US Filter-Memcor, and therefore, the 12 full-scale facility estimates are based on the Zenon MF (now UF) system. This is not necessarily an endorsement of one vendor, but an engineering judgment to provide the lowest representative costs for the full-scale facilities.” The Peer Review Team agrees that the test results for the Memcor CMF and Zenon MF pilot systems were comparable. The updated cost information supplied to HSA by Zenon was for UF membranes, not MF. US-Filter-Memcor’s updated cost information was based on a PVdf membrane. Neither of these membranes was pilot tested by CRA. Nevertheless, the updated cost estimates provided by HSA are within acceptable limits of the latest costs obtained by the Peer Review Team. In addition, Zenon’s cost estimates to both HSA and the Peer Review Team were based on using the latest 650 square foot or 500C UF membranes. According to HSA, currently Zenon is introducing a new membrane design, model ZW-1000, which is being pilot tested at several locations. However, these new generation membranes are UF membranes for clean water applications only. The main advantage of these membranes for clean water applications is a
SFWMD/C-E018/WO#7 – Project Cost Estimate Peer Review Microfiltration Supplemental Technology Demonstration Project
Section 3 – Peer Review
Parsons Brinckerhoff Page 13 of 39
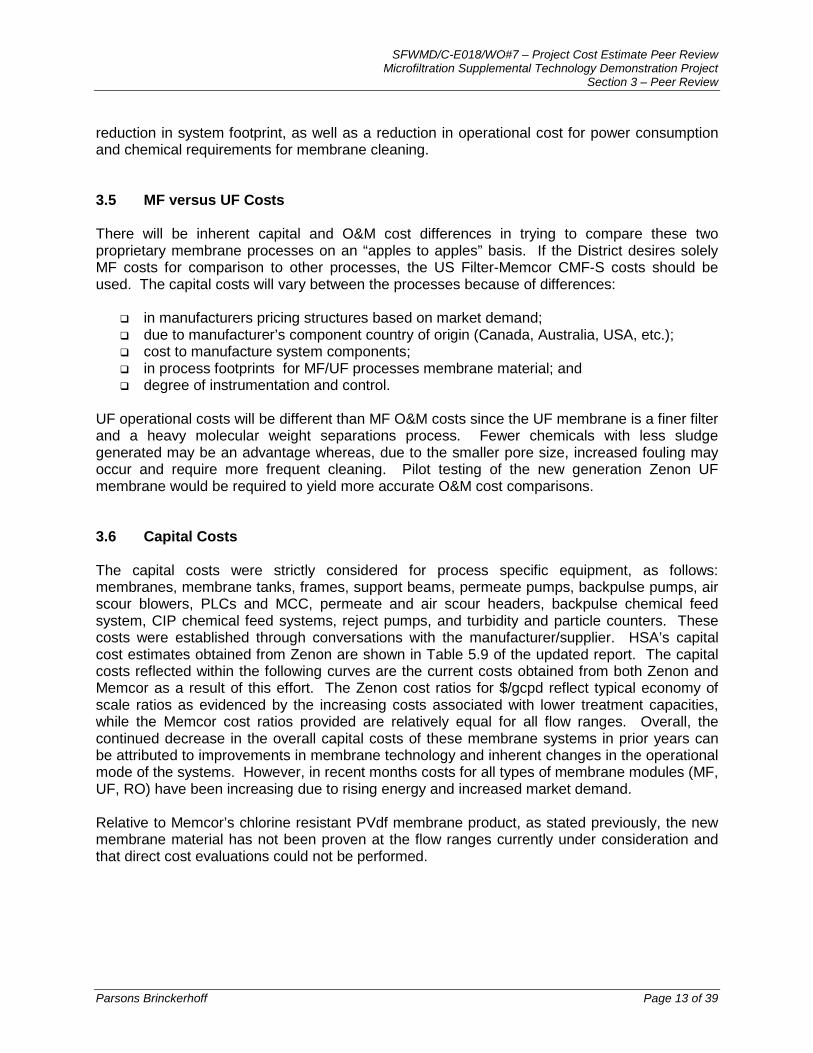
reduction in system footprint, as well as a reduction in operational cost for power consumption and chemical requirements for membrane cleaning. 3.5 MF versus UF Costs There will be inherent capital and O&M cost differences in trying to compare these two proprietary membrane processes on an “apples to apples” basis. If the District desires solely MF costs for comparison to other processes, the US Filter-Memcor CMF-S costs should be used. The capital costs will vary between the processes because of differences:
�� in manufacturers pricing structures based on market demand; �� due to manufacturer’s component country of origin (Canada, Australia, USA, etc.); �� cost to manufacture system components; �� in process footprints for MF/UF processes membrane material; and �� degree of instrumentation and control.
UF operational costs will be different than MF O&M costs since the UF membrane is a finer filter and a heavy molecular weight separations process. Fewer chemicals with less sludge generated may be an advantage whereas, due to the smaller pore size, increased fouling may occur and require more frequent cleaning. Pilot testing of the new generation Zenon UF membrane would be required to yield more accurate O&M cost comparisons. 3.6 Capital Costs The capital costs were strictly considered for process specific equipment, as follows: membranes, membrane tanks, frames, support beams, permeate pumps, backpulse pumps, air scour blowers, PLCs and MCC, permeate and air scour headers, backpulse chemical feed system, CIP chemical feed systems, reject pumps, and turbidity and particle counters. These costs were established through conversations with the manufacturer/supplier. HSA’s capital cost estimates obtained from Zenon are shown in Table 5.9 of the updated report. The capital costs reflected within the following curves are the current costs obtained from both Zenon and Memcor as a result of this effort. The Zenon cost ratios for $/gcpd reflect typical economy of scale ratios as evidenced by the increasing costs associated with lower treatment capacities, while the Memcor cost ratios provided are relatively equal for all flow ranges. Overall, the continued decrease in the overall capital costs of these membrane systems in prior years can be attributed to improvements in membrane technology and inherent changes in the operational mode of the systems. However, in recent months costs for all types of membrane modules (MF, UF, RO) have been increasing due to rising energy and increased market demand. Relative to Memcor’s chlorine resistant PVdf membrane product, as stated previously, the new membrane material has not been proven at the flow ranges currently under consideration and that direct cost evaluations could not be performed.

SFWMD/C-E018/WO#7 – Project Cost Estimate Peer Review Microfiltration Supplemental Technology Demonstration Project
Section 3 – Peer Review
Parsons Brinckerhoff Page 14 of 39
3.7 Capital Cost Curves Capital cost curves were developed for both US-Filter-Memcor and Zenon Process equipment through actual telephone conversations with the manufacturers. The curves follow:
Figure 2 – Zenon Capital Cost Curve
Figure 3 – Memcor Capital Cost Curve
0 50 100 150 200 250 300 350 400 450 500
Ultrafiltration Treatment Capacity (mgd)
$0.00
$0.20
$0.40
$0.60
$0.80
$1.00
Cap
ital C
ost (
$/gp
cd)
SFWMD - ATT PEER REVIEWZenon Capital Costs
0 50 100 150 200 250 300 350 400 450 500
Microfiltration Treatment Capacity (mgd)
0.26
0.27
0.28
0.29
Cap
ital C
ost (
$/gp
cd)
SFMWD - ATT PEER REVIEWMemcor Capital Costs
SFWMD/C-E018/WO#7 – Project Cost Estimate Peer Review Microfiltration Supplemental Technology Demonstration Project
Section 3 – Peer Review
Parsons Brinckerhoff Page 15 of 39
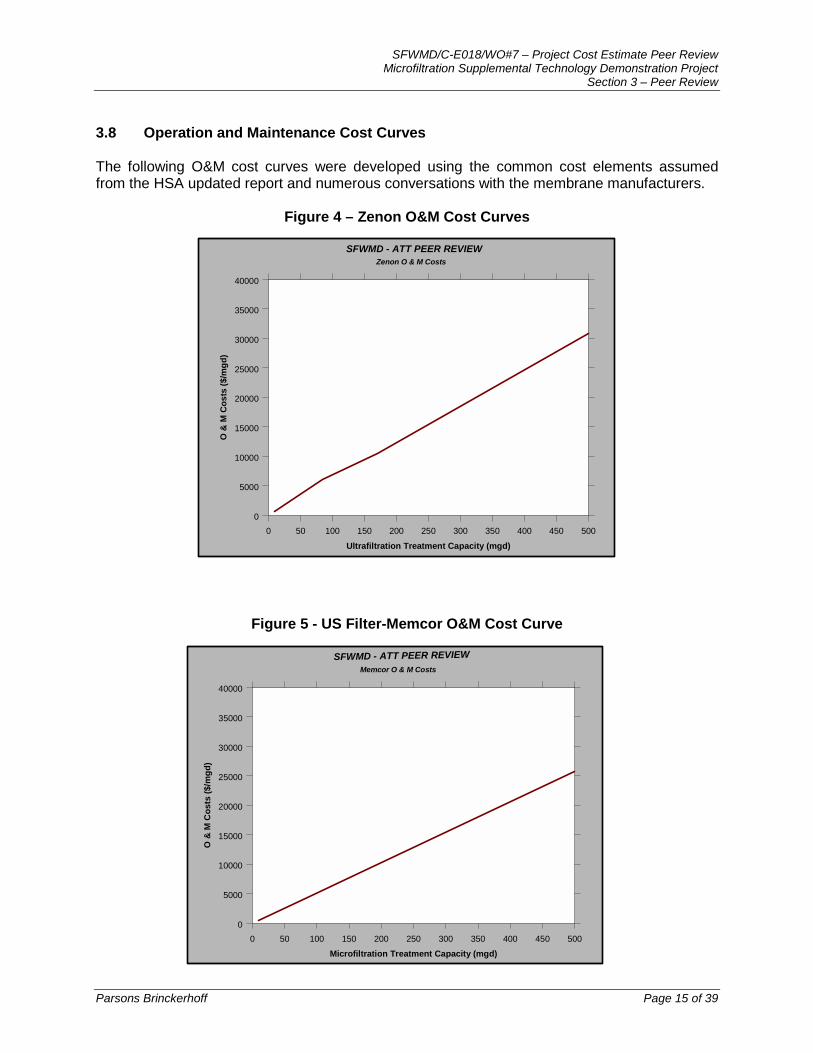
3.8 Operation and Maintenance Cost Curves The following O&M cost curves were developed using the common cost elements assumed from the HSA updated report and numerous conversations with the membrane manufacturers.
Figure 4 – Zenon O&M Cost Curves
Figure 5 - US Filter-Memcor O&M Cost Curve
0 50 100 150 200 250 300 350 400 450 500
Ultrafiltration Treatment Capacity (mgd)
0
5000
10000
15000
20000
25000
30000
35000
40000
O &
M C
osts
($/m
gd)
SFWMD - ATT PEER REVIEWZenon O & M Costs
0 50 100 150 200 250 300 350 400 450 500
Microfiltration Treatment Capacity (mgd)
0
5000
10000
15000
20000
25000
30000
35000
40000
O &
M C
osts
($/m
gd)
SFWMD - ATT PEER REVIEWMemcor O & M Costs

SFWMD/C-E018/WO#7 – Project Cost Estimate Peer Review Microfiltration Supplemental Technology Demonstration Project
Section 3 – Peer Review
Parsons Brinckerhoff Page 16 of 39
3.9 Operation and Maintenance Costs The O&M costs reflected within the above curves exclude items which were incorporated in the HSA report that were determined to be peripheral from the membrane processes as follows:
�� levee maintenance; �� treatment of residual solids; �� building maintenance water control structures; �� fuel consumption; and �� sampling and monitoring.
Zenon provided O&M costs for 85 MGD and 170 MGD, while Memcor provided data for 40 MGD. Since both manufacturers indicated that their O&M cost curves are linear, an extrapolation was performed to determine the previously noted graphs. Chemical costs for Zenon and Memcor were developed utilizing data provided by the respective manufacturers for their processes’ chemical requirements. For Zenon’s UF membrane, the following chemicals were considered; sodium hypochlorite, MC-1, sodium hydroxide, and sodium bisulfate. For Memcor’s MF membrane, the following chemicals were considered; citric acid, liquid chlorine and sodium bisulfate Common operation and maintenance unit costs for the purposes of comparing O&M costs on an “apples to apples” basis were used. Common costs used in the HSA cost update were adopted wherever available and in collaboration with the membrane manufacturer. These O&M costs are described, as follows: 3.9.1 Labor Costs The labor costs associated with the Zenon membrane consist of a 24-hour, 7 day per week operation, while the Memcor labor costs provided consist of those costs associated with chemical cleaning labor. Labor costs were estimated assuming a projected staffing plan for a 24/7 operation and a unit cost of $30 per hour (includes fringe benefits) per employee. 3.9.2 Spare Parts Mechanical and Electrical Spare Parts and Supplies are based on 1%/yr. of mechanical and electrical capital costs. The 1% number is the accepted “rule of thumb” used in the membrane industry for these costs. 3.9.3 Coagulant Costs Coagulant costs were estimated based on the pilot studies chemical dosage. Nominal chemical dosages of ferric chloride (8 mg/L as Fe) for post-BMP and (3 mg/L as Fe) for post-STA application were used to calculate chemical costs. PEER/B&C (August 1999) provided a unit

SFWMD/C-E018/WO#7 – Project Cost Estimate Peer Review Microfiltration Supplemental Technology Demonstration Project
Section 3 – Peer Review
Parsons Brinckerhoff Page 17 of 39
cost for ferric chloride of $180 per ton. For post-BMP applications, MF membrane chemical cleaning was estimated to occur every 14 days and for post-STA application, cleaning was estimated to occur every 21 days. Chemical cleanings alternate between citric acid and sodium hypochlorite. One reuse was estimated for the citric acid solution and no reuse of the sodium hypochlorite solution. 3.9.4 Energy Costs The electrical costs associated with the Zenon membrane have been reduced due to technological advancements and the use of cyclic aeration, while the Memcor membrane provides lower electrical costs due to inherent differences in its configuration (now submerged type). Electrical energy consumption was estimated based on the estimated treatment plant power consumption and a unit cost of $0.08 per kWh (SFWMD).
*Source-EPRI
Figure 6 - Relative Energy Requirements for Membrane Processes Note in the recent bar graph (Figure 6, above) provided by the Electric Power Research Institute the relative difference for energy consumption for MF and UF processes is indicated. The data are shown not to indicate current costs but to show the energy required in kWh/Kgal, one membrane process relative to another. The bar is hardly visible for microfiltration (2) and is indicative of the low energy required for the process.
SFWMD/C-E018/WO#7 – Project Cost Estimate Peer Review Microfiltration Supplemental Technology Demonstration Project
Section 3 – Peer Review
Parsons Brinckerhoff Page 18 of 39
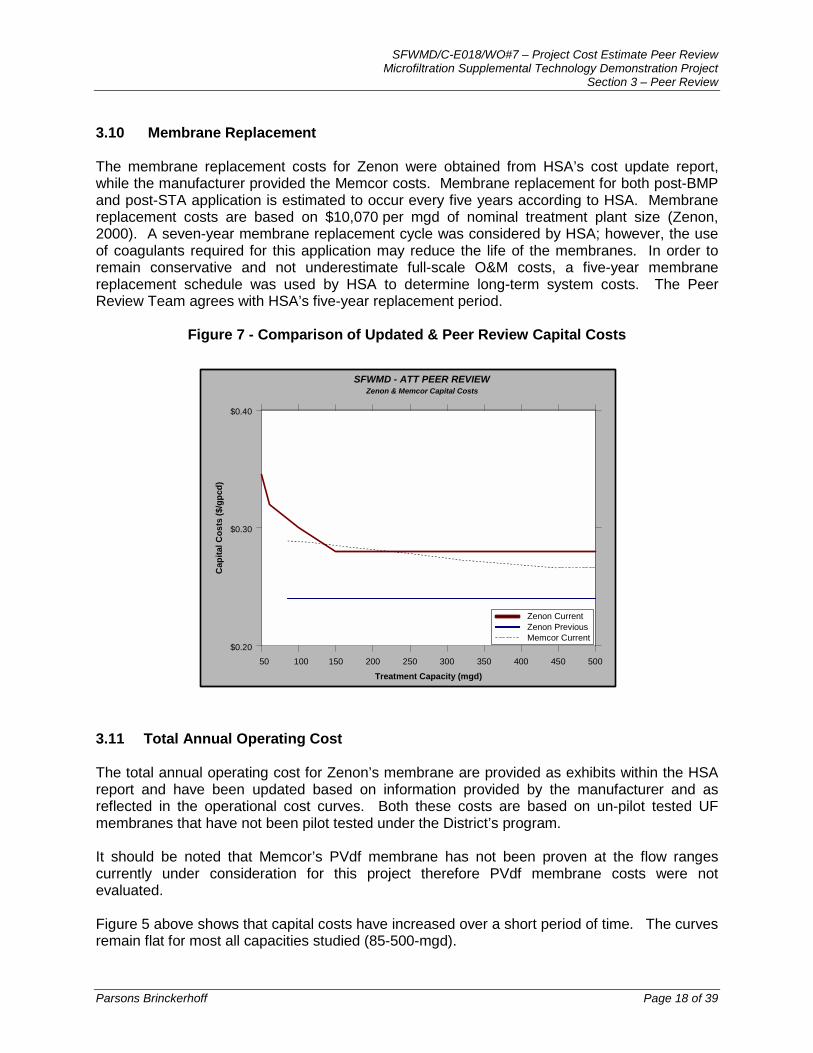
3.10 Membrane Replacement The membrane replacement costs for Zenon were obtained from HSA’s cost update report, while the manufacturer provided the Memcor costs. Membrane replacement for both post-BMP and post-STA application is estimated to occur every five years according to HSA. Membrane replacement costs are based on $10,070 per mgd of nominal treatment plant size (Zenon, 2000). A seven-year membrane replacement cycle was considered by HSA; however, the use of coagulants required for this application may reduce the life of the membranes. In order to remain conservative and not underestimate full-scale O&M costs, a five-year membrane replacement schedule was used by HSA to determine long-term system costs. The Peer Review Team agrees with HSA’s five-year replacement period.
Figure 7 - Comparison of Updated & Peer Review Capital Costs
3.11 Total Annual Operating Cost The total annual operating cost for Zenon’s membrane are provided as exhibits within the HSA report and have been updated based on information provided by the manufacturer and as reflected in the operational cost curves. Both these costs are based on un-pilot tested UF membranes that have not been pilot tested under the District’s program. It should be noted that Memcor’s PVdf membrane has not been proven at the flow ranges currently under consideration for this project therefore PVdf membrane costs were not evaluated. Figure 5 above shows that capital costs have increased over a short period of time. The curves remain flat for most all capacities studied (85-500-mgd).
50 100 150 200 250 300 350 400 450 500
Treatment Capacity (mgd)
$0.20
$0.30
$0.40
Cap
ital C
osts
($/g
pcd)
SFWMD - ATT PEER REVIEWZenon & Memcor Capital Costs
Zenon CurrentZenon PreviousMemcor Current

SFWMD/C-E018/WO#7 – Project Cost Estimate Peer Review Microfiltration Supplemental Technology Demonstration Project
Section 3 – Peer Review
Parsons Brinckerhoff Page 19 of 39
The following calculations show how the latest membrane O&M cost curves were established. Values were extrapolated as linear for both Memcor and Zenon O&M costs, based on confirmations obtained from the manufacturers. The previous Zenon unit values were obtained from the HSA report for the different flows, with the following exceptions: The O&M cost for a flow of 10 mgd was extrapolated and the cost for a flow of 170 mgd was actually the cost reported for a flow of 165 mgd. The current Zenon values were obtained directly from the manufacturer with the exception of costs for flows of 10 and 500 mgd, which were extrapolated. Memcor costs for flows of 10 through 500 mgd were also extrapolated, and based on a 40 mgd example provided by the manufacturer. The following is a typical breakdown of how O&M costs were determined. The values listed below represent the costs for an 85 mgd flow from the HSA report.
ZENON
Labor (Unit Cost x Total Hours)
30 $/hr x 18,720 hr = $561,000 Electrical (Unit Cost x Total Power)
0.08 $/Kwhr x 8,871,820 Kwhr = $709,746 Chemical (Unit Cost x Dosage) Citric Acid 0.90 $/lb x 62,475 lb = $56,228 Bleach 0.75 $/gal x 2,975 gal = $2,231 Sub-Total (Chemical) = $58,459 Membrane Replacement (Unit Cost x Flow) 10,070 $/mgd x 85 mgd = $855,950 Mechanical Maintenance (Capital Cost x 1%) 20.4 x 0.01 = $204,000 O&M Cost for 85 mgd = $2,389,775/year
or $6,547/day
MEMCOR Labor (Unit Cost x Total Hours)
30 $/hr x 18,720 hr = $561,000 Electrical (Unit Cost x Total Power)
0.08 $/Kwhr x 913,277 Kwhr = $73,062 Chemical (Unit Cost x Dosage) Citric Acid

SFWMD/C-E018/WO#7 – Project Cost Estimate Peer Review Microfiltration Supplemental Technology Demonstration Project
Section 3 – Peer Review
Parsons Brinckerhoff Page 20 of 39
0.90 $/lb x 75,098 lb = $67,588 Liquid Chlorine 0.11 $/lb x 85,455 lb = $9,400 Sodium Bisulfite (dechlorination) 0.35 $/lb x 102,517 lb = $35,881 Sub-Total (Chemical) = $58,459 Membrane Replacement (Unit Cost x Flow) 14,811 $/mgd x 40 mgd = $592,440 Mechanical Maintenance (Capital Cost x 1%) 0.289 $/gpd x 40,000,000 gpd x 0.01 = $115,600 O&M Cost for 40 mgd = $753,360/year
or $2,064 /day
Figure 8 - Comparison of Current Zenon UF & Memcor MF O&M Costs
0 50 100 150 200 250 300 350 400 450 500
Treatment Capacity (mgd)
0
5000
10000
15000
20000
25000
30000
35000
40000
O &
M C
osts
($/m
gd)
SFWMD - ATT PEER REVIEWZenon & Memcor O & M Costs
Zenon CurrentMemcor Current

SFWMD/C-E018/WO#7 – Project Cost Estimate Peer Review Microfiltration Supplemental Technology Demonstration Project
Section 3 – Peer Review
Parsons Brinckerhoff Page 21 of 39
Figure 9 - Required Footprint For Memcor CMF-S MF Process
3.12 Industry Trends Treatment plants utilizing membrane technologies benefit from the following:
�� Membrane plants consistently produce superior quality water versus conventional technologies
�� They provide a hedge against future more stringent regulations �� Require less operator attention, and �� Are aesthetically more pleasing
The development of membrane process costs since the first municipal RO membrane plant came on line in Florida in 1971 has been merging towards comparable conventional treatment process costs. An example of this trend is the costs for conventional lime softening versus membrane softening. Membrane softening has replaced conventional lime softening in Florida since it was first proposed on a large scale in 1988. MF and UF will undoubtedly replace conventional filtration in time. Seawater RO, once thought to be cost prohibitive is now at its lowest cost in history. For example, at Tampa Bay Water the water developer has been contracted to produce potable water from Tampa Bay at a cost of $1.71/Kgal. This trend toward lower costs or merging of costs is more readily noticed when costs are compared on a beneficial cost ratio analyses basis or in a matrix type evaluation. Some project cost components do not have intrinsic fixed value and common sense judgment factors need to be used to determine worth.
0 50 100 150 200 250 300 350 400 450 500
Microfiltration Treatment Capacity (mgd)
0.0
0.5
1.0
1.5
2.0Ar
ea (A
cres
)
SFWMD - ATT PEER REVIEWMemcor Footprints

SFWMD/C-E018/WO#7 – Project Cost Estimate Peer Review Microfiltration Supplemental Technology Demonstration Project
Section 3 – Peer Review
Parsons Brinckerhoff Page 22 of 39
3.13 Residuals Management HSA’s updated report states on page 5-9, Peer/B&C (August 1996) estimated a base capital construction cost for residual solids treatment and disposal facilities of $20,000/mgd of average daily design flow. Further, this cost was developed assuming thickening in settling ponds followed by underground injection on an adjacent dedicated land disposal site. The chemical feed dosages for the MF would be clearly less than that of the chemical treatment technologies discussed in the B&C document. The lower dosages for MF would reduce the cost to $7,500/mgd. For the same reason the B&C 1996 estimated O&M costs of $1,200/mgd were reduced to $450/mgd by HSA. HSA’s updated report on page 5-16 calls for land application of MF residual solids in the vicinity of the MF treatment facility. HSA states this would be the most cost effective solution however dewatering and transport to an approved landfill would also be a technically feasible option, but more expensive. Industry dewatering would employ one of the following methods; belt press, filter press, vacuum filtration or centrifugation. Typically, ultimate disposal of water plant residuals is accomplished by:
�� discharge to sanitary sewers; �� hauling to landfill; �� on-site disposal; and/or �� recovery of by-products.
By-product recovery of water treatment plant sludge has been accomplished, sometimes successfully, internationally through:
�� brick making; �� augmentation as a soil conditioner; and/or �� chemical recovery.
Site-specific studies and pilot testing are recommended for proving any by-product recovery method.
Table 1 - Chemical Dosages for Post-BMP Processes Using Ferric Chloride
Process Ferric Chloride Dosage(mg/l)
Chemical Treatment/High Rate Sedimentation Post-BMP North Site
40
Microfiltration Post-BMP
8
SFWMD/C-E018/WO#7 – Project Cost Estimate Peer Review Microfiltration Supplemental Technology Demonstration Project
Section 3 – Peer Review
Parsons Brinckerhoff Page 23 of 39
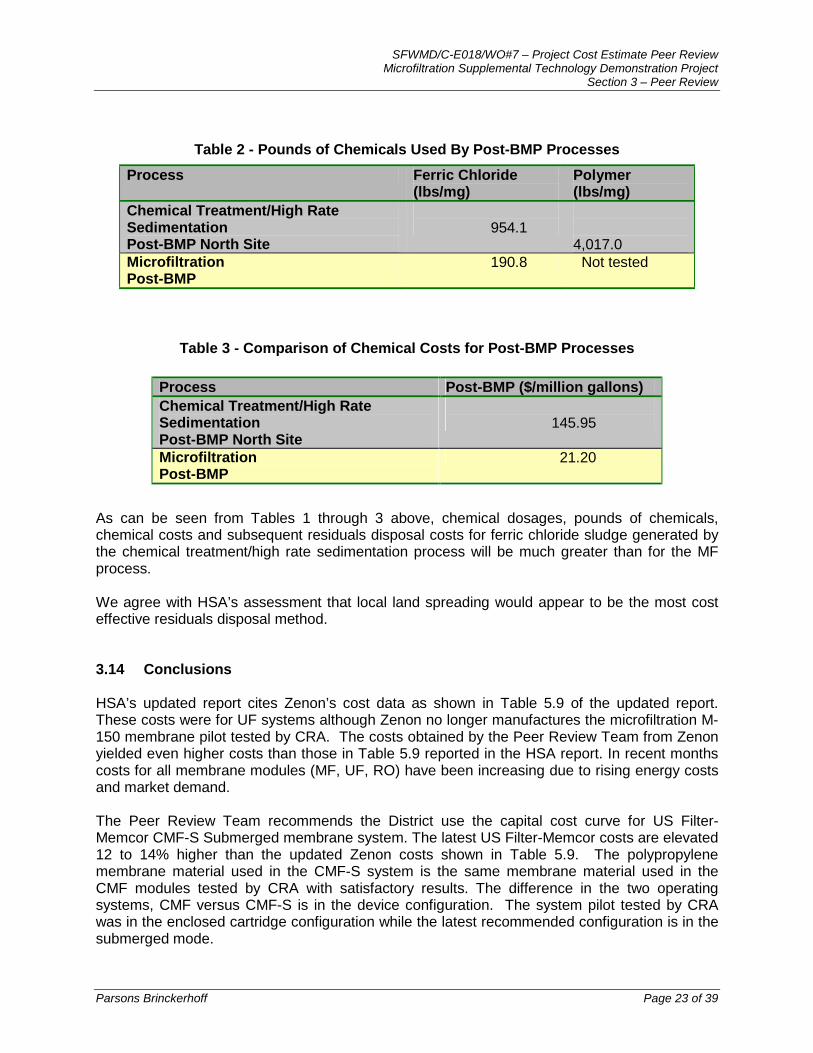
Table 2 - Pounds of Chemicals Used By Post-BMP Processes
Table 3 - Comparison of Chemical Costs for Post-BMP Processes As can be seen from Tables 1 through 3 above, chemical dosages, pounds of chemicals, chemical costs and subsequent residuals disposal costs for ferric chloride sludge generated by the chemical treatment/high rate sedimentation process will be much greater than for the MF process. We agree with HSA’s assessment that local land spreading would appear to be the most cost effective residuals disposal method. 3.14 Conclusions HSA’s updated report cites Zenon’s cost data as shown in Table 5.9 of the updated report. These costs were for UF systems although Zenon no longer manufactures the microfiltration M-150 membrane pilot tested by CRA. The costs obtained by the Peer Review Team from Zenon yielded even higher costs than those in Table 5.9 reported in the HSA report. In recent months costs for all membrane modules (MF, UF, RO) have been increasing due to rising energy costs and market demand. The Peer Review Team recommends the District use the capital cost curve for US Filter-Memcor CMF-S Submerged membrane system. The latest US Filter-Memcor costs are elevated 12 to 14% higher than the updated Zenon costs shown in Table 5.9. The polypropylene membrane material used in the CMF-S system is the same membrane material used in the CMF modules tested by CRA with satisfactory results. The difference in the two operating systems, CMF versus CMF-S is in the device configuration. The system pilot tested by CRA was in the enclosed cartridge configuration while the latest recommended configuration is in the submerged mode.
Process Ferric Chloride (lbs/mg)
Polymer (lbs/mg)
Chemical Treatment/High Rate Sedimentation Post-BMP North Site
954.1
4,017.0
Microfiltration Post-BMP
190.8 Not tested
Process Post-BMP ($/million gallons) Chemical Treatment/High Rate Sedimentation Post-BMP North Site
145.95
Microfiltration Post-BMP
21.20

SFWMD/C-E018/WO#7 – Project Cost Estimate Peer Review Microfiltration Supplemental Technology Demonstration Project
Section 3 – Peer Review
Parsons Brinckerhoff Page 24 of 39
Table 4 - Cost Comparison of UF, MF and CT-SS Processes for Post-BMP Flows
Table 5 - Cost Comparison of UF, MF and CT-SS Processes for Post-STA Flows
In the above tables (Tables 4 and 5), the updated report costs from HSA’s Table 5.9, Memcor costs generated by the Peer Review, and the CT-SS Peer Review capital costs are compared for various flow ranges. It is interesting to note as the flows are diminished the capital costs move closer for the two technologies. Examination on a present worth basis comparing MF and CT-SS costs should reveal an optimum plant capacity at which MF may be the most cost effective process to use. The updated capital cost estimates by HSA were verified to be sufficient for the engineering budgetary cost estimate since their accuracy range was within +30% to –15%, which is in accordance with the norms developed by the American Association of Cost Engineers.
Table 6 - O&M Cost Comparison for Post-BMP and Post-STA Systems
450 mgd Post-BMP ($/Kgal)
500 mgd Post-STA ($/Kgal)
HAS Updated Report Zenon .05 .04 Current Zenon .10 .10 Current Memcor .06 .06
However, based on a comparison of HSA’s costs in Table 5-12, O&M costs (without levee maintenance, residuals solids management, sampling and monitoring), on a $/Kgal basis, the current O&M costs provided by the US-Filter Memcor and Zenon are higher. The Peer Review Team recommends using the current Memcor MF O&M costs which when compared to HSA’s latest costs are more conservative but within the plus 30% estimate guidelines developed by the American Association of Cost Engineers for most flow ranges considered in the study.
Post-BMP Flows (mgd) 450 315 230 240 165
125
Table 5.9 UF
$108,000,000 $75,600,000 $55,200,000 $57,600,000 $39,600,000 $30,000,000
Memcor $120,150,000 $85,995,000 $64,630,000 $66,960,000 $47,025,000 $36,000,000 CT-SS $62,000,000 $47,000,000 $34,000,000 $36,500,000 $27,500,000 $21,500,000
Post-STA Flows (mgd) 500 305 225 160 110 85 Table 5.9 $120,000,000 $73,200,000 $54,000,000 $38,400,000 $26,400,000 $20,400,000 Memcor $133,500,000 $83,570,000 $63,000,000 $45,440,000 $31,680,000 $24,480,000 CT-SS $67,000,000 $44,000,000 $33,000,000 $25,000,000 $19,800,000 $16,000,000

SFWMD/C-E018/WO#7 – Project Cost Estimate Peer Review Microfiltration Supplemental Technology Demonstration Project
Appendix A
Parsons Brinckerhoff Appendix A-1
APPENDIX A

SFWMD/C-E018/WO#7 – Project Cost Estimate Peer Review Microfiltration Supplemental Technology Demonstration Project
Appendix A
Parsons Brinckerhoff Appendix A-2
Basic US Filter-Memcor CMF System
The MF system that was tested by CRA was the Memcor CMF system described in the following paragraphs. The heart of the polypropylene Continuous Microfiltration (CMF) system consists of hollow fiber microporous membranes. These membranes are approximately 0.5mm in diameter, and are encapsulated into a bundle to form a filter module. The filter modules housing the membranes are modular in design, and are connected by an interlocking mechanism that reduces external plumbing requirements.
During normal operation of the US Filter-Memcor CMF system, the feed passes from the outside of the membrane (from the module shell) into the center (lumen) and exits as filtrate. Suspended solids and microorganisms are collected on the outside surface of the hollow fiber. Typical system feed pressure is 25 to 35 psid (170 to 240 kPa). The normal operating differential pressure for the membrane is 5 to 30 psid (35 to 210 kPa), with an average initial differential pressure loss of 5 to 8 psid (35 to 55 kPa). The gas backwash utilized by the process, is a self-cleaning regime for the cleaning of hollow fiber membranes. Compressed air is used to perform a backwash, with air being introduced into the filtrate side of the system, and released through the walls of the hollow fiber. Accumulated solids are flushed from the membrane surface using feed water. Filtrate is not used to backwash the membranes. US Filter-Memcor CMF systems have been proven to be effective in the removal of particles greater than 0.2 micrometers (which is the absolute pore size of the membrane), colloidal particles, fecal bacteria and enteric viruses, giardia lamblia, cryptosporidium cysts, heavy metal particulates and their hydroxides, algal blooms, and yeast cells enabling these systems to meet current and future requirements. The systems also have a number of membrane integrity diagnostic facilities that monitor the system integrity and provide continuous filtrate quality assurance. The core component of a CMF filtration system is the microporous hollow fiber membrane that forms the filtration barrier. The fibers are bundled together to form a submodule. The submodule is housed in a Module. The module is constructed of molded nylon components, and has been designed to fit together with other modules into a module block or a. module blocks are fitted to a frame and connected with piping, valving and electrical and pneumatic controls to construct a CMF unit.
Courtesy of US Filter-Memcor

SFWMD/C-E018/WO#7 – Project Cost Estimate Peer Review Microfiltration Supplemental Technology Demonstration Project
Appendix A
Parsons Brinckerhoff Appendix A-3
Groups of CMF units may be connected together in a row to form a CMF train. The units in a train share common ancillary equipment such as manifolds, backwash disposal, air supply, chemical cleaning system and controls. The CMF-S submerged membrane system described in the next section was not available at the time CRA began pilot testing. The new CMF-S system is, according to Memcor technical staff, a later generation product more suitable to this application. Like the Zenon ZeeWeed® UF membrane system, the CMF-S is a submerged system. Basic Overview of the Latest US Filter-Memcor CMF-S Microfiltration System As engineers and owners gain microfiltration experience and with the declining cost of membrane technology, the trend is to design larger microfiltration plants. However, according to Memcor, incorporating considerations for economy of scale, there is a point above 15-mgd where supplying multiple skidded systems is not as economical. The CMF-S system addresses this opportunity with a pre-engineered modular membrane system designed to be submerged into built on-site rectangular concrete tanks. CMF has been an established and proven technology and according to the manufacturer they have more than 700 CMF systems around the world and during this decade they further state CMF capital and operating costs have dropped by over 50%. This trend continues in the next step of the CMF's evolution, a submerged CMF, or CMF-S. US Filter-Memcor researched and developed the submerged membrane system over the past two years. The aim was to reduce capital costs, simplify and scale up the microfiltration process for full-scale applications. After running over a half dozen small-scale trials on a range of feed waters, the design was validated. The first commercial plant was commissioned in August 1998 at Dalesford, Victoria, Australia.
Submerged Microfiltration Membrane System
Courtesy of US Filter Memcor

SFWMD/C-E018/WO#7 – Project Cost Estimate Peer Review Microfiltration Supplemental Technology Demonstration Project
Appendix A
Parsons Brinckerhoff Appendix A-4
The CMF-S uses a membrane with a 0.2-micron pore size and demonstrates up to 6-log removal of Giardia and Cryptosporidium. A vacuum pump draws water through the membrane fibers of sub-modules submerged in the open top filter tanks. The fibers are the same polypropylene material as those used in the conventional CMF process, but the Memcor CMF-S operates under vacuum, so the maximum driving pressure is only 85-100kPa. This lower pressure limit is not the disadvantage it first appears to be because filter cake characteristics improve at lower pressures. Compared against earlier versions of CMF, operation of the submerged system has according to the manufacturer, elsewhere demonstrated the following:
�� Fluxes 80-95% of CMF
�� The same backwash efficiency and backwash intervals
�� The same cleaning efficiency and CIP intervals
�� The same membrane integrity Basic Overview of the Zenon UF Membrane Technology The ZeeWeed® membrane module’s features are as follows:
�� Can accommodate coagulant additions such as Ferric Chloride
�� Oxidant resistant and chlorine tolerant
�� Over 2.5 log removal of viruses
�� NSF 61 certified ultrafilter ZeeWeed® water treatment is a proprietary Zenon process technology that can produce high quality water by drawing raw water through immersed UF membrane modules. The ZeeWeed® "Outside-In" hollow-fiber membranes form an absolute barrier to particulate, including giardia cysts and cryptosporidum oocysts. The ZeeWeed® ultrafiltration membrane can remove a large percentage of impurities. This includes certain viruses, which are removed by a combination of adsorption onto the solids in the process tank and by membrane filtration.
Courtesy Zenon Environmental

SFWMD/C-E018/WO#7 – Project Cost Estimate Peer Review Microfiltration Supplemental Technology Demonstration Project
Appendix A
Parsons Brinckerhoff Appendix A-5
The membranes operate under a slight vacuum created within the hollow membrane fibers by a permeate pump. Pretreated water (after ferric chloride addition) is further treated as it is drawn through the membranes, enters the hollow fibers and is returned less the major portion of the phosphorous to the Everglades system. Air flow is introduced at the bottom of the membrane modules to create turbulence which scrubs and cleans the outside of the membrane fibers allowing them to operate at a high flux. The cyclic aeration provided also oxidizes iron and organic compounds, resulting in a treated water quality which is greater than that provided by ultrafiltration alone.
As stated above the UF system would be effective at removing phosphorous from water. Coagulant would be injected into the water as was in the CRA pilot tests to allow the formation of floc particles, which only need to be larger than the membrane pores to be rejected. UF membranes can effectively replace both clarifier and granular media type filters found in a conventional water treatment plants resulting in easier control for plant operators.
The membranes are immersed directly in the process tank and are under a slight vacuum. High suspended solids concentrations do not foul the membranes or cause excessive backpulsing frequency and therefore, avoiding the loss of productivity. These membranes have the additional benefit of being chlorine resistant up to concentrations of 1,000 mg/l. Therefore, influent water can be pre-chlorinated if deemed necessary. This type of membrane process can consistently produce high quality water as the membranes are less subject to stress, pressurization or rapid pressure fluctuations. Membrane cleaning by backpulsing is achieved by reversing the permeate flow and backwashing the fiber's lumen with permeate at low pressure. The small variations in operating pressure occur smoothly over relatively long periods so that at no time is the membrane stressed.
Courtesy of Zenon Environmental

SFWMD/C-E018/WO#7 – Project Cost Estimate Peer Review Microfiltration Supplemental Technology Demonstration Project
Appendix A
Parsons Brinckerhoff Appendix A-6
Operational Microfiltration & Ultrafiltration Facilities
Water & Wastewater Treatment Facilities >
100,000 gpd
Project Name
Owner Startup Feedwater Capacity(gpd)
Whitebull Water Treatment Works North West Water 1997 Groundwater 11,890,000
Koper (Slovenie) Koper (Slovenie) 12/1/1997 Groundwater 9,200,000Winnick Water Treatment Works North West Water 8/1/97 Groundwater 4,230,000
Chilhowie WTP Village of Chilhowie VA 7/20/1999 Groundwater 2,500,000Spectacle Pond Well Treatment Littleton, MA 4/1/1998 Groundwater 1,500,000
Rocco Farm Foods Rocco Farm Foods 1/1/96 Groundwater 1,500,000Fontgombault, France Lyonnaise des Eaux 5/10/93 Groundwater 1,321,000Bernay, France Lyonnaise des Eaux 10/1/93 Groundwater 872,000La Filliere, France Lyonnaise des Eaux 2/1/93 Groundwater 528,400Sauve, France Lyonnaise des Eaux 6/1/91 Groundwater 502,000Douchy, France Lyonnaise des Eaux 8/1/89 Groundwater 320,000Urzy, France Lyonnaise des Eaux 3/1/93 Groundwater 291,000Gracay, France Lyonnaise des Eaux 6/1/90 Groundwater 190,000Chatel-Gerard, France Lyonnaise des Eaux 6/1/93 Groundwater 174,000Bristol Myers Squibb GW Remediation Bristol Myers Squibb 8/1/94 Groundwater 168,000
Charcenne, France Lyonnaise des Eaux 9/1/92 Groundwater 158,000Saint-Jean D'Arvey, France Lyonnaise des Eaux 1/1/94 Groundwater 158,000Douchy I Lyonnaise des Eaux 3/1/95 Groundwater 110,000Dungannon WTP Dungannon, Town of 12/1/98 Groundwater 70,000
Project Name Owner Startup Feedwater Capacity(gpd)
Huntington Water Treatment Works North West Water 9/1/96 Surface Water 20,000,000
Heemskerk N.V. PWN Water Supply Company of North Holland 4/99 Surface Water 18,500,000
Lausanne, Switzerland Lausanne, Switzerland 6/1/99 Surface Water 17,200,000Vigneux-sur-Seine WTP
Jan, 1998 Article Dec, 1997 Article Oct, 1997 Article
Lyonnaise des Eaux 10/13/97 Surface Water 14,500,000
Kenosha Water Plant (Project Description)
1996 Article May, 1999 Article
Memcor -- Kenosha Tour 99
Kenosha, City of 12/22/98 Surface Water 14,000,000
Ennerdale Water Treatment Works North West Water 2/15/2000 Surface Water 11,900,000
Manitowoc, WI City of Manitowoc, WI 5/15/99 Surface Water 11,000,000

SFWMD/C-E018/WO#7 – Project Cost Estimate Peer Review Microfiltration Supplemental Technology Demonstration Project
Appendix A
Parsons Brinckerhoff Appendix A-7
Joyce Road Water Treatment Plant
Tauranga District Council, New Zealand 12/97 Surface Water 9,775,400
Industrial Business Park Industrial Water Production Facility (1998 News Account)
Bexar Metropolitan Water District 1/2000 Surface Water 9,000,000
Cornhow Water Treatment Works North West Water 1998 Surface Water 8,450,000
Collingwood, Ontario (Project Description)
(Zenon Article)
Collingwood Public Utilities Commission
Train 1 since 7/97, Trains 2 thru 5 since 12/98
Surface Water 7,600,000
Apie Saint-Cassien Plant Lyonnaise des Eaux 1/1/97 Surface Water 7,500,000Kamole Weir WTP
M&E Description Alt. Description
Maui Water (County of Maui) 5/1/98 Surface Water 7,200,000
Loch Lomond Temporary MF Facility
City of Thunder Bay, Ontario 11/8/98 Surface Water 7,000,000
Marquette MI (May 1998 Award)
(1998 Abstract) (9/98 Article)
Marquette, City of 10/1/97 Surface Water 7,000,000
Scottsdale Water Campus (water) Scottsdale, AZ 2/1/99 Surface Water 6,000,000
Saratoga Water Treatment Plant (Description)
San Jose Water Co. 3/1/94 Surface Water 5,000,000
Westside Water Treatment Plant
Cucamonga County Water District 5/1/97 Surface Water 4,000,000
Brooklyn Naval Shipyard 2/1/99 Surface Water 3,450,000Ft. Lupton-Hudson WTP Ft. Lupton, City of 12/1/96 Surface Water 3,000,000
Lahaina WTP, Lahaina Maui Maui Water (County of Maui) 5/1/97 Surface Water 2,700,000
Dayton WTP Dayton, VA 4/1/99 Surface Water 2,200,000Mackinac Island (Abstract) Mackinac Island 5/1/98 Surface Water 2,000,000
Greytown, New Zealand Greytown, NZ 4/1/99 Surface Water 2,000,000
NUANNU Lower Aerator Honolulu HI Board of Water Supply 3/1/99 Surface Water 2,000,000
Giles County PSA Giles County PSA, Pembroke VA 7/1/99 Surface Water 2,000,000
Foxwoods Casino Mashantucket Pequot Tribe 2/1/96 Surface Water 1,800,000
Iao Ditch, Maui Maui Water (County of Maui) 5/1/97 Surface Water 1,800,000
Olinda WTP, Maui Maui Water (County of Maui) 5/1/98 Surface Water 1,700,000
White Plains, NY White Plains, NY 1/1/99 Surface Water 1,600,000
Sioux Lookout Sioux Lookout--First Nation, Ontario 11/1/98 Surface Water 1,400,000
La Nive, France Lyonnaise des Eaux 5/1/92 Surface Water 1,321,000Amherst Water System Amherstview, Ontario 4/1/98 Surface Water 1,300,000

SFWMD/C-E018/WO#7 – Project Cost Estimate Peer Review Microfiltration Supplemental Technology Demonstration Project
Appendix A
Parsons Brinckerhoff Appendix A-8
Wallace, Idaho USDA Success Story (PDF)
East Shoshone County Water District 1998 Surface Water 1,200,000
Anthem Water Campus Maricopa County, Arizona 9/1/98 Surface Water 1,000,000CAP Water Plant Scottsdale, AZ 9/1/94 Surface Water 1,000,000New Market VA New Market, Town of 8/5/98 Surface Water 1,000,000
Olivenhain Demo Facility Press Release
Project Description
Olivenhain Municipal Water District 9/1/99 Surface Water 1,000,000
Douglas County Douglas County, Virginia 5/1/97 Surface Water 960,000Coles Run WTP, Verona VA Lower Brule Community 11/15/99 Surface Water 960,000Lower Brule Reservation WTP 1/1/98 Surface Water 960,000
Kisima Industrial Site NV Water Company, Netherlands 2/1/99 Surface Water 951,000
Nagambie Water Treatment Plant
(EIDN Project Description)(Press Release)
Goulburn Valley Water, Victoria Australia 8/5/94 Surface Water 925,000
Avoriaz, France Lyonnaise des Eaux 11/1/93 Surface Water 898,000
Mullan, Idaho East Shoshone County Water District 1998 Surface Water 800,000
Estevan Power Station Saskpower 5/1/97 Surface Water 720,000Macao UF Plant Macao Water Supply LTD 6/1/91 Surface Water 690,000Meredith Water Treatment Plant
Barwon Water, Victoria Australia 6/1/1993 Surface Water 660,500
Rothesay, NB Rothesay, New Brunswick 6/1/96 Surface Water/Groundwater 600,000
Crow Creek Reservation, Ft. Thompson Community
Aberdeen Area Indian Health Service 8/15/99 Surface Water 500,000
Clyde Potts WTP, Morris, New Jersey
Southeast Morris County Munic. Utilities Authority 8/1/97 Surface Water 500,000
Kodak, Australia Kodak 1/1/94 Surface Water 500,000Lincoln Memorial University LMU, Harrowgate TN 1/1/96 Surface Water 500,000Argyl Diamond Mine, Australia Argyl Diamond Mine 1/1/92 Surface Water 432,000
Rural Retreat Rural Retreat, Town of 2/1/98 Surface Water 420,000
Marulan WTP Mulwaree Shire Council, New South Wales, Australia
8/1/98 Surface Water 396,000
Barrow Water Systems Upgrade
Barrow Utilities & Electric Cooperative, Barrow Alaska
6/1/99 Surface Water 360,000
McKinley Paper Mill, Prewitt, NM McKinley Paper Mill 6/1/94 Surface Water 360,000
God's Lake God's Lake--First Nation, Manitoba 8/1/98 Surface Water 350,000
Wainwright Alaska Wainwright, City of 8/1/97 Surface Water 324,000
Shamattawa -- First Nation Shamattawa--First Nation, Manitoba 11/1/98 Surface Water 300,000
Pardee Recreation Area East Bay MUD 1996 Surface Water 300,000

SFWMD/C-E018/WO#7 – Project Cost Estimate Peer Review Microfiltration Supplemental Technology Demonstration Project
Appendix A
Parsons Brinckerhoff Appendix A-9
Birregurra Water Treatment Plant
Barwon Water, Victoria Australia 6/1/98 Surface Water 264,200
Echo Bay, Lake Mead National Park Service 3/1/99 Surface Water 259,000Overton Beach, Lake Mead National Park Service 3/1/99 Surface Water 259,000
Beausoleil First Nation Beausoliel First Nation, Ontario 5/1/99 Surface Water 240,000
Pine Brook Water District WTP
Pine Brook Water District, Boulder CO 4/1/97 Surface Water 240,000
Linwood MWD Linwood Metropolitan Water District 12/1/98 Surface Water 216,000
Weyerhauser Weyerhauser, Alberta 7/1/95 Surface Water 200,000Edinburg VA Edinburg 6/1/98 Surface Water 180,000Water Treatment Improvements Project
Bolinas Community Public Utility District 2/1/96 Surface Water 160,000
Shoal Lake Shoal Lake--First Nation, Ontario 10/1/98 Surface Water 150,000
Cadbury Schweppes, Australia Cadbury Schweppes 1/1/94 Surface Water 144,000
San Bernadino, CA National Forest US Forest Service 6/1/93 Surface Water 144,000
Strawberry WTP El Dorado Irrigation District 11/1/94 Surface Water 132,000Noble County, Lucien OK Noble County 11/1/97 Surface Water 120,000
Waiawa Correctional Facility Hawaii Dept of Public Safety 12/1/96 Surface Water 120,000
Perth Way Treatment Plant Inverness Public Utilities District 4/1/96 Surface Water 120,000
Tomsbrook Tomsbrook 7/1/97 Surface Water 120,000West Jefferson WTP West Jefferson, Town of 9/1/98 Surface Water 120,000
Seri Kembangan WTP Transwater Corporation, Malaysia 4/1/98 Surface Water 120,000
Beverly Beach State Park Oregon State Parks 5/1/99 Surface Water 115,000New Rochelle WTP New Rochelle NY, Town of 10/1/92 Surface Water 108,000
Project Name Owner Startup Feedwater Capacity(gpd)
Eindhoven NV Nutsbedriff Regio Eindhoven 5/1/97 Backwash Water 634,000
Rocco Farm Foods Backwash Recovery Rocco Farm Foods 1/1/96 Backwash Water 160,000
Douglas County Backwash Recovery Douglas County 5/1/97 Backwash Water 160,000
Project Name Owner Startup Feedwater Capacity(gpd)
Westview Water Reclamation Facility Powell River, BC 10/1/98 Wastewater (Raw) 2,000,000
Kaha Egypt Kaha, Egypt 7/1/98 Wastewater (Raw) 2,000,000El Obour Egypt El Obour, Egypt 9/1/98 Wastewater (Raw) 1,320,000Anthem Water Campus Maricopa County, Arizona 10/1/98 Wastewater (Raw) 1,000,000Arapahoe CO Arapahoe, CO 8/1/98 Wastewater (Raw) 1,000,000Porlock MBR Facility Wessex Water 2/1/98 Wastewater (Raw) 500,000Oakwood, NJ Oakwood, NJ 2/1/98 Wastewater (Raw) 350,000

SFWMD/C-E018/WO#7 – Project Cost Estimate Peer Review Microfiltration Supplemental Technology Demonstration Project
Appendix A
Parsons Brinckerhoff Appendix A-10
Mt. Washington Ski Resort Mt. Washington, BC 11/1/96 Wastewater (Raw) 300,000Hidden Meadows NJ Hidden Meadows, NJ 5/1/98 Wastewater (Raw) 104,000
Project Name Owner Startup Feedwater Capacity(gpd)
Milton Milton, Ontario 6/1/97 Wastewater (Primary) 530,000
Project Name Owner Startup Feedwater Capacity(gpd)
Mobil Boiler Feed project West Basin Municipal Water District 8/1/98 Wastewater (Unfiltered
Secondary) 3,800,000
Clean Water Revival Dublin San Ramon Services District 12/15/98 Wastewater (Unfiltered
Secondary) 2,940,000
Barrier Project (Phase II Expansion)
USBR Description
West Basin Municipal Water District 6/1/97 Wastewater (Unfiltered
Secondary) 2,940,000
Cronulla Membio Facility Cronulla Australia 11/1/92 Wastewater (Unfiltered Secondary) 994,000
Eraring Power Station, Lake Macquarie, New South Wales Case Study #2
Pacific Power Corporation 3/1/96 Wastewater (Unfiltered Secondary) 920,000
Blackheath, Australia Blackheath Australia 1/1/91 Wastewater (Unfiltered Secondary) 900,000
Key Colony WWTP Key Colony, Florida Keys 1/1/99 Wastewater (Unfiltered Secondary) 850,000
OCWD MF Demo Project #1 Orange County Water District 8/1/94 Wastewater (Unfiltered
Secondary) 792,000
LeHigh Florida Lehigh, FL 10/1/98 Wastewater (Unfiltered Secondary) 750,000
OCWD MF Demo Project #2 Orange County Water District 3/3/99 Wastewater (Unfiltered
Secondary) 720,000
Mount Barker STEDS Effluent Treatment Plant
District Council of Mt. Barker, NSW, Australia 1998? Wastewater (Unfiltered
Secondary) 616,000
Orascum Egypt Orascum Egypt 9/1/97 Wastewater (Unfiltered Secondary) 530,000
Margaretsville STP New York City 4/1/99 Wastewater (Unfiltered Secondary) 480,000
Grahamsville STP, Neversink NY New York City 4/1/97 Wastewater (Unfiltered
Secondary) 360,000
Ganges, BC Phase II Upgrade Ganges, BC 9/1/98 Wastewater (Unfiltered
Secondary) 211,000
Ganges, BC Phase I Ganges, BC 12/1/96 Wastewater (Unfiltered Secondary) 90,000
Project Name Owner Startup Feedwater Capacity(gpd)
Scottsdale Water Campus (wastewater) Scottsdale, AZ 2/1/99 Wastewater (Filtered
Secondary) 10,000,000
Carson RWTF West Basin Municipal Water District 1/2000 Wastewater (Filtered
Secondary) 5,880,000
Tannersville WTF New York City 8/1/98 Wastewater (Filtered Secondary) 2,000,000
Grand Gorge WTF New York City 8/1/98 Wastewater (Filtered Secondary) 1,250,000

SFWMD/C-E018/WO#7 – Project Cost Estimate Peer Review Microfiltration Supplemental Technology Demonstration Project
Appendix A
Parsons Brinckerhoff Appendix A-11
Pine Hill WWTP Pine Hill, NY 11/1/98 Wastewater (Filtered Secondary) 1,250,000
Livermore AWRP Livermore, City of 2/1/97 Wastewater (Filtered Secondary) 880,000
Project Name Owner Startup Feedwater Capacity(gpd)
Chandler Intel Wastewater Treatment
(Ionics Project Description)(Other Project Description)
B&V 1996 Writeup June 1996 Article
Chandler, City of 11/1/97 Industrial Wastewater 1,728,000
Zinc Nacional Zinc Nacional (Mexico) 12/1/98 Industrial Wastewater 288,000
Courtesy of © Fluid Knowledge, 1998 &1999 & 2000. Latest Update 1/14/2000 Feel free to cite the information provided here, however please reference the source as:
Geselbracht, J. J., (2000), "Operational Microfiltration & Ultrafiltration Water & Wastewater Treatment Facilities", Fluid Knowledge, http://www.fluidknowledge.com/fksite/links/mfprojects, January 14.
GLOSSARY OF FILTRATION TERMS (Courtesy of US Filter-Memcor) Acidity
The quantitative capacity of aqueous solutions to react with alkalis. Alkalinity
The quantitative capacity of aqueous solutions to react with acids. Backwash
Reversed flow through a filter medium to remove filtered solids. Break Tank
Storage tank at atmospheric (a break in head pressure) pressure from which feed is drawn prior to filtration.
Bubble Point The pressure at which air first passes through a wet membrane; the path being the channel of greatest pore size.
Cartridge An assembly of filtration media in a housing.
Caustic A Sodium Hydroxide (NaOH) solution.
Center Tube The nylon or stainless steel tube which forms the main shell of an M10 class CMF module.
CIP Clean-in-place. A method whereby a filter medium can be chemically cleaned to restore performance without requiring removal from the system.
Cleaning Agent An agent used to soften, disintegrate, or dissolve contaminants lodged in a filter.
CMF Continuous Microfiltration. Memcor's microfiltration product, which uses a gas backwash to allow continuous operation on feed streams of varying quality, is a CMF system.

SFWMD/C-E018/WO#7 – Project Cost Estimate Peer Review Microfiltration Supplemental Technology Demonstration Project
Appendix A
Parsons Brinckerhoff Appendix A-12
Coliforms A group of bacteria which are used as indicator organisms in various standards of hygiene for drinking water and wastewater treatment.
Concentrate The non-filtered stream leaving a crossflow filter system. Also called Return, Recycle, Recirculation, or Reject.
Compaction The reduction in thickness of a filter medium as a result of applied filtration pressure (TMP).
Cross Flow Filtration Method of filtration where the feed stream flows parallel to the surface of the filter medium to minimize fouling. Only a percentage of the feed passes through the filter medium.
DAF Test Diffusive Air Flow Test. A high-resolution test for detecting membrane integrity to one part in 107. It measures the amount of air that is diffused through a wetted membrane.
Deadleg An area of the pipework in which process fluid may stagnate.
Direct Filtration A method of filtration whereby the feed stream is fed directly to the filtration media. All the feed passes through the membrane. No crossflow is used; therefore, feed flow and filtrate flow are balanced during filtration.
Dynamic Membrane A transient membrane formed on the surface of an established membrane by solids filtered from the feed stream. Sometimes called a filter cake.
End Manifold A molded plastic component which provides a simplified means of connecting module banks together to form a module array, while maintaining separation of feed and filtrate.
Feed The raw supply liquid to the filtration unit.
Fiber More correctly called the Hollow Fiber Membrane. A bundle of thousands of fibers is used in each Memcor® module.
Filtrate The end product of the filtration process; i.e., liquid exiting the filtrate outlet.
Filtrate Flow Rate The instantaneous volume per unit time of filtrate produced by a system, typically measured on a filtrate flowmeter.
Filtrate Flux The rate of filtrate flow as expressed per unit of filtration area (liters/meter sq. hour).
Filtrate Shut-off Valve The device used to isolate filtrate flow from a single module. It is a built-in feature of the Memcor® M10 class module.
Filtrate Side That part of a system which carries filtrate flow, including fiber lumens and all filtrate-carrying manifolds and pipework
FTU A measure of turbidity equal to NTU.

SFWMD/C-E018/WO#7 – Project Cost Estimate Peer Review Microfiltration Supplemental Technology Demonstration Project
Appendix A
Parsons Brinckerhoff Appendix A-13
Hardness The concentration of polyvalent cations in water.
Head The manifolded headpiece of the CMF module.
Hydrophilic Water-loving. Easily wetted with water.
Hydrophobic Water-aversive. Not easily wetted with water.
kg Kilogram - unit of mass. Consists of 1000 grams or 2.2 lbs.
kPa Kilopascal - a unit of pressure. 100kPa = 14.75 psi or 1 atmosphere.
Lumen The axial hole through the center of a hollow fiber membrane.
Lumen Side Same as Filtrate Side for outside to inside filtration as used by Memcor's CMF process.
M10 Nomenclature for the filter modules used in Memcor® CMF systems. Membranes housed in an M10 module have an equivalent surface area of approximately 10m2 or more.
Membrane A porous barrier filtration medium. It may be flat (e.g. R.O.), or a hollow fiber (e.g. Memcor® CMF).
Membrane Test A process, based on membrane bubble point characteristics, for testing the integrity of the membranes used by the Memcor® CMF system.
Memclean® Proprietary chemical solution used to clean microfiltration membranes and systems.
Microfiltration Membrane filtration of a liquid which removes particles in the range of 0.1 to 1.5 microns. Memcor® membranes have a nominal pore size of 0.2 microns.
Module An assembly of hollow fiber membranes in a single pressure vessel or housing with a head manifold at each end containing separate feed and filtrate connections.
Module Array Multiple module banks connected by end manifolds to form a block of filtration modules. A ninety-module array consists of fifteen banks of 6 modules each.
Module Bank Multiple single modules connected together in a row with end manifolds.
Nephelometer An instrument which uses scattering light to measure turbidity in a liquid. Commonly known as a turbiditimeter.
NTU Nephelometric Turbidity Unit. Unit of turbidity (lack of clarity) obtained by measuring scattering of light in a liquid.
Osmosis The natural transport of water through a semi-permeable membrane which separates two solutions of different solute concentration.

SFWMD/C-E018/WO#7 – Project Cost Estimate Peer Review Microfiltration Supplemental Technology Demonstration Project
Appendix A
Parsons Brinckerhoff Appendix A-14
Outer Sleeve The threaded retainer which holds the head to the center tube of an M10 CMF module.
Permeate The product, or filtrate, of Reverse Osmosis or ultrafiltration.
pH Measurement of acidity (<7) or alkalinity (>7). The logarithm of the reciprocal of hydrogen ion concentration in an aqueous solution.
PLC Programmable Logic Controller. Used to control the functions of a Memcor® CMF system.
Pore Small interconnecting passage through the membrane. The size and irregular path of a pore determines the removal rating of a membrane.
Pore Size The equivalent diameter of the smallest part of any channel through a membrane.
Potting The securing material or adhesive that seals the filter material in a cartridge.
Prefilter A device installed upstream of the main filtration process to remove large solids.
PSI Pounds per square inch. A unit of pressure. 1 PSI = 6.78 kPa.
Return Flow The concentrate which is returned to the head of the process for further processing.
Rewetting The process of refilling the pores of a hydrophobic membrane with liquid.
Sanitizing Agent An agent introduced into a system to kill organisms and prevent the growth of organisms.
Scale The deposits, usually salts, created as a solution increases and exceeds its solubility limit , that builds up on the filter media.
Shell The outer tube encasing the hollow fibers in a module.
Shell Side The part of a CMFsystem which carries feed flow, including module casings, feed manifolds, and feed and recirculation pipework.
Sub Module The replaceable bundle of hollow fiber membranes contained in an M10 class module.
TDS Total Dissolved Solids. May be used as an indication of the level of contamination of water.
TOC Total Organic Carbon. May be used as an indication of the level of contamination of water. Measures the CO2 produced from organics when a water sample is atomized into a combustion chamber.
TMP Transmembrane Pressure. The average pressure across the membrane.

SFWMD/C-E018/WO#7 – Project Cost Estimate Peer Review Microfiltration Supplemental Technology Demonstration Project
Appendix A
Parsons Brinckerhoff Appendix A-15
Turbidity Non-clarity caused by fine suspended particles. Defined by measurement of scattering light through a sample.
Ultrafiltration A pressure-driven membrane process which rejects large molecules in the range of approximately 0.005 to 0.1 microns.
Wetting The process of filling pores of a hydrophobic membrane with water. Typical methods include use of alcohol as a wetting solution, or high pressure to drive air out.