final report rehabilitation of a reinforced concrete ... · pdf filefinal report...
TRANSCRIPT

Final Report
REHABILITATION OF A REINFORCED CONCRETE BRIDGE USING FRP LAMINATES
by
Joseph W. Tedesco J. Michael Stallings
Mahmoud EL-Mihilmy
sponsored by
The Alabama Department of Transportation Montgomery, Alabama
March 1998


ACKNOWLEDGMENT
The material contained herein was obtained or developed in connection with a research project, "Rehabilitation of a Reinforced Concrete Bridge Using FRP Laminates," RP 930-341, conducted by the Highway Research Center at Auburn University. The research project was sponsored by the Alabama Department of Transportation (ALDOT) and the Federal Highway Administration (FHW A). Traffic control, test load vehicles and operators for the field testing were provided by the Alabama Department of Transportation Maintenance Bureau. The support, interest, cooperation, and assistance of many personnel from ALDOT and FHW A is gratefully acknowledged. Much work by graduate students Mahmoud EL-Mihilmy, Michael McCauley, Nathan Porter and Robert Williams is gratefully acknowledged. The authors also wish to acknowledge Mr Jackie White for his valuable assistance during the course of this project, and also Mr. John Brooks of FiberCote, Inc. for supplying the composite materials.
DISCLAIMER
The contents of this report reflect the views of the authors who are responsible for the facts and accuracy of the data presented herein. The contents do not necessarily reflect the official views or policies of the Alabama Department of Transportation or Auburn University. The report does not constitute a standard, specification, or regulation.

SUMMARY
Over fifty percent of all bridges in the United States were built before 1940, and approximately
42% o these bridges are structurally deficient. This alarming statistic underscores the importance of
developing reliable and cost effective repair and strengthening techniques for existing bridge
structures. Rehabilitation needs vary widely, so easily adaptable approaches are desirable. Some
bridges need repair because deterioration has resulted in loss of load capacity. Others exhibit only
minor deterioration, but were designed for loading significantly less than modern traffic loading.
In the past, various methods have been used to strengthen bridges and many other types of
structures. Traditionally structural rehabilitation has been accomplished by methods such as
introducing additional beams to the structure, by strengthening existing beams with mechanically
attached reinforcing plates, or adding externally post-tensioned cables. In recent years, external
bonding of steel plates to the tension face of deficient flexural members has been successfully applied
to many structures. However, the use of steel plates has many disadvantages. Some disadvantages are
corrosion, difficulty in handling the plates, deterioration of bond at the steel-concrete interface, and the
need for massive scaffolding or heavy lifting equipment during installation.
Unidirectional fiber reinforced plastic (FRP) sheets made of carbon (CFRP), glass (GFRP) or
aramid (AFRP) fibers bonded together with a polymer matrix (e.g., epoxy, polyester, vinylester) are
being used as a substitute for steel.. Initial developments in this area took place in Germany and
Switzerland. FRP plates are an attractive solution over steel plates because of their ease in handling
resistance to corrosion, light weight and high strength. Recent experimental studies have shown that
reinforced concrete beams strengthened with externally bonded FRP laminates can exhibit ultimate
load capacities as high as three times their original capacity depending on steel ratio, concrete strength,
FRP ratio, FRP mechanical properties, properties of the bonding agent, and pre-existing level of
ii

damage of the beams.
While laboratory experiments have illustrated the effectiveness of using FRP in repairs, and
some field applications of FRP have been reported, there is a lack of test data illustrating the field
performance of FRP repairs. Field test data that quantitatively illustrate the effects of FRP repairs on
an existing bridge are the focus of this report. The behavior of a bridge is quantified by measurements
of vertical deflections, strains in the primary flexural reinforcement, and strains on the surfaces of the
FRP plates, These data are recorded from static and dynamic tests performed both before and after the
FRP repairs, with loading by two identical test trucks of known weight and configuration. The data
presented in this report are results from a research project conducted for the Alabama Department of
Transportation (ALDOT). The overall project included: field application of FRP plates to an existing
bridge, field load testing, development of a cross sectional procedure including the FRP, and static and
dynamic finite element analyses of the structure. The results from that study are presented and
discussed in the report.
The results of the field study conducted to investigate the effectiveness of externally bonding
FRP laminates to a deteriorated reinforced concrete bridge have established the procedure as a viable
bridge rehabilitation procedure. This conclusive finding is corroborated with results from a
comprehensive finite element method analysis of the bridge, as well as with a detailed analytical
investigation of the repaired structure. The procedure is recommended as a rehabilitation strategy for
similar reinforced concrete bridges exhibiting advanced symptoms of deterioration or distress.
iii

TECHNICAL REPORT STANDARD TITLE PAGE
1. Report No. 2. Government Accession No. 3. Recipient's Catalog No.
4. Title and Subtitle 5. Report Date
Rehabilitation of a Reinforced March 1998
Concrete Bridge Using FRP Laminates 6. Performing Organization Code
7. Author(s) Tedesco, J. W., Stallings, J. 8. Performing Organization Report No.
Michael, EL-Mihilmy, Mahmoud
9. Performing Organization Name and Address 10. Work Unit No. Auburn University Highway Research Center 238 Harbert Engineering Center 11. Contract or Grant No.
Auburn, AL 36849-5337
12. Sponsoring Agency Name and Address 13. Type of Report and Period Covered Alabama Department of Transportation Final Research and Development Bureau 1409 Coliseum Boulevard Montgomery, AL 36130-3050
14. Sponsoring Agency Code
15. Supplementary Notes
16. Abstract Many reinforced concrete bridges throughout the Unites States on county and state highway systems are
deteriorated and/or distressed to such a degree that structural strengthening of the bridge or reducing the allowable truck loading on the bridge by load posting is necessary to extend the service life of the bridge. The structural performance of many of these bridges can be improved through external bonding of fiber reinforced plastic (FRP) laminates or plates. This report describes the rehabilitation of an existing concrete bridge in Alabama through external bonding of FRP plates to the bridge girders. Field load tests were conducted before and after application of the FRP plates, and the response of the bridge to test vehicle loadings was recorded. Results of the field tests are reported, and the effects of the FRP plates on the bridge response are identified. The repaired bridge structure exhibited a decrease in primary reinforcing bar stresses and vertical midspan deflections. These decreases ranged from 4 to 12% for various static and dynamic loading cases. The report also presents the results of a comprehensive finite element method (FEM) analysis conducted on the bridge, as well as the details of a cross sectional analysis procedure developed for FRP strengthened girders.
17. Key Words: Infrastructure, Bridges, Concrete, Tests, Repair, Fiber 18. Distribution Statement Reinforced Plastics, Externally Bonded, Composite Laminates, Finite
No Restriction Element Analysis
19. Security Classif. (of this report) 20. Security Classif. (of this page) 21. No. of Pages 22. Price 130
IV

Form DOT F 1700.7 (8-69) TABLE OF CONTENTS
List of Figures . . . . . . . . . . . . . . . . . . . . . . . . . . . . . . . . . . . . . . . . . . . . . . . . . . . . . . . . . . . . . . . . . . . . . . . . . . . . . vn
List of Tables . . . . . . . . . . . . . . . . . . . . . . . . . . . . . . . . . . . . . . . . . . . . . . . . . . . . . . . . . . . . . . . . . . . . . . . . . . . . . . . xi
CHAPTER ONE: INTRODUCTION . . . . . . . . . . . . . . . . . . . . . . . . . . . . . . . . . . . . . . . . . . . . . . . . . . . . . . . . . . . . 1 BACKGROUND . . . . . . . . . . . . . . . . . . . . . . . . . . . . . . . . . . . . . . . . . . . . . . . . . . . . . . . . . . . . . . 1 FIBER REINFORCED PLASTIC . . . . . . . . . . . . . . . . . . . . . . . . . . . . . . . . . . . . . . . . . . . . . . . . 2 PROJECT OBJECTIVES . . . . . . . . . . . . . . . . . . . . . . . . . . . . . . . . . . . . . . . . . . . . . . . . . . . . . . . 2 LITERATURE REVIEW . . . . . . . . . . . . . . . . . . . . . . . . . . . . . . . . . . . . . . . . . . . . . . . . . . . . . . . 3
CHAPTER TWO: BRIDGE REHABILITATION ................ ~ ................................ 13 DESCRIPTION OF BRIDGE . . . . . . . . . . . . . . . . . . . . . . . . . . . . . . . . . . . . . . . . . . . . . . . . . . . 13 SURFACE PREPARATION OF BRIDGE GIRDERS . . . . . . . . . . . . . . . . . . . . . . . . . . . . . . . 18 SURFACE PREPARATION OF COMPOSITES .. .. . . . . . . . . . . . . . . . . . . . . . . . . . . . . . . . 18 COMPOSITE POSITIONING AND PROPERTIES . . . . . . . . . . . . . . . . . . . . . . . . . . . . . . . . . 18 GENERAL DESCRIPTION OF REHABILITATION PLAN . . . . . . . . . . . . . . . . . . . . . . . . . . 19 INSTALLATION PROCEDURE ................................................ 22
CHAPTER THREE: FIELD LOAD TESTS . . . . . . . . . . . . . . . . . . . . . . . . . . . . . . . . . . . . . . . . . . . . . . . . . . . . . . 25 INSTRUMENTATION PLAN . . . . . . . . . . . . . .. . . . . . . . . . . . .. . . . . . . . . . . . . . . . . . . . . . . 25 DESCRIPTION OF LOAD TESTS . . . . . . . . . . . . . . . . . . . . . . . . . . . . . . . . . . . . . . . . . . . . . . 27
CHAPTER FOUR RESULTS OF LOAD TESTS . . . . . . . . . . . . . . . . . . . . . . . . . . . . . . . . . . . . . . . . . . . . . . . . . 33 INTRODUCTION . . . . . . . . . . . . . . . . . . . . . . . . . . . . . . . . . . . . . . . . . . . . . . . . . . . . . . . . . . . . 33 DATA ACQUISITION AND REDUCTION . . . . . . . . . . . . . . . . . . . . . . . . . . . . . . . . . . . . . . . 33 EFFECT OF FRP ON REBAR STRESSES . . . .. . . . . . . . . .. . .. . . . . . . . .. . . . . . . . . . . . . . 43 EFFECT OF FRP ON GIRDER DEFLECTIONS . . . . . . . .. . . .. . . . . . . . .. . . . . . . . . . . . . . 50 TRANSFER OF STRESSES THROUGH SPLICE PLATES ... .' ...................... 54 CONCLUSIONS . . . . . . . . . . . . . . . . . . . . . . . . . . . . . . . . . . . . . . . . . . . . . . . . . . . . . . . . . . . . . 54
CHAPTER FIVE: ANALYSIS OF BRIDGE . . . . . . . . . . . . . . . . . . . . . . . . . . . . . . . . . . . . . . . . . . . . . . . . . . . . . 57 INTRODUCTION . . . . . . . . . . . . . . . . . . . . . . . . . . . . . . . . . . . . . . . . . . . . . . . . . . . . . . . . . . . . 57 FINITE ELEMENT MODEL . . . . . . . . . . . . . . . . . . . . . . . . . . . . . . . . . . . . . . . . . . . . . . . . . . . 57 FEM ANALYSIS . . . . . . . . . . . . . . . . . . . . . . . . . . . . . . . . . . . . . . . . . . . . . . . . . . . . . . . . . . . . 60
Frequency Analysis . . . . . . . . . . . . . . . . . . . . . . . . . . . . . . . . . . . . . . . . . . . . . . . . . . . . 60 Damping Characteristics . . . . . . . . . . . . . . . . . . . . . . . . . . . . . . . . . . . . . . . . . . . . . . . . 61 Transient Analysis . . . . . . . . . . . . . . . . . . . . . . . . . . . . . . . . . . . . . . . . . . . . . . . . . . . . . 68 Results of Transient Analysis . . . . . . . . . . . . . . . . . . . . . . . . . . . . . . . . . . . . . . . . . . . . 68 Static FEM Analysis Results . . . . . . . . . . . . . . . . . . . . . . . . . . . . . . . . . . . . . . . . . . . . . 73 Parametric Study ............... ·. . . . . . . . . . . . . . . . . . . . . . . . . . . . . . . . . . . . . . . 92
SECTION ANALYSIS ....................................................... 100 Effect of CFRP Cross Sectional Area on Girder Ultimate Strength . . . . . . . . . . . . . . 100 Effect of CFRP Tensile Strength on the Ultimate Strength of Girder. . . . . . . . . . . . . 101 Design Charts . . . . . . . . . . . . . . . . . . . . . . . . . . . . . . . . . . . . . . . . . . . . . . . . . . . . . . . 104
CONCLUSIONS ...................... · ...................................... 106
CHAPTER SIX: BRIDGE INSPECTION AND MONITORING . . . . . . . . . . . . . . . . . . . . . . . . . . . . . . . . . . . . 109 INITIAL CONDITION OF CONCRETE BRIDGE MONITORING . . . . . . . . . . . . . . . . . . . 109
v

CONDITION OF GIRDERS IMMEDIATELY FOLLOWING APPLICATION OF FRP ... 109 RESULTS OF PERIODIC INSPECTIONS . . . . . . . . . . . . . . . . . . . . . . . . . . . . . . . . . . . . . . . 112
CHAPTER SEVEN: CONCLUSIONS AND RECOMMENDATIONS ............................... 117 CONCLUSIONS . . . . . . . . . . . . . . . . . . . . . . . . . . . . . . . . . . . . . . . . . . . . . . . . . . . . . . . . . . . . 117 RECOMMENDATIONS ..................................................... 119
REFERENCES 120
APPENDICES . . . . . . . . . . . . . . . . . . . . . . . . . . . . . . . . . . . . . . . . . . . . . . . . . . . . . . . . . . . . . . . . . . . . . . . . . . . . 122 APPENDIX A: DETAILS OF SECTION ANALYSIS .............................. 122
vi
List of Figures
Figure 2.1. Reinforcement of the Concrete Slab (All Dimensions are mm) . . . . . . . . . . . . . . . . . . . . 14
Figure 2.2. Bridge Cross Section (All Dimensions are mm) . . . . . . . . . . . . . . . . . . . . . . . . . . . . . . . 14
Figure 2.3. Girder Cross Section (All Dimensions are mm) ................................ 15
Figure 2.4. Elevation View of Girder Showing Shear Reinforcement (All Dimension are mm) ................................................ 16
Figure 2.5. Stirrup Spacing and Shear Capacity Along Span . . . . . . . . . . . . . . . . . . . . . . . . . . . . . . . 17
Figure 2.6. Bridge Cross Section Showing Positions of GFRP and CFRP ..................... 20
Figure 2.7. Elevation and Bottom Views of Bridge Girder Showing FRP Positions ............. 21
Figure 3.1. Locations of Strain Gages on Girder Cross Section (All Dimension are mm) ......... 26
Figure 3.2. Strain Gages Attached to Splice Plate of Girder 2 .............................. 26
Figure 3.3. Load Truck Configuration ................................................ 28
Figure 3.4. Load Truck Positions 1 and 2 (All Dimensions are mm) ......................... 29
Figure 3.5. Load Truck Positions 3 and 4 ............................................. 30
Figure 3.6. Load Truck Position 5 .............................. .. .................... 32
Figure 4.1. Static Rebar Stresses - Test Truck Positions 1 and 3 ............................ 47
Figure 4.2. Static Rebar Stresses -Test Truck Positions 2 and 4 ............................ 47
Figure 4.3. Peak Dynamic Rebar Stresses ............................................. 49
Figure 4.4. Static Girder Deflections - Test Truck Positions 1 and 3 .......................... 49
Figure 4.5. Static Girder Deflections -Test Truck Positions 2 and 4 ......................... 53
Figure 4.6. Peak Girder Deflections from Dynamic Tests - Eastbound Trucks ................. 53
Figure 4.7. Splice Plate Strains at East End of Girder 2 ................................... 55
Figure 5 .1. An Isometric View of the Finite Element Model of the Bridge .................... 59
Figure 5 .2. Typical Cross Section of the FEM Model for Repaired Bridge Structure . . . . . . . . . . . . 62
Vll

Figure 5.3. Mode Shape Corresponding to Fundamental Vibration Frequency . ..... . .......... 63
Figure 5.4. Experimental Data Recorded During Dynamic Field Load Test No.3 on Girder B3 Before Rehabilitation ........ . ............ . ... . . : ...... .. ... 65
Figure 5.5. Modal Damping Variation with the Bridge Natural Frequency .... . . . ............. 67
Figure 5.6. Dynamic Loading Configuration Simulating Test Trucks ... ,', ............ . .. ... . 69
Figure 5.7. Time History Used for Truck Loading in the FEM Analysis ..... . . . .............. 70
Figure 5.8. Comparisons of FEM Transient Analysis Results and Recorded Test Data Before Rehabilitation (Test No. 3): (a) Maximum Stresses in Reinforcing Steel Midspan: (b) Maximum Girder Deflections at Midspan ...... . .. . ......... . .. .. 71
Figure 5.9. Comparisons of FEM Transient Analysis Results and Recorded Test Data After Rehabilitation (Test No. 1): (a) Maximum Stresses in Reinforcing , Steel at Midspan: (b) Maximum Girder Deflections at Midspan . . . . . . . . . . . . . . . . . 72
Figure 5.10. Midspan Deflection Time Histories for Girder B 1 Before Rehabilitation (Test No.3) . 74
Figure 5.11. Midspan Deflection Time Histories for Girder B2 Before Rehabilitation (Test No.3) . 75
Figure 5.12. Time Histories for Midspan Reinforcing Steel Stresses for Girder B 1 Before Rehabilitation (Test No.3) .... .. . .. .... .. ... . . .. .... . .. ... .... . ......... 76
·Figure 5 .13. Time Histories for Midspan Reinforcing Steel Stresses for Girder B2 Before Rehabilitation (Test No.3) ....... ... . . ......... . ............ . ... 77
Figure 5 .14. Midspan Deflection Time Histories for Girder B 1 After Rehabilitation (Test No. 1) ... ...... . .... ..... . ... . . . .. ........ ... .... ... .... . ... ..... 78
Figure 5 .15. Midspan Deflection Time History for Girder B2 After Rehabilitation (TestNo.1) . . .. '. ......... . . . .................... . ..... .. ........... .. 79
Figure 5 .16. Time Histories for Midspan Reinforcing Steel Stresses for Girder B 1 after Rehabilitation (Test No. 1) . . . .. . ... .. . .. .. .. . ..... . .. ... ............ 80
Figure 5.17. Time Histories for Midspan Reinforcing Steel Stresses for Girder B2 After Rehabilitation (Test No.1) . ........... .. .......... ... ... . .......... . 81
Figure 5.18. Time Histories For Midspan Stresses in CFRP Plate for Girder B2 After Rehabilitation (Test No. 1) .... .. .... .. ...... . . . ... . ..... . ... . ..... . 82
Figure 5 .19. Maximum Reinforcing Steel Stresses and Girder Deflections at Midspan Before Rehabilitation (Static Load Position 1, Average, East Gage) ......... . .... 83
Vlll

Figure 5.20. Maximum Reinforcing Steel Stresses and Girder Deflections at Midspan Before Rehabilitation (Static Load Position 2) ............................... 84
Figure 5.21. Maximum Reinforcing Steel Stresses and Girder Deflections at Midspan Before Rehabilitation (Static Load Position 3) ............................... 85
Figure 5 .22. Maximum Reinforcing Steel Stresses and Girder Deflections at Midspan Before Rehabilitation (Static Load Position 4) ............................... 86
Figure 5.23. Maximum Reinforcing Steel Stresses and Girder Deflections at Midspan After Rehabilitation (Static Load Position 1) (Avg. East Gage) .................. 87
Figure 5.24. Maximum Reinforcing Steel Stresses and Girder Deflections at Midspan After Rehabilitation (Static Load Position 2) . . . . . . . . . . . . . . . . . . . . . . . . . . . . . . . . 88
Figure 5 .25. Maximum Reinforcing Steel Stresses and Girder Deflections at Midspan After Rehabilitation (Static Load Position 3) ................................ 89
Figure 5.26. Maximum Reinforcing Steel Stresses and Girder Deflections at Midspan After Rehabilitation (Static Load Position 4) ................................ 90
Figure 5.27. Maximum CFRP Stresses at Midspan for Each Beam (Load Position 2) .... · ....... 91
Figure 5.28. Maximum CFRP Stresses at Midspan for Each Beam (Load Position 3) ........... 91
Figure 5.29. Midspan Deflection Time Histories for Girder B3 for Different CFRP Cross Sectional Areas ................ · . . . . . . . . . . . . . . . . . . . . . . . . . . . . . . . . . . 94
Figure 5.30. Midspan Deflection Time Histories for Girder B3 with Different CFRP Modulii of Elasticity ................................ · ................... 95
Figure 5 .31. Effect of the CFRP Cross Sectional Area on Reduction of Maximum Girder Deflection and Maximum Stress Reinforcing Steel (Girder B3) .................. 96
Figure 5.32. Effect of the CFRP Modulus of Elasticity on Reduction of Maximum Girder Deflection and Maximum Stress in Reinforcing Steel (Girder B3) .......... 97
Figure 5 .33. Effect of Varying CFRP Cross Sectional Area on the Average Change in Static Girder Deflections and Reinforcing Steel Stresses at Midspan ............ 98
Figure 5.34. Effect of Varying the CFRP Modulus of Elasticity on the Average Change in Static Girder Deflections and Reinforcing Steel Stresses at Midspan . . . . . . . . . . . . 99
Figure 5.35. Modified Hognestad Concrete Stress-Strain Curve used in the Sectional Analysis Computer Program ............................................ 102
ix
Figure 5.36. Effect of CFRP Cross Sectional Area and Elastic Modulus on Enhancement Percentage of Girder Ultimate Capacity . . . . . . . . . . . . . . . . . . . . . . . . . . . . . . . . . . . 103
Figure 5.37. Typical Design Chart for Girders Strengthened with CFRP .................... 108
Figure 6 .1. Sketch of Crack Pattern in Typical Girder Prior to FRP Application . . . . . . . . . . . . . . . 110
Figure 6.2. Typical Crack Patterns in Concrete Girders Prior to FRP Application .............. 111
Figure 6.3. Voids Under GFRP at East End of Girder 2 - North Face ....................... 113
Figure 6.4. Voids Under GFRP at East End of Girder 2 - South Face ....................... 113
Figure 6.5. Voids Under GFRP at West End of Girder 4 - North Face ...................... 114
Figure 6.6. Voids Under GFRP at West End of Girder 4 - South Face ...................... 114
Figure 6.7. Voids Under CFRP at West End of Girder 1 ................................. 115
Figure 6.8. Voids Under CFRP at West End of Girder 2 ................................. 115
Figure 6.9. Voids Under CFRP at East End of Girder 4 .................................. 116
Figure 6.10. Largest Void Found Under CFRP ........................................ 116
Figure A.l. Neutral Axis Position for T-Sections ..................................... 123
Figure A.2. Design Chart for RC Sections with FRP ................................... 130
x

List of Tables
Table 4.1. Rebar Strains from Static Tests - Before FRP Application .. . . . ................. 34
Table 4.2. Rebar Strains from Static Tests - After FRP Application .................... .. . 35
Table 4.3. Girder Deflections from Static Tests - Before FRP Application . ....... .. . .. . . . . . 36
Table 4.4. Girder Deflections from Static Tests - After FRP Application . . ............... . . 37
Table 4.5. CFRP Strains from Static Tests . . .... . .... .... ......... .. .......... .. ... . 39
Table 4.6. Strains Measured on CFRP Splice Plate (microstrain) . . . . . . . . . . . . . . . . . . . . . . . . 40.
Table 4.7. Peak Rebar Strains from Dynamic Tests - Before FRP Application ........... . .. . 41
Table 4.8. Peak Rebar Strains from Dynamic Tests - After FRP Application . ............. . . 41
Table 4.9. Peak Girder Deflections from Dynamic Tests - Before FRP Application . ... .. .. ... 42
Table 4.10. Peak Girder Deflections from Dynamic Tests - After FRP Application ....... . .. . . 42
Table 4.11. Rebar Stresses from Static Tests - Before FRP Application .... . . . ......... . . . . . 44
Table 4.12. Rebar Stresses from Static Tests - After FRP Application . ..... . .. . . . .. .. .... . . 45
Table 4.13. Comparison of Rebar Stresses from Static Tests ........... ... .......... . .... 46
Table 4.14. Peak Rebar Stresses from Dynamic Tests - Before FRP Application ....... . . . .... 48
Table 4.15. Peak Rebar Stresses from Dynamic Tests - After FRP Application .. .... . ... .. . .. 48
Table 4.16. Percent Differences in Peak Dynamic Stresses (Mpa) for Test Trucks Traveling Eastbound . . . . . . . . . . . . . . . . . . . . . . . . . . . . . . . . . . . . . . . . . 48
Table 4.17. Comparison of Strains Measured on CFRP and on Rebar ... . . .... .. . . .. .. .. .. . 51
Table 4.18. Comparison of Girder Deflections from Static Tests .... .. .. . . . . .. .... . . . . .. .. 52
Table 4: 19. Comparison of Peak Girder Deflections from Dynamic Tests . ..... . . ... .. . . .. .. 52
Table 5.1. Natural Circular Frequency, Natural Frequency and Natural Period for the First Twenty Modes Extracted from the FEM Frequency Analysis . . . . . . . . . . . . . . . 64
Table 5.2. Comparison Between Maximum Midspan Stresses (Mpa) in CFRP Obtained from Recorded Test Data and the FEM Analysis ... . . ... ......... .. . . 92
xi

Table 5.3. Effect pf CFRP Cross Sectional Area on Ultimate Flexural Strength of Girder ..... 105
Table 5.4. Effect of CFRP Tensile Strength on Ultimate Strength Flexural Strength of Girder . .. . ...... . .... .. .. . ....... .. ............ . . . . .. ..... . . . . . . . 105
Table A. l. Values of ex, k2 for Concrete Compressive Strength of 27 Mpa . . . . . . . . . . . . . . . . . 125
Table A.2. Calculation of exec for Example Problem ...... . ... . .... . ... . ....... .. ... . . 128
xii

BACKGROUND
CHAPTER ONE INTRODUCTION
A significant percentage of the bridges in North America were built after the Second World
War. Most of them were originally designed for smaller vehicles, lighter loads and a lower traffic
volume than commonly experienced today. Over fifty percent of all bridges in the United States were
built before 1940, and approximately 42% of these bridges are considered to be structurally deficient
(Klaiber et. al., 1987). This alarming statistic underscores the importance of developing reliable and
cost effective repair and strengthening techniques for existing bridge structures.
In the past, various methods have been used to strengthen bridges and other types of structures.
Traditionally, structural rehabilitation was accomplished by introducing additional beams to the
structures or by strengthening existing beams with externally post-tensioned cables. In recent years,
external bonding of steel plates to the tension face of the deficient member has been successfully
applied in many structures. However, the use of steel plates has many disadvantages, such as
corrosion, difficulty in handling the plates, deterioration of bond at the steel-concrete interface and the
requirement of massive scaffolding during construction.
Fiber reinforced plastic (FRP) laminates, or plates, provide an attractive alternative to steel
plates because of their ease in handling, resistance to corrosion, light weight and high strength.
Experimental studies (Saadatmanesh and Ehsani 1991; Meier and Kaiser 1991; Ross et. al. 1994)
conducted on both virgin and damaged beams strengthened with externally bonded FRP plates showed
this technique to be very effective. The increase in strength exhibited by beams strengthened with FRP
plates can be as high as three times their original capacity depending on the steel ratio, concrete
strength, FRP ratio, FRP mechanical properties, properties of the bonding agent and the pre-existing
level of damage to the beams.
1

FIBER REINFORCED PLASTIC
Fiber reinforced plastic (FRP) composites are typically made of carbon, · aramid or glass fibers
bonded together with a polymer matrix (e.g. epoxy, polyester, vinylester). Carbon fiber composites
have been widely used for most reinforced concrete repair applications because of their high strength.
FRP comes in variety of shapes and fiber orinations such as fabric, prepreg, and laminates.
In brief, FRP consists of two or more different materials combined to produce a new material
that possesses mechanical characteristics superior to those of the individual components. FRP is thus a
combination of high strength fibers (glass, carbon or aramid) in a polymer matrix. The matrix contains
and protects the fibers, and permits stress transfor to the fibers through shear.
PROJECT OBJECTIVES
The overall goal of this project is to develop a procedure to rehabilitate deteriorated reinforced
concrete bridge girders by external bonding of FRP laminates. To achieve this goal, an existing
deteriorated bridge structure was retrofitted with FRP laminates. The improved structural performance
of the rehabilitated structure was evaluated from load tests, field monitoring and inspection and
numerical analyses. The bridge rehabilitation procedure is described in Chapter Two; the bridge
instrumentation plan and field load tests are discussed in Chapter Three; the results of the field load
tests are presented in Chapter Four; and the numerical analyses are discussed in Chapter Five.
The candidate bridge is located on state highway 110 near Union Springs. The structure
consists of 13 simple spans of 10.36 m lengths. Each span is comprised of four reinforced concrete T
beams, nearly all of which are exhibiting significant flexural cracking due to routine truck traffic over
a 40 year period.
One span from this bridge was repaired with the external bonding of FRP laminates. The
laminates were applied to the bottom and sides of the stems of three of four T-beams within the span;
the remaining beam was retrofitted with FRP laminates on the bottom of the stem only. All beams
2

were appropriately instrumented to collect the pertinent data from the load tests. The bridge was
inspected frequently throughout the duration of the project to assess the performance of the
rehabilitation procedure. The bridge inspection program is described in Chapter Six.
LITERATURE REVIEW
P.A. Ritchie (1988) upgraded fourteen reinforced concrete beams using steel plates as well as,
glass and carbon FRP laminates. He reported increases in beam stiffnesses ranged from 18 to 116
percent, and the increases in the ultimate flexural capacity ranged from 47 to 97 percent. The beams
with externally bonded plates also exhibited another desirable trait, namely, the cracking patterns
changed from several widely spaced cracks with relatively large widths, to many more closely spaced
cracks with much narrower widths. Analytically predicted load-deflection responses exhibited fairly
good correlation with the experimental data, although the theoretical curves were stiffer. The author
indicated that failure did not occur by flexure in the maximum moment region on many beams, but
rather by debonding at the plate ends, despite attempts at providing plate end anchorages to postpone
interface failure. Based on the experimental evidence, externally bonded FRP plates proved to be a
feasible method of upgrading the strength and stiffness characteristics of reinforced concrete beams.
Additional studies to investigate stress concentrations near the plate ends to prevent premature failure
were also recommended.
H. Saadatmanesh and M. R. Ehsani (1990) tested five reinforced concrete beams, four of them
strengthened with epoxy bonded GFRP plates, and the fifth served as a control specimen. The four
strengthened beams had the same steel reinforcement ratio and GFRP plate area, however, a different
epoxy was used on each beam. The selected epoxies had a wide range of strengths and ductilities.
The most ductile epoxy did not enhance the ultimate capacity of the beam because it was too flexible
to allow any shear transfer between the concrete and the GFRP plate. On the other hand, the most
rigid adhesive experienced a premature failure of the beam with no increase in the peak load compared
3

to that of the control beam. The remaining two epoxies used in the study did increase the ultimate
flexural capacity of the beams by 30 and 110 percent, respectively. It was concluded that an effective
adhesive must posses both sufficient stiffness and shear strength to successfully transfer the load from
the concrete to the GFRP plates.
U. Meier and H. Kaiser (1991) tested twenty-six rectangular reinforced concrete beams having
a 2 meter span, and one beam having a span of 7 meters. The 2 meter span beams were strengthened
with 0.3 mm thick CFRP sheets bonded to the beam bottoms. Strengthening with this very thin plate
nearly doubled the ultimate flexural capacity of the beams. However, the steel reinforcement in the
beams was intentionally under dimensioned. In the case of the seven meter span beam which was
reinforced with a 1.0 mm thick CFRP laminate, the reported increase in ultimate flexural capacity was
only 22 percent, and a sudden laminate peel-off due to the development of shear cracks in the concrete
was also noticed. The influence of bonded CFRP laminates on reducing the number and width of
flexural cracks was also studied. Despite the higher ultimate flexural capacity exhibited by the CFRP
retrofitted beam, the total width of all cracks was 40 percent less than that experienced by the control
beam. Finally, the authors concluded that the ultimate flexural capacity of reinforced concrete beams
strengthened with FRP plates could be calculated analytically by a procedure completely analogous to
that employed for conventionally reinforced concrete beams.
H. Saadatmanesh and M. R. Ehsani (1991) tested five rectangular concrete beams and one T
beam, strengthened with GFRP plates, under four point loading. The results of the rectangular beam
tests indicated that the ultimate flexural strength of reinforced concrete beams can be significantly
increased by gluing GFRP plates to the tension face. However, beams having no conventional steel
reinforcement failed at a very low load due to premature debonding of the FRP plate. Thus, it was
concluded that a minimum amount of steel reinforcement was necessary to limit the width of the
flexural cracks to prevent debonding of the composite. Results of the T-beam test indicated that
4

bonding of the GFRP plate doubled the flexural capacity of the beam. It was also cited that beams
strengthened with FRP plates experienced less flexural cracking, reduced crack widths and a delay in
the formation of the flexural cracks. However, bonding of the FRP plates reduced the ductility of the
beam compared to that exhibited by the conventionally reinforced beam.
W. An, et. al. (1992) developed analytical models based on compatibility of deformations and
equilibrium of forces for predicting the load-deflection response for reinforced concrete beams
strengthened with FRP plates. Models were derived for both rectangular and T-sections. Using these
models, a parametric study was conducted to investigate the effects of several design variables such as
FRP plate area, plate modulus, plate tensile strength, concrete compressive strength and steel
reinforcement ratio. It was concluded from the results of the study that bonding the FRP plate to the
concrete beam increases the stiffness, the yield moment and the ultimate flexural capacity of the beam,
particularly for beams having low steel reinforcement ratios. Increasing the concrete compressive
strength for beams strengthened with FRP plates resulted in a further increase in the ultimate flexural
strength of the section. Although the calculated curvature at the ultimate load decreased as the FRP
plate area increased, the area under the moment curvature diagram did not decrease significantly.
B. M. Ghaleb (1992) investigated the use of externally bonded fiber glass plates to increase
both the flexural and shear capacity of damaged reinforced concrete beams. His work was divided into
four segments. The first segment focused on the selection of the fiber glass material. The second
segment addressed the effect of thermal cycling on the bond strength between the FRP and the epoxy
glue. The third segment evaluated the performance of damaged beams repaired with FRP plates. The
ultimate flexural capacity of the repaired beams were found to have been increased by approximately
60 percent. The fourth segment of the study considered the performance of reinforced concrete beams
strengthened for shear. Three repair techniques for shear damaged beams were investigated: FRP side
plates, FRP side strips and FRP U-jackets. Shear damaged beams repaired by FRP side strips and FRP
5

side plates enhanced the shear capacity by 26 and 32 percent, respectively. Beams repaired with FRP
U-jackets attained the ultimate flexural capacity without experiencing a shear failure. Thus, it was
concluded that the FRP U-jackets was the most effective technique for repairing shear damaged beams.
U. Meier et. al. (1992) extended the concept of strengthening laboratory test beams to girders
in existing bridge structures. The Ibach Bridge and the historic wooden bridge in Switzerland were
strengthened by external bonding of CFRP plates. The damaged concrete girder in the Ibach Bridge,
having a span of 39 meters, was repaired with CFRP laminates. A 6.2 kg CFRP plate was used in the
repair in lieu of a 175 kg steel plate. In the second case, the historic wooden bridge was severely
deteriorated and a load limit was posted. Two of the most highly loaded cross beams were
strengthened using carbon fiber reinforced epoxy resin sheets. Even though the strengthened beams
were subjected to extremely high loads, no further signs of deterioration were reported.
S. Raghavachary (1992) conducted a laboratory testing program in which he studied the effect
of plate thickness on the ultimate flexural strength of reinforced concrete beams having externally
bonded CFRP plates. All beams tested experienced failure by concrete crushing, but exhibited a
significant increase in ultimate load capacity. Beams strengthened with three plies of CFRP displayed
considerable ductility, exhibiting an almost constant load capacity prior to failure. The ultimate
flexural capacity of the beams increased with increasing the number of plies, but not at a proportional
rate. The average percentage of increase in stiffness for the FRP plated beams over the control beams
was 20%, 47%, and 64% for one, two and three plies respectively. A substantial reduction in the
widths of flexural cracks with increasing number of plies was also noticed. Cracks exhibited by the
FRP plated beams were more closely spaced and had narrower widths than those experienced by the
control beams.
F. Rostasy et. al. (1992) reported the rehabilitation of the Kattenbusch Bridge in Germany with
externally bonded GFRP plates. The Kattenbusch Bridge is a continuous eleven span, post-tensioned
6
concrete bridge. Because the bottom flanges of the box girders were lightly reinforced, wide thermally
induced cracks developed at bottom flange-web junctures of the girders. Field test data recorded for
the bridge, both before and after strengthening, indicated a reduction in the reinforcing steel stresses at
the service load stage had been achieved.
T. C. Triantafillou and N. Plevris (1992) studied the behavior of reinforced concrete beams
strengthened with FRP plates and the associated modes of failure. The authors derived equations
describing each failure mechanism using the strain compatibility method, the concept of fracture
mechanics and a simple model representing the FRP peel-off debonding mechanism. Seven beams
strengthened with FRP plates were tested under four point loading. The experimental results showed
that the ultimate flexural capacities of the FRP strengthened beams were superior to that of the control
beam. Five of the repaired beams failed due to debonding and subsequent peeling off of the
composite. They concluded that the FRP peel-off failure mechanism establishes an upper limit to the
composite plate thickness. Beams fitted with FRP plates of greater thickness will exhibit a peel-off
failure before achieving the theoretical ultimate flexural capacity.
Y. N. Ziraba (1993) developed a non-linear finite element method (FEM) computer program to
analyze reinforced concrete beams strengthened with externally bonded steel and GFRP plates. The
author indicated that increasing the plate thickness led to an increase in ultimate flexural capacity,
however this strength enhancement was limited by the condition of the beam-plate interface failure.
Therefore, it was suggested that a limit should be established for the thickness of the bonded plate in
order to prevent premature interface failure. A series of FEM analyses were conducted on a half beam
specimen which indicated that the interface failure was a surface phenomenon. Based on the results of
the numerical analyses and the available experimental work in the literature, the author suggested that
a Moher-Coulomb failure criterion with a tension cut-off should be the material characterization of the
steel/glue/concrete interface. Increasing plate curtailment length led to a significant magnification of
7

the interface stresses. Using a more flexible glue and tapered plates decreased both peeling and shear
stresses at the plate ends. Furthermore, for optimal results, the author recommended using thinner
plates which are as wide as possible. Roberts' formula (Roberts 1989) for predicting interface stresses
was found to be conservative for very thin plates, but underestimates the interface stresses of thicker
plates. Newly derived expressions for peak interface shear and peeling stresses were presented for use
as design aids. The author also noted that the ACI procedure for shear design for conventionally steel
reinforced beams cannot be used for beams with bonded FRP plates because the horizontal cracking
which developed near the plate ends did not intersect the stirrups. Based on the experimental evidence
of failed beams, the author proposed an alternative expression to evaluate the efficiency of the stirrups
in beams strengthened with externally bonded plates.
M. J. Chajes et. al. (1994) performed a series of laboratory tests on reinforced concrete beams
with bonded composite fabrics to evaluate the improvement to the ultimate flexural capacity. The
fabrics used were made of aramid, E-glass and graphite fibers. Originally, all beams were bonded for
flexural considerations without shear strengthening. End tabs were later employed to prevent fabric
debonding which occurred in the first series of tests. Beams strengthened with aramid failed due to
concrete crushing, while those strengthened with E-glass and graphite fibers failed due to rupture of
the composite. These different modes of failure were attributed to the variation in the fabric ultimate
strain. The ultimate strain for the aramid fabric was twice that of E-glass and three times that of the
graphite. Increases in the ultimate flexural capacity ranged from 36 to 57 percent with corresponding
increases in flexural stiffness of 45 to 53 percent. This increase in strength was accompanied by a
decrease in ductility. The reported ductility index for beams strengthened with composite was in the
vicinity of two or three, while beams without the composite fabric exhibited a ductility index in the
range of four to five. The authors developed an analytical model based on the stress-strain
relationships of the materials used to predict the load-deflection behavior of the strengthened beams.
8

A comparison between the experimental results and the analytical model indicated that the behavior of
the beams with bonded FRP fabric could be accurately predicted using the developed analytical model.
P: J. Heffernan (1994) conducted a series of laboratory tests to investigate the fatigue behavior
of damaged beams post-strengthened with CFRP laminates. The results of seven (3 static plus 4
cyclic) 2.0 m span simple beams and four (2 static plus 2 cyclic) 5.0 m simple span beams were
reported. The efficiency of the CFRP reinforcement as compared to an equivalent area of additional
conventional steel reinforcing was greater than the modular ratio of the materials, and was dependent
upon the relative distance of the additional reinforcements from the neutral axis. For beams subject to
static loading, a design procedure based on strain compatibility was found to be reliable. The fatigue
life of beams subjected to cyclic loading with a stress range greater than the tensile strength of the
reinforcing steel, was governed by the reinforcing steel. Unlike the monotonic loading cases, the 2.0 m
beams in the fatigue tests experienced shear cracks after 100,000 cycles. These cracks propagated
horizontally, at the reinforcing steel level, toward midspan and eventually precipitated failure of the
beam. The author attributed this type of failure to insufficient development length for the CFRP plate.
The mode of failure for both monotonic and cyclic loading of the 5.0 m beams was a sudden rupture of
the CFRP plate near midspan. The fatigue life of the CFRP strengthened beams appears to be at least
equal to that of the conventionally reinforced concrete beam of the same strength. No slippage
between the CFRP and the concrete beam as result of cyclic loading was observed. Finally, the effect
of beam scale was examined and appeared to be negligible.
N. Plevris and T. Triantafillou (1994) studied the time dependent behavior (due to sustained
loading) of reinforced concrete beams strengthened with FRP laminates. An analytical procedure was
presented for the deformation of the cross section based on an age-adjusted effective modulus method
for the concrete. The analytical model was used to predict the long term deflections of reinforced
concrete beams with bonded FRP plates. The authors concluded that bonding the FRP plates to the
9

concrete beams played a favorable role in mitigating the long term deflection response. Increasing the
FRP plate area decreased the creep strains.
R. Qu (1994) performed analytical studies on reinforced concrete beams strengthened with
CFRP laminates using the finite element method (FEM). A reasonably accurate load-deflection
response was predicted based on the proposed modeling of the material stress-strain relations, failure
criterion and concrete properties. The confinement effect of the CFRP plates was implemented by
setting the concrete modulus of elasticity after cracking (Ee) to 1/20 Ee. Both theoretical and
experimental results confirmed the use of a higher value of Ee for FRP strengthened beams than that
for the control beam. The ultimate flexural strength and stiffness of the beams with bonded CFRP
laminates was found to be significantly higher than that of the control beam.
C. A. Ross et. al (1994) tested 24 reinforced concrete beams strengthened with CFRP plates
externally bonded to the tension face. All beams had the same CFRP cross-sectional area, but had
several different reinforcing steel ratios. Considerable enhancement was achieved by bonding of the
CFRP laminates to the beams having the lower reinforcing steel ratios. However, the addition of
CFRP to the beams having the higher reinforcing steel ratios resulted in significantly less strength
enhancement. The peak load for the FRP strengthened beams having the lowest reinforcing steel ratio
was as high as three times that of the control beam. It was also observed that retrofitted beams with
the lower reinforcing steel ratios failed by delamination of the composite, while the retrofitted beams
with the higher reinforcing steel ratios failed by concrete crushing accompanied by horizontal cracking
in the vicinity of the tension steel reinforcement. The authors reported that at the load corresponding
to yielding of the tensile steel, approximately seventy five percent of the beam stiffness was attributed
to the CFRP plates. Thus the authors concluded that a high CFRP modulus was more important than a
high tensile strength in increasing flexural stiffness. Based on the experimental observation that the
load-deflection curve is multi-linear, an analytical model was developed to predict the load- deflection
10

response of CFRP strength enhanced beams at several different load stages. Excellent agreement
between the analytical model and experimental results was cited. A nonlinear FEM analysis was also
conducted to study the behavior of CFRP strengthened beams during various stages of loading. The
results of the FEM analysis correlated very well with the test data and the analytical model.
A. Kobayashi,.et. al. (1995) used CFRP sheets to upgrade an existing reinforced concrete
bridge in Japan. The bridge had been in service since 1977. Many flexural cracks were observed on
the undersides of the concrete deck slabs, thus necessitating their repair and strengthening. The deck
slabs were originally designed for a maximum vehicle load of 20 tons, however, an evaluation of the
reinforcing steel stresses for a 25 ton vehicle (upgraded capacity) indicated that the allowable design
stress was exceeded. The bridge was repaired with one ply of CFRP sheets bonded to the bottoms of
the deck slabs spanning in the longitudinal direction, and with an additional one ply sheet spanning in
the transverse direction of the deck slabs. The total applied cross-sectional area of the composite for
the entire bridge was 164 m2·, and the entire repair work was completed in two weeks. After all
repairs were completed, reinforcing steel strains and deck-slab displacements at midspan were
recorded for a 25 ton test truck traveling across the bridge. The comparison of the recorded test data
both before and after the bridge repair indicated that the primary reinforcing steel stresses were
reduced by 30 to 40 percent and the secondary reinforcing steel stresses were reduced by 20 to 40
percent. The midspan deflections of the deck slabs were decreased by 15 to 20 percent.
M. J. Chajes et. al. (1995) tested twelve reinforced concrete T-beams to study the effect of
using externally applied composite fabric as a method of increasing beam shear capacity. Three
different types of composite were used in the study so that the effects of the fabric modulus of
elasticity and tensile strength could be examined. The selection of the adhesive was based on the
results of pull-off tests using 25 mm wide fabric strips bonded to a concrete specimen. Test results for
eight beams strengthened for shear were compared with the corresponding results for the four control
11

beams. Debonding of the fabric from the concrete did not occur in any of the tests. The behavior of
the strengthened beams was similar to that exhibited by the control beams both before and after
cracking. Before cracking in the beam occurred, recorded strains in the fabric were very low.
However, after cracking, the fabric strains increased significantly until failure occurred. The test
results indicated that externally bonded composite fabric increased the ultimate shear strength by 60 to
150 percent. An analytical method was presented for predicting the ultimate shear capacity of beams
strengthened with bonded composite.
A. Nanni (1995) reported several examples of bridges in Japan strengthened with FRP. The
Hata Bridge was strengthened to accommodate additional loads caused by the construction of larger
windbreak walls. The strengthening project began in the spring of 1994 with the erection of a
suspended light scaffolding to facilitate application of the composite. Approximately 100 m2 of CFRP
was used in the project. The effectiveness of the strengthening method was examined by conducting
an on site load test which indicated a considerable reduction in reinforcing steel strains. In another
project, the Hiyoshikura Bridge was strengthened to increase the load rating of the structure. The
soffit of the deck slab suffered from extensive flexural cracking. The cracks were sealed and
approximately 164 m2 of two ply CFRP was applied to the underside of the deck slab. Upon the
completion of the repair work, moving vehicle load tests were conducted. The results of these tests
indicated that a 30 to 40 percent reduction in reinforcing steel stresses was achieved ..
12

DESCRIPTION OF BRIDGE
CHAPTER TWO BRIDGE REHABILITATION
The bridge selected for rehabilitation was built in 1952 and is located on Alabama Highway
110. It has a 7.32 m wide roadway with a 457 mm safety curb, and consists of seven 10.36 m simple
spans with an East-West orientation. It was designed in accordance with specifications of the Alabama
State Highway Department for an AASHTO H15-44 design load. The primary construction materials
are Class "A" bridge concrete and structural carbon steel. All steel reinforcement has deformations in
accordance with ASTM-A-305-49 and is intermediate grade new billet or rail steel, as permitted in the
specifications.
The bridge deck consists of a 152 mm thick slab with shrinkage and temperature reinforcement
of #4 bars spaced at 330 mm on center, as show in Figure 2.1. Transverse reinforcement is provided
by #4 bars spaced at 279 mm on center.
Four standard reinforced concrete girders support the deck. Figure 2.2 shows a cross sectional
view of the structure. The girders are spaced transversely at 1700 mm clear spacing. Tensile
reinforcement for each girder consists of two layers of #11 rebar spaced as shown in Figure 2.3. Shear
reinforcement consists of #4 double leg stirrups spaced as shown in Figure 2.4. The bridge girders are
subjected to a maximum dead load moment of 172 kN-m, which corresponds to a dead load stress of
58.12 Mpa in the reinforcement at midspan. The factored load moment capacity was calculated to be
380 kN-m. A plot of the girder's factored load shear capacity along the length of the span is given in
Figure 2.5
The bridge rehabilitation procedure was implemented in 4 basic steps: surface preparation
composite positioning and installation, epoxy preparation, and pressure application. Each of these
steps is described in this chapter. The composites were installed in October of 1995.
13

L-330-..i..l.-----1702----·"'-'·33o-J
Figure 2. 1 Reinforcement of the Concrete Slab (All Dimensions are mm)
Figure 2.2. Bridge Cross Section (All Dimensions are mm)
14

" Rebar
6 7 0 ,, stirrup
111 Rebar
t 70 95 95 70
89
76 51
Figure 2.3. Girder Cross Section (All Dimensions are mm)
15
511

13:--.i~---
89
- ... f--....... 111---140
8@ 152
#4 stirrups
#11 Rebar
12 @ 305 I
76
iillt' , ...
152
Figure 2.4. Elevation View of Girder Showing Shear Reinforcement (All Dimensions are mm)
16
76
556

Shear Capacity
~
I
......... r...
t-.."' r-. I'
- "'i-... .............
I .14 m . 1.. ...I ..
1.22 m
r--.... \. \
"' '\ \
"''' I\.\
~,,,._ f11 Rebar
3.66 m
184 kN--.. ....................... __. ......... ~
125 kN
1.36 m Distance Along Span
Figure 2.5. Stirrup Spacing and Shear Capacity Along Span
17
.15 m
5.17 m

SURFACE PREPARATION OF BRIDGE GIRDERS
To insure the integrity of the bond of the FRP laminates, with the surface of concrete,
preparation of the concrete surface was required. First, the bonding surface was smoothed so that the
composite would be in full contact with the girder surface. This leveling process was accomplished
with a hand held grinder. Areas of extreme roughness on the concrete surf ace were ground down until
relatively flat. Surface flatness was ascertained by placing a yardstick along the girder surface and
observing the completeness of contact between the two.
To provide a suitable bonding surface to accommodate the adhesive used to attach the
composites, the concrete girders were abraded by sandblasting the girders until the coarse aggregate
became visible. The girders were then pressure washed with a solution of mild detergent and hot water
to remove the excess dust, grease and other substances that might adversely affect the bond between
the girder and the composite.
SURFACE PREPARATION OF COMPOSITES
The smooth surfaces of the composites were scuffed using a 100 grit sanding disc on a hand
held rotary sander: The composite plates were laid flat on a table with the girder contact surface facing
upward. The surfaces were sanded using a back and forth motion across the width of the composite,
along the entire length of the plate. For the plates that were to be spliced together, the outside surface
of the last 0.6 m of the ends to which the splice plates were to be attached were also prepared in the
same manner. The surfaces were then cleaned with methyl-ethyl-ketone (MEK) to remove excess
dust.
COMPOSITE POSITIONING AND PROPERTIES
To facilitate bonding the composites to the girders, each bridge girder was divided into three
sections: west, middle and east. Each girder section length matched the length of the composite plate
to be attached to that face. A girder section consisted of three surfaces: the north face, south face, and
18

bottom face. The position of each composite plate was then outlined on the girders. Figures 2.6 and
2. 7 illustrate the positions of the FRP plates. Each glass fiber reinforced plastic (GFRP) plate was 356
mm wide, and was positioned so that its bottom edge was 51 mm from the bottom edges of the north
and south face of each girder. The carbon fiber reinforced plastic (CFRP) plates were 267 mm wide
and were centered on the bottom face of each girder. The splice plates for both the GFRP and CFRP
full length plates, were also 356 mm wide and 267 mm wide, respectively, and were 914 mm long.
The splice plates were centered lengthwise over the joint between the two full length plates being
spliced.
The GFRP plates had overall dimensions of 3.28 m x 356 mm x 1 mm. The unidirectional
fibers were oriented parallel to the longitudinal axis of the plate. The GFRP plates had a tensile
strength and modulus of elasticity of 448 MPa and 23,720 Mpa, respectively. The CFRP plates had
overall dimensions of 3.09 m x 267 mm x 1.3 mm. The unidirectional fibers were oriented parallel to
the longitudinal axis of the plate. The CFRP plates had a tensile strength and modulus of elasticity of
1,194 Mpa and 121,420 Mpa, respectively.
GENERAL DESCRIPTION OF REHABILITATION PLAN
The FRP plates were applied to two girders simultaneously, one section at a time, to all three
surfaces of each section, with the exception of girder 1 (the northernmost girder). Girder 1 had only
the CFRP plates applied to the bottom surface, and served as a standard of comparison to investigate
the effects of the GFRP plates bonded to the sides of the other girders. The bridge traffic was
restricted during application of the FRP plates, and for a minimum of 6 hours after application until the
adhesive bond was set. A uniform pressure of at least 0.034 Mpa was applied over the entire surface
of the composite plates for the 6 hours required for curing the adhesive. This pressurization was
implemented through a vacuum bag covering all three surfaces of the girder section. The vacuum bag
was connected by a hose to a vacuum pump powered by an electric generator. The vacuum pump had
19

N-
Figure 2. 6. Bridge Cross Section Showing Positions of GFRP and CFRP
20

ELEVATION VIEW
l""·-----------10.36 m-----------·1 260 mml 3.28 m-----3.28 m--· 1
r '457,mm
51 mm _J L-914 mm
BO'ITOM VIEW
---3.09 m-----3.09 m-----3.09 m--·1
_J L-914 mm
Figure 2. 7. Elevation and Bottom Views of Bridge Girder Showing FRP Positions
21

sufficient capacity to provide the required vacuum for two girder section bags simultaneously.
Therefore, the composite plates were applied to one section of two adjacent girders at the same time.
A more detailed description of the installation procedure is provided in the next section.
The FRP plates were bonded to the concrete with Dexter-Hysol EA9460 structural adhesive, a
two component epoxy that combines high strength with low visctosity, thus enhancing its
conduciveness to mixing. The adhesive has a tensile lap shear strength of 24.13 Mpa at 25 ° C and a
peel strength of 5 .3 N per linear millimeter. The epoxy has a mix ratio of 1: 1 by volume and a pot life
of 55 minutes, allowing ample time for application. For this project, two liters of epoxy (one liter of
each component) were mixed for each girder section (three full length pieces of FRP per section).
INSTALLATION PROCEDURE
The first step in the FRP installation procedure was to de-grease the surf ace of both the
concrete and the composite plates with MEK. The MEK was applied to the girder surfaces with a
spray applicator. Cloth rags soaked with MEK were used to clean surfaces of the composite plates.
The composite plates were kept out of direct sunlight in order to maintain them at the ambient
temperature underneath the bridge.
The vacuum bag was then prepared. The first step in this preparation was to mark the surface
of the concrete girders with the position of the outside edges of the bag. A sheet of 6 mil thick plastic
was then cut to the size required to cover the FRP girder section. To facilitate bag handling, the actual
size of the bag was cut somewhat larger than the required dimensions. The bag was also marked to
match the FRP position lines on the concrete. This marking of both the bag and the concrete girder
surface greatly facilitated the process of adhering the vacuum bag to the surface of the girders. The
adhesive used to bond the sheet plastic to the concrete girder surfaces was GM Super 77 Spray
Adhesive. Prior to the affixing the sheet plastic to the concrete girder surface, the bag was lined and
crossed with small ropes. These ropes provided veins through which the vacuum pressure could be
22

distributed uniformly to all areas of the bag.
The vacuum pressure applied to the bag was generated by an electric powered, 0.37 kw Welch
Director 8915 vacuum pump. This pump had an air flow rate of 22.3 liters per minute and was capable
of providing the required minimum 0.034 Mpa of uniform pressure for setting of the epoxy. The
vacuum line from the pump was attached to a 114 liter tank from which another line ran to the inlet of
the bag. The tank acted as a reservoir in which a sufficient amount of pressure could accumulate to
insure that the air flow rate through the vacuum line would be large enough to evacuate the bag
rapidly. The pump was turned on and allowed to evacuate the tank for at least thirty minutes before
the entire FRP application process was completed, at which time the tank valve was opened. The
vacuum causes the bag to compress against the composite plates, providing the necessary uniform
pressure during the cure time.
Another major step in the installation process was the application of the epoxy to the
composite. The two components of the epoxy were first combined in a large can, at a 1: 1 volumetric
ratio. The epoxy components were mixed with a mixing tool attached to a hand held drill until a
uniform, homogenous mixture was obtained. The epoxy was then spread evenly over the entire
surface of the composite plate to a thickness of approximately 1.5 mm. The composite plate was then
immediately affixed to the girder, taking extreme care to position the plate to match the boundaries
previously marked on the concrete. Direct pressure was applied over the surface of the plate with a
hand held roller. It required, a splice plate was also installed in this step of the procedure. This
procedure was repeated on the next girder section in a similar manner.
Approximately fifteen minutes prior to the time that the vacuum bag was to be installed, each
surface of the concrete-vacuum bag interface was sprayed with adhesive. This was done to allow the
spray adhesive to reach a level of maximum adherence before the bag was installed. The bag was then
installed, making sure that the position of the adhesive on both the plastic and the concrete matched.
23

Hand pressure was applied along the perimeter of the bag until the concrete-bag interface was in full
contact, except for a small area of approximately five inches in length. This small length was left
unsealed to accommodate insertion of the vacuum hose. The hose entered the bag as close as possible
to one of the air passages provided by the small ropes. The bag was sealed around the vacuum line,
using a putty sealant to seal around the line inlet. The bag was further secured against leakage by
lining the perimeter with duct tape.
After the bag had been installed on one girder section, the valve controlling the vacuum was
opened. The composite was then applied to another girder section in exactly the same manner. The
vacuum tank provided separate outlets for each vacuum bag, and the vacuum system was capable of
providing a minimum of 0.034 Mpa of pressure to both bags simultaneously. After the installed
composite plates were subjected to a uniform pressure for at least six hours, a sufficient set of the
epoxy was achieved and the pressure apparatus was removed.
24

CHAPTER THREE FIELD LOAD TESTS
Field load tests were performed so that comparisons of the structural behavior of the bridge
before and after application of the FRP laminates could be made. The bridge behavior was quantified
by measurements of vertical mid-span deflections of the bridge girders, strains in the primary flexural
reinforcement, strains in the FRP laminates, and concrete strains on the surface of the bridge beams.
Measurements were made for both static and dynamic loading conditions using two identical trucks.
The bridge instrumentation plan and details of the load tests are described in this chapter.
INSTRUMENTATION PLAN
Electrical resistance foil strain gages were used to measure the strain response to the load in
the rebar, composite plates, and on the surfaces of the concrete girders both before and after the FRP
was installed. The gages had preattached lead wires with polyamid encapsulation and were self
temperature compensating. All gages had a nominal resistance of 350 ohms. After each gage was
mounted, the preattached lead wires were soldered to light gage stranded wire which was connected to
a terminal block. Electrical tape was applied to insulate the wires from each other. The whole
assembly was then covered with a waterproof neoprene pad with an adhesive backing to protect it from
the environment.
Two gages were installed, approximately 100 mm on each side of midspan, on the middle
rebar of the bottom row of tensile reinforcement in each girder, as shown in Figure 3.1. Data from
only one of the gages was sufficient; the other was provided for redundancy. The gages attached to the
rebar had a gage length of 6.35 mm. Strain gages with a gage length of 101.60 mm were installed on
the surfaces of the girders, as shown in Figure 3.1. Each girder had a strain gage installed on its inside
chamfer at midspan. Prior to FRP application, each girder also had a gage installed on its inside
surface 50 mm from the chamfer, as shown in Figure 3.1. This gage was removed before the FRP was
installed.
25

I srmmetric About Centerline ·- o Bridge
i J_
i30T
j_
30 y- ......_-ii~"!"
Girder 2
j_ •
soY-~--·--Strain Gages -J ~134
Girder 1
Figure 3 .1. Locations of Strain Gages on Girder Cross Section (All Dimensions are mm)
Splice plates
GFRP
CFRP
Midspan-
Figure 3.2. Strain Gages Attached to Splice Plate of Girder 2
26

After application of the FRP, gages were installed on the surfaces of the composite plates.
Figure 3.1 shows the position of these gages. These gages had a gage length of 12.70 mm. All gages
applied to the FRP were at midspan, except for 4 gages that were installed to the bottom plate splice at
the East end of beam 2, as shown in Figure 3 .2.
Vertical deflections were measured at midspan of each girder with Linear Variable Differential
Transformers (LVDT's). The LVDT's had a range of 2.54 mm, a resolution of .003 mm, and operated
with a linearity of less than 0.25% of full scale.
All strain gages were connected to a data acquisition system using a three-wire quarter bridge
connection. Shielded cable for the strain gages and L VDT' s was used to reduce the electronic noise
recorded with the data. The shielded cables were attached to terminal blocks at the gages and were
routed to the data acquisition van where they were connected to the data acquisition system through
screw terminal blocks.
DESCRIPTION OF LOAD TESTS
Load test were performed both before and after application of the FRP with load test trucks of
known axle configuration and weight distribution. The two vehicles used for the load tests are
identical load test trucks owned and operated by the Alabama Department of Transportation (ALDOT).
These trucks have a 3-axle configuration as shown in Figure 3.3. ALDOT test loading case LC5 was
used. This provided a gross vehicle weight of 173 KN distributed as shown in Figure 3.3.
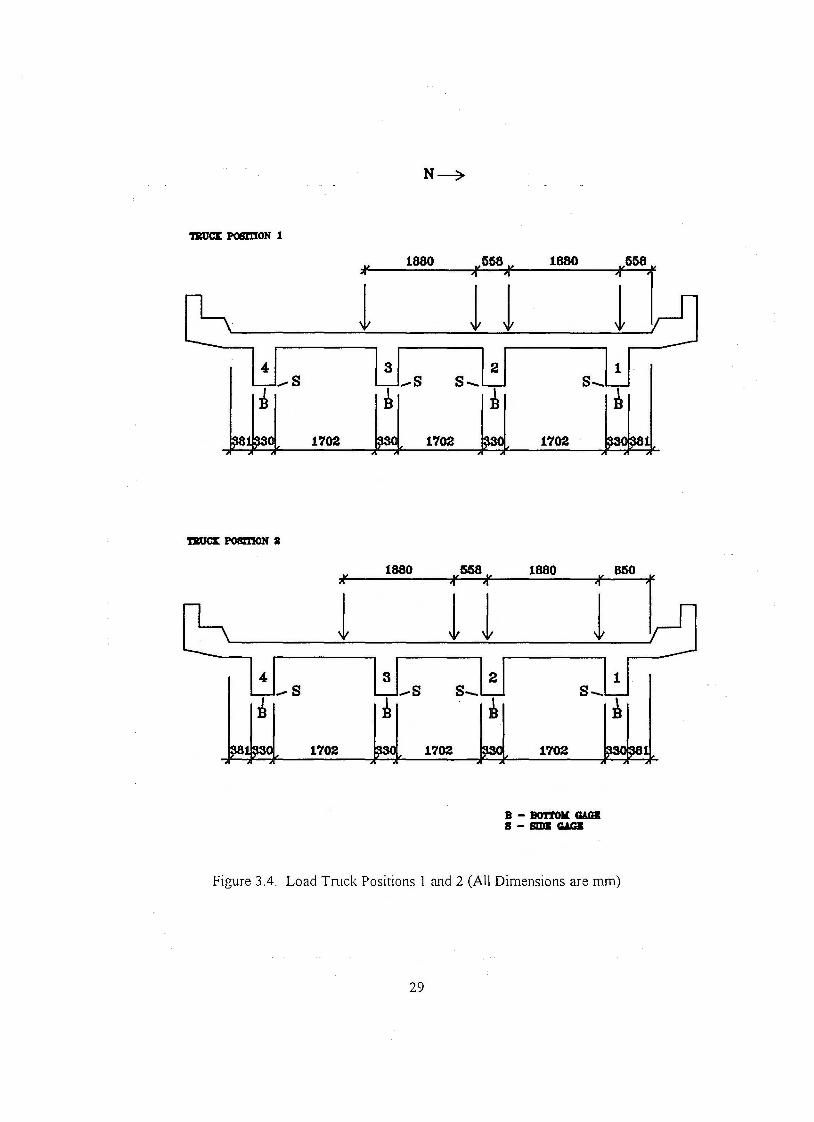
Static and dynamic tests were performed on the bridge. For the static tests, the trucks were
positioned with the center axle at midspan in 4 different transverse locations, as shown in Figures 3.4
and 3.5. The positions were chosen to simulate the most extreme load conditions possible. Before the
trucks were positioned on the bridge, the data acquisition system was balanced to establish a reference
point of zero live load strain. After a zero reference point was established, the trucks were directed to
Position 1. Data was then recorded for each sensor. The true value for the live load deflections and
27

I-- 2.22 m ----l I j-1 .54 m --j I
-r I~ ~~ 1.46m~~ ~~
t 63.92 KN
63.34 KN
5.63 m
1 ~1------~~.r- 45.77 KN
~2.26m~
Figure 3.3. Load Truck Configuration
28
l
1702
DUCI: POSmON I
" "
l 4
-s ~
1702
1880 ,,C568 I( 1880
1880
3 -s
~
J\ J\
l l
1702
"558 'I " J\
l l 2
s-~
1702
1702
1880 '1"
l s-
1702
B - BOftOM GAB S - SIDI GACK
850
1
~
Figure 3.4. Load Truck Positions l and 2 (All Dimensions are mm)
29
l

'l'BUa POSITION 8
4 -s
~
'l'BUCI: POSmON ~
850 >i'
l 4
-s ~
1880 VMS v 1880 1 1
l l 3 2
-s s-~ ~
1702 1702
1880 >al( 1568 1"
1880
l l 3 2
-s s-~ ~
1702 1702
,,.,
l s-
1702
" "
l s-
1702
B - BOTTOK GAGE
S - SIDJ: GAGE
Figure 3.5. Load Truck Positions 3 and 4
30
1
~
1
~

strains were determined by subtracting the values taken for each sensor at the zero reference point from
the values recorded for each sensor when the test trucks were on the bridge. The trucks were then
moved off of the bridge and the whole sequence was repeated for Positions 2 through 4. Static tests
were performed twice for each test position. These tests were performed both before and after the FRP
was installed.
Dynamic tests were conducted with the same test vehicles traveling side by side at 80
kilometers per hour. Multiple tests were carried out for redundancy. Data was recorded for the trucks
traveling in both directions across the bridge. A zero data reference point was established in the same
manner described for the static tests. The trucks were then driven across the bridge. A spotter with a
clear view of the trucks and the bridge communicated with the data acquisition system operator via a
hand held radio. The spotter instructed the system operator when to begin and stop recording data.
After the trucks crossed the bridge, the test file number and the speed and direction of the trucks were
recorded. This same sequence was then repeated several more times. Prior to FRP installation, 3 load
tests were performed with the test trucks traveling westbound and 2 tests were performed with the test
trucks traveling eastbound. After FRP application, 4 tests were performed with the test trucks
traveling eastbound. An additional static test was performed after FRP application with the tests trucks
centered in the traffic lanes, as shown in Figure 3.6. This was done for comparisons of data from the
dynamic tests to static data with the trucks in the same transverse position.
31

TRUCK POSITION 5
1.435
4 ,,.. s ~
I,. 1880 558 'lv ...
" "
l l l 3
,,..$ s-~
1702 1702
2
~
1880 I,
" 1.(.35
l
1702
B - llOtrOK GAGB
s - mm G.&.CZ
Figure 3.6. Load Truck Position 5
32

INTRODUCTION
CHAPTER FOUR RESULTS OF LOAD TESTS
To evaluate the effects of externally bonding FRP plates to the surfaces of the bridge girders,
both dynamic and static load tests were performed. These tests, as well as the instrumentation used to
gather the test data, are described in Chapter Three. The results of these tests are presented in this
chapter. Data is presented to quantify the effect of the FRP reinforcement on rebar strains and girder
deflections. Strain compatibility between the rebar and the CFRP is investigated. The effectiveness of
the splice plates in transferring the load between the primary FRP reinforcement plates is also
discussed. Finally, conclusions are drawn to summarize the overall performance of the FRP
strengthening system.
DATA ACQUISITION AND REDUCTION
As described in Chapter Three, load tests were performed in each of the four truck loading
positions shown in Figures 3.4 and 3.5. These tests were performed both before and after application
of the FRP. For each loading position, strain or deflection values were recorded for each sensor (strain
gage or deflection sensor). Measurements for each position were repeated four times. A single value
was calculated for each sensor for each position by averaging the values recorded for that sensor in
each of the four tests. The rebar strain data from each test and the average values are listed in Tables
4.1 and 4.2. The column headings in those tables indicate the strain gage location. For example, the
gage attached to the rebar in girder 1, 100 mm to the west of midspan, is designated R 1 W. Similarly,
the gage RlE is located in girder 1, 100 mm to the East of midspan. When the second round of load
tests were performed, after application of the RFP, some of the gages were malfunctioning. In Table
4.1, an entry of "NA" indicates that the gage was not working properly and the data is not available.
The girder midspan deflection results from the static tests are shown in Tables 4.3 and 4.4. Strains
33

Table 4.1 . Rebar Strains from Static Tests - Before FRP Application
Strain Gage Data (microstrain) Loading RlW RlE R2W R2E R3W R3E R4W R4E
Position 1 Test 1 419 375 518 458 418 388 194 199 Test 2 420 375 520 459 408 379 179 182 Test 3 401 359 508 450 406 376 178 184 Test4 418 373 520 459 407 377 178 182 Avg 415 371 517 457 410 380 182 187
Position 2 Test 1 379 340 498 441 429 398 224 229 Test 2 374 336 498 439 423 391 220 225 Test 3 378 339 504 446 415 385 212 218 Test4 374 336 497 440 421 391 221 226 Avg 376 338 499 442 422 391 219 225
Position 3 Test 1 196 176 411 362 530 493 407 414 Test 2 199 178 411 362 523 486 407 415 Test 3 192 172 408 359 531 492 407 414 Test4 188 169 401 353 527 489 399 406 Avg 194 174 408 359 528 490 405 412
Position 4 Test 1 234 210 429 378 511 475 363 369 Test 2 241 217 435 383 507 471 357 364 Test 3 229 207 425 375 508 473 361 367 Test4 238 214 431 379 511 473 360 367 Avg 236 212 430 379 509 473 360 367
34

Table 4.2. Rebar Strains from Static Tests - After FRP Application
Strain Gage Data (microstrain) Loading RlW RlE R2W R2E R3W R3E R4W R4E
Position 1 Test 1 391 351 NA* 422 372 348 NA 172 Test 2 381 343 NA 424 373 347 NA 175 Test 3 NA 354 NA 420 359 334 NA 162 Test4 382 344 NA 427 374 348 NA 172 Avg 385 348 NA 423 370 344 NA 170
Position 2 Test 1 369 331 NA 410 386 360 NA 207 Test 2 355 320 NA 408 385 359 NA 209 Test 3 357 319 NA 419 391 364 NA 202 Test4 361 324 NA 409 381 354 NA 203 Avg 361 324 NA 412 386 359 NA 205
Position 3 Test 1 189 170 NA 330 463 432 NA 364 Test2 194 174 NA 333 467 434 NA 371 Test 3 181 163 NA 330 476 445 NA 373 Test4 184 164 NA 333 480 448 NA 373 Avg 187 168 NA 332 472 440 NA 370
Position 4 Test 1 221 199 NA 346 452 423 NA 333 Test 2 218 204 NA 347 447 418 NA 333 Test 3 222 196 NA 345 451 421 NA 326 Test4 228 199 NA 347 455 424 NA 330 Avg 222 200 NA 346 451 422 NA 331
*NA== Not Available
35
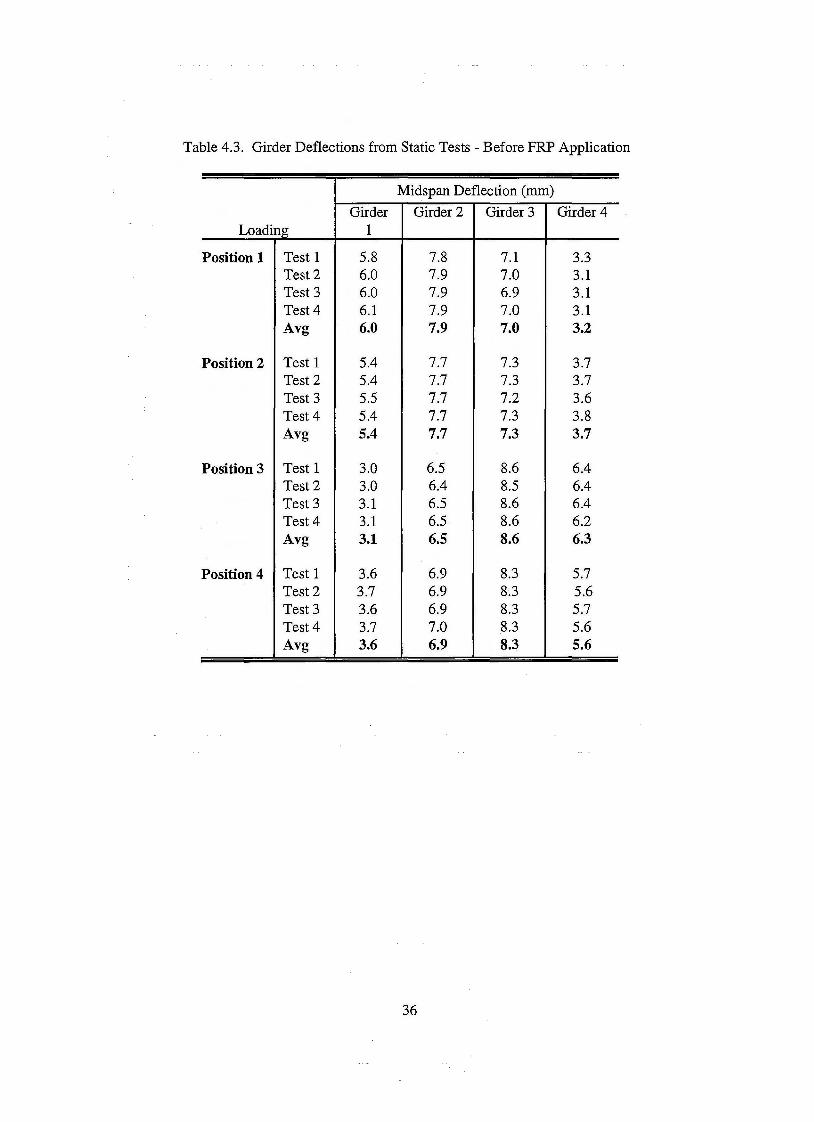
Table 4.3. Girder Deflections from Static Tests - Before FRP Application
Midspan Deflection (mm)
Girder Girder 2 Girder 3 Girder 4 Loading 1
Position 1 Test 1 5.8 7.8 7.1 3.3 Test2 6.0 7.9 7.0 3.1 Test 3 6.0 7.9 6.9 3.1 Test4 6.1 7.9 7.0 3.1 Avg 6.0 7.9 7.0 3.2
Position 2 Test 1 5.4 7.7 7.3 3.7 Test 2 5.4 7.7 7.3 3.7 Test 3 5.5 7.7 7.2 3.6 Test4 5.4 7.7 7.3 3.8 Avg 5.4 7.7 7.3 3.7
Position 3 Test 1 3.0 6.5 8.6 6.4 Test2 3.0 6.4 8.5 6.4 Test 3 3.1 6.5 8.6 6.4 Test4 3.1 6.5 8.6 6.2 Avg 3.1 6.5 8.6 6.3
Position 4 Test 1 3.6 6.9 8.3 5.7 Test2 3.7 6.9 8~3 5.6 Test 3 3.6 6.9 8.3 5.7 Test4 3.7 7.0 8.3 5.6 Avg 3.6 6.9 8.3 5.6
36

Table 4.4. Girder Deflections from Static Tests - After FRP Application
Midspan Deflection (mm)
Girder Girder 2 Girder 3 Girder 4 Loading 1
Position 1 Test 1 5.7 7.2 6.2 2.7 Test2 5.5 7.3 6.3 2.8 Test 3 5.6 7.2 6.3 2.8 Test4 5.5 7.3 6.4 2.9 Avg 5.6 7.3 6.3 2.8
Position 2 Test 1 5.1 7.2 6.6 3.2 Test2 5.2 7.1 6.5 3.2 Test 3 5.3 7.1 6.6 3.3 Test4 5.1 7.1 6.6 3.4 Avg 5.2 7.1 6.6 3.3
Position 3 Test 1 2.9 6.0 7.7 5.6 Test2 2.9 6.0 7.8 5.6 Test 3 3.0 6.0 7.6 5.5 Test4 3.1 6.0 7.6 5.5 Avg 3.0 6.0 7.7 5.5
Position 4 Test 1 3.4 6.3 7.4 4.9 Test2 3.5 6.3 7.5 5.0 Test 3 3.5 6.3 7.4 5.0 Test4 3.5 6.3 7.4 5.0 Avg 3.5 6.3 7.4 5.0
37

were also measured at selected locations on the surfaces of the FRP plates. The strains recorded on the
bottom of the CFRP plates at midspan and on the CFRP splice plate at the east end of girder 2 are
shown in Tables 4.5 and 4.6, respectively.
Prior to application of the FRP, dynamic load tests were performed with test vehicles traveling
in both eastbound and westbound directions. The rebar strain data recorded for these tests are show in
Table 4.7. After FRP application, the load tests were performed with the trucks traveling eastbound
only because a traffic accident a short distance from the bridge restricted traffic flow. The rebar strains
recorded for those tests are shown in Table 4.8. Girder midspan deflection results for the dynamic
tests are shown in Tables 4.9 and 4.10. The strain and deflection values that appear in Tables 4.7 and
4.10 are the peak values recorded over the time interval beginning just before the truck rolled onto the
bridge until just after the truck rolled off of the bridge.
38

Table 4.5. CFRP Strains from Static Tests
Strain Data (microstrain)
Girder Girder 2 Girder 3 Girder 4 Loading 1
Position 1 Test 1 371 423 NA* 168 Test 2 366 432 NA 178 Test 3 371 428 NA 180 Test4 363 432 NA 185 Avg 368 429 NA 178
Position 2 Test 1 338 424 NA 211 Test 2 342 413 NA 210 Test 3 349 415 NA 217 Test4 336 413 NA 220 Avg 341 416 NA 215
Position 3 Test 1 172 334 NA 388 Test2 173 337 NA 389 Test 3 179 335 NA 381 Test4 182 337 NA 392 Avg 177 336 NA 388
Position 4 Test 1 208 348 NA 338 Test 2 210 351 NA 344 Test 3 210 349 NA 349 Test4 215 352 NA 350 Avg 211 350 NA 345
*NA= Not Available
39

Table 4.6 Strains Measured on CFRP Splice Plate (microstrain)
Gage* Test Position 1 Position 2 Position 3 Position 4
Gagel Test 1 558 535 443 470 Test 2 556 533 437 467 Test 3 551 514 442 460 Test4 566 543 442 467 Avg 558 531 441 466
Gage2 Test 1 552 529 421 446 Test2 539 519 417 444 Test 3 534 508 418 440 Test4 535 515 420 440 Avg 540 518 419 443
Gage3 Test 1 434 428 340 362 Test2 430 414 339 360 Test 3 426 409 338 355 Test4 432 411 340 356 Avg 431 416 339 358
Gage4 Test 1 540 529 414 442 Test 2 539 518 417 447 Test 3 539 517 421 444 Test4 542 521 429 447 Avg 540 521 420 445
*See Figure 3.2 for gage locations.
40

Table 4.7. Peak.Rebar Strains from Dynamic Tests -Before FRP Application
Strain Gage Data (microstrain)
Test No. RlW RlE R2W R2E R3W R3E R4W R4E
(a) Test Trucks Travelin Eastbound
3 436 391 553 485 559 521 406 415 5 404 361 529 465 538 503 418 429
Av 420 376 541 475 549 512 412 422
Test Trucks Travelin Westbound 1 475 424 687 604 763 712 584 592 2 500 449 728 639 772 721 562 572 4 490 439 713 627 770 720 599 611
Avg 488 437 709 623 768 718 582 592
Table 4.8. Peak Rebar Strains from Dynamic Tests -After FRP Application
Strain Gage Data (microstrain)
Test No. RlW RlE R2W R2E R3W R3E R4W R4E
(a) Test Trucks Traveling Eastbound
1 408 367 NA* 434 468 438 NA 360 2 398 359 NA 439 479 448 NA 369 3 390 348 NA 472 536 501 NA 426 4 402 359 NA 469 518 483 NA 394
Avg 400 358 NA 454 500 468 NA 387
41

Table 4.9. Peak Girder Deflections from Dynamic Tests - Before FRP Application
Midspan Deflection (mm)
Test No. Girder 1 Girder 2 Girder 3 Girder 4
(a) Test Trucks Travelin Eastbound
3 6.5 8.9 9.5 6.5 5 6.0 8.5 9.3 6.8
Av. 6.3 8.7 9.4 6.7
Test Trucks Travelin Westbound 1 7.1 11.0 12.5 8.9 2 7.4 11.5 12.8 8.7 4 7.2 11.3 12.7 9.3
Avg. 7.2 11.3 12.7 9.0
Table 4.10 Peak Girder Deflections from Dynamic Tests - After FRP Application
Midspan Deflection (mm)
Test No. Girder 1 Girder 2 Girder 3 Girder 4
(a) Test Trucks Travelin Eastbound
1 5.8 7.6 7.8 5.4 2 5.7 7.7 8.0 5.5 3 5.7 8.5 9.1 6.5 4 5.9 8.4 8.8 6.1
Avg 5.8 8.1 8.4 5.8
42

EFFECT OF CFRP ON REBAR STRESSES
The stresses that correspond to the rebar strains presented in Tables 4.1 and 4.2 are shown in
Tables 4.11 and 4.12. The stresses were obtained by multiplying the strains by the elastic modulus of
the steel (200,000 MPa). Table 4.13 compares the stresses from the static load tests prior to FRP
application to those from static tests after FRP application. For the comparisons shown in Table 4.13,
the calculated stresses in each girder are based on the same strain gage, both before and after the FRP
was applied. The gages used were Rl W, R2E, R3W, and R4E.
Table 4.13 indicates that the rebar stresses were reduced by application of the FRP. The
reductions range from 4% in girder 1 for loading positions 2 and 3 to 12% in girder 3 for position 4.
The average stress reduction for all girders is 8%. The results shown in Table 4.13 are presented
graphically in Figures 4.1 and 4.2. These figures indicate that the largest rebar stresses are induced in
the interior girders. The test trucks were positioned to give the most extreme loading conditions
possible, hence the interior girders are loaded more heavily due to the special limitations presented by
the bridge deck and curb. It is noted in Table 4.13 that the largest reduction in rebar stress is also
found in an interior girder, girder 3.
For each test loading position, Table 4.13 indicates that the smallest strain reductions are
always observed in girder 1. GFRP plates were not bonded to the sides of this girder, as shown in
Figure 2.6. This indicates that the GFRP plates bonded to the girder sides had a significant effect on
the overall stiffening of the bridge.
Tables 4.14 and 4.15 show the rebar stresses measured at midspan of each girder for the
dynamic tests performed before and after FRP application, respectively. Comparisons are made in
Table 4.16 to show the effect of the FRP on the rebar stresses. The comparisons are made using data
for Eastbound test trucks both before and after applications of the FRP. The stress values that appear
in Table 4.16 are taken from Tables 4.14 and 4.15. The information presented in Table 4.16 is
43

Table 4.11. Rebar Stresses from Static Tests - Before FRP Application
Rebar Stresses (MPa) Loading RlW RlE R2W R2E R3W R3E R4W R4E
Position 1 Test 1 84 75 104 92 84 78 39 40 Test 2 84 75 104 92 82 76 36 36 Test 3 80 72 102 90 81 75 36 37 Test4 84 75 104 92 81 75 36 36 Avg 83 74 103 91 82 76 36 37
Position 2 Test 1 76 68 100 88 86 80 45 46 Test 2 75 67 100. 88 85 78 44 45 Test 3 76 68 101 89 83 77 42 44 Test4 75 67 99 88 84 78 44 45 Avg 75 68 100 88 84 78 44 45
Position 3 Test 1 39 35 82 72 106 99 81 83 Test 2 40 36 82 72 105 97 81 83 Test 3 38 34 82 72 106 98 81 83 Test4 38 34 80 71 105 98 80 81 Avg 39 35 82 72 106 98 81 82
Position 4 Test 1 47 42 86 76 102 95 73 74 Test 2 48 43 87 77 101 94 71 73 Test 3 46 41 85 75 102 95 72 73 Test 4 48 43 86 76 102 95 72 73 Avg 47 42 86 76 102 95 72 73
44

Table 4.12 Rebar Stresses from Static Tests - After FRP Application
Rebar Stresses (MPa) Loading RlW RlE R2W R2E R3W R3E R4W R4E
Position 1 Test 1 78 70 NA* 84 74 70 NA 34 Test 2 76 69 NA 85 75 69 NA 35 Test 3 NA 71 NA 84 72 67 NA 32 Test4 76 69 NA 85 75 70 NA 34 Avg 77 70 NA 85 74 69 NA 34
Position 2 Test 1 74 66 NA 82 77 72 NA 41 Test 2 71 64 NA 82 77 72 NA 42 Test 3 71 64 NA 84 78 73 NA 40 Test4 72 65 NA 82 76 71 NA 41 Avg 72 65 NA 82 77 72 NA 41
Position 3 Test 1 38 34 NA 66 93 86 NA 73 Test2 39 35 NA 67 93 87 NA 74 Test 3 36 33 NA 66 95 89 NA 75 Test 4 37 33 NA 67 96 90 NA 75 Avg 37 34 NA 66 94 88 NA 74
Position 4 Test 1 44 40 NA 69 90 85 NA 67 Test 2 44 41 NA 69 89 84 NA 67 Test 3 44 39 NA 69 90 84 NA 65 Test4 46 40 NA 69 91 85 NA 66 Avg 44 40 NA 69 90 84 NA 66
*NA =Not Available
45

Table 4.13. Comparison of Rebar Stresses from Static Tests
BeforeFRP AfterFRP Percent Girder (MPa) (MPa) Difference
(a) Loading Position 1
Girder 1 83 77 7 Girder 2 91 85 7 Girder 3 82 74 10 Girder 4 37 34 9
b Loadin Position 2 Girder 1 75 72 4 Girder 2 88 82 7 Girder 3 84 77 8 Girder 4 45 41 9
c Loadin Position 3 Girder 1 39 37 4 Girder 2 72 66 8 Girder 3 106 94 11 Girder4 82 74 10
d Loadin Position 4 Girder 1 47 44 6 Girder 2 76 69 9 Girder 3 102 90 12 Girder 4 73 66 10
46

120
100
-<( 80 a.. 2 -(/) 60 (/) w 0: I- 40 (/)
20
0
120 ~------------------
iOO Position 3
~ 80 c.. 2 .._.. CJ) 60 CJ) w a: I- 40 CJ)
20 ~Before FRP --o-After FRP
4 3 2
GIRDER NUMBER
Figure 4.1. Static Rebar Stresses - Test Truck Positions I and 3
Position 4 Position 2
-<>- Before FRP -o-After FRP
4 3 2
GIRDER NUMBER
Figure 4.2. Static Rebar Stresses - Test Truck Positions 2 and 4
47
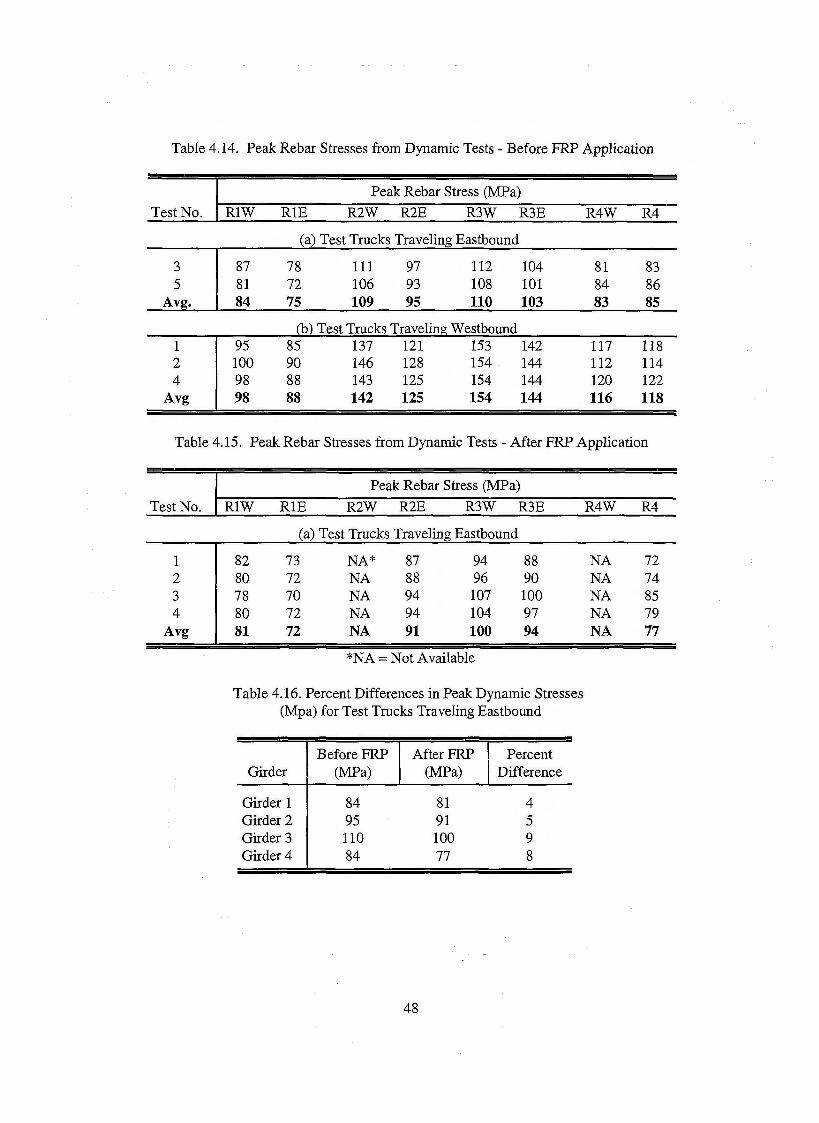
Table 4.14. Peak Rebar Stresses from Dynamic Tests - Before FRP Application
Peak Rebar Stress (MPa)
Test No. RlW RlE R2W R2E R3W R3E R4W R4
(a) Test Trucks Traveling Eastbound
3 87 78 111 97 112 104 81 83 5 81 72 106 93 108 101 84 86
Av. 84 75 109 95 110 103 83 85
Test Trucks Travelin Westbound 1 95 85 137 121 153 142 117 118 2 100 90 146 128 154 144 112 114 4 98 88 143 125 154 144 120 122
Avg 98 88 142 125 154 144 116 118
Table 4.15. Peak Rebar Stresses from Dynamic Tests - After FRP Application
Peak Rebar Stress (MPa)
Test No. RlW RlE R2W R2E R3W R3E R4W R4
(a) Test Trucks Traveling Eastbound
1 82 73 NA* 87 94 88 NA 72 2 80 72 NA 88 96 90 NA 74 3 78 70 NA 94 107 100 NA 85 4 80 72 NA 94 104 97 NA 79
Avg 81 72 NA 91 100 94 NA 77
*NA::::: Not Available
Table 4.16. Percent Differences in Peak Dynamic Stresses (Mpa) for Test Trucks Traveling Eastbound
BeforeFRP AfterFRP Percent Girder (MPa) (MPa) Difference
Girder 1 84 81 4 Girder 2 95 91 5 Girder 3 110 100 9 Girder 4 84 77 8
48
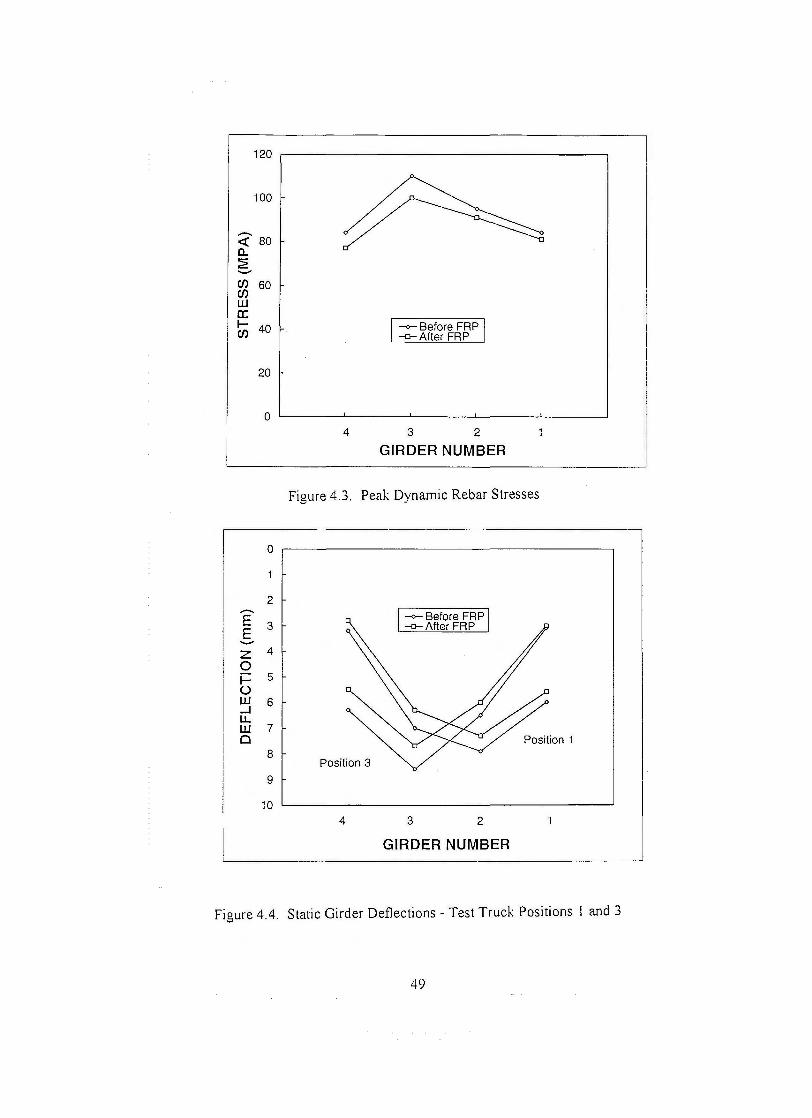
120
100
-<l: 80 a.. 2: -(f) (f)
60
UJ a: f- 40 -<>--Before FRP (f) -a-After FRP
20
0 4 3 2
GIRDER NUMBER
Figure 4.3. Peak Dynamic Rebar Stresses
0
2 -E 3 -<>--Before FRP
E -a- After FRP -z 4
0 f- 5 (.) w 6 ....I LL w 7 0 Position 1
8 Position 3
9
10 4 3 2
GIRDER NUMBER
Figure 4.4. Static Girder Deflections - Test Truck Positions I and 3
49

illustrated graphically in Figure 4.3. Table 4.16 and Figure 4.3 indiCate that the dynamic rebar stresses
were reduced by to application of the FRP. The reductions range from 4% in girder 1 to 9% in girder
3, with an average reduction of 7%. Once again, the largest stress is observed in an interior girder, as
is the largest reduction of stress. It is also noted that the smallest stress reduction again occurred in
girder 1, which did not have GFRP plates bonded to its sides.
To investigate strain compatibility between the girders and the composite plates, the strains
recorded in the rebar are compared to the strains recorded on the surfaces of the CFRP plates at the
same location on the beam, and are presented in Table 4.17. The table shows that the difference
between the strains are small. This result was expected since the difference between the distances of
the rebar gages and the CFRP gages form the neutral axis of the girders is relatively small. This
indicates that the bond between the composite and the concrete is rigid and exhibits linear elastic
behavior.
EFFECT OF FRP ON GIRDER DEFECTIONS
The static midspan girder deflections shown in Tables 4.3 and 4.4 are compared in Table 4.18
and presented graphically by Figures 4.4 and 4.5. Deflection reductions due to the presence of the
FRP range from 2% in girder 1 for loading position 3 to 12% in girder 4 for each of the test positions.
For each loading position, the results indicate that the largest deflections were measured in the interior
girders, as expected. Again, the smallest reduction in deflection for each loading position occurs at
girder which did not have GFRP plates bonded to its sides. It is also noted in Table 4.18 that the
largest reduction in deflection is observed at girder 4 for every loading position.
The reductions in peak dynamic deflections shown in Table 4.19 range from 8% in Girder 1 to
12% in Girder 4. This largest reduction of 12% is consistent with the static test results. The smallest
reduction in peak dynamic deflection was at Girder 2 and not at the exterior Girder 1, which is the
trend of all the other test results. However, as shown in Table 4.19, the reductions of peak dynamic
deflection at Girders 1 and 2 are almost equal.
50

Table 4.17. Comparison of Strains Measured on CFRP and on Rebar
Rebar Strain CFRP Strain Percent Girder (Microstrain) (MPa) Difference
(a) Loadin Position 1
Girder 1 385 368 -4 Girder 2 423 429 1 Girder 3 370 NA* NA Girder 4 170 178 5
b Loadin Position 2 Girder 1 361 341 -6 Girder 2 412 416 1 Girder 3 386 NA NA Girder4 205 215 5
c Loadin Position 3 Girder 1 187 177 -5 Girder 2 332 336 1 Girder 3 472 NA NA Girder4 370 388 5
d Loadin Position 4 Girder 1 222 211 -5 Girder 2 346 350 1 Girder 3 451 NA NA Girder4 331 345 4
*NA= Not Available
51

Table 4.18. Comparison of Girder Deflections from Static Tests
BeforeFRP AfterFRP Percent Girder (mm) (mm) Difference
(a) Loadin Position 1
Girder 1 6.0 5.6 7 Girder 2 7.9 7.3 8 Girder 3 7.0 6.3 10 Girder4 3.2 2.8 12
Position 2 Girder 1 5.2 5 Girder 2 7.7 7.1 8 Girder 3 7.3 6.6 10 Girder4 3.7 3.3 12
c Loadincr Position 3 Girder 1 3.1 3.0 2 Girder 2 6.5 6.0 8 Girder 3 8.6 7.7 10 Girder4 6.3 5.5 12
d Loadin Position 4 Girder 1 3.6 3.5 4 Girder 2 6.9 6.3 9 Girder 3 8.3 7.4 11 Girder4 5.6 5.0 12
Table 4.19 Comparison of Peak Girder Deflections from Dynamic Tests
BeforeFRP AfterFRP Percent Girder (mm) (mm) Difference
Girder 1 6.3 5.8 8 Girder 2 8.7 8.1 7 Girder 3 9.4 8.4 11 Girder4 6.6 5.8 12
52

2 ...-.. E 3 E z 4 0 i== 5 u LU 6 ....I u.. LU 7 Cl
8 Position 4
9
10 4
--<>-Before FRP -o-- After FRP
3 2
GIRDER NUMBER
Figure 4.5. Static Girder Denections - Test Truck Positions 2 and 4
2 -E 3 E --<>-Before FRP. - -o-- After FRP z 4 0 i== 5 u LU 6 ....I u.. LU 7 Cl
8
9
10 4 3 2
GIRDER NUMBER
Figure 4.6. Peak Girder Deflections from Dvnamic Tests - Eastbound Trucks
53

TRANSFER OF STRESS THROUGH SPLICE PLATES
To investigate the performance of the splice plates in transferring stress in the primary FRP
reinforcement, strain gages were attached to the splice plates of the CFRP on the east end of girder 2,
as shown in Figure 3.2. Recorded strain values are presented in Table 4.6 and illustrated graphically in
Figure 4.7. The results show that the strains are maximum at the center of the splice plate, and
decrease toward the end of the plate. The increase in strain toward the center of the splice indicates
that shear stresses in the adhesive layer between the primary CFRP plate and the splice plate transfers
force into the splice plate. This force increases from the end of the splice plate toward the center.
Figure 4.7 shows that the strain measured on the primary plate and on the splice plate near the joint are
approximately the same. This indicates that the bond between the splice plate and the primary plate
transfers stress as effectively as the bond between the primary plate and the concrete. This suggests
that the use of splice plates is a valid mechanism for providing continuous FRP reinforcement along
the entire length of beams.
CONCLUSIONS
The field test results reported in this chapter were used to investigate the effect of externally
bonded FRP composite plates on the structural performance of the bridge girders. Dynamic and static
tests were performed. Rebar strains and girder deflections were measured at midspan for both the
dynamic and static tests. The efficiency of stress transfer through the splice plates of the CFRP was
also investigated.
In each case investigated, bonding of the composite plates to the bridge girders had a
significant effect on the behavior of the structure. Rebar strain reductions ranged from 4% to 12% for
the static tests and from 4% to 9% for the dynamic tests. Girder deflection reductions ranged from 2%
to 12% for the static tests and from 7% to 12% for the dynamic tests.
The relative strength enhancement associated with the GFRP plates bonded to the sides of the
54

600
D
0
500 z -<(
¢ a: ... .6.
en 400 0 a: (.) -~ -a- POSITION 1
300 -o- POSITION 2 -tx-POSITION 3
-<>-POSITION 4 - END OF SPLICE
200 0 100 200 300 400 500 600
DISTANCE FROM JOINT (mm)
Figure 4.7. Splice Plate Strains at East End of Girder 2
55

girders was also investigated. Without exception, the test results indicated that the girder which did
not have GFRP plates bonded to its side surfaces experienced smaller reductions in both the measured
rebar strains and girder deflections. Therefore it is concluded that the laterally bonded GFRP plates
also have a significant effect on the structural performance of the bridge. In addition, the compatibility
between the strains measured in the rebar and the bottom CFRP plates indicate that an effective bond
was achieved between the concrete and the composite. It can also be concluded from the strain data
recorded on the surface of the splice plate that the composite splice design is an effective way to
transfer stress between plates of primary reinforcement. The data shows that the load was transferred
effectively through the splice. The splice plate design allows for the application of multiple pieces of
FRP reinforcement to be applied along the entire length of a structural member, thus greatly facilitating
the rehabilitation procedure.
56

INTRODUCTION
CHAPTER FIVE ANALYSIS OF BRIDGE
The effectiveness of strengthening the bridge with externally bonded FRP laminates was
investigated by performing a comprehensive three dimensional finite element method (FEM) analysis.
Both static and dynamic analyses were conducted, and the FEM analysis results were compared with
the field load test results. The same truck loading positions used in the actual field load tests, as
described in Chapter 3, were implemented in both the static and dynamic FEM analyses. A sensitivity
study to assess the effects of altering the cross sectional area and the modulus of elasticity of the FRP
laminates used in the rehabilitation on girder deflections and reinforcing steel stresses was also
conducted.
A section analysis procedure, based on strain compatibility and equilibrium equations, was
also developed in an attempt to evaluate the ultimate flexural capacity of the FRP repaired bridge
girders. Using this methodology, a parametric study was conducted to assess the strength enhancement
provided to the ultimate load capacity of the bridge and to identify the associated modes of failure. The
primary parameters in the study were the FRP cross sectional area, modulus of elasticity and tensile
strength. Finally, from the results of the section analysis study, design charts were developed which
may be employed for future bridge upgrading.
FINITE ELEMENT MODEL
To verify the accuracy of the FEM analysis, the results of the recorded field test data reported
in Chapter 3 were compared with the FEM results. The bridge span investigated was a simple span of
four girders, each having a length of 10.36m. The width of the span was 7 .32m. Each girder was
reinforced with 6 No. 11 bars in the tension zone as shown in Figure 2.3.
To accurately model the bridge, a three dimensional FEM model was constructed. The bridge
57

structure was categorically analyzed using a judiciously selected combination of finite elements. The
deck and girders were modeled independently of each other in order to simulate the effect of the
existing cracks in the girders. Although the original bridge structure is symmetric, the loading
conditions were unsymmetric and the FRP bonded side plates were not installed on all girders.
Therefore, a three-dimensional model for the entire bridge was required. An isometric view of the
FEM model is shown in Figure 5.1. In the actual bridge, the concrete girders exhibited extensive
flexural and shear cracking. These cracks extended through the entire stem of each girder and virtually
along their entire length as illustrated in Figures 6.1 and 6.2. Therefore the elastic modulus of the
girders was modified to simulate their extensive cracked state. The modulus of elasticity of the deck
was calculated using the American Concrete Institute (ACI, 1995) standard of 4730 ./(,where (is
the concrete compressive strength in Mpa.
The bonding of the FRP laminates to the damaged concrete surfaces prevented the cracks from
opening when the bridge was subjected to loading, and tended to stiffen the girders. This improved
stiffness of the cracked concrete due to the bonding of the FRP laminates was estimated to be 30-40%
above that of the unrepaired cracked concrete girders.
The FEM analyses were conducted on the Alabama Super computer Authority (ASA) Cray
C90 Super computer through implementation of the ADINA (ADINA, 1990) finite element computer
programs. The FEM model consists of 1440 three dimensional, eight node solid elements for the
concrete deck slab, 1280 eight node solid elements (having a reduced modulus of elasticity to simulate
the effect of cracks) to model the concrete girders, and 160 truss elements to model the steel
reinforcing bars (located at the C.G .. of the reinforcement). The total number of degrees of freedom
for the FEM model is approximately 15,000. The bonded FRP laminates were represented with 160
truss elements to model the CFRP plates located at the mid bottom nodes of the girders. In addition,
another 720 truss elements were employed on the sides of the girders to represent the GFRP plates. A
58

Figure 5.1. An Isometric View of the Finite Element Model of the Bridge
59

typical cross section of the FEM model of the bridge is presented in Figure 5.2.
FEM ANALYSES
A comprehensive series of three-dimentional FEM analyses were conducted for the bridge
structure described in the previous chapters of this report. Both static and dynamic analyses were
performed to verify the accuracy of the FEM model and to replicate the field load tests described in
Chapters Three and Four. The dynamic analysis studies included frequency analyses to establish the
dynamic characteristics of the bridge, and transient analyses to simulate the dynamic field load tests.
A parametric study was also conducted to quantify the effects of varying several cross section
characteristics and mechanical properties of the FRP laminates upon the bridge girder structural
responses.
Frequency Analysis
The previously described FEM model was used to conduct a frequency analysis of the bridge.
This analysis was performed to establish the dynamic characteristic of the bridge and to verify the
accuracy of the FEM model by comparing the calculated fundamental frequency and the mode shape
with those observed in the field tests. Also, the results of the frequency analysis, along with the
damping ratio for the fundamental mode determined from the filed tests, were used to determine the
constants required to construct the Rayleigh damping matrix required for the transient analysis.
Moreover, the integration time step used in the transient dynamic analysis was selected to be
approximately 1/10 of the fundamental bridge period obtained from the frequency analysis.
The first twenty natural frequencies and the corresponding mode shapes for the bridge were
determined using the subspace iteration method (Bathe, 1996) and are presented in Table 5.1. The first
vibration mode shape was identified as the symmetric flexural mode having an axis of symmetry about
midspan as illustrated in Figure 5.3. The fundamental natural period obtained from this frequency
analysis was 0.097 sec, as indicated in Table 5.1. This result was compared to the fundamental
60

natural period for the bridge determined from field test results. To this end, the bridge period was
measured from the time history recorded by the rebar strain gage located at midspan of girder B3
during dynamic field load test No.3, which was conducted before rehabilitation. This strain time
history is presented in Figure 5.4. The natural period measured from this time history was 0.099 sec,
which agrees very well with the FEM result of 0.097 sec.
Damping Characteristics
The true damping characters of a structure are very complex and difficult to define. Moreover
the physical damping matrix, [ c], is difficult to determine analytically or even to estimate. However
modal damping ratios'(() are more easily calculated or estimated. A Rayleigh damping formulation
was employed in the dynamic FEM analyses. Rayleigh damping implies that, the system damping
matrix is proportional to the mass and the stiffness matrices by means of two constants, a0 and a1• The
Rayleigh damping matrix is given by:
[C] = a0 [M] + a1 [K] ............. 5.1
where [C], [M] and [K] are the damping, mass and stiffness matrices, respectively. The constants a0
and a1 are alternately related to the system damping by the expression:
a1 wn + ---
2 ............. 5.2
where (n is the modal damping ratio for mode n, and wn is the corresponding natural frequency
(rad/sec).
61

truss elements for GFRP laminates
truss elements for steel reinforcing bars
truss elements for CFRP laminates
Figure 5.2. Typical Cross Section of the FEM Model for Repaired Bridge Structure.
62
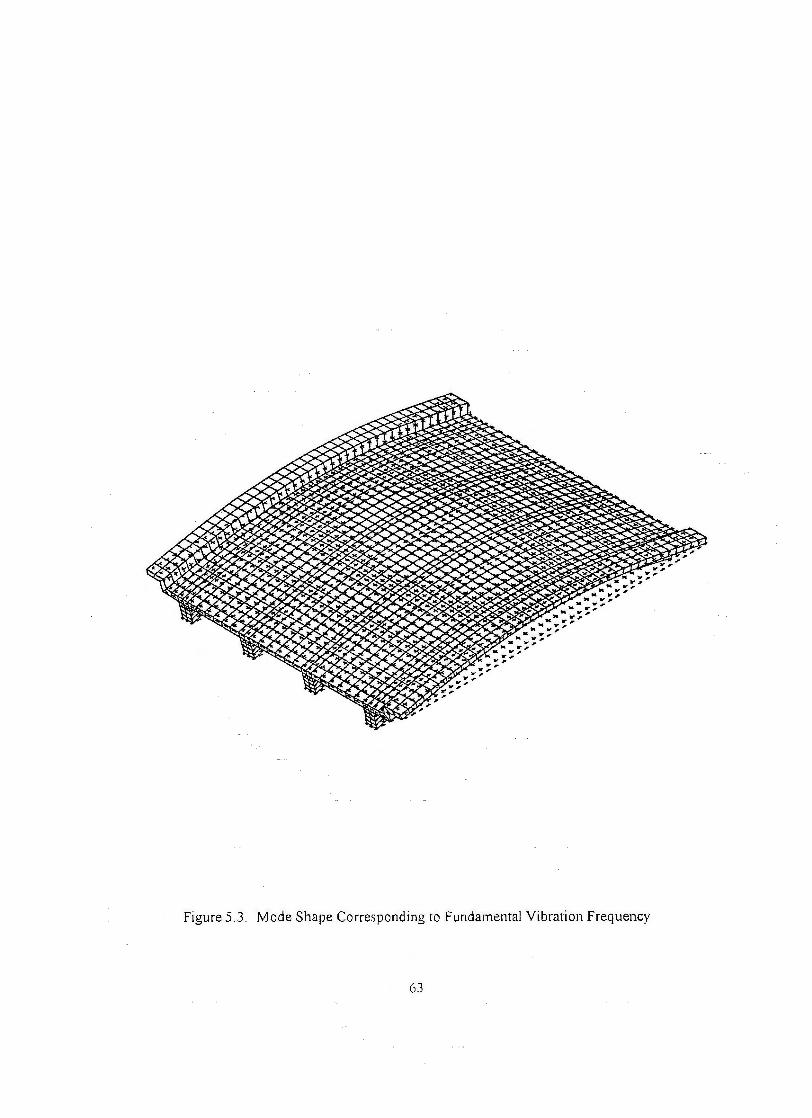
Figure 5.3. Mode Shape Corresponding to Fundamental Vibration Frequency
63

Table 5 .1. Natural Circular Frequency, Natural Frequency and Natural Period for the First Twenty Modes Extracted from the FEM Frequency Analysis.
Mode Frequency Natural Natural Number (rad/sec) Frequency, Hz Period, sec.
1 64.71 10.30 0.0971
2 81.83 13.02 0.0768
3 110.70 17.62 0.0568
4 173.23 27.57 0.0363
5 196.41 31.26 0.0320
6 221.90 35.32 0.0283
7 226.69 36.08 0.0277
8 257.78 41.03 0.0244
9 299.96 47.74 0.0209
10 324.36 51.62 0.0194
11 352.56 56.11 0.0178
12 362.56 57.70 0.0173
13 398.29 63.39 0.0158
14 403.59 64.23 0.0156
15 412.63 65.67 0.0152
16 463.91 73.83 0.0135
17 471.25 75.00 0.0133
18 494.19 78.65 0.0127
19 515.54 82.05 0.0122
?.O '\'JL1 flR R~ "1 00170
64

6
e E -c 0
~ .!!! 4 -Cl) Q .. Cl)
l? a
2
Bridge period
5 5.2 5.4 5.liime (se<f}.8 6 6.2
Figure 5.4. Experimental Data Recorded During Dynamic Field Load Test No. 3 on Girder B3 Before Rehabilitation.
65
6.4

The constants a0
and a1 are determined from the simultaneous equations obtained by applying Equation
5.2 twice for any two modes which results in the following expression:
2 -1 1 [ ~:) ............. 5.3 [ ::) -w r
Using the information extracted from the frequency analysis, the coefficients a0anda1 can be
evaluated. The first modal damping ratio ((1)was determined from the logarithmic decrement (o) of the
mid span deflection time history recorded for beam B3 during the dynamic field test No. 3 (refer to
Table 4.9), shown in Figure 5.4. The calculated average value of ~1 , using Equation 5.4 is 0.018 (i.e.
1.8% of critical damping). The expression for the calculation of s1 is given by
............. 5.4
where y1 and y2 represent the amplitudes of two successive peaks of the free vibration segment of the
deflection time history shown in Figure 5.4.
The contribution of the higher modes to the dynamic response is usually small, therefore the
damping ratio ( 3 corresponding to the third frequency, w3, was set equals to 0.05 and used in the
analysis. Substituting these values for s1 and s3 into Equation 5.3 yielded the values a0=-2.21 and
a1=0.0011. Then, the proportional damping matrix defining the required values for damping ratio for
the specified frequencies is determined from the Rayleigh damping expression as given by Equation
5 .1. This relation is represented graphically in Figure 5 .5.
66

0.20 ........ >..JI -0 :;::: <II a: 0) s: 0.15 ·e Cl1 c
Ci:i -a 0 :e
0.10
0 100 200 300 400 500 600
Frequency (radJsec)
Figure 5.5. Modal Damping Variation with the Bridge Natural Frequency.
67

Transient Analysis
To assess the effectiveness of the FRP strengthening technique on reducing the reinforcing
steel stresses and girder deflections, two dynamic analyses were performed; one for the bridge before
rehabilitation, and the other after installing the FRP laminates. In each of these analyses, the actual
dynamic field load tests described in Chapter 3 were simulated. The dynamic tests were performed
using two trucks traveling side by side in a symmetric pattern along the bridge longitudinal axis as
illustrated in Figure 5.6. The truck wheel loads in the FEM model were represented as moving
concentrated loads assigned to pre-specified nodes. The specific nodal loads were calculated
according to their distance from the wheel path. To accurately model the load conditions, these loads
were specified in the time domain with the trapezoidal load-time history shown in Figure 5. 7. This
load-time history is shifted along the longitudinal axis of the structure, according to the truck speed
and the node spacing, as the truck moves across the bridge. A computer program was developed to
calculate the appropriate load time histories for either one or two load trucks.
In the transient analyses, an integration time step of 0.002 sec was selected to insure accuracy
of the results, and the integration was carried out over 400 time steps. The Newmark method for direct
time integration with a consistent mass matrix and a Rayleigh damping formulation, as previously
described in this section, were employed in the numerical analysis. Due to the extensive flexural
cracking in the bridge girders, a reduced value for the modulus of elasticity of the girder finite
elements was employed to simulate the stiffness degradation.
Results of Transient Analyses
Comparisons of the FEM transient analysis results with the recorded field test data, both before
(refer to Table 4.7 and 4.9) and after (refer to Table 4.8 and 4.10) installing the FRP laminates, are
shown in Figure 5.8 and Figure 5.9, respectively. It is apparent from these comparisons that the FEM
model provides a very good prediction for both the maximum girder deflections and the reinforcing bar
68
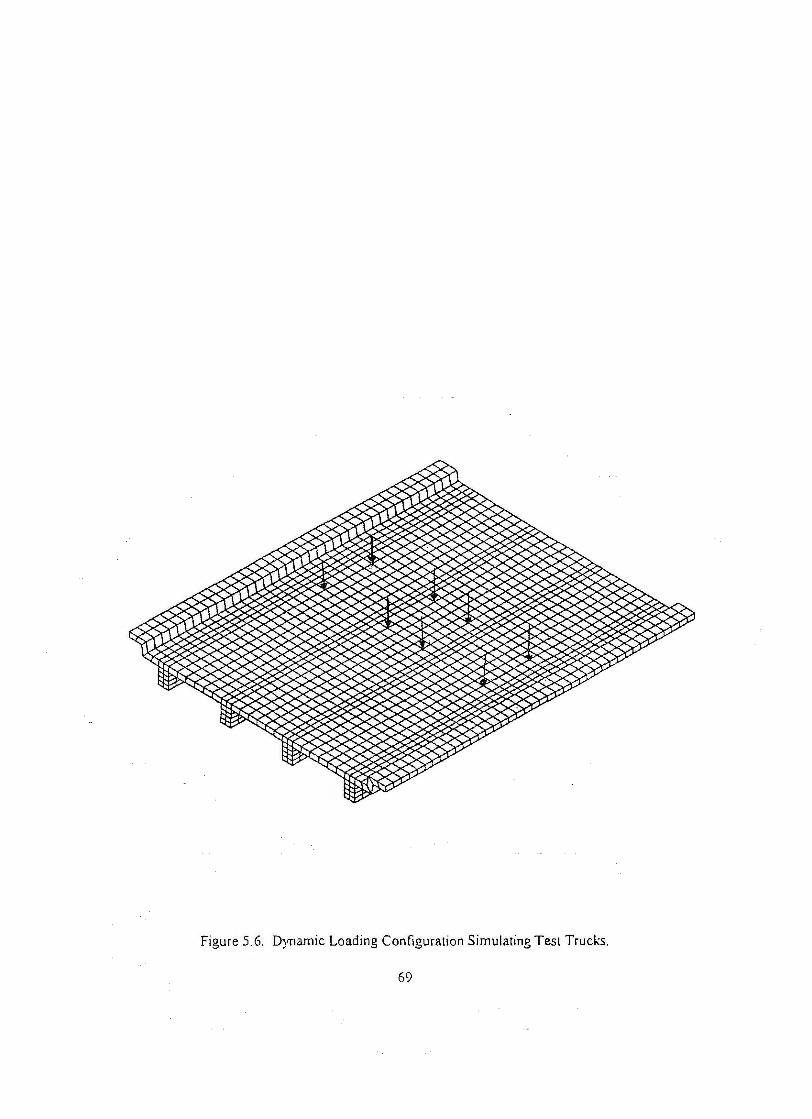
Figure 5.6. Dynamic Loading Configuration Simulating Test Trucks.
69

f~b Loading for node 40
n 0 I
0 0.05 0.1 0.15 0.2 0.25 0.3
Time, sec
:h Loading for node 39
n 0 I I I I I
p 0.05 0.1 0.15 0.2 0.25 0.3
Time, sec
:h Loading for node 38
n 0 I I I I I
p 0.05 0.1 0.15 0 .2 0.25 0.3
Time, sec
~ Vilt
-~ - . - .
40 39 38 node number
~ • ' -
Figure 5.7. Time History Used for Truck Loading in the FEM Analysis.
70

120 151 Recorded Test Data
El FEM Results 100
-CG c. 80 :e -Ill Ill f ti) 60 E ::s E ·~ 40 ~
20
0 81 82 Beam No.
(a) 83 B4
11
10 El Recorded Test Data El FEM Results
9 -E 8 E ...... c 7 0 ~
6 <II ;;::: <II c 5 E ::s
4 E ')( CG 3 :e
2
1
0 81 82 Beam No. 83 84
(b) Figure 5.8. Comparisons of FEM Transient Analysis Results and Recorded Test Data Before
Rehabilitation (Test No.3): (a) Maximum Stresses in Reinforcing Steel at Midspan; (b) Max.imum Girder Deflections at Midspan.
71

100
90
80
- 70 I'll
Cl. :::E 60 -II) V>
50 f -(/) "i 40 Q) -(/)
30
20
10
0
10
9
-E 8
e 7 -c 0 6 ~ Q)
;;::: 5 Q)
0 E 4 ::s E .>< I'll 3
== 2
1
0
81 82
81 82
Beam No. (a)
Beam No. (b)
m Recorded Test Data
83 84
83 84
Figure 5.9. Comparisons of FEM Transient Analysis Results and Recorded Test Data After Rehabilitation (Test No. 1): (a) Ma..'(imum Stresses in Reinforcing Steel at Midspan:
(b) Maximum Girder Deflections at Midspan.
72

stresses in both instances.
The variation of mid-span girder deflections and steel reinforcing bar stresses with time,
recorded during the field tests, both before (test No. 3) and after (test No. 1) bonding the FRP
laminates, were compared with the corresponding results obtained from the FEM analysis. These
comparisons are presented in Figure 5 .10 through Figure 5 .17. Finally, a comparison of the field load
test and FEM results of the time histories (test no. 1) for stresses in the CFRP plate at midspan of
girder B2 is presented in Figure 5.18. Excellent correlation between the measured (field) and predicted
(FEM) results are noted in each instance.
Static FEM Analysis Results
The results obtained from the FEM analysis before installing the composite laminates are
presented Figures in 5 .19 through 5 .22 for the four static load configurations described in Chapter
Three. Very good correlation of the FEM results, for both girder deflections and reinforcing steel
stresses, with the field test data is noted. The reinforcing steel stresses obtained from the FEM
analysis are slightly lower than the results obtained from the filed tests. This is attributed to the
modeling simplification of lumping together the physical properties of the six reinforcing bars at the
center of gravity location of the reinforcing steel area, while in the actual field test, the recording gage
was mounted on the underside of the bottom most bar.
The results of the FEM analysis after installing the FRP laminates are presented in Figures
5.23 through 5.26. The FEM analysis results agree very well with the static load test data for both the
girder deflections and reinforcing steel stresses. Also, the average decrease in midspan girder
deflection and steel reinforcing stresses predicted by the FEM analysis is equal to 10%. This is
approximately equal to the actual recorded decrease using the field test data. Finally, Table 5.2, Figure
5.27 and Figure 5.28 present comparisons between CFRP stresses obtained from the FEM analysis and
the recorded test data. Excellent correlation of these results is also noted.
73

- Recorded Test Data
- FEM Results
5.1 5.2 5.3 5.4 5.5 5.6 5.7 5.8 5.9 6.0
Time (second)
Figure 5.10. Midspan Deflection Time Histories for Girder Bl Before Rehabilitation (Test No. 3).
74

-E . E -c 0 ~ 0
! CP Cl
- Recorded Test Data
--FEM Results
4
2
-2 -l---~~+-~~-1-~~-1-~~-1-~~-+~~-+~~--t~~~~~---i
5.1 5.2 5.3 5.4 5.5 5.6 5.7
Time (second)
Figure 5 .11 . Midspan Deflection Time Histories for Girder B2 Before Rehabilitation (Test No. 3).
75
5.8 5.9 6.0

c;-a. :: -en en Cl> ... ....
CJ)
Q) Cl> ....
CJ)
en
·= E J2 c 'Ci> cc
- Recorded Test Data
- FEM Results
50
40
30
20
10
5.1 5.2 5.3 5.4 5.5 5.6 5.7 5.8
Time (second)
Figure 5.12. Time Histories for Midspan Reinforcing Steel Stresses for Girder B 1 Before Rehabilitation (Test No. 3).
76
5.9 6.0

'Ci' a. :E -fl) ti)
~ -U1 a; Cl) -U1 O> c u ... 0 -c
"Qi a:
- Recorded Test Data --FEM Results
60
40
20
-20+-~~l---~-+~~-1-~~+-~--1~~-+~~--t-~~+-~-i
5.1 5.2 5.3 5.4 5.5 5.6 5.7 5.8
Time (second)
Figure 5.13. Time Histories for Midspan Reinforcing Steel Stresses for Girder B2 Before Rehabilitation (Test No. 3).
77
5.9 6.0

- Recorded Test Data
--FEM Results
'E 3..j_~~-1-~~--l-~~-+~--+1-+~~--t~~~k;;;;;:-t-~-r-~---i E -c 0
~ Cl)
di 2+-~~---J.~~~-l----i'--~~-H,__-l--~~~+-~~-t~-ttr.--t--tt-~--i c
-1 _J._.__._--'--'--l--'--'--'--Y---'---'--'--L--ji-'--'---'--'-+---1--'--'--'--+-.L.._1.---'---'-+--'---'--'---'--i-'---'--l.-p--jj
3.4 3.5 3.6 3.7 3.8 3.9
Time (second)
Figure 5.14. Midspan Deflection Time Histories for Girder Bl After Rehabilitation (Test No. 1).
78
4.0 4.1 4.2

-E E ...... c 0 = u Q)
;;::: Cl)
c
- Recorded Test Data
8 --FEM Results
5
4
3
-1 -\-J.--L-..L-L-l->--.L---'--'-+-.l......l.-'-L--J---'--'-L--'-f-1-.L.......1....-'-11-'---'----1-'-+--'--'-~+-'--'-........._,
3.4 3.5 3.6 3.7 3.8 3.9 4.0 4.1 4.2
Time (second)
Figure 5 .15. Midspan Deflection Time History for Girder B2 After Rehabilitation (Test No. l).
79

-cu a.. :s -en en ! -"' Ci s "' C'I c ·~ .e c 'G) cc
- Recorded Test Data
- FEM Results
50
40
30
20
10
~0-l--i-'--'-'-l--'--.1-1._._+.-"'---'-.J-.1-+...L-J'--'---'-f-L-'-'-'--+-.!-.-1.-'--'-!_..__,_,'-'--t-~-'-~
3.4 3.5 3.6 3.7 3.8 3.9 4.0
Time (second)
Figure 5 .16. Time Histories for Midspan Reinforcing Steel Stresses for Girder Bl After Rehabilitation (Test No. I).
80
4.1 4.2

- Recorded Test Data
got-~~-r~~-t~~~t-~~J-~~---rt_.-_-:_-~F~E~M;.;,,.;.;R~es~u~lt~s----_.
'i' GO-l-~~-4~~~--1-~~---1~~~-h,____.l----if--__,r-'t-t-~~~-t--~~--i
a. :ii: ...... ~ SO-l-~~--i~~~--1-~~--1~~~-J--1--~~1--~--tr-f\:~~~f-'"~~-i e tn J 40-l-~~--i~~~--1-~~--1~--:-1-l\f-'--1t-~~--1--~--1;-t-~~~t-'"~~1 UJ tn c ·E 30-1-~~-+~~~~~+----1-JY-~-1-+-~~--1,----~~tt-~-r~-t--~~--i
a c ·; ~ 20-1-~~-+-~-..,J'---1~~~+-~~-t-~~-+~~--j~~-\---t-~~-i
3.4 3.5 3.6 3.7 3.8 3.9 4.0
Time (second)
Figure 5.17. Time Histories for Midspan Reinforcing Steel Stresses for · Girder B2 After Rehabilitation (Test No. I).
81
4.1 4.2

-ca ll. :E -cn en ! -(/) ll. a: u. 0
30
20
10
~Recorded Test Data
- FEM Results
-20-l--~~+--~-i~~-J-~~--+-~~-+-~~-t-~~t--~---1
3.4 3.5 3.6 3.7 3.8 3.9 4.0 4.1
Time (second)
Figure 5. 18. Time Histories For Midspan Stresses in CFRP Plate fo r Girder B2 After Rehabilitation (Test No. 1)
82
4.2

100
El Recorded Test Data 90
El FEM Results - 80 "' D. :i - 70 en en f 60 -(/) "'i 50 Cl) -(/)
Cl 40 c ·c:; ... 30 0 -c ·a; 20 a:
10
0 81 82
Beam No. 83 84
10
9 El Recorded Test Data El FEM Results
8 -E 7 E -c 6 0 :;::: u
5 Cl) :;::: Cl)
0 4 ... Cl)
't1 ... 3 (]
2
0
81 82 83 84 Beam No.
Figure 5.19. Mmdmum Reinforcing Steel Stresses and Girder Deflections at Midspan Before Rehabilitation (Static Load Position 1, Average, East Gage).
83

100 lll!I Recorded Test Data
90 a FEM Results - BO m Q. ~ - 70 Ill Ill 2? 60 -UJ "ii 50 .!! "' m 40 c u ... 30 0 -c "ii 20 a:
10
0 81 82
Beam No. 83 84
10
ID Recorded Test Data 9 a FEM Results 8 -E 7 E -c 6 0
~ 5 ..!!! -CD
0 4 ... CD
"tJ 3 ... a 2
0
81 82 83 84 Beam No.
Figure 5.20. Ma\.imum Reinforcing Steel Stresses and Girder Deflections at Midspan Before Rehabilitation (Static Load Position 2).
84

100
90 rn Recorded Test Data la FEM Results
m- 80 Q. :!: - 70 II) II)
!! 60 -(/)
"ii 50 G) -(/)
0) 40 c ·c; ... 30 0 -c 'i 20 a:
10
0 81 82
Beam No. 83 84
10
9 IITl Recorded Test Data
la FEM Results 8 -E 7 E -c 6 0
:;:; u
5 G) ;;:: G)
c 4 ... G)
'U ... 3 8
2
0
81 82 83 84 Beam No.
Figure 5.21. Maximum Reinforcing Steel Stresses and Girder Deflections at Midspan Before Rehabilitation (Static Load Position 3).
85

100
13 Recorded Test Data 90
El FEM Results -cu Cl. 80 :!: - 70 U) fl) Cl> .. 60 -(/) 4i 50 Q) -(/)
en 40 c ·c; .. 30 0 -c "i 20 a:
10
0 81 82
Beam No. 83 84
10
9 8 .Recorded Test Data I El FEM Results
8 -E 7 E -c 6 0 :u 5 Cl>
:;::: Cl> c 4 ... GI
~ 3 c; 2
1
0 81 82 83 84
Beam No.
Figure 5.22. Maximum Reinforcing Steel Stresses and Girder Deflections at Midspan Before Rehabilitation (Static Load Position 4).
86

100
90 m Recorded Test Data
El FEM Results -l'il D. 80 :ii - 70 en Cl) e 60 -ti) "i 50 Cl> -U> m 40 c ·u ... 30 0 -c 4i 20 a:
10
0 81 82 83 84
Beam No.
10
9 m Recorded Test Data
El FEM Results 8
e 7 E -c 6 0 n
5 Cl> :;::
Cl> 0 4 ... CD 'E 3 a
2
0
81 82 83 84 Beam No.
Figure 5.23. Maximum Reinforcing Steel Stresses and Girder Deflections at Midspan After Rehabilitation (Static Load Position I) (Avg. East Gage).
87

100
90 El Recorded Test Data El FEM Results
m-c. 80 ~ - 70 (I) (I)
!! 60 -en "i 50 QI -en tJ) 40 c u ... 30 0 -c ·a; 20 a:
10
0 81 82
Beam No. 83 84
10 El Recorded Test Data
9 El FEM Results
8 -E 7 E -c 6 0 :;; ()
5 QI :;: QI c ... 4 Q)
"'CJ 3 ... cs
2
0
81 82 83 84 Beam No.
Figure 5.24. Maximum Reinforcing Steel Stresses and Girder Deflections· at Midspan After Rehabilitation (Static Load Position 2).
88

100 El Recorded Test Data
90 El FEM Results
ti c. 80 :E - 70 !II !II ~ 60 -(/)
"i 50 G) -(/)
O> 40 c ·u .... 30 0 -c "G> 20 a:
10
0 81 82
Beam No. 83 84
10
9 El Recorded Test Data El FEM Results
8 -E 7 E -c 6 0 ;:: u 5 G)
;;:: G> c .... 4 G)
"'C 3 .... a
2
0
81 82 83 84 Beam No.
Figure 5.25. Ma\'.imum Reinforcing Steel Stresses and Girder Deflections at Midspan After Rehabilitation (Static Load Position 3).
89

100 li!I Recorded Test Data
90 El FEM Results - 80 Ill
D.. :!!: - 70 !I) !I)
! 60 -ti) ... 50 Q> -(/)
m 40 c u ... 30 0 -c ·a; 20 a:
10
0 81 82
Beam No. 83 84
10
9 lliil Recorded Test Data
El FEM Results 8 -E 7 E -c 6 0
:;:: u
5 Cl) ;:
Cl)
c 4 ... Q>
"tJ 3 ... (;
2
0
81 82 83 84 Beam No.
Figure 5.26. Maximum Reinforcing Steel Stresses and Girder Deflections at Midspan After Rehabilitation (Static Load Position 4)
90

60
(i" 50 CL.
== -0 40 0
! -(/J
"i Cl) -(/J
30
m c .E 20
~ ·a; 10 a:
0
60
(i" 50 CL. :: -f/j
40 0 1!! Ci) "i Cl) -(/J
30
m c
20 ·e .s c 'Ci)
10 a:
0
Bt 82 Beam No.
ml Recorded Test Data
El FEM Results
B4
Figure 5.27. Ma\'.imum CFRP Stresses at Midspan for Each Beam. (Load Position 2).
8 Recorded Test Data
13 FEM Results
B1 B2 Beam No.
B4
Figure 5.28. Maximum CFRP Stresses at Midspan for Each Beam (Load Position 3).
91

Parametric Study
The effect of changing the CFRP cross sectional area and modulus of elasticity on the
maximum midspan deflection and reinforcing steel stresses of girder B3 was investigated for both the
dynamic and static field loading conditions. Increasing the value of either CFRP parameter reduces
both the reinforcing steel stresses and girder deflections for the dynamic load case, as illustrated in
Figure 5.29 and Figure 5.30, respectively. These observations are attributed to the downward shifting
of the neutral axis (for the decrease in reinforcing steel stresses) and the increase in the flexural
rigidity, EI (for the decrease in girder deflections).
Table 5.2. Comparison Between Maximum Midspan Stresses (MPa) in CFRP Obtained from Recorded Test Data and the FEM Analysis.
Static load Bl B2 B4 Average Position difference
Test FEM Test FEM Test FEM (%)
1 44.5 43.4 51.9 51.5 21.5 19.4 4.5
2 41.3 38.3 50.3 50.6 26.0 22.2 6.7
3 21.4 20.1 40.7 40.4 46.9 41.0 6.5
4 25.5 23.3 42.4 42.6 41.7 36.6 6.8
Figure 5.31 summarizes the effect of increasing the CFRP cross sectional area on reducing
both the maximum girder deflection and reinforcing steel stresses for the dynamic load case.
Increasing the CFRP cross sectional area can reduce the maximum girder deflection by as much as
22%, and reduce the maximum reinforcing steel stress by as much as 20%, as illustrated in Figure
5.31.
The effect of varying the modulus of elasticity of the CFRP on the dynamic girder deflections
and steel reinforcing bar stresses is illustrated in Figure 5.32. It can be concluded that the bonding of
the CFRP plates has a significant effect on enhancing the girder performance even for plates with a
relatively low modulus of elasticity. However girders repaired with a higher strength material will
92

exhibit a higher ultimate flexural capacity. The decrease in the maximum girder deflection could be as
high as 16% for CFRP plates having a modulus of elasticity of 150,000 MPa.
The parametric study was expanded in the static loading cases to include all four bridge
girders. Figure 5.33 illustrates the effect of varying the CFRP cross sectional area on the average
change in maximum static girder deflections and reinforcing steel stresses at midspan. From this figure
it is apparent that, increasing the CFRP cross sectional area has a significant effect on reducing both
girder deflections and reinforcing stresses. It is also evident from Figure 5.33 that the relation
between the CFRP cross sectional area and the percentage of change for both girder deflections and
reinforcing steel stresses is nearly linear.
The effect of varying the modulus of elasticity of the CFRP bottom plate for all four girders
was also studied. Figure 5.34 illustrates the effect of varying the CFRP modulus of elasticity on the
average change in maximum static girder deflections and reinforcing steel stresses at mid span. This
figure clearly shows that the higher the CFRP modulus of elasticity, the greater is the decrease in both
girder deflections and reinforcing steel stresses. Bonding of the CFRP laminates enhances the concrete
tension zone confinement as well as the girder flexural stiffness regardless of its modulus. These
results also indicate that girders repaired with CFRP having a low modulus of elasticity will still
exhibit a significant reduction in girder deflection and reinforcing steel stresses at the service load
stage. However, at the ultimate load stage, the CFRP tensile strength is the critical parameter
controlling the increase in capacity. For example, if the bridge were repaired by bonding GFRP plates
(E=23.7 GPa) to the bottom of the girders instead of CFRP plates, approximately an 8% reduction in
both reinforcing steel stresses and girder deflections would have been achieved at the service load
level. However the ultimate capacity of the bridge would have been increased only 7% using GFRP
bottom plates instead of the 20% increase realized for the CFRP bottom plates.
93

---without CFRP s .J----+---+----+---t---#-TirJ.iti-...,-i --Af=338 mm2
0.0
used in the repair work
0.1 0.2 0.3 0.4 0.5
Time (second)
Figure 5.29. Midspan Deflection Time Histories for Girder B3 for Different CFRP Cross Sectional Areas.
94
• Af=1290 mm2
0.6 0.7 0.8

--without CFRP 8 ...l----1----l-----1f----+-~~iW-::-+--I • Ef=24 GPa
--Ef=121 GPa
"E' used in the E repair work -c 0 4J_~~--l~~~-l-~~-J..~~~-1-~~~+-~-1--1~~~-1-~~---1
~ Cl> c
0.0 0.1 0.2 0.3 0.4 0.5
Time (second)
Figure 5.30. Midspan Deflection Time Histories for Girder B3 with Different CFRP Modulii of Elasticity.
95
0.6 0.7 0.8

24
22
8
6
24
22
~20 -c .Q 18 0 ! 16 ~ .514
Cl) Cll ! 12 (,)
~ 10
8
6
-:--.--
""' ~ '
....... ~
----L...----
l...---"""-
~ ~ __...
~~ l...---"""
CFRP area used in the repair work
-~
---____.
CFRP area used in the repair work
300 400 500 600 700 800 900 1000 1100 1200 1300
CFRP Cross Sectional Area (mm2)
Figure 5.31. Effect of the CFRP Cross Sectional Area on Reduction of Maximum Girder Deflection and Maximum Stress in Reinforcing Steel (Girder B3).
96

18
16
Ci Q.
~14 Ill Ill e .... (/) 12 .5 CD Cl)
at l! 10 ~ c
8
6
18
16 -~ ...... c .214 g -~ 12 .E
8
6
20000
-----l--7 ..-
-~ ~ - I ----
CFRPmodulus used in the repair work
~
J I
CFRP modulus used in the repair work
40000 60000 80000 100000 120000 140000 160000
CFRP Modulus of Elasticity (MPa)
Figure 5.32. Effect of the CFRP Modulus of Elasticity on Reduction of Maximum Girder Deflection and Ma,~imum Stress in Reinforcing Steel (Girder B3).
97
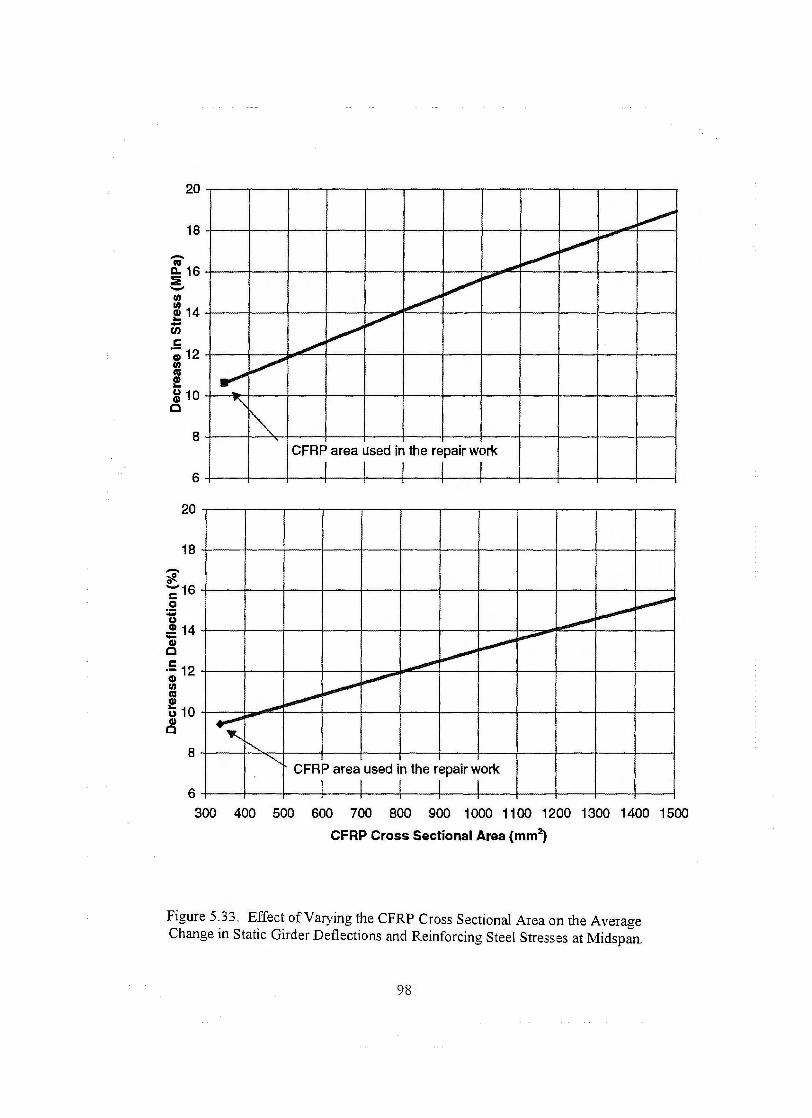
20
18
8
6
20
18
--;fl. 'C'16 0
~ ..!? 14 Gi c c ·-12 5l ca Q)
t 10 ~
8
6
---~ ~
,.,,,.,....
~ _....
~ ......
~
~ V"
_,,,,-
...---L-/
" ~ '
CFRP area used in the repair work
I I I I I
l,.....--" l----" L....--
i.......-- i..----
l.----'" .__,,,,,,..
~ ,,,,,,,,---
~ ~
~ -)'--..
........_ CFRP area used in the repair work
I I I I I I
300 400 500 600 700 BOO 900 1000 1100 1200 1300 1400 1500
CFRP Cross Sectional Area (mm2)
Figure 5.33. Effect of Varying the CFRP Cross Sectional Area on the Average Change in Static Girder Deflections and Reinforcing Steel Stresses at Midspan.
98

14
13
'i'12 c.. :& -en 11 en
-__. ! -en 10 £ CD en 9 C\'S ! (,)
~. Ill"""'"'
~ l
~ ,,,,,,,.,,--
I ~
____.,,,... ,,,,_,... CFRPmodulus used in the repair work
Q) c 8
7
6
14
13
-~12 c 0 g 11
;:::
~ 10 .5 - ----CD 9 in C\'S ! (,) 8 ~
-- " - / -
CFRP modulus used in the repair work
7
6 20000 40000 60000 80000 100000 120000 140000 160000
CFRP Modulus of Elasticity (MPa)
Figure 5.34. Effect of Varying the CFRP Modulus of Elasticity on the Average Change in Static Girder Deflections and Reinforcing Steel Stresses at Midspan.
99

SECTION ANALYSIS
A section analysis was conducted to study the effect of bonding the FRP laminates to the
girders on enhancing the ultimate load capacity of the bridge. The analysis was performed using
strain compatibility and equilibrium equations. The details of the section analysis procedure are
presented in Appendix A. The concrete girders were analyzed as T-sections, having an effective
flange width determined in accordance of ACI 318-95 (ACI 1995) criteria. The total tensile steel
reinforcement for the rehabilitated girders consisted of two layers of No. 11 bars (i.e. 3 bars in each
layer) and the CFRP plate bonded to the bottom of the girder. The GFRP side plates were not
considered in this calculation. It was determined that the CFRP plates would attain their ultimate
strain before the concrete strain in the extreme compression fiber of the girders attained its ultimate
strain (0.003). This mode of failure is referred to as steel yield-FRP rupture.
In this mode of failure, when the FRP ruptures, the girder ultimate capacity will drop to its
virgin strength (i.e. without the FRP laminates) corresponding to the current strain field, and continue
to deform until failure is precipitated by crushing of concrete. To calculate the concrete stress at any
stage below the ultimate condition, a non linear constitutive concrete model (a modified Hognestad
formulation) was used as shown in Figure 5.35. A computer program was developed to calculate the
ultimate load capacity for both rectangular and T-sections repaired with FRP plates.
Effect of CFRP Cross Sectional Area on Girder Ultimate Strength
The effect of varying the CFRP cross sectional area on the bridge ultimate capacity was
investigated using the previously defined section analysis method. This was achieved by analyzing
each individual girder with an effective flange width determined in accordance AC! 318-95 (ACI
1995), and assuming that premature failure due to CFRP laminate separation at the ends of the girder
would not occur. It was determined that increasing the CFRP plate cross sectional area not only
100

affects the girder ultimate strength but the mode of failure as well.
Table 5.3 summaries the effect of varying the CFRP cross sectional area on the ultimate
flexural strength and the mode of failure of the girder. It can be concluded that, increasing the CFRP
cross sectional area increases the ultimate strength in a linear fashion as illustrated in Figure 5.36. For
example, if the CFRP cross sectional area used in the repair work was increased by 400 percent, the
ultimate capacity would have increased by 100 percent. Beyond the threshold where the concrete
crushing-steel yield mode of failure controls, the rate of increase in the ultimate strength decreases
because the CFRP stress has been maximized at its tensile strength.
The mode of failure for the subject bridge, at it was repaired, is expected to be the steel yield
FRP rupture mode as shown in Table 5.3. At the failure load, the CFRP will rupture and the bridge
will abruptly return to its original virgin (unrepaired) strength. Thicker plates tend to move the neutral
axis of the girder downward and decrease the CFRP strain at failure, indicating that the CFRP will not
attain its tensile strength. In this case failure will occur with the steel reinforcement yielding and
subsequent crushing of the concrete (tension failure). Both the FRP rupture and tension failure modes
are ductile and will exhibit significant deformation before collapse. If the CFRP cross sectional area is
increased further, the steel reinforcement will not yield and failure will be controlled by concrete
crushing in the compression zone (compression failure). This type of failure is highly undesirable, but
is unlike to occur in girder T-sections with wide flanges because the area of the CFRP required to
balance the compression force would have to be extremely large. However, for rectangular sections or
T-sections with narrow flanges, this type of failure may be encountered, especially in sections with
high steel reinforcement ratios.
Effect of CFRP Tensile Strength on the Ultimate Strength of The Girder
The CFRP bottom plate tensile strength affects the ultimate capacity of the bridge whenever
101

J:? 0 ! -(/)
.! e u c 8
c
fc·= 0.90 fc' ········-··--··----- ....... • ... • . • ........ • . t 0.15 fc"
Linear
fen ea = 1.8 f c"IEc I
~/ : £c
~ ~ Concrete strain e
(a) Constitutive model
b 0
ac=k2 c Cc
d
As Ts •
A1 Ct T1
(b) Section analysis
Figure 5.35. Modified Hognestad Concrete Stress-Strain Curve used in the Sectional Analysis Computer Program.
102

2000
1800
1600
'CU' 1400 Q. :E -.s:: -g> 1200 ! -fl) .s! ·c;; 1000 c ~ Q. a: ~ 800
600
400
200 0
I
I
I
I
I
• I . •
I
I
-• Valu es use<
:/ I ~
I
I
J • •
I I
I
I
• I I
/ I
I
• IJ/ v •
H
I I I J
.v ._
.V \ v \ in the repair· vork
~
7 Conrete Crushes
/
/ v
v
---CFRP Tensile Strength
CFRP Cross Sectional Area
I
,_
3600
3200
2800
tr
2400 ~ -ca
~ 2000 cu
c
i 1600 fl)
0 0 e 0
1200 ~
800
400
0
LL 0
20 40 60 80 100 120 140 160 180 200
Ultimate Capacity Enhancement Percentage (%)
Figure 5.36. Effect of CFRP Cross Sectional Area and Elastic Modulus on Enhancement Percentage of Girder Ultimate Capacity.
103

the FRP rupture mode of failure controls. In this case the modulus of elasticity of the plate will have no
effect on the ultimate capacity. However, it affects the girder stiffness, reinforcing steel strains and
girder deflections. On the other hand, if the steel yield-concrete crush mode of failure controls, the
CFRP modulus of elasticity will have an effect on the girder ultimate capacity. The tensile strength of
the CFRP plate will have no effect on the girder ultimate capacity as long as the plate does not rupture.
However, as previously discussed, for most standard T-sections the FRP mode of failure will
dominate, therefore FRP tensile strength is an important consideration when calculating the girder
ultimate strength.
Table 5 .4 illustrates the effect of CFRP tensile strength on the girder ultimate flexural strength.
It is obvious that increasing the CFRP tensile strength increases the girder ultimate capacity in an
almost linear trend. In all cases investigated, the neutral axis lies within the slab thickness, therefore
the CFRP reaches its ultimate tensile strain while the concrete strain remains well below its ultimate
strain Ecu (0.003).
Design Charts
For any future repair work, the amount of the FRP required to upgrade a structure to a certain
pre-specified capacity can be difficult to calculate. This difficulty is attributed to the fact that the
enhanced capacity of the repaired structure depends on many factors such as concrete strength, steel
reinforcement ratio and grade, FRP cross sectional area, FRP modulus of elasticity and FRP tensile
strength. Also, a trial and adjustment (iterative) procedure is required to achieve a solution. The
process can be simplified by using appropriate design charts. A computer program has been
developed to calculate the ultimate flexural strength and mode of failure for both rectangular and T- ·
section girders for any given concrete strength, steel reinforcement ratio and FRP cross sectional area
and material characteristics. Using this computer program, design charts similar to that shown in
Figure 5.37 may be generated.
104

Table 5.3. Effect of CFRP Cross Sectional Area on Ultimate Flexural Strength of Girder
Area of Concrete Ultimate % increase in CFRP strain moment ultimate Mode of Failure mm2 at failure Kn.m strength
0 0.0030 1215 NIA Steel Yield-Concrete Crushes
347* 0.0015 1454 20 Steel Yield-FRP Rupture
500 0.0016 1566 29 Steel Yield-FRP Rupture
1000 0.0019 1922 58 Steel Yield-FRP Rupture
1500 0.0021 2263 86 Steel Yield-FRP Rupture
2000 0.0023 2605 114 Steel Yield-FRP Rupture
2500 0.0026 2936 142 Steel Yield-FRP Rupture
3000 0.0030 3225 165 Steel Yield-Concrete Crushes
3500 0.0030 3446 183 Steel Yielq-Concrete Crushes
** CFRP ultimate strength used in the bridge repair
Table 5.4. Effect of CFRP Tensile Strength on Ultimate Flexural Strength of Girder
CFRP Concrete Ultimate % increase in ultimate strain moment ultimate
Mode of Failure strength at failure Kn.m strength (MPA)
0 0.0030 1215 NIA Steel Yield-Concrete Crushes
500 0.0014 1300 7 Steel Yield-FRP Rupture
1000 0.0015 1415 16 Steel Yield-FRP Rupture
1194** 0.0015 1454 20 Steel Yield-FRP Rupture
1500 0.0016 1518 25 Steel Yield-FRP Rupture
2000 0.0017 1623 34 Steel Yield-FRP Rupture
** CFRP ultimate strength used in the bridge repair
105

In the analysis, the compression reinforcement was ignored and the ratio of the FRP depth (df)
to the reinforcing steel depth ( d) was set fixed at 1.2. Such design charts must be constructed for each
type of FRP considered for use. To use the chart, simply locate the point corresponding to the given
steel reinforcement ratio (p) and the required girder moment capacity (Mu). Read from the chart the
required FRP ratio (pf), from which the required cross sectional area of FRP is determined from the
expression:
(5.5)
It should be noted that, if the point selected for the given and required Mu does not fall within
the family of curves presented on the chart, it is an indication that a different type of FRP (i.e.
different tensile strength and/or elastic modulus) must be selected. These charts can be used for the
repair of existing girders or for the design of new beams with bonded FRP laminates.
CONCLUSIONS
The bridge was analyzed through a comprehensive series of three-dimensional FEM analyses.
Both static and dynamic FEM analyses were conducted in an attempt to replicate the field load tests
described in Chapters 3 and 4. The FEM analyses were then extended to evaluate the effects of a
variety of parameters contributing to the structural response of FRP repaired bridges. An analytical
section analysis procedure was also conducted to study the effects of bonding the FRP laminates to the
bridge girders on enhancing the ultimate load capacity of the bridge.
The correlation of the FEM analysis results with the results of the field load tests was
excellent. Comparisons of midspan girder deflections and rebar stresses simulated by the FEM
analyses with those obtained from the field load tests were within 5% for almost all cases investigated,
both static and dynamic. Comparisons of field measured stresses in the CFRP laminates at midspan
with those predicted by the FEM analyses exhibited only slight differences, ranging from 4.5% to
6.8%. Moreover, the fundamental period of vibration for the bridge predicted from the FEM frequency
106

analysis was within 2% of that measured from the midspan girder deflection time history recorded in
the dynamic field load tests.
Having established the veracity of the FEM model, a parametric study was then conducted to
evaluate the effects of varying the CFRP cross sectional area, modulus of elasticity and tensile strength
on the structural response of the bridge. Results of the study indicated that increasing the CFRP cross
sectional area could reduce the maximum girder deflections and reinforcing steel stresses by as much
as 22% and 20%, respectively. The results also indicated that increasing the modulus of elasticity of
the CFRP plates could reduce the girder deflections by as much as 16%. It was also concluded that the
tensile strength of the CFRP plates significantly affected the ultimate load capacity of the bridge
structure, but had very little influence on the bridge response at the service load stage.
A section analysis procedure was developed using strain compatibility and equilibrium
equations. This procedure provides a convenient method for determining the ultimate strength of
bridge girders repaired with. FRP laminates. From this procedure a specified level of strength
enhancement can be decided in terms of CFRP cross sectional area, modulus of elasticity and tensile
strength. The section analyses procedure has been computerized to afford the development of design
aids for specific case studies.
107

fy= 414 MPa fc'=25 MPa Et=120000 MPa Etu=0.01 dtld= 1.2
FRP-rupture
p =Q.004
0.05 _j__,____,____._--+___._..__.....__-+-_,___..___,_--t-'----'---'--t---'---'----'--j
0.000 0.002
As=pbd
At= Pt b d
0.004 0.006 0.008
FRP Ratio (p1)
Figure 5.37. Typical Design Chart for Girders Strengthened with CFRP.
108
0.010

CHAPTER SIX BRIDGE INSPECTION AND MONITORING
The bridge structure selected for rehabilitation was visually inspected for evidence of structural
distress and deterioration prior to application of the FRP laminates. The girders were examined closely
with hand held lights powered by an electric generator. All cracks were outlined with a black
permanent marker and their locations relative to the east support were recorded. Photographs were
taken of typical crack patterns in the girders.
After FRP application, the girders were inspected to detect the presence of voids in the bond
between the FRP and the concrete. Each void was outlined on the FRP plates with a black permanent
marker. The FRP was thereafter inspected periodically to determine if the void spaces were increasing
in either size or number.
INITIAL CONDITION OF CONCRETE BRIDGE GIRDERS
Prior to FRP application, the four concrete bridge girders exhibited a similar pattern of
cracking as illustrated by the sketch in Figure 6.1. The primarily vertical cracks were typically located
in the central three-fourths of the span at a horizontal spacing of approximately 140 mm between
cracks. There was an average of 46 cracks in each girder. The maximum number of cracks in a girder
was 54, found in girder 4. The minimum number of cracks was 41, found in girder 2. Photographs of
typical crack patterns are shown in Figure 6.2.
CONDITION OF GIRDERS IMMEDIATELY FOLLOWING APPLICATION OF FRP
After the FRP was applied, the girders were inspected to determine how well the FRP bonded
to the concrete. This inspection was carried out by tapping the surface of the FRP plates with a hard
object such as a coin. A change in pitch in the sound of the tapping indicated the presence of a void.
The entire surface of each FRP plate was inspected in this manner, and the shape of each void
outlined.
109

BRIDGE CROSS SECTION
~ W L_gj /LJ-A C ~B
ELEV A TIDN OF GIRDER 1
c,.. --·l:J ..------ 9.4 M
SURFACES OF GIRDER 1 2350 MM 2350 MM 2350 MM 2350 MM
I I
! I I I { 1
I j I (' I ' I \' I f ) I I I
I ( I
I l I I I \
I I )
\ II I
( I I I ~ '( (
\ i I
Figure 6. 1. Sketch of Crack Pattern in Typical Girder Prior to FRP Application
110
A
B
c

Figure 6.2. Typical Crack Patterns in Concrete Girders Prior to FRP Application
l l l

Figure 6.3 through Figure 6.6 show examples of voids found beneath the GFRP plates bonded to the
sides of the girders. The instance of best adherence of the GFRP to the concrete was noted on the
north face of girder 2. The voids were distributed uniformly over the span. In the eastern half of the
same girder, a total area of 76,800 mm2 of voids were measured. An area of 4% of the total northern
surface of girder 2 did not bond.
The instance of worst adherence of the GFRP to the concrete was noted on the north face of
girder 4. The voids were distributed uniformly over the span. A total area of 322,300 mm2 of void
space was measured in the western half of the beam. An area of 18% of the total northern surface of
girder 4 did not bond. The largest single void found beneath any GFRP surface was on the northern
face of girder 4. This void covered an area of 48,400 mm2.
Figure 6.7 through Figure 6.9 show examples of the voids found beneath the CFRP plates. The
CFRP plates appeared to bond to the concrete better than the GFRP plates. The largest percentage of
unbonded CFRP surface area was 4%, which was found on girder 2. The largest void, shown in Figure
6.10, was found on girder 4. This void covered an area of approximately 28,800 mm2•
RESULTS OF PERIODIC INSPECTIONS
The bridge girders were inspected at periodic intervals after the completion of the field work in
an attempt to assess the durability of the bond between the FRP and the concrete girders. The bond
was inspected in the manner described in the previous section to detect the presence of any new voids
and to determine if the voids previously identified had grown. At a period of 16 months after the FRP
was installed, no new voids had been detected and the sizes of the previously identified voids remain
constant. Therefore, to the present time, it is concluded that the void spaces are due to the failure of
the adhesive to bond the FRP to the concrete at the time of installation. This condition can be
attributed to several factors, such as impurities on the FRP or concrete surfaces, the presences of
uneven areas and ridges on the girder surfaces, and uneven application of the adhesive to the FRP
plates.
112

Figure Ci3. Voids Under GFRP at East End or Girder 2 - North Face
Figure 6.4. Voids Under GFRP at East End or Girder 2 - South Face
I 13

Figure <> .5 Voids Under GFR.P at West End or Girder 4 - North Face
Figure G.6. Voids Under GFRP at West End of Girder 4 - South Face
114

Figure 6.7. Voids Under CFRP at West End of Girder I
Figure 6.8. Voids Under CFRP at West End of Girder 2
1 15

Figure 6.9. Voids Under CFRP at East End of Girder 4
Figure 6.10. Largest Void Found Under CFRP
l 16

CONCLUSIONS
CHAPTER SEVEN CONCLUSIONS AND RECOMMENDATIONS
The results of the field study to investigate the effects of externally bonded FRP composite plates
on the structural performance of a reinforced concrete bridge were presented. Based on the experience
gained from applying the FRP plates and from analysis of the static and dynamic load tests data, the
following conclusions are presented:
1. Application of FRP plates to concrete bridge girders was successfully performed using a simple
and straightforward process. The only specialized equipment required, beyond normal bridge
maintenance equipment and tools, was a vacuum pump for maintaining constant pressure to the
plates during the curing period of the adhesive.
2. Application of the FRP plates produced significant reductions in the reinforcing bar stresses and
vertical midspan deflections of the girders. Reductions of reinforcing bar stresses ranged from
4% to 12% for the static tests and from 4% to 9% for the dynamic tests. Girder deflection
reductions ranged from 2% to 12 % for the static tests, and from 7% to 12% for the dynamic tests.
These reductions indicate that the FRP plates were behaving as an effective component of the
girder cross sections.
3. A classical calculation of the cracked-section moment of inertia of the girder cross sections
indicated that application of the FRP plates increased the girder moment of inertia by
approximately 5%. Since the reductions in stresses and deflections resulting from the FRP repair
were generally greater than 5% more advanced cross sectional analysis procedures are necessary
to accurately account for the beneficial effects of FRP repairs.
4. The reductions in reinforcing bar stresses and girder deflections were noticeably greater for the
three girders repaired with GFRP side plates as compared to the one girder without the side
117

plates. This suggests that lower cost GFRP side plates might be used to add stiffness to the girder
cross sections, while more expensive CFRP plates be attached to girder bottom surfaces to
increase the load capacity.
5. The strain recorded on the splice plate between primary FRP plates indicates that the composite
splice design is an effective mean to transfer stress between plates of primary reinforcing.
The results of a comprehensive, three-dimensional FEM analysis of the bridge were also
presented. Comparisons of the FEM results with the field load tests data have verified the
accuracy of the analyses. The FEM analyses were therefore extended to include a parametric
study for the purpose of evaluating the effects of varying the CFRP cross sectional area, modulus
of elasticity and tensile strength on the structural response of the bridge. Based on the results of
the parametric study, the following additional conclusions are presented:
6. There is a linear relationship between increasing the cross sectional area of the CFRP plates and
the corresponding decrease in both maximum girder deflections and maximum stresses in the
reinforcing steel. Decreases of 22% and 20% respectively, for the maximum girder deflections
and maximum reinforcing steel stresses are possible.
7. The modulus of elasticity of the CFRP plates also has an effect on the bridge structural response
similar to that observed for the cross sectional area, but to a lesser degree.
8. At the service load stage, bridge structural response is relatively insensitive to CFRP tensile
strength. However, at the ultimate load stage, the CFRP tensile strength is the critical parameter
affecting increased load capacity.
9. Finally, an analytical section analysis procedure was developed based upon equilibrium and strain
compatibility. The details of the procedure, presented in Appendix A, were subsequently
incorporated into a computer program capable of calculating the ultimate load capacity for both
rectangular and T-sections repaired with FRP plates. The computer program has the feature of
118

generating design aids for user specified bridge cases requiring strength enhancement.
RECOMMENDATIONS
A procedure for repairing deteriorated or distressed reinforced concrete bridges has been
developed. A methodology based on fundamental engineering principles to evaluate the strength
enhancement provided by the repair procedure has also been developed. Based upon these
developments, a strategy for rehabilitating deteriorated and/or structurally deficient reinforced concrete
highway bridges is recommended as follows:
1. From the ALDOT inventory of state and county bridges, identify all reinforced concrete bridges
that would be suitable candidates for the devel_oped repair procedure.
2. Conduct an on-site inspection of the candidate bridges to confirm their suitability for the repair
procedure.
3. Select a small number of these bridges for repair (approximately 5).
4. Design a repair methodology for each bridge from the procedures developed in this report.
5. Train ALDOT maintenance personnel in implementation of the repair procedure.
6. Implement the repairs to the candidate bridges.
7. Monitor the performance of the repaired bridges by monthly inspections for a two-year
probationary period.
119

REFERENCES
Automatic Dynamic Incremental Nonlinear Analysis (ADINA). (1990). Report ARD 90-1. ADINA R & D, Inc. Watertown, MA.
American Concrete Institute (ACI). (1995). Building Code Requirements for Reinforced Concrete. Detroit, ML
An, W., Saadatmanesh, H. and Ehsani, M.R. (1991). "RC Beams Strengthened with FRP Plates. II: Analysis and Parametric Study." Journal of Structural Engineering, ASCE, 117 (11), pp. 3434-3455
"
Bathe, K.J. (1996). Finite Element Procedures. Prentice Hall, Inc. Englewood Cliffs, NJ.
Chajes, M.J., Thomson, Januszka, T.F. and Finch, W.W. (1994). "Flexural Strengthening of Concrete Beams Using Externally Bonded Composite." Construction and Building Materials, 8(3), pp. 191-201.
Chajes, M.J., Januszka, T.F., Mertz, D.R., Thomson, T.A. and Finch, W.W. (1995). "Shear Strengthening of Reinforced Concrete Beams Using Externally Applied Composite Fabrics." ACI Structural Journal, 92 (3), pp. 295-302.
Ghaleb, B.M. (1992). Strengthening of Damaged Reinforced Concrete Beams by External Fiber Glass Plates, Thesis, King Fahd University of Petroleum and Minerals, Saudi Arabia.
Hefferman, P.J. (1994). Behavior of Reinforced Concrete Beams Strengthened with CFRP Sheets, Thesis, Royal Military College of Canada, Canada.
Kobayashi, A., Endoh, M., Kuroda, H. and Kliger, H. (1995). "Use of Carbon Fiber Tow Sheet Reinforcement for Improved Bridge Capacity Rating in Japan." International SAMPE Symposium, May 8-11, pp. 513-521.
Meir, U. and Kaiser, H. (1991). "Strengthening Structures with CFRP Laminates." Proceedings of Advanced Composite Materials in Civil Engineering Structures, ASCE, Las /Vegas, Nevada, pp. 224-232.
Meir, U. and Deuring, M. (1992). "Strengthening of Structures with CFRP Laminates." Advanced Composite Materials in Bridges and Structures. Canadian Society for Civil Engineering, pp. 243-251.
Meir, U. (1992). "Carbon Fiber Reinforced Polymers: Modern Materials in Bridge Engineering." Stryctyrak /engineering International, International Association for Bridge and Structural Engineering, Switzerland, pp. 7-11.
Nanni, A. (1995). "Concrete Repair with Externally Bonded FRP Reinforcement." Concrete International, June, pp. 22-26.
Plevris, N. and Triantafillou, T.C. (1994). "Time Dependent Behavior of RC Members Strengthened with FRP Laminates." Journal of Structural Engineering, ASCE, 120(3), pp. 1016-1039.
120

Qu, R. (1994). "Theoretical Analysis of Reinforced and Prestressed Concrete Bridge Members Strengthened with FRP Laminates." Thesis, Florida Atlantic University, Florida.
Raghavachary, S. (1995). Experimental Studies on Flexural Behavior of CFRP Retro fired Concrete Members, Thesis, Florida Atlantic University, Florida.
Ritchie, P.A. (1988). External Reinforcement of Concrete Beams Using Fiber Reinforced Plastic, Thesis, Leigh University.
Ross, C.A., Jerome, D.M. and Hughes, M.L. (1994). Hardening and Rehabilitation of Concrete Structures Using Carbon Fiber Reinforced Plastics (CFRP), Final Report, Wright Laboratory Armament Directorate, Eglin Air Force Base, Florida.
Rostasy, F., Hankers, C. and Ranisch, E. (1992). "Strengthening of RC and PC Structures With Bonded FRP Plates," Proceedings of the First International Conference on Advanced Composite Materials in Bridges and Structures, Sherbrooke, pp. 253-263.
Saadatmanesh, H. and Ehsani, M.R. (1990). "Fiber Composite Plates Can Strengthen Beams," Concrete International, March, pp. 65-71.
Saadatmanesh, H. and Ehsani, M.R. (1991). "RC Beams Strengthened with GFRP Plates, I: Experimental Study," Journal of Structural Engineering, ASCE, 117 (11), pp. 3417-3433.
Triantafillou, T.C. and Plevris, N. (1992). "Strengthening of RC Beams with Epoxy Bonded Fibre Composite Materials," Materials and Structures, 25(1), pp. 201-211.
Ziraba, Y.N. (1993). Non-Linear Finite Element Analysis of Reinforced Concrete Beams Repaired by Plate Bonding, Dissertation, King Fahd University of Petroleum and Minerals, Saudi Arabia.
121

APPENDICES
122

APPENDIX A
Flanged sections are often encountered in reinforced concrete bridge structures. Generally, the
neutral axis at the ultimate state falls within the slab (flanges), and therefore the T-section may be
analyzed as a rectangular section having a compression face width equal to the flange width b, as
illustrated in Figure A.1. However, for sections reinforced with FRP plates, at the ultimate stage, the
FRP strain in a T-section usually approaches its ultimate strain eru before the concrete in compression
zone attains its ultimate strain (0.003). Therefore, the usual rectangular stress block cannot be used
and the calculation of the concrete compression force is performed by integrating nonlinear the
concrete stress distribution over the compressed area. Such calculations are tedious and complicated,
therefore a methodology for calculating the ultimate section capacity was developed using the concrete
model shown in Figure 5.34.
By dividing the compression zone into twenty equal segments and evaluating the concrete
compressive stress (fen) at the mid point of each segment in accordance with the corresponding
concrete strain e, the total resultant concrete compressive force Cc and its location (k2 c) are determined
by the
following equations
n=20
c e = I: fen b de = a e fc' ..................................... A.l n=l
where
n=20 n=20
L f en de L f en / ~ n=l n=l ...................... A.2 =
I f c C
123

8
f~ Af Et< Etu
.. b ..
a}neutral axis within the flange (tension failure}
b)neutral axis within the flange (FRP rupture)
f d
At .. b ..
c}neutral axis outside the flange (tension failure}
8
d f d)neutral axis outside the flange (FRP rupture)
Figure A.1. Neutral Axis Position for T-Sections.
124

Noting that
if E h f, = fc" ( 2 E - ( E )2 ] :S E0
t en .... en .. . . . ......... .. .. .. ........... . A.3a Eo Eo
if E >- €0
then ...... fcn = f/ [ 1 -0-0-0-~-·;-""'-_ -t:::- ( E E 0 ) ]
where
1.8 fell C II I C E
0= Ee , de=
20, fc =0.9fc, yn=(n-0.5) dc=(n-0.5)
20
Yn E = E -c c
( n - 0.5 ) - EC-----
20
Summing moments about point 0 (refer to Figure A. l ) we have
... A.3b
... A.4
..................... A .5
11=20
L fcnbdc(c -yn) = Cck2 c ... ................... .. . .. . ... . .. .. . ......... A.6
n=l
n~ f b d ( ) n~ f b C ( ) n~ fen ( 1 - Y n) k2 =-~-=l_c_n_c_c_-_Y_n_= ~ en 20 c-yn = ~ 20 c
C I I cc (a;c f cbc)c aJc
........ . .. .. A .7
and where
Cc= etc f/ b c . . . . ............. . .. . . . . .. ..... . . . ....... . ..... . . ..... . .. . .. ... ... A.8
125

Table A.1 Lists the values of etc, k2 at any given concrete strain for a compressive strength of
27 MPa. The resultant compressive force Cc is given by Equation A.6 and its center of pressure is
located a distance (k2 c) from the top compression fiber.
An iterative procedure is employed to determine the neutral axis position and the nominal
moment capacity. The concrete strain is assumed to be less than 0.003 and etc is determined from
Table A.1. The neutral axis position is determined from the compatibility of strains as illustrated in
Figure A.1 and
calculated as
c = d f E + E
c 'fit
............................................. A.9
T bl A 1 Val a e .. ues o f k f c Cl, -? or oncrete c ompress1ve Str h f 27 M engt o lpa.
Top Top Concrete Cle K2 Concrete Cle k2
Strain Strain
0.0005 0.229 0.343 0.0018 0.616 0.374
0.0006 0.269 0.345 0.0019 0.633 0.377
0.0007 0.308 0.347 0.002 0.649 0.381
0.0008 0.345 0.349 0.0021 0.662 0.385
0.0009 0.38 0.351 0.0022 0.674 0.388
0.0010 0.413 0.353 0.0023 0.684 0.392
0.0011 0.445 0.355 0.0024 0.694 0.396
0.0012 0.475 0.357 0.0025 0.702 0.4
0.0013 0.503 0.36 0.0026 0.71 0.403
0.0014 0.529 0.362 0.0027 0.716 0.407
0.0015 0.553 0.365 0.0028 0.722 0.41
0.0016 0.576 0.368 0.0029 0.728 0.414
0.0017 0.597 0.371 0.003 0.732 0.417
126

All forces acting on the cross section are given by:
C0 = CX0 f 0 ' b c .......... .. ............ .. .......... . . .. .......... . . .. ......... .. A .lOa
Ts= As fy . ........... ... ........... . . ............. . ............ .. ............ A.lOb
Tr= Ar fru . . .. . ... .. .. ... ........ . . . . . . . .. . ....... . ... . ..... ... . .. ....... ... . A.lOc
From the equilibrium condition of C0 = Ts + Tr we have:
CX0 f0 ' b C = ~ fy + Ar ffu . . . . . . . . . . . . . . . . . . . . . . . . . . . . . . . . . . . . . . . . . . . . . . . . . . . . . . . . . . A. 11
= As f y + Atftu
c !/ b .. . .. . .............. .. ......... .. A.12
A trial and adjustment procedure is performed by the assuming concrete strain E0 , locating the
corresponding value of cx0
from Table A.1 and calculating the neutral axis distance (c) from Equation
A.9 until the product cx0c approximately equals to the value obtained from Equation A.12. The
moment of the cross section forces taken about the concrete compression force is given in Equation
A.13 as
Mn= Asfy (d - a0
) +At fru (dr - a0) ••••• • ••••••••••••••• •• •••••••••••• • • •• ••••••••• •• A.13
in which
ac= kzC . .............. . ............ . ........... . ............... .... . .. .... ... A.14
127
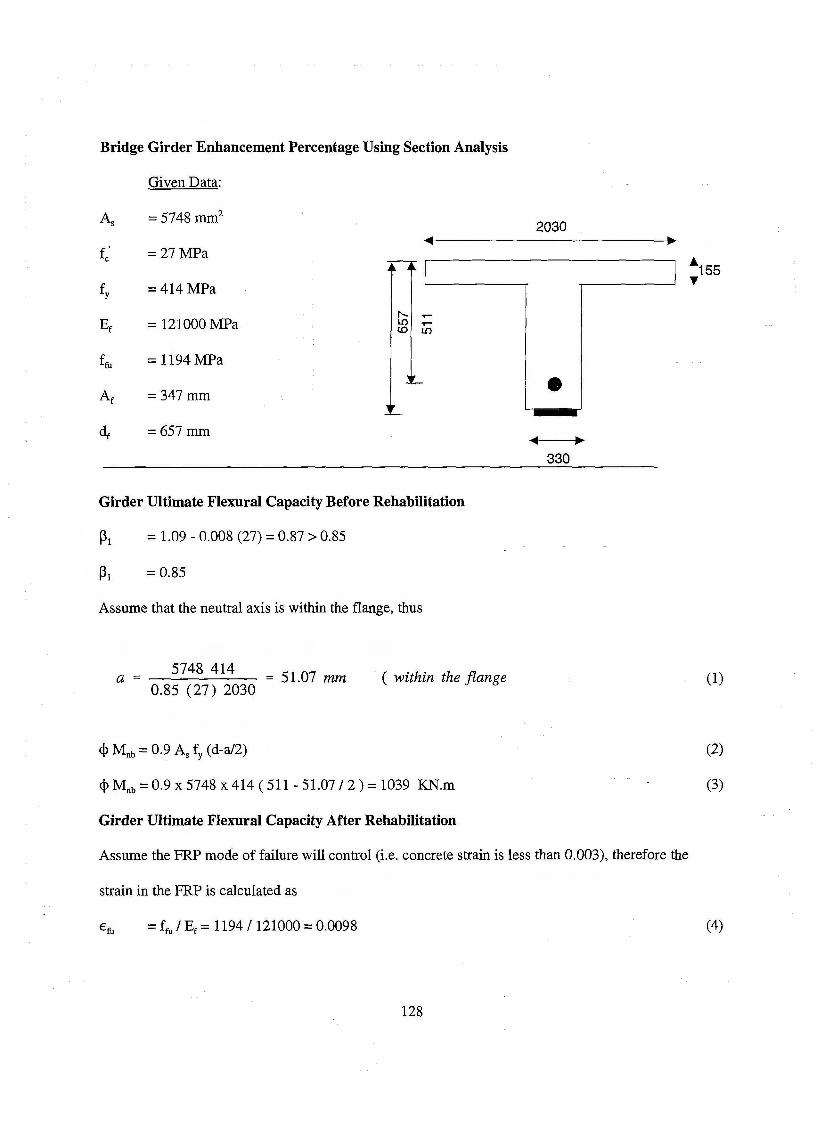
Bridge Girder Enhancement Percentage Using Section Analysis
Given Data:
As = 5748 mm2
2030
f' c =27MPa
fy =414MPa
....... Er = 121000MPa LO ..-
CO LO
fru = 1194 MPa
Ar = 347 mm • df = 657 mm ... ...
330
Girder Ultimate Flexural Capacity Before Rehabilitation
p1 = 1.09 - 0.008 (27) = o.87 > o.85
P1 = o.85
Assume that the neutral axis is within the flange, thus
a == 5748 414 == 5 1.07 mm 0.85 (27) 2030
( within the flange
<!> Mnb = 0.9 As fy (d-a/2)
<!> Mnb = 0.9 X 5748 X 414 ( 511 - 51.07 / 2) = 1039 KN.m
Girder Ultimate Flexural Capacity After Rehabilitation
Assume the FRP mode of failure will control (i.e. concrete strain is less than 0.003), therefore the
strain in the FRP is calculated as
= ffu I Er= 11941121000 = 0.0098
128
(1)
(2)
(3)
(4)

Calculate effective flange width (bis the least of the following):
1. b = 16 hf +bw = 16 (152) + 330 = 2762 mm
2. b = 10.36 x 1000 I 4 = 2590 mm
3. b = 2030 mm (half the clear distance on each side plus beam width bw)
b = 2030 mm controls
Assume that the neutral axis is within the flange, and apply equilibrium Equation A.11 as
(5)
in which
a0
(27) (2030) C = 5748 (414) + 347 (1194) (6)
or
ac c = 50.97 (7)
and
= 657 EC + 0.0098
(8)
The iteration procedure on Equation (8) is performed by assuming a concrete strain e0
, and
determining the corresponding value of a0
from Table A.1 until the term ( a0
c) approximately equals
the value 50.97 obtained from Equation 7. The calculations are summarized in Table A.2
T bl A 2 C 1 1 f a e .. a cu a ion o f f E CGCC or 1 p bl xamp e ro em
Assumed ac c ace Concrete strain E0 (from Table A.1) (from Equation A.12)
0.0017 0.597 97.12 57.98
0.0016 0.576 92.21 53.11
0.0015 0.553 87.21 48.23
0.00155 0.565 89.72 50.69
129

From Table A.l with a concrete strain equal 0.00155, k2=0.366 and we have
k2 c = 0.366 (89.72) = 32.83 mm
and the nominal moment capacity calculated from Equation A.13 as
Mna = 5748 X 414 (511-32.83) + 347 X 1194 (657- 32.83) = 1396 KN-m.
cP M0a= 0.9 X 1398 = 1256 KN-m.
The enhancement percentage can thus be computed as
or
(1256 - 1039) I 1039 x 100 = 20.8 %
Thus the FRP increases the ultimate flexural capacity by approximately 21 %
Example Using Design Charts
Alternatively, design charts may be used to calculate the upgraded girder ultimate flexural capacity as
follows:
5748 p = 2030 511 = 0·0056
347 p1
= - 0.00033 2030 511
P1 = i.09 - 0.008 (27) = o.87 > o.85
P1 = o.85
d/d = 657/511 = 1.28
Using the design chart in Figure A.2 CP1=0.85, fy=414 MPa, Efu=0.0098, df/d ::ol.2, Ef =120,000 MPa)
= 0.088 = __ ¢_M_n -27 2030 5112
M0
= 1399 kN.m, which is approximately equal the calculated ultimate flexural (1396 kN.m) capacity
using the analytical section analysis procedure.
130

f y= 414 MPa fc'=27 MPa Er=120000 MPa etu=0.0098 d1/d= 1.2
FRP-rupture
p =0.004
0.05 -1---<L-L--__.___._---I_...__,____._~__,____,.___.._ _ _.__~_... __ _.____.___.._~
0.000 0.002
As=pbd Ar= Pt b d
0.004 0.006
FRP Ratio (Pt)
Figure A.2. Design Chart for RC Sections with FRP.
131
0.008 0.010