final report - · pdf filefinal report the commission of ... 10.5 the seminar in greece ......
TRANSCRIPT

EUROPEAN COMMISSION D I R E C T O R A T E - GE N E R A L FO R E N E R GY S A V E I I Pr o g r a mme
Energy Savings by Combined Heat Cooling and Power Plants (CHCP)
in the Hotel Sector
FINAL REPORT
The Commission of the European Communities Directorate General for Energy,
Contract No XVII/4.1031/Z/98-036 SAVE II
The 31th of May 2001

2001-05-31 2
ÅF-Energikonsult AB F:\CHOSE\relfinal\Final Report 010710.doc 471275-D-SW-03
Partners in the CHOSE-project Coordinator: ÅF-Energikonsult AB, Energi och Miljö
Box 8133, Fleminggatan 7 S-104 20 Stockholm, SWEDEN Tel: +46 8 657 10 00, fax: +46 8 653 31 93 Contact: Elisabeth Ekener Petersen [email protected]
Partners: Alteren Inc, Energy and Environmental Analysis & Planning Kassandrou 37a GR-546 33 Thessaloniki, GREECE Tel: +3031 282.528, fax: +3031 283.725 Contact: Anastasios Christoforides [email protected]
DEAF-Department of Energy and Applied Physics University of Palermo V.le delle Scienze 90128 Palermo, ITALY Tel: +39 91 236.113, fax: +39 91 484.425 Contact: Prof. ing. Ennio Cardona [email protected]
INESC – Instituto de Engenharia de Sistemas e Comutadores Rua Antero de Quental, 199 3000 Coimbra, PORTUGAL Tel. +351 39 3 26 89, fax: +351 39 2 46 92 Contact: Luis Neves [email protected]
AEOLIKI Ltd 65 Prodromou Str CYPRUS 2063 Nicosia Tel. +357 2 676818, fax +357 2 6768919 Contact: Ioannis P Glekas [email protected]
The project has been realised with financial support from: The Commission of the European Communities
Directorate General for Energy, Contract No XVII/4.1031/Z/98-036
SAVE II

2001-05-31 3
ÅF-Energikonsult AB F:\CHOSE\relfinal\Final Report 010710.doc 471275-D-SW-03
Content 1. Introduction...............................................................................................................5 2. Summary....................................................................................................................6 3. Analysis of the structure of the Hotel Sector...........................................................14
3.1. Overview .............................................................................................................14 3.2. The tourism sector in Europe ..............................................................................15 3.3 The hotel sector in Europe...................................................................................15 3.4. The hotel sector in each partner country .............................................................18
4. Energy consumption in hotels .................................................................................20 4.1 Energy uses in hotels...........................................................................................20 4.2 Heating and air conditioning ...............................................................................21 4.3 Domestic hot water..............................................................................................22 4.4 Lighting ...............................................................................................................23 4.5 Catering - the kitchen ..........................................................................................23 4.6. Other services ......................................................................................................24 4.7. Electrical system and equipment.........................................................................25 4.8. Ventilation...........................................................................................................25 4.9 Thermal energy systems and equipment .............................................................26 4.10 Specific energy characteristics in each partner country ......................................26
5. The combined Co-generation and Cooling System - CHCP...................................28 5.1 Concept and benefits of combined CHCP...........................................................28 5.2 The design of CHCP and factors influencing the installations ...........................30
6. Case studies overview .............................................................................................38 6.1 General considerations on the selection of Hotels ..............................................38 6.2 Method of Energy Audits ....................................................................................43 6.3 Method of Economic Evaluation.........................................................................47 6.4 Investment cost of CHCP....................................................................................55 6.5 Annual cost for operation and maintenance ........................................................60
7. Results from energy audits ......................................................................................67 7.1 Energy source and usage in the hotels ................................................................67 7.2 Energy consumption in the hotels and need of energy conservation measures.........................................................................................68 7.3 Differences in the system design.........................................................................69 7.4 Energy profiles, electricity and thermal energy ..................................................71 7.5 Differences between countries ............................................................................90 7.6 Conclusions .........................................................................................................93
8. Economic results .....................................................................................................94 8.1 COST-effectiveness of CHCP.............................................................................94 8.2 Sensitivity of results to other changes and assumptions ...................................101 8.3. General guidelines.............................................................................................108
9. Environmental aspects ..........................................................................................114 9.1 Fuel savings.......................................................................................................114 9.2 The emissions from fuel combustion ................................................................115 9.3 Refrigerants .......................................................................................................117 9.4 Noise..................................................................................................................119

2001-05-31 4
ÅF-Energikonsult AB F:\CHOSE\relfinal\Final Report 010710.doc 471275-D-SW-03
10 Dissemination of results ........................................................................................122
10.1 Seminars in each country ..................................................................................122 10.2 Distribution of Newsletters ...............................................................................123 10.3 Production of an Internet Web-site ...................................................................123 10.4 General conclusions ..........................................................................................125 10.5 The seminar in Greece.......................................................................................125 10.6 The seminar in Italy...........................................................................................125 10.7 The seminar in Portugal ....................................................................................126 10.8 The seminar in Sweden .....................................................................................126
11. Concluding remarks ..............................................................................................127
Appendix A Combined Heat and Power generation, CHP B Absorption chillers C Energy Audits form and Checklist for Energy Saving Measures in Hotels D Energy Audits- Cyprus E Energy Audits- Greece F Energy Audits- Italy G Energy Audits- Portugal H Energy Audits- Sweden I Energy and price parameters J Dissemination of Results
PREVIOUS PUBLISHED REPORT CHOSE, Energy Savings by Combined Heat Cooling and Power Plants (CHCP) in the Hotel Sector – Intermediate Report, The 20th of December 1999, Stockholm, Sweden. ÅF-Energikonsult AB, Sweden

2001-05-31 5
ÅF-Energikonsult AB F:\CHOSE\relfinal\Final Report 010710.doc 471275-D-SW-03
1. Introduction Combined Heat and Power (CHP) has during several years been an important and prioritised area for the EC SAVE-programme. In combination with a cooling system, the technical and economical viability of the CHP-system is likely to increase. This is of particular interest in the hotel sector, where the specific energy consumption is high and the costs for energy represents a considerable share of the total running cost. The aim of the project has therefore been to investigate the technical and economical viability of Combined Heat, Cooling and Power (CHCP) plants in the hotel sector, as well as the energy saving potential through this action. The project has resulted in a method as well as in guidelines on how to measure and evaluate the suitability for CHCP-installations in different types of hotels. The results from the project are documented in this final report. Intermediate project results with particular emphasis on analysis of the hotel sector as well as the general method applied for energy auditing, have been presented in Intermediate Report, Energy Savings by Combined Heat Cooling and Power Plants in the Hotel Sector; 99-12-20. Furthermore, results from the project have been presented through national seminars conducted in each partner country, as well as an internet site, www.inescc.pt/urepe/chose. The funding of the project has been through the SAVE II –programme as well as through national governments and energy companies among others. Partner countries of the project have been Cyprus, Greece, Italy, Portugal and Sweden, the latter as co-ordinating partner. The project duration time has been two years.

2001-05-31 6
ÅF-Energikonsult AB F:\CHOSE\relfinal\Final Report 010710.doc 471275-D-SW-03
2. Summary The CHOSE project Combined Heat and Power (CHP) has during several years been an important and prioritised area for the EC SAVE-programme. In combination of a cooling system, the technical and economical viability of the CHP-system is likely to increase. This is of particular interest in the hotel sector, where the specific energy consumption is high and the cost for energy represent a considerable share of the total running cost. The aim of the project has been to investigate the technical and economical viability of combined heat, cooling and power plants, CHCP, in the hotel sector, as well as the energy saving potential through this action. The project has resulted in a method as well as in guidelines on how to measure and evaluate the suitability for CHCP-installations in different types of hotels. The project has chosen to focus on only studying CHP- and CHCP-systems with gas based fuels; such as natural gas, biogas etc. The project period has been January 1999 to March 2001. The project has been funded through the SAVE II–programme as well as through National Governments and Energy companies among others. Partner Countries of the project have been Cyprus, Greece, Italy, Portugal and Sweden, the latter as a Co-ordinating partner. Analysis of the structure of the hotel sector Tourism has been a constantly growing sector in Europe. There are two aspects why hotels are an interesting target group to study in the respect of CHCP potential. First, in the coming years a large increase in number of tourists is expected, which will create a need for more hotels. Secondly, energy generally makes up the largest portion of hotel running cost after the cost of staff. The hotel sector within the EU market is characterised by a high fragmentation concerning size of hotels, quality, occupation rate, services rendered etc. Market demand has developed the hotel sectors quite differently in the partner countries, and created separate characteristics of the hotel sector in each country. In total, the EU hotels use 39 TWh of energy yearly, and about half of the energy used is electricity. The estimated energy saving potential through CHP is 8 TWh per year, which is 20% of total energy used by the hotels. Energy consumption in hotels The need for energy in hotels is dependent on a large number of factors; customer category, the type of hotel, its geographic location, age and condition of the energy-using systems and last, but not least, the energy management skills. Due to large differences between hotels, it is difficult to arrive at general consumption figures. However, the project describes a generalised distribution of energy consumption in a hotel. Heating and climatisation makes up for almost half of the hotel’s energy consumption. The

2001-05-31 7
ÅF-Energikonsult AB F:\CHOSE\relfinal\Final Report 010710.doc 471275-D-SW-03
rest is divided between catering 25%, hot water production 13%, lighting 7% and other ser-vices 7%. Ventilation is identified as an area where good management can increase energy efficiency significantly.
Hot water13%
Others7%
Lighting7%
Catering25%
Heating & Climatisation
48%
Distribution of energy consumption in hotels. Source: Rational Use of Energy in the Hotel Sector, Thermie Programme Action -B-103, 1995. The combined Co-generation and Cooling System – CHCP Co-generation, CHP, is the term universally applied to the simultaneous production of electricity and heat, and has been studied in a variety of projects. This project has gone further, and analysed the possibilities to reduce the energy consumption by combining heat, cooling and power production, CHCP. The systems has several advantages, both on a national and on a business level: • National benefits are mainly increased reliability, primary fuel savings, enhanced
efficiency of electric utility services, reduced emissions and possibilities to use more environmental friendly fuels and refrigerants.
• The business benefits with an optimised CHCP-system are reduced energy costs, security against energy price fluctuations, and a more reliable power supply.
Reciprocating engines and gasturbine systems are commonly used in a co-generation application to produce electricity and heat. The selection of prime mover depends on the type of demand placed on the system. This report discuss an energy system with heat recovered in the forms of either hot water, steam, cooling or electricity in the combination with heat and electricity for internal use or delivered to the grid. There are, however, other forms of systems that use the power from the prime mover shaft and the recovered heat. The traditional system is a co-generation unit for generation of electricity and heat with either hot water and/or steam, but there are also other forms of systems. These have not been the main targets of this study. There are several types of combined energy production systems available in the market today. The following have been identified as the most suitable for hotels: • CHP with turbine engine • CHP with standard temperature reciprocating engine

2001-05-31 8
ÅF-Energikonsult AB F:\CHOSE\relfinal\Final Report 010710.doc 471275-D-SW-03
• CHCP with high temperature reciprocating or turbine engine and absorption chiller. The fist two systems are composed of CHP-systems and are normally developed as a com-plete package, which are relatively simple to install. They are also small enough to be located in existing boiler rooms and effectively replace the main boiler, linking into the existing heat-ing distribution system. These two system types constitute the basic form of co-generation suitable for a majority of hotels and are generally sized to cover only the base load of domes-tic hot water needs. These systems can also be designed as to operate to meet the thermal load and the electricity base load of a hotel. By doing so, the result is a simple system, which can meet most of the energy demand of the hotel without having to be equipped with a configura-tion of electricity export to the local grid. The third system, the CHCP plant, saves more energy than the first two configurations, but is more complex and expensive to install and requires larger space for installation. The CHCP plant must operate almost continuously for extended periods of time and, ideally, a thermal need must exist to completely utilise the majority of the waste heat recovered from the on-site engine-generator. The combination of co-generation with absorption chillers increase the module operating time at high thermal load through additional utilisation of exhaust heat with a summer load, and decrease the connected electrical load and therefore reduces the energy costs. Case study overview A number of representative hotels from each country were selected for case studies. The main objective of the case study was to find appropriate CHCP-plants for different types of hotels as well as finding energy profiles for the hotel sector. A second objective was to identify some general parameters. An important criterion for the selection of case-study hotels has been to include those hotels that represent the hotel structure as a whole in each country. The selected hotels can therefore be regarded as representative for both the southern and northern part of Europe, which has allowed the project to cover the main climate extremes in Europe. With the exception of Cyprus, ten hotels were selected in each country. In order to be able to evaluate the hotels, it was essential to know the load and load-duration curves for heating, cooling and electricity separately. However, for the predominate part of the hotels the data on energy consumption, if at all available, were aggregated and presented either as total energy consumption or in the form of heat and electricity load on a monthly basis. Separate data of the heating- and cooling loads have in general not been historically measured, and therefore no relevant information was available for the project. For the electric load however, information was possible to obtain from electricity companies, at least on high- and low-time basis. Since the required information on load and load-duration on an hourly basis was not available for the selected hotels, a method of energy auditing was used in the project. First a short energy audit was conducted in 60 hotels. It was followed by a detailed energy audit performed on those 44 hotels assessed as having a potential for CHCP installations. By doing the audits, it became clear that a detailed review of energy conservation measures had to be made in order to review more economic measures before considering CHCP.

2001-05-31 9
ÅF-Energikonsult AB F:\CHOSE\relfinal\Final Report 010710.doc 471275-D-SW-03
The method of evaluating the cost effectiveness of CHCP was the following: the possible revenues in the forms of energy savings and co-generated electricity that could be sold by the hotels were compared to the expected cost of energy production with CHCP. The economic savings from the operation of a CHCP system were then estimated by comparing the operat-ing costs for an alternative system that would be adopted if a CHCP system were not installed. The alternative systems are in most cases electrical power purchased from the local Distribu-tion Company, combined with heat generation from boilers. The following details are typically needed in the economic analysis of CHCP plants: • fuel costs • capital costs • operation and maintenance costs • revenue from electricity sales • savings from in house utilisation of electrical energy • economic life length The project aimed to receive equivalent output from all calculations regardless of in which partner country the case study had been accomplished. In order to reach this, a computer software program was developed. Input required in the model was: prices for fuel for heating, fuel for CHP, interest rate, time span to be used and capacity charges for electricity in Euro/kW per year. There are significant variations between the partner countries in these variables. Results from energy audits Not surprisingly, the result from the energy audits varied between the hotels in the different countries. These differences influence the design of a CHP- and CHCP-plant. In order to specify a detailed design of a CHP- and CHCP-system, the energy profiles on an hourly basis must be known. It is especially important to evaluate the simultaneous load for heating, cooling and electricity. The following are some general conclusions from the energy audits: In the majority of the cases studied it is recommended that before considering a CHP system, every effort must be made to reduce the energy requirements, especially the electrical energy consumption. This is to be done through the incorporation of simple energy saving technologies.

2001-05-31 10
ÅF-Energikonsult AB F:\CHOSE\relfinal\Final Report 010710.doc 471275-D-SW-03
0
100
200
300
400
500
600
700
0 100 200 300 400 500 600 700
n u m b e r o f ro o m s
kWh
/m2
and
ye
a
Hotel rating total energy consumption, kWh/m2 as a function of number of rooms. The hotels with good energy consumption defined as a specific consumption kWh/m2 are found under the line in the diagram. Hotels above the line are rated poor and energy conservation measures are recommended before installing CHP or CHCP plant. However, the most important thing is to reduce the energy consumption for space heating. The reason is that the heat load will determine the size of a CHP or a CHCP. With the heat load being unnecessary high due to poor energy efficiency the installed CHCP will not be optimised. With the installation of absorption machines, the need for electrical power and energy will be reduced. In the future, there will be an increase in the demand for electricity, which may cause inconvenience for electrical generation in many countries, shortage of power, as well as difficulties with transmission. Economic results The main result of the project is the guideline that eases the decision on the installation of CHP or CHCP plants in hotels. The cost-effective analysis of CHCP shows the following payback periods for the investments: Cyprus Greece Italy Portugal Sweden CHCP 8,4 > 6 2,5-4,1 > 15 CHP 3,9-4,7 4,5-6 2,7-4,4 1) > 15
1. With actual prices, none of the cases has a real cost-effective CHP solution. A price difference of 12 Euro/MWh between gas for boiler and gas for CHP gave pay back periods of 4,4 – 7,0 years. Until January 2000 there are no differences in Natural gas prices for CHP and for boilers in Portugal.
Investments in CHP Investments in CHP in Cyprus, Greece and Italy are likely to be economical viable for the examined hotels sites. The suitable form of CHP for the majority of the examined hotels

2001-05-31 11
ÅF-Energikonsult AB F:\CHOSE\relfinal\Final Report 010710.doc 471275-D-SW-03
would consist of a mimi-CHP package set with a heat recovery system to provide mainly do-mestic hot water, meet the baseload and run over 4 000 hours a year. In Sweden and Portugal, CHP is not an option with present fuel and electricity prices. Investments in CHCP The results indicate that the concept of tri-generation system is most likely to be economically viable in Italy. However, investments in CHCP are not likely to be viable with the present fuel and electricity prices in Sweden, Portugal, Greece or Cyprus. The result show that although significant levels of energy efficiency can be reached by introducing CHCP-concepts, it is difficult to get the investments viable with the prevailing fuel costs and electricity prices. If the European societies value the benefit of energy efficiency, incentives are needed for energy actors in order to make the investments. Sensitivity of results CHP and CHCP investments are capital intensive. A subsidy on the initial investment cost would greatly influence the financial results of the investment. In Cyprus for instance, a subsidy of 30% on initial cost would reduce the pay back period on a CHCP investment from 8,4 to 4,2 years. The fuel cost is another issue of concern. Examples from Cyprus indicate that a 20% reduction in LPG price would result in pay back periods of 3-4 years instead of 9 years. Similar examples from Greece show that a 30% increase in natural gas prices would result in reducing the net present value by 65%. Environmental aspects When optimised the CHCP technique shows promising results in energy efficiency since less fuel is needed to produce energy compared to other techniques. It is also possible to use efficient exhaustion techniques, which in addition to the reduction in fuel consumption assists in decreasing the emissions from energy production. Obviously this is an environmental benefit. As the results indicates, the installation of the proposed CHP mini-package is resulting in primary energy savings of around 5,5 to 20%. The magnitude of the fuel savings was calculated taking into account the efficiency of electricity generation from the conventional units of large central power stations connected to a national electric grid. Examples from Italy offers energy savings of between 10 – 25 % compared with the electricity and heat from conventional power stations and boilers. Estimates of environmental benefits also show that in comparison to separate production of heat and electricity, the CO2 reduction with CHP and CHCP plants varies from 31% to 20%. The technique does not seem to imply any negative side effects on the hotel activity, i.e. the hotel guest will not notice any changes.

2001-05-31 12
ÅF-Energikonsult AB F:\CHOSE\relfinal\Final Report 010710.doc 471275-D-SW-03
The EU has several goals and working programmes where great efforts are made to reducing the consumption of energy within the union. The power plants within the EU constitute for a large portion of the emissions. Out of the total emissions, the power plants accounts for: ! 33% of Carbon dioxide, CO2 ! 60% of Sulphur dioxide, SO2 ! 20% of Nitrogen oxides, NOx ! 40-55% of emissions of particles. Consequently, power production is an area where introducing new techniques on a large scale could have a great positive impact on the environment. Installing CHCP units have the technical potential of being one of these techniques. However, the case studies show that only in one of the countries in the project, Italy, there is an economically viable situation for CHCP investments. In the rest of the countries, the combinations of fuel costs, taxes and electricity prices do not favour CHCP investments. If the EU wants to pursue the possibilities of using CHCP as an energy saving device, incentives for investments in the technique must be created. As the situation is today, very few if any, are willing to take the risk. Dissemination of results One essential task of the CHOSE project, was the dissemination of the result to stakeholders. People from different categories in society could benefit from learning of the results in the project, and cross-sector discussions could stimulate the progress. The information was therefore disseminated in a variety of ways to reach many people. The dissemination activities have included the following: Seminars In order to stimulate discussions and cross sector experiences, the information was disseminated through seminars in each country. The seminars were also held in order to encourage the creation of networks to support work in the field of energy conservation. The target groups for the seminars were hotels, hotel associations, energy consulting companies, institutions and companies of public sector related to energy, energy technicians, tourism schools, managers in building- and real estate companies. The seminars were well attended, the number of participants varied from 20-60. Distribution of Newsletters Newsletters in the participating countries have been written and distributed to stake holders. Newsletters have so far included invitations and information of the seminar, intermediate results of the projects etc.

2001-05-31 13
ÅF-Energikonsult AB F:\CHOSE\relfinal\Final Report 010710.doc 471275-D-SW-03
Production of an Internet Web-site A web-site was made which was replicated in the participating countries and contains the project results as well as useful links to energy related issues. General conclusions The seminars had slightly different focus. The following are some issues emphasised in many of the seminars: • Control of energy use in buildings and methods to follow-up energy consumption – the
well worth investment in appropriate control systems. • Energy-savings measures should be undertaken to improve energy performance of the
hotels before they proceed to the evaluation of a CHP installation. • The importance of choosing the optimal size of CHCP-plant in the relation to actual
energy demands of the hotel. • IT –tools for CHCP evaluations. • The national power generation systems today and coming changes. • The possibilities of receiving funds for energy efficiency projects. Documentation The project is reported in an intermediate report, CHOSE, Energy Savings by Combined Heat Cooling and Power Plants (CHCP) in the Hotel Sector – Inermediate Report in December 1999, in this final report, an executive summary and in the above mentioned seminars. There is also a web site at http://www.inescc.pt/urepe/chose, where the project is described.

2001-05-31 14
ÅF-Energikonsult AB F:\CHOSE\relfinal\Final Report 010710.doc 471275-D-SW-03
3. Analysis of the structure of the Hotel Sector 3.1. Overview This chapter aims to give a better understanding of the hotel sector. It contains a condensed description of how the sector looks today, what affects the markets and what trends are expected in the future. It also describes generally the different types of hotels that exist in Europe and more specifically in the partner countries. This background information aims at creating a better understanding of the potential for CHCP in the hotel sector. There are two main groups of customers in the hotel sector; the business traveller and the tourist. Their demands differ. Business guests generally demand high service hotels inside the cities. The tourist's demand is more heterogeneous. Hotels in cities are in demand but also outside cities in tourist areas. There is also a large variety in desired quality standards by the tourists. To study the hotel sector, both the tourist sector and the business sector is of interest. However, this chapter's main focus is on the tourist sector, since no comprehensive information on business travel has been available. The business travellers in the different partner countries will therefore be discussed in the country specific information at the end of the chapter. 3.1.1 The hotel sector today Tourism is a constantly growing sector of the world economy. Revenues of the sector increased from $435 981 in 1997 to $444 741 in 1998. Europe receives 60% of the world tourist arrivals, America 20%, followed by Asia and Africa. The hotel sector is characterised by a strong dependency on the economic situation in the society. Generally, if society is in a boom period with high consumer income and intensive business climate, the hotel sector is prospering. On the contrary, if society is experiencing a slump period, the hotel sector is generally effected negatively with low occupation rates etc. 3.1.2 The future of the hotel sector The forecast in international tourism is a constantly expected growth. Today five of the top ten leading tourist destinations are European countries. In the coming years, countries such as China, Hong Kong and Russia are expected to take a larger share of international tourism. Although Europe is expected to only have four countries in the top ten leading tourist destinations by the year 2020, a large increase in number of tourists in Europe is expected. An example is Italy which is expected to have 53 million visitors per year in 2020 compared to 35 millions in 1998. The increased number of expected tourists indicate that the market will need more hotels in the future, which has been one of the reasons to choose this sector for the study.

2001-05-31 15
ÅF-Energikonsult AB F:\CHOSE\relfinal\Final Report 010710.doc 471275-D-SW-03
3.1.3 Energy use and cost in the hotel sector Energy generally makes up the largest portion of hotel running cost after the cost of staff. This fact should attract the interest of hotel managers, since a potential for decreased cost through energy savings exist. The estimated total energy consumption in EU hotels is 39 TWh. Out of that, 50% is electricity consumption. A rough estimated energy saving potential through CHP is 7,8 TWh per year1. The energy use is elaborated more extensively in chapter 4. 3.2. The tourism sector in Europe Within Europe, there are great differences in the number of hotel receptive structures each country has. Four countries have more than 70% of all units. As presented in the table below, Italy has the biggest number among the countries studied. However in terms of tourist attraction, numbers are much different., Italy is the fourth destiny in the world, Portugal and Greece, the eleventh and twelfth, while Sweden and Cyprus aren’t among the 40 main destinies (source: Eurostat 1998). Table 1: European Hotel receptive structures, 1997. Source: Eurostat Country Number of
tourists (1000)
% of total in Europe
1 United Kingdom 46 300 24% 2 Germany 38 700 20% 3 Italy 33 900 18% 4 France 20 600 11% 5 Austria 18 000 10% 6 Spain 9 500 5% 7 Greece 7 900 4% 10 Sweden 1 900 1% 11 Portugal 1 800 1% 3.3 The hotel sector in Europe The hotel sector within the EU market is characterised by a high fragmentation concerning size of hotels, quality, services offered etc. A closer look at hotel sizes shows that in Italy, where 74% of all hotels in partner countries are situated, the typical hotel is a small or medium sized family hotel with an average of 28 rooms. Cyprus, on the contrary, has developed a hotel structure of large tourist- and apartment hotels where the average size is 165 rooms. In the table below, the size of the hotels in the partner countries are presented.
1 Based on the following calculation: Energy consumption in EU hotels is estimated to 39 TWh; a reasonable average energy savings through the use of CHP is estimated to 20%.

2001-05-31 16
ÅF-Energikonsult AB F:\CHOSE\relfinal\Final Report 010710.doc 471275-D-SW-03
Table 2: Hotel Sector consistency. Source: compiled reports from partner countries. Cyprus Greece Italy Portugal Sweden Number of hotels 517 7916 33905 1768 1851 Number of rooms 85600 301829 948462 93460 91467 Average number of rooms per hotel
165 38 28 53 50
Number of million hotel nights per year*
n.a. 58 299 41 37
* Data from HOTREC, 1998. Another way of showing differences in the partner countries hotel structure, is the relation in each country between small and large hotels. As the figure below displays, a large part of the Greek hotels are small, while the Cypriot and Swedish hotels in general are larger. Small hotels have less than 50 rooms, medium sized hotels have 50-150 rooms and large hotels have more than 150 rooms.
0%
10%
20%
30%
40%
50%
60%
70%
80%
90%
Cyprus Greece Portugal Sweden
<50 rooms50-150 rooms>150 rooms
Figure 1: Classification of hotels according to number of rooms.
Source: Compiled reports from partner countries. Cyprus data approx. on category 50-150 rooms, Italian data not available but the concentration is on small hotels.
The tourist sector represents various parts of the gross domestic product, GDP, in the different partner countries. As the table below indicates, the tourist sector represents a large source of income in Cyprus while the sector contributes to a fairly small part of the GDP in Italy and Sweden.
2001-05-31 17
ÅF-Energikonsult AB F:\CHOSE\relfinal\Final Report 010710.doc 471275-D-SW-03
0%2%4%6%8%
10%12%
GDP
Cyprus Greece Italy Sweden
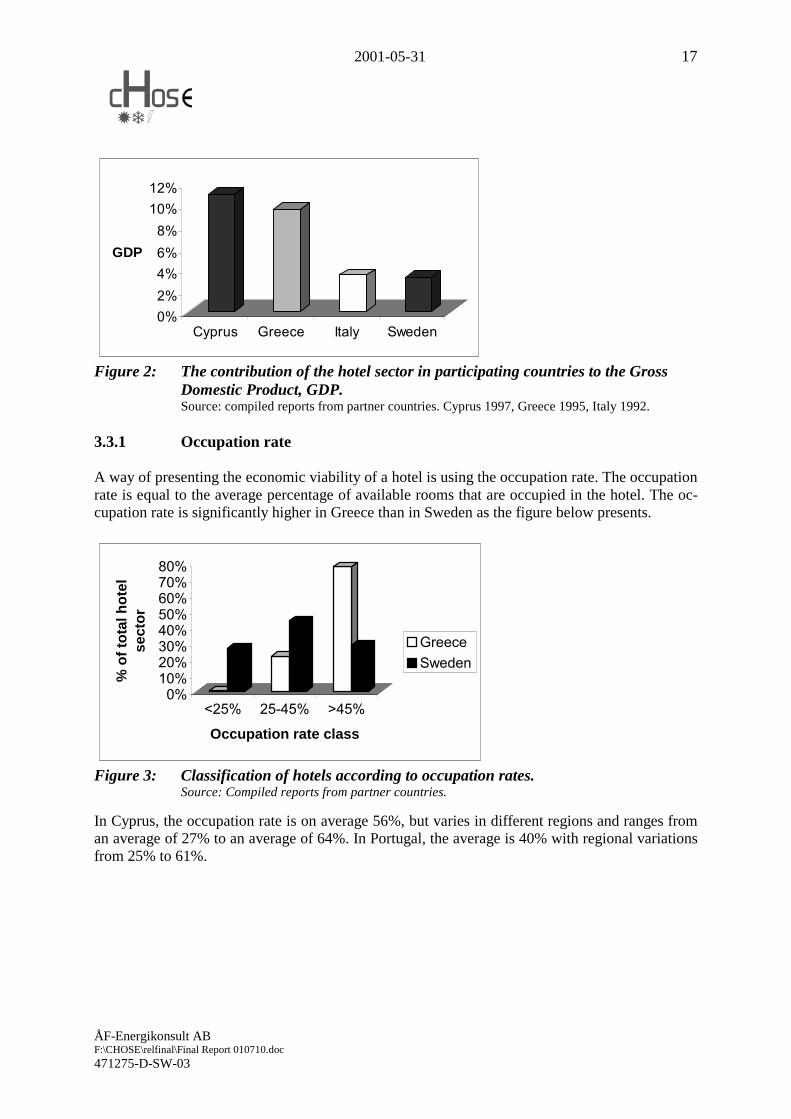
Figure 2: The contribution of the hotel sector in participating countries to the Gross
Domestic Product, GDP. Source: compiled reports from partner countries. Cyprus 1997, Greece 1995, Italy 1992.
3.3.1 Occupation rate A way of presenting the economic viability of a hotel is using the occupation rate. The occupation rate is equal to the average percentage of available rooms that are occupied in the hotel. The oc-cupation rate is significantly higher in Greece than in Sweden as the figure below presents.
0%10%20%30%40%50%60%70%80%
% o
f tot
al h
otel
se
ctor
<25% 25-45% >45%
Occupation rate class
GreeceSweden
Figure 3: Classification of hotels according to occupation rates.
Source: Compiled reports from partner countries. In Cyprus, the occupation rate is on average 56%, but varies in different regions and ranges from an average of 27% to an average of 64%. In Portugal, the average is 40% with regional variations from 25% to 61%.

2001-05-31 18
ÅF-Energikonsult AB F:\CHOSE\relfinal\Final Report 010710.doc 471275-D-SW-03
3.3.2 Quality Quality is defined and measured by different standards in the participating countries and is there-fore not easy to compare. Cyprus, Italy and Portugal have five quality categories. Greece has six and Sweden has no quality categories. Generally, more luxurious equipment, pool, larger rooms and higher quality of the hotel res-taurant will result in a higher quality rate. The number of hotels in the different categories differs between the partner countries as is displayed in the table below. Table 3: An estimated summary of the different countries distribution of quality
categories. Source: Compiled reports from partner countries.
Luxury-High %
Medium %
Low %
Comment on category
Cyprus 28 37 35 Luxury-High = class 5 and class 4; Medium = class 3, Low = class 2 +class 1
Greek 10 69 21 Luxury-High = Luxury class + class A Medium = class B + class C Low = class d + class E
Italy 7 35 58 Luxury-High = class 5 + class 4 Medium = class 3 Low = class 2 + class 1
Portugal 18 70 12 Luxury-High = class 5 Medium = class 4 + class 3 Low = class 1 + class 2
3.4. The hotel sector in each partner country Below is a brief summary of the characteristics for each partner country. Further details can be found in the Intermediate report, December 1999. 3.4.1 Cyprus The tourist sector in Cyprus is very important and 12% of the GDP comes from tourism, which is the largest part of GDP among the partner countries in this study. Consequently, 95% of the visits to Cyprus hotels are tourists, and only 5% are business travellers. The large share of tourists gives fluctuations in the occupational rate. However, overall Cyprus hotels have on average high occu-pation rates, with the summer months being the peak months and the high-standard hotels having higher occupation rates than the hotels with low standard. The Cyprus hotels are also on the average the largest ones in the study with 165 rooms. Cyprus also has the highest percentage of Luxury-high class hotels among the partner countries. 3.4.2 Greece Tourism in Greece is the most important sector in the Greek economy, making up 10% of GDP. Most hotels are holiday hotels for tourists - 64%. Greece has a high share of hotels with high oc-cupational rate.

2001-05-31 19
ÅF-Energikonsult AB F:\CHOSE\relfinal\Final Report 010710.doc 471275-D-SW-03
Greek hotels are on average the second smallest in the study. Medium class hotels are the most common Greek hotels, making up 70% of the market. There are few Luxury-High class hotels - 10%. 3.4.3 Italy Italy receives the largest amount of tourists among the partner countries. On the Top World Desti-nations, Italy is number four receiving 35 million tourists yearly - which counts for nearly 6% of the world’s tourists. The characteristic of the Italian hotel sector is a concentration on small hotels. The average Italian hotel has only 28 rooms, which is the smallest among the partner countries. The Italian hotel sec-tor has few chain- and market collaboration hotels - 85% of the hotels have single local units. Italy also has the highest share of low class hotels (58%), and the lowest share of luxury-high class hotels (7%) among the partner countries. 3.4.4 Portugal The Portuguese hotel sector is hard to characterise with a specific type of hotel. There is a concen-tration of City hotels in the Lisbon and Oporto areas, while holiday hotels with higher occupancy rates are concentrated in the region of Algarve, and on the islands of Azores and Madeira. Statisti-cally the most common hotel is a medium class and medium sized hotel. 3.4.5 Sweden The Swedish hotel sector separates itself from the other partner countries. Swedish Tourism repre-sents the lowest part of GDP among the partner countries. Sweden is the only country in the study where business guests dominate - as much as 70% of the hotel visitors are there in business. An-other characteristic of the Swedish hotel sector is the large concentration of ownership. Chains and market collaborations have 60% of the total hotel and restaurant market, and their market share is increasing every year. The market is very focused on the large city areas, where more than half of the total hotel nights are spent. The quality standard is no longer in use in Sweden.

2001-05-31 20
ÅF-Energikonsult AB F:\CHOSE\relfinal\Final Report 010710.doc 471275-D-SW-03
4. Energy consumption in hotels 4.1 Energy uses in hotels A hotel is a building designed to provide rest and comfort. Energy in different forms is used in hotel facilities and services to help create an atmosphere of comfort. However, it is not true to say that the more energy used, the more comfortable the hotel will be. Energy efficiency is optimal when there is a suitable relation between the comfort of the different spaces and the energy consumption. The need for energy is dependent on a large number of factors; type of hotel, its geographic location and climate conditions and the type, age and condition of the energy-using systems. Also very influential on the energy consumption are the energy management skills; i.e. the property's maintenance program and the management's concerns on the day-to-day operation. Other variables effecting the energy usage are types of guest (families with children, conven-tioneers, businessmen) and kind of insulation used in the buildings. The main energy consuming systems are: ! heating ! air conditioning and ventilation ! domestic hot water production ! catering ! lighting ! other usage of electricity (pumps, elevators, equipment etc.) Large variations exist among hotels, which makes it difficult to arrive at general consumption figures. However, the figure below describes a generalised distribution of energy consumption in a hotel.
Hot water13%
Others7%
Lighting7%
Catering25%
Heating & Climatisation
48%
Figure 4: Distribution of Energy consumption in hotels.
Note that these figures are only a rough estimate. Source: Rational Use of Energy in the Hotel Sector, Thermie Programme Action -B-103, 1995.

2001-05-31 21
ÅF-Energikonsult AB F:\CHOSE\relfinal\Final Report 010710.doc 471275-D-SW-03
A comparison between three hotel types and their energy use per m2 is shown in Table below. The hotels are classified as: • Large hotels: more than 150 rooms, with heating, air conditioning, laundry and indoor
swimming pool. • Medium sized hotels: 50-150 rooms with heating and air conditioning in some areas; no
laundry facilities. • Small hotels: 4 to 50 rooms, heating and air conditioning in some areas; no laundry. Table 4: Performance criteria for the three hotel categories.
Source: Rational Use of Energy in the Hotel Sector, Thermie Programme Action -B-103, 1995. Hotel type Yearly energy use in kWh/m2
Efficient use Fair use Poor use Fuel Electricity Fuel Electricity Fuel Electricity
Large hotel Less than 200 less than 165 200 to 240 165 to 200 More than 240
more than 200
Medium ho-tel
Less than 190 less than 70 190 to 230 70 to 90 More than 230
more than 90
Small Less than 180 less than 60 180 to 210 60 to 80 More than 210
more than 80
4.2 Heating and air conditioning
Heating and air conditioning, commonly called space conditioning or climate control, account for nearly half the energy consumption in many hotels. There are however large differences. In fact, space conditioning is the energy use in hotels which is most dependent on climate, and therefore shows the largest regional variations in energy use. The variations are due to the intensity of the heating- and cooling season, the type of heating or cooling system used, but also dependent on type of hotel constructions and insu-lation. The usual temperature for climatisate hotel areas and rooms are showed in the following table.
48 %

2001-05-31 22
ÅF-Energikonsult AB F:\CHOSE\relfinal\Final Report 010710.doc 471275-D-SW-03
Table 5: Temperature for hotel areas and rooms.
Source: Rational Use of Energy in the Hotel Sector, Thermie Programme Action -B-103, 1995. Type of climatisation State of space Recommended temperature Normal heating Occupied 20-22°C Low heating Unoccupied for certain periods 16-18°C Standby heating Unoccupied for long periods 12-14°C Minimal heating Unoccupied in winter 7-8°C Cooling Lounges and guest rooms
summer 5° lower than external temperature
Cooling Lounges and guest rooms win-ter
23
4.3 Domestic hot water
Domestic hot water requirements in hotels vary greatly according to category. For example, a five-star hotel requires around 150 litres per guest per day, whilst for a three-star establish-ment 90 litres per guest are required. Hot water is basically used for shower/baths in the rooms, in the kitchens or by different services. In the room the volume is directly related to the number of guests in the room. The energy required to produce hot water make up an important part of a hotel’s energy con-sumption, accounting for as much as 15% of total energy consumption. However, in proper-ties which include restaurants, kitchens and laundries, the percentage of energy for hot water can be greater. For example, in a medium category hotel, with an average annual occupation of 70%, the en-ergy consumed for the production of domestic hot water ranges from 1.500 to 2.300 kWh/room per year. The principal production systems are: • Accumulation systems - water at the required temperature is stored ready for use in
insulated tanks. • Instant heating systems - where hot water is not stored, but is produced when and where
required. Such systems require great instant power to cope with peak demand periods. • Mixed systems - a limited hot water storage to reduce power demand during periods of
large consumption. Hot water is normally stored at a temperature of 60°C and is delivered to the guest rooms at about 45°C which is satisfactory for the guest comfort. Domestic hot water can be produced by electricity, natural gas, fuel oil, solar or heat recovery devices.
13 %

2001-05-31 23
ÅF-Energikonsult AB F:\CHOSE\relfinal\Final Report 010710.doc 471275-D-SW-03
4.4 Lighting
Lighting installations in hotels must provide adequate levels of illumination for each activity as well as create a pleasant environment and a sense of comfort in each of the different zones. The electrical energy consumed in lighting makes up an important part of a hotel’s total en-ergy consumption. Depending on category of establishment, this can account for 7% of total energy consumption and up to 40% of total electrical energy consumption. Lighting levels necessary for each zone is, among other things, established in the lighting regulations of each particular country. The levels should be reached by using suitable lamps for each case. For reference purposes, installed power is 10-20 W/m2 for rooms and 15-30 W/m2 for general service areas, giving an energy consumption of 25-55 kWh/m2 per year. 4.5 Catering - the kitchen
On the basis of square footage, the kitchen has the most energy intensive activities in a hotel. Depending on the type of hotel, the kitchen may be equipped to serve only breakfast or a large number of meals during the day. Naturally, energy consumption is dependent on to the num-ber of meals served each day, as well as the type of food prepared. Studies have shown that kitchens represent 25% of total hotel energy usage. The major por-tion of energy use in the kitchen (60-70%) is for appliances and cooking. The studies also indicate that a substantial base load exists during night- and early morning hours, when the kitchen is inoperative. Refrigeration of foodstuffs is a permanent portion of that indicated base load. The most common source of energy for cooking is gas. The average energy consumption in kitchens is around 1-2 kWh per meal. • It is estimated that some 4,5 litre of domestic hot water at 60°C are required for cooking
each meal. In addition, hot water for washing the dishes is needed. The sum of energy consumption for hot water is estimated to 0,2-0,3 kWh per meal.
• Cold requirements for conserving food before and after cooking range from 0,1 to 0,3 kWh per meal.
7 %
25 %

2001-05-31 24
ÅF-Energikonsult AB F:\CHOSE\relfinal\Final Report 010710.doc 471275-D-SW-03
• The electrical power required by the auxiliary equipment used in kitchen is much lower
than the usage for hot water and refrigeration. Ventilation in kitchens is very important, as smoke is produced during cooking which needs to be quickly expelled. Fans and extractor fans can make up a large proportion of total energy consumption in kitchens.
4.6. Other services
4.6.1 Laundry For those hotels offering these services, the energy used for laundry constitute a significant share of energy consumption. The main functions are heat energy for hot water, dryers, and pressing equipment. Steam can also be used for sterilisation purposes. Average consumption is 2-3 kWh per kilo of clothes, divided among washing (at temperatures of 60-80°C), drying, ironing and general electricity consumption. Generally, the laundry ser-vice operates on steam at a temperature of 110° to 120°C. In some instances, comfort devices are installed to alleviate intolerable conditions for the per-sonnel working in the laundry facilities. One interesting characteristic of the laundries is that the energy use remains fairly constant regardless of occupancy. This indicates that certain equipment and lighting are turned on for the same time periods each day regardless of workload, and a potential for more energy effi-cient laundries ought to exist with better planning and management. 4.6.2 Swimming pools Swimming pools use a great deal of energy. It is estimated that swimming pool systems re-quire from 45.000 kWh to 75.000 kWh per season. There are other ways of dividing the energy consumption in hotels. In many of the above categories electricity and ventilation is included. Below, these matters will be discussed more in detail.
7 %

2001-05-31 25
ÅF-Energikonsult AB F:\CHOSE\relfinal\Final Report 010710.doc 471275-D-SW-03
4.7. Electrical system and equipment The electrical energy consumed may account for 26-30 % of total energy consumption. Every hotel has a continuous base load requirement for electricity. It could range from 25 kW for a small transient motel to more than 1 MW for a large convention type hotel with >1.000 rooms. Regardless of occupancy, hotels are using a certain amount of electricity. The base load would include such activities as: • Lighting of hallways, lobby and other public areas, including exterior lighting. • Electric motors driving pump for water circulation, fans for ventilation and/or heating and
cooling of certain areas. • Operation of refrigeration compressors for perishable food in the kitchen. • Operation of ice and vending machines. • Emergency engine generator sets; emergency lights, elevator service, alarm and call sys-
tems etc. 4.8. Ventilation Ventilation systems are used to maintain optimal air quality in the different areas. Poor venti-lation can greatly reduce comfort levels, but excessive ventilation wastes energy. It is quite common that good management of ventilation can increase energy efficiency significantly. Table 6: Air renovations in hotels.
Source: Rational Use of Energy in the Hotel Sector, Thermie Programme Action -B-103, 1995.
Ventilation Air flow (m3/h per person)
Hotel and Motels
Foreseen persons in 100 m2 Minimum Recommended
Rooms (sing./double) 5 12 17-26 Toilets 34 51-85 Corridor 5 9 12-17 Public areas 32 12 17-26 Small meeting rooms 75 26 34-43 Large meeting rooms 150 26 34-43 Public toilets 107 26 34-43 Restaurants Dining room 75 17 26-34 Kitchen 21 51 60 Cafeteria, Snack bar 107 52 60 Bar 160 51 68-85

2001-05-31 26
ÅF-Energikonsult AB F:\CHOSE\relfinal\Final Report 010710.doc 471275-D-SW-03
4.9 Thermal energy systems and equipment The thermal energy systems serve as the source of comfort conditioning – both space heating and cooling. It is also the source of hot water for personal hygiene, laundry, cooking, and, in some instances, provide steam for sterilisation purposes. Steam boilers and/or hot water boilers are generally used to produce low temperature hot wa-ter for heating and domestic hot water generation. If steam boilers are used, steam from the boilers is fed through heat exchangers. Different types of heating and air conditioning systems Space heating of the guest-rooms can be produced by local electric resistance heating, local or centralised electric heat pump or central hydronic systems. Air conditioning units are used in guest-rooms, hallways, meeting rooms and lobbies. Different types exist: • Fan coils units that contain a heating coil, cooling coil, fan and filters. They use chilled
and/or hot water coming from a central system. • Self-contained units that are the units commonly used through-the-wall or through-the-
window. These incremental units have integral air-cooled condensing units and supply fans, which re-circulate and cool the air in the room.
• Incremental units are self-contained units where the refrigerant system is included in the casing. The window type unit, which are controlled by the guests, are the main example of such units. Window and through-the-wall air conditioning units are substantial energy consumers. The Coefficient of Performance, COP, of older units only average about 1,75 kW of cooling capacity per kW of electric power. The COP of new units is 2,5 or higher.
• Package units contain both the refrigeration system and heating capabilities. In some in-stances the roof top units contain a gas-fired heating section. Heating is also accomplished by either steam or hot water coils. As the name implies, all equipment, including fans and filters, are contained in one cabinet.
• Multi-zone units consist of a cooling coil (cold deck) and a re-heat or heating coil (hot deck), and in some cases a preheat coil. A series of outlets (zones) are provided from both the hot deck and the cold deck. Dampers modulate and mix the air to attain the proper temperature. The dampers are controlled from a remote zone or area. These units are ca-pable of heating one zone, while at the same time, cooling another.
4.10 Specific energy characteristics in each partner country 4.10.1 Cyprus Cyprus has one of the highest solar radiation in the world on a horizontal area – 5,4 kWh/m2 per day. This makes the country quite attractive for solar energy applications. The solar en-ergy on Cyprus is mainly used for heating water. In the Hotel sector 10% of total energy con-sumption came from solar energy in 1994. The largest share of the energy consumption was produced by diesel 46%. Liquified Petroleum Gas counted for 8%.

2001-05-31 27
ÅF-Energikonsult AB F:\CHOSE\relfinal\Final Report 010710.doc 471275-D-SW-03
The energy supply in Cyprus comes from imported oil (91%), imported coal (4%) and solar energy (4%). 4.10.2 Greece A basic natural gas network has been constructed in Greece, but so far only the industries have had access to the network. The gas has now been extended to parts of Athens, Thessalo-niki, Larissa and Volos. The fuels most commonly used in Greek hotels are light fuel oil, diesel oil and Liquified Pe-troleum Gas (LPG). 4.10.3 Italy The natural gas distribution net in Italy is developed in all regions except Sardinia. A part of the gas is produced in Italy, but a large part is imported from Russia, the Nether-lands and Algeria. 4.10.4 Portugal Most of Portugal’s population and business centres are reached by natural gas distribution net since 1998. The major part of the energy consumption in Portuguese hotels, 45%, comes from electricity followed by Liquified Petroleum Gas with 26%. Portugal also receives a fair amount of sun; averaging from 400 to 700 kWh/m2 yearly for the mainland. 4.10.5 Sweden Natural gas is only available in the south-west of Sweden. Some municipalities have available bio gas and deposition gas, but they are presently used in vehicles and existing heating plants.

2001-05-31 28
ÅF-Energikonsult AB F:\CHOSE\relfinal\Final Report 010710.doc 471275-D-SW-03
5 The combined Co-generation and Cooling System -
CHCP As seen in chapter 3 and 4 the use of energy in the hotel sector represents a large amount of the total running costs. The possibility of applying different combined heat, cooling and power systems (CHCP) has therefore been analysed as a means to reduce the cost for energy consumption. The important parameters affecting the choice of energy production systems in the hotel sector are described in this chapter. A more comprehensive analysis of co-generation plants as well as absorption chillers is presented in Combined Heat and Power generation CHP, Appendix A and Absorption chillers, Appendix B respectively. 5.1 Concept and benefits of combined CHCP Co-generation (CHP) is the term universally applied to the simultaneous production of elec-tricity and heat. CHP offers two prime advantages by contributing to a more efficient use of energy and at the same time to convert part of the fuel used into high-valued electricity. Co-generation systems have been designed and built for many different applications. There are large-scale systems of co-generation used for production of electricity and district heat-ing, were steam or hot water are distributed in pipelines. Many towns in the northern part of Europe have a very well developed system where the district heating supplies more than 70 % of the total heat demand in the cities. Another use of co-generation is for industrial purposes. Co-generation systems are also available to small-scale users of electricity and have during the last years been developed for use in many different applications. CHP can further be developed towards an even more efficient energy production, through the combination of heat, cooling and power production (CHCP). This can be achieved by using CHP in combination with an absorption chiller, where the system uses the co-generation heat to drive absorption chillers as a means of receiving cold water for air conditioning2. The sys-tem of CHCP has different advantages, both on a national and business level. These advan-tages are further described below.
2 The project has chosen to focus on only studying a traditional CHP- and CHCP-systems as presented in figure 5, Principal of CHCP and energy end use. There are, however, other forms of systems that use the power from the prime mover shaft and the recovered heat in a different way. Three of them are described here: • Direct drive for compressors or refrigeration plants with the use of the recovered heat for processes or space
heat and domestic hot water. The direct drive is used to drive compressors for air-conditioning chillers, re-frigeration plants or compressors for compressed air.
• Drive of a generator for producing electricity with heat recovery in the form of hot air for drying or space heating. Instead of using water as a transfer medium hot air can be used in industrial or agricultural proc-esses as well as for space heating in large open buildnigs.
• Integration of heat pumps with co-generation. This system has a very high heat generation efficiency.

2001-05-31 29
ÅF-Energikonsult AB F:\CHOSE\relfinal\Final Report 010710.doc 471275-D-SW-03
5.1.1 National benefits A system for CHCP has the following benefits on a national level: • Fewer electricity shortages
Co-generation by industrial and commercial facilities reduces demand on the utility and makes electricity available for distribution elsewhere.
• Primary fuel savings Higher total energy efficiencies in comparison to conventional thermal power plants.
• Enhanced efficiency of electric utility service Centralised power plants have high transmission losses. This is not the case with co-generation plants being located near the end-user.
• Reduced emissions - NOx emissions are 25% lower in comparison to electricity produced in coal-fired
power plants and heat production in boilers. - CO2 emissions are 30 to 60% lower than those from conventional energy supply
source. - No sulphur emissions.
• Increased reliability Co-generation plants with two or more engines are reliable electricity producers during peak demand periods.
• Possibilities of use of environmentally friendly fuels Co-generation fuelled by biogas, sewage gas, landfill gas, etc. is CO2-neutral and makes use of methane gas (CH4), which otherwise destroys ozone.
• Attractive investment costs with appropriate system design The investment costs for gas engine driven co-generation systems are very attractive in comparison to conventional power plants.
5.1.2 Financial benefits As stated above, the principal objective of any combined heat, cooling and power installation is to minimise the costs for the energy consumption for the owner or the operator. Looking at a system for CHCP from a business perspective the following credits has been pointed out: • reduces energy cost • improves profit margin and gives a competitive edge • offers security against energy price fluctuations • makes available a more reliable power supply • improves the power supply quality When optimised, CHCP is an environmentally friendly method of energy production reducing fuel need and increasing competition in generation, for this reason it could be considered as a vehicle promoting liberalisation in energy markets.

2001-05-31 30
ÅF-Energikonsult AB F:\CHOSE\relfinal\Final Report 010710.doc 471275-D-SW-03
5.2 The design of CHCP and factors influencing the installations As stated above, a system for CHCP is defined as the sequential production of electrical or mechanical power and thermal energy such as steam, hot and chilled water. A system for CHCP can principally be consisting of the following equipment: • Boilers, which generate steam by direct firing. • The co-generation package which includes the:
Turbines, converting chemical energy to shaft power for electricity or mechanical drives or Reciprocating engines, converting fuel energy to shaft power for electricity or mechanical drives. For these two a common term is the prime mover. Generators, which convert mechanical shaft power to electric power. This is also called the alternator.
• Heat recovery systems, which convert part of the rejected heat into useful heat.
• Absorption chiller, which convert heat to cold water for air conditioning.
• Electrical driven chillers, which use electricity for air conditioning.
• Cooling tower, for cooling of waste heat.
• Heating, refrigerating and air-conditioning equipment, which includes heaters for building heating and domestic hot water as well as refrigeration equipment for air-conditioning.
• System controls, which ensure efficient and safe operation.
The basic co-generation configuration useful in hotels consists of a topping cycle unit set were electricity is produced first and the thermal energy exhausted is captured for further use. A principal structure of a CHCP is shown in the figure below.

2001-05-31 31
ÅF-Energikonsult AB F:\CHOSE\relfinal\Final Report 010710.doc 471275-D-SW-03
Cooling use Climate cooling
Electric use
Thermal useSpace heating and domestic hot water
Cogeneration unit
Heat only boiler Absorption chiller
Electrically drivenchiller
National grid
Figure 5: Principal of CHCP and energy end use. Generally, a rough assumption commonly used is that the thermal output of a CHP plant at full load should amount to about 30% to 50% of the maximum yearly heat requirement at full load in a hotel (kW). This is due to experience, which has shown than the co-generation mod-ules can cover about 50% to 70% of the yearly energy requirement (kWh). For peak load pe-riod’s, boilers supply the rest of the heat demand. The are several configuration for connecting the co-generation systems to the existing heating, cooling and electrical systems. Most systems are connected in series with existing heating systems, although parallel connection can be selected when co-generation supplies a not too large proportion of the heat load. Electrical connection is normally in parallel to the grid and to the low-voltage system, although units rated at more than 500 kWe and with a high load factor may be linked to the high voltage system and export power back to the grid during pe-riods of low on-site demand. Most of co-generation systems use synchronous generators. CHP systems, from 15 kWe (electrical) up to 1 MWe, can be used for hotels, usually driven by a small gas turbine or an internal combustion engine burning gas or gas oil. All types of small systems for combined energy production using gas turbine and reciprocat-ing engine, available today, are commercially ready and applicable to the specific require-ments of hotels. However, three systems are particularly suitable due to their costs and sim-plicity as well as their technical and thermodynamic characteristics: • CHP with turbine engine. • CHP with standard temperature reciprocating engine.

2001-05-31 32
ÅF-Energikonsult AB F:\CHOSE\relfinal\Final Report 010710.doc 471275-D-SW-03
• CHCP with high temperature reciprocating or turbine engine and absorption chiller. The fist two systems are composed of CHP-systems and are normally developed as a com-plete package, which are relatively simple to install. They are also small enough to be located in existing boiler rooms and effectively replace the main boiler, linking into the existing heat-ing distribution system. These two system types constitute the basic form of co-generation suitable for a majority of hotels and are generally sized to cover only the base load of domes-tic hot water needs. These systems can also be designed as to operate to meet the thermal load and the electricity base load of a hotel. By doing so, the result is a simple system, which can meet most of the energy demand of the hotel without having to be equipped with a configura-tion of electricity export to the local grid. The third system, the CHCP plant, saves more energy than the first two configurations, but is more complex and expensive to install and requires larger space for instalment. Further, to be viable, CHCP must operate almost continuously for extended periods of time and, ideally, a thermal need must exist to completely utilise all or most of the waste head recovered from the on-site engine-generator set whether it is for domestic hot water, space conditioning or proc-ess steam. The combination of co-generation with absorption chillers increase the module operating time at high thermal load though additional utilisation of exhaust heat with a sum-mer load and decrease the connected electrical load and hence reduction of energy costs. These three systems are further described below.

2001-05-31 33
ÅF-Energikonsult AB F:\CHOSE\relfinal\Final Report 010710.doc 471275-D-SW-03
5.2.1 Turbine engine CHP system In hotels, CHP turbine engine packages can be used and sized to produce electricity and to meet the thermal base load. The turbine engines are compact power generation systems pro-viding electrical power up to 200 kW, running at very high speed. In addition to producing electricity, the turbine engine produces usable exhaust heat using a heat exchanger of gas-water counter-current flow type, which transfers the thermal energy from the exhaust gases to the hot-water system. The gas turbine operates to meet the thermal load needs. As to cover the energy peak demand the system is connected in parallel with a hot water boiler that will supply the rest of energy demand. Currently typical CHP turbine engine packages performances at ISO conditions are:
- net electrical efficiency 17-30% - net thermal efficiency 35-50% - net total efficiency 85-80% - exhaust gas temperature 560-270°C - engine speed 110.000-96.000 RPM - exhaust gas flow 9-24 Nmc/kWh - exhaust gas outlet temperature 55°C - water inlet temperature 50°C - water outlet temperature 70°C - electric to thermal ratio 1/4-1/1,7
The upper electrical efficiency of gas turbine is due to the use of regenerator. Fuel used for calculations: Natural Gas. 5.2.2 Reciprocating engine CHP Reciprocating engine systems are the most commonly applied in the 30-1000 kWe size range of co-generation plants. Each unit can readily be tailored to the hotels specific requirements. Reciprocating engine systems usually use natural aspired or turbo-charged, inter-cooled in-dustrial engines. These are commonly derived from standard diesel engine blocks and are normally fitted with spark ignition systems. The main fuel used is natural gas, although diesel, LPG, propane and biogas can be used. In these systems, the engine drives an electric generator while the heat from the engine ex-haust, jacked water and oil cooling generates low-pressure steam or hot water. Using heat exchangers, the heat rejected by the water and oil cooling can be totally recovered and 50-70% of the exhaust energy is economically recoverable, due to the fact that exit tem-perature of exhaust remains generally above 150°C to avoid exhaust condensation in ducts. To avoid far too expensive and large heat exchangers, the minimum drop temperature usually utilised between primary and secondary circuits is 25°C.

2001-05-31 34
ÅF-Energikonsult AB F:\CHOSE\relfinal\Final Report 010710.doc 471275-D-SW-03
More versatile jacked heat recovery methods are grouped into: • Standard temperature up to 99°C outlet temperature. • High temperature, up to 127°C outlet temperature. In both cases the engines are generally designed to operate with a jacked water temperature differential of less than 10°C. 5.2.2.1 CHP with Jacked Water Standard Temperature Reciprocating Engine This system is connected in parallel with a hot water boiler covering the peak demand. The CHP system uses a heat exchanger to transfer the jacked water heat to a secondary circuit, which warm up the water in the load circuit at an intermediate temperature. After-cooler and oil cooler heat rejection is usually included. To reduce the temperature drop between primary and secondary circuit, plate heat exchangers are generally used. There are many advantages inherent with this design; the standard engine jacket water pump, thermostatic configuration, and water bypass line are retained. The engine system is inde-pendent from the load process loop, which allows operation with antifreeze and coolant con-ditioner. This alleviates concern for problems associated with using process water to cool the engine. After the jacked water heat exchanger, an exhaust heat recovery device, in series with the re-covery system, consents to reach the desiderata final temperature of water load. Normally the recovery device is a shell and tubes heat exchanger. When heat demand in the hotel is low with power still required, the engine must be cooled, because the normal process load is insuf-ficient to absorb enough heat. This is done through load balancing thermostatic valves that limits jacket water inlet temperature by directing coolant though a secondary cooling source. Further, to control the exit temperature the exhaust recovery device can be bypassed using two pneumatic valves.

2001-05-31 35
ÅF-Energikonsult AB F:\CHOSE\relfinal\Final Report 010710.doc 471275-D-SW-03
Using jacked water standard temperature reciprocating engine packages, currently typical CHP performances at ISO conditions are: - net electrical efficiency 30% - heat rejected to jacket 37,5 % - jacket water inlet temperature 84°C - jacket water outlet temperature 90°C - heat rejected to exhaust 22,5 % - exhaust stack Temperature 445°C - exhaust outlet temperature 120°C - exhaust gas flow 5,70 Nmc/kWh - net thermal efficiency 60% - net total efficiency 90% - engine speed 1.500 RPM - electric to thermal ratio 1/2 - water inlet temperature 75°C - water outlet temperature 85°C Fuel used for calculations: Natural Gas. 5.2.3 CHCP using reciprocating engine or turbine and absorption chiller The third system consists of a combination of co-generation with absorption chillers. The co-generation system, based on a gas engine or a turbine, generates most of the electrical energy required in hotel, whilst the recovered heat is used either for cooling purposes, via the absorp-tion chiller, or for heating the water for domestic and air conditioning purposes. 5.2.3.1 Absorption chillers The most important parameter used for the selection of the absorption chillers and their work-ing conditions is the Coefficient of Performance (COP), defined as “useful energy out/total energy in”. The COP depends on whether the chiller is of half, single or double-effect. Further it is dependent on the temperature of the driven flow. High COP saves energy and reduces cooling water consumption, since the evaporation on the cooling tower depends on the sum of energy input and energy output. In the table below, the characteristics of four different ab-sorption chillers are presented. These are further described in Absorption Chillers, Appendix B. Table 7: Characteristics of four different absorption chillers. Source: Italian report.
Chiller Type Thermal COP Temperature range °C Half-effect 0.35 80 – 100 Single-effect 0.70 120 – 132 Double-effect 1.1 150 – 170 Triple-effect >1.6 170 – 200

2001-05-31 36
ÅF-Energikonsult AB F:\CHOSE\relfinal\Final Report 010710.doc 471275-D-SW-03
The most efficient triple-effect chillers are in the same range as the COP of an electric chiller, in terms of primary energy. However, because absorption chillers' initial costs are relatively high, heat-driven absorption chillers only comprise a fairly small portion of the chiller market today. Of these, most of the absorption chillers are gas-fired. Of the small-scale CHCP tech-nologies, only conventional turbines have outlet temperatures high enough to drive double and triple effect chillers. At present, high costs, large sizes ant too low COP makes half-effect chillers not useful for CHCP purposes. 5.2.3.2 The CHCP configuration In the CHCP-system, single-effect absorption chiller produces chilled water utilising water as the refrigerant with cooling as low as 32°C and waste hot water as energy input. Cooling tower is utilised for cooling of the recirculating water. For this arrangement, a three-way mixing valve is used to control the capacity of the absorp-tion chiller by varying the quantity of hot water flowing through the machine. The engine’s waste heat is recovered from the engine jacket cooling water and the exhaust gases in series, in the form of pressurised high temperature hot water. The system operates similar to the standard temperature used by reciprocating engine system, except that elevated jacked water temperatures varying from 99°-27°C are used. During the summer season, pressurised water supplies the primary circuit of a heat exchanger and the absorption chiller. During the winter season the cooling machine is instead by-passed and the CHP plant deliver only heat at the heat exchanger. The secondary circuit of the heat exchanger supplies hot water for air conditioning system, guestrooms, swimming pool, cater-ing and other domestic uses. Maximum efficiency of the system is achieved when the unit is operating at full load. As to achieve this, the thermal power of the co-generation system should be selected using the total Thermal Load Duration Curve, including the heat needed to supply absorption chillers cover-ing the total demand of cold water. Then, the size of the absorption chiller is selected on the basis of the exhaust thermal energy, available from the selected CHP plant. Both the inlet and outlet temperatures of the recovery system are selected on the basis of ab-sorption chiller needs. Hot water supply of 120°C will provide sufficient heat for the chiller. Lower hot water temperatures may not achieve the nominal capacity and reduces COP. Maximum temperature can reach 132°C. Temperature drops higher than 15°C reduces again the COP. Due to the high temperature needs, separate circuits remove the after-cooler and the heat rejected to lubricating oil. The heat removed by the after-cooler and the lubricating oil is not recuperated. The electrical and thermal production of the CHCP is independent from each other. When normal process load is insufficient to absorb enough heat, load balancing thermostatic valve limits jacket water inlet temperature by directing coolant though a secondary cooling source. To control the exit temperature the exhaust recovery device can be bypassed using two pneu-matic valves.

2001-05-31 37
ÅF-Energikonsult AB F:\CHOSE\relfinal\Final Report 010710.doc 471275-D-SW-03
The system is further connected in parallel with a hot water boiler covering the thermal peak hotel’s demand. Peak demand for chiller air/fluid is compensated by an electrical driven chiller in parallel with an absorption chiller. Currently the typical performances at ISO conditions of the CHCP showed are: Using, CHCP with high temperature reciprocating engine and single-stage absorption chiller currently typical CHCP performances at ISO conditions are: • net electrical efficiency 33,3% • heat rejected to jacket 22,5 % • jacket water inlet temperature 122°C • jacket water outlet temperature 127°C • heat rejected to lube oil 6,4 %
(not recuperated) • heat rejected to after-cooler 3,8 % • (not recuperated) • heat rejected to exhaust 18 % • exhaust stack temperature 425°C • exhaust outlet temperature 150°C • exhaust gas flow 4,60 Nmc/kWh • net thermal efficiency 4 0,5% • net total efficiency 73,8% • engine speed 1.500 RPM • electric to thermal ratio 1/1,2 • water inlet temperature 130°C • water outlet temperature 115°C • absorption chiller COP 0,7 • cooling tower water consumption 4 kg/h Fuel used for calculations: Natural Gas. Recovery of heat rejected to after-cooler and to lube oil for low temperature thermal purposes increases the net thermal efficiency at 50% and the total efficiency at 84%. In all CHCP-installations, designed and sized to meet thermal load, the electricity produced should be utilised as much as possible by the demand of the supplied object. As a result high tariffs for electricity and load charges can be saved. The surplus of electricity produced is exported to the local grid and importing power from the public supply/local grid covers any shortfall in electricity.

2001-05-31 38
ÅF-Energikonsult AB F:\CHOSE\relfinal\Final Report 010710.doc 471275-D-SW-03
6. Case studies overview Based on the analysis in chapter 3 and 4 of the hotel sector and its energy consumption, a number of representative hotels from each country were selected for case studies. The main objective for the case studies has been to confirm energy profiles for the hotel sec-tor and the appropriate CHCP-plant installations. The second objective has been to identify some general parameters as to categorise hotels into groups and match them to specific energy profiles. The Case Studies consist of the following components: • Selection of hotels (a total number of 60 hotels in six European countries), • Survey on the selected hotels through short energy audits, • Detailed energy audits to confirm the energy uses and specify the energy profile for each
hotel (performed on 44 of the originally 60 selected hotels), • Economic evaluations to estimate appropriate CHCP-plants in hotels and their economic
viability. The criteria for selection of the hotels, the methods used for energy auditing and the economic evaluation are further described below. 6.1 General considerations on the selection of Hotels As illustrated in Chapter 3 and 4, the structure and composition of the hotel sector show many differences in each country participating in the study. At Cyprus the hotels are mainly big tourist complexes while in Italy and Greece the hotels are smaller. Italy also has the undoubt-edly largest amount of hotel. The Portuguese hotel sector is quite heterogenous, and hard to characterise with a specific hotel type. Swedish hotels are in general large business hotels, with many hotels in the size of 150 beds or more. Thus, any general criteria for the selection of hotels have been difficult to apply, which are valid for the hotel structures in all the participating countries. As a consequence the selection of hotels in each country has been made more on pragmatic basis than through a specific method. However, an important criteria for the selection, has been to include those hotels that are representative for the hotel structure as a whole in each country. The selected hotels can therefore be regarded as representative for both the southern and northern part of Europe, which has allowed the project to cover the main climate extremes in Europe. The composition of the hotel sector within each country has been described using parameters vital to decide the suitability of a CHCP plant investment - where the suitability is equal to the expected economic viability of the investment. Parameters of great importance for the selec-tion of hotels have been:

2001-05-31 39
ÅF-Energikonsult AB F:\CHOSE\relfinal\Final Report 010710.doc 471275-D-SW-03
• The magnitude of energy used for heating, cooling and electricity. • The capacity of investments of the hotel. • The availability of a suitable energy source. These issues were specified in parameters such as size, guest type, occupation rate, quality type, geographical location and availability of energy sources. They are discussed below. • Size Size is an important parameter in order to determine pay back time for a CHCP plant invest-ment. Large hotels in general use more energy compared to hotels with fewer rooms, and since the investment cost is not linear to the magnitude of the CHCP plant, larger hotels are more likely to obtain shorter pay back time on their investment. • Guest type The guest type is another important parameter Business hotels generally are situated in city centres, they are generally large and are open all year. Holiday hotels are often situated in tourist areas outside cities, they are often small and are often open only during tourist seasons. Therefore, business hotels are considered more suitable for CHCP plant installations. • Occupation rate The occupation rate is referred to as the average amount of occupied rooms in per cent of total amount of rooms. This parameter is connected to the economic capability of the hotel, which is important when selecting hotels suitable for CHCP plant investments. Hotels with high oc-cupation rate are likely to be more suitable for CHCP plant installation. • Quality type Quality is measured differently in the various partner countries. However, in general, a hotel with a high quality level is expected to have a higher level of extra equipment and services and as a consequence of that, also a higher consumption of energy which generally make them more suitable for CHCP. • Geographical location The geographical location of the hotel is obviously interesting since very cold areas and very warm areas bring forth a need for more energy than the average amount of heating and cool-ing for hotels. • Availability of energy sources The energy sources available at a specific location are also of great importance for the eco-nomic performances of a potential CHCP plant. In broad outlines, a CHCP-installation is likely to give a higher economic performance with the availability of natural gas. Derived from different procedures of selection, ten hotels in each country were chosen that were likely to be suitable for a CHCP plant installation, except for Cyprus where five hotels has been chosen. Presented below is an account for the specific parameters used by each par-

2001-05-31 40
ÅF-Energikonsult AB F:\CHOSE\relfinal\Final Report 010710.doc 471275-D-SW-03
ticipating country. A more detailed description on the specific hotels chosen is available in the Intermediate report, December 1999. 6.1.1 Selection of hotels in Cyprus The criteria set for the choice of the hotels at Cyprus to satisfy the needs of this study were the following: • High quality (within the 5 star to 3 star range) where the hotel management are more
likely to be in favour of investments leading to greater comfort. • Large size (within the 200 rooms and above range), since larger hotels are more likely to
obtain shorter payback time on their CHCP investment. • Holiday hotel: Holiday hotels were chosen since the majority of hotels in Cyprus are holi-
day hotels. • Cover a range of locations instead of one location. Based on the mentioned criteria, four hotels are participating in the study so far. Geographi-cally, two are in Limassol, one in Ayanapa and one in Paphos. One of the chosen hotels is a 5-star hotel, two are 4-star hotels, and one is a 3-star hotel. 6.1.2 Selection of hotels in Greece In Greece the selection of hotels has been primarily city or business hotels and secondly large tourist seasonal hotels. The specific criteria set for the selection of hotels in Greece has been as follows: • Medium-sized and large hotels (above 100 rooms) since larger hotels have a greater
chances to obtain a shorter pay-back period on their investments • City-business hotels because they operate all year and they have both heating and cooling
systems. • Large holiday-tourism seasonal hotels with several facilities, situated in islands, in order
to examine the viability of CHCP systems and their effect to primary energy consumption at energy isolated regions.
• Cover a variety of climate characteristics and climate zones. As mentioned earlier, most of the hotels in Greece are small with less than 50 rooms and 2/3 are tourist seasonal hotels. This common hotel category does not meet the minimum CHCP criteria’s stated above. Despite this fact, two of the hotels selected for the Greece case study have been seasonal hotels, however with large sizes. Commonly these hotels uses electricity produced by internal combustion engines or small steam-power stations that burn exclusively fuel oil or diesel oil. Therefore, a specific interest exists concerning the potential positive ef-fect by CHCP on primary energy use in these specific isolated regions of Greece (Rhodes, Crete, Corfu etc.).

2001-05-31 41
ÅF-Energikonsult AB F:\CHOSE\relfinal\Final Report 010710.doc 471275-D-SW-03
Table 8: Climate characteristics in Greece. Source: Greek report. Thessaloniki Athens Rhodes Latitude N 40° 31’ N 37° 58’ N 36° 23’ Longitude E22° 58’ E 23° 43’ E 28° 07’ Degree days 1.725 1.100 896 Climatic zone C B A Ambient reference temperature -5° C +1° C +3° C 6.1.3 Selection of hotels in Italy The Italien hotel sector is characterised by many small hotels with low quality standard. However, for the case study, larger high quality hotels were chosen since they have a higher potential to obtain a shorter pay-back period on their investments. Initially, 21 Italian hotels were chosen for short energy audits. Based on the results from these short energy audits, 10 hotels were chosen for a detailed energy audit to characterise the en-ergy profile demand for electricity, heating and cooling. The hotels chosen for the detailed energy audits studies are located in Rome, Agrigento, Florence, Milan and Venice represent-ing three different climate zones. All of the hotels are classified as 4 star- business and leisure hotels and half of them are situated in city centres. The hotels are either large (more than 150 rooms) or medium sized (100-150 rooms), and all hotels had restaurants. 6.1.4 Selection of hotels in Portugal In Portugal data from a recent study sponsored by the Portuguese Directorate General for En-ergy (DGE, 1999) was used. That study covered the energy consumption on 4 and 5 star ho-tels all over the country and could therefore contribute with useful material. The new audits were then targeted to 3 star hotels and to hotel-apartments. As an extreme case, one state-inn ("Pousada") was selected, as this object has different consumption patterns compared to the typical hotels (although being smaller in size). Due to higher occupation rates the state-in was considered to have a potential of cost-effectiveness with an installed CHCP system. The approach was to choose a set of hotels and hotel-apartments from different climate re-gions, but situated in districts where minimum occupation rates are reasonable (>30%). The hotels were also selected as to fit into three different size classes (in number of rooms), namely around 100, 200 and 300 rooms, and smaller only if they included a swimming pool. The obtained list was filtered according to the exclusion criteria defined by the consortium, type of climate in the region and type of air-conditioning system.

2001-05-31 42
ÅF-Energikonsult AB F:\CHOSE\relfinal\Final Report 010710.doc 471275-D-SW-03
Table 9: Selected hotels in Portugal. Source: Portugal report. Type Location Number of rooms Hotel 4 quality class Porto 112 Hotel apartment Lisboa 134 Hotel 3 quality class Lisboa 96 Hotel-apartment Cascais 162 Hotel 5 quality class Porto 238 Hotel-apartment Coimbra 138 Hotel 3 quality class Vila Real 166 Pousada Beja 35 Hotel-apartment Portimão 74 apartment and 76 rooms Hotel 5 quality class Vilamoura 387 Hotel 3 quality class Lisboa 252 This set has been selected from 12 cases studied and which audit reports will be supplied by the DGE. From the most interesting 10 has been selected. 6.1.5 Selection of hotels in Sweden Selection of suitable hotels in the northern climate zones of Europe has been carried out in co-operation with Scandic Hotels AB and Holiday Inn AB. Scandic Hotels is a hotel chain oper-ating in many northern European countries in association with Holiday Inn. In order to evaluate the suitability of a CHCP installation, 16 hotels were initially analysed of which 10 hotels in Sweden have been chosen for this study. As natural gas is only available in the south west parts of Sweden, most of the hotels included in the study are located in the southern parts of the country. Further, two of the selected hotels are situated in northern Ger-many. The structure of the selected hotels varies compared to the structure of the total hotel sector in Sweden. They are larger, they generally offer a higher quality and they have a higher occupa-tion rate than the average Swedish hotel. All selected hotels are business hotels. Though there are no existing definition in Sweden for quality classification this parameter has not been used to select hotels for the study. This selection of hotels, with a high number of rooms and high occupation rate, is due to the fact that large hotels have more suitable energy consumption compared to hotels with fewer rooms and lower occupation. These hotels are therefore more likely to obtain shorter payback time on their investment of the CHCP plant. The selected hotels in Sweden are all located in the climate zone with 3000 – 4000 degree-days for heating.

2001-05-31 43
ÅF-Energikonsult AB F:\CHOSE\relfinal\Final Report 010710.doc 471275-D-SW-03
6.2 Method of Energy Audits As the main objective of the case study was to find appropriate CHCP plants for different types of hotels, it has been essential to know the load and load-duration curves for heating, cooling and electricity separately. However, for the predominate part of the hotels in Europe the data on energy consumption, if at all available, are aggregated and presented either as total energy consumption or in the form of heat and electricity load. Due to this fact, the heating and cooling loads have in general not been historically measured, and therefore no relevant information was available for the project. For the electric load however, information has been possible to obtain from electricity companies, at least on high- and low-time basis. Since the required information on load and load-duration was not available for the selected hotels, a method of energy auditing was constructed and used for the project. The method is illustrated in the figure below. As seen in the figure, the phase of hotel selection was followed by the phase of conducting different levels of energy audits in the selected hotels. The respective partner countries con-ducted the energy audits. The first level of auditing has been a comprehensive audit, also called a short energy audit. Of the 60 hotels selected for short energy audits, 44 were as-sessed as having a potential for a CHCP-installation. The short energy audit was followed by a detailed energy audit performed on those hotels assessed as having a potential for CHCP-installations. During the implementation of the pro-ject, it was also realised that a detailed review of energy conservation measures had to be made in order to review more economic measures before considering CHCP. Through the different levels of the energy audits, the specific energy profile for the heating-, cooling- and electrical load as well as the seasonal variations of the profiles have been identi-fied for each hotel. The information has further been divided into typical profiles as described in the figure below.

2001-05-31 44
ÅF-Energikonsult AB F:\CHOSE\relfinal\Final Report 010710.doc 471275-D-SW-03
Hotel characteristics and electrical andthermal energy to evaluate key figures,specific consumption etc.
Saving conservation measures
Energy audit
Have energy savings measures been considered
Implement energy conservationmeasures or undertake sensitivityanalysis
Short-Energy Audit
Identify electrical power by end-use/equipment
Identify heat load production, centralisedand local(end-use/equipment)
Divide the electrical end-users in categories
Category AElectrical end-uselightning etc .
Category CHeat produced byelectricity, candidatesfor replacement
Category BCooling produced byelectricity, candidatesfor replacement
Divide the end-usersin low and high gradetemperature
Divide the end-usersin low and high gradetemperature
Divide the productionin low and high gradetemperature
Define load profileCompile load profilesby using recordeddata or measure theconsumption onhourly basis
Define load profileLow grade temperatureCompile load profilesby using recordeddata or measure theconsumption on hourlybasis, refrigerators etc
Define load profileHigh grade temperatureCompile load profilesby using recordeddata or measure theconsumption onhourly basis, climatecooling etc
Define load profileHigh Grade temperatureCompile load profilesby using recordeddata or measure theconsumption onhourly basis for hot waterto radiators, steam to laundry etc.
Define load profileLow grade temperatureCompile load profilesby using recordeddata or measure theconsumption onhourly basis for domestichot water, ventilation etc.
YES
NO
Selection of hotels
Figure 6: Schematic illustration of energy audit methodology used in the project. Below is a further elaborated description of the different levels of energy auditing. 6.2.1 Short Energy Audit As briefly described above, the energy audit phase of the project started with a comprehensive evaluation of the 60 selected hotels in the participant countries. The evaluation was conducted through a Short Energy Audit Form, with the aim to identify the most suitable hotels to proceed with in the study. The short audit form has been set up to find the main characteristics of the hotel and the consid-ered design elements; i.e. thermal load and electrical load. Both data for a specific year or meas-ured period as well as history records have been analysed to verify the present status and to iden-

2001-05-31 45
ÅF-Energikonsult AB F:\CHOSE\relfinal\Final Report 010710.doc 471275-D-SW-03
tify noticeable trends. Any well-known change in installation and/or energy use during the period has been noted separately. Planned changes for the future, which might influence the load charac-teristics, has also been noted. This short audit form has been used to identify the hotel characteristics as well as installed electrical-, heating-, cooling- and domestic hot water systems. Also, as an important input, any other previous or planned cost-effective energy savings measures have been considered. As for the utilisation of the Short Energy Audit Form, the five participating countries have taken different actions. The main structure of the Short-Audit Form used in the project is presented in Energy Audits form and Checklist for Energy Saving Measures, Appendix C 6.2.2 Detailed Energy Audit Due to the lack of information on the load as well as load curves for heating, cooling and elec-tricity as separate parts of the energy consumption in hotels, more detailed energy audits had to be conducted by the project. This detailed energy audit was conducted on those hotels where a potential for CHCP had been recognised in the short energy audit phase. The objective of the detailed energy audit was to clearly define the thermal- and electrical load profile, as well as the base load and variations. To estimate the appropriate CHCP-plant and its economic viability, it is essential to know the load and load-duration profiles of heat-ing, electricity as well as cooling. However, in the conventional HVAC systems (Heating, Ventilation and Air Conditioning) electric compressors cover the cooling load. Since absorp-tion chillers have been investigated, the cooling load and cooling load-duration profiles had to be examined separately and not as parts of the electric load. The measurements and observations might include extraordinary activities and incidents dur-ing the period, such as larger constructions and operational disturbances. Data has not been adjusted to compensate this. Missing data due to malfunctions in the meters etc have however been rectified. The design elements, (i.e. the different load profiles), considered and determined in the en-ergy audits are the load profiles and its coherence of: • The profile of all heat supplied to the heat load systems. • The cooling load profile – it should be known separately and not as a part of the electric
load. • The electrical load profile to evaluate the electrical out-puts from the CHCP against elec-
trical demand. Additional care must be taken if a two-part tariff is used. Since both electricity and low temperature thermal energy are involved, small CHP- and CHCP-units can have a proper place in the energy management efforts for energy efficiency measures. However, the plant should be designed correctly in order to minimise both invest-ment and running cost. It is also important to know the design temperatures of the installed systems, such as cooling circuits, air conditioning and ventilation systems as well as the sys-

2001-05-31 46
ÅF-Energikonsult AB F:\CHOSE\relfinal\Final Report 010710.doc 471275-D-SW-03
tem for space heating. It is also important to find out the potential for energy conservation measures and include these in a total investment program for the hotel. In practice, a detailed review of energy conservation measures must be undertaken to imple-ment more economic measures before considering CHCP. The findings from the energy au-dits will be presented in chapter 7 and 8. 6.2.3 Load profile assessment • Thermal load assessment Thermal load assessment is composed of heating and cooling load profiles as well as domestic hot water. These load profiles have traditionally not been measured in the hotel sector. Hence, the availability of appropriate data is limited. It has therefore been necessary to conduct on site thermal demand measurements in the selected hotels. The method used has in general been through installations of gauges for measurements at different sites such as burners and boilers. Hotels connected to district heating networks collected data through signals from existing meters. Data was collected in 15 and 30 minutes intervals, and was based on the average value per hour. In addition, indoor and outdoor temperatures have been measured. For the hotels using oil- and gas fired boilers as heating device, data was collected in 15 minutes intervals by using operation times meters. The energy supplied for the period was found by using the data of time of operation together with the oil or gas consumption per mi-nute. The effect used was found by using data on flue gas collected during the yearly check-ups of the boilers. Data on climate cooling has been very limited, the exception being Sweden where some data on district cooling was available. Necessary data was collected by short-term measurements on cooling installations and equipment combined with connecting outdoor temperatures. The data was collected every 15-minutes. The COP-factor (Coefficient of Performance) was cal-culated by collecting temperatures on cool- and heat bearers. The comfort cooling was meas-ured during the main duration of the time of operation. • Electrical load assessment Appropriate data on electrical load profiles for the selected hotels was accessed from utility companies, which are active in the different geographical locations. To separate the electricity needed for cooling from the needs of electricity for other end-uses, the electricity consump-tion allocated to electric chillers has been determined using portable load monitors. To gain an accurate understanding of the electric load profile and the cooling profile, measurements have been made on a relatively long-time basis. As electricity normally is traded on an hourly basis, a requirement on the data obtained from the hotels has been on hour-basis-level. The electrical load profile has therefore been meas-ured and presented on such an hourly basis.

2001-05-31 47
ÅF-Energikonsult AB F:\CHOSE\relfinal\Final Report 010710.doc 471275-D-SW-03
6.2.4 Obstacle encountered A general problem encountered has been that many of the hotels, especially in the southern part of Europe, do not have any energy management- or measurement systems, nor do they have energy managers as part of their business organisations. This makes it difficult to gain historical records and data for an accurate assessment of the profile of thermal and electrical loads. The lack of these data can only be overcome if adequate thermal- and electrical demand measurements are made for long enough periods in order to determine weekly and seasonal load variations. But the extended measurements need substantial work, and are therefore very dependent on available financial and human resources. They should therefore only be carried out if the initial assessment produces encouraging results. At the selected hotels where measurements regularly are being undertaken, the information is in general concentrated on the actual purchase of electricity, water, heating etc. In order to receive appropriate data for better energy management of the hotels, measurements on a less aggregated level are needed. This can for instance be specific measurement on electricity to different end-uses, warm and cold water for catering purposes, heat recovery etc. Further, data on energy consumption would preferably be presented on an hourly basis. 6.3 Method of Economic Evaluation A method of evaluating the cost effectiveness of CHCP was set up. The possible revenues in the forms of energy savings and co-generated electricity that could be sold by the hotels, were compared to the expected cost of energy production with CHCP. This energy production cost is the cost for the primary energy, the maintenance cost, expenses for lubrication oil etc. This financial evaluation is a crucial stage of the initial design work of CHCP. It brings to-gether information from the technical evaluations undertaken, and turns them into potential savings, capital investments, and payback periods. Critical to the economic studies are the estimation of variables such as capital costs, operating costs, duty life, and revenues/savings. The following details are typically needed in the economic analysis of CHCP plants: • fuel costs and their future trends • capital costs • operation and maintenance costs • revenue from electricity sales • savings from in house utilisation of electrical energy • economic life length Economic savings from the operation of a CHCP-system are estimated by comparing operat-ing costs for an alternative system layout that would be adopted if CHCP were not under-taken. In most cases, it consists of power purchased from the local distribution company, combined with heat generation from boilers.

2001-05-31 48
ÅF-Energikonsult AB F:\CHOSE\relfinal\Final Report 010710.doc 471275-D-SW-03
Based on the configuration of the particular system selected, the first thing to estimate is the main operating cost. The major operating costs of all CHCP-systems is related to fuel costs. The concept of incremental fuel costing should be followed to estimate the fuel costs. In addi-tion to fuel costs, operating cost include: • manpower costs, covering operators and supervisors • service and maintenance costs, covering cost of spares and consumables • service contracts for main equipment. 6.3.1 Scope of analysis As to be able to conduct the economic evaluation, a software3 has been developed for the pro-ject. The model is called, Evaluation model CHCP.exe, version 9, and is based on Micro Soft Visual Basic. 6. The analysis has been based on the following fundamental strategy: • The basic idea with the model has been to create a realistic guideline to design the capaci-
ties of a CHCP-system and the surrounding components for a suitable hotel. The idea has not been to optimise the system in detail.
• The main objective of the model has been to receive equivalent output from all calcula-tions regardless of in which partner country the case study has been accomplished.
• To enable the consideration of all variations in the energy demand, such as holidays, peri-ods of low occupation, summer and winter period’s etc. the calculations have been made for a period of a whole year.
• The calculation is further based on an hourly basis. As described above, the data obtained from the energy audits and/or through qualified guesses have been utilised as inputs in the model. More specified, the inputs are the energy demand profiles in MWh per hour on an aggregated level of electricity- and thermal demand, where the cooling and heating have been separated. Further, this calculation model has been developed to be used for installations in existing ho-tels where heat only boilers and electrical chillers are already installed. This implies that this version cannot be used to evaluate CHCP in new hotels under construction. If the program is to be used for new hotels, a conventional design first has to be anticipated, from which the program can be utilised to seek alterations.
3 The software is not developed for commercial use. To be used by any other part than those involved in the project, permission is needed from the involved parties. The purpose of the evaluation model should be seen as a calculation method for the CHOSE project to uniform the evaluation manner. This version is to be used for evaluating installations in existing hotels where heat only boilers and electrical chillers are already installed.

2001-05-31 49
ÅF-Energikonsult AB F:\CHOSE\relfinal\Final Report 010710.doc 471275-D-SW-03
6.3.2 Definitions • Electrical demand refers to all electricity needed for the hotel excluding electricity to elec-
trical chillers. • Heat demand refers to all heat needed for laundry, domestic hot water, space-heating etc
excluding the heat needed for absorption chiller. • Cooling demand refers to all cooling energy needed for to satisfy climate-cooling etc. The aggregated level indicate no specific temperature, no typical day or typical week, but merely straightforward data hour by hour for a year. The calculations do not include "process temperatures". For this specific purpose, it is not necessary to use process temperatures for an economical evaluation. However, in the total information from an energy audit, process tem-peratures have to be included as the system temperatures are needed in order to dimension the equipment in the construction phase. 6.3.3 Methods of calculation The model developed for the project is performing calculation on: • The current installations. Already installed equipment such as old boilers, electrical chill-
ers, installed cooling tower etc. is seen as sunk costs. • CHP only, CHP and an absorption chiller (CHCP installation) can be evaluated individu-
ally selecting different sizes. The program calculates the water consumption at the cooling tower. The investments done for cooling towers are based on the extra installations needed for the new absorption chiller. The extra capacity needed is calculated in the program.
The changing of investment, maintenance and operation (excluding fuel costs) according to size will be taken care of by using cost functions for each type of equipment. As mentioned above, the operation strategy used in the program is to strictly follow the heat- and cooling loads: • The cooling loads are met using the absorption chiller as much as possible. Electric chill-
ers will cover the peak load. • The heat to the absorption chiller, domestic hot water and space heating will be met using
the CHP and for peak load the heat only boiler will be used. No internal loops (linear optimisation method) are included to optimise the operation strate-gies for a CHCP-plant for each hour, taking into account the electrical price, the fuel price, efficiencies etc. The program satisfies the needs for internal heating, cooling and electricity. Sometimes the need for heating and cooling results in that more electricity is produced than actually needed. The superfluous electricity is then sold to the distribution net. Hypothetically, this could lead to the fact that expensively produced electricity is sold to the net for a low in-come instead of buying cheap electricity from the net. However, it is anticipated that the hours when these situations will actually occur are very few. Considering these facts, the operation strategy may perhaps not be optimal at each hour. If the price for buying electricity is low, the

2001-05-31 50
ÅF-Energikonsult AB F:\CHOSE\relfinal\Final Report 010710.doc 471275-D-SW-03
operation cost for the actual system will be low. If the price for selling electricity is high, we will have a potential income that will force us to increase the size of the CHP plant. The production priority for the CHP is to strictly follow the heat load. The first priority is the heat loads for space heating and domestic hot water with no absorption chiller. Later, when using a CHCP, the combination of loads, which consists of the former heat load and the heat needed for the absorption chiller, when an absorption chiller is evaluated will be the produc-tion priority. The same method is used with the balance of using electrical chillers and absorp-tion chillers. Absorption chillers will be used in all situations, even if the electrical tariffs and the COP for some periods or seasons (day and night or winter and summer tariffs) could give lower cost using electrical chillers. However, it is again assumed that the numbers of hours this can actually happen are few. The electricity load cannot be followed using this evaluation model. If there is a shortage of electricity, the model will calculate the costs for buying electricity to satisfy the demand. If there is an over-capacity, the model will calculate the income from selling electricity to the grid. The calculations cannot evaluate the possibility for producing electricity in a cold con-densing mode using the cooling towers to dump the waste heat. Finally, all cost- and efficiency functions are default in the program code, but when changing the capacity the implied calculated change of investment and efficiency are visible during the calculations. 6.3.3.1 In-put data for the evaluation model The input data is organised in five separate files. Three files contain the data for electrical demand, heat demand and cooling demand respectively for the specific hotel studied. The year starts on a Monday, and the first data represent an average demand for the hour between 00.00 and 01.00 and so on. It is important to define the starting day as well as the starting hour due to the electrical tariff. The load shall be given in kW. The two remaining files define the electrical tariff for buying and selling electricity in the same way as for the load curves. These files are synchronised with the energy profiles. A separate module organises the individual electrical tariffs used by the local electrical pro-ducer. A change of price at 09.30 instead of 09.00 might cause a minor problem. Different tariffs can easily be used for the sensitivity analysis. Absolute load curves (kW and kWh) and relative load curves (0 to 1) can be used in the program. The following prices and costs are given as input to the model: • fuel for heating, • fuel for CHP, • interest rate • time span to be used • capacity charges for electricity in Euro/kW year.

2001-05-31 51
ÅF-Energikonsult AB F:\CHOSE\relfinal\Final Report 010710.doc 471275-D-SW-03
6.3.4 Assumptions in the technical and economical calculations The following assumptions have been made for the calculations: • Ideal regulation is assumed, which means that the production system completely follows
the demands given. • The capacity of energy production of the calculated CHCP-plant is based on the actual
thermal load of the hotel, which is the sum of heat- and cooling demand. • The evaluation model has no function for storage, neither for domestic hot water nor heat-
ing and cooling. The assumption made for the model is instead that all variation happens within an hour.
• There are many economical methods that can be used to analyse an investment – net pre-sent value (NPV), internal rate of return and the annuity method. For this model the method of net present value of the total costs and benefits during the economic life time period of the investment, and simple pay back has been used. The method is not based on any interest rate. However, the same result will be obtained by putting a zero interest rate when calculating the net present value as a function of lifetime. Therefore, by using sim-ple payback and net present value, essentially the same result will be received ranking the results for different installations. The calculation of net present value has been performed using the common evaluation model and the following assumptions: - Discount rate: 5% - Economic life of investment: 15 years.
6.3.4.1 Fuel costs and electrical tariffs The prices of natural gas, fuels and other light oil products usually correspond to each other. Normally the agreed price of natural gas in the contracts between the deliverer and the hotel, is related to the price of light oil. The table below shows a summary of the prices of natural gas and electricity based on delivery to a medium-sized or large hotel. However, the actual situation today in many European countries, is that the fuel and electric-ity companies have diversified their ”products” and consequently different prices occur. The table below must therefore be seen in this perspective, and as an example of energy prices used to evaluate the case studies. For each country some general discussions are given.

2001-05-31 52
ÅF-Energikonsult AB F:\CHOSE\relfinal\Final Report 010710.doc 471275-D-SW-03
Table 10: Energy prices for a medium or large sized hotel.
Source: compiled reports from partner countries Country Cyprus Greece Italy Portugal Sweden Isolated
systems Grid-connected systems
Price of natural gas 1) Fee for network utilisation Fixed fee per year, Euro 1724 155 Subscription for capacity, Euro/kW
Energy high period, Euro/MWh Energy low period, Euro/MWh Energy incl. taxes, Euro/MWh Used for electrical production CHP
22,4 22,4 27 34,3
Used for heat only boiler 32,0 32,0 57 27,3 39,9 Total, average incl taxes 28,3 34-40 Price of electricity Fee for network utilisation Fixed fee per year, Euro 1488 5482 14 300 Subscription for capacity, Euro/kW
41 0 97 10 38 52
Energy high period, Euro/MWh 2,1 Energy low period, Euro/MWh 2,1 Fee for energy Energy low period, Euro/MWh 78,3 32 42,3 17 Energy medium period Euro/MWh 78,3 50,9 17 Energy high period, Euro/MWh 78,3 48,4 87,7 17 Energy tax 19,3 Average 60 45,9 100 36,3 Total average incl. energy tax 66 78,3 59,7 101,5 75 49,3 Price for electricity, selling to the grid, Euro/MWh
63,6 46,9 38 80 20 - 60 25
1) Natural gas is not available in Cyprus. Price for alternative fuel, Light fuel oil 32,4 Euro/MWh and LPG 21,8 Euro/MWh.
6.3.4.1.1 Cyprus In Cyprus, the hotels are paying a high voltage tariff consisting of three items: a fix sum per month of 124 Euro, a charge related to the consumption, and a charge related to the monthly maximum demand which is related to high and low periods. The selling price of electricity is fixed at 63,6 Euro/MWh for CHP self-production at the grid-connected system. All prices are current prices of the year 2000.

2001-05-31 53
ÅF-Energikonsult AB F:\CHOSE\relfinal\Final Report 010710.doc 471275-D-SW-03
6.3.4.1.2 Greece In Greece, there are two levels of electricity costs for hotels; the hotels connected to the grid system, and hotels using isolated systems. The grid system has two tariffs for medium voltage electricity purchase - which is the case for a medium-sized or large hotels with installed power > 250 kVA. This means hoteliers have to choose between these two general use tariffs. The first tariff is suited to hotels that are operated all year round (i.e. city hotels, with high utilisation factor). This tariff has two scales; for the first 400 kWh per kW peak the price is 48,22 Euro/MWh and for the rest the price is 31,93 Euro/MWh. The price of power per month is 8,094 Euro/kW. The second tariff, is suited for seasonal hotels. The tariff is fixed at 63,13 Euro/MWh. The price of power per month is 2,917 Euro/MWh. The selling price of electricity is fixed at 37,89 Euro/MWh for CHP self-production at the grid-connected system. All the prices are current prices of the year 2000. 6.3.4.1.3 Italy There are several tariffs in Italy. For the case studies average figures have been used for the calculations (see table 10). The prices including taxes and the electricity price refer to a low voltage supply. The cost figure for Subscription for capacity, Euro/kW, is just an estimate for the range of case studies evaluated. All prices are current prices of the year 2000. 6.3.4.1.4 Portugal There are several options of tariffs in Portugal. However, most hotels use the average use of power and weekly cycles. Since December 1999, the electricity selling price for CHP, is defined trough a complex for-mula. It is strongly connected to the CHP unit design and to its performance. The price has three components, one fixed, one reflecting the evolution of Natural Gas prices, and one re-flecting the environmental benefits of that specific CHP unit. The price is higher in the peak and intermediate periods defined for the purchase prices, but depends on the stability of the diagram. The price for Natural gas is the same if it is used in CHP or in boilers. However, in practice a customer using CHP are likely to exceed the upper consumption limit of the rate in which the gas was priced, so in this way he may get a lower price for all the gas consumed. Customers using more than 2 000 000 cubic meter have the possibility of buying directly from the main network, being able to negotiate lower prices.

2001-05-31 54
ÅF-Energikonsult AB F:\CHOSE\relfinal\Final Report 010710.doc 471275-D-SW-03
6.3.4.1.5 Sweden During the last five years the Swedish market for energy, and in particular the market for elec-tricity, has been undergoing several changes. The Nordic electricity market is now seen as one of the most de-regulated markets world wide, and all customers can make their own choice of which power-trading company to by their electricity from. Energy fees At the same time, the producers have been experiencing a dramatic decrease in the electricity price and thereby also the profitability of their commodity. This is especially significant for small-scale electricity producers - which the hotel CHCP would be (electricity production units of 1 500 kW and below). Foremost, the profitability is dependent on how power-trading companies value the product. Secondly, the small-scale producers are heavily dependent on present governmental support. Total estimated income for small-scale electricity production is, at present, 20-25 ECU/MWh of which the selling price is 10-14 ECU/MWh and the gov-ernmental support is 10,8 ECU/MWh 4. The selling price is dependent on the current price at the spot- and future markets of the Nordic commercial market place for power transactions: Nord Pool. The Governmental support to the small-scale energy sector is under investigation. Present support is valid until 2002-12-31. An electricity customer in Sweden could today expect to pay 14-28 ECU/MWh (year 2000). The price range reflects the electricity consumption patterns of the customer and also their capacity of negotiating. In this case study we have estimated a price of 17-18 ECU/MWh. Network fees The price of electricity does not only consist of the price for the energy itself but also of transmission fees and governmental taxes. Mostly, the cost of connecting a production unit to the transmission network is dependent on the actual connection costs, which will vary consid-erably depending on the location of the production unit. The current fee for network transmission is approximately 2-4 ECU/MWh. However, there are also fees for connection, administrative costs of the network etc, as mentioned above. Also to be considered is the possible income from selling electricity such as reduction of losses. The fees (tariffs) are also differentiated over the 24-hour period as well as the year. In Sweden, there are four different zones: high load (Mon.-Fri. 07-21 hours), low load (remain-ing time), winter (November-March) and summer (April-Oct). The fees vary approximately 2 ECU/MWh between these periods. In general the total network fee for a smaller electricity customer is approximately 14-16 ECU/MWh. There are also other types of tariffs (fees) which a producer or a consumer can use. These are direct connection to the regional transmission network as well as fees where the network owner has the right to, at any time, disconnect the customer. The benefit that the production unit brings to the local network is calculated in the value of:
4 1 ECU equal to 8,3 SEK.

2001-05-31 55
ÅF-Energikonsult AB F:\CHOSE\relfinal\Final Report 010710.doc 471275-D-SW-03
• the reduction of electricity losses • reduction of fees for the network owner • reduced annual subscription for the network owner (in case of first-rate power) Any general amount for the total network benefits brought by the local production unit do not exist. However, calculations have been made on 15 ECU/MWh on high load periods and 2 ECU/MWh on low load periods. Summary As seen from above, the total costs and benefits from selling and buying electricity vary both with market prices on energy, governmental support and network fees dependent on where the production unit is located. In general the benefits to the network from a local production unit are more important if it is situated in a densely built area with a scarcity of power and has a possibility to deliver first-rate electricity. Fees and benefits are, as mentioned above, dependent on the location of the power plant, the possibilities to connect as first-rate power subscription as well as the historically power di-mension of the connecting point. 6.4 Investment cost of CHCP As described in chapter 5, a CHCP-plant generally consists of the following main compo-nents: • Co-generation package, including prime mover and alternator. The alternator can be seen
as a part of the package, but some additional equipment need to be installed. • Heat recovery system, can also be seen as a part of the co-generation package, se alterna-
tor above. • Absorption chillers. • Cooling tower or convective heat exchanger. • Natural gas heat only boiler for coping with peak demand and serve as a back up boiler.5 • Electrically driven chillers for peak cooling demand and serve as a back up. 6 Comparison of equipment costs as stated by manufacturers gives only indicative figures. The standards set for pollution and noise emissions also differ from country to country. However, for the purpose of doing an economic feasibility assessment, there is generally not a large variation in the installed cost among the different equipment types. If one uses average data, as done in the preliminary technical feasibility assessment, budgetary cost data in the range of ±25% were considered satisfactory. Below is a short survey of typical equipment cost.
5 Natural gas heat boiler and electrical chillers were used as alternatives to CHCP in the economical analysis. 6 See note 4.

2001-05-31 56
ÅF-Energikonsult AB F:\CHOSE\relfinal\Final Report 010710.doc 471275-D-SW-03
6.4.1 Co-generation plant (CHP) The equipment costs depend on the type of co-generation plant, i.e. the prime mover, the so-phistication of the control- and monitoring systems, the need for additional pollution abate-ment equipment, acoustic protection, site preparation, grid connection etc. Many co-generation systems are packaged and highly standardised. The basic cost varies ac-cording to the rated output. In practice, the installed costs of co-generation systems vary widely. Equipment suppliers are quoting prices from ECU 1300/kWe for the smallest gas engine systems, to less than ECU 800/kWe for units larger than 500 kWe. Systems fueled from digester gas systems may cost ECU 1700/kWe, while gas turbine systems were found to cost ECU 1600-2000/kWe. The figure below shows a plot of typical installed cost per kWe capacity against CHP rating Euro/kWe.
0
500
1000
1500
2000
2500
3000
3500
0 200 400 600 800 1000 1200 1400
kW electricity
Euro
per
kW
e
Figure 7: Co-generation Plant Installed Unit costs. Specific costs, Euro/kWe, as a func-
tion of size, kWe. The trend line represents the cost function used in the evaluation mode. It represent both reciprocating and turbine units. Source: Project results.
It is clear that the specific cost decreases with increasing capacity. The installation costs in-cludes equipment and simple installation and connection work. Supply of gas is not included if not already installed. 6.4.2 Heat recovery system The heat recovery system can be seen as a part of the co-generation package, just as the alter-nator. The heat recovery systems includes the boiler, feed water tank with chemical dosing, feed water pumps, steam drum, blow-down tank, control panel and instruments. The feed wa-

2001-05-31 57
ÅF-Energikonsult AB F:\CHOSE\relfinal\Final Report 010710.doc 471275-D-SW-03
ter temperature to the boiler is assumed to be 100oC. The exhaust gas temperature available to the separate Heat Recovery Steam Generator, HRSG, is assumed to be 385oC. The manufac-turer cautions that what heat recovery boiler to chose for such a system is dependent to a very large extent on the engine and the temperature of its exhaust. A rule-of-thumb is that a HRSG costs in the range of 36-95 Euro per kg/h of steam. The cost figure recommended for feasibility studies is ca 59 Euro per kg/h of steam. This correlates rather well with the data in the table below. Prices are for a separate HRSG supplying steam to a 1 MW and a 1.4 MW absorption chiller for single respectively double effect absorption chillers are shown in the table below. Table 11: Prices for a HRSG. Source: ÅF Energikonsult AB.
Cooling capacity 1 MW 1.4 MW
Double effect Flue gas outlet temp. 260oC 212oC Steam at 9 bar/175oC 1.4 t/h 2.0 t/h Price 126 kEUR 135 kEUR Single effect Flue gas outlet temp. 177oC 138oC Steam at 2.5 bar/130oC 2.4 t/h 3.0 t/h Price 131 kEUR 148 kEUR 6.4.3 Absorption chillers Cost information on water-lithium bromide units for air cooling applications (chilled water), was obtained from a couple of manufacturers. A rule-of-thumb is that a double-effect unit is approximately 20% more expensive than a sin-gle-effect unit with the same capacity. The reason for the higher cost is the additional genera-tor and condensor in the design. However, data from the ASHRAE handbook and from a German survey indicate that the extra cost is more likely to be as high as 30-40%. Another rule-of-thumb is that a hot-water ”fired” unit is approximately 25% more expensive than a steam ”fired” unit with the same capacity. The cause for the latter rule would be the size of the ducts necessary for delivering a given thermal power to the absorption machine is larger with hot water than with steam. However, data collected from manufacturers do not support this rule-of-thumb. Single-effect absorption machines ”fired” with comparatively low- temperature hot water (90-95oC) are more expensive than the conventional single-effect machines. A comparison be-tween sets of data obtained from different manufacturers confirms that the price difference is approximately 35%. A further reference may be the statement from one supplier that a dou-ble-effect machine is actually 5 to 8% cheaper than a ”low temperature” hot-water driven sin-gle-effect.

2001-05-31 58
ÅF-Energikonsult AB F:\CHOSE\relfinal\Final Report 010710.doc 471275-D-SW-03
The results obtained from representatives for a couple of manufacturers are shown in the fig-ure below.
0
50
100
150
200
250
300
350
0 1000 2000 3000 4000 5000 6000
Cooling capacity [kW]
Euro
/kW
Figure 8: Estimated cost for water/lithium bromide absorption chiller, single effect. The trendline represent the function used in the evaluation model. Source: Project results. As shown in the figure above, the cost of a unit per kWth of cooling capacity depends on its size, but becomes approximately constant above 2 MWth. 6.4.4 Cooling tower or connective heat exchanger The cost estimates obtained for cooling towers are summarised in the figure below as cost per kWth capacity of the cooling tower.

2001-05-31 59
ÅF-Energikonsult AB F:\CHOSE\relfinal\Final Report 010710.doc 471275-D-SW-03
0
2
46
8
10
1214
16
18
0 1000 2000 3000 4000 5000 6000
kW
Euro
/kW
Sweden
Germ any
Sweden Germ any Italy Greece
Figure 9: Estimated costs for cooling towers for different countries. The trend line represents the function used in the evaluation. Source: Project results. Alternatively, it may in some locations not be necessary to use a cooling tower. Convective heat exchange between the coolant of the absorption machine and air could in these cases be sufficient. Costs for these liquid-air heat exchangers are exemplified in table below. Table 12: Cost for liquid-air heat exchanger, Euro. Source: Project results. Outdoors temp. Heat rejected Cost of heat exch. Specific cost 28oC 400 kWth 22 kEUR 55 EUR/kWth 28oC 550 kWth 31 kEUR 57 EUR/kWth 30oC 350 kWth 31 kEUR 89 SEK/kWth 6.4.5 Heat only boiler and electrical driven chillers In the economical analysis, the alternative to CHCP has in most cases been, power purchased from the local electric distribution company, electrical chillers and generation of heat using boilers. Hence, heat only boilers, used for peak energy demand and to serve as a back up boiler, are also needed in the economical analysis. Investment figures for both oil- and natural gas fired boilers as well as burners for space heating and hot water production, are not used as the eco-nomical evaluation are for hotels and the investment costs can be seen as sunk cost. The same applies for the electrically driven chillers. Electrically driven chillers are included in the system for peaking and back-up. Therefore, they are also needed in the economical analysis of an alternative to CHCP.

2001-05-31 60
ÅF-Energikonsult AB F:\CHOSE\relfinal\Final Report 010710.doc 471275-D-SW-03
6.4.6 Other components and overhead cost On site costs and overhead costs are not used as separate cost items in the evaluation model. They are included in each main component respectively. On site costs, and costs for over head consists mainly of the following items: On site costs • Air intake, ventilation system and system for exhaust gas outlet (stack) • Pipes and pumps etc to connect the components (prime mover, absorption chiller and
cooling tower) to the thermal system • Ventilation system in the machinery room • Electricity installations • Modification to building structure • Design of CHCP installation • Installation and control • Project management • General Contingency Cost included in the specific cost of machinery • Control and monitoring system • Acoustic enclosure • System start up and testing • General Contingency 6.5 Annual cost for operation and maintenance 6.5.1 Co-generation package The efficiency of co-generation units is usually expressed in terms of both electrical effi-ciency and overall efficiency. The efficiencies are dependent on the type of prime mover, its size, the temperature at which recovered heat can be utilised, the condition and the operating regime of the unit. Operating regime is particularly important. Reciprocating engine The overall efficiency as a function of size is a constant, estimated to 0,89 independent of size. The ratio of electricity power and heat power is estimated as follows:

2001-05-31 61
ÅF-Energikonsult AB F:\CHOSE\relfinal\Final Report 010710.doc 471275-D-SW-03
0,000,100,200,300,400,500,600,700,800,901,00
0 200 400 600 800 1000 1200kWe
Ratio
ele
ctric
ity/h
eat
Figure 10: Ratio of electricity output/heat output as a function of size. The
trend curve represents the function used in the evaluation model. Source: Project results.
0
0,2
0,4
0,6
0,8
1
1,2
0 0,2 0,4 0,6 0,8 1
Part Load
Tota
l Effi
cien
cy a
nd r
atio
el
ectri
c/he
at p
ower
Figure 11: Efficiency and Ratio of electricity out put/heat out put as a function of part
load. The trend curves represents the function used in the evaluation model. If the total efficiency is greater than 1, the value 1 is used in the evaluation model.
Source: Project results. Gas turbine As a first estimate for the evaluation model, the turbine use the same trend curves for total efficiency and ratio electricity/heat as a function of size as for the reciprocation unit. The fol-lowing figure represent the function used as a function of load.

2001-05-31 62
ÅF-Energikonsult AB F:\CHOSE\relfinal\Final Report 010710.doc 471275-D-SW-03
0,0
0,1
0,2
0,3
0,4
0,5
0,6
0,7
0,8
0,9
0 10 20 30 40 50 60 70 80 90 100
Part load %
% re
sp R
atio
ele
ctric
ity/h
eat
Net total efficiencyRatio electric/heat
Figure 12: Gas turbine, Efficiency and Ratio of electricity out put/heat out put as a func-
tion of part load. Source: Project results.
Costs for maintenance, is estimated as a fixed cost as a function of size added by an operating cost per produced energy, electricity and heat. For this evaluation the operating costs are es-timated to 17 ECU per produced MWh electricity for reciprocating engine and 12 ECU per produced MWh electricity for the turbine. 6.5.2 Absorption chillers The coefficient of performance COP for the absorption chiller is estimated as a constant func-tion, independent of size. The value used in the evaluation model is 0,75.

2001-05-31 63
ÅF-Energikonsult AB F:\CHOSE\relfinal\Final Report 010710.doc 471275-D-SW-03
Cor
rect
ion
fact
ors
0
0,2
0,4
0,6
0,8
1
1,2
0 20 40 60 80 100
Partload %
Figure 13: Absorption chillers, the coefficient of performance as a function of part load
at constant cooling water temperature. The trend curve is used in the evalua-tion model. Source: Project results.
The capacity of an absorption machine may be controlled in various ways. The following in-dicator might be used; the flow rate of the hot media, its temperature, flow-rate and tempera-ture of the circuit to which heat is rejected, or the flow-rate or temperature of the chilled wa-ter. A detailed map of the dependence of coefficient of performance and capacity will involve many variables and diagrams. However, the part load behaviour can be described in a simpli-fied way. If a design condition is defined, capacity at part load follows energy input linearly. The coefficient of performance is almost independent of load down to 60% of design load, after which the values of the COP decreases linearly. Costs for operation and maintenance Maintenance costs are highly variable. They depend on local labour rate, age of the chiller etc. Estimates based on a proposal of manufacturers are summarised in the following figure in order to provide a reference. The figure represents costs for maintenance for absorption- and electrical chillers as well as cooling tower. The diagram represents a fixed cost as a function of size and maintenance cost as a function of produced energy.

2001-05-31 64
ÅF-Energikonsult AB F:\CHOSE\relfinal\Final Report 010710.doc 471275-D-SW-03
0
500
1 000
1 500
2 000
2 500
3 000
3 500
0 500 1000 1500 2000 2500 3000 3500 4000 4500
Cooling capacity (kW)
Euro
Electrical driven chillerAbsorption chillerCooling tower
Figure 14: Fixed maintenance cost as a function of size for Electrical driven chiller,
absorption chiller as well as for cooling tower. Source: Project results.
The maintenance cost as a function of produced energy can be seen in the following table. Table 13: Maintenance costs as a function of produced energy. Source: Project results. Euro per MWh,
produced energy Electrical driven chiller 2 Absorption chiller 0,5 Cooling tower 3 During the first five-years period after erection of the machine, there should not be any other maintenance costs than costs for make-up fluids and costs for chemicals which also includes labour costs. Neither should there be any cost for the maintenance of the building where the machine is placed. In a long-term perspective, the yearly maintenance costs will increase. It is generally thought that cooling towers have a shorter technical lifetime and higher maintenance costs because they are open to air and sensitive to corrosion. The buildings also have to be maintained.

2001-05-31 65
ÅF-Energikonsult AB F:\CHOSE\relfinal\Final Report 010710.doc 471275-D-SW-03
6.5.3 Cooling tower or connective heat exchanger For the costs of operation and maintenance, including staffing, see the section on operation and maintenance for absorption chiller. Costs for maintenance, is estimated as a fixed cost as a function of size, see section “Absorp-tion chillers” for figures. Water for cooling tower Water has to be supplied to a cooling tower in order to compensate for evaporation of water and bleed off. If all heat rejected is latent heat, the water consumption of a cooling tower is approximately 1,4 kg/h per rejected kWth (2,0 kg/kWhc). The water loss caused by bleeding in order to prevent building up salt in the cooling water is estimated to around 0,4 kg /h per re-jected heat. In total 1,8 kg/h water will be lost per rejected heat kWth (2,6 kg/kWhc). 6.5.4 Heat only boiler The efficiency is estimated to 90 % as a mean value over a year. Operation and maintenance costs are estimated to 300 Euro per year. 6.5.5 Electrically driven chillers Efficiency as a function of size and load is estimated including the electrical energy used in a liquid chilling system for solution pumps etc.
00,5
11,5
22,5
33,5
44,5
0 200 400 600 800 1000
Cooling capacity, kW
Coe
ffici
ent o
f per
form
ance
CO
P
Figure 15: The coefficient of performance as a function of size. The trend curve is used
in the evaluation model. Source: Project results.

2001-05-31 66
ÅF-Energikonsult AB F:\CHOSE\relfinal\Final Report 010710.doc 471275-D-SW-03
0
0,2
0,4
0,6
0,8
1
1,2
1,4
0 20 40 60 80 100 120
Part load %
Corr
ectio
n fa
ctor
Figure 16: Electrically driven chillers, the coefficient of performance as a function
of load. Source: Project results. Costs for operation and maintenance see figures under section “Absorption chillers.”

2001-05-31 67
ÅF-Energikonsult AB F:\CHOSE\relfinal\Final Report 010710.doc 471275-D-SW-03
7 Results from energy audits As described in the previous chapter, detailed energy audits had to be conducted by the pro-ject as to receive information on the load and load profiles for heating, cooling and electricity separately. The information has then been used as input to the economic analysis. The results from the energy audits are presented below. 7.1 Energy source and usage in the hotels Energy in different forms is used in many hotel facilities and services. The type of energy used in the examined cases are given in the following table: Table 14: Type of energy used for the case studies. Source: Project results. Primary energy/fuel used Cyprus Greece Italy Portugal Sweden Electricity and liquefied pe-troleum gas (LPG)
1 3
Electricity, light fuel oil and LPG
4 4 2 1
Electricity, light fuel oil, LPG and solar
1
Electricity, LPG and solar 1 Electricity and light fuel or heavy oil
5 2 1) 3
Electricity and District heat-ing
5
Electricity and town gas 1 Electricity and natural gas 3 1 2) Electricity, natural gas and oil 8 3) Electricity 1 4) 1) Heavy oil is used in one hotel. 2) Located in Germany. 3) Three hotels use absorption chillers for producing cold and hot water for air conditioning purposes. 3) Space heating and domestic hot water are produced by a reversible heat pump. As seen in the table, the use of fuel energy for the studied hotels is diversified. Some national characters can however be found: Light fuel oil is used in Cyprus, Greece and Italy as a single fuel, or as in Cyprus and Greece in combination with LPG, and in Italy in combination with oil. Hotels in Sweden, located in the centre of the cities, are often connected to District Heat-ing and in Portugal, LPG and natural gas is used as single energy fuel for the hotels. There are only a few hotels where recovered heat from the chillers is used for climate cooling and solar energy for heating purposes.

2001-05-31 68
ÅF-Energikonsult AB F:\CHOSE\relfinal\Final Report 010710.doc 471275-D-SW-03
7.2 Energy consumption in the hotels and need of energy
conservation measures The total energy consumption in each hotel where measured and specified as per m2 and year, divided into the categories: Efficient use-, Fair use- and Poor use of energy, in the same way as described in Chapter 4, Table 4. The division into these categories has been done in order to show how energy efficient the hotels selected for the case study are compared to these pre-vious specified categories. The following figures show this comparison. The hotels with efficient energy consumption defined as specific consumption kWh/m2 in figure 17-19 are found under the line in the dia-gram. Hotels above the line are rated poor, and energy conservation measures are recom-mended before installing a CHP or CHCP plant.
0
100
200
300
400
500
600
0 100 200 300 400 500 600 700
Number of rooms
kWh/
m2
and
year
Figure 17: Hotel rating, total energy consumption, kWh/m2 as a function of number of
rooms. Source: project results.

2001-05-31 69
ÅF-Energikonsult AB F:\CHOSE\relfinal\Final Report 010710.doc 471275-D-SW-03
0
50
100
150
200
250
300
350
0 100 200 300 400 500 600 700
Number of rooms
kWh/
m2
and
year
Figure 18: Hotel rating, heating energy consumption kWh/m2 as a function of number of
room. Source: Project results.
0
50
100
150
200
250
300
350
0 100 200 300 400 500 600 700
Number of rooms
kWh/
m2
and
year
Figure 19: Hotel rating, Electrical energy consumption, kWh/m2 as a function of number
of rooms. Source: Project results. 7.3 Differences in the system design There are some differences found in the hotel installations in the partner countries that influ-ence the design of a CHP and CHCP plant, both of hotel facilities and the energy profiles. These differences have to be considered before making any far-reaching conclusions. The differences are discussed below.

2001-05-31 70
ÅF-Energikonsult AB F:\CHOSE\relfinal\Final Report 010710.doc 471275-D-SW-03
In many hotels in Italy, Greece and Portugal, steam is produced for comfort purposes as well as for use in the laundry area of the hotel. In Swedish hotels, the laundry has been out-sourced to specialised companies. In the future the same trend is likely to occur in the Mediterranean countries. Due to the need of steam, the base load energy consumption is higher in the hotels studied in Greece and Italy. Also the consumption of domestic hot water is higher in the Italian and Greek hotels. In Sweden on the other hand, the base load is in general equal to the domestic hot water, where the water often is produced from a heat recovery of out-let air, or from the electric chillers in use. In hotels located in the Mediterranean area, heat recovery systems in chillers are not so frequently installed. Three Italian hotels covered by the energy audits have absorption chillers installed both for cooling production and heat. The design temperature for the cooling circuit and refrigerators seems to be general for all installations i.e. 5°C. The case studies have not attempted to include the refrigeration and freezing systems in the cooling circuit due to the low temperature. The following system temperatures have been found in the detailed energy analysis for the Swedish hotels. The temperatures refers to the temperature at Design data at Out-door Tem-perature, DOT, for space heating, ventilation, domestic hot water refrigerator and heat recov-ery chiller. Table 15: Design temperatures DOT. Source: Project results. Hotel number
Space heat-ing
Ventilation Domestic hot water
Refrigerator Heat recovery chiller
1 80 80 55 -8 5 2 80 80 55 -8 5 3 4 5 6 55 55 50 -8 5 7 8 60 60 63 -6 5 9 55 55 55 -8 6 10 80 80 55 -8 5 11 80 80 55 -8 5 12 60 60 80(60) -8 8

2001-05-31 71
ÅF-Energikonsult AB F:\CHOSE\relfinal\Final Report 010710.doc 471275-D-SW-03
7.4 Energy profiles, electricity and thermal energy As discussed above, the energy profiles must be known in order to specify a detailed design of a CHP- and CHCP-system. The energy consumption and the profiles as a result from the en-ergy audits are therefore presented below. The result is presented for each partner country, followed by a general comparison between the country results. 7.4.1 Cyprus 7.4.1.1 Energy consumption in the studied Cypriot hotels Due to the variations in types of hotel, number of rooms, category (star rating), fuel and en-ergy sources used, etc., it has been difficult to arrive at a relation between energy consump-tion and hotels characteristics, as it can be seen from the figure below.
0
1000
2000
3000
4000
5000
6000
7000
8000
9000
10000
0 50 100 150 200 250 300 350 400
Nmber of rooms
Tota
l Ene
rgy
Cons
umpt
ions
, MW
h
Figure 20: Relation between energy consumption and size of the hotels included in the Cypriot case study. Source: Report on Cyprus Energy Audit. The specific energy consumption (SEC) of the hotels (energy uses per m² and year and per room) is shown in the following table and figure.

2001-05-31 72
ÅF-Energikonsult AB F:\CHOSE\relfinal\Final Report 010710.doc 471275-D-SW-03
Table 16: Specific energy consumption in the Cypriot hotels (kWh/m2 and MWh/room
per year). Source: Report on Cyprus Energy Audit.
Energy consumption (MWh/year) Specific Consumption HOTELS
Total area, m²
Rooms Thermal Electrical Total kWh/m² MWh/room
HOTEL 1 17.700 342 3.768 2.790 6.558 370 19,2 HOTEL 2 10.000 150 2.038 1.040 3.078 308 20,5 HOTEL 3 29.400 350 3.558 5.150 8.708 296 24,9 HOTEL 4 4.560 114 755 550 1.305 286 11,5 HOTEL 5 26.600 199 1.686 1.060 2.746 103 13,8
050
100150200250300350400
1 2 3 4 5
kWh/
m2/
year
ThermalElectrical
Figure 21: Specific energy consumption of selected hotels in Cyprus. Source: Report on Cyprus Energy Audit. As the figures display, all the studied hotels show good energy performance for electricity consumption as well as for fuel consumption, according to the specific performance criteria and efficiency rating7, discussed in chapter 4. Although these are encouraging results, at the end of each audit, recommendations have been made in relation to possible measures to fur-ther reduce the energy requirements and especially the electrical energy consumption. 7.4.1.2 Energy Load Profiles Electrical Load Profiles Electrical loads have been obtained from electricity consumption measurements, which were performed for one week time period two times per year (winter and summer peak months), using portable load monitors. Each time the total energy consumption as well as two other end
7 Rational Use of Energy in the Hotel Sector, A THERMIE programme action, European Commission Director-ate-General for Energy (DGXVII).

2001-05-31 73
ÅF-Energikonsult AB F:\CHOSE\relfinal\Final Report 010710.doc 471275-D-SW-03
uses was measured. The information measured by the monitor at selected time intervals (i.e. every half-hour) was energy consumption, power factor, and load factor. The typical monthly electrical load profile is given in the following figure. The load is divided into space heating (SH) and domestic/sanitary hot water (DHW). This figure demonstrates, as it was expected, seasonal variations in consumption, as a result of air-conditioning loads in summer.
0
100
200
300
400
500
600
700
JAN
FEB
MA
R
APR
MA
Y
JUN
JUL
AU
G
SEP
OC
T
NO
V
DEC
SHDHW
Figure 22: Typical monthly Electrical load profile in a Cypriot hotel.
Source: Report on Cyprus Energy Audit. Data from this figure show there is a difference of approximately 300 kWe between winter and summer months, which is a result of air-conditioning load. These data corresponds with the historical data of the maximum demand. Thermal Load Profiles Thermal load estimations on the Cypriot hotels were performed on the historical data on fuel consumption on a daily basis. In one case, a fuel meter was installed in order to gain the hourly profile of the fuel consumption. Results obtained with this method were not complete, since monitoring had to be performed manually. The thermal energy demand was then esti-mated relating the operating time of the boilers to the difference of the outdoor-indoor tem-perature. The monthly thermal load profile is shown in the following figure. The load is divided into space heating, domestic/sanitary hot water and laundry demand.
MWh

2001-05-31 74
ÅF-Energikonsult AB F:\CHOSE\relfinal\Final Report 010710.doc 471275-D-SW-03
0
50
100
150
200
250
300
350
400
450
500
JAN
MA
R
MA
Y
JUL
SEP
NO
V
Space heating
Laundry
Domestic hotwater
Figure 23: Typical monthly Thermal load profile in a Cypriot hotel.
Source: Report on Cyprus Energy Audit. For detailed information see Energy audits – Cyprus, Appendix D. 7.4.2 Greece 7.4.2.1 Energy consumption in Greek hotels studied In Greece, as well as described in Cyprus above, the variations between the hotels have made it difficult to arrive at a significant relation between energy consumption and hotel character-istics, although some relations have been possible to establish. The results from the energy audits on Greek hotels are summarised below. The cooling requirements of the audited hotels in Greece are in general covered by central air-conditioning system serving the whole or part of the building. The chillers installed are air-cooled or water electric chillers. Further, there are two different levels of energy types ratio, depending on the geographic location and the type of each hotel site. For city-business hotels situated in northern Greece at climate zone C (hotel cases 1 to 6 in the study) thermal energy makes up 50% up to 70% of the total energy usage. In this case the ratio Electric/Heat Power is generally in the range 1:1 to 1:2,3. For city-business hotels situated in southern Greece at climate zone B, and large tourist seasonal hotels situated in island at climate zone A (hotel cases 7 to 10), thermal en-ergy represent 25% to 40% of the total energy usage. In this case the Electric/Heat Power ra-tio is generally in the range 1:0,3 to 1:0,7. For the audited hotels, as the following figure shows, there is a strong relation (with correla-tion coefficient R² =0,989) between total energy consumption and the number of rooms for
MWh

2001-05-31 75
ÅF-Energikonsult AB F:\CHOSE\relfinal\Final Report 010710.doc 471275-D-SW-03
city-business hotels. Different behaviour is observed for tourist seasonal hotels situated in climate zone A, since they operate only in the summer, and they do not have heating systems due to their limited heating demands.
y = 0,1092x2 + 2,9588xR2 = 0,9879
0
2.000
4.000
6.000
8.000
10.000
12.000
14.000
16.000
18.000
20.000
0 50 100 150 200 250 300 350 400 450
Rooms
Tota
l Ene
rgy
Con
sum
ptio
n, M
Wh
Business Hotels Tourist Hotels
Figure 24: Relation between energy consumption and size of the hotels included in the
Greek case study. Source: Report on Greece Energy Audit. All medium-sized hotels (cases 2 to 6), with the exception of one (case 5) are showing poor energy performance for electricity consumption and good or fair performance for fuel con-sumption, according to the specific performance criteria and efficiency rating8 discussed in chapter 4. Two cases (hotel 9 and 10) are seasonal tourist hotels and their energy consumption does not include space heating demands, but only air-conditioning and sanitary hot water demands during limited operation time (7 months). The audited Greek hotels’ average poor energy performance for electricity- as well as fuel consumption, are also confirmed by the following figure. The specific energy consumption, SEC, is shown related to the hotel size. It has to be noted, that in the following figure the SEC of the two last cases (hotels 9 and 10) was excluded, since these are seasonal tourist hotels.
8 Rational Use of Energy in the Hotel Sector, A THERMIE programme action, European Commission Director-ate-General for Energy (DGXVII).

2001-05-31 76
ÅF-Energikonsult AB F:\CHOSE\relfinal\Final Report 010710.doc 471275-D-SW-03
0
50
100
150
200
250
300
350
400
450
50 - 150 room more than 150 roomsSpec
ific
Ener
gy C
onsu
mpt
ion
(SEC
), kW
h/m
²yea
r
Electricity Fuel
Figure 25: Specific energy consumption according to size of selected hotels.
Source: Report on Greece Energy Audit. As described in chapter 4, poor performance of electricity is >90 kWh/m2 for medium-sized hotels and >200 kWh/m2 for large hotels. Fair performance for fuel consumption is 190-230 kWh/m2 for medium-sized hotels and 200-240 kWh/m2 for large hotels. The conclusion on this, for the majority of the cases, is the recommendation that before con-sidering a CHP system, every effort must be made to reduce the energy requirements and es-pecially the electrical energy consumption, through the incorporation of simple energy saving technologies. Also, a detailed review of the existing energy saving measures is recommended, to ensure that all other more cost-effective measures have been identified and implemented prior to the specification of the CHP unit. 7.4.2.2 Energy Load Profiles Electrical and Cooling Load Profiles The case of a typical medium-sized hotel located in climate zone C is examined below. In this hotel site, an extended energy audit has been conducted including electrical- and thermal measurements. The typical monthly load profile for electrical and cooling energy is given in the following figure. This figure demonstrates, as it was expected, seasonal variations in consumption, as a result of air-conditioning loads in the summer.

2001-05-31 77
ÅF-Energikonsult AB F:\CHOSE\relfinal\Final Report 010710.doc 471275-D-SW-03
0
20.000
40.000
60.000
80.000
100.000
120.000
140.000
160.000
JAN FEB MAR APR MAY JUN JUL AUG SEP OCT NOE DECMonth
kWh
Lighting and Other Climate chillers
Figure 26: Typical monthly Electrical profile in a Greek hotel.
Source: Report on Greece Energy Audit. The electrical load profiles have been obtained from the Public Power Corporation and have been measured using a portable load monitor. Profiles for normal weekday and weekends are displayed in the following figure.
0
50
100
150
200
250
300
1 3 5 7 9 11 13 15 17 19 21 23 25 27 29 31 33 35 37 39 41 43 45 47
Daily hours
Elec
tric
al L
oad,
kW
February March June JulyAugust September November December
Figure 27: Typical daily electrical load profiles in Greek hotels for weekdays-weekends
during different months. Source: Report on Greece Energy Audit.
In this figure a steady daily difference of approximately 80-120 kWe is observed between winter and summer months - which is a result of the air-conditioning load. It has to be noted that in this specific case the installed cooling capacity is 400 kW.

2001-05-31 78
ÅF-Energikonsult AB F:\CHOSE\relfinal\Final Report 010710.doc 471275-D-SW-03
Thermal Load Profiles The monthly thermal load profile is shown in the following figure, divided into space heating (SH) and domestic/sanitary hot water (DHW) demand.
0
20.000
40.000
60.000
80.000
100.000
120.000
140.000
160.000
180.000
JAN FEB MAR APR MAY JUN JUL AUG SEP OCT NOE DECMonth
kWh
DHW SH
Figure 28: Typical monthly thermal load profile in a Greek hotel.
Source: Report on Greece Energy Audit. The thermal load profiles have been estimated from an “hours run” meter installed on the boiler burner. The thermal load profiles have been indirectly deduced from the meter read-ings, since the burner flow rate is known and the boiler efficiency was measured. In the fol-lowing figure, the boiler operation profile is shown. This figure demonstrates seasonal varia-tions in consumption, as a result of space heating loads during winter and hot water demand in the summer period.
0
10
20
30
40
50
60
1 2 3 4 5 6 7 8 9 10 11 12 13 14 15 16 17 18 19 20 21 22 23 24Daily hours
Boi
ler o
pera
tion
time,
min
4-Μαρ 10-Μαρ 17-Μαρ 18-Μαρ 10-Αυγ11-Αυγ 8-Σεπ 9-Σεπ 12-Σεπ 13-Σεπ
Figure 28: Typical daily thermal load profiles in Greek hotels during springtime and
summer (hot water only). Source: Report on Greece Energy Audit.

2001-05-31 79
ÅF-Energikonsult AB F:\CHOSE\relfinal\Final Report 010710.doc 471275-D-SW-03
Detailed results from the energy audits are presented in the Energy Audits – Greece, Appendix E 7.4.3 Italy 7.4.3.1 Energy consumption in Italian hotels studied In Italy, 21 hotels were initially considered, out of which 10 hotels were further chosen for a detailed energy audit, as to characterise the energy profile demand for electricity, heating and cooling. For the audited hotels, as the following figure shows, there is a strong relation be-tween total energy consumption and the size of the hotel.
0
2000
4000
6000
8000
10000
12000
14000
16000
0 100 200 300 400 500 600 700
Number of rooms
Tpta
l Ene
rgy
Con
sum
ptio
n, M
Wh
Figure 29: Relation between energy consumption and size of the hotels included in the
Italian case study. Source: Report on Italy Energy Audit. As showed in the figure below, energy efficiency measures has to be taken into consideration, especially for the medium-sized hotels as they specific energy consumption is high. The con-clusion is, as for the hotels studied in Italy, that before considering a CHP system, effort must be made to reduce the energy requirements.

2001-05-31 80
ÅF-Energikonsult AB F:\CHOSE\relfinal\Final Report 010710.doc 471275-D-SW-03
0
50
100
150
200
250
300
350
400
450
50-150 room more than 150 rooms
kWh/
m2
year
Fuel incl. District Heating
Electricity
Figure 30: Specific energy consumption according to size of selected hotels in Italy.
Source: Report on Italy Energy Audit. 7.4.3.2 Energy Load Profiles Electrical Load Profile The typical monthly electrical load profiles for the 10 audited Italian hotels are given in the following figure. The figure demonstrates seasonal variations in consumption, with higher electrical consumption during the summer months, as a result of air-conditioning loads.
Electrical Energy Supply
10
100
1000
jan
feb
mar apr
maj jun jul
aug
sep
oct
nov
dec
months
MW
h
Hotel 1Hotel 2Hotel 5Hotel 6Hotel 7Hotel 11Hotel 13Hotel 15Hotel 16Hotel 21
Figure 31: Typical monthly electrical profiles in the Italian hotels included in the Case
Study. Source: Report on Italy Energy Audit.

2001-05-31 81
ÅF-Energikonsult AB F:\CHOSE\relfinal\Final Report 010710.doc 471275-D-SW-03
Thermal Load Profile The typical monthly thermal load profiles for the 10 audited Italian hotels are given in the figure below. The figure demonstrates seasonal variations in consumption, with a slightly higher thermal consumption during the winter months in some geographical locations, as a result of space heating. The base loads for the hotels are generally high due to a high con-sumption of domestic hot water.
Thermal Energy Supply
10
100
1000
10000
jan
feb
mar apr
maj jun jul
aug
sep
oct
nov
dec
months
MW
h
Hotel 1Hotel 2Hotel 5Hotel 6Hotel 7Hotel 11Hotel 13Hotel 15Hotel 16Hotel 21
Figure 32: Typical monthly thermal profiles in the Italian hotels included in the Case
Study. Source: Report on Italy Energy Audit. Detailed results from the Italian energy audits are presented in the Energy Audits – Italy, Appendix F. 7.4.4 Portugal The Energy Audits for the CHOSE project were targeted to 3 star hotels and to hotel-apartments. As an extreme case, one “Pousada” a state-inn was also chosen. 7.4.4.1 Energy consumption in Portuguese hotels studied As for the other partner countries, the variations in types of hotel, number of rooms, fuel and energy sources used, etc., it has been difficult to arrive at a significant relation between en-ergy consumption and hotels characteristics, as it can be seen from the figure below. However some conclusions can bee made.

2001-05-31 82
ÅF-Energikonsult AB F:\CHOSE\relfinal\Final Report 010710.doc 471275-D-SW-03
0
1000
2000
3000
4000
5000
6000
7000
8000
9000
0 100 200 300 400 500
rooms
MW
h
Figure 33: Relation between total energy consumption and size of the hotels included in
the Portuguese case study. Source: Report on Portugal Energy Audit. 7.4.4.2 Energy Load Profiles Determination of energy consumption patterns in the Portuguese hotels was made on an hourly basis. The approach followed for the chosen hotels was to simulate each one using a well-known software tool, VisualDOE, the adequate climatic files, the information of building designs and the audit results. This approach was chosen because it's a common approach for this kind of studies9 and was used in a previous study on Portuguese Hotel's energy consump-tion10 so its results could be compared. It also avoided expensive thorough energy audits, which, due to budget restrictions would make it impossible to have real curves from each of the studied cases. The resulting curves have some uncertainty due to simplifications made, but by having incor-porated the effect of thermal behaviour of the buildings, and tuned against the audit estimates, they show a reliable hypothesis of the energy consumption pattern of those hotels, so the evaluation of CHCP can be considered fair. Electrical Load Profile The following figure illustrates the results for one of the studied cases in Portugal. The figure shows the electric load (without cooling) over the year represented on a daily scale.
9 See "Market Assessment of Combined Heat and Power in the State of California", California Energy Commis-sion, October 2000 10 Condições de Utilização de Energia e de Segurança nos principais equipamentos energéticos na hotelaria, CCE et al.

2001-05-31 83
ÅF-Energikonsult AB F:\CHOSE\relfinal\Final Report 010710.doc 471275-D-SW-03
Electricity (without cooling)
5354555657585960
1 22 43 64 85 106
127
148
169
190
211
232
253
274
295
316
337
358
days
kW
Figure 34: Typical electrical profile, daily average over the year, represented in the Por-
tuguese hotels included in the Case Study. Source: Report on Portugal Energy Audit. Further, a 3D view of the simulated hotel building and the comparison between billing history and simulated monthly electric energy consumption is illustrated in the figure below. The differences illustrated between the two diagrams, figure 34 and 35, is the use of electricity for cooling in the later diagram.
Figure 35: Monthly electrical profile for one of the Portuguese hotels included in the
Case Study. The simulated profile is compared to its billing history. Source: Re-port on Portugal Energy Audit.
Thermal load profile The thermal load profile separated in heat load profile and cooling load profile is illustrated in the following figures. The figures consist of the results from the simulations on one of the studied cases in Portugal. The figures show the heat load and the cooling load over the year represented on a daily scale.

2001-05-31 84
ÅF-Energikonsult AB F:\CHOSE\relfinal\Final Report 010710.doc 471275-D-SW-03
Heat
50
100
150
200
250
3001 26 51 76 101
126
151
176
201
226
251
276
301
326
351
days
kW(th
)
Figure 36: Typical heat profile, daily average over the year, represented in the
Portuguese hotels included in the Case Study. Source: Report on Portugal Energy Audit.
Cooling
50100150200250300350400
1 22 43 64 85 106
127
148
169
190
211
232
253
274
295
316
337
358
days
kW(th
)
Figure 37: Typical cooling profile, daily average over the year, represented in the
Portuguese hotels included in the Case Study. Source: Report on Portugal Energy Audit.
Detailed results from the Portuguese energy audits are presented in the Energy Audits – Portugal, Appendix G.

2001-05-31 85
ÅF-Energikonsult AB F:\CHOSE\relfinal\Final Report 010710.doc 471275-D-SW-03
7.4.5 Sweden As presented in chapter 6, sixteen hotels were discussed of which 10 hotels were chosen for the study by the Swedish team in order to evaluate the suitability of a CHOSE installation. Since Natural Gas is only available in the south west of Sweden, most of the hotels in the case studies are located in the southern parts. Two hotels were selected in Germany to cover the northern climate zones of Europe. 7.4.5.1 Energy consumption in Swedish hotels studied The location of the selected hotels in Sweden is presented in the figure below which illustrates that all the studied hotels with the exception of one, are located in the south of Sweden at cli-mate zone 4. The exception is located in climate zone 3. The zones are used to decide the in-sulation standard for the building. The studied hotels are business hotels located close to a city or in the city centre. The hotels in the suburbs (case 1,2,10 and 11) were built in the period of the year 1964 – 1969, and are called Motor Hotels. The energy for space heating and domestic hot water are 60 % of the total energy use. In these cases the ratio between heat and electric energy is higher than 1. The buildings in these Motor Hotels are low and wide, with a maximum of two floors. The hotels in the case study are two-medium size hotels with 50-150 rooms, and two large hotels with more than 150 rooms.
Dortmund, Germany
Bremen, Germany Figure 38: Locations of the selected hotels in Sweden. Source: Report on Energy Audit – Sweden.

2001-05-31 86
ÅF-Energikonsult AB F:\CHOSE\relfinal\Final Report 010710.doc 471275-D-SW-03
In comparison to the suburb hotels, the city centre hotels are more compact buildings and number of floors are varies between 5 - 20. They are all built 1985 or later. For these hotels the thermal energy consumption represent a fairly low ratio in relation to the total energy con-sumption, i.e. 30 - 47 % and the ratio between the heat and electric is lower than 1. The city centre hotels are large hotels with more than 150 rooms, except one that is medium-sized. In the figure below, the specific energy consumption as a function of year of construction the analysis from above on electricity and thermal energy ratio in relation to the total energy con-sumption is illustrated for all the studied hotels.
0
50
100
150
200
250
1960 1965 1970 1975 1980 1985 1990 1995
Year of construction
Spec
ific e
nerg
y co
nsum
ptio
n kW
h/m
2
Electricity Heating
Figure 39: The specific energy consumption as a function of year of construction
of hotels included in the Swedish study. Source: Report on Energy Audit – Sweden. For the studied hotels the following figure shows the total energy consumption as a function of number of rooms.
0
1000
2000
3000
4000
5000
6000
7000
0 50 100 150 200 250 300 350
Number of rooms
tota
l ene
rgy
cons
umpt
ions
MW
h
total energy consumption year of construction 1964-1969
total energy consumptions year of construction 1985-1992
Figure 40: The total energy consumption as a function of size of hotels included
in the Swedish study. Source: Report on Energy Audit – Sweden.

2001-05-31 87
ÅF-Energikonsult AB F:\CHOSE\relfinal\Final Report 010710.doc 471275-D-SW-03
As seen in the figure, two hotels can be observed as not following the trend line. One hotel was restored in 1992 with a new hotel- and conference section, but the main building section was built in the 19th century. The other hotel is unique due to its high building with 21 floors. The average specific energy consumption according to the size of selected hotels, referred to the number of rooms, is presented in the figure below.
0
50
100
150
200
250
300
350
50 - 150 room more than 150 rooms
kWh/
m2
year
Fuel incl. Distric t Heating
Electric ity
Figure 41: Specific energy consumption according to size of selected hotels in
the Swedish study. Source: Report on Energy Audit – Sweden. All medium-sized hotels (case 7, 10, 11 and 12) have shown poor energy performance for electrical consumption and good or fair performance for heating. However, two of the me-dium sized hotels are rated as poor energy performance according to the total consumption. One large hotel (case 8) is rated as poor according to the electric consumption, but fair or good for the total rating including both electricity and heat. 7.4.5.2 Energy Load Profiles The issue of the Swedish team has been to construct energy profiles on an hourly basis as an input to the developed evaluation model. The reason for having energy profiles on an hourly base is discussed in chapter 6.2 and 6.3. Detailed energy audits have been conducted by the audit-team in all the selected hotels in or-der to establish accurate energy profiles for the electric, heating and cooling load. Out of those, 9 hotels have detailed hourly profiles. Due to the measuring problems in one of the selected hotels, the hourly profile is missing. As the energy profiles are based on measured data they reflect the real consumption including all activities that have taken place in the hotel. It means that extra consumption used for re-building the hotel, or less consumption as a result of breakdowns is included in the data. There have not been any corrections concerning these types of activities as it often happens and it will reflect the reality. However, corrections have been made for periods of missing data.

2001-05-31 88
ÅF-Energikonsult AB F:\CHOSE\relfinal\Final Report 010710.doc 471275-D-SW-03
Electrical, Heat and Cooling Load Profiles Energy profiles for two typical hotels are shown below. One hotel (case A) has a typical en-ergy load demand profiles for a hotel built in the period of 1985. The energy demand for the electricity (excluding chillers for climate cooling) and the heat load results in a ratio between the heat and electric energy which is higher than 1. The other hotel (case B) is an example of a hotel built in 1970s, where the ratio between heat and electricity is lower is than 1. Also, the cooling loads for the two hotels are presented for the same period. Detailed results from the energy audits are presented in Energy audits – Sweden, Appendix H.

10-07-2001 89
ÅF-Energikonsult AB F:\CHOSE\relfinal\Final Report 010710.doc 471275-D-SW-03
0
100
200
300
400
500
600
700
800
900
1 324 647 970 1293 1616 1939 2262 2585 2908 3231 3554 3877 4200 4523 4846 5169 5492 5815 6138 6461 6784 7107 7430 7753 8076 8399 8722 Figure 42 a: Electrical demand
0
100
200
300
400
500
600
700
800
900
1 324 647 970 1293 1616 1939 2262 2585 2908 3231 3554 3877 4200 4523 4846 5169 5492 5815 6138 6461 6784 7107 7430 7753 8076 8399 8722 Figure 42b: Heat demand
0
100
200
300
400
500
600
700
800
900
1 324 647 970 1293 1616 1939 2262 2585 2908 3231 3554 3877 4200 4523 4846 5169 5492 5815 6138 6461 6784 7107 7430 7753 8076 8399 8722 Figure 42 c: Cooling demand Figure 42: Energy profiles in the Swedish studied hotel (A). Source: Report on Energy Audit - Sweden
0
100
200
300
400
500
600
1 324 647 970 1293 1616 1939 2262 2585 2908 3231 3554 3877 4200 4523 4846 5169 5492 5815 6138 6461 6784 7107 7430 7753 8076 8399 8722 Figure 43 a: Electrical demand
0
100
200
300
400
500
600
1 324 647 970 1293 1616 1939 2262 2585 2908 3231 3554 3877 4200 4523 4846 5169 5492 5815 6138 6461 6784 7107 7430 7753 8076 8399 8722 Figure 43 b: Heat demand
0
100
200
300
400
500
600
1 324 647 970 1293 1616 1939 2262 2585 2908 3231 3554 3877 4200 4523 4846 5169 5492 5815 6138 6461 6784 7107 7430 7753 8076 8399 8722 Figure 43 c: Cooling demand Figure 43: Energy profiles in the Swedish studied hotel (B). Source: Report on Energy Audit - Sweden

2001-04-17 90 7.5 Differences between countries As seen in each partner country section above, the variations which exist regarding types of hotel, number of rooms, category, geographical location, fuel and energy sources used etc., makes it difficult to arrive at a relation between energy consumption and hotels characteris-tics. The results presented in this section are therefore a limited selection of each partner country hotels. One of the parameters analysed for the different hotels, is supplied energy per m2 total build-ing area, measured in kWh/m2. In the figure below the specific energy consumption for all the hotels studied in the partner countries are illustrated.
0
100
200
300
400
500
600
1 3 5 7 9 11 13 15 17 19 21 23 25 27 29 31 33 35 37 39 41 43 45 47Hotel
kWh/
m2
year
Electricity Fuel incl. District Heating
Figure 44: Total energy consumption divided into electricity and other energy consump-tion per hotel and per kWh/m2. Source: Project Results. The demand for cooling can be expressed as supplied electricity to the cooling systems per year and building area. In this case, the total area of the building is considered, since separate data on areas using heat or comfort cooling is not available for all hotels.

10-07-2001 91
ÅF-Energikonsult AB F:\CHOSE\relfinal\Final Report 010710.doc 471275-D-SW-03
0,0
10,0
20,0
30,0
40,0
50,0
60,0
70,0
80,0
1 2 3 4 5 6 7 8 9 10 11 12 13 14 15 16 17 18 19 20 21 22 23 24 25 26 27 28 29 30 31 32 33 34 35 36 37 38 39 40 41 42 43 44 45 46 47 48hotels
Spec
ific
load
, kW
H/ m
2 an
d ye
ar
Figure 45: Supplied electrical energy for comfort cooling, hotel rooms and conference
section, per hotel, kWh/m2 and year. Source: Project Results. It should be noted that the above figures are not adjusted according to heating- and cooling days. In addition, the figures have not taken into account how much of the hotel area have comfort cooling, or how much is being heated. Therefore, the diagrams should not be used as a measure on how effective the energy is used. In addition it should not be used to determine the differences in efficiency of the heating- or cooling system in different hotels, since the energy used is not correlated to the output. Table 17: Months with comfort cooling systems in operation. Source: Project Results. Jan Feb Mar April May June July Aug Sept Oct Nov Dec Cyprus Greece Italy Portugal Sweden In the following figure, the ratio of electricity used for comfort cooling compared to total electricity used is shown. The reasons for the differences observed are a longer period of comfort cooling, and generally a larger demand for cooling depending on the out door tem-perature, but also because a greater part of the building have comfort cooling. However, this is most likely not the general case, but applies to the hotels selected for the case study.

10-07-2001 92
ÅF-Energikonsult AB F:\CHOSE\relfinal\Final Report 010710.doc 471275-D-SW-03
0,0
10,0
20,0
30,0
40,0
50,0
60,0
70,0
80,0
90,0
100,0
1 2 3 4 5 6 7 8 9 10 11 12 13 14 15 16 17 18 19 20 21 22 23 24 25 26 27 28 29 30 31 32 33 34 35 36 37 38 39 40 41 42 43 44 45 46 47 48
Hotell
%
Figure 46: Share of supplied electricity used for comfort cooling, in % of total supplied
energy in the hotels included in the case study. Source: Project Results. Further, the differences in the use of Domestic Hot Water (DHW) between the hotels included in the case study are showed in the following figure.
0,00
1,00
2,00
3,00
4,00
5,00
6,00
7,00
1 2 3 4 5 6 7 8 9 10 11 12 13 14 15 16 17 18 19 20 21 22 23 24 25 26 27 28 29 30 31 32 33 34 35 36 37 38 39 40 41 42 43 44 45
Hotels
Use
of d
omes
tic h
ot w
ater
MW
h/ro
om a
nd y
ear
Figure 47: Use of domestic hot water in the hotels included in the case study. Source: Project Results. Another difference is the frequency of a laundry operated by the hotel. In the Mediterranean countries more than 50 % operate a laundry. As mentioned earlier in the report, this is a dif-ference compared to Swedish hotels where the laundry has been out-sourced to other compa-nies with their core business being laundry services.

10-07-2001 93
ÅF-Energikonsult AB F:\CHOSE\relfinal\Final Report 010710.doc 471275-D-SW-03
7.6 Conclusions In the majority of the hotel cases studied it is recommended that before considering a CHP system, every effort must be made to reduce the energy requirements, and especially the elec-trical energy consumption. This reduction can be achieved through the incorporation of sim-ple energy saving technologies. However, the most important measure is to reduce the energy consumption for space heating. The reason is that the energy profile of the heat load, in combination with the possibility to convert the cooling production from electrical chiller into absorption, set the sizing data for a CHP package. An installation of absorption machines reduces the electrical need for power as well as energy. In the future, there will be an increase in the demand for electricity, which may cause trouble for electrical generation in many countries, shortage of power, as well as difficulties with transmission. A detailed review of the existing energy saving measures is also recommended, to ensure that all other more cost-effective measures have been identified and implemented prior to the specification of the CHP-unit.

10-07-2001 94
ÅF-Energikonsult AB F:\CHOSE\relfinal\Final Report 010710.doc 471275-D-SW-03
8. Economic results The main result of the project is the guideline that eases the decision on the installation of CHP or CHCP plants in hotels. The method used and the assumptions made for the technical and economical calculations are discussed in chapter 6.3, Method of Economical Evaluation. In the following chapters the evaluation results are discussed. A summary of the energy prices used for a medium sized hotel are given in table 10 and a detailed information for Cyprus, Greece and Portugal about tariffs and prices can be find in Energy and price parameters, Appendix I. 8.1 COST-effectiveness of CHCP The cost-effectiveness of CHCP and CHP shows the following payback periods for the in-vestments: Table 18: Results from the Pay back analysis. Source: Project results. Cyprus Greece Italy Portugal Sweden CHCP 8,4 1) > 6 2,5-4,1 > 15 CHP 3,9-4,7 4,5-6 2,7-4,4 2) > 15
1) A subsidy on the capital investment of 30% of the initial cost reduces the payback period to 4,2 years. 2) With actual prices, none of the cases has a real cost-effective CHP solution. A price difference of 12
Euro/MWh between gas for boiler and gas for CHP gave pay back periods of 4,4 – 7,0 years. Until January 2000 there are no differences in Natural gas prices for CHP and for boilers in Portugal.
8.1.1 Cyprus CHP Evaluation The basic form of CHP suitable for the majority of examined hotels would consist of a mini-CHP package set with a heat recovery system to provide mainly domestic hot water. The in-stallation of the proposed CHP mini-packages is resulting in primary energy savings of around 7% to 17%. The magnitude of the savings was calculated taking into account the effi-ciency of electricity generation from the conventional units of Electricity Authority of Cyprus of around 38%.

10-07-2001 95
ÅF-Energikonsult AB F:\CHOSE\relfinal\Final Report 010710.doc 471275-D-SW-03
Table 19: Summary of CHP evaluation energy results. Source: Cyprus report.
Base Case CHP only Hotel Cases Electricity
MWh Fuel
MWh Total MWh
Installed kWe
Electricity MWh
Boiler/CHP Fuel MWh
Total MWh
Primary Energy Savings
1 2.790 3.107 5.897 195 1.705 756 3.519
5.980 16%
3 5.150 2.823 7.973 147 4.345 1.052 2.703
8.100 7,2%
4 550 581 1.131 37 345 79 726
1.150 15,5%
5 1.060 1.407 2.467 73 610 470 1.420
2.500 16,7%
Generally CHP is likely to be economical viable for the examined hotel sites provided the unit would meet the thermal base load (domestic hot water load) and thus run over 4.000 full load hours per year, as shown in the following table. Pay back periods from 3,9 to 4,7 years were obtained, under the specified conditions, for all the simulated energy-demand behaviours of the considered hotels. Table 20: Summary of CHP evaluation financial results. Source: Cyprus report.
CHP Installed capacity Hotel cases Electrical
kWe Thermal
kWth
Hours run at full load
Simple Pay-back
period
1 195 318 4.500 4,7
3 147 250 4.270 4,1
4 37 73 3.300 4,5
5 73 128 4.632 3,9 CHCP Evaluation Because of the great differences in the operational conditions of the hotels in Cyprus, as well as the small sample of hotels audited in this study, the results of the CHCP analysis can not be generalised for the whole hotel sector. The analysis showed that the concept of CHCP system is not likely to be viable with the pre-sent fuel and electricity prices, and the required capital costs. The most favourable result ob-tained, a case with CHP and an absorption chiller of 300 kWc cooling capacity, showed a payback period of 9 years - a result that is not acceptable in the hotel sector. However, sub-sidy schemes on the initial investment cost and fuels cost could greatly influence the financial results of such an investment. This is discussed in Chapter 8.2 Sensitivity of results to other changes and assumptions.

10-07-2001 96
ÅF-Energikonsult AB F:\CHOSE\relfinal\Final Report 010710.doc 471275-D-SW-03
8.1.2 Greece CHP Evaluation A feasibility assessment was undertaken in order to evaluate the performance and economic viability of a CHP installation to the examined hotel sites, using the common evaluation model. The evaluation was based on the energy, economical and financial parameters that are given in previous Chapters and Appendices. The results from 8 of the examined cases, in which a CHP installation is viable in principle, are shown in the following tables. The basic form of CHP suitable for the majority of exam-ined hotels would consist of a mini-CHP package set with a heat recovery system to provide mainly domestic hot water. The proposed CHP installations range in size from just 18 kWe to 210 kWe. Table 21: Summary of CHP evaluation energy results. Source: Greek Report.
Base Case CHP only Hotel Cases Electricity
MWh Fuel MWh
Total MWh
Installed kWe
Electricity MWh
Boiler/CHP Fuel MWh
Total MWh
Primary Energy Savings
1 4.901 4.064 8.965 160 3.932 2.042 3.098
9.072 8,9%
2 986 1.166 2.152 47 680 433 1.036
2.149 13,7%
3 1.087 1.224 2.311 35 853 664 790
2.307 9,7%
4 761 1.042 1.803 30 575 589 631
1.795 10,5%
5 322 916 1.238 42 112 427 702
1.241 19,8%
6 590 719 1.309 18 481 449 368
1.298 8,5%
7 3.089 1.523 4.612 96 2.534 264 1.829
4.627 9,4%
8 10.792 3.377 14.169 210 9.646 1.142 3.575
14.363 5,4%
Generally CHP is likely to be economical viable for the examined hotel sites provided the unit would meet the thermal base load (domestic hot water load) and thus run over 4.000 full load hours per year, as shown in Table 22. For the remaining two hotel cases, the installation of a CHP is non-economical viable, since these are seasonal tourist hotels with an operation period of 7 months (5.136 hours). The installation of the proposed CHP mini-packages is resulting in primary energy savings of around 5,5% to 20%. The magnitude of the savings was calculated taking into account the efficiency of electricity generation from the conventional units of Greek Public Power Corpo-ration of around 37%.

10-07-2001 97
ÅF-Energikonsult AB F:\CHOSE\relfinal\Final Report 010710.doc 471275-D-SW-03
Table 22: Summary of CHP evaluation financial results. Source: Greek report.
CHP Installed capacity Hotel cases Electrical
kWe Thermal kWth
Hours run at full load
Simple Pay-back period
Net Present Value (NPV) in Euro
1 160 279 4.388 4,6 256.588
2 47 94 4.817 4,9 88.601
3 35 71 5.219 5,1 64.009
4 30 62 4.665 5,3 52.846
5 42 85 4.140 5,1 73.990
6 18 38 4.674 5,2 36.515
7 96 180 3.138 6,0 99.801
8 210 348 4.510 4,9 275.871 Pay back periods from 4,5 to 6,0 years were obtained, under the specified conditions, for all the simulated energy-demand behaviours of the considered hotels. In the following figure a relation between the proposed CHP electrical power capacity and the number of rooms is shown. As the following figure shows, there is a strong relation (with correlation coefficient R² =0,986), between the proposed installed power and the number of rooms.
y = 148,57Ln(x) - 679,99R2 = 0,9858
0
50
100
150
200
250
0 100 200 300 400 500
Number of rooms
CHP
inst
alle
d el
ectr
ical
pow
er, k
We
Figure 48: Relation between CHP installed power and number of rooms in the Greek
case studies. Source: Greek Report.

10-07-2001 98
ÅF-Energikonsult AB F:\CHOSE\relfinal\Final Report 010710.doc 471275-D-SW-03
CHCP Evaluation The installation of CHP in combination with absorption chillers (CHCP) was also investigated for two typical cases, one of a medium-sized and one large-sized hotel, using the evolved computer package. Generally the use of absorption chillers and the concept of CHCP system are likely not to be economical viable, particularly to medium-sized or large hotels with less than 400 guest rooms for the present fuel, electricity prices and the required capital costs. In the following figures a comparison between CHP only application and a CHCP (including different sizes of absorption chillers) is given. In the first medium-sized hotel case three options have been considered: (1) CHP only, (2) CHP with a single-effect absorption chiller of 17 kWc cooling capacity and (3) CHP with an absorption chiller of 26 kWc cooling capacity. In this comparison the Net Present Values (NPV) of the relevant investments are set out in the following figure. Results from the evaluation show that the NPV of CHP only application is the most accept-able, since the other two alternatives show lower NPV for the expected higher installed CHP electrical capacities.
0
10.000
20.000
30.000
40.000
50.000
60.000
70.000
10 15 20 25 30 35 40 45 50 55 60 65 70 75 80 85 90 95 100
CHP electrical capacity, kWe
Net P
rese
nt V
alue
(NPV
), in
Eur
o
CHP only CHP + 17 kWc CHP + 26 kWc
Figure 49: Comparison of CHP application and CHP in combination with absorption
chillers in a medium-sized hotel. Source: Greek Report.

10-07-2001 99
ÅF-Energikonsult AB F:\CHOSE\relfinal\Final Report 010710.doc 471275-D-SW-03
In the second case, with the large hotel, the installation of an absorption chiller gives more encouraging results. Calculating NPV for three alternatives: (1) CHP only, (2) CHP with a single-effect absorption chiller of 115 kW cooling capacity and (3) CHP with an absorption chiller of 150 kW. The second alternative gives an approximating indication of to be economical. Even in this case the simple payback period from the installation of a 115 kW absorption chiller and the prolongation of thermal duration curve during summer period may be rather long for the in-vestment criteria and the NPV benefits are comparable to those of CHP only application.
0
50.000
100.000
150.000
200.000
250.000
300.000
100 120 140 160 180 200 220 240 260 280 300 320 340 360 380 400
CHP electrical capacity, kWe
Net P
rese
nt V
alue
(NPV
), in
Eur
o
CHP only CHP + 30 RT CHP + 40 RT
Figure 50: Comparison of CHP application and CHP in combination with absorption
chillers in a large hotel.( 30 Rt = 115 kWc, 40 RT = 150 kWc.) Source: Greek report.
8.1.3 Italy The performance and economic viability of a CHP and CHCP installation has been evaluated for the examined hotel sites. The results show installations from the examined cases are economically viable with pay back period of less than 4,5 years. The basic form of CHP suitable for the majority of examined hotels would consist of a mini-CHP package set with a heat recovery system to provide mainly domestic hot water but also CHCP installations seems to be viable for the actual en-ergy prices.

10-07-2001 100
ÅF-Energikonsult AB F:\CHOSE\relfinal\Final Report 010710.doc 471275-D-SW-03
Table 23: Summary of CHP and CHCP evaluation financial results.
Source: Evaluation of the Appropriate CHCP Plant-Italy. Hotel cases CHCP Installed capacity Simple Pay back period,
year Electrical
kWe Thermal kWth
Cooling kWcool
CHP CHCP
1 1500 1766 700 2,7 2,5 2 200 335 100 4,2 3,9 5 200 335 100 4,4 4,1 6 130 235 110 3,4 3,8 11 168 291 110 3,4 3,4 13 200 335 90 3,2 3,2 15 100 187 40 3,4 3,6 16 250 399 150 2,8 3,0
The hotels studied in the range 100 to 250 rooms the proposed CHP installations are sizes of 100 kWe to 250 kWe has been evaluated. For one hotel at the size of 650 rooms, which also is the biggest hotel studied in the CHOSE project, an installation of 1.5 MWe installation is eco-nomically feasible. The thermal demand for this installation is steam for laundries, dish wash-ers and cooking and hot water for space heating and domestic hot water. 8.1.4 Portugal CHP Evaluation With actual prices, none of the cases has a real cost-effective CHP solution. The cost of each generated kWh is higher than the average purchase cost, and in general only lower than the peak term price. As a result of this, benefits would be maximised by running the co-generation unit only during peak term periods, but this makes the system non-viable due to an excessive payback period. Only one case could be considered cost-effective due to low volt-age generation is just allowed for a 15kW co-generation unit. CHCP Evaluation The installation of CHP in combination with absorption chillers was also investigated for the two cases with higher CHP power, and for the cases with higher cooling consumption. In none of the cases a cost-effective solution was found, even with the special gas price for co-generation. In fact, both the actual investment in absorption chillers in the possible range, and the maintenance costs of cooling towers contribute in a decisive way to this. 8.1.5 Sweden CHP and CHCP are not an option at the present time. The Swedish hotels do not seem to be suited for CHP at the present energy prices. Their thermal energy profiles descend too much, so the base load is very small (domestic hot water only), and the natural gas is pres-ently too expensive for producing electricity. Due to these facts, energy prices of electricity and natural gas indicate that CHP and CHCP are not economically feasible.

10-07-2001 101
ÅF-Energikonsult AB F:\CHOSE\relfinal\Final Report 010710.doc 471275-D-SW-03
The above considerations together with a low Coefficient of Performance, COP, and a high price for the Absorption chillers avoid almost any chance to make a CHCP system cost-effective. 8.2 Sensitivity of results to other changes and assumptions The financial analysis in combination with the sensitivity analysis bring out not only the con-ditions that make the investment financially acceptable to the final user, but also the National Economy’s benefit that an investment like this leads to. This makes it possible to define quality and quantity motives, i.e. the grants or level of subsi-dies for specific systems. It can also assist in the admission of a new price policy in the sector of self-production or co-generation, such as a price policy for natural gas invoices, or policies for purchase/sale invoices of the Public Power Corporation. 8.2.1 General conclusions Energy prices and national subsidies have a big impact on the economical result for a CHP or a CHCP installation. The results are very sensible to the natural gas price and the price of sub-stitute fuel (i.e. light oil) and price of electricity. Considering that a CHP or a CHCP invest-ment is capital intensive, a subsidy on the initial investment cost influences greatly the finan-cial result of the investments. The sensitivity analysis has been limited to the following parameters, as these are associated to uncertainty or has a high probability to change: • average intended grade of capital’s profitability • the unit value of a co-generation system fuel • structure of fuel prices • subsidy’s percentage (allowance of capital) From the parameters above, a selected number have been chosen by the partner countries for their respective sensitivity analysis. 8.2.2 Cyprus The Cypriot result showed a payback period of almost 9 years on CHCP investments, a result that is unacceptable in the hotel sector. However, considering that CHP investments are capi-tal intensive, a subsidy on the initial investment cost influences greatly the financial results of the investment. A subsidy of 30% of the initial cost reduced the payback period from 8,4 years to 4,2 years. The fuel cost is another issue of concern, especially under the local conditions prevailing in Cyprus. There is a surplus of LPG produced at the Cyprus Refinery during the summer pe-riod. Operation of CHCP systems fired with LPG could alleviate part of the surplus problem. A reduction of with 20% from 21,8 Euro/MWh, nominal value, results in a substantial reduc-

10-07-2001 102
ÅF-Energikonsult AB F:\CHOSE\relfinal\Final Report 010710.doc 471275-D-SW-03
tion of the payback period of the investment. In conjunction with a subsidy on the initial in-vestment cost, this can make the CHCP systems concept viable (payback period of the order of 3 to 4 years). Table 24: Payback period (years). Source: Report CHCP Evaluation – Cyprus.
Subsidy of the capital cost (%) Subsidy LPG (%) 0 10 20 30 40 50
0 5 10 15 20
8,43 8,01 7,55 7,20 6,83
7,02 6,63 6,28 5,98 5,70
5,60 5,30 5,02 4,78 4,55
4,19 3,96 3,75 3,56 3,40
2,78 2,63 2,49 2,37 2,25
1,37 1,29 1,22 1,16 1,10
8.2.3 Greece The values of technical and financial parameters that are used in the feasibility study and CHP evaluation have got a level of uncertainty. The reason is because they are either forecasts i.e. the value of natural gas has not yet been defined for the city of Thessaloniki, or they are con-tinuously changing. For this reason, except from the analysis based on the nominal values of parameters, it is necessary to investigate what could be the consequences of values different than the nominal. The results of the parameter research are represented at the following figures. The following conclusions could be drawn from these figures: • A 10% increase in the natural gas price reduces the net present value, NPV, of the invest-
ment by 30%, and a 22% increase reduces the NPV by 65%. • A 10% increase in discount rate reduces the NPV of the investment by 6%, and a 20%
increase reduces the NPV by 12%. • Considering that CHP investments are capital intensive, there could be a reason for a par-
tial subsidy of the initial capital cost. Even a small 10% subsidy increases significantly the economical viability of these investments.
As shown in the following figures, the price of natural gas has the greater influence of the financial viability of CHP units:

10-07-2001 103
ÅF-Energikonsult AB F:\CHOSE\relfinal\Final Report 010710.doc 471275-D-SW-03
0
10000
20000
30000
40000
50000
60000
70000
23,2 24,4 25,6 26,9 28,2
Fuel (NG) price for CHP, in Euro/MWh
Net P
rese
nt V
alue
, in
Euro
0
2
4
6
8
10
12
14
Sim
ple
Payb
ack
Perio
d
NPV SPB
Figure 51: Results of sensitivity analysis with regard to price of natural gas. Source: Report
CHP Evaluation – Greece.
0
10000
20000
30000
40000
50000
60000
70000
5 5,5 6 6,5 7 7,5Discount rate (%)
Net
Pre
sent
Val
ue, i
n Eu
ro
NPV
Figure 52: Results of sensitivity analysis with regard to discount rate.
Source: Report CHP Evaluation – Greece.

10-07-2001 104
ÅF-Energikonsult AB F:\CHOSE\relfinal\Final Report 010710.doc 471275-D-SW-03
0
10000
20000
30000
40000
50000
60000
70000
80000
90000
100000
0% 4% 10% 16% 20% 25% 29% 35% 39% 45% 49%
Grant or subsidy (%)
Net P
rese
nt V
alue
(NP
V), i
n Eu
ro
0
2
4
6
8
10
12
14
Sim
ple
Payb
ack
Perio
d (S
PB)
NPV SPB
Figure 53: Results of sensitivity analysis with regard to grant or subsidy.
Source: Report CHP Evaluation - Greece 8.2.4 Portugal Also in Portugal attempts were made to assess which were the sensible parameters that could make co-generation cost-effective. Besides natural gas price and investment, the ones that proved to be important, were also Electric Power/Thermal Power ratio have influence on the profitability. In the case of price of natural gas, it was concluded that the structure of the prices are proba-bly more important than the price level. Today, co-generated power becomes expensive com-pared to the price of purchased electricity. However, a difference in price between the natural gas used for boilers and the natural gas used for CHP, would support co-generation. The exis-tence of this difference is easier to anticipate than a descent in the overall prices. In some countries this price differentiation is already the case, and serves as an incentive to encourage co-generation. A price difference similar to existing price differences in other countries of 12 Euro/MWh between gas for boiler and gas for CHP, was tested. The nominal prices for natural gas for the case studied is 32.2 Euro/MWh. The obtained results were:

10-07-2001 105
ÅF-Energikonsult AB F:\CHOSE\relfinal\Final Report 010710.doc 471275-D-SW-03
Table 25: Summary of CHP evaluation energy results for an incentive of 12 Euro/MWh
in gas price in Portugal. Source: Report CHP Evaluation – Portugal. Base Case CHP only Hotel
Cases Electricity MWh
Fuel MWh
Total MWh
Installed kWe
Electricity MWh
Boiler/CHP Fuel MWh
Total MWh
Primary Energy Savings
1 801 1091 1892 26 623 670 630
1471 10.4%
2 1164 504 1669 9 1100 350 230
1680 3.1%
3 567 469 1036 14 464 223 367
1054 9.4%
4 1025 423 1448 11 947 236 279
1462 4.4%
5 2064 1185 3249 17 1945 900 424
3269 3.2%
6 416 412 828 11 341 232 269
842 9.0%
7 668 722 1390 19 1) 549 441 422
1412 8.7%
10 4105 680 4785 17 3981 392 433
4806 1.9%
11 1394 579 1973 26 1214 158 632
2004 7.4%
1) Low voltage generation The basic form of CHP suitable for the majority of the examined hotels would consist of a mini-CHP package set with a heat recovery system to provide mainly domestic hot water. Two of the cases did not have a cost-effective solution, one due to its size (35 rooms), and the other due to particular characteristics (low quality, mild climate location). Generally, the CHP is likely to be economically viable for the examined hotel sites provided the unit would meet the thermal base load (domestic hot water load) and thus run over 6.000 full load hours per year, as shown in the following table.

10-07-2001 106
ÅF-Energikonsult AB F:\CHOSE\relfinal\Final Report 010710.doc 471275-D-SW-03
Table 26: Summary of CHP evaluation, financial results for an incentive of 12
Euro/MWh in gas price in Portugal. Source: Report CHP Evaluation – Portugal. CHP Installed capacity Hotel
cases Electrical kWe
Thermal kWth
Hours run at full load
Simple Pay-back period
Net Present Value (NPV) in Euro
1 26 57 6846 6.8 26 390
2 9 20 7111 7.0 10 806
3 14 31 7357 6.2 20 900
4 11 25 7090 6.6 14 462
5 17 38 7000 6.2 24 082
6 11 25 6818 6.8 13 715
7 19 1) 42 6263 4.4 51 436
10 17 38 7235 5.9 26 821
11 26 57 6923 5.6 42 584 1) Low voltage generation The obtained payback periods were between 4.4 and 7.0 years, under the specified conditions. In case number 7, the already quoted having a CHP unit for low voltage generation own trans-former, leads to the best result (4.4 years). This is due to the higher electricity prices and may be the case of several other hotels not studied. A parameter that seems to influence the results is the electric/thermal power ratio. A sensi-tivity analysis has been done for that parameter for the cases studied in Portugal. Although it is strictly dependent on the CHP technology, recent data about available packages with spark ignition engines do present significant differences toward the assumed values considered in the evaluation software tool (electric/thermal ratio 0,44 –0,47). Therefore, a different tool was used to test the same cases, using data from one small CHP package (15kWe/39kWt, elec-tric/thermal ratio 0,38) as a single unit and in clusters. The evaluation results are shown in the following table. For the sake of comparison, the investment values were calculated using the same equation as before, and the tool was calibrated with the above results.

10-07-2001 107
ÅF-Energikonsult AB F:\CHOSE\relfinal\Final Report 010710.doc 471275-D-SW-03
Table 27: Summary of the evaluation of the 15kWe/39kWt package. Source: Report CHP
Evaluation – Portugal.
Case System kWe/kWt
Payback (years)
NPV (Euro)
Secondary Energy savings
(%)
Primary Energy savings
(%) 1 45/117 5.4 57 737 6 18 2 15/39 7.0 13 201 2 5 3 15/39 5.4 24 389 6 14 4 15/39 6.8 14 403 3 10 5 45/117 6.4 39 044 2 7 6 15/39 6.7 14 905 5 12 7 45/117 1) 5 68 125 4 17 10 15/39 4.6 33 176 1 2 11 30/78 5.1 48 103 4 9
1) Low voltage generation The results of this parameter study were that the pay back period was reduced and in some cases prolonged. The variation is –1.4 to +0,6 year. An interesting conclusion to draw from these last results, are that the hotels located in the north part of Portugal (cases 1, 5 and 7) were the ones with larger units. The results are tied to the base of the thermal load, which does not have a direct connection with any of the charac-teristics, rooms, location, category, etc. However, it must be noted that any certain conclu-sions in this matter are impossible to draw due to the reduced number of cases of each type. The above results were submitted to the variation of some of these values, namely: • Natural Gas prices +/- 15% • Investment costs – possibility of grants. The results showed that the extreme cases, cases 2, 7 and 11 with a price variation of ± 15%, resulted in payback variations of less than ± 10%. Except for case 2, this variation does not represent a real problem. In case 2 however, the Net Present Value becomes too small for any investor to be interested in the project if prices continue to increase. Any investment reduction through the use of grants has a positive effect of raising the NPV and reducing payback times. 8.2.5 Italy and Sweden No detailed sensitivity analyses have been performed in Italy and Sweden. The reason for this being the obvious results from the case studies and their economic profitability, where the case studied in Italy display a very positive result and the case studied in Sweden indicates the opposite.

10-07-2001 108
ÅF-Energikonsult AB F:\CHOSE\relfinal\Final Report 010710.doc 471275-D-SW-03
8.3. General guidelines Appraising a suitable site for a CHP or CHCP plant, or knowing if a specific hotel is suitable for CHP or CHCP, can be time consuming and expensive. To ease the investigation on the installation of CHP or CHCP plants in hotels, the following steps have been developed as a guideline based on the case studies evaluated in the project. 8.3.1 Finding the energy consumption in the hotel If the actual energy consumption in the hotel is not known, the following diagram can be used. In the diagram, the energy consumption as a function of rooms is presented to give a first indication of the energy used in the hotel. The diagram is based on the case studies done and shows the total energy consumption, both electrical- and thermal energy.
0
2000
4000
6000
8000
10000
12000
14000
16000
18000
20000
0 50 100 150 200 250 300 350 400 450Number of rooms
Tota
l ene
rgy,
MW
h
Italy, Portugal and Sweden Cyprus Greece
Figure 54: Total energy input as a function of size reflecting the energy input for the case
studies evaluated. Source: Compiled reports from partner countries. The figure shows the total energy input as a function of rooms reflecting the energy input from the case studies. One function is done for each partner country studied. The function used for the trend line for Italy, Portugal and Sweden are based on a population of 30 hotels presented in figure below and an actual energy input from a hotel could of course diverse from the trend line given.

10-07-2001 109
ÅF-Energikonsult AB F:\CHOSE\relfinal\Final Report 010710.doc 471275-D-SW-03
0
2000
4000
6000
8000
10000
12000
14000
16000
0 100 200 300 400 500 600 700
Number of rooms
Tota
l enr
gy, M
Wh
Figure 55: Total Energy Input as a function of size, MWh per year for evaluated hotels,
Italy, Portugal and Sweden, 30 hotels. Source: Compiled results from partner countries. Although the above diagrams can serve as a guide in finding the energy consumption of a specific hotel, it is recommended to conduct a site inspection and a short energy audit. How to do this is introduced in Chapter 6, and further descriptions of the short audit form and the checklist for energy saving measures are given in Appendix C, Energy Audit Form and Checklist for Energy Saving Measures in Hotels. If the energy consumption can be divided into electrical- and thermal energy, a comparison with performance criteria can be done of the energy uses per m2 for the electrical and thermal use. These performance criteria are presented in Chapter 4, table 4 and Chapter 7, figure 17 – 19. By using these diagrams, the results from the actual hotel can be compared with results from the performed case studies. 8.3.2 The importance and influence of Energy conservation Energy conservation measures are strongly recommended as a first approach if the consump-tion is larger than indicated in the performance criteria. It is particularly important if poor energy performance is caused by inefficient thermal use. However, energy conservation measures on thermal energy, for domestic hot water and laundry will lead to reduced amount of energy, and this will influence the annual return of the investment. Therefore, the correct sizing of a CHP and CHCP is critically dependent on the site demand for heating. Once in-stalled, any further energy efficiency measures that reduce the demand may undermine the economic benefit gained through CHP and CHCP.

10-07-2001 110
ÅF-Energikonsult AB F:\CHOSE\relfinal\Final Report 010710.doc 471275-D-SW-03
8.3.3 Finding the approximate pay back period of the investment Indication of the pay back period for a CHP installation at different prices of electricity and fuel can be seen in the following figure. The simple payback method has been used, giving an approximate indication of the economic success of an installation. The prices are representing a mix of actual prices of fuel and electricity in the partner countries that have been used in the economical evaluation. Although the information is meant to be general for any country and hotel, the cases are based on the prevailing economic situation, and might differ slightly in other countries depending on the building structures and installed systems.
0
1
2
3
4
5
6
7
8
0
1000
2000
3000
4000
5000
6000
7000
8000
9000
1000
0
Total energy input, MWh per year
Pay
back
, yea
rs
Key of symbols •••• ♦♦♦♦ ∆∆∆∆ ΟΟΟΟ
Fuel for CHP Euro/MWh 27 23,2 15 Fuel for Heat only boilers, Euro/MWh 57
LPG 21,8 Light fuel oil
32,4 31,9 27
Electricity purchase prices, average. Fee for capacity incl. Euro/MWh
101,5 66 59,7 75
Electricity selling, Euro/MWh 80 63,6 38 60
Figure 56: Payback period of CHP as a function of total energy input for the cases
studied. Source: Compiled results from partner countries. Actual fuel prices and electrical tariffs are discussed in chapter 6.3, “Assumptions in the tech-nical and economical calculations.” In the appendixes “CHP Evaluation” the basic energy parameters, fuel prices and the structure of the electrical tariffs are presented in detail for the partner countries.

10-07-2001 111
ÅF-Energikonsult AB F:\CHOSE\relfinal\Final Report 010710.doc 471275-D-SW-03
To be noted is that no trend lines have been developed for the case studies presented as a function of total energy input in Figure 56. The reason is that the economical outcome is highly dependent on the systems installed, the energy demands profiles and the seasonal variations more than the total energy demands. Theoretically, the trend would have been a longer payback period for smaller units. 8.3.4 Finding the approximate size of a installation the CHP and CHCP plant In order to size the plant correctly, it is generally essential to know the demand and demand duration curves for heating, cooling and electricity separately and its seasonal variations. It became clear in the project, that in most of the cases the required information on demand and demand duration was not available. Therefore, a method of energy auditing and evaluation of the CHP and CHCP was constructed and used for the project. From these results the following diagrams was constructed to find an approximate size of an installation of CHP and CHCP. The recommended size is at first dependent on the thermal base load. Secondly, the recom-mended size is dependent on the price relations between price of fuel and price for electricity. In the following diagram an approximate size of a CHP plant in terms of installed electrical power, kWe is shown. These graphs should be seen as an indication of size.
0
50
100
150
200
250
300
350
400
450
0 2000 4000 6000 8000 10000 12000
Total energy input, MWh per year
Rec
omm
ende
d ca
paci
ty, k
We
Key of symbols •••• ♦♦♦♦ ∆∆∆∆ Fuel for CHP Euro/MWh 27 23,2 Fuel for Heat only boilers, Euro/MWh 57
LPG 21,8 Light fuel oil
32,4 31,9
Electricity purchase prices, average. Fee for capacity incl. Euro/MWh
101,5 66 59,7
Electricity selling, Euro/MWh 80 63,6 38
Figure 57 Recommended installed electric power CHP (kWe) as a function of total energy input, MWh per year. Source: Compiled results from partner countries.
••••
♦♦♦♦
∆∆∆∆

10-07-2001 112
ÅF-Energikonsult AB F:\CHOSE\relfinal\Final Report 010710.doc 471275-D-SW-03
The diagram in Figure 57 shows that recommended size on a CHP is dependent of the price of fuel and electricity. Both the price level and relation/ratio between the fuel used as well as purchase and selling price to the grid is essential for the installed capacity. For price relations not so well suited for an installation, a low capacity is recommended. This allows the CHP to run in full load mood most of the time, over 6000 full load hours per year, to generate a posi-tive net present value over the period. For the situation where the purchase electricity prices is 60 Euro/MWh, the recommended size allows a run between 4000 – 5000 full load hours per year, Figure 57 symbol ♦ and ∆, provided the unit would meet the thermal base load. For more convenient energy prices less full load hours are needed. Generally speaking, the thermal output of a CHP-plant at full load in a hotel should amount to about 30-50% of the maximum yearly heat requirement, Figure 57 symbol •••• . Experience shows that the co-generation modules can cover approximately 50-70% of the yearly heat requirement for cer-tain price conditions for fuel and electricity. Typically, hours run at full load are more than 3100 hours a year for a plant showing positive economical results. Boilers would supply the rest for peak load periods. Correct sizing of a CHP for a hotel with suitable energy profiles gives typically pay back pe-riods of less then 7 years. Using a CHCP-plant, the peak demand for chiller air/fluid can be compensated by a compres-sion type of refrigerating machine. For the evaluation of a CHCP plant, an inventory of replacing electrically driven equipment with thermal equipment must be conducted, especially electric driven chillers has to be changed into absorption chillers. Generalisation is not always applicable. However, the use of absorption chillers and the con-cept in combination of CHCP i.e. tri-generation system, are likely not economically viable for most of the price levels/combinations studied in this project. Because of the differences in the operational conditions of the hotels studied, as well as the small sample of evaluated hotels showing economically viable results in this study, the results of the CHCP analysis can not be generalised for the whole sector. The following figure refers to the most favourable results at indicated price levels.

10-07-2001 113
ÅF-Energikonsult AB F:\CHOSE\relfinal\Final Report 010710.doc 471275-D-SW-03
0,0
0,5
1,0
1,5
2,0
2,5
3,0
3,5
4,0
4,5
0 2000 4000 6000 8000 10000 12000 14000 16000
Total energy input, MWh per year
Pay
back
, yea
rs
Key of symbols •••• Fuel for CHP Euro/MWh 27 Fuel for Heat only boilers, Euro/MWh 57 Electricity purchase prices, average. Fee for capacity incl.Euro/MWh 101,5 Electricity selling, Euro/MWh 80
Figure 58: Pay back period of a CHCP as a function of total energy input for the most
favourable cases studied. Source: Compiled results from partner countries. As the results from this study can not be used in a generalised way, no graph has been con-structed to indicate the size of the absorption chiller. The following table is merely indicating the calculated size and the relation to installed cooling capacity for some of the cases studied. Table 28: Example of the ratio between the capacity of an absorption chiller and the
maximum cooling demand. Source: Report CHP Evaluation – Italy. Cooling demand
Absorption chiller
Ratio Absorption chiller kW/ Cooling demand, kW
kW kW % 1129 700 62 240 100 42 267 100 37 486 110 23 774 110 14 191 90 47 75 40 53 181 150 83

10-07-2001 114
ÅF-Energikonsult AB F:\CHOSE\relfinal\Final Report 010710.doc 471275-D-SW-03
9. Environmental aspects When optimised, the CHCP technique shows promising results in energy efficiency since less fuel is needed to produce energy compared to other techniques. It is also possible to use effi-cient exhaustion techniques, which in addition to the reduction in fuel consumption further decreases the emissions from the energy production. The technique does not seem to imply any negative side effects on the hotel activity i.e. the hotel guest will not notice any changes, a possible exception could in some cases be noise, which is discussed below. The EU has several goals and working programmes were great efforts are made for reduction of the energy use within the union. The power plants within the EU constitute for a large por-tion of the emissions. Out of the total emissions, the power plants account for: ! 33% of Carbon dioxide, CO2 ! 60% of Sulphur dioxide, SO2 ! 20% of Nitrogen oxides, NOx ! 40-55% of emissions of particles. Consequently, power production is an area where introducing new techniques on a large scale could have a great positive impact on the environment. Installing CHCP units have the techni-cal potential of being one of these techniques. However, the case study shows that in only one of the partner countries in the project, Italy, there is an economically viable situation for CHCP investments. In the rest of the countries, the combinations of fuel costs, taxes and electricity prices do not favour CHCP investments. If the EU wants to pursue the possibilities of using CHCP as an energy saving device, incen-tives for investments in the technique must be created. As the situation is today, very few if any, are willing to take the risk. 9.1 Fuel savings The hotels purchase electricity for lighting, ventilation and other uses as well as additional electricity or fuel to provide domestic hot water, heating and cooling. Each of these products has primary energy intensity, the amount of fossil fuels converted to these products. CHP and CHCP plant achieves much greater conversion efficiencies than a conventional elec-tric power plant and, as the plant is situated on-site, it gives minimal losses from transmission and distribution. For the calculation of the savings using CHP and CHCP plant in hotels the following fundamental considerations of a national electrical system has been applied: • Conventional generation of electricity in large central power stations is normally only 30 –
40% energy efficient; even if more recent combined cycle generation can improve this to

10-07-2001 115
ÅF-Energikonsult AB F:\CHOSE\relfinal\Final Report 010710.doc 471275-D-SW-03
55% excluding losses for the transmission and distribution electricity. The average ther-mal efficiency of the power stations in Europe remains however well below 40%. Conventional electricity-only stations release large amount of energy as waste heat.
• About 8% of the electricity produced (i.e. a further 3% of energy input) is lost during
transmission and distribution to the end-user - he hotel. Looking at the efficiencies of co-generation plants, the efficiency gains of hotel’s energetic system using CHP or CHCP plants may be significant, but will vary depending upon the per-centage of yearly energy requirement covered by the co-generation, the technology selected and the fuel source used and displaced by CHP systems. As indicated in the results presented in Chapter 8.1, the installation of the proposed CHP mini-package is resulting in primary energy savings of between 5,5 to 20%. Examples from Italy offers energy savings of between 10 – 25% compared with the electricity and heat from conventional power stations and boilers. As the above results show, the primary energy savings can be significant, which is also re-flected in the pollutant emissions, especially if natural gas is used as a fuel. The analysis con-firms that CHP or CHCP, if economically viable, is one of the very few technologies, which can offer a significant short or medium term contribution to energy efficiency issue in the European Union and can make a positive contribution to environmental policies of the EU. 9.2 The emissions from fuel combustion The emissions of fuel combustion include NO, NO2, CO2, CO, CnHn (unburned hydrocar-bons, UHC), SO2, SO3, dust, fly ash, heavy metals, chlorides, etc. The most important product of the combustion process is carbon dioxide CO2, well known for its contribution to the greenhouse effect and climatic change. An example from Italy shows that a typical hotel release annually about 10 tonnes of CO2 per bedroom. The EU power plants average production of CO2 for all sources is 684 g CO2/kWhe. The CO2 average for heat-only boiler production depends on the fuel burned. This can be coal (410 g CO2/kWh), heavy fuel oil (333 g) or gas (225 g). Carbon monoxide, unburned hydro-carbons and particles are rarely a problem unless air/fuel ratios and combustion conditions are inadequately controlled. Emissions of sulphur dioxide vary directly with the sulphur content of the fuel. In the case of natural gas the sulphur content is negligible, and condensing heat exchangers can be used to maximise heat recovery wherever appropriate. Diesel fuel and bio gas, however, do contain sulphur and, where the sulphur content exceeds the limit set by the manufacturer, some form of fuel cleaning is necessary prior to use. Furthermore, the cost of installing a stainless steel heat exchanger and exhaust flue to counter the corrosive nature of the condensate usually pre-cludes the use of condensing heat recovery systems with these fuels.

10-07-2001 116
ÅF-Energikonsult AB F:\CHOSE\relfinal\Final Report 010710.doc 471275-D-SW-03
International agreements The Protocol on 10 December 1997 in Kyoto tackles emissions of six greenhouse gases:
• Carbon dioxide (CO2)
• Methane (CH4)
• Nitrous oxide (N2O)
• Hydrofluorocarbons (HFC)
• Perfluorocarbons (PFC)
• Sulphur hexafluoride (SF6) The parties undertake to reduce greenhouse gas emissions by at least 5% below 1990 levels during the period 2008 to 2012. The EU Member States collectively must reduce their green-house gas emissions with 8% between 2008 and 2012. When optimised the CHCP technique is an environmentally friendly method of energy pro-duction reducing fuel need. This increased fuel efficiency gives the technique a potentially useful role in helping to combat global warming, through reduction of carbon dioxide (CO2) emissions, the principal man-made greenhouse gas. Emissions from CHP and CHCP Depending on which fuel that is being displaced by CHP and on the different technical con-figurations, the reduction in CO2 emissions CHP varies. Virtually all new CHP systems are based on natural gas and give CO2 emissions in the range of 200-300 g CO2/ total kWh pro-duced. Gas-fired co-generation schemes eliminate SO2 and solid particulate emissions. However in one area, the CHP show worse result than other techniques. That area is the NOx gases – which are the only toxic emissions contained in the exhaust. The NOx gases (NO+NO2) generates nitric acid in the atmosphere and this, together with sulphuric acid is one of the factors responsible for acid rain. When measured on a performance basis (i.e., in-cluding thermal energy in the denominator), the NOx emissions of a modern engine - 320 g/MWh(t+e) - are fairly low, but still higher than the other technologies. These emissions, along with the greater noise and size of the engines, limit their applications. There are however ways to reduce the emissions. Many of the CHP engines are stoichiometric engines with a three-way catalytic converter to remove NOx, carbon monoxide and unburned hydrocarbons. The NOx content of exhaust gases can also be reduced using selective catalytic reduction techniques based on ammonia or urea.
In micro turbines the oxygen-rich exhaust can be used directly without any "cleaning" thanks to the very low levels of NOx (less than 15 parts per million), and CO.

10-07-2001 117
ÅF-Energikonsult AB F:\CHOSE\relfinal\Final Report 010710.doc 471275-D-SW-03
Table 29: Combustion emission referred to the performance basis. Source: Project results, Italy. Emissions g/kWh
CHP Micro
turbine
CHP L.T. Engine
CHCP H.T. engine
Separate heat pro-duction
Conven-tional con-
densing power plant
CO2 250 224 272 247 684 NOx 0,18 0,32 0,32 0,32 0,63 SO2 Approx.0 Approx.0 Approx.0 600 1260
Solid parti-cles
Approx.0
Approx.0
Approx.0
87
180
The CO2 saving from 1 MWh of CHP engine electricity production vary from 350 kg to 520 kg. A typical hotel for Italy releases annually 95-162 kg of CO2 per square meter of floor area, which is equivalent to about 10 tonnes per bedroom. Estimates show that in comparison to separate production of heat and electricity, the CO2 reduction with CHP and CHCP plants varies from 31% to 20%. 9.3 Refrigerants 9.3.1 Environmental impact Over the past 60 years, the growing use of air conditioning has played a role in the increased emissions of greenhouse gases and ozone-depleting chemicals, such as CFCs. Depletion of the earth's protective ozone layer occurs when industrial chemicals, mainly chlorine and bro-mine, reach the stratosphere. Global warming, a separate but related phenomena, results from an increase in greenhouse gases in the earth's environment. Carbon dioxide is the main culprit in global warming, but chlorofluorocarbons (CFCs), methane, ozone, and nitrous oxide also contributes to the problem. CFCs have been widely used as refrigerants since the 1930s, and for many years, they were considered inert gases. However, when CFCs are discharged into the atmosphere and come in contact with solar ultra-violet rays, they disintegrate releasing chlorine gas that damages the earth's protective ozone layer. It was not until 1974 that scien-tists first demonstrated the potential for significant ozone depletion based on the projected use of CFCs. International agreements The Montreal Protocol, an international agreement intended to reduce the production of chemicals harmful to the ozone layer, was adopted in 1987. This agreement and subsequent amendments, included a timetable setting dates by which participating nations would stop the manufacture of air conditioning and refrigeration equipment that uses harmful refrigerants as well as discontinuing production of the refrigerants themselves. The first target date was January 1, 1996, when the production of CFC-11 and CFC-12 was banned along with the

10-07-2001 118
ÅF-Energikonsult AB F:\CHOSE\relfinal\Final Report 010710.doc 471275-D-SW-03
manufacture of equipment using these products. Initially these refrigerants were replaced with more benign HCFCs (hydrochlorofluorocarbon) products, but these too will be phased out in favour of chlorine-free refrigerants, such as HFCs (hydrofluorocarbons). Despite a phase out of production of CFC refrigerants completed in 1995, many centrifugal and screw compressors still use CFC refrigerants. A recent survey showed that approximately 70% of the chillers that used CFCs in the early 1990s remain dependent on CFCs. The HCFC known as R-22 has been the refrigerant of choice for residential cooling systems for more than 40 years. Currently all major manufacturers use R-22 in more than 95% of the systems they build. And, even though HCFCs are considerably safer for the environment (at least 95% less damaging to the ozone layer than CFCs), they still contain chlorine, which is an ozone-destroying chemical. From the year 2010, The Heating, Ventilation and Air Conditioning (HVAC) manufacturers can no longer produce new air conditioners and heat pumps using R-22. From 2010 refriger-ant manufacturers will no longer produce R-22 to service existing air conditioners and heat pumps. R-22 is gradually phased out of use over the next two decades and R-410A will be phased in. R-410A is an HFC (hydrofluorocarbon) and is considered to be the most likely replacement when R-22 is no longer in use in residential systems. However, the transition to R-410A re-quires that the heat pump and air conditioning systems are redesigned. R-410A is a refrigerant with operating pressures almost 50% higher than R-22. Because of this, a redesign of the compressor as well as other components is necessary. Additionally, since R-410A demands special synthetic lubricants for the compressor, there are compatibility issues with the lubri-cants, cleaners and other fluids used in the manufacturing process. All of these issues must be carefully evaluated. Environmental benefits with CHCP The demand of innovative chiller plant designs that eliminate CFC’s can improve the diffu-sion of absorption chillers. In a growing number of applications with waste heat or abundant low pressure steam, absorption chillers offer an ideal means of substitution of one technol-ogy by another which is more respectful to the environment, without a significantly installa-tion cost penalty. Environmentally friendly, the working fluid of lithium bromide is safe, odourless and non-toxic, the gas absorption-type chiller is an air-conditioning system that uses water as the re-frigerant. CFCs, HCFCs, or HFCs – all major contributors to global warming and ozone de-pletion - are not used in this refrigerating process. If CHP heat is available in a new building without existing chillers, it will pay, on a life-cycle basis, to invest in absorption chillers.

10-07-2001 119
ÅF-Energikonsult AB F:\CHOSE\relfinal\Final Report 010710.doc 471275-D-SW-03
In an existing building, however, early retirement of an existing electric chiller may not be cost effective. However, the lack of CFCs for electric air-conditioning is likely to lead to an improved relative economics for absorption chillers. 9.4 Noise As discussed earlier, the CHCP technique has no impact on the experience of a hotel visit, with the possible exception of noise. Below is a description of the reason for increased noise, as well as ways to reduce or eliminate it. As the CHP plant is generally situated on-site, it brings any adverse environmental effects, including noise, much closer to the point of use. Noise is caused by radiating (vibrating) surfaces, from high velocity air or gas creating shear-ing forces that causes turbulence and hence noise. In relation to the emitted sound energy and of the surrounding environment, the emitted sound pressure level generally results in not be-ing acceptable and has to be reduced with suitable silencers. Table 30 present a list of the sources from which the noise in a CHCP plant originates. Table 30: Noise sources in CHCP plants. Source: Project results, Italy. Source of noise Reference sound pressure level,
dBa at 1 meter Engine 98
Engine exhaust 110
Oil and after cool radiator 80
Micro turbine 70
Boilers
Electrical chillers 85
Cooling towers 80
Systems for noise reduction A complete CHCP noise control system must be designed to: ! Control fan noise • Provide "acoustic privacy" in occupied areas • Shield neighbourhood from acoustic annoyance • Shield workmen and tenants from machinery noise • Control noise transmission from building machine rooms • Furnish at the engine ventilation and noise control.

10-07-2001 120
ÅF-Energikonsult AB F:\CHOSE\relfinal\Final Report 010710.doc 471275-D-SW-03
The market offers a complete range of products, which are effective in combating noise-induced hearing loss and therefore ensure compliance with current health and safety. The device most useful for CHCP plants, are silencers for fans, power plant intake/exhaust ducts, chimneys etc. Silencers are used in suppressing the noise generated from: • the intake and exhaust of any internal combustion engine and gas turbine • the radiator of internal combustion engine • the electrical chiller. Silencers may include dissipative and/or reactive elements to provide the most cost-effective means of satisfying applicable noise criteria. The intake and exhaust silencers of any internal combustion engine, includes intake filters, filter silencers, and a wide range of exhaust silenc-ers for naturally aspirated and turbo charged engines. For the majority of engines and operating conditions, multi-chamber exhaust silencers, gener-ally made up of annular acoustical elements, provide maximum noise attenuation within ac-ceptable back pressure limits. Generally, the silencer is located near the source, but in some installation and after some modification of the existing plant, it can be convenient to install the silencer inside the chimney. Some engines require very low exhaust system back pressures for maximum engine perform-ance. Several turbo charged engines and some naturally aspirated engines fall into this cate-gory. For these engines, straight-through, reactive silencers are available to provide adequate silencing while imposing negligible restriction on the flow of exhaust gas. The exhaust si-lencer of a gas turbine can pose special design and manufacturing challenges, since a gas tur-bine's exhaust noise is broadband, but has significant low-frequency contributions. The si-lencer design can often be strictly absorptive, but a combination absorptive/reactive design is sometimes necessary. Exhaust temperatures create additional acoustical and mechanical de-sign concerns. Special provisions for thermal growth are essential, and material selection is critical. Owing to the inlet noise of a gas turbine contains mostly high-frequency noise, an absorptive silencer in series with the inlet filtration system is usually required to meet noise attenuation requirements. Different sizes of silencers with acoustic baffles can be added both on the inlet and outlet of air. Acoustic louvers for cooling towers and many other types of buildings housing mechani-cal services plant. The louver is used to permit the flow of air while shielding the environment from noise. Acoustic louvers reduce noise transmission in or out of building-wall openings, where there is a need to provide ventilation opening with noise attenuation. Applications in-clude power generation equipment, fresh-air and return intakes, noise barriers, air condition-ing installations, cooling towers, and refrigeration plant.

10-07-2001 121
ÅF-Energikonsult AB F:\CHOSE\relfinal\Final Report 010710.doc 471275-D-SW-03
Acoustic barriers and screens, often installed along sensitive boundaries at power plant sites to combat low frequency noise disturbance, can provide an effective shield from machinery noise without the necessity to fully enclose the machine itself. Acoustic enclosures, doors, windows, walls and roof, used in all types of industrial and power plants buildings, house transformers, boilers and other types of noise-making plant and ma-chinery, often contain noise emissions from production areas and prevent noise pollution problems in nearby communities. Sound absorptive panels, can be fixed to walls or suspended from ceilings as baffles to pre-vent the build-up of noise and reverberation in buildings (in turbine halls, for example). The baffles are sound absorbing units that hang from the ceiling and absorb and detract sound waves, effectively reducing echo and reverberation noise that would ordinarily be reflected into the working area. The economical installation of the baffle system reduces high intensity noise to safe, comfortable levels. Acoustic treatment of engine involves also channelling airflow over Spark-Ignited engines for cooling, then drawing up the air into an acoustic exhaust plenum. The plenum must be de-signed to absorb noise from all interior noise sources.

10-07-2001 122
ÅF-Energikonsult AB F:\CHOSE\relfinal\Final Report 010710.doc 471275-D-SW-03
10 Dissemination of results One essential task of the CHOSE project, was the dissemination of the result to stakeholders. People from different categories in society could benefit from learning of the results in the project, and cross-sector discussions could stimulate the progress. The information was there-fore disseminated in a variety of ways to reach many people. The dissemination activities have included Seminars in each country, distribution of Newsletters and production of an Internet Web-site. 10.1 Seminars in each country In order to stimulate discussions and cross sector experiences, the information was dissemi-nated through seminars in each country. The seminars were also held in order to encourage the creation of networks to support work in the field of energy conservation. Hotel managers as well as other real estate holders were invited. In the seminar, the benefits and options for CHCP-generation were explained, and collected data on energy use was presented. Agenda items in the countries were generally: • co-generation options for hotels, • how to decide which co-generation system to chose based on hotel characteristics, • case studies, • financial support for co-generation investments and • other energy saving opportunities. In order to attract possibly interested participants, advertisements in local newspapers, maga-zines of special interest groups etc. were done. The majority of the seminars were full day seminars which encouraged discussions and networking during lunch, dinner and other breaks. See the table below for participants and main target groups of the seminars.

10-07-2001 123
ÅF-Energikonsult AB F:\CHOSE\relfinal\Final Report 010710.doc 471275-D-SW-03
Table 31: Number of participants and main target groups of participants at CHOSE
seminars in partner countries. Source: compiled reports from partner countries. Country Number of participants Main target group
Greece 31 Hotels, Hotels associations, energy consulting companies, institutions and companies of public sector related to energy
Italy 20 Hotels and hotel associates
Portugal
31 56
1. Energy technicians 2. Hotels, hotels associations,
tourism schools Sweden 53 Managers in energy, environ-
mental or operation working within building and real estate companies
10.2 Distribution of Newsletters Newsletters in the participating countries have been written and distributed to stake holders. Newsletters have so far included invitations and information of the seminar, intermediate re-sults of the projects etc. 10.3 Production of an Internet Web-site A web-site was made which was replicated in the participating countries and contains the pro-ject results as well as useful links to energy related issues. An on-line decision-aid function can also be added for help to choose the best co-generation option for hotels with particular characteristics. Also possible, is to support a permanent chat-line or mailing list for the ex-change of information between energy managers and hotel managers in different countries, regarding co-generation and other energy issues.

10-07-2001 124
ÅF-Energikonsult AB F:\CHOSE\relfinal\Final Report 010710.doc 471275-D-SW-03
Figure 59: The web site developed by the project.

10-07-2001 125
ÅF-Energikonsult AB F:\CHOSE\relfinal\Final Report 010710.doc 471275-D-SW-03
10.4 General conclusions The seminars had slightly different focus. The following are some issues emphasised in many of the seminars: • Control of energy use in buildings and methods to follow-up energy consumption – the
well worth investment in appropriate control systems. • Energy-savings measures should be undertaken to improve energy performance of the
hotels before they proceed to the evaluation of a CHP installation. • The importance of choosing the optimal size of CHCP-plant in the relation to actual en-
ergy demands of the hotel. • IT –tools for CHCP evaluations. • The national power generation systems today and coming changes. • The possibilities of receiving funds for energy efficiency projects. Below is a brief description of the respective seminar in each partner country. The specific agendas, participants and more detailed summaries are found in Appendix J, Dissemination of results – Seminar. 10.5 The seminar in Greece In total 31 participants coming from all parts of Greece and representing, the university, the public, gas companies, consulting firms and manufacturers attended the seminar. The Greek seminar focused on the following issues: • Results of the energy audits – the importance of improving the energy performance of the
hotels before they proceed to the evaluation of CHP. • Co-generation and absorption cooling in hotels – the importance of choosing the optimum
size of CHCP was stressed. Also guidelines on CHP installations in combination with ab-sorption chillers was presented along with a technical and economical evaluation of two hotel cases.
• The major parameters affecting the financial viability of a co-generation investment. • Feasibility study comparing reciprocating engines with and without absorption chillers. 10.6 The seminar in Italy Invited were participants all over Italy with an emphasise on decision-makers in the Hotel-sector. At the seminar, there were 20 people taking part in discussions focusing on: • The role of the hotel sector in the Italian and European economy • Energy savings in hotels • Energy savings of primary sources • The result of the research in the project.

10-07-2001 126
ÅF-Energikonsult AB F:\CHOSE\relfinal\Final Report 010710.doc 471275-D-SW-03
10.7 The seminar in Portugal In Portugal the dissemination occurred in two phases. The first seminar attracted 31 partici-pants and presented the CHOSE project and its preliminary results. The target group was en-ergy technicians, and all members of the Portuguese Board of Engineers as well as students and teachers of the Electrical Engineering Department of the Coimbra University as well as Polytechnic Institutes of Coimbra, Öeiria and Viseau. The seminar focused on presenting the technology involved in the CHOSE project and the principle behind “trigeneration.” The main purpose of the second seminar was to reinforce the dissemination of known savings measures on the electrical and thermal systems used in the hotels. The target group was ho-tels, hotels associations and tourism- and engineering schools. The seminar attracted 56 par-ticipants from the target groups as well as representatives from equipment manufacturers, research institutes, energy agencies and press. The Portuguese seminar focused on: • Opportunities for rational use of electrical energy and thermal energy in hotels • Some considerations about electricity sector and the independent Power Producers • Example of a CHCP plant in a service building • The conclusions of the cHose-project • Rational use of energy in the Service sector – including possible ways for getting funds
for energy efficiency projects. 10.8 The seminar in Sweden The Swedish seminar was mainly directed towards managers responsible for energy and envi-ronmental issues or operation within building and real estate companies. Also representatives from the energy and consultant sector were present. In total 51 people participated. The seminar gave a short introduction to the technology and possibilities to produce electric-ity, heat and cooling locally. Experiences from the CHOSE project regarding energy use were shared, both from a national and international perspective. Most of the seminar was focused on control of energy use in buildings, computerised solutions and IT-applications in buildings and methods to follow-up energy consumption. The seminar focused on the following issues. Discussions were actively encouraged: • Energy use in hotels – data on energy use obtained from measurements during a year • Technological and economical possibilities for local production of electricity, heat and
cooling and future areas of use. • Lower need of energy by co-operation between building and installation processes. • The ”POSITIV-project” – computerised control for buildings. • Energy use follow-up by using ”Degree-Days,” ”Energy-Index” and weather forecast. • Follow-up of energy use using ”Energy Signatures.” • Research and development regarding energy efficiency – Best practice purchase of energy
consuming equipment.

10-07-2001 127
ÅF-Energikonsult AB F:\CHOSE\relfinal\Final Report 010710.doc 471275-D-SW-03
11 Concluding remarks CHP contributes to a more efficient use of energy, primary fuel savings and reduced emis-sions. At the same time CHP convert part of the fuel used into high-valued electricity. Co-generation plants being located near the end-user reduces the power and energy demand on the utility and also reduces the transmissions losses. Absorption chillers can provide an ideal application for waste heat during summer time. Since the hotel industry in the southern Europe has its peak power demand during the summertime, a combination of CHP with an absorption chiller offers the following advantages: • Reduces the electrical power demand for the Electricity utility, for the Mediterranean
countries in summer and for the Nordic countries in wintertime. • Reduction of electrical power demand, as the main power consumer of the hotel (chiller)
becomes heat powered. • Electricity generation cost not more than the cost of purchasing power from the Electricity
Utility. • Savings from the reduction of maximum demand charges. • Free waste heat to provide hot water and provide for space heating in wintertime and hot
water and space cooling (through the absorption chiller) in the summer. In case of an installation in a new building the following advantages will also be applicable: • Less power (kVAs) would have to be purchased from the Electricity Utility. • Smaller and more compact electrical installations (smaller main panel, smaller power fac-
tor correction unit, less wiring, etc.). The analysis has showed that the concept of CHCP not is likely to be economically viable, for the present fuel and electricity prices and the required capital costs. Italy is however an exception, where pay back periods of between 2,5 to 4 years have been calculated. Also the actual investment cost for absorption chillers and the maintenance costs of cooling towers contributes to an increased pay back period for CHCP installations. The results in Italy de-pend on low fuel price for co-generation use, compared to fuel prices for heat only produc-tion. Another important factor for the profitability is the high electrical fees. The CHP, in its basic form, consists of a mini CHP package with a set of heat recovery sys-tem to provide domestic hot water. This CHP package is suitable for the majority of the exam-ined hotels. The installed units will be small, covering only a small part of the thermal and electric load, and will fit easily into any existing thermal plant in hotels. Generally CHP is likely to be economical viable based on energy prices similar as those in Cyprus, Greece and Italy, i.e. relatively high prices for electricity and low prices for fuels for co-generation. The unit would meet the thermal base load (domestic hot water load) and thus run over 4 000 full load hours per year. Pay back periods from 4,5 to 6,0 years for Cyprus and Greece and for Italy between 2,5 and 4,4 years were obtained under the specified conditions for all the simulated energy-demand behaviours of the considered hotels.

10-07-2001 128
ÅF-Energikonsult AB F:\CHOSE\relfinal\Final Report 010710.doc 471275-D-SW-03
The actual situation today in many European countries is that the fuel and electricity compa-nies have diversified their products and consequently different prices occur. The economical results calculated for Sweden and Portugal indicates no profitability in for the present price combination. Also, the absence of an incentive in the form of price strategies for co-generation will not make any CHP investments possible in these countries. An estimated price difference of 12 Euro/MWh between gas for boiler and gas for CHP, gives pay back periods between 4,4 – 7 years for the case studied in Portugal. The low electricity price in Sweden will make all investments for small electric generation units: co-generation as well as hydro-power units, not economically feasible. Even with an incentive in fuel prices, there is a need for investment support to achieve a more attractive pay back time, as to make hotel owners interested. The use of absorption chillers does not seem to be attractive for the time being, unless COP and costs evolve in a favourable way. The installation of the proposed CHP mini-packages is resulting in primary energy savings of around 5,5% to 20%. The magnitude of the savings was calculated taking into account the efficiency of electricity generation from the conventional units of Public Power Corporation assumed to 37%. As the above results show, the primary energy savings can be significant, which is also re-flected in the pollutant emissions, especially if burning natural gas. The analysis confirms that CHP or CHCP, if economically viable, is one of the very few technologies, which can offer a significant short or medium term contribution to energy efficiency issue in the European Un-ion and can make a positive contribution to environmental policies of the EU. The use of the absorption chiller is also an ideal means of substitution of the technology by another which is more respectful to the environment since CFC, HCFC or HFC – all major contributors to global warming and ozone depletion – are not used in this refrigeration process. The estimations of many parameters that are used in the feasibility study and CHP evaluation have got an uncertainty either because they are forecasts or because they are continuously changing. Still, it has to be noted that the financial analysis in combination with the sensitivity analysis bring out not only the conditions that make the investment financially acceptable to the final user, but also what National Economy benefits that an investment like this can lead to. The analysis makes it possible to defined quality and quantity motives (i.e. the extent of grants or subsidies for specific systems). Hopefully, the project can also result in the imple-mentation of a new price policy in the sector of self-production/co-generation of energy.