final report - serdp-estcp.org reporting burden for this collection of information is estimated to...
TRANSCRIPT

FINAL REPORT
Extending The Applicability of Compound-Specific Isotope Analysis To Low Concentrations Of 1,4-Dioxane
SERDP Project ER-2535
FEBRUARY 2017
Peter Bennett Haley & Aldrich, Inc.
Distribution Statement A

Page Intentionally Left Blank

This report was prepared under contract to the Department of Defense Strategic Environmental Research and Development Program (SERDP). The publication of this report does not indicate endorsement by the Department of Defense, nor should the contents be construed as reflecting the official policy or position of the Department of Defense. Reference herein to any specific commercial product, process, or service by trade name, trademark, manufacturer, or otherwise, does not necessarily constitute or imply its endorsement, recommendation, or favoring by the Department of Defense.

Page Intentionally Left Blank

REPORT DOCUMENTATION PAGE Form Approved OMB No. 0704-0188
Public reporting burden for this collection of information is estimated to average 1 hour per response, including the time for reviewing instructions, searching existing data sources, gathering and maintaining the data needed, and completing and reviewing this collection of information. Send comments regarding this burden estimate or any other aspect of this collection of information, including suggestions for reducing this burden to Department of Defense, Washington Headquarters Services, Directorate for Information Operations and Reports (0704-0188), 1215 Jefferson Davis Highway, Suite 1204, Arlington, VA 22202-4302. Respondents should be aware that notwithstanding any other provision of law, no person shall be subject to any penalty for failing to comply with a collection of information if it does not display a currently valid OMB control number. PLEASE DO NOT RETURN YOUR FORM TO THE ABOVE ADDRESS. 1. REPORT DATE (DD-MM-YYYY)26-01-2018
2. REPORT TYPESERDP Final Report Report
3. DATES COVERED (From - To)Dec 2014 – Jan 2018
4. TITLE AND SUBTITLEFinal Report
5a. CONTRACT NUMBER W912HQ-14-P-0143
Extending the Applicability of Compound-Specific Isotope 5b. GRANT NUMBER N/A
Analysis to Low Concentrations of 1,4-Dioxane 5c. PROGRAM ELEMENT NUMBER N/A
6. AUTHOR(S)Bennett, Peter
5d. PROJECT NUMBER ER-2535
Aravena, Ramon 5e. TASK NUMBER N/A 5f. WORK UNIT NUMBERN/A 7. PERFORMING ORGANIZATION NAME(S) AND ADDRESS(ES)
8. PERFORMING ORGANIZATION REPORTNUMBER
Haley & Aldrich, Inc. 1956 Webster Street Suite 300 Oakland, California 94612
41703-004
9. SPONSORING / MONITORING AGENCY NAME(S) AND ADDRESS(ES) 10. SPONSOR/MONITOR’S ACRONYM(S)Strategic Environmental Research and Development Program SERDP4800 Mark Center Drive, Suite 17D08Alexandria, VA 22350-3605 11. SPONSOR/MONITOR’S REPORT
NUMBER(S)
12. DISTRIBUTION / AVAILABILITY STATEMENTApproved for public release; distribution is unlimited
13. SUPPLEMENTARY NOTESN/A
14. ABSTRACTThe objective of this work was to develop a reliable method to perform compound-specific isotope analysis (CSIA) on low aqueous concentrations (1 µg/L) of 1,4-dioxane in groundwater and then apply it to investigate 1,4-dioxane biodegradation. It was determined that 0.5 grams of a synthetic carbonaceous sorbent, when added to a 40 mL vial containing aqueous 1,4-dioxane in the 10 to 100 µg/L range, could adsorb more than 99 percent of the 1,4-dioxane from solution. The 1,4-dioxane was successfully recovered from the dried solid sorbent by thermal desorption into a gas chromatograph with isotope ratio mass spectrometry. The method was successfully applied to samples at concentrations in the 1 µg/L range. It is anticipated that the CSIA method will be applied to demonstrate the biodegradation of 1,4-dioxane in the 1-100 µg/L range. The method is likely to be adaptable to other contaminants and media (e.g.,air and soil), thereby extending the applicability of CSIA to possibly document degradationprocesses that may be occurring at much lower concentrations in the environment.
15. SUBJECT TERMS1,4-dioxane, compound-specific isotope analysis, CSIA, Ambersorb 560, thermal desorption, GC-IRMS
16. SECURITY CLASSIFICATION OF: 17. LIMITATIONOF ABSTRACT
18. NUMBEROF PAGES
19a. NAME OF RESPONSIBLE PERSONPeter Bennett
a. REPORTUNCLASS
b. ABSTRACTUNCLASS
c. THIS PAGEUNCLASS
UNCLASS 53
19b. TELEPHONE NUMBER (include area code)(510) 879-4547 Standard Form 298 (Rev. 8-98)
Prescribed by ANSI Std. Z39.18
ER-2535

Page Intentionally Left Blank

i
LIST OF TABLES iii
LIST OF FIGURES iii
LIST OF ACRONYMS iv
ABSTRACT vi
ACKNOWLEDGEMENTS viii
1. OBJECTIVE 1
2. BACKGROUND 1
2.1 INTRODUCTION 1 2.1.1 Degradation of 1,4-Dioxane 2 2.1.2 Compound Specific Isotope Analysis for Documenting Degradation 2
2.2 TECHNICAL SCOPE OF PROJECT ER-2535 3 2.2.1 Task 1 Method Development 3 2.2.2 Task 2 Assessment of Isotope Fractionation 3 2.2.3 Task 3 CSIA of 1,4-Dioxane and CVOCs during Cometabolic
Degradation 4 2.2.4 Task 4 CSIA of 1,4-Dioxane and CVOCs at Field Sites 4 2.2.5 Task 5 Project Management and Reporting 4
3. MATERIALS AND METHODS 5
3.1 TASK 1 – METHOD DEVELOPMENT 6 3.1.1 Tests 1-4: Micro-Column Sorption with Acetone Elution 7 3.1.2 Test 5: Column Sorption with Thermal Recovery 7 3.1.3 Tests 6-14: Column Sorption with Either Solvent Elution or Thermal
Desorption 8 3.1.4 Equilibrium Sorption of 1,4-Dioxane 10
3.2 TASK 2 – ASSESSMENT OF ISOTOPE FRACTIONATION 11 3.2.1 Determination of Carbon Isotope Ratios of 1,4-Dioxane by Direct
Injection – GC-IRMS 12 3.2.2 Determination of Carbon Isotope Ratios of 1,4-Dioxane by Thermal
Desorption – GC-IRMS 12 3.2.3 Determination of Hydrogen Isotope Ratios of 1,4-Dioxane by Thermal
Desorption – GC-IRMS 12 3.3 TASK 3 – CSIA OF 1,4-DIOXANE DURING COMETABOLIC
DEGRADATION 12 3.3.1 Microcosm Studies for Determining Enrichment Factors 13 3.3.2 Field Study of Aerobic Cometabolic Degradation 14
3.4 TASK 4 – CSIA OF 1,4-DIOXANE AT FIELD SITES 15

ii
3.4.1 Vandenberg Air Force Base Site 24 15 3.4.2 Cape Canaveral Air Force Station Sites 16
4. RESULTS AND DISCUSSION 17
4.1 ANALYSIS OF STABLE CARBON AND HYDROGEN ISOTOPE RATIOS OF 1,4-DIOXANE AT LOW CONCENTRATIONS IN WATER SAMPLES 17 4.1.1 Stable Carbon Isotope Analysis of 1,4-Dioxane 18 4.1.2 Stable Hydrogen Isotope Analysis of 1,4-Dioxane 19
4.2 MICROCOSM STUDIES ON ENRICHMENT OF CARBON AND HYDROGEN ISOTOPE RATIOS DURING AEROBIC COMETABOLIC DEGRADATION OF 1,4-DIOXANE 21
4.3 ASSESSMENT OF CARBON AND HYDROGEN ISOTOPE RATIOS DURING AEROBIC COMETABOLIC DEGRADATION OF 1,4-DIOXANE AT THE MCCLELLAN AIR FORCE BASE PILOT TEST 24 4.3.1 Baseline Sampling Event: 11 September 2015 24 4.3.2 First Biostimulation Phase: 7 and 11 December 2015 26 4.3.3 Propane Inhibition Phase: 12 February 2016 27 4.3.4 Second Biostimulation Phase: 2 June 2016 27
4.4 PRELIMINARY ASSESSMENT OF THE ISOTOPIC COMPOSITION OF 1,4-DIOXANE AT FIELD SITES 29 4.4.1 McClellan Air Force Base 29 4.4.2 Vandenberg Air Force Base Site 24 29 4.4.3 Cape Canaveral Air Force Station 30
5. CONCLUSIONS AND IMPLICATIONS FOR FUTURE RESEARCH 32
5.1 TECHNOLOGY TRANSFER 32 5.2 NEXT STEPS AND OBJECTIVES FOR FOLLOW-ON FUTURE RESEARCH
33 5.2.1 Next Steps for Further Development of the Analytical Method 33 5.2.2 Next Steps for Further Evaluation of Isotopic Enrichment in 1,4-Dioxane
33
LITERATURE CITED 34

iii
LIST OF TABLES Table No. Title 1 Tests 1-4 2 Tests 6-14 and Groundwater Samples 3 Conditions used for Equilibrium Sorption Tests at 1,039 mg/L 4 Conditions used for Equilibrium Sorption Tests at 1-10 µg/L 5 Stable Carbon Isotope Ratios for 1,4-Dioxane Aqueous Solutions 6 Stable Hydrogen Isotope Ratios for 1,4-Dioxane Aqueous Solutions 7 1,4-Dioxane Concentrations and Stable Isotope Ratios for Microcosm
Study 8 1,4-Dioxane Concentrations and Stable Isotope Ratios for Pilot Test at
McClellan AFB 9 CSIA Results for Cape Canaveral Air Force Station 10 CSIA Results for Vandenberg Air Force Base
LIST OF FIGURES
Figure No. Title 1 Photograph of Ambersorb 560 2 Sorption Isotherm for A560 in Equilibrium with Aqueous 1,4-Dioxane 3 Schematic of Aerobic Cometabolic Pilot Test at McClellan AFB 4 Summary of Stable Carbon Isotope Ratios for 1,4-Dioxane Aqueous
Solutions 5 Carbon and Hydrogen Enrichment Trends for Microcosm Samples 6 Dual Isotope Plot of 1,4-Dioxane during Degradation in Microcosm 7 Dual Isotope Plot of 1,4-Dioxane during Degradation in Pilot Test
APPENDIX
APPENDIX A: Method Summary

iv
LIST OF ACRONYMS
12C most abundant isotope of carbon with atomic mass of 12 13C less abundant isotope of carbon with atomic mass of 13 13C/12C Stable carbon isotope ratio 1,1-DCE 1,1-dichloroethene 1,2-DCA 1,2-dichloroethane 1,4-D 1,4-Dioxane A560 AmbersorbTM 560 ACB aerobic cometabolic biodegradation AFB Air Force Base bgs below ground surface CCAFS Cape Canaveral Air Force Station cis-1,3-DCE cis-1,2-dichloroethene CSIA Compound-Specific Isotope Analysis CVOC Chlorinated Volatile Organic Compound D deuterium, a less abundant isotope of hydrogen with atomic mass of 2 δ13C stable carbon isotope ratio as permil (‰) difference from internationally accepted
standard D/H Stable hydrogen isotope ratio δD stable hydrogen isotope ratio as permil (‰) difference from internationally
accepted standard DI direct injection DoD Department of Defense, United States EA-IRMS elemental analyzer coupled with an isotope-ratio mass spectrometer EBCT empty bed contact time FID Flame Ionization Detector g gram(s) GAC granular activated carbon GC Gas Chromatograph GC-IRMS Gas Chromatography – Isotope-Ratio Mass Spectrometry gpm gallons per minute H Most abundant hydrogen isotope with atomic mass of 1 ID internal diameter L liter(s) mg milligram(s) mg/L milligrams per liter mg/g milligrams of 1,4-dioxane/gram of Ambersorb 560 min minutes mL milliliter(s) mL/min milliliters per minute m meter mm millimeter MNA Monitored Natural Attenuation NA not applicable or not analyzed

v
LIST OF ACRONYMS (cont’d) ng nanogram(s) nmol nanomole(s) PCE tetrachloroethene PLFA phospholipid fatty acid SERDP Strategic Environmental Research and Development Program SON Statement of Need TCE trichloroethene TD thermal desorption US EPA United States Environmental Protection Agency µg microgram(s) µg/L micrograms per liter VAFB Vandenberg Air Force Base VPDB Vienna Pee Dee Belemnite (internationally accepted standard for referencing
carbon isotope ratios) VSMOW Vienna Standard Mean Ocean Water (internationally accepted standard for
referencing hydrogen isotope ratios)

vi
ABSTRACT
Objective: The objective of this work was to develop a reliable method to perform compound-specific isotope analysis (CSIA) on low aqueous concentrations (1 microgram per liter, µg/L) of 1,4-dioxane in groundwater and then apply it to investigate 1,4-dioxane biodegradation. Microcosms were used to assess carbon and hydrogen isotope ratios during cometabolic biodegradation of 1,4-dioxane. CSIA was applied to groundwater samples from United States Department of Defense sites with different groundwater conditions to assess the use of the newly-developed CSIA method as a tool to evaluate biodegradation. Technical Approach: The research involved three major components. First, the method to concentrate dilute 1,4-dioxane was developed by adding a small quantity of synthetic carbonaceous sorbent to the water sample containing 1,4-dioxane. The dried solid sorbent was then subjected to thermal desorption to recover the 1,4-dioxane into a gas chromatograph for separation, conversion to carbon dioxide or hydrogen gas, and mass separation with isotope ratio mass spectrometry. Microcosm studies were used to determine enrichment factors. The propane-grown cells of Mycobacterium sp. 1A degraded 1,4-dioxane by an aerobic cometabolic process. Carbon and hydrogen isotope ratios of 1,4-dioxane were analyzed in samples collected from the microcosms at different times during degradation using the newly-developed method. Groundwater samples were collected from four separate Department of Defense sites with low 1,4-dioxane concentrations with different co-contaminants in various aquifer conditions. At McClellan Air Force Base, a biostimulation pilot test for aerobic cometabolic 1,4-dioxane degradation was investigated. Carbon and hydrogen isotope ratios of 1,4-dioxane were analyzed in samples collected from the pilot test monitoring wells during different operational phases of the test. At the Cape Canaveral Air Force Station, two different sites were investigated. One had undergone a variety of remediation methods and is currently managed by monitored natural attenuation; a remedy at the second site had not yet been implemented when samples were collected. Groundwater samples from Vandenberg Air Force Base Site 24, which had undergone biosparging and bioaugmentation, were collected from two different aquifer zones and analyzed using the method developed herein. Results: It was determined that 0.5 grams of the synthetic carbonaceous sorbent, when added to a 40 mL vial containing aqueous 1,4-dioxane in the 10 to 100 µg/L range, could adsorb more than 99 percent of the 1,4-dioxane from solution. The 1,4-dioxane was successfully recovered from the dried solid sorbent by thermal desorption into a gas chromatograph with isotope ratio mass spectrometry. The method was successfully applied to samples at concentrations in the 1 µg/L range. In the microcosms, an enrichment of heavier carbon and hydrogen isotopes was observed during 1,4-dioxane degradation. The enrichment trend closely followed the Rayleigh-type isotopic enrichment trend that is characteristic of degradation. Enrichment factors for carbon and hydrogen were determined to be approximately -1.98 and -25.6 permill, respectively.

vii
At McClellan AFB, an enrichment of heavier carbon and hydrogen isotopes was observed in samples from wells collected within the biostimulation zone compared to those outside of the biostimulation zone. The carbon and hydrogen isotopic composition of 1,4-dioxane in samples from wells outside of the biostimulation zone appeared to vary over time by approximately 5 and 50 permill, respectively. Because the source isotopic composition of 1,4-dioxane was not characterized at any of the sites, it is difficult to conclusively show that biodegradation had occurred with CSIA. However, enrichment of carbon and hydrogen isotope ratios beyond values reported for neat 1,4-dioxane was observed in certain samples. Proposed further work will assess the stable isotopic composition of neat 1,4-dioxane from different manufacturers to expand the current database of undegraded 1,4-dioxane for comparison with the isotopic composition of 1,4-dioxane at several DoD sites. Benefits: It is anticipated that the method described herein will be widely applied to demonstrate the biodegradation of 1,4-dioxane by CSIA where it is often found in the 1-100 µg/L concentration range. The method is likely to be adaptable to other contaminants and media (e.g., air and soil), thereby extending the applicability of CSIA to possibly document degradation processes that may be occurring at much lower concentrations in the environment. KEYWORDS: 1,4-dioxane, CSIA, Ambersorb 560, thermal desorption, GC-IRMS

viii
ACKNOWLEDGEMENTS
The authors thank the Department of Defense Strategic Environmental Research and Development Program for funding this project. Michael Nickelsen of ECT2 in Rochester, New York, provided chemistry and analytical support and supported method development throughout the project. Humam El Mugammar performed the CSIA analysis at the University of Waterloo Environmental Isotope Laboratory in Waterloo, Ontario, Canada, and assisted with method development. In addition, we thank Dr. Michael Hyman and technical staff at North Carolina State University for conducting the microcosm studies and shipping water samples to the University of Waterloo Environmental Isotope Laboratory. We greatly appreciate the work of Dr. Jacob Chu at Haley & Aldrich and Dr. Richard Hunter Anderson and Dr. Adria Bodour at the Air Force Civil Engineer Center for facilitating sample collection from the pilot test at McClellan Air Force Base. Groundwater samples from the Cape Canaveral sites were provided by Dr. David Adamson of GSI Environmental Inc.; we thank Dr. Adamson for providing the samples and background information on these sites. We thank Kathleen Gerber (Vandenberg Air Force Base), Caitlin Bell (Arcadis), and Alex Stack (Blainetech) for facilitating collection of groundwater samples at Vandenberg Air Force Base Site 24. We thank the University of Waterloo Environmental Isotope Laboratory staff for coordinating the shipping, receiving, and reporting of CSIA results and Pace Analytical for technical assistance and analytical chemistry support.

1
1. OBJECTIVE
The objectives of project ER-2535 are aligned with the overall objective of ERSON-15-01: to improve estimates of the long-term impact of natural attenuation processes on groundwater contaminants. Specifically, this project sought to develop a cost-effective diagnostic method to demonstrate that natural attenuation processes were contributing to 1,4-dioxane degradation. Specific objectives of this research are to:
1. Develop a reliable method for performing compound-specific isotope analysis (CSIA) on low levels of 1,4-dioxane in groundwater;
2. Assess the use of stable carbon and hydrogen isotope ratios as tools to document the cometabolic biodegradation of 1,4-dioxane; and
3. Assess the use of stable carbon and hydrogen isotope ratios as tools to evaluate biodegradation of 1,4-dioxane at United States Department of Defense (DoD) sites with different groundwater conditions.
The objectives are designed to answer the following specific questions:
1. Can 1,4-dioxane be concentrated by adsorption onto a solid medium from a dilute aqueous solution, as low as 1 microgram per liter (µg/L), and then be extracted from the medium in a more concentrated form suitable for performing carbon and hydrogen CSIA?
2. Can the method developed for 1,4-dioxane be adopted for very low concentrations of chlorinated volatile organic compounds (CVOCs) (e.g., <10 µg/L)?
3. During the 1,4-dioxane concentration process, does isotope fractionation occur? Are hydrogen isotope ratios affected differently than carbon?
4. Can the stable carbon and hydrogen isotope ratios be used at field sites for assessing biodegradation of 1,4-dioxane?
The effort described herein focuses on 1,4-dioxane, however, the method is likely adaptable to other contaminants and media (e.g., air and soil), thereby extending the applicability of CSIA to low concentrations of a variety of environmental contaminants in different phases.
2. BACKGROUND
2.1 Introduction At many DoD sites, even the most costly and aggressive groundwater cleanup methods will not be able to achieve the low concentration cleanup goals set by the United States Environmental Protection Agency (US EPA) and/or state agencies for a variety of contaminants in a reasonable timeframe (NRC, 2013). A transition from active remediation to long term management with monitored natural attenuation (MNA) is the most realistic outcome for many sites (NRC, 2013). The Statement of Need (SON) ERSON-15-01, issued by the Strategic Environmental Research and Development Program (SERDP), calls for research that will lead to an improved understanding of long term natural attenuation processes on contaminants in groundwater.

2
A critical process of natural attenuation is contaminant degradation. It is difficult to demonstrate degradation of 1,4-dioxane, which is often present at chlorinated solvent sites but is considered recalcitrant in the subsurface. Little is known about the fate of 1,4-dioxane at low concentrations because most laboratory and field studies have involved concentrations in the 1,000 µg/L range. This research project aimed to develop a method to provide direct evidence for the intrinsic degradation of 1,4-dioxane at low concentrations in groundwater. This limited-scope research project is important to the DoD because the expected outcome will allow for a cost-effective and readily-implementable method to demonstrate the natural attenuation of 1,4-dioxane, thereby enabling a transition from active remediation to MNA. 2.1.1 Degradation of 1,4-Dioxane Although numerous studies on aerobic biodegradation of 1,4-dioxane have been published, most laboratory and field studies have involved stable isotope probing with high concentrations of 1,4-dioxane. Thus, little is known about the subsurface fate of 1,4-dioxane at low concentrations at sites where a transition to MNA is appropriate. Li et al. (2014) found evidence for the presence of 1,4-dioxane degrading microbes at five sites by quantifying catabolic biomarkers that correlate with 1,4-dioxane degradation activity found in microcosms. These results suggest that biomarkers could be an important tool for assessing 1,4-dioxane degradation potential at field sites, however, do not provide direct evidence on the extent of 1,4-dioxane degradation that has occurred in situ. Li et al. (2014) found potential for 1,4-dioxane degradation at each of the five sites evaluated, suggesting that MNA is promising. Chiang et al. (2012) used stable isotopic tools as well as enzyme and phospholipid fatty acid (PLFA) analysis to demonstrate the biodegradation of trichloroethene and 1,4-dioxane at a DoD site in Tucson, Arizona (Air Force Plant 44). Although their results demonstrated that microbes capable of degrading 1,4-dioxane were present and active at the site, the authors acknowledged the need to develop CSIA as a tool to directly demonstrate and monitor the in situ biodegradation of 1,4-dioxane. 2.1.2 Compound Specific Isotope Analysis for Documenting Degradation CSIA is a powerful tool for providing evidence of contaminant degradation of many groundwater contaminants including fuel-related hydrocarbons, oxygenates, and chlorinated solvents (USEPA, 2008). CSIA has become an important tool to document biodegradation of an organic contaminant with similar chemical properties to 1,4-dioxane, methyl tert-butyl ether (MTBE), thought to be resistant to biodegradation 15 years ago (Kolhatkar et al., 2002; Lesser et al., 2008). CSIA is now a primary technique used to show that MTBE degrades under both engineered and natural conditions (Wilson et al., 2005). The same could be true for 1,4-dioxane with the development of a reliable and practical method for performing CSIA on groundwater samples, which was achieved with the research presented herein. The occurrence of isotopic fractionation, a key prerequisite for the application of CSIA in biodegradation studies, has been documented in an aerobic microcosm experiment of 1,4-dioxane biodegradation by Pseudonocardia dioxanivorans CB1190 (Pornwongthong et al., 2011). The experiment involved high concentrations of 1,4-dioxane (>10,000 µg/L) so that CSIA could be applied using current methods. In contrast, many sites have dilute, attenuating 1,4-dioxane plumes (Adamson et al., 2015) that require CSIA to be reliable at low concentrations (1-10 µg/L) to demonstrate the contribution of degradation to attenuation.

3
Two-dimensional CSIA (i.e., a dual isotope approach) involves analyzing two different isotope ratios of the same compound to demonstrate microbial processes that cannot be elucidated with one-dimensional (i.e., single isotope ratio) CSIA. For hydrocarbons, two-dimensional CSIA is frequently performed on carbon and hydrogen. Fischer et al. (2007) showed that the dual isotope approach can indicate the specific pathway of benzene degradation because aerobic and anaerobic conditions result in different hydrogen and carbon fractionation factors. Kuder et al. (2005) and Zwank et al. (2005) used two-dimensional CSIA to assess breakdown pathways for MTBE. The dual isotope approach, if applied to 1,4-dioxane, may be a powerful tool for assessing the degradation pathway (e.g., anaerobic versus aerobic) and for forensic applications. Given that multiple sources exist for 1,4-dioxane in groundwater, including manufactured 1,4-dioxane as a solvent stabilizer and 1,4-dioxane as a byproduct of detergent production (Duncan et al., 2004; Mohr et al., 2010), two-dimensional CSIA can be a valuable tool for differentiating sources of 1,4-dioxane in groundwater. For example, the dual isotope approach has been successfully applied to CVOC contamination to differentiate solvents from different manufacturers (Jendrzejewski et al., 2001, Lojkasek-Lima et al, 2012). A recent publication applied the dual isotope approach to stable carbon and hydrogen isotopes of 1,4-dioxane in three groundwater samples, however the results were not conclusive of different sources or degradation (Wang, 2016). 2.2 Technical Scope of Project ER-2535 The overall technical scope of work was designed to achieve the objectives described above and involved, but was not limited to, the following five tasks. 2.2.1 Task 1 Method Development This task involved developing methods for concentrating dilute aqueous concentrations of 1,4-dioxane onto solid hydrophobic carbonaceous resin material, Ambersorb 560 (manufactured by Dow Chemical; referred to hereafter as A560) so that 1,4-dioxane could then be analyzed by CSIA. This involved preparation of large volumes (up to 50 liters) of aqueous solutions of 1,4-dioxane in the 1 to 100 µg/L range from neat 1,4-dioxane of known isotopic composition. Several experiments were conducted that involved transferring the dilute aqueous 1,4-dioxane solution to the solid phase by passing the solution through a small column containing a A560. The 1,4-dioxane was then eluted from the column with a small volume of acetone. The eluted 1,4-dioxane in acetone solution was analyzed as part of Task 2. It was found that the initial acetone extracts were too dilute for CSIA. Additional steps were assessed. It was found that liquid:liquid partitioning of the acetone extract with chloroform allowed for concentration of 1,4-dioxane into chloroform for analysis by CSIA. It was also found that thermal desorption of 1,4-dioxane by heating A560 and collecting a concentrated aqueous solution of 1,4-dioxane for CSIA was a viable approach. However, after several iterations of column experiments involving various quantities of A560, a more practical method to concentrate 1,4-dioxane was developed involving the addition of a small quantity of A560 directly to 1,4-dioxane solutions and allowing sorption to occur over several days. The methods and results of Task 1 are described in this report. 2.2.2 Task 2 Assessment of Isotope Fractionation Task 2 involved developing the protocols to analyze for the carbon and hydrogen isotope ratios of 1,4-dioxane in samples concentrated during Task 1. The CSIA was conducted in the

4
Environmental Isotope Laboratory at the University of Waterloo, Ontario, Canada (Waterloo Isotope Lab). The liquid samples (mixtures of 1,4-dioxane, acetone, and water or 1,4-dioxane and chloroform) were analyzed by direct injection onto a gas chromatograph – isotope-ratio mass spectrometer (GC-IRMS) equipped with a combustion interface. Thermal desorption of adsorbed 1,4-dioxane directly from A560 (of the equilibrium sorption tests) was also conducted by the Waterloo Isotope Lab; this method proved to be more effective and was developed further. Task 2 also involved determining whether isotopic fractionation had occurred during the procedures utilized in Task 1. No significant nor systematic fractionation was observed. The methods and results of Task 2 are described in this report. The success of Task 2 provided a “Go” decision regarding Tasks 3 and 4 as well as finalized the sampling and analytical protocols described herein. 2.2.3 Task 3 CSIA of 1,4-Dioxane and CVOCs during Cometabolic Degradation This task focused on assessing whether isotope fractionation occurs during aerobic cometabolic degradation of 1,4-dioxane. Thirteen groundwater samples were collected from a field pilot test of 1,4-dioxane degradation at McClellan Air Force Base (AFB), near Sacramento, California. The goal was to collect groundwater samples during different stages of the pilot test to assess whether a predictable and quantifiable isotopic enrichment is associated with biodegradation of 1,4-dioxane. The method was intended to also assess fractionation during cometabolic degradation of certain CVOCs (e.g., trichloroethene [TCE] and 1,2-dichloroethane [1,2-DCA]) but this was not completed because CVOC concentrations were too low or non-detect in groundwater samples from the degradation zone of the pilot test. 2.2.4 Task 4 CSIA of 1,4-Dioxane and CVOCs at Field Sites The final task was focused on collecting groundwater samples from additional DoD sites to assess the variability in isotopic composition of 1,4-dioxane in groundwater. In addition to McClellan AFB, samples were also collected from Vandenberg AFB in Lompoc, California and Cape Canaveral Air Force Station (CCAFS) in Cape Canaveral, Florida. CVOCs were not analyzed. The results of Task 4 are described in this report. 2.2.5 Task 5 Project Management and Reporting Task 5 included the management and coordination of research activities as well as routine project reports and technology transfer. The Final Report is the Task 5 deliverable.

5
3. MATERIALS AND METHODS
The applicability of CSIA was extended to 1,4-dioxane at concentrations as low as 1 µg/L by using A560 to concentrate 1,4-dioxane from groundwater samples. A560 is a spherical hydrophobic carbonaceous adsorbent with excellent properties for removal of low-level dissolved contaminants from liquid streams (Figure 1). The unique pore size distribution, and hydrophilic and hydrophobic surface chemistry of A560 provide superior sorption and desorption characteristics for both polar
and non-polar compounds compared to granular activated carbon (GAC). A560 has five to ten times the equilibrium capacity for most volatile organic compounds in comparison to GAC; this effect is more pronounced at low aqueous concentrations. The isotherm for A560 in equilibrium with 1,4-dioxane at different aqueous concentrations is shown in Figure 2.
Figure 1: Photograph of Ambersorb 560 (source: Mike Nickelsen, ECT2).
Figure 2: Sorption isotherm for A560 in equilibrium with aqueous 1,4-dioxane. (source: Mike Nickelsen, ECT2) A single source of neat 1,4-dioxane (Sigma-Aldrich, anhydrous, 99.8%) was used to prepare the aqueous 1,4-dioxane solutions in Task 1 by dilution with distilled water to concentrations ranging from 1 to 100 µg/L. Carbon isotopic characterization by GC-IRMS typically requires at least one

6
nanomole (nmol) of carbon for reliable analysis (Hunkeler & Bernasconi, 2010), therefore, a minimum of 22 nanograms (ng) of 1,4-dioxane was targeted to be adsorbed to A560 from the aqueous solution and recovered for CSIA. As shown in Figure 2, even the lowest data point on the sorption isotherm provides a mass of 1,4-dioxane that is three orders of magnitude greater than that required for CSIA (an aqueous concentration of 3 µg/L corresponds with 20 µg of 1,4-dioxane sorbed onto 1 gram (g) of A560 (dry weight)). Although the isotherm shown in Figure 2 does not extend to 1,4-dioxane concentrations as low as 1 µg/L, it can be extrapolated that a very small mass of A560 has sufficient capacity to adsorb the required 22 ng of 1,4-dioxane. For example, at an aqueous concentration of 1 µg/L of 1,4-dioxane, based on the isotherm, only 5.5 milligrams (mg) of A560 is needed to sorb sufficient 1,4-dioxane for carbon CSIA. As such, the limiting factors in determining the amount of A560 required for concentrating aqueous solutions of 1,4-dioxane in columns are practical and mechanical. For example, smaller columns require lower flow rates for equivalent empty bed contact times (EBCT) and thus require a lower pumping rate than is feasible with standard equipment. For these reasons, a series of small and larger columns tests were performed in iteration to determine a suitable method for concentrating 1,4-dioxane from dilute aqueous solutions. Equilibrium sorption tests were performed as an alternative to the more time-consuming column method, which are expected to result in a lower-cost method that will be simpler to implement and automate by most isotope laboratories. These methods are discussed in Section 3.1. Section 3.2 describes the CSIA performed by the Waterloo Isotope Lab. The results of Task 2 provided feedback for accepting and refining the methods developed under Task 1. The work summarized in Section 3.2 relied primarily on carbon isotope ratios of 1,4-dioxane to assess method effectiveness. Carbon ratios were examined before hydrogen ratios because CSIA for carbon is generally more precise and applicable at lower concentrations and a method that was not successful for carbon isotope ratios would likely not work for hydrogen isotope ratios. In addition, carbon isotopic fractionation has already been documented for aerobic degradation of 1,4-dioxane, albeit at high concentrations (>10,000 µg/L; Pornwongthong et al., 2011), indicating that carbon isotope ratios will be useful for demonstrating biodegradation of 1,4-dioxane. After successful analysis of carbon isotope ratios, hydrogen isotope ratios of 1,4-dioxane were also able to be determined; these are summarized in Sections 3.2.3 and 4.3. 3.1 Task 1 – Method development In accordance with the proposal, the first task included iterative column tests to determine the best method for concentrating 1,4-dioxane onto A560. These tests primarily involved passing large volumes of dilute 1,4-dioxane through small columns containing A560 (Section 3.1.1). Further development led to the use of larger columns, which allowed for shorter loading times and higher EBCTs (Sections 3.1.2 and 3.1.3). The last series of tests involved equilibrium sorption tests to transfer 1,4-dioxane to A560, followed by thermal desorption of 1,4-dioxane from A560 directly into the GC-IRMS (Section 3.1.4). This last series of tests ultimately proved to be the most successful and pragmatic and was developed further; the other series are discussed to document the methods that were not further developed.

7
3.1.1 Tests 1-4: Micro-Column Sorption with Acetone Elution Tests 1-4 were performed to evaluate the use of small columns to concentrate 1,4-dioxane. These micro-column tests were designed to maximize contact between a large volume, low concentration aqueous solution and the A560 beads in order to maximize loading of 1,4-dioxane onto the solid substrate. Each aqueous 1,4-dioxane solution (prepared at concentrations of 1, 10, and 78 µg/L) was pumped at flow rates ranging from 1 to 10 milliliters per minute (mL/min; Fluid Metering, Inc. QG50 Pump Drive with Q1CSC Pump Head) through a column made from 3/8-inch polytetrafluoroethylene tubing and stainless steel compression fittings (Swagelok). Each column contained approximately 2 mL of A560 beads (1.1 g dry weight). The conditions for operating each column are summarized in Table 1.
Table 1: Summary of Tests 1-4
Test Influent Sample
Volume (L)
Influent 1,4-D (µg/L)
Effluent 1,4-D (µg/L)
EBCT (min)
1,4-D mass loaded on A560
(ng/g)
Flow Rate (mL/min)
1,4-D in eluent (µg/L)
1 50 1.0 0.91 2.0 4,100 10 1,125 2 5 9.8 6.4 0.2 15,300 10 4,250 3 0.5 78.3 24.7 0.2 24,100 10 6,700 4 50 1.3 0.90 2.0 18,000 1 5,000
Notes: 1,4-D: 1,4-Dioxane EBCT: Empty Bed Contact Time
The 1,4-dioxane concentrations in the column influent and effluent solutions were quantified by a contract laboratory (Pace Analytical) using EPA Method 522. The 1,4-dioxane loaded onto the A560 was then extracted by eluting each column with 4 mL of acetone. The 1,4-dioxane mass transfer onto A560, based on the difference in influent and effluent concentrations, was fairly low, ranging from 9.0%, to 68.5% (Table 1). The low mass loading efficiency is problematic for two reasons: 1) if isotopic fractionation of 1,4-dioxane occurs, complete or near complete mass loading and recovery is needed to mitigate the fractionation and 2) isotopic characterization of the acetone extract would not be possible because the 1,4-dioxane mass would be too low for CSIA by direct injection. In theory, there was sufficient 1,4-dioxane mass loaded onto the A560 for other sample extraction methods, such as thermal desorption, to be successful. The use of small columns and large volumes was not developed further because the time required for sufficient EBCT was too great, e.g., Test 4 required approximately 35 days to complete. 3.1.2 Test 5: Column Sorption with Thermal Recovery Larger columns were developed to facilitate more efficient 1,4-dioxane transfer from the aqueous phase to A560 in a shorter time period. Because a larger A560 mass also requires a larger volume of solvent for extraction, a different method was used to desorb 1,4-dioxane from the A560. Heating of hydrated A560 produces steam that removes 1,4-dioxane from A560 for condensation and recovery of 1,4-dioxane; based on this, Test 5 was designed and implemented.

8
A column was constructed of 1-in diameter Schedule 40 steel pipe (1.05-inch internal diameter [ID]) and packed with 55.6 g of A560. The column length was approximately 7.1 inches; 5.8 L of aqueous 1,4-dioxane solution with a concentration of 10.6 µg/L was pumped to the top of the column at a rate of 15 mL/min. After all the dilute aqueous solution had passed through the column, samples of influent and effluent were sent to Pace Analytical for quantification of 1,4-dioxane by EPA Method 522. The steel column was wrapped in electrical heat tape and heated to 150°C for 240 minutes. Forty milliliters of aqueous condensate were recovered from the column during heating. The 1,4-dioxane concentration of the condensate was analyzed by gas chromatography (GC) with flame ionization detection (FID) at the Haley & Aldrich laboratory and was determined to be 1,080 µg/L. Mass transfer onto the A560 was greater than or equal to 99.8%, likely due to the longer EBCT (6.7 min), but 1,4-dioxane recovery by heating was only about 70%. The results of Test 5 demonstrated the ability of A560 to concentrate aqueous 1,4-dioxane by two orders of magnitude. Heating at higher temperature may have resulted in higher recovery of 1,4-dioxane from the A560. Rather than repeating Test 5 at higher temperatures, it was decided to test thermal desorption as a recovery method, as described in Section 3.2.2, because it became apparent that this method would be more practical and less labor intensive. Nonetheless, it appears likely that a method to concentrate 1,4-dioxane in water for subsequent CSIA could have been further developed based on Test 5. Such a method may have value for laboratories without access to thermal desorption equipment that could readily perform CSIA on a water sample via heated purge and trap or liquid:liquid extraction with direct injection onto the GC-IRMS. 3.1.3 Tests 6-14: Column Sorption with Either Solvent Elution or Thermal Desorption After larger columns were demonstrated to trap 1,4-dioxane on A560 more efficiently than smaller columns, additional column tests focused on enhancing recovery of 1,4-dioxane from the A560 to facilitate CSIA. Glass columns (1-inch ID) were filled with 25 g of A560. New aqueous 1,4-dioxane solutions were prepared at concentrations of 1, 10, and 84 µg/L and introduced to the top of each column at a flow rate of 7 mL/min. The influent aqueous solution volumes for Tests 6-14 ranged proportionally with 1,4-dioxane concentration, from 0.5 L (84.2 µg/L) to 48 L (1.2 µg/L). For Tests 6-9, 1,4-dioxane was recovered by elution from the column with 50 mL of acetone. The liquid extracts were shipped to the Waterloo Isotope Laboratory. The 1,4-dioxane concentration in each acetone extract ranged from 842-898 µg/L. The required concentration for direct injection of the sample into the GC-IRMS is 22,000, therefore, the concentration in the acetone extract was far too low for direction injection. Attempts to concentrate 1,4-dioxane in the acetone further by evaporation were ineffective due to the abundance of water in the samples. The Waterloo Isotope Laboratory tested a method to separate 1,4-dioxane from acetone and water by partitioning it into chloroform. The 1,4-dioxane preferentially partitioned into chloroform at a ratio of 4:1 over acetone. Because of this success, the sample from Test 9 was extracted with chloroform and provided sufficient 1,4-dioxane for GC-IRMS using direct injection. For Tests 10-14, 25 g of A560 were removed from the column, air-dried, transferred to a 60 mL glass vial, homogenized (mixed by hand), and shipped to the Waterloo Isotope Laboratory for CSIA by direct thermal desorption-GC-IRMS (TD-GC-IRMS).

9
The column methods employed for Tests 6-14 were also tested on three replicate groundwater samples (1-ACB-1-D, -E, and -F) from the in situ aerobic cometabolic biodegradation groundwater treatment system operated by Haley & Aldrich at McClellan AFB. These samples were collected on 11 September 2015 from the groundwater circulation system at an above-ground sampling port located between the extraction and injection wells. Because it was found during Tests 6-14 that the same results could be achieved with a lower mass of A560, 8 g of A560 was used for the field samples. 1 L of each replicate sample was introduced to a separate glass column containing 8 g of A560. Similar to Test 10, the A560 was removed from each column, air-dried, transferred to a 60 mL glass vial, mixed, and delivered to the Waterloo Isotope Laboratory for CSIA by TD-GC-IRMS. The conditions for operating each column are summarized in Table 2.
Table 2: Summary of Tests 6-14 and groundwater samples
Sample ID
Influent Sample Volume
(L)
Influent Aqueous
1,4D (µg/L)
Effluent Aqueous
1,4D (µg/L)
Amber- sorb mass (g)
EBCT
(min)
1,4D mass
loaded on
A560 (ng
1,4D/g)
Method for recovering 1,4D from
A560
Concentration of 1,4D in
eluent (µg/L)
6 0.5 84.2 <0.023 25 6.7 1,684 Ac.elut. (50 mL) 842
7 0.5 84.2 <0.023 25 6.7 1,684 Ac.elut. (50 mL) 842
8 0.5 84.2 <0.023 25 6.7 1,684 Ac.elut. (50 mL) 842
9 5 9.0 <0.023 25 6.7 1,795 Ac.elut. (50 mL) 898
10 5 9.0 <0.023 25 6.7 1,795 TD NA 11 5 9.1 <0.023 25 6.7 1,815 NA* NA 12 47 1.2 <0.023 25 6.7 2,223 TD NA 13 44 1.2 <0.023 25 6.7 2,080 TD NA 14 48 1.2 <0.023 25 6.7 2,273 TD NA
I-ACB-1-D 1 50.9 <0.023 8 6.0 6,360 TD NA
I-ACB-1-E 1 50.9 <0.023 8 6.0 6,360 TD NA
I-ACB-1-F 1 50.9 <0.023 8 6.0 6,360 TD NA
Abbreviations: Ac.elut. (50 mL): elution of 1,4-dioxane from A560 by passing 50 mL acetone through column. TD: thermal desorption (conducted at Waterloo Isotope Laboratory). NA: not applicable to thermal desorption. *: Not analyzed for CSIA due to method adjustments.
Notes: Influent and effluent 1,4-D concentrations were analyzed by Pace Analytical using EPA Method 522.

10
3.1.4 Equilibrium Sorption of 1,4-Dioxane Equilibrium sorption tests were conducted to assess the effectiveness of A560 at concentrating 1,4-dioxane by placing A560 beads into an aqueous solution of 1,4-dioxane and then removing 1,4-dioxane from A560 using solvent or heat. Two sets of sorption experiments were performed at higher concentrations to more quickly assess the feasibility of this method. Once it was demonstrated to be feasible, the tests were performed at lower concentrations to represent typical groundwater concentrations. 3.1.4.1 High Concentration Equilibrium Sorption Tests – 1,039 mg/L Approximately 0.37 g dry weight of A560 was transferred to each of six glass vials (60 mL). 50 mL of a prepared 1,4-dioxane solution at a concentration of 1,037 milligrams per liter (mg/L) was added to each vial. The vials were placed on a rotary shaker overnight (a minimum of 16 hours) for mixing. The supernatant was decanted from each vial and analyzed for residual 1,4-dioxane concentration using an HP 5890 GC-FID. For Vials 1-3, 1,4-dioxane was extracted from the adsorbent with 2 mL of acetone for 1 hour. For Vials 4-6, the adsorbent was allowed to air dry for 24 hours before acetone extraction to minimize the water content of the adsorbent. A 2 µL aliquot of the acetone extract was injected into the GC-FID to determine the 1,4-dioxane concentration. After completing the mass loading and extraction experiments, samples of the neat 1,4-dioxane solution and the six acetone extracts were shipped to the Waterloo Isotope Laboratory for carbon isotope CSIA of 1,4-dioxane. Data from the six acetone extracts is summarized in Table 3.
Table 3: Summary of conditions used for equilibrium sorption tests at 1,039 mg/L
Units Gravity Filtration Gravity Filtration / 24hr
Drying Vial 1 Vial 2 Vial 3 Vial 4 Vial 5 Vial 6
A560 Mass (wet wt) g 1.028 1.012 1.145 0.982 1.204 1.018 A560 Mass (dry wt) g 0.365 0.360 0.407 0.349 0.428 0.362 1,4-D Solution Concentration mg/L 1031.9 1031.9 1031.9 1031.9 1031.9 1031.9 1,4-D Solution Volume L 0.05 0.05 0.05 0.05 0.05 0.05 1,4-D Mass in Solution mg 51.6 51.6 51.6 51.6 51.6 51.6 Supernatant 14D Residual mg/L 194.0 133.7 129.9 245.5 127.0 157.3 1,4-D Mass Remaining Solution mg 9.7 6.7 6.5 12.3 6.3 7.9 1,4-D Loaded Mass mg/g 114.6 124.8 110.8 112.6 105.7 120.8 Acetone Extraction Volume L 0.002 0.002 0.002 0.002 0.002 0.002 1,4-D Mass in Acetone mg 40.3 40.9 41.68 38.67 43.1 42.8 1,4-D Mass Percent Recovery % 96.2% 91.0% 92.4% 98.3% 95.2% 97.8%
3.1.4.2 High Concentration Equilibrium Sorption Tests – 200 mg/L The Waterloo Isotope Laboratory performed a second series of tests to assess the feasibility of performing direct thermal desorption of 1,4-dioxane and subsequent analysis of hydrogen isotope ratios. For these tests, a standard aqueous solution with a 1,4-dioxane concentration of 200 mg/L was used. Aliquots of aqueous 1,4-dioxane ranging in volume from 0.025 to 0.75 mL were equilibrated with A560 ranging in mass from 73.3 to 205.9 mg for 24 hours. Due to sample volume limitations, percent recoveries were not calculated for these experiments.

11
3.1.4.3 Low Concentration Equilibrium Sorption Tests – 1-10 µg/L A series of three equilibrium sorption tests were performed in triplicate using prepared aqueous 1,4-dioxane solutions at concentrations of 1, 5, and 10 µg/L. Assuming 100% sorption of 1,4-dioxane onto the 0.3 grams of A560, the sorbed mass was calculated to be 130, 664, or 1,330 ng/g for the 1, 5, or 10 µg/L aqueous concentrations, respectively. Approximately 1 mL of A560 (0.3 g dry weight) was placed in each of nine 40 mL glass vials. These vials were filled with dilute aqueous 1,4-dioxane at concentrations of 1 µg/L (SERDP-1A, B & C), 5 µg/L (SERDP-5A, B & C), and 10 µg/L (SERDP-10A, B & C), then capped with plastic caps fitted with Teflon-lined septa. All nine vials were packed in an ice-filled cooler and shipped to the Waterloo Isotope Laboratory, where the A560 from each sample was collected on a conical paper filter. The filter paper containing the A560 was placed in a pyrex beaker on a hot plate at 80°C for 12 hours; the hot plate and sample beaker were contained in a plexiglass enclosure which had a continuous sweep of ultra-high purity nitrogen gas. Carbon isotope CSIA of 1,4-dioxane was then performed on each sample. Table 4 provides a summary of the equilibrium sorption tests.
Table 4: Summary of conditions used for equilibrium sorption tests at 1-10 µg/L
Sample ID
Aqueous Sample Volume
(L)
Aqueous 1,4D Conc. (µg/L)
Amber- sorb mass (g)
1,4D mass loaded on A560 (estimated, assuming 100%
sorption) (ng 1,4D/g) SERDP-1A 0.04 1 0.3 130 SERDP-1B 0.04 1 0.3 130 SERDP-1C 0.04 1 0.3 130 SERDP-5A 0.04 5 0.3 664 SERDP-5B 0.04 5 0.3 664 SERDP-5C 0.04 5 0.3 664
SERDP-10A 0.04 10 0.3 1,330 SERDP-10B 0.04 10 0.3 1,330 SERDP-10C 0.04 10 0.3 1,330
3.2 Task 2 – Assessment of Isotope Fractionation Measurements of stable carbon isotope ratios (13C/12C) and stable hydrogen isotope ratios (2H/1H or D/H) of 1,4-dioxane were performed at the Waterloo Isotope Laboratory using GC-IRMS. The results are reported as the deviation (δ) from the corresponding isotope ratio of an internationally defined standard, in this case, a marine carbonate called Vienna Pee Dee Belemnite (VPDB) for carbon and Vienna Standard Mean Ocean Water (VSMOW) for hydrogen. Each stable isotope ratio is reported as a relative difference from the standard in parts per thousand, or permil (‰):
𝛿𝛿 = �𝑅𝑅𝑠𝑠𝑠𝑠𝑠𝑠𝑠𝑠𝑠𝑠𝑠𝑠𝑅𝑅𝑠𝑠𝑠𝑠𝑠𝑠𝑠𝑠𝑠𝑠𝑠𝑠𝑠𝑠𝑠𝑠
− 1� × 1000‰
Where Rsample = 13C/12C or D/H measured in the sample using IRMS and Rstandard is the internationally defined standard of 0‰. The 1,4-dioxane used in the experiments was isotopically characterized for carbon and hydrogen isotope ratios using an elemental analyzer coupled with an isotope-ratio mass spectrometer (EA-IRMS).

12
3.2.1 Determination of Carbon Isotope Ratios of 1,4-Dioxane by Direct Injection – GC-
IRMS Samples from Tests 1-4 and 6-9 were analyzed by GC (Agilent 7980) connected to a catalytic combustion interface (copper/nickel oxide wires at 950°C) followed by an IRMS (Mat 253; ThermoFinnigin, Bermen, Germany). Samples of acetone extract were introduced directly to the GC column (Rtx-VRX 60m long, 0.32mm ID) via injection to a sample loop with volume of 1 or 2 µL. Helium carrier gas swept the sample loop onto the column at a flow rate of 2.4 mL/min. Column temperature was held constant at 35°C for the first 5 minutes then increased at a rate of 5°C/min to 80°C, then held for 2 minutes, then heated at a rate of 10°C/min to 150°C; 1,4-dioxane eluted at 20 minutes. 3.2.2 Determination of Carbon Isotope Ratios of 1,4-Dioxane by Thermal Desorption –
GC-IRMS For the remaining samples, CSIA was performed by direct thermal desorption-GC-IRMS (TD-GC-IRMS) from the A560 beads. The A560 was first separated from water and dried as described in Section 3.1.4.3. Prior to CSIA, the amount of A560 mass to load into the thermal desorption tube (3.5-inch stainless steel, 5mm ID) was selected to contain a minimum of 5 µg of 1,4-dioxane; the A560 mass ranged from 73.3 to 205.9 mg for thermal desorption at 350°C (Perkin Elmer ATD 400). Desorbed 1,4-dioxane was introduced into the GC-IRMS system via a heated transfer line connected directly to the GC column with helium carrier gas at a flow rate of 3 mL/min. Separation of compounds occurred on an Agilent 6890 GC. The GC was equipped with a capillary column (Rtx-VRX 60m long, 0.32mm ID). Column temperature was held constant at 35°C for the first 5 minutes, then increased at a rate of 5°C/min to 80°C, then held for 2 minutes, and then heated at a rate of 10°C/min to 150°C; 1,4-dioxane eluted at 20 minutes. Column effluent was directed to a catalytic combustion interface (copper oxide pellets at 850°C) followed by an IRMS (IsoPrime). 3.2.3 Determination of Hydrogen Isotope Ratios of 1,4-Dioxane by Thermal Desorption –
GC-IRMS Eleven A560 samples from the batch sorption tests were analyzed by TD-GC-IRMS. The A560 was first separated from water and dried as described in Section 3.1.4.3. Prior to CSIA, the amount of A560 mass to load into the thermal desorption tube (3.5-inch stainless steel, 5mm ID) was selected to contain a minimum of 5 µg of 1,4-dioxane; the A560 mass ranged from 73.3 to 283.5 mg for thermal desorption at 350°C (Perkin Elmer ATD 400). Desorbed analytes were introduced into the GC-IRMS system via a heated transfer line connected directly to the GC column with helium carrier gas at a flow rate of 10 mL/min. Separation of compounds occurred on an Agilent 6980 GC. The GC was equipped with a capillary column (Rtx-VRX 60m x 0.32mm). Column temperature was held constant at 35°C for the first 5 minutes, then increased at a rate of 5°C/min to 80°C, then held for 2 minutes, and then heated at a rate of 10°C/min to 150°C; 1,4-dioxane eluted at 419 seconds. Column effluent was directed to a ceramic pyrolysis tube at 1450°C followed by an IRMS (MAT 253). 3.3 Task 3 – CSIA of 1,4-Dioxane during Cometabolic Degradation Task 3 involved applying the newly-developed CSIA method to assess enrichment trends during aerobic cometabolic degradation. This was accomplished by applying CSIA to water samples from

13
microcosm studies of 1,4-dioxane under aerobic cometabolic degradation and on groundwater samples from a field pilot test of aerobic cometabolic degradation of 1,4-dioxane. 3.3.1 Microcosm Studies for Determining Enrichment Factors Microcosm studies are an important step in assessing the application of CSIA for a contaminant of interest because the conditions of the “Rayleigh model” for isotope enrichment can usually be satisfied under the controlled conditions that a microcosm can provide. The Rayleigh model specifies that the extent of isotope enrichment occurring in a compound undergoing degradation follows a predictable trend that can be described using the Rayleigh equation (Thullner et al., 2012, Abe and Hunkeler, 2006, USEPA, 2008). A simplified approximate form of the Rayleigh equation can be expressed for carbon as:
δ13Ct=δ13Co+εln(f) (Rayleigh Equation)
– δ13Co = the starting isotope composition of the contaminant of interest (in this case, 1,4-dioxane) prior to biodegradation (source isotope ratio);
– δ13Ct = the isotope composition of 1,4-dioxane after a certain amount of degradation has occurred over time;
– ε = the enrichment factor, a constant describing the magnitude of the isotope shift during degradation of 1,4-dioxane;
– f = fraction of 1,4-dioxane remaining after a certain amount of 1,4-dioxane degradation has occurred over time. This is calculated by dividing the concentration of 1,4-dioxane in a sample collected at a certain time following the onset of degradation by the starting concentration before the onset of degradation; and
– ln(f) = natural logarithm of (f). The Rayleigh Equation indicates that the observed increase in δ13Ct is controlled by the enrichment factor (ε) and the amount of degradation. In addition, a plot of δ13Ct versus ln(f) would form a straight line with a slope equal to ε and a y-intercept equal to the isotopic composition of the contaminant prior to onset of degradation (δ13Co). The Rayleigh Equation could also be applied to the hydrogen isotope ratios of 1,4-dioxane. Enrichment factors derived from microcosm tests can be applied to field studies on 1,4-dioxane degradation. Microcosm studies were completed in the laboratory of Dr. Michael Hyman at North Carolina State University (NCSU). Cells of Mycobacterium sp. 1A were grown in two 1L glass serum bottles (A and B) containing mineral salts medium (250 mL). The bottles were inoculated with cells previously grown on minimal media plates grown under isobutane pressure and were sealed with screw caps containing a butyl rubber septum. After sealing the bottles, 120 mL propane was added to the gas phase as an overpressure using sterile plastic syringes fitted with disposable sterile filters (0.1 µm). The bottles were then incubated in the dark at 30°C in an environmental shaker operated at 150 rpm.
14
After five days, the cells were harvested by centrifugation (10,000 rpm for 5 minutes). The resulting cell pellet was re-suspended in a buffer solution (50 mM sodium phosphate [NaPi] at pH 7.0) and then centrifuged again (10,000 rpm for 5 minutes). The resulting washed cell pellet was re-suspended in buffer (as above) to a final cell concentration of ~20 mg total protein/mL. The re-suspended washed cell pellets from each of the two propane-fed cultures were then combined and used to generate water samples for CSIA. The consumption of 1,4-dioxane by the propane-grown cells was conducted in a glass serum bottle (1 L) that contained NaPi buffer (200 mL) and was sealed with a Teflon-lined Mininert stopper. The sealed bottle was supplemented with neat 1,4-dioxane (85 µL) and the reaction was initiated by the addition of washed resting cells (5 mL). During the course of 1,4-dioxane degradation, the residual 1,4-dioxane was determined by GC analysis of the reaction medium (2 µL samples) that were directly injected into Shimadzu 14A GC fitted with a 6-foot long stainless steel Porapak Q-filled column and a flame ionization detector (FID). At appropriate times, larger samples (≤ 5 mL) were removed from the reaction and were added to glass VOA vials filled with trisodium phosphate solution (1% wt/v) as a preservative. In all cases the final 1,4-dioxane concentration in these samples was approximately 500 µg/L; these samples were sent to the Waterloo Isotope Laboratory for 1,4-dioxane analysis. 3.3.2 Field Study of Aerobic Cometabolic Degradation The AFCEC-funded field pilot project demonstrated the feasibility of aerobic cometabolic biodegradation (ACB) to stimulate native bacteria and degrade 1,4-dioxane at the former McClellan AFB. The field testing was conducted in Operable Unit D at McClellan AFB, where a stable 1,4-dioxane plume has been monitored since the early 2000s. The sediments in the vadose and shallow groundwater zones beneath McClellan AFB consist of alluvial and fluvial deposits, including sand, silty sand, silt, and clay. The demonstration took place in an aquifer that begins at approximately 100 feet below ground surface (bgs) and is approximately 35 feet thick. The groundwater flow in the vicinity of OU D is controlled by extraction wells. The hydraulic conductivity was estimated by an aquifer test to be 24 feet per day. Groundwater within the pilot test zone is moderately hard with a low concentration of total dissolved solids and organic matter content. Dissolved oxygen concentrations were approximately 4 mg/L, indicating aerobic conditions in shallow groundwater. The field-scale ACB remediation system consisted of an injection-extraction well pair for groundwater recirculation, two monitoring wells in the recirculation zone for performance monitoring, and an above-ground substrate delivery system for propane and oxygen addition (Figure 3). Concentrations of 1,4-dioxane (up to 77 µg/L) and co-contaminants, such as TCE (up to 4.4 µg/L), 1,1-dichloroethene (1,1-DCE up to 1.4 µg/L), and 1,2-DCA (up to 13 µg/L), in the testing area were treated through propane and oxygen addition to levels below 3 µg/L for 1,4-dioxane, 1 µg/L for TCE, 0.2 µg/L for 1,1-DCE, and 0.18 µg/L for 1,2-DCA. The half-life for 1,4-dioxane degradation was estimated to be 0.45 days during biostimulation with propane and oxygen. A tracer test using bromide indicated the travel time between the injection well (IACB-1) and first monitoring well along the flowpath (MACB-1) was 1.5 days during groundwater circulation

15
Groundwater samples were collected at different phases of the pilot test for CSIA (carbon and hydrogen isotope ratios) in 1,4-dioxane by the methods described in Sections 3.2.2 and 3.2.3, respectively, of this report. Figure 3. Schematic of aerobic cometabolic pilot test at McAFB. An in situ groundwater recirculation bioreactor was established by extraction of groundwater at MACB-3 and re-injection at IACB-1; MACB-1, MACB-2, and MW-10 are monitoring wells. Flow rates were maintained between 1.75 and 2 gallons per minute. Oxygen and propane were added to the injection line as discrete pulses to promote a zone of aerobic cometabolic degradation around IACB-1 (shaded area). During operation, 25% to 30% of groundwater captured at MACB-3 was from outside of the treatment cell; the remainder was from IACB-1 (Haley & Aldrich, 2016). 3.4 Task 4 – CSIA of 1,4-Dioxane at Field Sites Groundwater samples from the following four DoD field sites were collected to assess variability of stable carbon and hydrogen isotope ratios of 1,4-dioxane at contaminated sites:
1. McClellan Air Force Base, Operable Unit D, in McClellan, near Sacramento, California, 2. Vandenberg Air Force Base, Site 24, near Lompoc, California, 3. Cape Canaveral Air Force Station, Facility 1381, Cape Canaveral, Florida, and 4. Cape Canaveral Air Force Station, Space Launch Complex 16 (SLC-16).
Site background information on the McClellan Air Force Base is provided previously in Section 3.3.2. Background information on the Vandenberg Air Force Base Site 24 and the Cape Canaveral sites is provided below. Results for these sites are discussed in Section 4.4. 3.4.1 Vandenberg Air Force Base Site 24 Vandenberg Air Force Base spans approximately 150 square miles and is located along 35 miles of the central California coastline, approximately 10 miles west of Lompoc (Bell et al., 2016). Site
C3H8
O2
IACB
-1
MAC
B-1
MAC
B-2
MAC
B-3
MW
-10

16
24 comprises an area formerly used for vehicle fueling, military tank service and maintenance, and pesticide mixing and equipment washing, which involved chlorinated solvents use and discharge to sumps (Bell et al., 2016). Impacts to groundwater include 1,4-dioxane, with concentrations in Site 24 groundwater samples historically ranging from 135 µg/L to 1,090 µg/L, and co-contaminants tetrachloroethene (PCE, up to 34 µg/L), trichloroethene (TCE, up to 411 µg/L), cis-1,2-dichloroethene (cis-1,2-DCE, up to 21 µg/L), 1,1,1-trichloroethane (1,1,1-TCA up to 30 µg/L), 1,1-dichloroethane (1,1-DCA up to 69 µg/L) 1,1-DCE (up to 286 µg/L) and trichlorofluoromethane (up to 226 µg/L) (Lippincott et al., 2015). Subsurface conditions reportedly comprise primarily silty fine sand with lower permeability intervals of silt and clay and a deeper layer of sand and gravel overlying a lean clay at approximately 90 feet bgs (Lippincott et al., 2015). Three generalized water-bearing zones have been identified above the lean clay: 1) shallow groundwater that is encountered as a perched zone overlying low permeability soils at depths of 8 to 23 feet bgs; 2) an intermediate water-bearing zone from 35 to 82 feet bgs; and 3) a deep confined zone at 82 to 90 ft bgs, with a potentiometric surface of 65 ft bgs (Lippincott et al., 2015). Vertical hydraulic gradients are downwards between these intervals (based on Figure 1 in Lippincott et al., 2015). Microcosm studies indicated that native propanotrophs were abundant in the shallow (perched) groundwater zone but difficult to stimulate with propane sparging in the deep zone (Lippincott et al., 2015). Pilot testing of propane biosparging and bioaugmentation to promote aerobic cometabolic biodegradation of 1,4-dioxane was performed in the deep aquifer zone at Site 24 between April and December 2013. At four monitoring wells within the radius of biosparge influence, 1,4-dioxane concentrations decreased by 95 to 99 percent 245 days after biosparging and bioaugmentation began (Lippincott et al., 2015). On 16 and 17 November 2015, two groundwater monitoring wells were sampled for stable isotopic characterization of 1,4-dioxane. Monitoring well 24-MW-34B, installed in the deep zone, was selected because it was within the zone of influence of the biosparge pilot test and concentrations had reportedly decreased by 95% during the 2013 pilot test, then rebounded to 82 µg/L by mid-2015. Shallow zone monitoring well 24-PMW-01R was also selected because it was likely not affected by the pilot test. Groundwater samples for 1,4-dioxane CSIA were collected using low flow groundwater sampling methods to collect samples in 1L amber glass bottles. The samples were shipped to Haley & Aldrich’s laboratory in Rochester, New York in ice-filled coolers and stored at 4°C before shipping to the Waterloo Isotope Laboratory for CSIA. 3.4.2 Cape Canaveral Air Force Station Sites Groundwater samples for 1,4-dioxane CSIA were collected at two separate sites at CCAFS in Cape Canaveral, FL. The geology of both sites is similar and is comprised of an unconfined, anaerobic aquifer of undifferentiated marine sands overlain by Pleistocene-age deposits of the Caloosahatchee Marl and Tamiami Formations. There are discontinuous lenses of clay and silt present in deeper parts of aquifer, at approximately 40 to 50 ft bgs. CSIA samples were collected from both sites, in the source zones and downgradient wells, to provide evidence for degradation of 1,4-dioxane in the lower-conductivity layers.

17
The first site at CCAFS is Facility 1381, where 1,4-dioxane was detected in 2009 in shallow groundwater (to 40 ft bgs) during remediation and long-term monitoring of a chlorinated solvent plume. The release of 1,4-dioxane and chlorinated solvents at Facility 1381 was due to former acid neutralization pits and an ordnance support facility. Concentrations of 1,4-dioxane are as high as 26 µg/L but are spatially sporadic and do not represent a distinct plume. Co-contaminants include TCE, cis-1,2-DCE and trans-isomer, 1,1-DCE, vinyl chloride, 1,1-DCA, 1,1,1-TCA, dichloromethane, and benzene; TCE and its daughter products were historically up to 10,000-100,000 µg/L but currently are less than 1,000 µg/L everywhere except one localized area. 1,4-dioxane concentrations were observed to be relatively stable while co-contaminants have decreased significantly due to corrective measures (steam- and iron-enhanced soil mixing and new technology pilot tests including in situ bioremediation, multi-level air sparging, phytoremediation, groundwater recirculation, and groundwater capture with aeration). The site is currently managed using monitored natural attenuation. Seven samples were collected by Groundwater Services Incorporated (GSI) at Facility 1381 groundwater between 12-20 May 2016 for analysis of carbon and hydrogen isotopes. The second site at CCAFS is Space Launch Complex 16 (SLC-16), where 1,4-dioxane was detected in 2012 groundwater to depths of 50 ft bgs. The release of 1,4-dioxane and chlorinated solvents at SLC-16 was due to the use of solvents to clean small parts at a launch facility. Concentrations of 1,4-dioxane are as high as 2,400 µg/L and appear to be co-located with the chlorinated solvents TCE (maximum concentration 500,000 µg/L), cDCE (450,000 µg/L), and VC (34,000 µg/L). Contaminants did not display a clear trend in the short duration of monitoring. A remedy had not been implemented prior to collection of CSIA samples. Ten samples were collected by GSI at SLC-16 groundwater between 16-18 May 2016 for analysis of carbon and hydrogen isotopes.
4. RESULTS AND DISCUSSION
The results and discussion of this research are presented below and organized as follows:
• Section 4.1 includes a summary of the results of all relevant chemical and isotopic analyses from laboratory method development and a recommended procedure for performing CSIA on 1,4-dioxane;
• Section 4.2 summarizes the results of the microcosm studies and presents carbon and hydrogen enrichment factors for aerobic cometabolic degradation of 1,4-dioxane;
• Section 4.3 summarizes the results of CSIA performed on 1,4-dioxane in groundwater samples from the aerobic cometabolic pilot test; and
• Section 4.4 provides a preliminary assessment of the isotopic composition of 1,4-dioxane at field sites.
4.1 Analysis of Stable Carbon and Hydrogen Isotope Ratios of 1,4-Dioxane at Low
Concentrations in Water Samples The accuracy of CSIA performed on dilute aqueous 1,4-dioxane by GC-IRMS is assessed by comparing δ13C and δD values of the dilute solution with that of the neat 1,4-dioxane used to prepare the dilute solution. The δ13C and δD values for neat 1,4-dioxane (Sigma-Aldrich,

18
anhydrous, 99.8%) used to prepare the dilute aqueous solutions determined by EA-IRMS as follows: δ13C reported by University of Waterloo in December 2014 by EA-IRMS: -33.3 ‰ VPDB δ13C reported by Pace Analytical in April 2015 by GC-IRMS: -33.1 ‰ VPDB δD reported by University of Waterloo in January 2016 by EA-IRMS: -44. 5 ‰ VSMOW The same source of neat 1,4-dioxane was used to prepare dilute aqueous 1,4-dioxane solutions with concentrations ranging six orders of magnitude: from 1 µg/L to 1,039 milligrams per liter. It is expected that the isotopic composition of this neat 1,4-dioxane remained stable over the course of the study. This expectation is supported by the fact that two different laboratories (Waterloo and Pace) reported essentially identical δ13C values from the same neat 1,4-dioxane source but at different times (approximately 4 months apart). 4.1.1 Stable Carbon Isotope Analysis of 1,4-Dioxane The δ13C values obtained for 1,4-dioxane aqueous standards (prepared from neat 1,4-dioxane as described in Section 3.1) are plotted versus 1,4-dioxane concentration in Figure 4 and summarized in Table 5.
Figure 4. Summary of Stable Carbon Isotope Ratios for 1,4-Dioxane Aqueous Solutions. The process of aqueous sorption and desorption of 1,4-dioxane from A560 at as well as partitioning into chloroform did not cause a noticeable carbon isotope fractionation (Figure 4). An analytical error of ± 0.5 ‰ should be considered for practical applications. For partitioning into chloroform, duplicate samples from Test 9 (Section 3.1.3) had δ13C values of -33.0‰ and -33.2‰, which are comparable to neat 1,4-dioxane (-33.3‰). The process involving partitioning into chloroform was not pursued for other reasons.
0 . 1 1 1 0 1 0 0
1 0 0 0
1 0 0 0 0
1 0 0 0 0 0
1 0 0 0 0 0
0
1 0 0 0 0 0
0 0
Concentration (µg/L)
-36
-34
-32
-30
δ 1 3 C
Equilibrium sorption, direct injection Test #9 Column (25), thermal desorption Equilibrium, thermal desorption

19
Initial, high-concentration equilibrium sorption tests demonstrated that 1,4-dioxane can be concentrated by loading onto A560 and then extracted with a small volume of acetone, with greater than 90% recovery of 1,4-dioxane in a single extraction step. Subsequent, low-concentration equilibrium sorption tests were conducted at concentrations of 1-10 µg/L 1,4-dioxane, as described in Section 3.1.4.3. Three of these samples had a δ13C value (-33.1‰, -33.1‰, and -33.9‰) which is similar to the δ13C value of neat 1,4-dioxane. Two of these samples had a slight isotopic enrichment compared to neat 1,4-dioxane, with δ13C values of -31.9‰ (SERDP-5-B) and -31.6‰ (SERDP-10-B); reasons for the enrichment are not known but may be related to an equipment malfunction since the SERDP-10-C sample could not be analyzed for that reason. To assess the possibility of fractionation associated with TD-GC-IRMS, the results of column Tests 10 and 12-14 (Section 3.1.3) and low-concentration equilibrium sorption tests (Section 3.1.4.3) were assessed. The mean δ13C value for these 11 tests, excluding duplicate samples, was -33.0‰. This value is like the value of the neat 1,4-dioxane (-33.3‰) used to prepare the aqueous solutions, indicating that fractionation did not occur with TD-GC-IRMS. The standard deviation of these tests was 0.74‰, which is slightly higher than the typical range for GC-IRMS (0.5‰). If the SERDP-5-B and SERDP-10-B samples are excluded from the group, the standard deviation is 0.48 ‰ and the average of the nine samples is -33.3‰. These values are within the range of CSIA and equal to the isotopic composition of the neat 1,4-dioxane standard, respectively. Of the tests described in Section 3.1, δ13C values were not obtained for multiple samples because there was not enough 1,4-dioxane mass to perform CSIA. The micro-column sorption with acetone elution (Tests 1-4) was unsuccessful because, at the injection volume of 2 µL, the amount of carbon available for analysis ranged only from 0.10 to 0.61 nmol. Column sorption with thermal recovery (Test 5) was unsuccessful because there was not sufficient 1,4-dioxane (1,080 µg/L) for direct injection, which requires 22,000 µg/L 1,4-dioxane; other methods, such as heated purge-and-trap or liquid:liquid extraction may have worked but were not pursued further because thermal desorption proved more successful at concentrating 1,4-dioxane. The acetone evaporation tests to concentrate 1,4-dioxane (Tests 6-8) were unsuccessful and therefore did not provide samples for CSIA. Tests 9, 10, and 12-14, which concentrated 1,4-dioxane by chloroform partitioning or thermal desorption, provided enough mass for CSIA and thermal desorption proved the most practical and effective method. 4.1.2 Stable Hydrogen Isotope Analysis of 1,4-Dioxane Quantification of the δD of neat 1,4-dioxane used to prepare the 1,4-dioxane solutions was determined by EA-IRMS to be -44.5‰. This 200 mg/L 1,4-dioxane solution was used in equilibrium tests described in Section 3.1.4.2. Table 6 provides a summary of the conditions and δD results for 1,4-dioxane. The mean δD values of the 200 mg/L solution of 1,4-dioxane after sorption onto various quantities of A560 and removal by thermal desorption was -44.6‰ with a standard deviation of 2.9‰. This value is quite similar to the δD value determined for neat 1,4-dioxane by EA-IRMS (-44.5‰); the standard deviation of 2.9‰ indicates better precision than is typical for hydrogen analysis by GC-IRMS (±5‰). These results indicate that hydrogen fractionation did not occur during loading of 1,4-dioxane onto the A560 and during recovery of 1,4-dioxane from A560 using thermal desorption.

20
Table 5: Summary of Stable Carbon Isotope Ratios for 1,4-Dioxane Aqueous Solutions
Description of Method Used to Prepare Sample
Aqueous 1,4-D (µg/L)
Aqueous Sample
Volume (L) Sample ID δ13C
(‰, VPDB)
Neat 1,4-dioxane -- -- Neat 1,4-dioxane -33.26
Equilibrium sorption tests conducted with high concentrations of 1,4-
dioxane, acetone extraction (Section 3.1.4.1) and 2 µL acetone extracts injected directly into GC-IRMS
(Section 3.2.1)
1,037,000 0.050
Vial 1 -34.11 Vial 1 duplicate -34.04
Vial 2 -33.70 Vial 3 -33.64
Vial 3 duplicate -33.57 Vial 4 -33.24 Vial 5 -33.42 Vial 6 -33.39
Vial 6 duplicate -33.84
mean: -33.66 standard deviation: 0.29
Column test with 25 g A560, acetone elution, partitioning 1,4-D into
chloroform, DI-GC-IRMS (Section 3.1.3).
9.0 5.0 Test 9 -33.04
Test 9 duplicate -33.15
mean: -33.10 standard deviation: 0.08
Column test with 25 g A560 or 0.3 g of A560 (Section 3.1.3) from column
loaded into thermal desorption tube for analysis by TD-GC-IRMS (Section
3.2.2).
9.0 5.0 Test 10 -33.21 Test 10 duplicate -33.29
1.2
47 Test 12 -33.86 Test 12 duplicate -33.69
44 Test 13 -33.77 Test 13 duplicate -33.53
48 Test 14 -33.21
mean: -33.51 standard deviation: 0.27
Equilibrium sorption tests conducted with low concentrations of 1,4-dioxane
and TD-GC-IRMS as described in Section 3.1.4.3 (Section 3.2.1)
1.0
0.040
SERDP-1-A -33.12 SERDP-1-B -33.06 SERDP-1-C NA
5.0 SERDP-5-A -33.91 SERDP-5-B -31.96 SERDP-5-C -32.62
10 SERDP-10-A -32.70 SERDP-10-B -31.62 SERDP-10-C NA
mean: -32.71 standard deviation: 0.76
Notes: NA = not analyzed. SERDP-1C did not have sufficient 1,4-dioxane for δ13C analysis. Instrument failure prevented the analysis of SERDP-10-C.

21
Table 6: Summary of Stable Hydrogen Isotope Ratios for 1,4-Dioxane Aqueous Solutions
Sample ID A560 dry weight (mg)
1,4-D Mass (µg)
1,4-D mass loaded on A560 (ng 1,4D/g)
δD (‰, VSMOW)
1 208.8 100 478,900 -48.3 2 208.7 100 479,200 -43.4 3 205.9 150 728,500 -44.9 4 283.5 50 176,400 -39.8
1A 115.8 25 215,900 -48.0 2A 121.4 20 164,700 -46.2 3A 73.3 16 218,300 -48.3 4A 151.3 14 92,500 -44.6 5A 114.5 12 104,800 -42.4 6A 100.7 10 99,300 -41.9 7A 91.9 5 54,400 -42.2
4.2 Microcosm Studies on Enrichment of Carbon and Hydrogen Isotope Ratios during
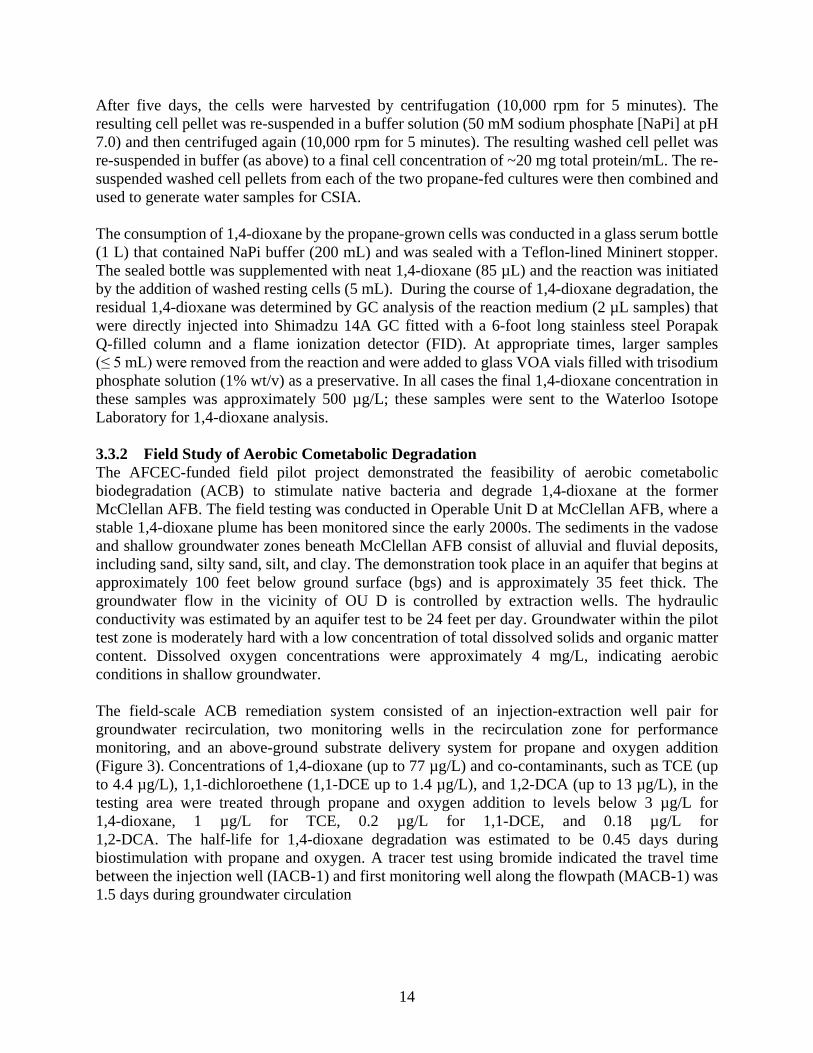
Aerobic Cometabolic Degradation of 1,4-Dioxane The 1,4-dioxane in water samples from the NCSU microcosms were analyzed for carbon and hydrogen isotope ratios at the Waterloo Isotope Laboratory by the protocols described above (Section 3.2.2 and 3.2.3, respectively). The stable isotope ratios for the microcosm tests are summarized in Table 7 and Figures 5 and 6. For some samples, a repeat measurement could be made and is included in Table 7 but not in Figures 5 and 6. For cell culture B, the Waterloo Isotope Laboratory could not analyze hydrogen isotope ratios because the hydrogen peak was too small for reliable hydrogen isotope analysis of 1,4-dioxane in this batch of samples; only the carbon isotope ratios were reported. No technical explanation was provided by the Waterloo Isotope Laboratory as to why hydrogen isotope ratios could not be reported in these samples even though the concentrations were similar to culture A samples. One possibility is that there was a problem with the dilution of the microcosm samples and the estimated concentration of 500 µg/L was not correct. Carbon and hydrogen isotope enrichment factors for 1,4-dioxane destruction via aerobic cometabolic degradation were calculated based on the slopes of the lines shown in Figure 5 (consistent with the Rayleigh enrichment trend). The value of enrichment factor calculated for carbon isotope fractionation (ɛC = -1.98‰) is similar to the ɛC value of -1.73 ± 0.14‰ reported by Pornwongthong et al., 2011 for direct aerobic oxidation of 1,4-dioxane by CB1190. The reproducibility of ɛC and linear increase in δ13C with logarithmic decrease in 1,4-dioxane concentration (Figure 5) demonstrates that carbon isotope enrichment can be used as an indication of 1,4-dioxane degradation and the relatively simple Raleigh model may be applied to interpret the enrichment trends. Figure 5 shows a much stronger enrichment trend for hydrogen compared to carbon, with ɛH=-25.6‰. Figure 6 includes a dual isotope plot of hydrogen versus carbon isotope ratios from the microcosm tests and shows that a linear relationship exists between carbon and hydrogen during aerobic cometabolic degradation of 1,4-dioxane; the slope of the best fit line is 12 and the

22
r-squared value is 0.92. Gray et al. (2002) reported a similar enrichment scenario for carbon and hydrogen isotopes during the aerobic biodegradation of MTBE. In summary, the microcosm studies provided an important foundation for assessing the behavior of stable carbon and hydrogen isotope ratios of 1,4-dioxane during aerobic cometabolic degradation. The Rayleigh model describes the enrichment trend for both isotopes such that enrichment factors were readily determined from the isotope results. Although the enrichment trend for carbon appears to be reproducible, an ɛC of -2‰ is relatively small, such that 50% degradation of 1,4-dioxane would only amount to an enrichment of 1.4‰. This small enrichment in 13C may be difficult to observe in the field given the possibility of larger variations in source isotopic composition. At 90% degradation, a carbon isotope enrichment of 4.6‰ is calculated from the Rayleigh equation for ɛC = -2‰; this larger enrichment may be observable in the field, provided that more studies on the variation of source isotopic composition of 1,4-dioxane are available. Much stronger enrichment was observed for hydrogen with δD values ranging from -45.9‰ to +75.3‰ (Table 7). Such strong enrichment could be readily observed in the field if biodegradation is occurring, however, the hydrogen isotopic composition of 1,4-dioxane needs further characterization. Based on this preliminary work, the dual isotope plot
Table 7: 1,4-Dioxane Concentrations and Stable Isotope Ratios for Microcosm Study
Time (hours)
1,4-dioxane
Fraction Remaining δ13C Repeat δ2H Repeat
μg/L f (%) VPDB ± 0.3‰ VSMOW ± 0.5‰ Microcosm A
0.0 440,000 100% -29.75 -29.65 -45.92 -45.16 4.4 300,000 68% -27.16 -27.16 6.32 -- 8.0 145,200 33% -26.68 -- 18.84 -- 13.0 52,800 12% -24.45 -24.71 27.02 -- 20.3 8,800 2% -20.48 -- 75.31 --
Microcosm B 0.0 440,000 100% -28.99 -- -- -- 2.0 308,000 70% -27.42 -27.27 -- -- 15.3 193,600 44% -27.07 -- -- -- 23.5 114,400 26% -25.39 -- -- -- 33.6 4,400 1% -20.13 -- -- --
Notes: Percentages indicate the relative amount of 1,4-dioxane remaining. -- = not analyzed.

23
Figure 5. Carbon and Hydrogen Enrichment Trends for Microcosm Samples. Rayleigh plots of δ13C (left) and δD (right) versus natural logarithm of the fraction of 1,4-dioxane concentration remaining in the microcosm (ln f). Stable carbon isotope results are for two cultures of Mycobacterium sp. 1A degrading 1,4-dioxane. Series A is shown in black dots and Series B in black circles. Linear best fit lines and equations are shown in each plot. The enrichment factor for carbon (ɛC) and hydrogen (ɛH) is the slope of each dashed line, -1.98 and -25.6‰, respectively.
Figure 6. Dual Isotope Plot of 1,4-Dioxane during Degradation in Microcosm A. may prove to be the most reliable method for demonstrating degradation of 1,4-dioxane in the field, where a linear increase in δD with δ13C values would provide compelling evidence for biodegradation. Additional microcosms are underway at NCSU and CSIA will be performed on samples from these new microcosms using the methods developed under this project.
0 -1 -2 -3 -4 -5ln f
-32
-28
-24
-20
-16δ 1
3 C
0 -1 -2 -3 -4ln f
-80
-40
0
40
80
δ D
y=-25.6x-22.2; R2=0.85y=-1.98x-28.7; R2=0.97
-36 -32 -28 -24 -20δ13C
-80
-40
0
40
80
δ D

24
4.3 Assessment of Carbon and Hydrogen Isotope Ratios during Aerobic Cometabolic Degradation of 1,4-Dioxane at the McClellan Air Force Base Pilot Test
CSIA was performed on groundwater samples from the recently-completed field pilot project entitled “Concurrent In-Situ Cometabolic Biodegradation of 1,4-Dioxane and Chlorinated Ethenes Using Recirculation”, funded by the Air Force Civil Engineer Center. These samples were collected to assess whether isotopic enrichment due to cometabolic biodegradation could be observed in groundwater samples. This would enable CSIA to be used to demonstrate degradation during natural and enhanced attenuation. Because these samples were obtained from an active groundwater circulation system, the dynamics of the system deserve consideration to interpret the results. Important considerations for groundwater samples from the locations shown in Figure 3 are as follows:
• Samples from IACB-1 are considered to provide representative starting isotope ratios for comparison with samples from MACB-1 and MACB-2. A tracer test has demonstrated that water injected at IACB-1 arrived at MACB-1 within 1.5 days; it is assumed that the background isotopic composition of 1,4-dioxane in the pilot test area does not change substantially in this timeframe.
• Groundwater extracted at MACB-3 and injected at IACB-1 is essentially the same groundwater but the samples labelled as IACB-1 may have been augmented with propane and/or oxygen. The samples identified as “IACB-1” are not actually pumped from the injection well IACB-1, instead, they are collected from a sampling valve at the wellhead of IACB-1, prior to water being introduced at IACB-1.
• Due to groundwater recirculation, approximately 70 - 75% of groundwater extracted at MACB-3 and injected at IACB-1 has passed through the treatment zone at least once. Although isotopic enrichment of 1,4-dioxane in extracted groundwater from treatment zone is expected due to ACB, enrichment is diminished due to the much lower concentrations of 1,4-dioxane treatment zone groundwater compared to groundwater entering the treatment zone for the first time.
• Because the pilot test wells are shallow water table wells and 1,4-dioxane may be present in the vadose zone at McClellan AFB, the potential for 1,4-dioxane vapor concentrations to influence groundwater concentrations and CSIA results cannot be ruled out.
The 1,4-dioxane in groundwater samples collected during five different sampling dates over various pilot test conditions and are summarized in Table 8. Figure 7 includes a dual isotope plot for the two sampling events during active degradation where carbon and hydrogen CSIA was performed. A description of the results from each is provided below. 4.3.1 Baseline Sampling Event: 11 September 2015 The baseline sampling event was performed before any propane and oxygen addition occurred to characterize the initial stable carbon and hydrogen isotope ratios of 1,4-dioxane before enrichment from enhanced biodegradation would be expected. As shown in Table 8, the concentrations of 1,4-dioxane, TCE, 1,1-DCE, and 1,2-DCA were similar in groundwater samples collected from all of the treatment zone wells (IACB-1, MACB-1, and MACB-2). Dissolved oxygen (DO) concentrations ranged from 4.50 to 4.89 mg/L, indicating natural aerobic conditions

25
Table 8: 1,4-Dioxane Concentrations and Stable Isotope Ratios for Pilot Test at McClellan AFB Sample Date Injection Monitoring Monitoring Extraction Monitoring
(system Analyte x = 0 feet x = 3 feet x = 7 feet x = 14 feet x = 21 feet operation) IACB-1 MACB-1 MACB-2 MACB-3 MW-10
DO (mg/L) 4.50 4.70 4.89 -- 2.11 9/11/2015 propane (μg/L) 0.36 0.13 J 0.16 J -- <0.009
1,4-D (μg/L) 56 57 57 -- 47 (Baseline, TCE (μg/L) 3.9 3.3 3.2 -- 4.1
groundwater 1,2-DCA (μg/L) 8.4 7.6 7.1 -- 11 circulation, 1,1-DCE (μg/L) 1.1 1.1 1.1 -- 1.2
2 gpm) δ13C (‰ VPDB) -29.8 -- -- -- -- δ2H (‰ VSMOW) -42.6 -- -- -- -- DO (mg/L) 3.30 1.26 1.24 3.44 --
12/7/2015 propane (μg/L) 11000 39 0.56 0.59 -- (Biostimulation, 1,4-D (μg/L) 26 3.6 4.2 -- --
C3H8 + O2, TCE (μg/L) 2.1 0.57 0.59 -- -- groundwater 1,2-DCA (μg/L) 3.9 <0.18 <0.18 -- -- circulation 1,1-DCE (μg/L) 0.4J <0.2 <0.2 -- -- at 2 gpm) δ13C (‰ VPDB) -- -- -31.1 -- --
δ2H (‰ VSMOW) -- -- -40.2 -- -- DO (mg/L) 9.83 0.62 0.82 3.11 --
12/11/2015 propane (μg/L) 9500 160 29 9 -- (Biostimulation, 1,4-D (μg/L) 26 4.7 3.4 -- --
C3H8 + O2, TCE (μg/L) 1.7 0.4 0.59 -- -- groundwater 1,2-DCA (μg/L) 3.2 <0.5 <0.5 -- -- circulation 1,1-DCE (μg/L) 0.3 <0.5 <0.5 -- -- at 2 gpm) δ13C (‰ VPDB) -33.7 -33.2 -30.2 -- --
δ2H (‰ VSMOW) -37.6 -33.1 -33.1 -- -- DO (mg/L) 1.14 0.52 0.38 0.99 --
2/12/2016 propane (μg/L) 3400 15000 7200 4000 -- (Inhibition, 1,4-D (μg/L) 29 16 9.3 -- -- C3H8 only, TCE (μg/L) 2.3 0.99 0.98 -- --
groundwater 1,2-DCA (μg/L) 4.6 2.1 0.95 -- -- circulation 1,1-DCE (μg/L) 0.44 <0.5 <0.5 -- --
0.6 - 1.5 gpm) δ13C (‰ VPDB) -30.1 -32.6 -30.4 -- δ2H (‰ VSMOW) -- -- -- -- -- DO (mg/L) 7.30 5.65 4.06 6.80 --
6/2/2016 propane (μg/L) 560 0.042 J 0.027 J 0.0088 J -- (Biostimulation, 1,4-D (μg/L) 24 0.68 0.82 -- 44*
C3H8 + O2, TCE (μg/L) 2.1 0.49 J 0.47 J -- 2.9* groundwater 1,2-DCA (μg/L) 3.3 <0.18 <0.18 -- 7.6* circulation 1,1-DCE (μg/L) 0.45 J <0.2 <0.2 -- <0.2* at 1.9 gpm) δ13C (‰ VPDB) -28.9 -25.4 -24.1 -28.3 -28.6
δ2H (‰ VSMOW) -88.8 -6.4 -23.3 -89.3 -63.2 *sampled on 6/9/2016
in the zone of groundwater recirculation (treatment zone). Monitoring well MW-10 may be outside of the zone of recirculation, so 1,4-dioxane and VOC concentrations are slightly different at this location and DO was lower (2.1 mg/L). The δ13C and δD values for the groundwater sample

26
collected from IACB-1 on 11 September 2015 were reported as -29.8‰ and -42.6‰, respectively. These values are representative of 1,4-dioxane in groundwater at McClellan AFB prior to biodegradation. 4.3.2 First Biostimulation Phase: 7 and 11 December 2015 The first biostimulation phase of the pilot test began in late September 2015 by pulsing propane and oxygen into the groundwater extracted from MACB-3 with continued injection at IACB-1; this phase continued through the end of January 2016. Groundwater samples for CSIA on 1,4-dioxane were collected from MACB-2 on 7 December 2015 and from IACB-1, MACB-1, and MACB-2 on 11 December 2015. During this time period, DO and propane concentrations varied due to the pulsed injection, but the consumption of both DO and propane is evident from the lower concentrations at MACB-1 and MACB-2, located three and seven feet downgradient of injection, respectively (Table 8). The biostimulation resulted in approximately one order of magnitude decrease in 1,4-dioxane concentrations at MACB-1 and MACB-2, concurrent with decreases in TCE, 1,2-DCA, and 1,1-DCE (Table 8). The δ13C and δD values for the groundwater samples collected on 7 December and 11 December 2015 are interpreted as follows: The δ13C value for IACB-1 (-33.7‰) is depleted in 13C relative to the baseline sample and
has a slightly higher δD. This suggests that variability in the isotopic composition of 1,4-dioxane exists in the pilot test area, which can complicate interpretation of CSIA.
The δ13C values for MACB-1 (-33.2‰) and MACB-2 (-31.1‰ and -30.2‰) are enriched in 13C relative to IACB-1 (-33.7‰). This 13C enrichment may be consistent with biodegradation as follows:
– The concentration at MACB-2 (3.4 µg/L on 11 December) represents 13% of the injected 1,4-dioxane concentration at IACB-1 (26 µg/L on 7 December and 11 December).
– If the 87% concentration decrease at MACB-2 were attributed to ACB with ɛC = -2‰ (consistent with the microcosms with Mycobacterium 1A), then the δ13C value would be -29.7‰ (based on the Rayleigh equation), which is comparable to the measured -30.2‰.
– The concentration at MACB-1 is similar to MACB-2 but the 13C-enrichment was much smaller. It is possible that mixing of “non-degraded 1,4-dioxane” masked the enrichment from degradation at MACB-1, where certain flow lines captured by MACB-1 during sampling were not within the influence of propane and oxygen addition. Although this process is believed to be important in obscuring isotopic enrichment trends (US EPA, 2008), it is difficult to prove it had occurred.
The δD values for MACB-1 (-33.1‰) and MACB-2 (-33.1‰) are only slightly enriched relative to IACB-1 (-37.6‰). Based on the dual isotope plot shown in Figure 6, the D enrichment is expected to be 12 times greater than the observed 13C enrichment in the same samples (e.g., D enrichment at MACB-2 would be more than 40‰ resulting δD value greater than 0‰ (Figure 7). Therefore, these δD values are not indicative of biodegradation.
Although 1,4-dioxane degradation was certainly occurring based on the concentration data, it is difficult to prove that the 13C-enrichment at MACB-1 and MACB-2 is only due to biodegradation given the variability in the isotopic composition of 1,4-dioxane at IACB-1 and small D enrichment.

27
4.3.3 Propane Inhibition Phase: 12 February 2016 The propane inhibition phase of the pilot test ran from 29 January to 12 February 2016. This phase involved pulsing propane only (no oxygen addition) into the groundwater extracted from MACB-3 with continued injection at IACB-1. During this time, propane concentrations overwhelmed the treatment zone and drove redox conditions towards anoxic (Table 8), while biofilms developed leading to declining recirculation rates (0.6 gpm). Concentrations of 1,4-dioxane increased to approximately 30% to 50% of injected concentrations by the end of the inhibition phase (Table 8). The δ13C values ranged from -32.6‰ (MACB-1) to -30.1‰ (IACB-1). During propane inhibition, the δ13C value for IACB-1 was higher than MACB-1 and MACB-2, which is the opposite pattern observed for the biostimulation phase. This is consistent with the decreased rate of 1,4-dioxane degradation due to propane inhibition. 4.3.4 Second Biostimulation Phase: 2 June 2016 The second biostimulation phase of the pilot test ran from 5 May to 13 June 2016. It was similar in operation to the first phase and followed a six-week long “starvation period” where only groundwater circulation occurred with no propane or oxygen addition. Groundwater samples for CSIA on 1,4-dioxane were collected from IACB-1, MACB-1, MACB-2, MACB-3, and MW-10 on 2 June 2016. During this time period, injected DO and propane concentrations varied due to the pulsed injection, the consumption of propane is evident from the lower concentrations at MACB-1 and MACB-2; DO concentrations remained above 3 mg/L, indicating aerobic conditions throughout the treatment zone (Table 8). The treatment efficiency was similar in the second biostimulation phase compared to the first phase (approximately 90 to 95%) (Haley & Aldrich, 2016). The decrease (relative to IACB-1) in 1,4-dioxane concentrations at MACB-1 and MACB-2, concurrent with decreases in TCE, 1,2-DCA, and 1,1-DCE documents the effects of aerobic cometabolic degradation (Table 8). The δ13C and δD values for the groundwater samples collected on 2 June 2016 are interpreted as follows: The sample from MACB-3 is essentially a duplicate sample of IACB-1 and reported very
similar δ13C and δD values as IACB-1, thereby documenting the reproducibility of the CSIA method.
The δ13C value for IACB-1 (-28.9‰) is slightly enriched in 13C relative to the baseline sample (-29.8‰) but depleted in D (δD = -88.8‰ in 2 June sample versus -42.6‰ in the baseline sample; Table 8).
The concentrations reported for MACB-1 (0.68 µg/L) and MACB-2 (0.82 µg/L) are below the demonstrated range of applicability of the CSIA method. However, these reported concentrations are from separate samples collected on the same day but different times and may not represent the concentration of the actual samples analyzed by CSIA. The Waterloo Isotope Laboratory was able to analyze the samples from MACB-1 and MACB-2 with sufficient confidence to report the results (peak area greater than 0.5 volts), so the results are considered valid and useable. Groundwater samples collected on 27 May and 9 June 2016 (the closest sampling dates bracketing 2 June) ranged from 1.3 to 1.8 µg/L; it is possible that the 1,4-dioxane concentrations in MACB-1 and MACB-2 samples were in the 1 to 2 µg/L range.
28
The δ13C values for MACB-1 (-25.4‰) and MACB-2 (-24.1‰) are enriched in 13C relative to IACB-1 (-28.9‰). This 13C enrichment may be consistent with biodegradation as follows:
– The δ13C values are sufficiently enriched beyond the range that can be attributed to variation in source isotopic composition.
– If the ~95% concentration decrease at MACB-1 and MACB-2 were attributed to ACB with ɛC = -2 ‰ (consistent with the microcosms with Mycobacterium 1A), then the δ13C value would be -22.9‰ (based on the Rayleigh equation), which is reasonably close to the measured values of -25.4‰ and -24.1‰, respectively, considering it is possible that mixing of “non-degraded 1,4-dioxane” could obscure some of the enrichment signal.
The δD values for MACB-1 (-6.4‰) and MACB-2 (-23.3‰) are strongly enriched in D relative to IACB-1 (-88.8‰). Based on the dual isotope plot shown in Figure 6, the D enrichment is consistent with the expected enrichment trend for carbon and hydrogen isotope ratios (Figure 7). Therefore, these δD values appear to be indicative of biodegradation.
The CSIA of 1,4-dioxane in groundwater samples collected from this second biostimulation phase showed a carbon and hydrogen isotope enrichment trend that is similar to the trend observed in the microcosm study.
Figure 7. Dual Isotope Plot of 1,4-Dioxane during Degradation in Pilot Test. Open circles represent 11 December 2015 samples; closed circles represent 2 June 2016 samples. The dashed arrow indicates the general enrichment trend expected for aerobic cometabolic degradation based on the microcosm test (Figure 6). Labels designate sample locations from pilot test wells shown in Figure 3 using data shown in Table 8.

29
4.4 Preliminary Assessment of the Isotopic Composition of 1,4-Dioxane at Field Sites A common method for demonstrating biodegradation using CSIA is to document an increase in δ13C and/or δD beyond the known range in isotopic composition of the source material. The range of starting isotopic compositions of neat 1,4-dioxane has just begun to be investigated. Based on isotopic characterization of seven different 1,4-dioxane sources, Wang (2016) reported the following isotopic compositions for 1,4-dioxane:
– δ13C: from -34 to -29‰ (a 5‰ range) – δD: from -150‰ to -90‰ (a 60‰ range)
The δ13C and δD for neat 1,4-dioxane analyzed for this study by EA-IRMS is -33.3‰ and -44.5‰, respectively. This extends the range in hydrogen isotopic composition of 1,4-dioxane to -150‰ and -44.5‰, a difference of more than 105.5‰. Given the wide range in isotopic composition of undegraded (i.e., source) 1,4-dioxane, it is challenging to demonstrate biodegradation of 1,4-dioxane based on an increase in δ13C and/or δD for a limited number of samples. A dual-isotope approach with multiple samples plotted along an enrichment trend, similar to that shown in Figure 6, is more likely to provide compelling evidence for the biodegradation of 1,4-dioxane. The variation in isotopic composition at different field sites is described below. 4.4.1 McClellan Air Force Base Section 4.3 describes the CSIA results from the ACB pilot test at the McClellan AFB which seem to show the isotopic composition of 1,4-dioxane at the site is quite variable. As discussed in Section 4.3, and shown in Table 8, the results from IACB-1 and MW-10 (samples from outside of the biostimulation zone) provide additional documentation of variability in the isotopic composition of 1,4-dioxane in groundwater at the McClellan AFB, where the reported range (including previous samples from IACB-1) is as follows:
– δ13C: from -33.7 to -28.3‰ (a 5.4‰ range) – δD: from -89.3‰ to -37.6‰ (a 51.7‰ range)
This variability is similar to the reported range of isotopic composition of neat 1,4-dioxane and contrasts with the conventional thinking of a unique site “isotopic fingerprint.” Such variability indicates that characterization of the spatial and temporal isotopic composition of 1,4-dioxane at certain sites may require the analysis of several samples in source areas. 4.4.2 Vandenberg Air Force Base Site 24 The δ13C and δD values for the two monitoring wells sampled at Site 24 are reported in Table 10. The δ13C for 24-MW-34B (-27.3‰), reportedly influenced by the biosparge pilot test, is enriched in 13C by 2.4‰ relative to 24-PMW-01R (-29.7‰). It is possible that the higher δ13C for 24-MW-34B reflects enrichment in 13C due to biodegradation, but without knowledge of the starting isotopic composition of 1,4-dioxane, it is difficult to conclude whether the δ13C and δD values can indicate degradation or simply variation in isotopic composition. A second phase of propane biosparging began by injection of propane within 20 feet of 24-MW-34B beginning on 1 December 2015 (Bell et al., 2016). Follow-up CSIA at 24-MW-34B may be useful for assessing whether isotopic enrichment can provide a line of evidence to support aerobic cometabolic biodegradation at Site 24.
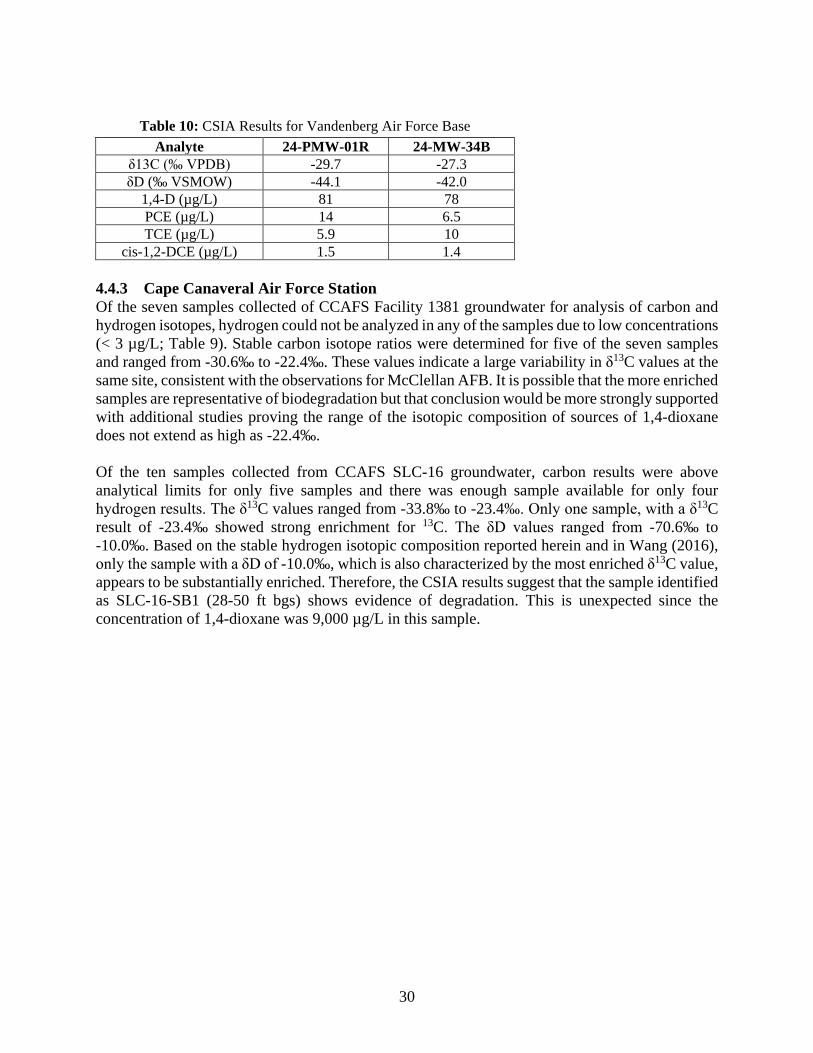
30
Table 10: CSIA Results for Vandenberg Air Force Base
Analyte 24-PMW-01R 24-MW-34B δ13C (‰ VPDB) -29.7 -27.3 δD (‰ VSMOW) -44.1 -42.0
1,4-D (µg/L) 81 78 PCE (µg/L) 14 6.5 TCE (µg/L) 5.9 10
cis-1,2-DCE (µg/L) 1.5 1.4 4.4.3 Cape Canaveral Air Force Station Of the seven samples collected of CCAFS Facility 1381 groundwater for analysis of carbon and hydrogen isotopes, hydrogen could not be analyzed in any of the samples due to low concentrations (< 3 µg/L; Table 9). Stable carbon isotope ratios were determined for five of the seven samples and ranged from -30.6‰ to -22.4‰. These values indicate a large variability in δ13C values at the same site, consistent with the observations for McClellan AFB. It is possible that the more enriched samples are representative of biodegradation but that conclusion would be more strongly supported with additional studies proving the range of the isotopic composition of sources of 1,4-dioxane does not extend as high as -22.4‰. Of the ten samples collected from CCAFS SLC-16 groundwater, carbon results were above analytical limits for only five samples and there was enough sample available for only four hydrogen results. The δ13C values ranged from -33.8‰ to -23.4‰. Only one sample, with a δ13C result of -23.4‰ showed strong enrichment for 13C. The δD values ranged from -70.6‰ to -10.0‰. Based on the stable hydrogen isotopic composition reported herein and in Wang (2016), only the sample with a δD of -10.0‰, which is also characterized by the most enriched δ13C value, appears to be substantially enriched. Therefore, the CSIA results suggest that the sample identified as SLC-16-SB1 (28-50 ft bgs) shows evidence of degradation. This is unexpected since the concentration of 1,4-dioxane was 9,000 µg/L in this sample.

31
Table 9: CSIA Results for Cape Canaveral Air Force Station
Date Sample 1,4-dioxane (mg/L)
δ13C (‰ VPDB)
δD (‰ VSMOW)
5/12/2016 1381-SB1 (50-52') <0.003 -25.54 -- 5/13/2016 1381-SB2 (50-52') <0.003 -22.39 -- 5/13/2016 1381-SB3 (44-46') <0.003 -24.53 -- 5/13/2016 1381-SB4 (45-47') <0.003 -24.37 -- 5/20/2016 1381-SB1 (52-54') <0.003 BAL -- 5/20/2016 1381-SB2 (52-54') <0.003 BAL -- 5/20/2016 1381-SB3 (48-50') <0.003 -30.61 -- 5/16/2016 SLC16-SB1 (40-42') 17.2 -30.85 -43.62 5/16/2016 SLC16-SB1 (48-50') 9.0 -23.39 -9.97 5/17/2016 SLC16-SB2 (40-42') 1.75 J -31.21 -70.61 5/17/2016 SLC16-SB2 (48-50') 1.82 J -32.06 -66.70 5/17/2016 SLC16-SB4 (40-42') <0.003 BAL -- 5/17/2016 SLC16-SB4 (45-47') <0.003 BAL -- 5/18/2016 SLC16-SB3 (40-42') <0.003 BAL -- 5/18/2016 SLC16-SB3 (46-48') 0.00173 J BAL -- 5/18/2016 SLC16-SB5 (35-27') <0.003 -33.80 -- 5/18/2016 SLC16-SB5 (53-55') <0.003 BAL --
Notes: J = concentration below the reporting limit but above the detection limit. BAL = below analytical limit. -- = not analyzed.
4.4.4 Discussion of the Isotopic Composition of 1,4-Dioxane at Field Sites Utilizing CSIA effectively requires comparison between the isotopic composition of the source material and the sample. For 1,4-dioxane, the variability in both source material and samples has yet to be well documented. The isotopic compositions of 1,4-dioxane from groundwater samples from McClellan AFB, Vandenberg AFB Site 24, and CCAFS were outside of the current published isotopic composition of neat 1,4-dioxane, which suggests that biodegradation of 1,4-dioxane has occurred at these sites. Stronger conclusions could be made if the data could be compared to a more comprehensive database of source 1,4-dioxane isotopic composition. Using the method developed herein, further investigation of the stable carbon and hydrogen isotope ratios of neat 1,4-dioxane from different manufacturers would expand the current database and improve the ability of practitioners to draw conclusions about 1,4-dioxane degradation. Some variability is to be expected for CSIA results. Multiple factors could have contributed to the results from McClellan AFB and CCAFS 1381 having greater variability than expected. At McClellan AFB, Operable Unit D served as a maintenance depot for over sixty years, which could have resulted in multiple different sources and manufacturers of 1,4-dioxane being released over time. Due to the recirculation system at McClellan AFB, it is possible that mixing of degraded and undegraded 1,4-dioxane also produced more variability in isotopic values. Similarly, at CCAFS 1381, multiple different remediation methods had been implemented that could have impacted the stable isotope signal. Finally, 1,4-dioxane may have been present in the vadose zone at McClellan

32
AFB; the possibility of undegraded 1,4-dioxane from vapor influencing the stable isotopic values of 1,4-dioxane in groundwater cannot be ruled out. The major lesson learned from performing CSIA on groundwater samples at the limited number of field sites discussed herein is that large variations in isotopic composition of 1,4-dioxane in groundwater at a single site can be comparable to the range in isotopic composition of source 1,4-dioxane. This complicates the interpretation of CSIA results for small datasets because spatial and/or temporal differences in isotopic composition of 1,4-dioxane in groundwater may be solely attributed to variation in isotopic composition of the parent (i.e., initial undegraded source) 1,4-dioxane. The dual-isotope approach to document biodegradation trends remains a powerful line of evidence for documenting biodegradation of 1,4-dioxane provided 1) a sufficient number of samples can be analyzed for both isotopes and 2) the samples are taken from areas that represent a progression of biodegradation (e.g., no biodegradation, 25%, 50%, and 90% biodegradation, etc.). This condition may be difficult to meet at some or many sites. The utility of the approach needs further exploration through additional characterization of the source isotopic composition of 1,4-dioxane and further case studies on the stable isotopic composition of 1,4-dioxane in groundwater. 5. CONCLUSIONS AND IMPLICATIONS FOR FUTURE RESEARCH
This research has met the primary objective of developing a method to perform CSIA on low concentrations of 1,4-dioxane (e.g. 1 µg/L) in groundwater. Several different methods were tested to concentrate 1,4-dioxane and equilibrium sorption coupled with thermal desorption was found to be the most effective without imparting a noticeable isotopic fractionation. A summary of the method is provided as Appendix A. A second objective of this work was to assess whether CSIA would be useful for assessing the biodegradation of 1,4-dioxane at field sites, and potentially support MNA programs or remedial effectiveness evaluations. This goal has also been accomplished. CSIA conducted on microcosm samples demonstrated conclusively that stable carbon and hydrogen isotope ratios are influenced by the aerobic cometabolic biodegradation of 1,4-dioxane; the carbon and hydrogen isotope enrichment factors for aerobic cometabolic degradation were determined to be approximately -2.0‰ and -26‰, respectively. These results show a promising application of the dual isotope approach to evaluate biodegradation of 1,4-dioxane in groundwater. Evaluation of the enrichment factors for different microbial communities will strength the application of the dual isotope approach. The use of stable carbon and hydrogen isotope ratios as tools to evaluate biodegradation of 1,4-dioxane was demonstrated to be viable, however, significant variations in the isotopic composition of 1,4-dioxane were observed at all four DoD field sites. This variation may complicate the interpretation of enrichment trends because the starting isotopic composition of 1,4-dioxane may be difficult to ascertain. As the CSIA database for 1,4-dioxane grows, the application of CSIA towards assessing the origin and fate of 1,4-dioxane will become stronger. 5.1 Technology Transfer The method reported herein may be implemented by isotope laboratories that possess the capability to perform limited wet chemistry and have access to GC-IRMS. A relatively small volume of a

33
groundwater sample (40 mL) is required for use with A560 resin to concentrate 1,4-dioxane, making this method accessible for standard groundwater sampling events. It may be possible to perform CSIA using this method at 1,4-dioxane aqueous concentrations lower than 1 µg/L by using larger sample volumes, however, this has not yet been tested. To facilitate technology transfer, a summary of the method is provided as Appendix A. The project team has been collaborating with Dr. Michael Hyman at NCSU and plans to publish a manuscript on the carbon and hydrogen isotope enrichment of 1,4-dioxane during aerobic cometabolic degradation. 5.2 Next Steps and Objectives for Follow-On Future Research There are two research objectives that deserve further investigation:
1. Additional case studies on the isotopic composition of 1,4-dioxane at field sites and 2. Further exploration of isotopic composition of different 1,4-dioxane sources.
5.2.1 Next Steps for Further Development of the Analytical Method The following next steps are recommended for further development of the analytical method:
1. Method verification with other isotope laboratories: This would involve collaboration with other isotope laboratories to facilitate technology transfer. There is a great deal of interest in the application of CSIA towards 1,4-dioxane, however, currently available methods for performing CSIA on 1,4-dioxane appear to be far more labor intensive and require much larger sample volume compared to the method developed herein.
2. Development of passive sorbent samplers for soil, water and air. This effort would involve developing a semi-permeable housing for A560 that could be suspended in a monitoring well, vapor probe or placed in a soil sample container for concentration of 1,4-dioxane or other chemical for subsequent CSIA. The method would be validated in the laboratory and then proven through a series of field trials.
5.2.2 Next Steps for Further Evaluation of Isotopic Enrichment in 1,4-Dioxane Future CSIA work on 1,4-dioxane should applying the method developed herein to help determine which specific enzyme system is responsible for aerobic cometabolic degradation of 1,4-dioxane. This could be elucidated through microcosm studies using known 1,4-dioxane degraders, Rhodococcus rhodochrous ATCC 21198 and Pseudonocardia sp. K1 and this research follows on from SERDP project ER-2303, Evaluation of Branched Hydrocarbons as Stimulants for In Situ Cometabolic Biodegradation of 1,4-Dioxane and Its Associated Co-Contaminants. Broader characterization of the isotopic characterization of 1,4-dioxane sources and in groundwater samples would provide a much needed data-based foundation for application of 1,4-dioxane. Application of CSIA towards 1,4-dioxane at additional sites undergoing in situ remediation would prove invaluable for further understanding of isotopic fractionation during 1,4-dioxane degradation. Therefore, the proposed next steps involve:
1. Continued collaboration with Dr. Michael Hyman to perform CSIA on samples from microcosms with different cultures and degradation scenarios, and
2. Analysis of groundwater samples from other DoD sites where in situ remediation of 1,4-dioxane is ongoing.

34
LITERATURE CITED
Abe, Y., and D. Hunkeler. 2006. Does the Rayleigh equation apply to evaluate field isotope data in contaminant hydrogeology? Environmental Science & Technology, 40, 101-107
Adamson, D. T., R. H. Anderson, S. Mahendra, and C. J. Newell. 2015. Evidence of 1,4-dioxane attenuation at groundwater sites contaminated with chlorinated solvents and 1,4-dioxane, Environmental Science & Technology, 49(11), 6510-6518.
Bell, C., J. McDonough, K.S. Houston, and K. Gerber. 2016. Stable Isotope Probing to Confirm Field-Scale Co-Metabolic Biodegradation of 1,4-Dioxane, Remediation, Winter 2016, 47-59.
Chiang, D., R. Mora, W. Diguiseppi, G. Davis, K. Sublette, P. Gedalanga, and S. Mahendra. 2012. Characterizing the intrinsic bioremediation potential of 1,4-dioxane and trichloroethene using innovative environmental diagnostic tools, Journal of Environmental Monitoring, 14, 2317-2326.
Duncan, B. D, E. Vavricka, and R. Morrison. 2004. A forensic overview of 1,4-dioxane, Environmental Claims Journal, 16, 69-79.
Fischer, A., K. Theuerkorn, N. Stelzer, M.Gehre, M. Thullner, and H.H. Richnow. 2007. Applicability of stable isotope fractionation analysis for the characterization of benzene biodegradation in a BTEX-contaminated aquifer, Environmental Science & Technology, 41(8), 3689-3696.
Gray, J.R., G. Lacrampe-Couloume, D. Gandhi, K.M. Scow, R.D. Wilson, D. M. Mackay and B. Sherwood-Lollar. 2002. Carbon and hydrogen isotopic fractionation during biodegradation of methyl tert-butyl ether, Environmental Science & Technology, 36, 1931-1938.
Haley & Aldrich, Inc., 2016. Draft Project Completion Technical Report, Concurrent In-Situ Cometabolic Biodegradation of 1,4-Dioxane and Chlorinated Ethenes Using Groundwater Recirculation, AFCEC Contract FA8903-13-C-0002.
Hunkeler, D., and S. Bernasconi. 2010. Analysis of Stable Isotopes. In C. M. Aelion, P. Hohener, D. Hunkeler, and R. Aravena (Eds.), Environmental Isotopes in Biodegradation and Bioremediation (pp. 23-42). Boca Raton, FL: CRC Press.
Kolhatkar, R., T. Kuder, P. Philp, J. Allen, and J. T. Wilson. 2002. Use of compound-specific stable carbon isotope analyses to demonstrate anaerobic biodegradation of MTBE in groundwater at a gasoline release site. Environmental Science & Technology, 36(23), 5139-5146.
Kuder, T., J. T. Wilson, P. Kaiser, R. Kolhatkar, P. Philp, and J. Allen. 2005. Enrichment of stable carbon and hydrogen isotopes during anaerobic biodegradation of MTBE: Microcosm and field evidence, Environmental Science & Technology, 39(1), 213-220.
Jendrzejewski, N., H.G. M. Eggenkamp, and M. L. Coleman. 2001. Characterization of chlorinated hydrocarbons from chlorine and carbon isotopic compositions: Scope of application to environmental problems, Applied Geochemistry, 16(9-10), 1021-1031.

35
Lesser., L.E., P.C. Johnson, R. Aravena, G. Spinnler, and C. Bruce. 2008. Assessing stable isotope techniques as diagnostic tools to evaluate aerobic MTBE biodegradation at Port Hueneme, CA. Environmental Science & Technology, 42(17), 6637-6643.
LITERATURE CITED (cont’d)
Li, M., J. Mathieu, Y. Liu, E. Tess Van Orden, Y. Yang, S. Fiorenza, and P. Alvarez. 2014. The Abundance of Tetrahydrofuran/Dioxane Monooxygenase Genes (thmA/dxmA) and 1,4-Dioxane Degradation Activity Are Significantly Correlated at Various Impacted Aquifers, Environmental Science & Technology Letters, 1(1), 122-127.
Lippincott, D., S.H. Streger, C.E. Schaefer, J. Hinkle, J. Stormo, and R.J. Steffan. 2015. Bioaugmentation and Propane Biosparging for In Situ Biodegradation of 1,4-Dioxane, Groundwater Monitoring & Remediation, 35(2), 81-92.
National Research Council (NRC). 2013. Alternatives for Managing the Nation’s Complex Contaminated Groundwater Sites. Washington, DC: The National Academies Press.
Mohr, T. K., W. H. DiGuiseppi, and J.A. Stickney. 2010. Environmental Investigation and Remediation: 1,4-Dioxane and other Solvent Stabilizers. Boca Raton, FL: CRC Press.
Pornwongthong, P., G. Paradis, and S. Mahendra. 2011. Stable Carbon Isotope Fractionation During 1,4-Dioxane Biodegradation. Proceedings of the Water Environment Federation, WEFTEC, 111-116.
Thullner, M., F. Centler, H.H. Richnow, and A. Fischer. 2012. Quantification of organic pollutant degradation in contaminated aquifers using compound specific stable isotope analysis – Review of recent developments, Organic Geogeochemistry, 42, 1440-1460.
USEPA. 2008. A Guide for Assessing Biodegradation and Source Identification of Organic Ground Water Contaminants using Compound Specific Isotope Analysis (CSIA). EPA 600/R-08/148.
Wang, Y., 2016. Breakthrough in 2D-CSIA Technology for 1,4-Dioxane, Remediation, Winter 2016, 61-70.
Wilson, J.T., P.M. Kaiser, and C.J. Adair. 2005. Monitored Natural Attenuation of MTBE as a Risk Management Option at Leaking Underground Storage Sites.
Zwank, L., M. Berg, M. Elsner, T. C. Schmidt, R. P. Schwarzenbach, and S. B. Haderlein. 2005. New evaluation scheme for two-dimensional isotope analysis to decipher biodegradation processes: application to groundwater contamination by MTBE, Environmental Science & Technology, 39(4), 1018-1029.
\\haleyaldrich.com\share\oak_common\41703 SERDP 1,4-D CSIA\Report\SERDP ER2535-Final Report_26Jan2018.docx

36
APPENDIX A: METHOD SUMMARY
This Appendix was prepared to describe the method for performing Compound Specific Isotope Analysis (stable carbon and hydrogen isotope ratios) on dilute aqueous 1,4-dioxane. The method may have applicability towards other aqueous organic solutes and/or other media (e.g. soil and vapor) but such methods have not been validated as part of this project.
1.0 Considerations for Water Sample Collection and Preservation There are no specific groundwater sampling requirements or preservatives associated with this method; the sample collection and preservation method may be based on existing site-specific sampling protocols for quantifying 1,4-dioxane concentrations in groundwater and include placing the samples in an ice-filled cooler for shipment to the isotope laboratory. It is advised to keep samples under refrigeration (e.g. 4 degrees Celsius) until extraction of 1,4-dioxane. A minimum of 40 mL of sample is recommended for 1,4-dioxane concentrations as low as 1 µg/L because that is the lower limit evaluated to date. It is recommended to include additional sample bottles (e.g. 40 mL glass volatile organic analysis vials with TeflonTM-lined septa [VOA]) of this size for shipment to the isotope laboratory. The samples should be placed on ice at the time of collection and shipped to the isotope laboratory under established chain of custody procedures. Samples expected to have high biological activity (e.g. from microcosm tests) are recommended to be preserved immediately after sampling to cease biological activity. For the microcosm tests performed in this study, trisodium phosphate was used as a preservative at a concentration of 1 percent by weight.
2.0 Preparation of AMBERSORBTM 560 AMBERSORBTM 560 (A560) is an engineered carbonaceous adsorbent produced from the pyrolysis and of a synthetic polymeric material in an inert atmosphere. The chemical composition, pore structure, physical form and surface chemistry of A560 provides higher sorption capacity for 1,4-dioxane compared to activated carbon. Since A560 is such a strong adsorbent, it readily adsorbs organic chemicals from air. Steam cleaning is recommended to avoid having high levels of background contaminants in the sample. After steam cleaning A560, is should be immediately place in a sealed container to avoid additional exposure to atmospheric contaminants. Below are the recommended procedures to prepare A560 for 1,4-dioxane CSIA.
1. Place 100 milliliters (mL) of A560 and 100 mL of deionized (DI) water DI in a 500 mL Buchner flask.
2. Apply a vacuum to the flask, for 30 minutes, to remove air entrained within adsorbent pores.
3. Transfer partially hydrated adsorbent to a glass or stainless steel chromatograph column fitted with stopcock valves at each end (nominal diameter of 1-inch and length of 12 inches works well).

37
4. Wrap column with mineral wool pipe insulation. 5. Pass saturated steam at 10 to 15 pounds per square inch (gauge; psig) through the column
to produce condensate at a rate of one bed volume per hour (e.g. 100 mL/hour or 1.7 mL/minute), for a minimum of 2 hours.
6. Close valve from steam source to column. 7. When 0 psig is achieved in the column, close valves at top and bottom of column. 8. Remove insulation. 9. After column has cooled for 15 minutes, attach a DI water reservoir to the column at the
top of the valve. 10. Open top valve. Cooling of the column contents will pull DI water into the column. 11. When vacuum filling has stopped, open bottom valve. 12. Allow DI water to flow through the column until the temperature of the water exiting the
column is equal to ambient temperature. 13. Transfer the steam cleaned and fully hydrated adsorbent to a Buchner funnel and fill to the
top of the funnel with DI water. 14. Allow the water to fully drain (without vacuum). 15. Apply a vacuum to the Buchner funnel for 2 minutes. 16. Remove adsorbent from the Buchner funnel and place into a glass jar (e.g. 250 mL) with a
Teflon lined lid. 17. The percent weight composition of the hydrated A560 will be approximately 60 percent
A560 and 40 percent water.
3.0 Extraction of 1,4-Dioxane (Loading onto AMBERSORB 560TM) Extraction of dilute aqueous phase 1,4-dioxane involves placing a quantity of A560 beads in the 1,4-dioxane water sample for sufficient time for most of the aqueous 1,4-dioxane to sorb onto the A560. The mass of A560 for this work was typically 0.5 grams (wet) since this was the maximum amount that could fit into the thermal desorption tube; the volume of aqueous sample used was 40 mL. A sorption study was conducted at different temperatures (4 ºC and 21 ºC) with 0.5 grams of A560 in contact with 40 mL of 8.9 micrograms per liter (µg/L) and 94 µg/L of aqueous 1,4-dioxane (Figure 1). The study showed 1,4-dioxane was extracted from these solutions to greater than 99% within 48 hours and transferred onto A560 at 21 ºC with sample agitation on a rotary mixer. The procedure for aqueous sample extraction is provided in subsection 3.1. For dilute samples, it is recommended that the ratio of aqueous sample volume to A560 mass be maximized to the extent practical as this will increase the concentration of 1,4-dioxane on the A560 and increase the signal strength for gas chromatography – isotope ratio mass spectrometry (GC-IRMS). It is recommended that a new sorption study be conducted if the A560 mass and/or aqueous sample volume to be used for extraction is substantially different than 0.5 grams and 40 mL, respectively.

38
Figure 1. Sorption study using 0.5 grams of hydrated A560 in contact with 40 mL of aqueous 1,4-dioxane at concentrations of 8.9 µg/L and 94 µg/L, at temperatures of 4 ºC and 21 ºC. Static samples were not subjected to mechanical agitation. Mixed samples were placed on a rotary mixer. Co = the starting 1,4-dioxane concentration in the aqueous solution before extraction. C = the 1,4-dioxane concentration after extraction was initiated (i.e. after some 1,4-dioxane had been sorbed onto A560). 3.1 Extraction of 1,4-dioxane with AMBERSORBTM 560 After the samples are received at the isotope laboratory and logged, the 1,4-dioxane is extracted from the water sample by equilibrating with A560 as follows: Place clean, hydrated A560 (0.5 grams wet weight) into a 40 mL VOA vial. Transfer 40 mL of the aqueous sample to be tested into the VOA vial containing the A560. Store the sample at room temperature (~21oC) for 7 days to allow sorption of 1,4-dioxane
onto the A560. This time can be decreased to 48 hours with mechanical mixing (Figure 1). After 7 days, filter the A560 from the sample and place it in a stainless steel thermal
desorption tube. Discard the liquid sample. Dry the tube in an oven for at least 16 hours at 80oC. The thermal desorption tube should be quickly inserted into the GC-IRMS for analysis or
stored in a clean, sealed glass vial to limit atmospheric contamination.
4.0 Compound Specific Isotope Analysis
Once samples have been prepared in the thermal desorption tube and dried, it is ready for GC-IRMS. Example procedures for carbon isotope ratios and hydrogen isotope ratios are provided in subsections 3.1 and 3.2, respectively. Although these procedures have been successfully tested at the University of Waterloo Environmental Isotope Laboratory, it is expected that other analytical
0 40 80 120time (hours)
0
0.2
0.4
0.6
0.8
1
C/C
o
8.9 ug/L, 4 C, static8.9 ug/L, 21C, static8.9 ug/L, 21C, mixed94 ug/L, 4C, static94 ug/L, 21C, static94 ug/L, 21C, mixed

39
chemists may modify these procedures based on different instrumentation and capabilities; these procedures are provided to serve as a guide for other laboratories. 4.1 Stable Carbon Isotope Ratios: Thermal Desorption – Gas Chromatography –
Isotope Ratio Mass Spectrometry Once samples have been prepared in the thermal desorption tube and dried, it is ready for GC-IRMS. The TD-GC-IRMS conditions are as follows: Place the thermal desorption tube in the sample holder of the TD-GC-IRMS. Set desorption temperature at 350oC. Set helium carrier gas at a flow rate of approximately 3 mL/min. Desorbed analyte is
introduced into the GC-IRMS via a heated transfer line connected directly to the GC column.
Separation of compounds occurs on a GC equipped with a capillary column (Rtx-VRX 1.8 µm, 60 m x 0.32mm).
Column temperature is held constant at 35oC for the first 5 minutes, then increased at a rate of 5oC/min to 80oC, and upon reaching 80oC held constant for 2 minutes, and then heated at a rate of 10oC/min to 150oC.
Column effluent is directed to a catalytic combustion interface (copper oxide pellets at 850oC) and then into the IRMS.
Convert results to VPDB for reporting.
4.2 Hydrogen Carbon Isotope Ratios: Thermal Desorption – Gas Chromatography – Isotope Ratio Mass Spectrometry
Once samples have been prepared in the thermal desorption tube and dried, it is ready for GC-IRMS. The TD-GC-IRMS conditions are as follows: Place the thermal desorption tube in the sample holder of the TD-GC-IRMS. Set desorption temperature at 350oC. Set helium carrier gas at a flow rate of approximately 10 mL/min. Desorbed analyte is
introduced into the GC-IRMS via a heated transfer line connected directly to the GC column.
Separation of compounds occurs on a GC equipped with a capillary column (Rtx-VRX 1.8 µm, 60 m x 0.32mm).
Column temperature is held constant at 35oC for the first 5 minutes, then increased at a rate of 5oC/min to 80oC, and upon reaching 80oC held constant for 2 minutes, and then heated at a rate of 10oC/min to 150oC.
Column effluent is directed to a catalytic pyrolysis interface (ceramic pyrolysis tube at 1450oC) and then into the IRMS.
Convert results to VSMOW for reporting.