final report: study to determine and improve design … report: study to determine and improve...
TRANSCRIPT

Issued: 3 December 1971
COPYFinal Report:Study to Determineand Improve Designfor Lithium-Doped Solar Cells
Prepared forJet Propulsion LaboratoryCalifornia Institute of TechnologyPasadena, CaliforniaIn fulfillment ofContract No. 952555June 24,1969 to September 24,1971Prepared byG. Brucker, T. Faithand A. Holmes-Siedle
RCA I Government and Commercial SystemsAstro Electronics Division | Princeton, New Jersey
https://ntrs.nasa.gov/search.jsp?R=19720010399 2018-07-08T00:29:09+00:00Z

Issued: 3 December 1971
Final Report:Study to Determineand Improve Designfor Lithium-Doped Solar Cells
Prepared forJet Propulsion LaboratoryCalifornia Institute of TechnologyPasadena, CaliforniaIn fulfillment ofContract No. 952555June 24, 1969 to September 24, 1971Prepared byG. Brucker, T. Faithand A. Holmes-Siedle
RCA I Government and Commercial SystemsAstro Electronics Division I Princeton, New Jersey

PREFACE
This is the Final Report on a program for a " Study to Deter-mine and Improve Design for Lithium-Doped Solar Cells."This report was prepared under Contract No. 952555 for JetPropulsion Laboratory, Pasadena, California, by the Astro-Electronics Division of RCA, Princeton, New Jersey. Thepreparation of this report is a contractual requirement cover-ing the period from June 24, 1969 to September 24, 1971. Thework reported here was conducted by the Radiation EffectsGroup, Manager, Dr. A.G. Holmes-Siedle. This group is apart of the Technology Development group, Manager, A.Aukstikalnis of the Astro-Electronics Division which is locatedat the RCA Space Center. The Project Supervisor is Dr. A.G.Holmes-Siedle and the Project Scientist is Dr. G. J. Brucker.The Technical Monitor of the program is Mr. Paul Hermanof the Solar Power group, Jet Propulsion Laboratory.
iii

ABSTRACT
Solar cell experiments show that a single lithium density parameter, the lithiumdensity gradient which is calculated from non-destructive capacitance measure-ments, provides the basis, for accurate predictions of lithium cell behavior in a1-MeV electron environment for fluences ranging between 3 x 10¹³ e/cm2 and3 x 1015 e/cm2. The oxygen-rich (quartz-crucible) lithium cell with phosphorusstarting dopant and lithium .gradient between approximately 5 x 10¹⁸ and 1. 5 x 10¹⁹
cm~4 has been found superior in performance to the commercial lOQ-cm n/pcontrol cells, giving approximately 10 percent higher initial power under 140mW/cm2 tungsten illumination. This 10 percent advantage is maintained afterrecovery from fluences ranging up to 3 x 10¹⁵ e/cm2. Post-recovery stabilityof oxygen-rich cells has been satisfactory, an average post-recovery currentdrop of approximately 1 mA; (< 2 percent) being observed for 70 crucible cellsafter 1 year's equivalent storage time at 80°C. - In contrast the oxygen-lean(float-zone and Lopex) lithium cells have displayed spotty initial performanceand stability problems at room temperature which prevent them from being com-petitive at this time. Quantitative relationships between lithium gradient, elec-tron fluence and performance parameters such as diffusion-length-damage coef-ficient, open-circuit voltage, cell recovery speed, and maximum power havebeen established: recovery speed is linearly proportional to the lithium gradientand inversely proportional to the 0. 59 power of the fluence; the damage coefficientimmediately after irradiation is proportional to the square root of the lithiumgradient with a logarithmic decrease with increasing fluence; the open-circuitvoltage increases logarithmically with lithium gradient immediately after irra-diation and after recovery. The activation energies for cell recovery were meas-ured to be 1. 1 eV and 0. 66 eV for oxygen-rich and oxygen-lean cells, respectively.
The Hall bar measurements show that the simple close-pair vacancy-interstitialmodel does not completely describe the dependence of defect introduction ontemperature and resistivity in lithium-containing silicon. The rate of carrier-removal (£n/£$) gAT measured in the high bombardment temperature limiton samples of quartz -crucible silicon is limited to a value of 0. 1 cm"1. Thissuggests that the lithium combined with oxygen so as to limit the oxygen con-centration available for A-center formation and the introduction rate of LiOVcenter is lower than the A-center introduction rate.
In contrast to this result, the rate of carrier-removal (An/£$) SAT increaseswith an increase of lithium concentration in float-zone silicon.
A defect located at « Ec - 0. 12 eV is produced by electron bombardment ofoxygen-lean float-zone silicon of high resistivity (2 x 10¹⁴ Li/cm3) at lowtemperatures.

Defects located at an energy of « EC - 0.18 eV and Ec - 0.13 eV were measuredin quartz-crucible silicon of moderate resistivity (2 x 10¹⁵ Li/cm3) bombardedby electrons at temperatures from 78°K to 200°K. The annealing processes andthe carrier-removal rates measured at temperatures of 100°K to 200°K on high-resistivity F. Z. samples suggest that this type of silicon behaves like Q.C. sili-con. Over a long period of time following bombardment, the results can be ex-plained as due to a multiple complexing by many lithium ions at a defect centerso as to produce an uncharged complex. Equilibrium and stability of the carrierdensity is possible after long term annealing in irradiated quartz-crucible orlightly doped float-zone silicon.
VI

SUMMARY
This is the Final Report on a program to study and analyze the action of lithiumin producing a recovery of radiation damage in bulk silicon and silicon solarcells. This program has technical continuity with the work performed by AEDof RCA for JPL on Contract No. 952555. The goal of this effort was to under-stand the damage and recovery mechanisms so that an optimum set of designrules could be specified.
The test vehicles used for this work are (1) a group of solar cells supplied byJPL, and (2) silicon bars in the "Hall-bar" configuration. The source ofparticle irradiation being used is a 1-MeV electron beam produced by the RCALaboratories Van de Graaff generator.
The measurements made on bulk silicon samples have provided confirmation ofresults observed with solar cells and also some fruitful insights into the proc-esses occurring in lithium-containing silicon. Some similar qualitative obser-vations in irradiated bulk silicon and solar cells, where the properties arecaused by carrier-removal and recombination defects respectively, are asfollows:
(1) Recovery time decreases with increasing lithium concentration
(2) Recovery time increases with increasing fluence
(3 ) Recovery time is shorter in oxygen-lean silicon compared tooxygen-rich silicon
(4) Recovery is stable in oxygen-rich silicon
(5) Recovery is unstable in oxygen-lean silicon under certainconditions
(6) Activation energy for recovery to occur is the activation energyfor lithium diffusion
(7) Introduction rate of damage is greater in oxygen-lean siliconcompared to oxygen-rich silicon
(8 ) Introduction rate of damage depends on fluence.
The experimental results suggest a radiation damage and annealing model toexplain these results. The model is presented in the conclusions of this report.
vn

Results of the solar cell experiments show that a single lithium density param-eter, namely the lithium density gradient which is calculated from non-destruc-tive capacitance measurements, provides the basis for accurate predictions oflithium cell behavior in a 1 MeV electron environment for fluences ranging be-tween 3 x 10¹³ e/cm2 and 3 x 10¹⁵ e/cm2. The oxygen-rich (quartz-crucible)lithium cell with phosphorus starting dopant and lithium gradient between ap-proximately 5 x 10¹⁸ and 1. 5 x 1019 cm"4 has been found superior in performanceto the commercial 10 £}-cm n/p control cells, giving approximately 10 percenthigher initial power under 140 mW/cm2 tungsten illumination. This 10 percentadvantage is maintained after recovery from fluences ranging up to 3 x 10¹⁵
e/cm2. A crucible cell with a lithium gradient of 1 x 1019 cm"4 has sufficientrecovery speed to keep pace with the rate of degradation (flux rate of 3 x 10¹⁵
e/cm2/year) provided the cell temperature is above 50°C. Post-recovery stabil-ity has been satisfactory, an average post-recovery current drop of approximately1 mA (< 2 percent) being observed for 70 crucible cells after 1 years equivalentstorage time at 80°C. In contrast the oxygen-lean (float-zone and Lopex) lith-ium cells have displayed spotty initial performance and stability problems atroom temperature which prevent them from being competitive for standard mis-sions at this time.
Quantitative relationships between lithium gradient, electron fluence and perform-ance parameters such as diffusion-length-damage coefficient, open-circuit volt-age, cell recovery speed, and maximum power have been established. These aresummarized in the text in Tables IV and V for oxygen-rich and oxygen-lean cells,respectively. In both cell types the following dependencies hold: recovery speedis linearly proportional to the lithium gradient and inversely proportional to the0. 59 power of the fluence; the damage coefficient immediately after irradiationis proportional to the square root of the lithium gradient with a logarithmic de-crease with increasing fluence; the open-circuit voltage increases logarithmicallywith lithium gradient immediately after irradiation and after recovery. The ac-tivation energies for cell recovery were measured to be 1.1 eV and 0.66 eV foroxygen-rich and oxygen-lean cells, respectively, the values published by Pell forthe diffusion of lithium in silicon. The recovery speeds of oxygen-rich cells at80°C and 26°C are, respectively, approximately equal to and approximately threeorders of magnitude below the recovery speed of oxygen-lean cells with equalgradient at 26°C. One exception to this was found in crucible cells with antimonystarting dopant. These cells recovered approximately an order of magnitudemore slowly than all other (phosphorus or arsenic starting dopant) crucible cells,and thus should be avoided.
Approximate ranges for lithium diffusion schedules (temperatures/times) toyield cells with high initial performance can be specified (see conclusions ). How-ever, no unique relationship exists between the lithium density gradient whichdetermines performance in an electron radiation environment, and lithium dif-fusion schedule (see Figures 39 and 40). Since ultimately the cell buyer must
vi-ii
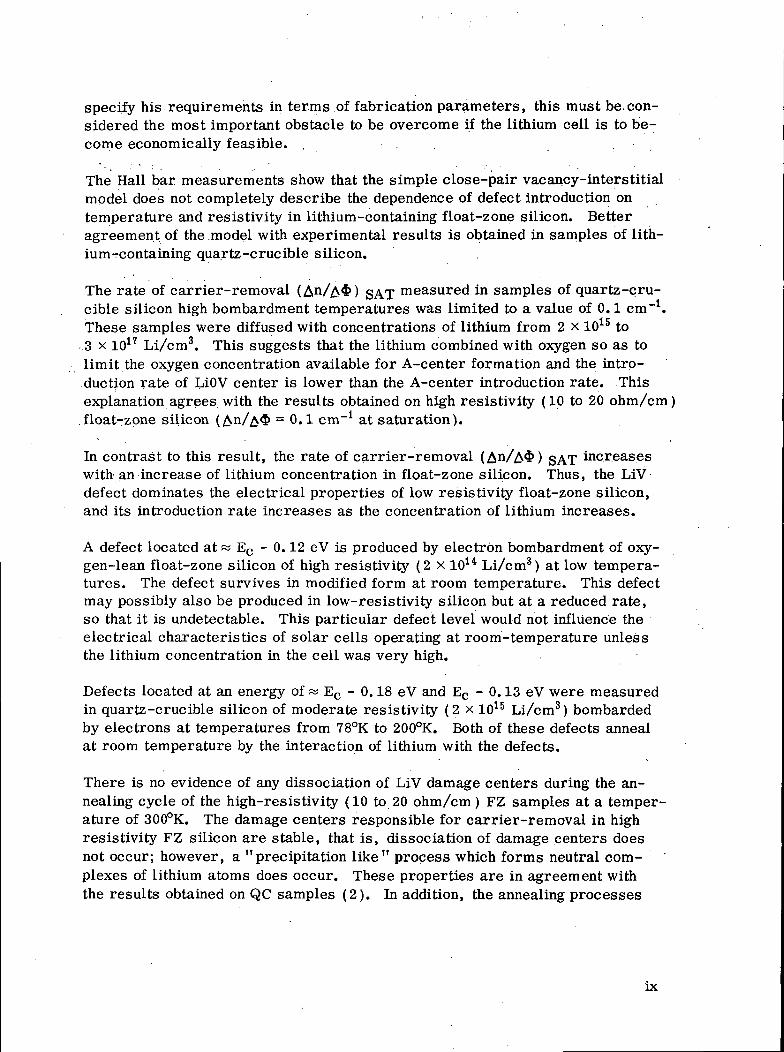
specify his requirements in terms of fabrication parameters, this must be. con-sidered the most important obstacle to be overcome if the lithium cell is to be-come economically feasible. . .
The Hall bar measurements show that the simple close-pair vacancy-interstitialmodel does not completely describe the dependence of defect introduction ontemperature and resistivity in lithium -containing float-zone silicon. Betteragreement of the .model with experimental results is obtained in samples of lith-ium-containing quartz -crucible silicon.
The rate of carrier-removal (An/A$) SAT measured in samples of quartz -cru-cible silicon high bombardment temperatures was limited to a value of 0. 1 cm"1.These samples were diffused with concentrations of lithium from 2 x 10¹⁵ to3 x 1017 Li/cm3. This suggests that the lithium combined with oxygen so as tolimit the oxygen concentration available for A-center formation and the intro-duction rate of LiOV center is lower than the A-center introduction rate. Thisexplanation agrees with the results obtained on high resistivity (10 to 20 ohm/cm)float-zone silicon (An/£$ = 0.1 cm-1 at saturation).
In contrast to this result, the rate of carrier-removal (An/A$) SAT increaseswith an increase of lithium concentration in float-zone silicon. Thus, the LiVdefect dominates the electrical properties of low resistivity float-zone silicon,and its introduction rate increases as the concentration of lithium increases.
A defect located at« Ec - 0. 12 eV is produced by electron bombardment of oxy-gen-lean float-zone silicon of high resistivity (2 x 10¹⁴ Li/cm3) at low tempera-tures. The defect survives in modified form at room temperature. This defectmay possibly also be produced in low- resistivity silicon but at a reduced rate,so that it is undetectable. This particular defect level would not influence theelectrical characteristics of solar cells operating at room-temperature unlessthe lithium concentration in the cell was very high.
Defects located at an energy of « Ec - 0. 18 eV and Ec - 0. 13 eV were measuredin quartz -crucible silicon of moderate resistivity (2 x 10¹⁵ Li/cm3) bombardedby electrons at temperatures from 78°K to 200°K. Both of these defects annealat room temperature by the interaction of lithium with the defects.
There is no evidence of any dissociation of LiV damage centers during the an-nealing cycle of the high-resistivity (10 to 20 ohm/cm ) FZ samples at a temper-ature of 300°K. The damage centers responsible for carrier-removal in highresistivity FZ silicon are stable, that is, dissociation of damage centers doesnot occur; however, a "precipitation like" process which forms neutral com-plexes of lithium atoms does occur. These properties are in agreement withthe results obtained on QC samples (2) . In addition, the annealing processes
IX

and the carrier-removal rates measured at temperatures of 100°K to 200°K onhigh-resistivity FZ samples suggest that this type of silicon behaves like QCsilicon. It appears that the concentration of oxygen relative to the concentra-tion of lithium determines the annealing properties. The Hall bar experimentssuggest, in agreement with the conclusions of stability studies on solar cells,that the lithium concentration can be high (2 x 10¹⁶ Li/cm3) in QC silicon with-out producing unstable defect centers and annealed-defect centers. In contrastto this, the concentration of lithium in FZ silicon must be limited to a valueless than 1015 Li/cm3 to achieve stability. This lower concentration of lithiumalso produces lower carrier-removal rates in Hall samples made from thistype of silicon.
Annealing results obtained on the quartz-crucible Hall bars suggest that severalcompeting processes take place during the post-bombardment period. The short-term experimental results cannot be explained on the basis of a single or a doublelithium ion neutralizing a defect. Over a long period of time following bombard-ment, the results can be explained as due to a multiple complexing by many lith-ium ions at a defect center so as to produce an uncharged complex. Equilibriumand stability of the carrier density is possible after long term annealing at 300°Kin irradiated quartz-crucible (^ 2 years) or lightly doped (2 to 5 x 10¹⁴ Li/cm3)float-zone silicon (< 1 year). This is an important conclusion relative to thequestion of solar cell stability.

TABLE OF CONTENTS
Section Page
I INTRODUCTION 1-1
A. General . . 1-1B. Technical Approach. 1-1Co Summary of Previous Work 1-1
II PARAMETRIC STUDIES OF LITHIUM CELLS . . . . ... . II-1_
A. General . II-lB. Lithium Gradient II-lC. Experimental Procedure . . n-3D. Initial Cell Performance II-3E. Damage Coefficient Before Recovery n-9F. Recovery Characteristics 11-17G. Post-Recovery Performance 11-25
1. Damage Coefficient and Short-Circuit Current . . 11-252. Open-Circuit Voltage 11-283. Maximum Power 11-29
HI LITHIUM CELL STABILITY. III-l
A. General , III-lB. Pre-1970 Lithium Cells III-lC. Modes of Instability IH-5
1. Short-Circuit Current Loss . . III-52. Open-Circuit Voltage Loss III-63. Junction Degradation Ill-94. Series Resistance in-11
D. Quartz-Crucible Cells IH-11
IV LITHIUM DENSITY CONTROL IV-1
A. Lithium Diffusion Schedule IV-1B. Density Measurements IV-3
1. Single Capacitance Method. IV-32. Single Density Method . . . . . . . . . . . . . . . IV-6
V SOLAR CELL COLD FINGER EXPERIMENTS . . . . . . . V-l
A. General V-lB. Experiments on Antimony-Doped Cells . V-lC. Lifetime Damage Constant V-llD. Cell Recovery V-13E. Redegradation V-16F. Diffusion Constant V-16
xi

TABLE OF CONTENTS (Continued)
Section Page
VI LITHIUM CELL OPTIMIZATION . . . VI-1
A. Test Variables VI-1B. Cell Parameters VI-2C. Optimum Lithium Cell VI-10D. Mission Considerations VI-12
VII HALL AND RESISTIVITY MEASUREMENTS VII-1
A. Introduction VII-1B. Temperature Dependence of Carrier-Removal Rate . . VII-1
1. Float-Zone Silicon. VII-12. Quartz-Crucible Silicon . VII-33. Carrier-Removal in High Resistivity Samples . . . VII-34. Fluence and Measuring Temperature VII-5
C. Carrier Density vs Measuring Temperature VII-6
1. Float-Zone Samples of High Resistivity VII-62. Quartz-Crucible Silicon. . . VII-9
D. Annealing. . VII-12
1. Dependence of Carrier Density Changeson Resistivity VII-12
2. Dependence of Mobility Changeson Resistivity . VII-15
3. High and Low Temperature Anneal of High-Resistivity Float-Zone Silicon VII-15
4. Quartz-Crucible Compared to High-ResistivityFloat-Zone Silicon VII-17
5. Long-Term Annealing Effects. . VII-176. Activation Energy for Recovery VII-19
E. Discussion of Results VII-20
VIE CONCLUSIONS AND RECOMMENDATIONS VIH-1
A. Solar Cells VIH-1B. Bulk Sample Measurements Vni-5C. Recommendations . VIII-8
SYMBOLS AND DEFINITIONS
REFERENCES
Xll

LIST OF ILLUSTRATIONS
Figure Page
1 Lithium Donor Density versus Distance from Junction forFour Typical Cells II-2
2 Initial Maximum Power Distributions for C13 Quartz-Crucible Lithium Cells versus Lithium Donor DensityGradients with Comparisons of 10 fl-cm Commercialn/p Cells . II-6
3 Initial Short-Circuit Current Distributions for C13 Quartz -Crucible Lithium Cells versus Lithium Donor DensityGradients with Comparisons of 10fi-cm Commercialn/p Cells . H-7
4 Initial Open-Circuit Voltage Distributions for C13 Quartz-Crucible Lithium Cells versus Lithium Donor DensityGradients with Comparisons of lOft-cm Commercialn/p Cells II-7
5 Initial Short-Circuit Current versus Lithium Gradientfor Quartz-Crucible Cells - Lots C14B, C14D,and H13A2. . . . . . . . . . . . . . . . . . . . . . . . . . II-8
6 Initial Short-Circuit Current versus Lithium Gradient forLopex Cells - Lots C14A, C14C, and H13A1 . . . . . . . H-9
7 Short-Circuit Current versus Diffusion Length for 100Crucible (CIS) Cells Unirradiated, 70 Cells at VariousStages of Recovery after Irradiation. . 11-11
8 Short-Circuit Current Immediately after Irradiation versusLithium Gradient for Seventy C13 Cells Irradiated by 1MeV Electrons to Fluences Ranging from 3 x 10¹³ e/cm2
to 3 x 101S e/cm2 11-119 Diffusion-Length Damage Coefficient Immediately after
Irradiation versus Lithium Gradient for Seventeen C13Cells Irradiated to a Fluence of 3 x 10¹³ e/cm2 . . . . . . H-12
10 Diffusion-Length Damage Coefficient Immediately afterIrradiation versus Lithium Gradient for H3A CellsIrradiated to a Fluence of 3 x 10¹⁴ e/cm2 11-13
11 Diffusion-Length Damage Coefficient Immediately afterIrradiation versus Lithium Gradient for Cll Quartz-Crucible Cells H-14
12 Diffusion-Length Damage Coefficient Immediately after'•"•'•" Irradiation versus Lithium Gradient for C14D and
H13A2 Quartz-Crucible Cells .. . . . . ... . . . . . . . H-14
Xlll

LIST OF ILLUSTRATIONS (Continued)
Figure Page
13 Diffusion-Length Damage Coefficient Immediately afterIrradiation versus 1 MeV Electron Fluence for aLithium Gradient of 1 x 1018 cm"4, Quartz-CrucibleCells . 11-15
14 Diffusion-Length Damage Coefficient Immediately afterIrradiation versus Lithium Gradient for C11C andH13A1 Lopex Cells. . H-15
15 Diffusion-Length Damage Coefficient Immediately afterIrradiation versus 1 MeV Electron Fluence for aLithium Gradient of 3 x 1018 cm"4, Lopex Cells . . . . . n-16
16 Short-Circuit-Current Recovery Curve for Cell C13E18,Short-Circuit Current versus Time 11-18
17 Short-Circuit-Current Recovery Curve for Cell C13E18,Short-Circuit versus Log-Time 11-18
18 Time to Half Recovery versus Lithium Gradient for Quartz-Crucible C13 Cells at a Recovery Temperature of 80°C(Measurement Temperature = 26°C) . . EI-19
19 Time to Half Recovery versus Lithium Gradient for Quartz-Crucible Cells at a Recovery Temperature of 26°C. . . . n-20
20 Product of Time to Half Recovery and Lithium Gradient,0dNL/dw, versus 1 MeV Electron Fluence for C13Cells n-20
21 Time to Half Recovery versus Lithium Gradient for Float-Zone and Lopex Cells Manufactured by Centralab andHeliotek at a Recovery Temperature of 26°C 11-22
22 Time to Half Recovery versus Lithium Gradient for LopexCells Manufactured by Texas Instruments at a RecoveryTemperature of 26°C. 11-23
23 Product of Time to Half Recovery and Lithium Gradient,9dNi/dw, versus 1 MeV Electron Fluence for Float-Zone and Lopex Cells Manufactured by Centralab andHeliotek 11-24
24 Time to Half Recovery versus Lithium Gradient for C15Aand C15B Lopex Cells at a Recovery Temperatureof 26°C H-25
25 Diffusion-Length Damage Coefficient after Recovery versusLithium Gradient for C13 Cells 11-26
26 Short-Circuit Current after Recovery versus LithiumGradient for CIS Cells with Comparisons to lOQ-cmCommercial n/p Cells 11-27
xiv

LIST OF ILLUSTRATIONS (Continued)
Figure Page
27 Open-Circuit Voltage after Recovery versus LithiumGradient for CIS Cells with Comparisons to lOQ-cmCommercial n/p Cells 11-28
28 Open-Circuit Voltage after Recovery versus LithiumGradient for C14D Cells with Comparisons to lOQ-cmCommercial n/p Cells E-29
29 Maximum Power after Recovery versus Lithium Gradientfor C13 Cells with Comparisons to lOQ-cm Commercialn/p Cells n-30
30 Maximum Power after Recovery versus Lithium Gradientfor C14D Cells with Comparisons to lOQ-cm Commercialn/p Cells 11-30
31 Short-Circuit Current versus Time after Irradiation forSix Oxygen-Lean Cell Groups, 0 = 3 x 10¹⁴ e/cm2 III-6
32 Diffusion Length and Short-Circuit Current versus Timeafter Irradiation for C10F Cells Ill-7
33 Open-Circuit Voltage Loss in Oxygen-Lean C4 Cells versusRatio of Lithium Gradient Measured at Start and at End ofthe Time Period During which the Loss Occurred.Theoretical Voltage Loss for a Donor Density Loss fromnj to n2 is also Plotted versus the Ratio of nj to n2 . . . . m-7
34 Open-Circuit Voltage versus Time for Oxygen-Lean C4Cells During Period of Voltage Loss ni-8
35 Donor Density versus Distance from Junction before andafter Open-Circuit Voltage Degradation for Cell C4-3 , . ni-10
36 Photovoltaic Characteristics before and after Curve FactorDegradation for Oxygen-Lean Cell T4-13 111-10
37 Comparison of Short-Circuit-Current Recovery Curves fora Crucible Cell at TA = 80°C and a Float-Zone Cell atTA = 26°C m-12
38 Short-Circuit-Current Degradation versus 1 MeV ElectronFluence for C13 Cells after One Year's Equivalent Post-Irradiation Storage Time at 80°C IE-13
39 Lithium Gradient Ranges versus Lithium Diffusion Temper-ature-Quartz-Crucible Cell Lots IV-2
40 Lithium Gradient Ranges versus. Lithium Diffusion Temper-ature-Oxygen-Lean Cell Lots . . . IV-2
41 Cell Capacitance at Zero Volt Bias versus LithiumGradient-Lopex Cells P7-4
xv

LIST OF ILLUSTRATIONS (Continued)
Figure Page
42 Cell Capacitance at Four Volts Reverse Bias versusLithium Gradient-Lopex Cells IV-5
43 Cell Capacitance at Zero and Seven Volt Bias versusLithium Gradient-H13A2 Crucible Cells IV-7
44 Donor Density at Edge of Depletion Region versus LithiumGradient-70 Quartz-Crucible Cells IV-7
45 Donor Density at Edge of Depletion Region versus LithiumGradient-128 Oxygen-Lean Cells W-8
46 Donor Density Measured at Two Sets of Bias Levels versusLithium Gradient H13A2 Crucible Cells . IV-10
47 Lifetime versus Temperature Data on Cell C6A-18( 2) . . . V-448 Lifetime versus Temperature Data on Cell C6A-19( 2) . . . V-549 Theoretical and Experimental Lifetime versus Temperature
Curves-C6A-18(2) V-7.50 Theoretical and Experimental Lifetime versus Temperature
Curves-C6A-19(2) . . . . . V-751 Lifetime at 373°K versus Annealing Time at 373°K: Cells
C6A-18(2) andC6A-19(2) . . . V-852 Lifetime versus Temperature Data on Cells C6A-B( 3)
and C6A-19(3) V-1053 Lifetime versus Annealing Time at 380°K: Cells C6A-B(3)
and C6A-19(3) V-ll54 Forward Diode Characteristic of Cell C6A-19(2) after
Mounting on Cold Finger . . . V-1255 Lifetime Damage Constant versus Inverse Bombardment
Temperature for Measurement Temperature of200°K, Cell C6C-18(2) V-14
56 Reciprocal Fraction of Damage Remaining versus Time afterIrradiation at 373°K: Cells C6C-17(1) and C6C-18(1).. V-15
57 Recovery Slope versus Inverse Annealing Temperature;Recovery Activation Energy for Quartz-Crucible Cells . . V-15
58 Recovery Slope versus Inverse Annealing Temperature;Recovery Activation Energy for Float-Zone andLopex Cells V-17
59 Normalized Lifetime or Carrier Density versus Time afterIrradiation at 357°K, 345°K, 322°K, and 300°K V-17
60 Diffusion Constant of Cells C5-19 and C5-20 versus InverseTemperature V-19
61 Time to Full Recovery (40 x 8) versus Lithium Gradientwith Cell Temperature and 1 MeV Electron Fluence asParameters: Quartz-Crucible Cells VI-11
xvi

LIST OF ILLUSTRATIONS (Continued)
Figure Page
62 Predicted Power Degradation Curves for Lithium Cellswith 18 mils Coverglass and IQ-cm n/p Cells with 54mils Coverglass. Projected Atmosphere ExplorerOrbit with 2040 nmi Apogee, 80 nmi Perigee and 18°Orbit Inclination . VI-14
63 Carrier-Removal Rates versus Reciprocal Bombard-ment Temperature for Float-Zone ( FZ ) Silicon.Measurements at 79° to 81°K after Annealing to 200°K . . . VII-2
64 Carrier-Removal Rates versus Reciprocal BombardmentTemperature for Quartz-Crucible Silicon (Measurementsat 79°K after Annealing to 200°K) „ . VH-4
65 Carrier-Removal Rates versus Reciprocal BombardmentTemperature for Float-Zone Silicon Irradiated by 1 MeVElectrons (Measured at TM = 78°K) VII-4
66 Carrier Density versus Fluence for FZ Silicon Sample(H5-5) Bombarded at 250°K and Measured at 79°and 250°K VH-7
67 Carrier Density versus Reciprocal Measurement Temper-ature for Float-Zone Silicon (20 ohm/cm) . . . . . . . . . VH-8
68 Carrier Density versus Reciprocal Measurement Temper-ature for Float-Zone Silicon (20 ohm/cm ) . . . VH-10
69 Carrier Density versus Reciprocal Measurement Temper-ature for Quartz-Crucible Silicon VII-11
70 Carrier Density versus Reciprocal Measurement Temper-ature for Quartz-Crucible Silicon VII-11
71 Unannealed Fraction of Carrier Density versus AnnealingTime for Four Samples of Float-Zone Silicon Annealedat 297°K and Measured at 80°K VH-12
72 Unannealed Fraction of Carrier Density versus AnnealingTime for Four Samples of Float-Zone Silicon Annealedand Measured at a Temperature of 297°K VII-13
73 Unannealed Fraction of Reciprocal Mobility versusAnnealing Time for Four Samples of Float-Zone SiliconAnnealed at a Temperature of 297°K and Measuredat 80°K VH-13
74 Unannealed Fraction of Carrier Density and ReciprocalMobility versus Annealing Time for 20 ohm/cm Float-Zone Silicon Annealed at TA = 300°K and 373°K andMeasured at 78°K and 300°K. VE-16
xvii

LIST OF ILLUSTRATIONS (Continued)
Figure
75
76
77
Page
78
79
Unannealed Fraction of Carrier Density and ReciprocalMobility versus Annealing Time for 0. 3 ohm/cm QCand 10 ohm/cm FZ Silicon. Annealed at TA = 300°Kand 373°K and Measured at TM = ?8°K and 300°K
Carrier Density versus Time after Electron Irradiationfor Samples of Float-Zone and Quartz-Crucible Silicon.Measurements at 300°K initial Lithium Concentrationis Indicated for Each Sample
Reciprocal Half Recovery Time of the Mobility in ElectronIrradiated Float-Zone Silicon versus the ReciprocalAnnealing Temperature. Measurements of Mobility at79°K. Activation Energy EA for the Recovery Processis Indicated. Initial Lithium Concentration 3 x lo17
Li/cm3
Probability of Defect Formation versus Reciprocal Bombard-ment Temperature for Electron Irradiated Float-ZoneSilicon. Measurements at 79°K after Annealing to 200°K.Initial Lithium Concentration is the Curve Parameter . .
Probability of Defect Formation versus Reciprocal Bombard-ment Temperature for Electron Irradiated Quartz-CrucibleSilicon. Measurements at 79°K after Annealing to 200°K.Initial Lithium Concentration is the Curve Parameter . .
VE-18
vn-i9
vn-20
vn-2i
vn-22
LIST OF TABLES
Table
I
II
in
IVV
VI
Properties and Initial Performance of Lithium Cell LotsReceived Since January 1970
Properties and Performance of Pre-1970 Quartz-CrucibleLithium Cells and Comparisons with Commercial10 Si-cm n/p Cells
Performance and Stability of Pre-1970 Float-Zone andLopex Lithium Cells
Parameters of Lithium CellsSummary of Parametric Relationships for Quartz-Crucible
Lithium CellsSummary of Parametric Relationships for Oxygen-Lean
Lithium Cells
Page
II-5
HI-2
ni-sVI-3
VI-6
VI-9
XVlll

SECTION I
INTRODUCTION
A. GENERAL
This contract effort represents an experimental investigation of the physi-cal properties of lithium-containing p-on-n solar cells and bulk silicon samples,and of the processes which occur in these devices and samples before and afterirradiation. The program objectives were to develop and reduce-to-practiceanalytical techniques to characterize the radiation resistance of lithium-dopedsolar cells and its dependence on the materials and processes used to fabricatethem. On the basis of this and other data, RCA, Astro-Electronics Divisionhas determined and recommended an improved design of lithium-doped solarcells for space use. A previous RCA program (Reference 1) performed forJPL provided the groundwork for this effort.
B. TECHNICAL APPROACH
This approach to the objectives was based on the irradiation and measure-ment of the electrical properties of bulk-silicon samples, and government-fur-nished (GFE)-solar cells. Experiments on bulk samples included Hall and re-sistivity measurements taken as a function of. (I) bombardment temperature,(2) resistivity or lithium density, (3) fluence, (4) oxygen concentration, and(5) annealing time at room temperature. Diffusion-length photovoltaic, andcapacitance measurements on solar cells were made as a function of the samefive parameters as for bulk samples. Stability studies were conducted on solarcells, which were irradiated and observed for long periods of time. Based onthese results, a set of preliminary design rules and specifications was deter-mined, and solar cells were procured by JPL in accordance with these rules.As a check of the validity of the design rules, tests were conducted on this groupof cells and a set of modified design rules was derived.
C. SUMMARY OF PREVIOUS WORK
A brief history is given here of the recent work performed on a precedingcontract (Reference 1) for purposes of continuity and to provide the reader witha better understanding of the current technical approach, its problems, andobjectives.
1-1

In the work of the past contract, basic material studies and device studies werepursued in parallel. These studies produced significant advances in the under-standing of the defect interactions, dynamics, and general properties of lithiumsolar cells. The dynamics of lithium in silicon have been studied under condi-tions analogous to those which would be experienced in a practical lithium solar-cell array over several years in a high-fluence trapped space-radiation situation,such as might be encountered near Earth, Jupiter, or other planets.
As a result of this, and the work of other contractors funded by JPL in the 1967-1969 period, the general level of confidence and knowledge as to what is happen-ing in lithium cells has increased in many ways.
In the RCA work, tests on GFE cells irradiated to fluences from 1014 to 1016
e/cm2 indicated that, to obtain good long-term stability in cells made from sili-con of low oxygen content, the lithium density should be made as low as is com-patible with maximum cell recovery for the fluence applied to the cells. Cellswith high lithium concentration and steep gradients of lithium density near thejunction showed gross lithium motion near the junction over approximately oneyear. Cells of this type have redegraded as much as 35 percent eleven monthsafter bombardment to 1014 e/cm2.
The RCA investigators found that redegradation in power output was due to curve-shape changes and decreases in open-circuit voltage as well as changes in short-circuit current. Cells with smaller lithium-density gradient showed better stabilityboth before bombardment and after bombardment to 1014 e/cm2.
Hall-coefficient and resistivity measurements were used by RCA to investigatethe crystal growth and irradiation-temperature dependence of the introductionrate and room-temperature annealing of carrier-removal defects in lithium-doped silicon. Initial resistivity of the quartz-crucible-grown silicon (QC) usedin these studies was 30 ohm-cm and of the float-zone silicon was a 1500 ohm-cm.The silicon was doped with lithium to a density of 2 x 1016 cm"3. Irradiationswere carried out with 1-MeV electrons at bombardment temperatures rangingfrom 79°K to 280° K. Specimens were annealed to 200° K, thereby, separatingintrinsic and impurity defects. Introduction rates of carrier-removal defectswere exponentially dependent on the reciprocal of temperature for both types ofcrystal, but the slopes and limiting temperature values differed. The slope ofthe carrier-removal rate versus reciprocal temperature curve was 0. 055 eV inQC silicon and 0. 09 eV in FZ silicon. The temperature-dependence was notconsistent with a simple charge-state-dependent probability of interstitial-va-cancy dissociation and impurity-vacancy trapping. Carrier concentrations meas-ured at or near room temperature were increased in FZ silicon, but were de-creased in QC silicon by isothermal annealing at room temperature. QC sil-icon samples annealed to 373°K for 10 minutes exhibited complete recovery
1-2

of mobility. Complete recovery of mobility in float-zone refined silicon tookplace in an annealing time £ 17 hours at room temperature. Both of these re-covery times are in agreement with the recovery times measured on solar cellsmade from these types of silicon and comparable lithium concentrations. Thetime constant of the annealing kinetics at room temperature is consistent withthe smaller lithium diffusion constant observed in oxygen-rich silicon comparedto the lithium diffusion constant in oxygen-lean silicon. The mechanism of room-temperature annealing is attributed to neutralization of carrier-removal defectsby lithium interaction in QC silicon, and by both lithium interaction and defectdissociation in FZ silicon. Results suggested that a lithium-oxygen-vacancycomplex is produced by radiation in quartz-crucible grown silicon and a lith-ium-vacancy complex in float-zone refined silicon. The LiO-V defect is tightlybound compared to the oxygen-free Li-V defect. Measurements of carrier den-sity as a function of reciprocal temperature located defect-energy levels nearE£-O. 18 eV and EQ-O. 13 eV, in irradiated-crucible silicon. The first defectlevel is the A-center and the latter is the reverse annealing center which isformed at a temperature of 250° K. A defect level located near Ec~0. 08 eVformed after QC silicon samples were annealed at room temperature and lith-ium interacted with radiation defects.
At the end of the previous program, the preliminary recommendations for pro-ducing stable, high-performance, high radiation-resistant lithium cells were:(1) to fabricate the cells from silicon of moderate resistivity (phosphorus-doped~ 10 ohm-cm), (2) to diffuse lithium into the cell with a concentration of 3 to10 x 1014/cm3 located at the edge of the depletion region, and (3) to distributethe lithium near the junction such that the density gradient is « 1019 cm~4. Thechoice of oxygen content would depend on the rate of recovery required by thespace mission in question.
1-3
SECTION II
PARAMETRIC STUDIES OF LITHIUM CELLS
A. GENERAL
Both the initial properties of silicon and the changes which occur in theseproperties in a radiation environment are functions of the impurity (donor oracceptor) density present in the silicon lattice. Consequently, physical param-eters such as mobility and damage constants are often specified as functions ofthis density (or equivalently, as functions of resistivity). In a non-lithium sili-con solar cell the resistivity is essentially constant throughout the base region.This enables the physical parameters of non-lithium cells to be specified interms of this resistivity. However, in the lithium-containing solar cell the sit-uation is complicated by the high mobility of the lithium donor ions. This highmobility in the presence of a p/n junction electric field results in large varia-tions of lithium density (with respect to the distance from the junction) in thebase region of the cell. These variations extend several micrometers into thebase region, in many cases continuing out to the back contact of the cell. Thissituation rendered the specification of a single base density or resistivity mean-ingless. Consequently, an alternative mode of description for the base densityhad to be established. Such a description would ideally involve a minimum num-ber of easily measurable parameters the knowledge of which would enable pre-diction of cell behavior in a radiation environment. In the present work a singledescriptive parameter, the lithium donor density gradient, dNL/dw, has beenadopted and has been seen to provide a good basis for such predictions as willbe demonstrated in the following sections.
The principal performance parameters characterizing lithium cell behavior ina radiation environment are: (1) the initial (pre-irradiation) performancelevels, (2) the rate of cell degradation or damage constant, (3) cell recoveryrate and (4) final photovoltaic performance after recovery from a given fluence.During the present contract, recovery rate versus lithium gradient relationshipswere established for solar cells bombarded by electron fluences from 3 x 10¹³
to 3 x 10¹⁵ e/cm2. In addition, relationships between diffusion-length damagecoefficient, K^, lithium gradient, dNL/dw, and 1-MeV electron fluence, $,were obtained.
B. LITHIUM GRADIENT
The reasoning which led to the adoption of the lithium gradient as the de-scriptive density parameter is explained with the aid of Figure I which showsdonor density in the base region of the cell versus distance from the junction
n-i

CO
u
14
12
10
oC 8
ZUJQ<ri
DISTANCE FROM JUNCTION (ftm)
Figure 1. Lithium Donor Density versus Distance fromJunction for Four Typical Cells
for four lithium-containing cells- These density profiles were calculated from(non-destructive) reverse-bias capacitance measurements (Reference 2) madeprior to cell irradiation. Each cell shows a linear increase in density with dis-tance from the junction, (i. e., each has a constant density gradient). The grad-ients in Figure 1 cover only a narrow range from 3. 5 x 10¹⁸ to 8. 2 x 1018 cm"4.However, measurements on over 500 cells have shown that virtually all lithiumcells have linearly-increasing density profiles for gradient values ranging from1 x 101? to 5 x io19 cm~4, which covers almost the entire range of practical cellvalues.
The donor density, ND, at a distance w from the junction is the sum of the back-ground contribution (usually phosphorus) and the lithium contribution. The ca-pacitance measurement cannot distinguish between different donor elements sothere is no direct and accurate way to obtain the lithium density component fromthis measurement. However, numerous measurements made on n/p and p/ncontrol cells during the time covered by this contract have shown the non-lithiumcells to have zero gradient. Therefore the entire gradient is due to lithium.This, together with the constancy of the gradient in the region near the junction(where most of the light-generated carriers are created) prompted the choice ofthe gradient as the prime physical parameter in these investigations.
II-2

C. EXPERIMENTAL PROCEDURE
The lithium-containing p/n solar cells furnished by JPL under this contractwere manufactured by Centralab, Helioteck, and Texas Instruments. In thecell-codes used in this report the first letter represents the manufacturer,designated C, H, and T, respectively. Seventy commercial-grade, 10 £}-cmn/p cells manufactured by Centralab were also furnished. These cells, .desig-nated by the letter D, provided a reference for the lithium cell performance;they were irradiated and measured with the lithium cells.
Prior to irradiation, measurements of photovoltaic current-voltage character-istic under 140 mW/cm2 tungsten illumination and reverse-bias capacitancecharacteristic were made on all cells. Minority-carrier diffusion-length meas-urements (Reference 2) were made on selected cells. The cells were irradi-ated by 1-MeV electrons from a Van de Graaff generator at a rate of approxi-mately 4 x lo13 e/cm2-min. All of the oxygen-rich cells and some of the oxygen-lean cells were irradiated at room temperature. Where damage coefficients andcomplete characteristics were to be measured it was necessary to cool the oxygen-lean cells down to a temperature of 0°C during irradiation to avoid significantrecovery during the irradiation. Reduction of the cell temperature to 0°C re-duced the cell recovery speed to less than one tenth the room-temperature value,thereby insuring less than 1 milliamp recovery in short-circuit current duringirradiation. Damage coefficient measurements on the cold finger (Sections Vand VII) indicate no temperature dependence in the range above approximately150°K. Consequently, the cooling of the cells to 0°C (273°K) during irradiationshould result in the same damage rate as room-temperature irradiation. Afterirradiation all cells were stored in dry ice up to the time of the first post-irradi-ation measurements. Post-irradiation measurements included short-circuitcurrent and photovoltaic characteristic measured under 140 mW/cm2 tungstenillumination, and minority-carrier diffusion-length measurements. All meas-urements were made at a cell temperature of 26° C. The oxygen-lean cellswere stored at 26°C after irradiation, the oxygen-rich cells at 26°C, 80°C or.90° C.
D. INITIAL CELL PERFORMANCE
In the organization of this report the lithium cells are divided into twocategories: (1) cells received before 1970 (2) cells received in 1970 and 1971.Two reasons for this separation are (1) the 1970-71 cells generally had higherinitial powers than the pre-1970 cells and (2) the 1970-71 cells were receivedafter the importance of the lithium gradient was better understood, consequentlyreverse-bias capacitance measurements were made on all of these cells where-as measurements were made only on selected pre-1970 cells. The 1970-71 cellsare discussed in this section; results on pre-1970 lithium cells are reported inSections HI and V. .
H-3

The cell lots received in 1970-71 were H1A, H3A, H5A, H7A, H13A1, H13A2,C10A-F, C11A-D, C13A-J, C14A-D, C15A and C15B. The initial propertiesand performance ranges for these cell lots are listed in Table I. For compar-ison purposes lot D, comprising 20 commercial 10 Q-cm n/p cells, is includedin the last line of the table. The CIO lots are omitted for the table; cells ofthese lots were very heavily doped with lithium (dNj/dw ^ 1020 cm~4) and hadrelatively poor power due to this unusually heavy doping.
Table I includes twenty-six lithium cell lots, seventeen of which are fabricatedfrom oxygen-rich (quartz crucible) silicon. A comparison of initial powersshows the oxygen-rich lots to be generally superior to the oxygen-lean (float-zone and Lopex) lots. The maximum power for crucible cells (averaged overthe cell lot) varies from 28.3 mW for lot CUB to 33.7 mW for lot C11A, where-as the averaged maximum power for oxygen-lean cell lots varies from 24. 8 mWfor lot C14A to 31. 5 mW for lot H13A1. All but three of the seventeen cruciblelots have higher averaged maximum power than the value of 29. 3 mW obtainedfor the n/p control (lot D) cells. In contrast only two of the nine oxygen-leangroups have greater than 29.3 mW averaged maximum power. While the physi-cal reasons for this are not understood it is clear from the empirical data that ;the oxygen-rich lithium cell is highly competitive with the n/p cell in terms ofinitial output. This is not generally the case for oxygen-lean lithium cells.
One of the problem areas in lithium cell technology is illustrated in the finalcolumn of Table I which lists the lowest and highest lithium gradients withineach cell lot. In many instances a single cell lot with a single lithium diffusionschedule displayed large cell-to-cell variations in lithium gradient. The worstexample of this was lot C15B where the most lightly lithium-doped cell had agradient of 1.1 x 1018 cm"4 while the most heavily doped cell had a gradient of7. 6 x io19 cm~4, a spread of a factor of seventy. Eleven of the twenty-six lith-ium-cell lots had spreads of greater than a factor of ten, and only ten lots hadspreads of less than a factor of three. As will be shown in Section IIF cell re-covery speed is directly proportional to the lithium gradient. Therefore, anywide spread in gradient within the cells of a single solar panel could cause mis-matches in the cell outputs in a radiation environment. (For example, the re-covery rate in the most lightly doped cells of the panel may not be fast enoughto keep pace with the rate of damage, the result being a loss in buss current.)Such problems could become significant in a severe radiation environment; re-covery results suggest that a spread of approximately three in gradient wouldgenerally be tolerable. * This problem will be discussed further in Section V.
* The tolerable spread would naturally depend on several system parameters.There would be situations (e.g. , panels with non-uniform temperature) wherecells with different densities could advantageously be placed on different por-tions of the panel. However, these densities should be controllable via thefabrication process (lithium introduction schedule).
II-4
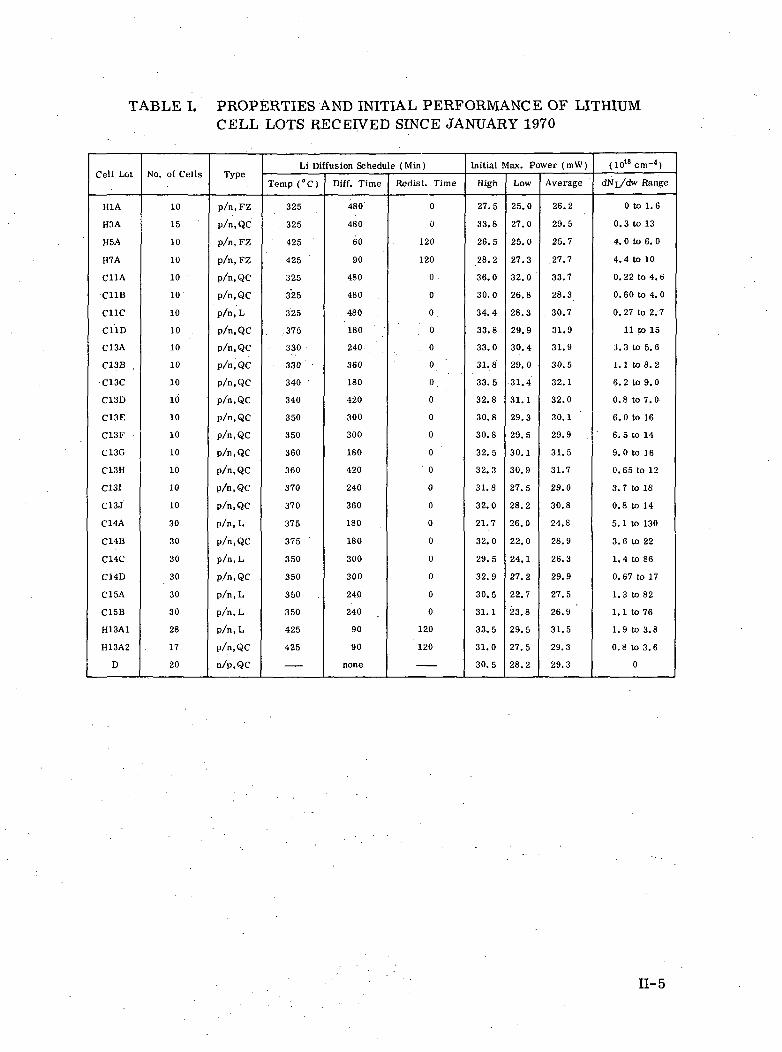
TABLE I. PROPERTIES AND INITIAL PERFORMANCE OF LITHIUMCELL LOTS RECEIVED SINCE JANUARY 1970
Cell Lot
H1A
H3A
H5A
H7A
C11A
CUB
cueC11D
C13A
C13B
C13C
C13D
C13E
C13F
C13G
C13H
C13I
C13J
C14A
C14B
C14C
C14D
C15A
C15B
H13A1
H13A2
D
No. of Cells
10
15
10
10
10
10
10
10
10
10
10
10
10
10
10
10
10
10
30
30
30
30
30
30
28
17
20
Type
p/n,FZ
P/n,QC
p/n,FZ
p/n, FZ
p/n,QC
P/n,QC
p/n,L
P/n,QC
P/n,QC
p/n,QC
P/n,QC
P/n,QC
P/n,QC
P/n,QC
P/n,QC
P/n,QC
P/n,QC
p/n,QC
p/n,L
P/n,QC
p/n,L
P/n,QC
p/n,L
p/n,L
p/n,L
P/n,QC
n/P,QC
Li Diffusion Schedule (Min)
Temp (°C)
325
325
425
425
325
325
325
375
• 330
330
340
340
350
350
360
360
370
370
375
375
350
350
350
350
425
425
Diff. Time
480'
480
60
90
480
480
. 480
180
240
360
180
420
300
300
180
420
240
360
180
180
300
300
240
240
90
90
none
Redist. Time
0
0
120
120
0
0
0 .
0
. 0
0
0.
0
0
0
0
' 0
0
0
0
0
0
0
0
0
120
120
Initial Max. Power ( mW )
High
27.5
33.8
26.5
28.2
36.0
30.0
34.4
33.8
33.0
31.8
33.5
32.8
30.8
30.8
32.5
32.3
31.8
32.0
21.7
32.0
29.5
32.9
30.5
31.1
33.5
31.0
30.5
Low
25.0
27.0
25.0
27.3
32.0
26.8
28.3
29.9
30.4
29.0
31.4
31.1
29.3
29.5
30.1
30.9
27.5
28.2
26.0
22.0
24.1
27.2
22.7
23.8
29.5
27.5
28.2
Average
26.2
29.5
25.7
27.7
33.7
28.3
30.7
31.9
31.9
30.5
32.1
32.0
30.1
29.9
31.5
31.7
29.0
30.8
24.8
28.9
26.3
29.9
27.5
26.9
31.5
29.3
29.3
(1018cm-4)
dNL/dw Range
0 to 1.6
0. 3 to 13
4. 0 to 6. 0
4. 4 to 10
0. 22 to 4. 6
0. 60 to 4. 0
0. 27 to 2. 7
11 to 15
3.3 to 5. 6
1.1 to 8. 2
6.2 to 9.0
0.8 to 7.0
6.0 to 16
' 6. 5 to 14
9.0 to 16
0.65 to 12
3. 7 to 18
0.8 to 14
5.1 to 130
3.6 to 22
1.4 to 86
0.67 to 17
1.3 to 82
1.1 to 76
1.9 to 3.8
0.8 to 3.6
0
II-5

As seen in Table I cell shipment CIS consisted of 10 cell lots, lots C13A throughC13J. To provide additional performance comparisons the ten lots comprisinga total of 100 cells were divided into three batches according to lithium gradient,without distinctions between lots. The three photovoltaic parameters, maximumpower, Pmax short-circuit current, open-circuit voltage, VOc. areplotted in Figures 2, 3 and 4, respectively. Batch 1 consisted of 20 cells withgradient ranging from 0. 65 x 1018 to 3. 3 x 1018 cm-4; batch 2 of 40 cells rang-ing from 3. 3 x 10¹⁸ to 9. 0 x 1018 cm~4; and batch 3 of 40 cells ranging from 9. 0x 1018 to 1. 6 x 1019 cm-4.
The data points appear along the abscissa at the average value of dNj_/dw forthe batch and the five ordinates represent ( from top to bottom) the highest value,the values exceeded by 20, 50, and 80 percent of the cells, and the lowest valueof the batch. Equivalent values for a batch of 20 commercial 10 f?-cm n/p ceilsare shown on the left in each figure. The general trends show the power andshort-circuit current to remain approximately constant for the first two batches,then drop for batch 3, while the open-circuit voltage increases monotonicallywith gradient. The maximum power of all lithium batches exceeds that of then/p batch, most of this advantage being due to the higher VQC which is due inturn to the heavier base doping in the lithium cells.
34
33
_§Q. 32
ofLU
O 31Q.
X<
30
< 29I-
28
27
PERCENT CELLSWITH POWER >P
10 SZcm n/p (20 CELLS)
0%
20%
50%
8O%
1 00%
C13 CELLS140 mW/cm2 _TUNGSTEN ~
ILLUMINATION
• BATCH 1 (2O CELLS)
D BATCH 2 (40 CELLS)
OBATCH 3(40 CELLS)
BATCH 3
BATCH 2
10 17 1018 10 19 1020
LITHIUM DONOR DENSITY GRADIENT, dNL/dw (cm'4)
Figure 2. Initial Maximum Power Distributions for C13 Quartz-CrucibleLithium Cells vs Lithium Donor Density Gradients withComparisons of 10 fi-cm Commercial n/p Cells
II-6

0in
01o:£T
O
77
75
73
71
_ 69
QCO
CO67
63
PERCENT CELLS WITHSHORT-CIRCUIT CURRENT >lsc
10 flcm n/p (20 CELLS) 0%
0%
— 20%
— 50%
— 80%
— 100%
C13CELLS140 mW/cm2TUNGSTENILLUMINATION
• BATCH i (20 CELLS)O BATCH 2 (40 CELLS)
O BATCH 3 (40 CELLS)
100%
10 17 ,18 ,1910'° 10'
LITHIUM DONOR DENSITY GRADIENT, dNL/dw (cm"4)
Figure 3. Initial Short-Circuit Current Distributions for C13 Quartz-Crucible Lithium Cells vs Lithium Donor Density Gradientswith Comparisons of 10 fi-cm Commercial n/p Cells
1020
630
620
tjO> 610
600
590
Ucc
580
LUCLO 570
— 560
PERCENT CELLS WITHOPEN-CIRCUIT VOLTAGE >
C13 CELLS140 mW/cm2
TUNGSTEN ILLUMINATION
• BATCH 1 (20 CELLS)
D BATCH 2 (40 CELLS)O BATCH 3 (40 CELLS)
10 £2 cm n/p (20 CELLS)— 0%
55010
-20%— 50%— 80%
100%17
BATCH 1 BATCH 2
•t*-
BATCH 3
* H
1018 1019 10,20
LITHIUM DONOR DENSITY GRADIENT, dNL/dw (cm"4)
Figure 4. Open-Circuit Voltage Distributions for CIS Quartz-CrucibleLithium Cells vs Lithium Donor Density Gradients withComparisons of 10 fi-cm Commercial n/p Cells
H-7

Figures 5 and 6 give curves of initial short-circuit current plotted against lith-ium gradient for cells from the most recent shipment. The cells in Figure 5are quartz-crucible cells, those in Figure 6 are Lopex cells. The data indi-cates a trend toward lower short-circuit current values for high gradients, how-ever, the large spread for a given gradient indicates that the gradient alone doesnot determine initial cell performance. Other noteworthy items in these figures(which were also brought out in Table I) are the wide gradient spreads in theC14 cells, the very narrow spreads in the H13A cells, and the unusually highperformance of the H13A1 (Lopex) cells. The H13A1 cells represented thehighest performance oxygen-lean cell lot received during this contractual effort.
Also worth mentioning is the relatively low open-circuit voltage in the H13A2cells. The average lithium gradient for these cells was approximately 2 x 10¹⁸
cm"4, the average VQC was 576 mV. In comparison the CIS and C14D cellswith comparable gradients had values of approximately 600 mV (see Figure 4).This difference, which became important in recovered cell performance will bediscussed further in Section IIG.
80
75
70
OCDC 65DO
60
u
oin
50
45
© O r,TO
• C14B CELLSO C14D CELLSQ H13A2 CELLS
o •
•••
•
1017 1018 1019 1020
LITHIUM DONOR DENSITY GRADIENT, dNL/dw (cnrr*)
Figure 5. Initial Short-Circuit Current vs Lithium Gradient forQuartz-Crucible Cells - Lots C14B, C14D, and H13A2
II-8

o
tro:ot eooIT
n '"tfc*
• C14A CELLSxmxftXXX X X XX O C14C CELLS
> H13A1 CELLS
O O » o8°
O
O 65 L • •
' • '
.«* '
•
1017 1018 1019 1020 . 1021
LITHIUM DONOR DENSITY GRADIENT, dNL/dw(cm-4)
Figure 6. Initial Short-Circuit Current vs Lithium Gradient forLopex Cells - Lots C14A, C14C, and H13A1
E. DAMAGE COEFFICIENT BEFORE RECOVERY
The diffusion-length damage coefficient, KL, is defined by the equation
KL* •= DT - -~i- (i)
where Lo and L are the minority-carrier diffusion lengths before irradiationand after irradiation, respectively, and $ is the 1 MeV electron fluence. Sincethe lithium cell recovers after irradiation the value of L is time dependent. If,as in these experiments, the damage and recovery stages are separated in time,it is convenient to characterize cell radiation properties by two damage coeffi-cients, (1) the damage coefficient before recovery, KL(O), which characterizesthe fully damaged condition, and (2 ) the damage coefficient after completion ofrecovery, KL(R). This section deals with the damage coefficient before recov-ery. The damage coefficient after recovery is discussed in Section IIG.
The damage coefficient before recovery KL(O), is defined by the equation
n-9

where L(O) is the minority-carrier diffusion length immediately after irradia-tion. In most of the post-irradiation experiments the short-circuit currentrather than the diffusion length was measured as a function of time. Conse-quently a relationship between short-circuit current and diffusion length was re-quired to determine the damage coefficients. Such a relationship was establishedthrough simultaneous measurements of short-circuit current and diffusion length*on a large number of cells. Figure 7 shows a short-circuit current versus diffu-sion length plot for 100 cells from lot CIS. Thirty of these cells were unirrad-iated at the time of measurement, the other seventy were at various stages ofrecovery after irradiation. The data shows a logarithmic relationship, the bestleast-squares fit being obtained with the equation
Isc = 34.41og10L. (3)
Similar relationships were obtained for many other cell lots. In all cases thecoefficient of the right side of the equation was between 34. 0 and 34. 4.
Of the seventy quartz-crucible C13 cells irradiated, seventeen were irradiatedto a fluence of 3 x 10¹³ e/cm2, nine to 1 x 10¹⁴ e/cm2, twenty to 3 x 10¹⁴ e/cm2,eight to 1 x IO15, and sixteen to 3 x 101S e/cm2. The cells were chosen so thatthe cells irradiated to 3 x io13 e/cm2, 3 x 10¹⁴ e/cm2 and 3 x io15 e/cm2 coveredthe widest possible range of lithium gradients. Room-temperature photovoltaiccharacteristics measured under 140 mW/cm2 tungsten illumination were takenon all cells immediately after irradiation. Short-circuit current immediatelyafter irradiation is plotted in Figure 8 versus lithium gradient, dN£/dw, forthe seventy cells.
The points at each fluence fit well along a straight line within the scatter of thedata, all five lines having approximately the same slope. A best least-squaresfit to the equation
ISC(°) = !A(0) - B Iog10 (IO-18 dNL/dw), (4)
where IA is the short-circuit current at the lithium-gradient value of 1 x io18
cm"4, and B is a coefficient giving the gradient dependence, was calculated foreach fluence. The values of B were found to be 8. 4, 8.7, 8.4, 8. 5 and 8. 9for $ = 3 x io13, 1 x IO14, 3 x IO14, 1 x IO15, and 3 x IO15 e/cm2, respectively.
* Obtained from measurements using band-gap light that was calibrated withthe electron-voltaic method using 15 different lithium and n/p solar cells.
11-10

75
70
CC 60CC
CJ
55oCC
o
CCO
3s
50
45
40
(C13 CELLS)
10 20 40 60 80 100
DIFFUSION LENGTH, L (/urn)
200
Figure 7. Short-Circuit Current vs Diffusion Length for 100 Crucible(CIS) Cells Unirradiated, 70 Cells at Various Stages ofRecovery After Irradiation
0= 3 x 10¹³e/cm2
I. - 61.0. B - 8.4
0= 3x 10¹⁵e/cm2 -IA = 39.O, B = 8.9
LITHIUM DONOR DENSITY GRADIENT, dNL/dw (cnT
Figure 8. Short-Circuit Current Immediately After Irradiation vsLithium Gradient for 70 C13 Cells Irradiated by 1-MeVElectrons to Fluences Ranging from 3 x 10¹³ e/cm2 to3 xlO15 e/cm2
n-n

For fluences above 3 x 10¹³ e/cm2, 1/L(O)2 » 1/Lfo in equation (2) and thelatter term can be dropped with less than 10 percent error. This approxima-tion, combining equations ( 2 ) , (3 ) , and (4) , and using B = 8.6 in equation (4) ,gives
KL(0) =10' |dNL
dw (5 )
which is valid for all of the fluences employed except $ = 3 x 10¹³ e/cm2. Forthis lowest fluence KL(O) was calculated taking LQ into account,which is shown in Figure 9, was
The result,
KL(O) = 8.5 x 10⁻¹⁹ (6 )
Thus, at each fluence KL(O) varies with the square root of the lithium gradient.The gradient dependence of KL(O) was also obtained for several other quartz-crucible cell groups. The results are shown in Figures 10, ll, and 12. In allcases good fits to the square-root dependence (straight lines drawn through thedata) were found, with only one experiment (CUB cells, $ = 1 x 10¹⁴ e/cm2,Figure 11) showing a large scatter in the data.
f— IUCO•
8UJ
11 \I _- 10-9
5 s^ _J
-J1
oCO
LLLL 1cr10
Q 1
1 1
C13 CELLS
0= 3 x 10¹³e/cm2
?2*^
^Sf
.^^ ^ KL = 8.5 x 10~19(dNL/dw)'/I
^»•
I I
O17 1018 1019 10:
LITHIUM DONOR DENSITY GRADIENT, dNL/dw (cm-4)
Figure 9.
11-12
Diffusion-Length Damage Coefficient Immediately after Irradi-ation vs Lithium Gradient for 17 C13 Cells Irradiated to aFluence of 3 x 10¹³ e/cm2

10
cozoCJ .LU
-886
— 2
2 -2i
IIC? *
gCO
U-10
2
-10
4.4 x 10~19 (dNL/dw)ya
H3A CELLS 0= 3 x 10¹⁴e/cm2
I i I
10 17 4 6 8 1O19 4 6 8 1020
Q LITHIUM DONOR DENSITY GRADIENT dNL/dw (cm'4)
Figure 10. Diffusion-Length Damage Coefficient Immediately after Irradiationvs Lithium Gradient for H3A Cells Irradiated to a Fluence of3 x 1014 e/cm2
The separation of the curves in these figures at different fluences suggests afluence dependence of Kj_,(O), as does equation 5. The values of KL(O) for agradient of 1 x 1018 cm"4, interpolated from the data of Figures 9 through 12,or calculated from equation 5, are shown in Figure 13 versus 1-MeV electronfluence. There is a strong fluence dependence in the damage coefficient, KL(O)which decreases with increasing fluence. This contrasts with the situation innon-lithium where the damage coefficient is not a function of fluence (i. e., for$ < 1016 e/cm2). The straight line in Figure 13 represents a best least-squaresfit to the CIS-cell data. It suggests a logarithmic fluence dependence where thegradient and fluence dependence of KL(O) is given by the equation
KL(O) = 5.3 xi( 18 (1-0.063 Iog10$) (7)
14Most of the data for the other cell lots in the fluence range from 1 x 10 to3 x 1015 e/cm2 fits well along this line, with the exception of the point for Cllcells at $ = 3 x io14 e/cm2. For the lowest fluence, 3 x 10¹³ e/cm2, the C14Dand H13A2 values are approximately 40 percent above the line. The reasonsfor this divergence are not understood.
The preceding damage-coefficient data was for quartz-crucible cells. Equival-ent data for oxygen-lean lithium cells is not as complete because (1) fewer high-performance oxygen-lean groups have been received, and (2) difficulties wereoften encountered in keeping cell temperature below 0°C during the entire irradi-ation. However, damage coefficients were successfully obtained for C11C cellsand H13A1 cells. These coefficients are plotted versus lithium gradient in Fig-ure 14 for a fluence of 1 x io~14 e/cm2. The data fits reasonably well the depen-dence on the square-root of the gradient indicated in the figure which is the samedependence that was deduced for the crucible cells.
H-13

io-8
UJ
O
OOLLJ(3
1 1 1 T~J 1
• C11B CELLS 0 = 1 x 10¹⁴e/cm2
O C11A, C11D CELLS 0 = 3 x 10¹⁴e/cm2
A C11A, C11D CELLS 0 = 3 x 10¹⁵e/cm2
T 1 T
10-1010 17 1018 1020
LITHIUM DONOR DENSITY GRADIENT, dNL/dw (cm-4)
Figure 11= Diffusion-Length Damage Coefficient Immediately afterIrradiation vs Lithium Gradient for Cll Quartz-Crucible Cells
10-8
9 10-9u_LLLU
10-10
C14D AND H13A2 CELLS
- 3 x 10¹³ e/cm2
~ 3 x 10¹⁴e/cm2
~ 3x 10¹⁵e/cm2
I I j I1017 1018 1019
LITHIUM DONOR DENSITY GRADIENT, dNL/dw (cm-4)
1020
Figure 12. Diffusion-Length Damage Coefficient Immediately after Irradiationvs Lithium Gradient for C14D and H13A2 Quartz-Crucible Cells
11-14

14
I 12CD
o«- 10
8 4
< 2Q
01013
Q C11 CELLS
• C13CELLS& C14D CELLS
O H3A CELLS© H13A2 CELLS
dNLat =
dw1018 cm-4
1014 1015
1 MeV ELECTRON FLUENCE, 0 (e/cm2)
1016
Figure 13. Diffusion-Length Damage Coefficient Immediately after Irradiationvs 1-MeV Electron Fluence for a Lithium Gradient of 1 x 1018 cm"4,Quartz-Crucible Cells
10,-8
_o—I
^
O 10-9
111Oo
10-10
C11C AND H13A1 CELLS
0 = 1 x 1Ql4e/cm2
KL(o) = 1.0 x 1Q-18 (dNL/dw)1/2
1018 1019
LITHIUM DONOR DENSITY GRADIENT, dNL/dw
Figure 14. Diffusion-Length Damage Coefficient Immediately after Irradiationvs Lithium Gradient for C11C and H13A1 Lopex Cells
n-15

The very narrow gradient spread in lot H13A1 (see Table I) precluded the meas-urement of gradient dependence within this lot but provided a good basis formeasurement of fluence dependence of KL(O ) for a (nearly) constant gradient.The twenty-eight cells of this lot were divided into groups of 9, 9, and 10 cellseach which were irradiated to fluences of 3 x 10¹³, 1 x 10¹⁴ and 3 x 10¹⁴ e/cm2,respectively. The lithium gradients averaged over each group were 2. 7 x 1018,2. 8 x 10¹⁸, and 3. 2 x 1018 cm~4; the averaged KO) values were calculated to
LU
be 2. 30 x io~9, 1. 90 x 10~9 and 1.45 x 10~9 e'1, respectively. These KL(O)values, normalized to a gradient value of 3 x 1018 cm"4 through use of the square-root gradient dependence, are plotted versus fluence in Figure 15. The datafits well along the straight line representing a fluence dependence of the form(1-0 . 063 Iog10<|>). This is the same fluence dependence obtained for the quartz-crucible CIS cells. Combining the fluence and lithium gradient dependencies,
KL(0) w 9 xiO-18 (dNL/dw)1/2 (1 - 0.063 Iog10*), (8)
for the oxygen-lean cells, which is 1.7 times the value for quartz-crucible cells(see equation 7 )„
30
CD
O 25
3. 20_l
t-z
15OLL
10
I I
H13A1 CELLS
3x 10*8 cm-4dw
I I | I J I
1015
LITHIUM DONOR DENSITY GRADIENT, dN|_/dw (cm-4)
Figure 15. Diffusion-Length Damage Coefficient Immediately after Irradiationvs 1-MeV Electron Fluence for a Lithium Gradient of 3 x 10¹⁸
cm"4 Lopex Cells
11-16

It should be stated that equation (8) , while valid for the cells tested, is based onrelatively few measurements. Thus its general applicability to oxygen-lean cellsmust be tested for a wider variety of such cells. Equation (7 ) , on the other hand,was found to be approximately correct for all but one of a large number of quartz-crucible cell groups for fluences ranging upward from 1 x 10¹⁴ e/cm2 and cantherefore be used with greater confidence of general applicability. As the scatterin data indicates (Figures 9 to 12 and 14), both equations give approximationsfor KL which can be off by as much as 50 percent for a given cell. This doesnot negate their value; uncertainties of almost equal magnitude appear in resultson non-lithium cells.
F. RECOVERY CHARACTERISTICS
Short-circuit current is plotted versus time in Figure 16 for quartz-cru-cible cell C13E18 during recovery at 80° C. This figure illustrates the shape ofa typical lithium-cell recovery curve where the recovery rate, dl/dt, is highestat zero time then decreases to dl/dt = 0 at the completion of the recovery stage.It is usually more instructive to plot current on a logarithmic time scale (Ref-erence 4) as shown in Figure 17. This expands and enables closer examinationof the early phase of recovery. (The scale compression at long times also en-ables the plot to be carried out further in time.)
The time to half recovery, p, illustrated in Figure 17, is defined by the equa-tion and condition
i sc(R)- isc( t ) atISC<R)- ISC(O) ° '
where I (O) is the short-circuit current at time O, and I(R) is the short-circuitcurrent at peak reocvery and Lgc(t) *s the short-circuit current at time t afterbombardment. This time provides the most accurately-defined index of (inverse)recovery speed since it occurs near the maximum slope of the recovery curve.In the recovery experiments, short-circuit current plots similar to Figure 17were obtained for more than 200 lithium cells fabricated from both quartz-cru-cible silicon and oxygen-lean silicon. The lithium gradients, dNj_/dw, for allof these cells had been obtained from pre-irradiation capacitance measurements.
Results of recovery experiments on quartz-crucible C13 cells are shown in_Fig-ure 18, in which Q is plotted versus dNL=dw for cells irradiated to fluences of3 x 1013, 3 x 10¹⁴ and 3 x 10¹⁵ e/cm2. The data points on these logarithmic plotsfit well along straight lines with slope of minus one for each fluence. Thus, fora given fluence the produce 0dNj_/dw is approximately constant, i. e. , the speed
H-17

oCO
LLItrccDO
DODCO
OCO
co
60
— 45
; r :—| —CELL C13E18. dNL/dw = 1.5 x 1019 cm'4
0 = 3 x 10¹⁴e/cm2
RECOVERY TEMP = 80°C
I I
2 3
RECOVERY TIME (DAYS)
'5
Figure 16. Short-Circuit-Current Recovery Curve for Cell C13E18,Short-Circuit Current vs Time
CELL C13E18. dNL/dv» - 1.5 X 10l9cm~*
0- 3x 10 l4e/cm2
RECOVERY TEMP - 80°C
LUECEE
(JOC
OCOx
RECOVERY TIME (DAYS)
Figure 17. Short-Circuit-Current Recovery Curve for Cell C13E18,Short-Circuit vs Log-Time
11-18

io'
in
- 101->-a:UJ
8ai<r
O 10-1
LU
5
10'
C13 CELLSRECOVERY TEMP = 80°C
,1910'° 10'
LITHIUM DONOR DENSITY GRADIENT, dNL/dw (cm4)
Figure 18. Time to Half Recovery vs Lithium Gradient for Quartz-CrucibleCIS Cells at a Recovery Temperature of 80°C (MeasurementTemperature = 26° C)
of short-circuit current is linearly proportional to the lithium gradient. Theseparation of the curves at different fluences indicates a dependence of recov-ery speed on fluence. Figure 19 gives similar plots for quartz-crucible cellsfrom several different cell lots which recovered at room temperature (the CIScells recovered at 80° C). The two lower fluences in Figure 19 are only a fac-tor of 3 apart (1 x IO14 and 3 x IO14 e/cm2), and the data scatter results in over-lapping of the points for these fluences. However, as was the case for the Cl3cells, the average value of gdNi/dw (indicated by the straight lines ) increaseswith increasing fluence, being 2.6 x IO20, 4. 6 x IO20, and 1. 8 x IO21 days/cm4
for 1 x io14, 3 x io14, and 3 x IO15 e/cm2, respectively, the fluence dependenceof recovery speed is further indicated in Figure 20 in which the 0dNL/dw prod-ucts for all seventy irradiated C13 cells are plotted versus fluence at a storagetemperature of 80° C. Here again the scatter in the data results in overlappingof the ranges of products at any two adjacent fluences. However, a fluence de-^pendence is evident, and the best least-squares fit to the averages at each fluenceis given by Equation (10).
= 2.9 x IO9 $ 0. 59, (10)
n-i9

103
CCCC
O
DOccO
GCOXC/5
102
10'
QUARTZ CRUCIBLE CELLSRECOVERY TEMP = 26°C
"• 1 x 1 <j1 4 e/cm2
O 3x 10¹⁴e/cm2
A3x 1015 e/cm2
I
1017 1018 1019
LITHIUM DONOR DENSITY GRADIENT, dNL/dw (cm-4)
Figure 19. Time to Half Recovery vs Lithium Gradient for Quartz-CrucibleCells at a Recovery Temperature of 26° C
tooDQOCCQ.
LU o
Q C/V
** "o £
19
18
£<oo111CC
1017
109 0^
0.59
1013 10' 1016
1-MeV ELECTRON FLUENCE,0 (e/cm2)
Figure 20. Product of Time to Half Recovery and Lithium Gradient, 0dNL/dw,vs 1-MeV Electron Fluence for CIS Cells
11-20

In spite of the scatter all but one of the seventy data points lie within a factorof two of this line. Likewise, the data of Figure 19 obtained at a storage temp-erature of 26°C show a similar fluence dependence, where the best fit is a 0. 57power dependence on fluence. Fitting to a 0. 59 power dependence the equationfor the cells in Figure 19 is given
9dNL/dw = 1. 5 x 10¹²$ 0. 59, (11)
which is 520 times the right side of equation (10). This ratio, together with thetwo recovery temperatures of 80° and 26° C enable calculation of the recoveryactivation energy. This was found to be 1.1.eV, which is the published value(Reference 5) for lithium diffusion in quartz-crucible silicon. Insertion of thisactivation energy into equation (10) results in a relationship between time tohalf recovery, 0, lithium gradient, dNL/dw, and cell temperature, T,
(1 28 X 104\;j ) « (12)
which holds for crucible cells for the temperature range between 26°C and-80°C.
Extensive recovery experiments were also performed on oxygen-lean lithiumcells. A large number of oxygen-lean cells from past shipments were irradi-ated to fluences ranging from 3 x 10¹³ e/cm2 to 3 x 10¹⁵ e/cm2. Cells fromTexas Instruments, Heliotek and Centralab* of both Lopex and Float-zone sili-con were represented. They included a wide range of diffusion schedules andinitial performance levels.
The values of Q for the Centralab and Heliotek cells are plotted against lithiumdensity gradient in Figure 21 for three fluences ranging from 3 x 10¹³ to 3 x 101S
e/cm2. Included are all the Heliotek and Centralab cells tested in this experi-ment except those of lots C4 and C5 and those with lithium gradients greaterthan 1020 cm"4. The points on these logarithmic plots fit well along straightlines with slopes of minus one indicating a linear relationship between recoveryspeed and lithium gradient. There are two cell lots that do not follow thesecurves, namely, lots C4 and C5, which recover at a faster rate than the curvespredict. These two lots had already been identified as mavericks (Reference 6,also Section III), having been shown to suffer open-circuit voltage instability dueto a decrease in lithium gradient with time. In addition, cells with gradientsgreater than 1020 cm~4 (C10C and C10F cells) recovered more slowly at low flu-ence than predicted by the curves. A feasible explanation for this is that thegradient in these cells is not a good index of the average lithium density nearthe junction. The capacitance measurements give evidence of this in the form
* Lots T3, T4, T5, T6, T7, T9, T10, H5, H7, H1A, H5A, H7A,'H( NASA-furnished in 1967), C4, C5, C8F, ClOC, C10F, and C11C were represented.
E-21

10'
CO
Q
OS
cc.LU
8UJ<r
OXYGEN-LEAN CELLS
RECOVERY TEMP. = 26°C
0,
10 17 ,18 10191020
LITHIUM DONOR DENSITY GRADIENT, dNL/dw (cm'4)
Figure 21. Time to Half Recovery vs Lithium Gradient for Float-Zoneand Lopex Cells Manufactured by Centralab and Heliotek ata Recovery Temperature of 26°C
of a leveling off of the lithium density; i. e., a decrease in gradient, at distancesof less than 1 micrometer from the junction. It should be noted that this levelingoff was observed only in cells with dNj^/dw > 1020 cm~4 and in some C4 and C5cells (see Section III).
A puzzling anomaly was observed in the case of the oxygen-lean T cells whichare represented in Figure 22. While the constancy of the 6dNj_/dw product wassatisfied by these cells at each fluence, the products were approximately an or-der of magnitude higher than the equivalent products for the Centralab and Heli-otek cells. This discrepancy, which can be seen by comparing Figure 22 with 21,is not understood at present. One of the main differences between the manufac-turers is that the Tl cells have used an evaporated lithium source whereas all ofthe oxygen-lean C and H cells in this experiment have used a paint-on source.It would seem more likely that a difference in silicon type would cause differ-ences in recovery rate. This would be particularly feasible for Lopex versusfloat-zone recovery since the oxygen-content is generally higher in Lopex sili-con. However, as Figure 21 indicates, the same recovery rate applies for bothLopex and float-zone C and H cells.
11-22

>Q
1>
ccw 10°OoLLJCCu.
<IO
LU
LOPEX CELLS(Tl CELLS)
0 3 x 10¹³ e/cm2
O 3 x 10¹⁴e/cm2
& 3 x 10¹⁵ e/cm2
, i I .W]QU "\Ql8 10^9 IQ^Q
LITHIUM DONOR DENSITY GRADIENT, dNL/dw(cm-4)
Figure 22. Time to Half Recovery vs Lithium Gradient for Lopex CellsManufactured by Texas Instruments at a Recovery Tempera-ture of 26°C
Fluence dependence of the recovery speed for the Centralab and Heliotek oxy-gen-lean cells is shown in Figure 23 in which the recovery time-gradient product,0dN-L/dw is plotted versus fluence. For fluences up to 1 x 10¹⁵ e/cm2, thisproduct has approximately the same form of fluence dependence, namely,
= 2. 0 x 109 $ 0. 59 (13)
as that of the crucible cells. The coefficient of the right side of equation (13)is a factor of 750 below that of equation (12) which describes the recovery ofcrucible cells at room temperature. This is very close to the ratio of 1000 be-tween the room-temperature lithium diffusion constants in oxygen-lean silicon
H-23

1019
OOcrQ.
LU
§ -< >o 2LU —
> zOC -OLU OS
i°
LUCC
18
1017
1013 10141015
1-MeV ELECTRON FLUENCE. 0 (e/cm2)1016
Figure 23. Product of Time to Half Recovery and Lithium Gradient,9dNL/dw, vs 1-MeV Electron Fluence for Float-Zoneand Lopex Cells Manufactured by Centralab and Heliotek
and oxygen-rich silicon (References 5, 7). Above 1 x 10¹⁵ e/cm2 the recoverytime increases at a more rapid rate with fluence. It is conjectured that this isdue to severe losses in lithium during irradiation to the high fluence of 3 x 10¹⁵
e/cm2.
One final recovery experiment was recently performed on CIS cells from thelatest cell shipment. The experiment was performed to provide another checkon previous data, the CIS (oxygen-lean) cells providing a severe test due totheir wide lithium gradient range (from 1.1 x 10¹⁸ to 8. 2 x 1019 cm"4). Twenty-one cells were irradiated to a fluence of 3 x 10¹⁴ e/cm2 and recovery curveswere measured. The results are shown in Figure 24, in which the linear rela-tionship between lithium gradient and recovery speed is shown to hold over theentire gradient range. The GdNi/dw product for these cells was 1.1 x 10¹⁸
days/cm4, approximately 50 percent above (and thus in good general agreementwith) the average (Figure 23) for oxygen-lean cells previously tested.
H-24

CO
DCUJ
8HIQC
O
LU
10-1
10
r— — i T-T-| r- C15A AND C15B CELLS
0 = 3x 10¹⁴e/cm2
0dNL/dw = 1.1 x 10¹⁸ DAYS/cm4 -
-21Q18 1019
LITHIUM DONOR DENSITY GRADIENT,
Figure 24. Time to Half Recovery vs Lithium Gradient for C15A andC15B Lopex Cells at a Recovery Temperature of 26°C
G. POST-RECOVERY PERFORMANCE
1. Damage Coefficient and Short-Circuit Current
After reaching peak recovery a significant fraction of oxygen-lean cellsexperience a loss in short-circuit current (see Section III). This phenomenon,called redegradation, renders a post-recovery damage coefficient ambiguoussince it would be a function of time. However, in most quartz-crucible lithiumcells the post-recovery current remains relatively stable, and meaningful post-recovery damage coefficients can be evaluated. These coefficients were calcu-lated from post-recovery short-circuit current measurements on a group ofcurcible cells (the C13 cells). The measurements were made after post-irradi-ation storage for one month at 80°C followed by four months at 90°C. The re-covery times for most of the cells were a small fraction of this storage time,so the values reflect the long-term behavior of the cells.
The damage coefficient after recovery Ki_,(R), is defined by the equation
K L ( R ) $ = 1 l(14)
11-25

where L(R) is the diffusion length after recovery. It was calculated from theshort-circuit current measurements and equation (3). Results for the C13 cellsirradiated to fluences of 3 x 10¹³, 3 x 10¹⁴, and 3 x 10¹⁵ e/cm2 are shown in Fig-ure 25 where KL(R) is plotted versus lithium gradient. The values for cells ir-radiated to 3 x 10¹³ e/cm2 vary approximately as the square root of the lithiumgradient. As the fluence increases the scatter in the data increases and thegradient dependence becomes weaker until a fluence of 3 x 10¹⁵ e/cm2 is attainedwhen there is no discernible gradient dependence.
This is further illustrated in Figure 26 in which the short-circuit currents areplotted versus gradient. The current values after recovery from 3 x 10¹⁵ e/cm2
show very little gradient dependence while those at the lower fluences show sub-stantial increases with decreasing gradient. Final short-circuit current values(after post-irradiation storage for five days at 90°C) measured for irradiatedn/p control cells are also shown in Figure 26. For each fluence the values liewithin the range of the recovered CIS-cell values. Thus the post-recovery short-circuit current values for high quality quartz-crucible lithium cells are compar-able to those for commercial 10 O-cm n/p cells irradiated by 1-MeV electronsto the same fluence.
10-9
UJ
5 icr10
u_u_LLJOO
LU
icr
C13 CELLS
I '
• 3x 10¹³e/cm2
O 3x 10¹⁴e/cm2
A 3 x 10¹⁵ e/cm2
1017 1019 102°
LITHIUM DONOR DENSITY GRADIENT, dN|_/dw (cm~4)
Figure 25. Diffusion-Length Damage Coefficient after Recovery vsLithium Gradient for C13 Cells
11-26

75
_ 70<
CJW 65
CC 60cr•DO
5.-occo
QCOIto
50
45
40
1 1—i—r i i I i | 1 1—i—I i I If"* 3x 10¹³e/cm2
C13 CELLS <t> = < O 3 x 10¹⁴e/cm2
l& 3 x 10¹⁵e/cm2
n/p (3x 10¹³)
— >n/p (3 x 10¹⁴)
0
o o ©
(3 x 10¹⁵)
1018
LITHIUM DONOR DENSITY GRADIENT, dNi_/dw
102°
Figure 26. Short-Circuit Current after Recovery vs LithiumGradient for C13 Cells with Comparisons to10 fi-cm Commercial n/p Cells
The degree of cell recovery can be obtained through comparisons of KL(R) andKL(O). After recovery from bombardment by 3 x 10¹³ e/cm2, the damage coef-ficient is given by -
K L (R) = 8 x l(T20 (dNL/dw)1/2 (15)
which is approximately one tenth of K L ( O ) at this fluence (Figure 9). For cellsirradiated to 3 x 10¹⁴ e/cm2, K L ( R ) ~ 6 x 10~U e"1 and KL(O) « 5 x 10~10 for agradient of 1018 cm"4. Thus for cells irradiated to fluences < 3 x 10¹⁴ e/cm2,KL(R) /KL(O) ^ O. I; i. e., approximately nine tenths of the effective damagecenters are annealed out during recovery. For cells irradiated to 3 x 10¹⁵
e/cm2 K L ( R ) fa 5 x 10"11 e"1 for all gradients while the KL(O) values are ap-proximately 5 x 10~10 e-1 and 1.6 x 10⁻¹⁰ e"1 for gradients of 1 x 1019 cm~4 and1 x 1018 cm~4 , respectively. Thus for this fluence, nine-tenths recovery occursin only the high gradient (~ 1019 cm"4) lithium cells, while for the cells withgradient (~ 1018 cm"4), KL(R) /KL(O) « 0.3, that is only seven tenths recoveryoccurs.
H-27

2. Open-Circuit Voltage
Open-circuit voltage after recovery, VQC» is plotted against lithium gra-dient for CIS cells in Figure 27 together with the values obtained for the n/p con-trol cells. Similar data is plotted for C14D (quartz-crucible) cells in Figure 28.These two figures are highly significant in that they show (1) that the advantagethe lithium cells hold over the 10 Q.-cm n/p cells is in open-circuit voltage, aswas the case in pre-irradiation comparisons (Figure 4), and (2) that as fluenceincreases the dependence of recovered open-circuit voltage on lithium gradientbecomes increasingly pronounced. After recovery from fluences of 3 x 10¹³ and3 x 1014 e/cm2, the lithium cells have open-circuit voltages averaging approxi-mately 40 mV above the n/p cell values. After recovery from 3 x 10¹⁵ e/cm2
only the high gradient (> 1019 cm~ 4) cells maintain this advantage. The dataindicates approximately 20 and 25 mV increases in VQC Per decade of lithiumgradient after recovery from 3 x 10¹³ and 3 x 10¹⁴ e/cm2, respectively. How-ever, after recovery from 3 x 10¹⁵ e/cm2, VQC increases with lithium gradientat a rate of approximately 50 mV per decade for both C13 cells and C14D cellsindicating a stronger gradient dependence at high fluence. This strong gradientdependence is highly important to cell performance. It (together with the lowdegree of short-circuit current recovery) indicates very significant lithiumdonor density losses in the lightly doped cells at high fluence.
610
600
580
_§
^>
llf
560
54O
l_ 520
5oorO 500
Q_
9 480
l) n/p (3 x 10\3j
Z\ n/p(3x1014)
n/p <3x
O o
4601017
C13CELLS
3x 10¹³ e/cm2
O 3x 10¹⁴e/cm2
e/cm2
1018 1019 1020
LITHIUM DONOR DENSITY GRADI ENT, dNL/dw (cm'*)
Figure 27. Open-Circuit Voltage after Recovery vs Lithium Gradient for C13Cells with Comparisons to 10 £?-cm Commercial n/p Cells
11-28

610
600
> 580
U560
<
540
O 520
111Q. 500O
480
I\ n/p <3x 10¹³)
^Z\n/p(3 x 1014)
[iC14D CELLS
3x 10¹³e/cm2
3 x
470
1017
=}n/p(3x
L. i i i i i i i I i i i i i i
1018 1019 102°
LITHIUM DONOR DENSITY GRADIENT, dN[_/dw (cm'4)
Figure 28. Open-Circuit Voltage after Recovery vs Lithium Gradient for C14DCells with Comparisons to 10 fj-cm Commercial n/p Cells
3. Maximum Power
Maximum power after recovery is plotted versus lithium gradient for C13cells and C14D cells in Figures 29 and 30, respectively. Equivalent values forn/p control cells are also indicated. These plots show that for low and interme-diate fluences (3 x 10¹³ and 3 x 10¹⁴ e/cm2) there is no uniform trend in maximumpower as a function of lithium gradient. However, a slight trend toward lowerpower for gradients above approximately 5 x 1018 cm 4 in the C13 cells, and astronger trend in the C14D cells, can be seen. This is partly due to the higherdamage coefficients in the high-gradient cells (Figure 25) and partly due to theirlower initial performance (Figure 2). However, at the highest fluence of 3 x 10¹⁵
e/cm2 the open-circuit voltage effect (Figures 27 and 28) comes strongly intoplay and a significant trend toward higher power at higher lithium gradients be-comes evident. Not much power difference is seen on the average between4 x 1018 cm"4 and the highest gradient (again, partly due to the higher initialpowers of the cells in the gradient range from about 4 x 10¹⁸ to 7 x 1018 cm"4).However, cells with gradients below 4 x I018-cm~4 have significantly lower power.
II-29

30
28
Q.
DCLLJ
OQ.
26
24
rp 20
18
16
14
1 - 1 —
Sn/p (3 x 10¹³>
GE>
0 =
p (3x 10¹⁴)
C13 CELLS
'•3 x 10¹³e/cm2
O3 x 1014e/cm2
^3 x 101 5 e/cm2
C13 CELLS
n/p (3 x 10¹⁵)
_l l_
o
' '1017 1018 1019
LITHIUM DONOR DENSITY GRADIENT dN|_/dw (cm-4)
102°
Figure 29. Maximum Power after Recovery vs Lithium Gradient for C13 Cellswith Comparisons to 10 O-cm Commercial n/p Cells
30
28
1 26
Q_
DCUJ
OQ.
24
22
X 20
18
16
14
1 - 1
n/p (3x 10¹³)
n/p <3 x 10¹⁴)
C14D CELLS
• 3x 10¹³ e/cm2
O 3x 1O14 e/cm2
A 3 x 10¹⁵ e/cm2
n/p (3x 10¹⁵)
. I
&
,]_
1017 1018 1019
LITHIUM DONOR DENSITY GRADIENT. dNL/dw (cm'4)
1020
Figure 30. Maximum Power after Recovery vs Lithium Gradient for C14D Cellswith Comparisons to 10 O~cm Commercial n/p Cells
11-30

After recovery from 3 x 10¹³ e/cm2 all but five of the twenty-two CIS. and C14Dcells have higher power than the highest n/p cell. The averaged maximumpower for the lithium cells is 28. 8 mW approximately 8 percent higher than the26.8 mW for the n/p cells. After recovery from bombardment by 3 x 10¹⁴ e/cm2,all twenty-nine of the lithium cells have higher power than the highest n/p celland their averaged maximum power is 24. 4 mW, which is 14 percent better thanthe 21. 3 mW for the n/p cells. After recovery from 3 x 10¹⁵ e/cm2 all sixteenlithium cells with gradient above 4 x 1018 cm"4 have higher power than the high-est n/p cell. The averaged maximum power for these sixteen lithium cells is17.4 mW which is approximately 10 percent above the 15.8 mW for the n/p cells.However, of the nine lithium cells with gradients below 4 x 1018 cm"4, only threehave higher power than the highest n/p cell. The other six all have powers be-low the lowest n/p cell. It is clear from these results that higher lithium gra-dients are required in a heavy radiation environment. (Certainly above 4 x 10¹⁸
cm~4 but, to be safer, above 1 x 1019 cm"4.) For a light to moderate environ-ment (up to a fluence of 1014 e/cm2), gradients in the range between about3 x 1018 and 7 x 1018 cm"4 are near optimum due to their higher initial performance.
The H13A2 (crucible) cells were irradiated with the C14D cells. Post-recoveryperformance of the H13A2 cells was disappointing in view of their good initialperformance. Comparison of the current-voltage characteristics of the H13A2cell with those of the C13 and C14D cells led to the discovery that the basic dif-ference is in open-circuit voltage. The H13A2 cells had lithium gradients near2 x 1018 cm"4 and initial open-circuit voltages between 570 and 580 mV. TheC14D cells with gradients near 2 x 1018 cm"4 had initial values between 580 and597 mV; the CIS cells, between 589 and 610 mV (see Figure 4). The C14Dcells also had lower VQC values after recovery from irradiation, and the resultwas lower maximum power. After recovery from bombardment by 3 x 1013,3 x 1014, and 3 x 101S e/cm2, the maximum powers averaged over the cells ateach fluence were 26. 9 mW, 22. 6 mW and 13. 9 mW, respectively. It is con-jectured that this difference in VQC between the H13A2 cells and the C14D andCIS cells with similar gradients could be due to the differences in lithium diffu-sion schedules. The C14D and C13 cells used a straight diffusion with no redis-tribution whereas the H13A2 cells received a diffusion followed by a redistribu-tion (Table I). The redistribution has been shown (Reference 8) to reduce thelithium density near the back contact. Such a reduction could be responsible forthe lower voltage in the H13A2 cells.
The Lopex cells of lot H13A1 were irradiated to one of three fluences 3 x lo13
e/cm2, 1 x 10¹⁴ e/cm2 or 3 x 10¹⁴ e/cm2. As noted previously these cells hadvery high initial performance with a narrow lithium gradient distribution cen-tered about 2 x io18 cm"4. Detailed recovery characteristics were not measuredon these cells, however their photovoltaic characteristics were measured after50 days storage at room temperature which results on previous results have
H-31
shown to be near the time of peak recovery. The photovoltaic measurements in-dicate maximum powers of 28. 9, 27. 5 and 25.1 mW for cells irradiated to3 x 1013, 1 x 10¹⁴, and 3 x 10¹⁴ e/cm2 respectively. These values were obtainedby averaging over groups of nine, nine, and ten cells, respectively.
11-32

SECTION III
LITHIUM CELL STABILITY
A. GENERAL
One of the problems with lithium cells has been their tendency to experiencepower losses after reaching peak recovery. This phenomenon, which has beennamed redegradation, was observed early in experiments on lithium cells(Reference 9) and has since been related to several separate physical phenomena(References 6 and 10) including decrease in short-circuit current, decrease inopen-circuit voltage, increase in series resistance, and degradation of junctioncharacteristics. This section gives results of long-term performance andstability measurements on both quartz-crucible and oxygen-lean lithium cellsand discusses specific modes of cell instability in relation to the physical pro-cesses occurring in the cell.
B. PRE-1970 LITHIUM CELLS
Long-term performance and stability experiments were conducted on alarge number of lithium-containing solar ceils furnished by JPL under the pres-ent contract and previous JPL Contract No. 952249. These cells, manufacturedby Centralab, Heliotek, and Texas Instruments, and some 10 ohm-cm commer-cial n/p cells were irradiated by 1-MeV electrons from a Van de Graaf generatorat a rate of »4 x 10¹³ e/cm2-min to one of the following fluences: 1 x 10¹⁴, 3 x 10¹⁴,
^5 x 10¹⁴*, or 3 x 10¹⁵ e/cm2. The cells were stored in the dark at room temp-erature and all irradiations were performed at room temperature. Measurementsof cell photovoltaic characteristics have been made periodically with illuminationby a 140 mW/cm2 tungsten light source with long term reproducibility within 2percent. Test durations range up to 1023 days after irradiation.
Performance levels of quartz-crucible and oxygen-lean lithium cells are givenin Tables II and III, respectively. Each table is divided into three parts re-presenting cells irradiated to low, intermediate, and high fluences. In thefirst column of Tables II and III cell groups are listed. The letter and firstnumber represent the cell lot to which the group belongs. The number inparenthesis is the designation given when the cells were divided into groups forirradiation. In Table HI, F and L refer to float-zone and Lopex, respectively.The second column lists the number of cells in the group. Table II also liststhe initial n-type dopant; the oxygen-lean cells (Table III) all had phosphorus
*In one such irradiation, the cells were erroneously exposed to 8 x 10¹⁴ e/cm2
of »0.7 MeV electrons.
III-l

TABLE II. PROPERTIES AND PERFORMANCE OF PRE-1970 CRUCIBLE-GROWN LITHIUM CELLS AND COMPARISONS WITH COMMERCIAL
10 ohm-cm n/p CELLS
Cell GroupNo. ofCells
DopantdN /dw
-4(cm )
Cell Power (mW)
Initial
Li cell n/p
After Irrad.
Li cell n/p
Latest Reading
Li cell n/p
T.A.B.(days)
1 . c\
(A) Low Fluence, 1 x 10 e/cm
C2(l)
Cl( l )
H2 (1)
HI (1)
5
7
9
8
Sb
As
P
As
IxlO18
1X10¹⁸
IxlO19
2X10¹⁹
30.3
30.3
26.0
21.7
28.1
28.1
28.1
28.1
17.9
18.6
17.0
15.7
21.3
21.3
21.3
21.3
22.5
25.0
23.6
20.2
23.3
23.3
23.3
23.3
1023
1023
551
551
14 2(B) Intermediate Fluence, 3 to 5 x 10 e/cm
C2 (2)
C6A (1)
C6B (1)
C6C (1)
C5 (5)
*C1 (2)
T8 (1)
H2 (2)
H6 (1)
*H1 (2)
C5(l)
2
3
3
3
3
2
3
2
3
2
3
Sb
Sb
Sb
P
P
As
P
P
P
As
P
IxlO18
IxlO18
IxlO18
IxlO18
IxlO18
IxlO18
IxlO19
IxlO19
IxlO19
2xl019
5xl019
30.3
28.2
29.3
28.1
30.9
31.8
26.1
24.3
24.7
17.4
25.0
27.7
28.2
28.2
28.2
28.2
28.4
28.2
27.7
28.2
28.4
28.2
14.8
15.1
15.7
16.0
16.6
13.8
12.6
13.5
14.0
10.8
13.0
17.7
19.5
19.5
19.5
19.5
16.6
19.5
17.7
19.5
16.6
19.5
15.7
15,5
17.0
17.4
21.8
16.9
20.5
19.8
21.3
15.8
20.7
18.9
20.9
20.9
20.9
20.9
18.9
20.9
18.9
20.9
18.9
20.9
483
266
266
266
740
483
740
957
957
483
266
15 2(C) High Fluence, 3 x 10 e/cm
C2 (3)
C6A (2)
C6B (2)
C6C (2)
C5 (6)
T8 (2)
H6 (2)
H2 (3)
C5 (2)
2
3
3
3
3
3
3
3
3
Sb
Sb
Sb
P
P
P
P
P
P
IxlO18
IxlO18
IxlO18
IxlO18
IxlO18
IxlO19
IxlO19
IxlO19
5xl019
30.1
28.9
28.9
.28.3
28.4
26.1
20.9
25.2
25.1
28.4
28.3
28.3
28.3
28.3
28.3
28.3
28.4
28.3
10.7
9.7
10.1
10.7
11.0
8.5
9.5
9.9
8.2
13.9
14.2
14.2.
14.2
14.2
14.2
14.2
13.9
14.2
10.9
.9.8
10.1
10.7
11.2
12.1
13.4
15.8
15.1
15.6
15.6
15.6
15.6
15.6
15.6
15.6
15.6
15.6
483
266
266
. 266
740
740
740
957
266
T. A.B indicates time after bombardment at latest reading.* o K 8 x 10¹⁴e/cm2 of « 0.7 MeV electrons
III-2

TABLE m. PERFORMANCE, AND STABILITY OF PRE-1970 FLOAT-ZONEAND LOP EX LITHIUM CELLS
Cell GroupNo. ofCells
dN /dw
(cm"4)
Cell Power (mW)
Initial After Irrad. ReceoveredLatest
Reading
T.A.B."(Days) % Redegradation
14 2(A) Low Fluence, 1x10 e/cm
C4(9) F
T2 (1)
C4 (17) F
C4 (5) F
C4 (13) F
C4 (1) F
T3 (1) L
4
6
4
4
4
3
3
IxlO18
3xl018
3X10¹⁸
2xl019
4xl019
5X10¹⁹
2xl02°
21. f
26.8
19.6
17.7
15.0
15.8
*(61.6)
16.6
16.5
16.0
15.3
13.6
14.2
(45.8)
21.1
23.6
19.5
17.4
14.4
15.3
(57.7)
20.0
23.4
18.5
16.0
13.6
14.0
(53.5)
483
549
483
483
483
483
483
5
1
5
8
6
8
(8)
' 14 2(B) Intermediate Fluence 3 to 5x10 e/cm
H5 (1) F
C4 (10) F
C5 (7) F
C4 (18) F
C4 (6) F
H7 (1) L
T6 (1) L
T7 (1)
C4 (14) F
C5 (3) F
C4 (2) F
T9 (1) L
T3 (2) L
T4 (1) F
T5 (1) L
T10 (1) L
3
3
3
3
3
3
3
3
3
3
3
3
3
3
3
3
<io17
181x10
IxlO18
3xl018
2X10¹⁹
2xl019
3xl019
3X10¹⁹
194x10
4X10¹⁹
5X10¹⁹
5X10¹⁹
202x10
202x10
203x10
3xl02°
28.7
20.3
21.6
20.8
17.5
24.1
26.8
25.2
15.3
17.5
15.8
26.9
*(60.4)
22.9
25.2
22.8
. 12.3
12.1
11.2
12.7
12.1
13.8
12.1
10.8
12.6
13.3
12.2
10.9
(30.5)
15.3
11.4
12.3
13.8
17.9
17.8
19.5
16.7
22.0
21.0
19.4
14.7
16.1
14.8
21.1
(46.7)
19.5
20.5
19.9
13.8
17.6
17.8 '
19.1
15.6
21.1
20.6
18.7
13.9
15.5
13.8
19.1
(42.2)
17.2
18.2
15.9
266
483
266
483
483 -
740
740
266
483
266
483
650
483
740
740
650
0
2
0
2
7
4 ' .. .
•2
4 ,
6 .
4
7
10
(10)
11 ' '1120
15 '2(C) High Fluence 3x10 e/cm
T2 (3)
C4 (19) F
C4 (7) F
H7 (2) L
T6 (2) L
T7(2)
C5 (4) F
C4 (15) F
T9 (2) L
C4 (3) F
. T3 (3) L
T10 (2) L
T4 (2) F
T5 (2) L
2
3
3
3
3
3
3
3
3
3
3
3
3
3
3X10¹⁸
183x10
2X10¹⁹
192x10
193x10
3xl019
3xl019
4xl019
5X10¹⁹
195x10
202x10
203x10
3xl02°
4X10²°
*(68.8)
20.0
17.7
22.8
*(69.6)
*<70.5)
16.6
15.1
26.6
15.3
23.1
*(56.5)r
22.3
23.4
(31.8)
8.7
8.1
8.5
(24.5)
(25.3)
9.5
9.5 .
6.5
9.1
7.9
- (22.3)
7.9 .
7.5
(49.6)
12.3
14.3
15.5
(49. 7)_
13.6
13.4
14.5
Kt.4
14.7
(36.2)
13.6
13.5
(49.6)
12.3
14.3
15.5
(49.7)
—13.6
13.2 •
14.5
12.7
13.9
(34.5)
12.9
12.2
483
483
483
266
266
266
266
. 483
170
483
483
170
266
266
(0)
0
0
0
(0)
(0)
0
1
0
5
6
(5)
5
10
•Numbers in parentheses indiate short circuit current (mA)5% Pre - Irradiation Degradation
**T. A.B - Time after bombardment to latest reading
III-3

as the initial dopant. A lithium gradient is listed for each cell group. However,it is usually based on measurements on only one cell of the group and thus is notnecessarily representative of the entire group. Both tables list cell maximumpower (averaged over the cell group) before irradiation, immediately afterirradiation, and at the most recent reading. Table II in addition lists thecorresponding values for similarly irradiated n/p control cells. The finalcolumn in Table III gives the percent degradation of maximum power (in a fewcases, of short-circuit current) from the peak recovered value as of the mostrecent reading. No such column appears in Table n since none of these quartz-crucible groups experienced significant redegradation.
Several of the crucible cell groups had initial powers comparable to or abovethe n/p cells (cf, columns 5 and 6) . Immediately after irradiation (columns7 and 8), the p/n lithium cells show greater damage. This is as expectedsince the damage introduction rate in n-type silicon is greater than that inp-type silicon. Of the four lithium cell groups irradiated to 1 x 10¹⁴ e/cm2,two [Cl (1) and H2(l)] have recovered to powers greater than the recoveredn/p values. Group C2(l) is below the n/p level; however, the C2(l) cells arestill recovering (this was true when this report was finalized) . The C2, C6A,and C6B cells which were made from silicon doped with antimony have all shownsurprisingly slow recovery suggesting that Sb-doping inhibits the diffusion oflithium (see also Section V) . Eleven lithium cell groups, irradiated to fluencesof 3 to 5 x 10¹⁴ e/cm2, are listed in Table II(b) . The recovery times becomelonger with increasing fluences due to the greater loss of lithium during irradi-ation. Consequently, none of the cell groups with density gradients below 1019
cm"4 have recovered to the n/p power levels. Of the cells which have recovered,groups H2 (2), H6( l ) , and C5(l) are competitive with the n/p cells. GroupsT8(l) and Cl (2) are not yet competitive but are still recovering (this was truewhen this report was finalized) . Of the eleven cell groups irradiated to3 x 1015 e/cm2, the first five groups with low density gradient (1018 cm ~4 )have yet to recover. Two groups H2(3), and C5(2), dNL/dW > 1019 cm"4 haverecovered to power levels competitive with the n/p cells. At the present time,the lithium cell group (from the pre-1970 cells) with the best competitive pos-ition is group Cl( l ) with an averaged power of 25.0 mW, approximately sevenpercent above the recovered n/p level.
The significant degree of post-irradiation recovery observed in the non-lithiumn/p cells is unusual (for room temperature storage) and therefore worthy ofspecial note. This recovery can be seen by comparing columns 8 and 10 ofTable II. It was observed in all the n/p (lot 1 - Centralab) cells tested, averagingapproximately 8 percent, with most of it occurring in the first ten days afterirradiation. All comparisons with recovered lithium cells (Section IIG) arebased on recovered n/p values.
Ill-4

Most of the oxygen-lean groups in Table HI had initial powers well below then/p values. The post-irradiation values in column 5 do not reflect the totaldamage during the irradiation since .they were taken «15 minutes after irradi-ation ceased, i.e., after «15 minutes recovery time. Column 8 gives the timeafter irradiation at the latest reading, and column 9 gives the percent power(or current) redegradation, measured from the peak recovered value, as of thelatest reading. Cell groups from two cell lots, i.e., T2 and f 7, came labeledas QC cells. However, both their rapid recovery (~103 faster then QC cells)and their activation energy for recovery, measured to be «0.66V (see Section V)indicate that they are actually oxygen-lean cells. From column 7 it is seen thatvery few of these lithium cell groups have powers competitive with the n/p con-trol cells (cf. column 10 of Table-H) . Only groups T2(l) with 23.4 mW (n/ppower =23.3 mW), T6(l), with 20.6 mW (n/p power = 20. 9 mW), and H7(2)with 15.5 mW (n/p power = 15.6 mW) are competitive with the recovered powerlevels of the commercial n/p cells. Column 9 indicates that most of the cellgroups have suffered significant redegradation, with several groups having highgradients suffering greater than 10 percent power loss.
C. MODES OF INSTABILITY
Several different modes of lithium-cell instability were observed inoxygen-lean cells. Some were radiation dependent, occurring only in cellswhich had recovered from irradiation, others were radiation independent,occurring equally in irradiated and unirradiated cells.
1. Short-Circuit Current Loss
A radiation-dependent, post-recovery loss in short-circuit current wasthe most frequently observed mode of instability. Redegradation via this modeis especially severe in very high gradient groups (dN^/dW > 5 x 1019 cm~4)such as T3, T4, T5, T9, T10, and CIO cells where 10 percent current drop wascommon after one year's storage time. However, some groups with lowergradient also suffered significant current redegradation i.e., group H7A(1), agroup from one of the new cell shipments, consisting of 3 cells all with gradientsof 6.5 x 1018 cm~4, suffered approximately 7 percent current redegradationfrom 61.7 mA at peak recovery to 57.7 mA three-hundred and forty days afterirradiation.
The measurements to date can identify no parameters which render oxygen-leancells immune to this type of current loss. One note of guarded optimism can,however, be extracted from the data. Figure 31 shows curves of short-circuitcurrent plotted against time for six cell groups suffering this mode of redegra-dation. The curves indicate that the most severe losses occur in the first one-,hundred days. After this period all groups but the very heavily doped (gradient
m-5

200 400 600 800
TIME AFTER IRRADIATION (DAYS)
Figure 31. Short-Circuit Current vs Time after Irradiation for Six Oxygen-Lean Cell Groups, (/> = 3 x 10¹⁴ e/cm2
~3 x 1020 cm"4) group T10(l) stabilize. In two of these groups, T6(l) andH 7 ( l ) , the power was still competitive with n/p levels after stabilization.
To establish the cause of this short-circuit current redegradation an experi-ment was performed on the C10C and C10F cells in which Ig£ and L were bothmonitored during the Igc redegradation. The results are shown in Figure 32which gives the averaged values for two CiOF cells. The coincidence of thetwo curves indicates that a loss in diffusion length is the cause for the short-circuit current redegradation.
2. Open-Circuit Voltage Loss
A second type of instability, a radiation independent degradation in open-circuit voltage which persists over much longer times (>500 days) was observedin two cell lots, lots C4 and C5. Open-circuit voltage losses were observed inequal degrees in both irradiated C4 cells after recovery and in unirradiated C4cells. These losses have been correlated with carrier losses in the base regionas is seen in Figure 33 which shows the ratio of the lithium density gradientsmeasured on a given cell at two different times spaced approximately 1 year
in-6

50
I(-o
o40
35
55
LUCCQC
50 O
OQCO
45CCO
to
500 1000
TIME AFTER IRRADIATION (MINUTES)
Figure 32. Diffusion Length and Short-Circuit Current vs Time AfterIrradiation for C10F Cells
W 70H
o>-, 60
50
40
LUo 30
20
o5Eo5E 10
S- 'o
AVQ C = 0.0575
I I I
2 3 4 5
DONOR DENSITY RATIO
8 9 1 0
Figure 33. Open-Circuit Voltage Loss in Oxygen-Lean C4 Cells vs Ratio ofLithium Gradient Measured at Start and at the End of the TimePeriod During which the Loss Occurred. Theoretical Voltage Lossfor a Donor Density Loss from nj to n2 is also Plotted vs the Ratioof nj to n2. m-7

apart plotted versus the open-circuit voltage loss occurring in the cell duringthe same one year period. The points lie approximately along a straight lineand provide a reasonably good fit to the equation VQC = 0-057 Iog10 (^/hj),which gives the difference in VQC f°r ^wo different base doping densities n2 andnj (Reference 11) . This instability mode was roughly dependent on the initiallithium gradients. The bottom five points in Figure 33 (smallest VQC loss)represent cells with initial dNL/dW <1019 cm"4, indicating more severe lossesfor higher dNjj/dw. An example of the time dependence of the VQC degradationis given in Figure 34 in which VQC is plotted against time for four of the mostseverely effected cells. The degradation is seen to continue even after «500days.
A possible reason for the donor loss near the junction is the motion of ionstoward the p- skin under the influence of the p/n junction field. Capacitancemeasurements have previously shown that the lithium flows from the base intothe depletion region (Reference 1). The flow rate, F, is given by
dw (16)
UJa
UJ
540
530
520
510O
I- 500DO
r, 490
480
470
C4-40
100 200 300TIME (DAYS)
400 500
Figure 34. Open-Circuit Voltage vs Time for Oxygen-Lean C4 Cells DuringPeriod of Voltage Loss
III-8
where /JL and DL are the lithium mobility and diffusion constant, respectively;and e is the electric field. In the base, beyond the depletion region,
Combining Equations (16) and (17) and using the Einstein relation, the lithiumflow rate (toward the junction) in the base region FB, is given by
The condition for steady flow is that dNL/dw be constant.
Almost all of the lithium cells tested over the past several years have shownlinear density increases (dN^/dw = constant, or d2N/dw2 = 0) in the baseregion near the junction. For such cells a steady flow pattern exists (assumingdDL/dw = 0) , giving a stable lithium density distribution near the junction untilthe lithium reservoir near the back of the cell is depleted. Indeed, most of thelithium cells tested have been stable with respect to open- circuit voltage, whichis the principle density-dependent cell parameter. However, this was not thecase in the C4 cells. A possible reason for this is shown in Figure 35 whichshows density profiles for cell C4-3. The initial profile shows an initial linearrise in donor density; however, beginning at about 0.7 um the density begins tolevel off, i.e., d2NL/dw2 becomes negative. This creates a situation in whichthere is a net lithium flow out of the region (dF/dw<0) and toward the junction.Consequently, a decrease in donor density occurs (with a corresponding loss in
as illustrated by the density profile in Figure 35 taken 550 days later.
3. Junction Degradation
Some of the cells experienced degradation of their junction characteristic.The effect of this phenomenon on a cell photovoltaic characteristic is illustratedin Figure 36. The cell, T4-13, of group T4(l ) , suffered no short-circuitcurrent redegradation between May 8, 1970 and August 25, 1971. However, asignificant power loss was incurred due to a degradation in the curve powerfactor (rounding of the knee of the I-V curve). This phenomenon has beenobserved mainly in cells with very high lithium gradient (^5 x 1019 cm~4) . Itis hypothesized that it is caused by the motion of lithium to regions where thep/n junction intersects the surface of the cell. This would result in a surfacecharge buildup and channeling (Reference 13) of carriers across the chargelayer which would cause the observed degradation.
This type of instability is radiation independent, occurring in both irradiatedand unirradiated cells.
m-9

Eo
oC. 5QZ
> 4
CO2LLJ
Q
OCO2OD
3
1 I I ICEL1-C4-3• INITIAL
(VQC = 548 mV)
AFTER 550 DAYS ATROOM TEMPERATURE
I I I I I
0.4 0.6 0.8 1.0 1.2 1.4 1.6 1.8
DISTANCE FROM JUNCTION, w (ptm)
Figure 35. Donor Density vs Distance from Junction Before and After Open-Circuit Voltage Degradation for Cell C4-3
0.6
CURRENT (mA)
Figure 36. Photovoltaic Characteristics Before and After Curve FactorDegradation for Oxygen-Lean Cell T4-13
III-10

4. Series Resistance
After heavy irradiation some lithium cells suffer an increase in seriesresistance with a consequent loss in curve power factor and cell power. Severemanifestations of this have been observed only in oxygen-lean cells with lightlithium doping and high starting (phosphorus) resistivity (^50 J2-cm) . Sincelightly-doped non-lithium cells are also subject to this problem it can not beconsidered a lithium-cell problem per se. However, caution should be exercisedin choosing initial resistivity and lithium diffusion schedule to insure sufficientbase doping. With very light lithium doping the maximum starting resistivityconsistent with low post-irradiation series resistance is approximately 25fi-cm.
D. QUARTZ-CRUCIBLE CELLS
The lithium diffusion constant and consequently the recovery speed inquartz-crucible lithium cells is a factor of approximately 1000 below that ofoxygen-lean lithium cells at room temperature. Consequently for equal storagetimes at this temperature the quartz crucible cells experience only one-thousandththe life cycle experienced by oxygen-lean cells with similar lithium gradient.While equal time/temperature storage is valid for comparisons of absolutestability (as in Tables n and III), an experiment involving equal life cycles isvaluable in relating the physical processes of the two cell types. The recoveryspeed of crucible cells at 80° C approximates that of oxygen-lean cells at roomtemperature [ cf. Equations (10) and (13) ]. Thus 80° C crucible-cell storageversus 25° C oxygen-lean cell storage provides the desired basis for comparison.In addition, 80° C is typical of maximum solar cell temperature in earth orbit,so storage at this temperature provides a meaningful test of cell stability in atypical earth-orbit thermal environment.
Seventy CIS (quartz-crucible) cells were stored after irradiation at 80° C forone month, then at 90° C for another four months. In terms of the lithiumdiffusion constant - time product this is the equivalent of one year at 80° C.During this time frequent measurements of short-circuit current were madeon all cells* and complete current-time curves were generated. A typicalcurve is shown in Figure 37 where short-circuit current for cell C13G20(fabricated from QC silicon) after irradiation to a fluence of 3 x 10¹⁴ e/cm2 iscompared with that averaged over a similarly irradiated group of three H7Afloat-zone cells. The measurement temperature, Tjyj, was 26° C. The re-covery temperature, T^» for the H7A cells was 26° C. The cells had approx-imately the same lithium gradients and recovery speeds, however, the oxygen-lean H7A cells show a post-recovery drop of approximately 4 mA whereas nosignificant drop occurred in C13G20, which was typical of the CIS cellsirradiated to 3 x 10¹⁴ e/cm2.
*The measurements were made at 26° C, the cells being temporarily removedfrom the storage oven.
Ill-11.
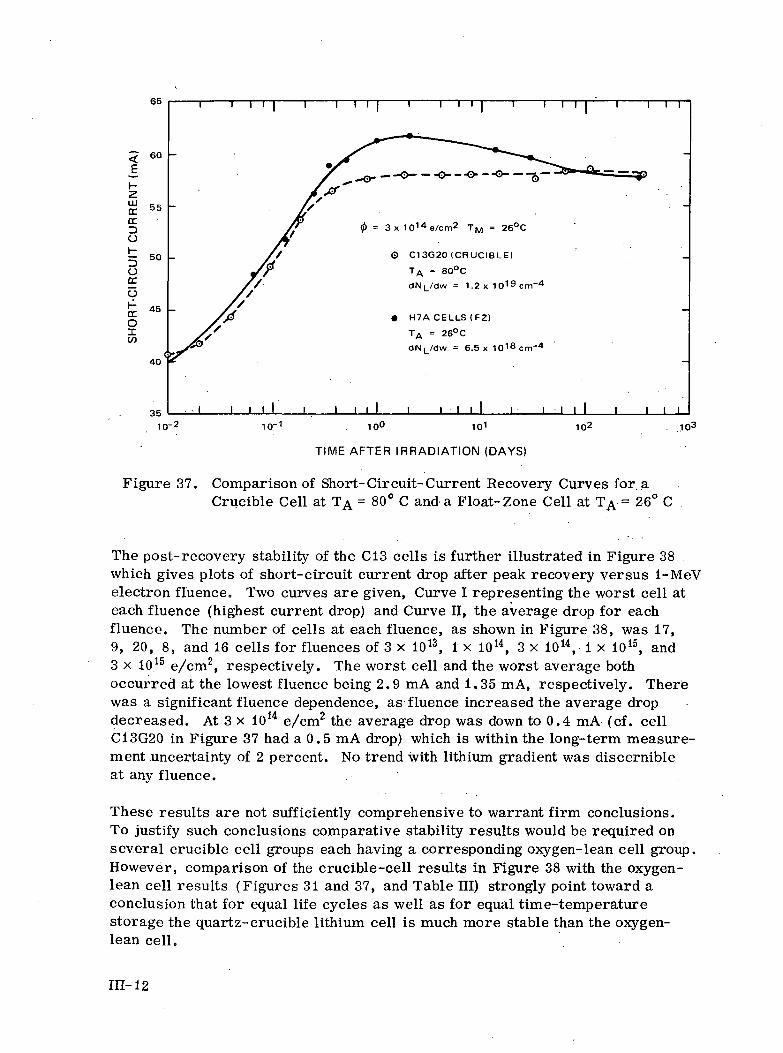
65
60
UJ c cir 55
DCDO
3 «o
crOIto
45
40
351 fl-
3x101 4e/cm2 TM = 26°C
0 C13G20 (CRUCIBLE)
TA = 80°C
dNL/dw = 1.2 x 10¹⁹crrT4
• H7A CELLS(F2)
TA = 26°C
dNL/dw = 6.5 x 1018cm-4
I I I I I
IC-1 . 10° 102 . .103
TIME AFTER IRRADIATION (DAYS)
Figure 37. Comparison of Short-Circuit-Current Recovery Curves for aCrucible Cell at TA = 80° C and a Float-Zone Cell at TA = 26° C
The post-recovery stability of the CIS cells is further illustrated in Figure 38which gives plots of short-circuit current drop after peak recovery versus 1-MeVelectron fluence. Two curves are given, Curve I representing the worst cell ateach fluence (highest current drop) and Curve II, the average drop for eachfluence. The number of cells at each fluence, as shown in Figure 38, was 17,9, 20, 8, and 16 cells for fluences of 3 x 10¹³, 1 x 10¹⁴, 3 x 10¹⁴, 1 x 10¹⁵, and3 x 1015 e/cm2, respectively. The worst cell and the worst average bothoccurred at the lowest fluence being 2.9 mA and 1.35 mA, respectively. Therewas a significant fluence dependence, as fluence increased the average dropdecreased. At 3 x 10¹⁴ e/cm2 the average drop was down to 0.4 mA (cf. cellC13G20 in Figure 37 had a 0.5 mA drop) which is within the long-term measure-ment uncertainty of 2 percent. No trend with lithium gradient was discernibleat any fluence.
These results are not sufficiently comprehensive to warrant firm conclusions.To justify such conclusions comparative stability results would be required onseveral crucible cell groups each having a corresponding oxygen-lean cell group.However, comparison of the crucible-cell results in Figure 38 with the oxygen-lean cell results (Figures 31 and 37, and Table III) strongly point toward aconclusion that for equal life cycles as well as for equal time-temperaturestorage the quartz-crucible lithium cell is much more stable than the oxygen-lean cell.
Ill-12

o.Occo
ccccDO
~
01013
17 CELLS
• I
C13 CELLS CURVE I - LARGEST lsc DROPWITHIN GROUP
CURVE II -AVERAGE DROP
EO.UIV POST IRRAD STORAGE =1 YEAR AT 80°C
16 CELLS
I
1014 1Q15
1 MeV ELECTRON FLUENCE, 0 (e/cm2)
10T6
Figure 38. Short-Circuit-Current Degradation vs 1-MeV Electron Fluencefor CIS Cells after One Year's Equivalent Post-IrradiationStorage Time at 80° C
m-13

SECTION IV
LITHIUM DENSITY CONTROL
A. LITHIUM DIFFUSION SCHEDULE
It is evident from Section II that many of the important characteristics oflithium cells under electron irradiation can be predicted through knowledge ofthe lithium gradient, dNL/dw. The lithium gradient is therefore probably themost important density parameter in the lithium cell. This being the case, itis desireable to have a relationship between the gradient and fabrication processvariables- This would enable the cell purchaser to specify the lithium diffusionschedule to the manufacturer with confidence of receiving cells with the desiredproperties. Unfortunately, as had been indicated in Table I (Section II), thissituation does not yet obtain. The fabrication and gradient data from Table Iare plotted in Figures 39 and 40 for quartz-crucible and oxygen-lean lithiumcells, respectively. * Lithium gradient is plotted against lithium diffusion temp-erature, with the lines indicating the gradient ranges for the cell lots, and thelabels along the lines being the lot code and lithium diffusion time in minutes.(It is noted that the number of cells per lot vary with cell lot, see Table I.) As-suming that a gradient range of a factor of three between the high and low valuesis acceptable, only six of the sixteen crucible lots in Figure 39 and none of theoxygen-lean lots in Figure 30 are satisfactory. The following observations onthe crucible data led to the hypothesis that the lithium source was being lost tosome cells at some point in the diffusion: (1) all six of the satisfactory lotshad relatively short diffusion times (^ 300 min), whereas the lots with longertimes gave wider spreads, (2) for a given diffusion temperature the cell lotwith the shorter diffusion time had a gradient distribution near the upper limitof the distribution of the lot with longer diffusion time, (3) the upper limits ofthe gradient ranges (excepting the one Heliotek lot) follow a rather smooth curve(which increases with temperature, the temperature dependence being the great-est at low temperature), and (4) lot H3A consisted of fifteen cells, ten of whichused a paint-on lithium source; (5) an evaporated source. The cells using paint-on source had a broad gradient distribution, spanning the entire H3A range,whereas the evaporated cells all had gradients of approximately 1 x 1019 cm"4,near the high end of the range. If the problem is caused by a loss of the lithiumsource, improved lithium application techniques could provide the solution. Itwould then be possible to obtain a shipment of crucible cells with a given, narrowgradient distribution by specifying the lithium diffusion schedule.
Cell lots with lithium redistribution cycles are not included.
IV-1

1020
^-. .
vl1
o
$
_J
z•oK2OJ
Q
OC
IH_J
I I 1 1
—
- S ' ' 1 f_ o 9 «- CM
00 _ — — ~
"3 2 u. 0 co— °° CO 10 r-
_< 0 •- " MtoI
——_.
_
~
-
—
1
- ^ ~ o o o •
""to O iu 1 1 I f T T^ o 4 i " IT 1 ',- *j , Jj »O 4 — o o s
I§ s s g , §' ' ^ "~ * *~ "* •— •
° la — Q I -,
S r- J2 o u o
f 1 [I I
I I 1 1
1
—
0 Ico,
D . ' -A
u'
1 13 ~CO Z^ „
u
"-
—
-
1
Figure 39.
320 330 340 350 360 370 38O
LITHIUM DIFFUSION TEMPERATURE (°C)
Lithium Gradient Ranges ys Lithium DiffusionTemperature-Quartz-Crucible Cell Lots
10,20
u
TJ
1019
Q<cro5 to18D
It-
1017
C15A (240)
C1.1C (480)
C14A (180)
C14C (300)
C15B (240)
H1A (480)
I
320 330 340 350 360 370 380 390
LITHIUM DIFFUSION TEMPERATURE (°C)
Figure 40. Lithium Gradient Ranges vs Lithium DiffusionTemperature-Oxygen-Lean Cell Lots
IV-2

All four of the cell lots undergoing a redistribution cycle (H5A, H7A, H13A1,and H13A2) had reasonably narrow spreads in gradient (see Table I). How-ever, there might be a reproducibility problem for this mode of lithium intro-duction as comparison of lots H7A and H13A1 indicates. Both of these oxygen-lean lots were lithium diffused for 90 minutes and redistributed for 120 minutesat 425°C. However, the H7A cells had gradients from 4.4 x 10¹⁸ to 1. 0 x 1019
cm"4, significantly above the H13A1 values of 1. 9 x 10¹⁸ to 3.8 x 1018 cm-4.Whether this is due to the difference in starting material (FZ for H7A, Lopexfor H13A1) or a reproducibility problem is not known.
B. DENSITY MEASUREMENTS
Reverse-bias capacitance measurements for a minimum of four differentvoltage levels are required for the calculation of the lithium gradient. Althoughthese measurements and the required calculations can be automated it would beadvantageous to have a simpler density test. If a unique relationship betweenthe lithium gradient and a more easily measured parameter can be established,the latter will provide a valid density test. Several attempts to find such a re-lationship with various capacitance parameters were made. The results arereported below.
1. Single Capacitance Method
Cell capacitance at zero bias, C(0) was plotted against lithium gradientas shown in Figure 41. Five oxygen-lean cell lots are represented, all havingapproximately the same starting resistivity. In the intermediate gradient range(5 x 10¹⁸ ^ dNL/dw < 4 x 1019 cm"4) there is a reasonably firm relationship be-tween C(0) and the gradient. At high gradients (> 5 x 1019 cm"4) there is agreat deal of scatter, however this is not of great concern since such high-gradi-ent cells do not appear to be practical. The main problem is for low gradientswhere a large offset is seen between the values for the H13A1 cells and those ofall of the C-cells. The capacitance at any bias is a function of the starting re-sistivity as well as the lithium density since the total donor concentration ismeasured. Thus, the separation between the H13A1 data and the C-cell data isprobably because of the slightly higher starting resistivity in the H13A/cells.
Since the lithium density increases with distance into the base region one way toswamp out the effect of the initial donors (starting resistivity) would be to ex-tend the depletion region into the base by applying a reverse bias to the cell.This was done and the capacitance values of the same cells at 4 V reverse bias,C(4) , are plotted against lithium gradient in Figure 42. Clearly, both the datascatter at all gradients and the offset of the H13A1 data is reduced from that of
IV-3

1 1 1 I I 1 1
_
-
-
.• • ••r • j* <* "
I eTc^PsK/1* !^& S9 *3 .
O *^ g, • '
**« &
t*.e
o
00O
' 0 _
- E 0
' cl f ***»m ^ e•- oeg
_ r~~^ ). . ^
< o < CD < *%o ^§D
o o u u i ^'O• o O ^ O O^ Op*
C£DQn
E>e
1 1 1 1 1 0 1 1in o in o in o inCO M CM ' IM • r- —
o
CQ
oX!
1
.2
0
»•! I•- 7 51 .a
Z • COT3 >U." CO2 rtui J5q9 -^rf »-
>> ot s2 N111 -4->Q CTi
1019
TH
IUM
DO
NO
R
Cap
acit
ance
"0
•iH
^
3
S
00r-0
'(0)0 'svm oaaz ±v
IV-4

CMO
CO
0)
&
.u>a
'Ort
OS
• • •
Oooo,.
Oo
u
z•a
UJ
O<tr<3>
(75UJQ
CCO
• OQ
co
IPQcucoJH0
iCO
Ihofa^Jrt
- IO
o1O
CDO
<0
IToo"oo
M.
SVI9 A fr IV iDNVllDVdVO
IV-5
Figure 41. The same improvement is shown more dramatically in Figure 43where C(0) and C(7) are plotted against lithium gradient for the H13A2 cruciblecells. These cells had 20 ft -cm nominal starting resistivity. However, it isevident from the C(0) plots that there were large cell-to-cell deviations in ac-tual starting resistivity. The C(0) data is totally useless, exhibiting extremelylarge scatter. The C(7 ) data, however, is coherent in spite of a still consider-able degree of scatter.
The zero-bias capacitance measurement is attractive to the cell manufacturerdue to the simplicity of both the measurement and its interpretation. The re-sults, however, indicate its limited validity. The measurement and interpreta-tion of a single non-zero-bias capacitance measurement are equally simple, re-quiring only the addition of a low-voltage supply. In principle, the bias voltagecan be extended to nearly the avalanche voltage, gaining improved coherencewith increasing voltage. Therefore, this approach should be pursued further.
2. Single Density Method
Another approach to simplifying the density test would be to calculate onedensity only, for example the donor density at the edge of the depletion region,NJ-JQ. This also has the inherent problem that the density is composed of bothbackground donors and lithium donors. It is also more involved than the singlecapacitance measurement, requiring two capacitance measurements and a den-sity calculation. Plots of NDO vs lithium gradient are given for crucible cellsand oxygen-lean cells in Figures 44 and 45 respectively. A fairly well definedrelationship exists in both cases:
NDQ w 1. 1 xio6 (dNL/dw)0 '46 (19)
for crucible cells and
« 1250 (dNL/dw)°-62 (20)
for oxygen-lean cells. However, in both cases data at low gradients divergefrom these relationships. This problem has the same origin as that associatedwith the C(0) measurement; namely, difference in starting resistivity. Fig-ure 45 illustrates this particularly well. The uncircled data points representcells with high starting resistivity (> 100 p-cm), or, equivalently, low initialdonor density (< 5 x 1013 cm"3 ), thus the principle donor constituent in NDQ islithium. All of these points fit well along equation (20) with very little scatter.The circled data points represent HiA cells with 20 f?.-cm starting material(« 2 x 1014 cm"3). Since these were low-gradient cells the background (phos-phorous ) density was greater than the lithium density at the edge of the depletionregion. The divergence from equation ( 2 0 ) and the lack of gradient dependenceof the HIA data confirms this.
IV-6

16
14
? ^
LUO
10
O 6.0
QL
LUO
5.5
5.0
4.5
I • i I
rHI 3A2 CELLS
•0 VOLT BIAS
®7 VOLT BIAS
"XX
O '
. T /I 1 1
0.6 0.8 1 2 4 6
LITHIUM DONOR DENSITY GRADIENT,
Figure 43. Cell Capacitance at Zero and Seven Volt Bias vsLithium Gradient - H13A2 Crucible Cells
O 1016 ;
LU
Q. 'LU
£ 10"o01OQ
in•z.LUQ
CCO
OXYGEN-RICH CELLS
0.46NDO=1.1 x10
.oQ
10 17 10 18 1019 1020
LITHIUM DONOR DENSITY GRADIENT, dNL/dw (cm-4)
Figure 44. Donor Density at Edge of Depletion Region vs LithiumGradient-70 Quartz-Crucible Cells
IV-7

oCMO
i w
5 g<
O
Xo
LUO
H
l"
U
01
'o
00
*0
T3
Q<CC.
LUQ
CC.OzoQ.
CQ
0>JIfl0)
oo(M
c0)
OS3
CO>
§•a0)tfS3O
aa>Q
<D
O
t w-1 -a
£>•r-iGOeCO
• Q
§
1C
s
I I I ICD
O
(e.LU3) OQN 'NOID3H NOI13Td3a JO 3903 IV A1ISN3Q dONOQ
IV-8

The single donor density test can be improved in the same manner the capaci-tance density test was improved, namely by making the measurements at a re-verse bias. This is illustrated in Figure 46 where the densities NLO and NLSare plotted for the H13A2 cells. The density Nj^g was calculated from capaci-tance measurements at 3- and 4-V reverse bias. Here, as in Figure 43, thevalues near zero bias give little basis for accurate gradient specification whilethe values at the applied bias to provide a reasonably good basis for such pre-dictions. Comparison of Figures 43 and 46 indicate that the latter shows a moreuniform trend with a smaller amount of scatter. This indicates that the singledensity measurement provides a better density test than the single capacitancemeasurement. In agreement with Murphy's law it is also the more involved ofthe two measurements.
To summarize the possibilities for simplified density tests, (1) both the singlecapacitance method and the single density method can be used to determine lith-ium gradient in cells all having the same background donor density, (2) for cellswith different background densities, only the gradients in the intermediate grad-ient range are accurately determined by either technique at zero bias, whileneither method is valid for low gradients, (3) the situation at low gradients canbe vastly improved by equivalent measurements at a reverse bias voltage, con-tinuous improvement being obtained with increasing bias up to the point wherethe capacitance measurement can no longer be made accurately, (4) the singledensity method is superior to, and more involved than the single capacitancemethod, and (5) crucible cells follow a different relationship than oxygen-leancells [cf. , equations (19 and 20)].
IV-9

CO
Z 5£ I'
00
o
O)o
cx>
o
00
CM
UJ
Q
iw ooLU OQ C
o zQ -o
IH-
coo"
CDd
o0>
1—Iago
CM
CO
aCD
1O
'A1ISN3Q
co
cor—4
CO
CD
COed
•r-(PQoco-u
wo
riT30^coOjd)
coacuQ
CD•*<of-ls,£
IV-10

SECTION V
SOLAR CELL COLD FINGER EXPERIMENTS
A. GENERAL
During the previous contract performed by RCA, Astro-Electronics Divi-sion for JPL (1968-1969), a cold finger apparatus for testing solar cells wasdesigned and fabricated. This apparatus, which was previously described in de-tail (Reference 1), can accommodate two devices with dimensions of approxi-mately 0.13 x 0. 30 inch. Heaters on the cold finger make possible testing be-tween liquid nitrogen temperature (77°K) and the melting temperature (~ 380°K)of the solder used to mount the cells to the finger. The heaters are capable ofraising the cell temperature from 77°K to 380°K in approximately one minute.
The principal cold finger experiments were made with the apparatus attached tothe output flange of 1-MeV Van de Graaff generator. Measurements of diffusionlength by the electron voltaic method (Reference 3) using the electron beam fromthis generator were taken for a series of electron irradiations and cell tempera-tures. In addition, forward and reverse (dark) diode characteristics and reverse-bias capacitance measurements were made.
Two solenoid actuated rods entering the cold finger apparatus through a vacuumquick-connect enabled automatic positioning of 0.085-inch thick aluminum beamstop (for cell protection) or a 0.011-inch thick beam moderator (for diffusionlength measurements, see Reference 3) in front of the test cells. The bottomedge of the cold finger was directly on the beam axis of the Van de Graaff gen-erator. Immediately behind and below the cold finger was a Faraday cup whichmonitored the electron beam current continuously.
B. EXPERIMENTS ON ANTIMONY-DOPED CELLS
Experiments were performed on two cells from Lot C6A. These cells areQC-grown cells with antimony doping to starting resistivities of 3 to 16 ohm-cmwhich were lithium-doped with a 90-minute diffusion at 425°C followed by a 120-minute redistribution at 425°C. Previous results on antimony-doped cells (LotC2) were puzzling in that the cells failed to show significant recovery at roomtemperature, although the most recent measurements (Section HI) show a smallamount of room temperature recovery. Since there are significant variationsin starting (Sb) resistivity within the cells of Lot C6A it was possible to choosetwo cells with significantly different doping densities.
V-l

The donor-density profiles obtained from capacitance-voltage plots indicated thatcell C6A-19 was much more heavily doped than C6A-18. It is reasonable to as-sume that the donor-density difference reflects a difference in the Sb dopinglevel rather than the Li doping level since both cells have similar density grad-ients. These two cells were chosen for the purpose of obtaining information onpossible effects of the Sb dopant on recovery characteristics.
The cells were cut into 0.13 x 0. 30 inch pieces. To minimize surface effects,the cells were cut by scribing the back surface and then cleaving. After cleav-ing, the cells' capacitance-voltage and diode characteristics were measured tocheck that no major changes occurred in the cutting process. The cells werethen soldered onto a 0. 020-inch thick metallized boron nitride wafer with Cer-roseal (220°F) solder. The boron nitride wafer was bonded to the cold fingerwith Dow Corning silicon adhesive. Cell temperature was measured by a copper-constantan thermocouple permanently mounted on a dummy cell next to the testcells. The dummy cell mounting to the cold finger was identical to that of thetest cells.
The experiments consisted of irradiations at~ 77°K by 1-MeV electrons to flu-ences from 3 x io13 e/cm2 to 3 x io15 e/cm2 and anneals at room temperatureand 373°K, with measurements of electron-voltaic short-circuit current, capac-itance-voltage, and diode characteristics at various stages of cell irradiation .and annealing. From the short-circuit current the minority carrier diffusionlength, L, was obtained using the method of Rosenzweig (Reference 2)*. Minor-ity carrier lifetime, TO = L2/D, where D is the minority-carrier diffusion con-stant. Values for D were obtained by use of the mobility data of Morin and Maita.(Reference 4) and application of the Einstein Relation. The experimental un-certainty in the short-circuit current measurement is approximately 10 percentgiving an approximate 20-percent uncertainty in TO assuming the values for Dare correct. This latter assumption is considered valid for temperaturesgreater than ~ 140°K (103/T « 7.1). Below 140°K impurity scattering becomessignificant leading to uncertainties in the value of D.
Recombination levels can be found by obtaining lifetime-temperature (T vs T)plots and applying Hall-Shockley-Read analysis (References 15 and 16). Forn-type material the equations are (Reference 17)
TO/TPO = (1 +n1/n0), (21)
or
To/Tp0 = (1 + yPt/no), ( 22 )
The beam current was sufficiently low that An/n0 < 10 5 in all measurements.
V-2

where
n0 and pfl are the thermla equilibrium electron and hole concentrations,
T is the minority-carrier (hole) lifetime when the Fermi level isPO near the conduction band,
y is the ratio of the hole capture cross-section to the electron cap-ture cross-section, and
nt and pj are the (fictitious) electron and hole concentrations which wouldexist if the Fermi level was located at the recombination level E^
Thus, nA = Nc exp [e (Et - Ec)/kT], Pj = Nv exp [e (Ey - Et)/kT], where Nc =Nv = 4. 82 x io15 T3/2, Ec and Ey are the energy levels at the edge of the conduc-tion and valence band, respectively. Equation (21) applies if the recombinationlevel is in the upper half of the band gap: Equation ( 22 ) if the level is in thelower half. The value of n0 to be used in these equations is the donor density ob-tained from C-V measurements. The large density gradients in lithium cellsprovide an uncertainty in that no single value of n0 is applicable over the currentcollection volume in the short-circuit current measurements (i. e. , over a diffu-sion length). However the uncertainty, AE, introduced by the variation in n0
can be approximated by the shift in Fermi level associated with this variation,that is
AEF - —In 2, (23)e n01
where n01 and n02 are the lower and upper limits of n0. For the present cells,the gradient near the junction is rather shallow, ~ IO18 cm"4, giving 2 ^ n02/n01 ^ 3 which gives AEp ~ kT/e. Consequently, for the temperature range ofthe measurements this uncertainty is 0. 02 eV.
The cells were irradiated sequentially to fluences of 3 x IO13, 3.3 x IO14, 1. 5 xIO15, and 3 x IO15 e/cm2 at« 77°K. During each irradiation, TO was measured atclosely spaced fluence intervals. After each irradiation, a « 10 minute, 200°Kanneal was performed to remove all divacancies (Reference 18), then a TO vs
T plot was made. A 12 hour room temperature anneal also followed the irradi-ations to fluences of 3.3 x IO14, 1. 5 x IO15, and 3 x IO15 e/cm2, after which a6-hour anneal at 373°K was performed, and TO vs time at 373°K was measuredto investigate cell recovery dynamics.
The results of the TO vs TM measurements are shown in Figures 47 and 48 onsemi-log plots with 103/TM as the abcissa. As stated previously, after eachirradiation and before the TO vs TM curves were taken, 200°K anneals of « 10minutes duration were made to anneal out the divacancies defects formed during
V-3

10
oLLJto
10 -5
10-6
10 -7
10,-8
10-9
C6A-18(2)
• PRE-IRRADIATION/
A 0= 3 x 10¹³ e/cm2 AT 77°K
O 0= 3.3 x 10¹⁴e/cm2 AT 77°K
D 0= 1.53 x 10¹⁵ e/cm2 AT 77°K
• 0= 3 x 10¹⁵ e/cm2 AT 77°K
A. ANNEALED AT 373°K FOR 6 HR
3 x 10¹⁵ e/cm2
ANNEALED AT373°K
53 x 1015e/cm2
10
-1
12 14
1000/tm (OK)'1
Figure 47. Lifetime vs Temperature Data on Cell C6A-18(2)
16
V-4

10 -5
10"
OLUw to1-
Ot-
10-8
10"
C6A-19I2) .
• PR6-IRRAOIATION
0= 3 x 10¹³e/cm2 AT 77°K
O 0 = 3.3 x 10¹⁴ e/cm2 AT 77°K
Q 0= 1.53 x 10¹⁵ e/cm2 AT 77°K
• 0=3 x 10¹⁵e/cm2 AT 77°K
A ANNEALED AT 373°K FOR 6 HR
3x 10¹⁵e/cm2
10 12 14
Figure 48.
1000/TM
Lifetime vs Temperature Data on Cell C6A-19( 2)
.16
V-5

irradiation. To monitor completion of this annealing stage, measurements ofTO were made each minute at 200°K until saturation was achieved. The curvesin Figures 47 and 48 indicated a recombination level somewhere in the vicinityof the Ec - 0.185 eV i.e., near a level previously identified as the oxygen-va-cancy or A-center (Reference 19) in QC grown n-type silicon and more recentlyfound at RCA (Reference I and 20) in lithium doped QC-grown silicon samples.
In Figures 49 and 50, theoretical curves of To/Tp0 from Equation (21) are given,together with the experimental data taken after fluences of 3. 3 x 10¹⁴ and 3 x 10¹⁵
e/cm2 and after the 6-hour, 373°K anneal. Curve fitting was done only for temp-eratures of 140°K and above for two reasons: (1) impurity scattering becomesa factor below « 140°K increasing the uncertainty in mobility (or D) value, and(2) the experimental value of TO begins to increase significantly at temperaturesslightly above 140°K. These reasons also dictated the choice of TpQ to be thevalue TO at 140°K.
For cell C6A-18(2) shown in Figure 49 a value of n0 = 1 x 1015 cm"3 was chosenfrom capacitance results. The data of both post-irradiation experiments and thepost-anneal data fit well within the envelope: 0.15 eV< Ec - E^< 0.17 eV withthe post-irradiation values fitting best the Ec - E-j- = 0.16 eV curve and the post-anneal data fitting best the ECl5 - ET_S = 0.15 eV curve. For cell C6A-19(2),the more heavily doped cell, n0 = 2 x 1015 cm"3 was used to generate the theoreti-cal curves from Equation (21). For this cell, Figure 50 shows the data to fitbetween 0.13 eV< Ec - EX< 0.15 eV. Again for this cell the post-anneal levelof 0.14 eV is shallower than the post-irradiation level of 0.15 eV. Even thoughthe experimental uncertainty in the level is greater than the « 0. 01 eV changewhich occurred during 373°K annealing cycle, the consistency of this change inboth cells indicates that perhaps some reordering or perturbation of the leveloccurs during the 373°K anneal. Another possibility, however, is that a changein relative density of two closely spaced levels occurs during annealing. Such adistinction would not be observable in these measurements. A question arisesconcerning the relation of the level found here to the A-center. Since the C6Acells are crucible-grown the expectation is that the main defect would be theA-center at« Ec - 0.18 eV. The « 0. 02 eV shallower level found in these exper-iments could be due to (1) measurement uncertainty, (2) perturbation of thelevel by the presence of lithium or antimony, or (3) the additional presence ofanother level close to the A-center level. The first and third of these possibil-ities seem more likely than the second.
After irradiation to a fluence of 3 x 10¹⁵ e/cm2, a 6-hour anneal was performedat 373°K for the purpose of obtaining information on the annealing kinetics of thecells. Plots of minority-carrier lifetime at 373°K vs annealing time at 373° Kare given in Figure 51. After an initial period of approximately 30 minutes forC6A-18(2) and approximately 80 minutes for C6A-19(2) in which a small decrease
V-6

I IC6A-18(2)
o 0=3.3Xl014e/cm2
• 0= 3x 10¹⁵e/cm2
AANNEALED AT 373°K FOR 6 HR
1000/TM (OKI-
Figure 49. Theoretical and Experimental Lifetime vsTemperature Curves C6A-18(2)
10°
a
10
C6A-19(2)
00 = 3,3 x 10¹⁴e/cm2
•0 = 3 x 1 01 5e/cm2
AANNEALED AT 373°K FOR 6 HR
<10'5
-0.13V THEORETICAL
-0.14V >EC ET
-0.15V J (2x I015cm 3)
Figure 50.
3 4 5 6
1000/TM
Theoretical and Experimental Lifetime vsTemperature Curves C6A-19(2)
V-7

oLUCO
A C6 A-18 (2)
• C6 A-19 (2)
NDO = 1.7 x 10¹⁵ CM
An
-3
I I
50 100 150 200 250 300 350
ANNEALING TIME (MINUTES)
Figure 51. Lifetime at 373°K vs Annealing Time at 373°K: CellsC6A-18(2) and C6A-19(2)
in lifetime is experienced, both cells began to recover. The recovery was par-ticularly pronounced in C6A-18(2). An annealing stage at 400°K in phosphorusdoped FZ silicon has previously been identified as the dissociation of the phos-phorus-vacancy or E-center (Reference 21). The analog of this center in theSb-doped C6A cells would be the antimony-vacancy defect. Thus, the questionarises as to whether we are observing the dissoication of antimony-vacancy de-fects during the 373°K anneal. This appears highly unlikely since the positionof the Sb-V center is at « Ec - 0. 4 eV (Reference 22) would render it unobserv-able in these measurements. (Much higher measurement temperatures wouldbe required to drive the Fermi level down to Ec - 0. 4 V.) Also, if this wereSb-V dissociation, the annealing in the more heavily Sb-doped cell C6A-19(2)should be more pronounced than in C6A-18(2). Figure 51 shows just the re-verse to be true.
These results indicated the possibility that the presence of antimony inhibitslithium diffusion. In an attempt to further pursue this question, another pieceof cell C6A-19, C6A-19(3), was mounted on the cold finger together with a non-lithium « 10 ohm-cm p/n control cell designated C6A-B(3). * The cells were
* Six non-lithium control cells from lot C6A were generously furnished to usby Peter lies of Centralab.
V-8

irradiated and lifetime vs temperature measurements made after fluence incre-ments of 1 x io15 e/cm2 at 90°K bombardment temperature and 2 x io15 e/cm2 at100°K. The results of these measurements are shown in Figure 52 in which In
) is plotted against inverse temperature, l,000/T]y[. The slope of thisPcurve at high T0/Tp gives the activation energy, Ea, of the predominant defect.The curves for the lithium cell and the non-lithium cell are virtually identicalabove TO/TP(J ~ 10. The activation energy is calculated to be 0. 21 eV, a valuewhich is close to the 0. 18 eV found for the A-center (oxygen-vacancy), whichis shown for reference.
A 380°K anneal of 380 minutes duration was performed on these cells. The re-sults of the measurements performed during this anneal are given in Figure 53which is a plot of lifetime at 380°K after a time t of annealing, Tot, normalizedto the lifetime at the start of the anneal, TOo> versus annealing time. Over theduration of the anneal the recovery in the lithium-free control cell is approxi-mately the same as that of the lithium cell. The shapes of the recovery curvesdo differ, however, with the non-lithium cell showing recovery throughout theanneal while the lithium cell starts its recovery only after an initial degradationof « 50 minutes duration. The control cell has an initial characteristic recov-ery rate, S, of 6 x 10~3 min"1. This rate is more than an order of magnitudehigher than the value of 2 x 10~4 min"1 calculated from published data (Reference22) for the dissociation of the antimony-vacancy defect. After approximately 70minutes the recovery rate decreased to ~ 1 x 10~3 min"1. The recovery rate inthe lithium cell, C6A-19(3 ) was ~ 4 x 10~3 min"1. This was lower than the re-covery rate observed for C6A-19(2) during a 373°K anneal, namely 7 x io~3
min"1. The probable explanation for the lower recovery rate in C6A-19(3) isthe heavier damage it experienced, i. e. , at the start of the anneal the diffusionlength of C6A-19( 3 ) was « 12 ^m at 373°K while that of C6A-19( 2 ) was « 16 |>imat 373°K. The more heavy damage in C6A-19(3) would imply heavier depletionof unbound lithium which would slow down any recovery due to lithium diffusion.The initial degradation observed during the anneal of C6A-19(3 ) had also beenobserved in cells C6A-19(2) and C6A-18(2). The unexpectedly high recoveryrate of the control cell C6A-B( 3 ) together with the unexpectedly low recoveryrate in C6A-19(3) leaves questions concerning the relative roll of lithium inthe recovery of Sb-doped cells still unanswered.
Cell diode and C-V characteristics of C6A-18(2) and C6A-19(2) were found to besimilar before and after the cells were cut. However, after soldering the ceilsto the cold finger, some dramatic changes did occur in one of the cells, C6A-19(2) . Forward diode characteristics of this cell after cold-finger mounting (andcareful cleaning ) are shown for various temperatures in Figure 54. The lowtemperature curves in particular show unusually high empirical A factors fang-ing up to « 27 in the case of the 83°K curve in the vicinity of 1 mA. Such high Afactors are possible only if channels are present (Reference 13) where the p/n
V-9

1000
100
a.o
t-
u
HI
oLL)N
<rO
10
£„ = 0.18 eV (A-CENTER)
0.21 eV
• C6A-BO)
X C6A-19O)
IRRADIATIONS
1 x 10¹⁵ e/cm2 @ 90°K2 x 1015 e/cm2 @ 100°K
1000/TM
Figure 52, Lifetime vs Temperature Data on Cells C6A-B(3) and C6A-19(3)
V-10

380°K ANNEAL
• C6A-BO) (CONTROL CELL)X C6A-19(3) (Li-CELL)
SIS
0 100 200 300 400 500
ANNEALING TIME (MINUTES)
Figure 53. Lifetime vs Annealing Time at 380°K:Cells C6A-B{3) and C6A-19(3)
junction is exposed, i.e., at the edges of the cell. Subsequent diode measure-ments showed significant spontaneous changes in diode characteristic. Theseeffects could conceivably be due to the presence of lithium. However, it is morelikely that they were caused by other surface impurities introduced after the cellwas cut.
C. LIFETIME DAMAGE CONSTANT
The objective of this experiment is to obtain information on dependence oflifetime damage constant, KT, on bombardment temperature, periodic measure-ments of diffusion length during electron irradiation enabled the calculation oflifetime damage constant, KT, using the equation
+ K (24)
where
*s tne lifetime prior to irradiation, and
is the electron fluence.
V-ll

10-1
10-2
toLUocLU
no
ortrDOLUQO
QQCC 10"
ECO
-3
10-5
10-6
C6A-19<2)
0.2
298"K
260°K
240°K
220°K
200" K
I I0.4 0.6 0.8 1.0
FORWARD BIAS (VOLTS)
1.2 1.4
Figure 54. Forward Diode Characteristic of Cell C6A-19(2) afterMounting on Cold Finger
V-12

Both oxygen-rich and oxygen-lean lithium cells were irradiated to fluence incre-ments of « 1012 e/cm2 at the bombardment temperature, Tg. Diffusion lengthmeasurements were then made at a measurement temperature of TM = 200°K.The cells were then returned to Tg for another irradiation. For each bombard-ment temperature this procedure was repeated approximately six times, thediffusion length measurements were converted to lifetime, T, through use of themobility data of Morin and Maita (Reference 14) and 1/r was plotted againstfluence, 0. The damage constant, KT, from Equation (24) is the slope of thiscurve,, (Throughout the measurements these curves'were good approximationsto straight lines.) In this way KT was found for several values of Tg for severaldifferent lithium cells.
The results of these measurements are shown in Figure 55. Since the densitynear the junction increases approximately linearly with distance from the junc-tion, the cells are characterized in Figure 7 by the density gradient dNL/dw.The cell diffusion length at TM = 200°K was « 20 m during the measurements,therefore an approximate estimate for the average density in the current collec-tion volume would be that« 10 jim from the junction or « 10~3 dNL/dw (cm~ 3) .The figure shows both oxygen-rich (QC) and oxygen-lean (FZ and Lopex) cells.The QC cells have saturated values of KT well below (a factor of « 3) the FZand L cells in agreement with the carrier removal results on bulk samples,Section VII. The exponential decrease in KT at low temperatures and saturationat high temperatures is also in agreement with the carrier-removal results.The apparent insensitivity of the saturated value of KT to lithium density gradientis puzzling in view of the square root dependence found in the parametric studies.The high degree of accuracy and reproducibility of the short-circuit currentmeasurements in the parametric studies, and the consistent results they yieldfor many different cells gives a high degree of confidence in their validity. Thecold finger measurements on the other hand, are very dependent on the accuratepositioning of the cell with respect to the 1-MeV electron beam rendering cell-to-cell comparisons less accurate. This is believed to be the reason for thediscrepancy.
D. CELL RECOVERY
Successive anneals at different annealing temperatures, T^, were per-formed on several oxygen-rich and oxygen-lean cells. The reciprocal fractionof damage remaining (fr)"1 was plotted against time. Physically, (fr)"1 attime t is the ratio of the effective density of unannealed damage centers at thestart of the anneal to that at time t into the anneal. In terms of the measuredquantities ( f r ) is given by the equation
f i i \(25)
V-13

Life
time
Dam
age
Con
stan
t, K
r cm
^/e-
sec
0
0
CJl
^J
N
O
CJ1
O
5
. N
K.1
0 n \o \>I • • ^• . x x ^ ^
VTm=2000K \x
1 1 I I 1> 4 6 8 10 12
Lopex,dl\lL/dw=5x10'9crTr4
-FZ dNL/dw-2x1018cm-4
. FZo rL dNL/dw=3x1019cm-4
QC,dN|_/dw-l .oxlil cm dlM|/dw=6x10 cm~4
I14
1000/TB(0K'1)
Figure 55. Lifetime Damage Constant vs Inverse BombardmentTemperature for Measurement Temperature of 200°K,Cell C6C-18(2)
where TOO. To (0 ) , and T o ( t ) are the minority-carrier lifetimes at the annealingtemperature in question before irradiation, immediately after irradiation, andat time t after the start of recovery, respectively. The time dependence of(fr)'"1 depends on the annealing kinetics, and for first order kinetics the depen-dence is exponential (Reference 23):
(fr)'1 = exp (47Tr 0 N L D L t ) , (26)
where NL is the lithium density, DL is the lithium diffusion constant and ro isthe capture radius for lithium by the defect.
Recovery curves for two of the cells measured are shown in Figure 56. Therecovery slopes, S(= 4rr r0NLD]_,) for these cells are 5.1 x 10~4 and 4. 5 x 10~"4
sec ~*. Values of S were obtained as a function of temperature for each cellstudied. The only quantity in S which is strongly temperature dependent is
Thus, DL can be calculated by finding S and inserting values for ro andIn Figure 57, plots of S versus inverse annealing temperature are given
for QC cells with two different values of dNL/dw. The solid lines drawn through
V-14

2.5
1.5
• C6C-17I1). X C6C 18(1) .
TA=373°K
10 15 20 25 30 35
TIME AFTER IRRADIATION (MINUTES)
Figure 56. Reciprocal Fraction of Damage Remaining vs Time after Irradiationat373°K: Cells C6C-17(1) and C6C-18(1)
2
.103
oo 2
. io-4
x C5 cells, QC,-g—: = 5x1019cm-4
0 C6 cells, Q C , - - = 1.8x1018cm-4
51 I I I I A I I -'I2.4 2.5 2.6 2.7 2.8 2.9 3.0 3.1
1000/TA(°K-1)
Figure 57. Recovery Slope vs Inverse Annealing Temperature;Recovery Activation Energy for Quartz-Crucible Cells
V-15

the experimental points represent an activation energy of 1.07 eV, the activationenergy (Reference 5) for the diffusion of lithium in QC silicon. The values ofDL calculated from the data assuming r0 = 10 A and NL = 10~3 dNL/dw agreewell with Pell's values for silicon containing an oxygen concentration of 5 x 10¹⁷
cm"3. This confirms that lithium diffusion to defect sites is responsible for re-covery in lithium-containing QC cells.
The recovery curves for three groups of low oxygen content cells are given inFigure 58. The solid lines represent the 0.66 eV activation energy (Reference7) for lithium diffusion in oxygen-lean silicon. Using ro = 10 A and NL = 10~3
dNL/dw, the values calculated from the data for DL agree with Pell's within afactor of « 2. It is noteworthy that the ratios of the values of S for the twocells at a given value of annealing temperature TA are (within a factor of 2)equal to the ratios of the lithium density gradients, dNL/dw, measured in thecells. This is further confirmation of the recovery results of Section II.
E. REDEGRADATION
Cells from lot T9 had shown considerable (« 10$) redegradation of photo-voltaic characteristic after recovery from irradiation. Therefore, they werechosen for redegradation studies on the cold finger. Anneals at various tempera-tures were carried out beyond the point of maximum recovery. The redegrada-tion characteristic was thus observed as a function of annealing temperature.The results of the experiment are shown in Figure 59 in which normalized life-time is plotted versus annealing time for annealing temperatures of 357°K, 345°K,and 322°K. Plotted on the same co-ordinates is an annealing curve of normalizedcarrier density for FZ Hall-bar sample at an annealing temperature of 300°K.Each of the curves rises to a peak (recovers) and then redegrades. The re-covery and redegradation rates increase with increasing annealing temperatureand all four redegradation curves show similar shape. This indicates that theremay be an effective activation energy for redegradation which is close to that forlithium diffusion in silicon.
F. DIFFUSION CONSTANT
The diffusion of lithium in silicon over a wide range of temperatures hasbeen reported previously by several authors (References 5, 7, and 24). Theseworkers generally used some sort of ion drift technique for the diffusion of lith-ium (n-type dopant) into a lightly doped p-type base. Since solar cells are quitedifferent devices from those used by the above authors, it is desirable to deter-mine nondestructively the diffusion properties of the lithium ion in the actual de-vice being studied. Such a technique was developed and reported previously,
V-16

10-2
5
o
~ 2
Q
^ 10-3
iiCO
Ea = 0.66eV
o C5 Cells, FZ, dl\l|_/dw = 2x 10¹⁸crrr4
+ T9 Cells, L,dNL/dw = 5x 10¹⁹crtr4
T7 Cells FZ or L, dN|_/dw = 3 x 1019 cm'4
I I2.9 3.0 3.1 3.2 3.3 3.4 3.5 3.6
Figure 58. Recovery Slope vs Inverse Annealing Temperature; Recovery Acti-vation Energy for Float-Zone and Lopex Cells
- 1 ?c/> I -f-
0)a« 1.0h_k.(OO
•° 0.8(O0)
0.6
N
"co
0.4
0.2
CellT9-16 (Lopex)
A TA = 322°K(103/TM=3.1)Q TA = 345°K(103/TM=2.9)
X TA = 357°K(103/TM = 2.8)
O Hall Bar TA = 300° K
10-2 10-1 10° 101
Time After Irradiation (Hours)
102 103
Figure 59. Normalized Lifetime or Carrier Density vs Time after Irradiationat 357°K, 345°K, 322°K, and 300°K
V-17

(Reference 1) and a brief description is given below to familiarize the readerwith the terminology. The capacitance Ca (and corresponding depletion width,Wa) is measured for some applied voltage, Va. Then a large negative bias V^is impressed on the cell (typically 10 volts) for a period of time. Under theresulting field, E, the mobile ions drift toward the junction. This causes thecapacitance, Ca, to increase very much like the increase in capacitance of aparallel-plate capacitor as the plates are moved toward each other. Since thesecells typically exhibit a linear 1/C3 vs V characteristic, one must increase theapplied voltage to maintain the same capacitance Ca. This change in appliedvoltage, AVa, is measured as a function of time while the cell is biased at Vfo.This Av
a/At is then proportional to the lithium ion mobility and with the Ein-stein relation, one can determine the diffusion constant, D.
Lithium diffusion constant measurements have been made on two high densitygradient quartz-crucible cells. These particular cells (C5-19, C5-20) are verysimilar, having a lithium density at the junction edge (1.09 micrometers) of~ 8 x 10¹⁴ Li/cm3 and a density gradient of ~ 5 x 10¹⁹/cm4. These are among thehighest-density-gradient quartz-crucible cells received. The lithium-ion diffu-sion constant was measured between 30°C and 64°C at 1. 09 micrometers fromthe junction. The results are shown in Figure 60. Also shown are the resultsof Pell (Reference 4) for lithium diffusion constant in quartz-crucible siliconcontaining an oxygen concentration of about 1018 atoms/cm3. The measurementsshow excellent agreement indicating the presence of about 1018 atoms/cm3 ofoxygen in these cells at 1. 09 micrometers from the junction. The 1. 07 eV acti-vation energy results from the dissociation of LiO+ (~ 0.42 eV) into Li+ and 0and the subsequent diffusion of free ( Li+) lithium (~ 0.65 eV). The data shownin Figure 60 leaves little doubt that the recovery of high-density-gradient lith-ium-doped quartz-crucible cells is associated with the diffusion of free lithium
V-18

10 13
10 14
i io-15
Ea = 0.65evd
FREE LITHIUM, v.\ PELL Q.C. Silicon-^ Ea = 1.07eV
\X+ OC5191
\ a. oc on r Quartz - Crucible Cellso \ -1-C5-/U J
^ Wa = 1.09 Micrometers
\
10 16
A\ 298\
V i2.8 2.9 3.0 3.1 3.2 3.3 3.4 3.5
103/TM(°K-1)
Figure 60. Diffusion Constant of Cells C5-19 and C5-20vs Inverse Temperature
V-19

SECTION VI
LITHIUM CELL OPTIMIZATION
A. TEST VARIABLES
Solar panels on earth-orbiting vehicles are subject to a radiation environ-ment which includes protons and alpha particles as well as electrons, the fluxrate and energy spectrum of each particle type varying with the altitude and in-clination of the orbit. Thermal cycling is also experienced; temperatures canrange up to approximately 100° C and down to approximately -80° C for an orbitwhich dips into the earth's shadow. (For vehicles subject to nuclear events bothradiation and thermal cycle environments are more severe; i.e. , x-ray, neutronbursts, etc., being added to the radiation environment, and high-temperaturethermal shock to the thermal environment.) The laboratory radiation environ-ment in the scope of this contract has been limited to a single particle type,energy, and (except in cold finger experiments) flux; i.e., 1 MeV electrons ata flux of approximately 4 x 10¹³ e/cm2-min. The radiation-envirpnment vari-able has been the fluence, ,0 which was varied from 3 x 10¹³ to 3 x 10¹⁵ e/cm2.The test flux of 4 x 10¹³ e/cm2-min. is several orders of magnitude higher thanthe rates normally experienced in earth orbit. While not simulating the real-time orbit situation the high flux and short durations of the irradiations permittedseparation and isolation of the three main phases in the lithium-cell life cycle;i.e., damage, recovery, and post-recovery behavior. Lithium-cell temperaturehas been varied from 80° K to 380° K (-193° C to +107° C).
The obvious disadvantage of the limited radiation test environment is the un-certain applicability of the results to other particle types, energies and fluxes.However, restriction of the radiation parameters made it possible 1) to testa wide range of lithium-cell variables for the same type of defects, 2) to testsufficiently large numbers of cells (and cell groups) to establish statistically-meaningful qualitative, and in many cases quantitative trends, 3) to identifynew parameters which provide more complete descriptions of cell behavior, and4) to rapidly test modified cell designs to provide swift feedback as to the re-covery characteristics. The most important discovery was that the slope of thelithium density profile near the cell junction, i.e., the lithium gradient, providesthe basis for many cell predictions and optimizations.
While the specific damage mechanisms vary with particle type and energy, allhave two basic effects in common, (1) decrease in minority-carrier lifetime(diffusion length) and (2) removal of majority carriers (donors). It is thusfelt .that the 1-MeV electron results do provide a good foundation for work usingother particles and energies and that the general nature of the trends observed,
VI-1

specifically the trends with lithium gradient, will be widely applicable. Thelogical follow-on to this work would be the testing of lithium cells under ir-radiation by protons and electrons of varying energies using the guidelineswhich have been developed and are summarized below.
B. CELL PARAMETERS
In optimizing a solar cell for operation in a radiation environment severalsets of parameters must be related, e.g., material parameters, fabricationparameters, initial performance characteristics,damage factors, post-irradiationperformance, and environmental characteristics. In this section the relation-ships established in the present work will be summarized. These will then beused to define, where possible, guidelines for optimum lithium-cell configurations.
It is convenient to divide the cell parameters into several sets. For this dis-cussion they have been categorized as follows:
Set 1. Source parameters. These specify the starting condition of asilicon cell before lithium is introduced. The cell manufacturer is alsoincluded as a parameter in this set.
Set 2. Lithium fabrication parameters. These describe the method andspecifics of the lithium introduction process.
Sets 1 and 2 are essentially independent parameters.
Set 3. Lithium density parameters. These describe the lithium donordensity distribution in the cell.
Set 3 is dependent on the set 2 parameters and also on several of theparameters of set 1.
Set 4. Performance parameters. These include the parameters whichdetermine initial and post-irradiation cell performance, recovery rateand stability.
The set 4 parameters are dependent on parameters of each of the previous sets;there are also mutual dependencies within set 4. In addition to the cell para-meters a fifth set must be considered, i.e., the environmental (thermal andradiation) parameters upon which set 4 parameters also depend.
The parameters are listed by set in Table IV. The parameter, the set to whichit belongs, and the symbol(s) used to identify it are listed in separate columns.The manufacturers are Centralab, Heliotek and Texas Instruments, designatedC, H, and TI, respectively. The three silicon types are quartz-crucible, Q;float-zone Z; and Lopex, L. The starting dopants are phosphorus, P; Arsenic,
VI-2

TABLE IV. PARAMETERS OF LITHIUM CELLS
Set
1
1
1
1
1
2
2
2
2
2
3
3
4
• 4
4
4
4
4
4
- 4
4
4
4
4
4
4
4
4
4
5
5
5
Parameter
Cell manufacturer
Silicon type
Starting dopant
Starting resistivity
Boron diffusion schedule
Lithium source
Lithium diffusion temperature
Lithium redistribution temperature
Lithium diffusion time
Lithium redistribution time
Lithium density distribution
Lithium density gradient
Pre- irradiation Isc
Pre- irradiation VQC
Pre- irradiation PMAX
Pre irradiation diffusion length
Immediate-post- irradiation Ig£
Immediate-post- irradiation VQQ
Immediate- post- irradiation PMAX
Immediate-post- irradiation diff. length
Post- recovery Igc
Post-recovery VQC
Post- recovery PMAX
Post- recovery diff. length
I- V- curve filling factor
Time to half recovery
IgQ loss (redegradation)
VQQ degradation
Filling- factor degradation
1-MeV electron fluence
Bombardment temperature
Recovery (annealing) temperature
Symbol (s)
C, H, TI
Q, Z, L
P, As, Sb
Po
NL(w)
dNL/dw
!0
V0
PoLo
KO)
V(0)
P(0)
L(0)
KR)
V(R)
P(R)
L(R)
f
eAI
AV
Af
0 -TBTA
VI-3

As; and antimony, Sb. The lithium source is either a paint-on (suspended inoil) source or an evaporated source. The performance parameters include (inaddition to the current, voltage, and power) recovery and redegradation timesand current loss during redegradations. In set 5 only the parameters coveredin the present work are listed, although the possible effects of other variationswill be considered later.
The set 3 parameters include the lithium density distribution with distance fromthe junction, NL(W) , and the lithium gradient, dNL/dw. Obviously the formergives the more complete density description, however relationships involvingthe entire distribution, in addition to being difficult to establish, would be im-possibly complex. Layer resistivity measurements by the cell manufacturers(Reference 8) indicate densities varying up to ~1017 lithium donors/cm3 nearthe back of the cell. Interpolation between these results (which extend to withinseveral mils from the junction) and our reverse-bias capacitance measurements(which extend out up to «0.4 mils from the junction) indicates that a constantgradient situation throughout the bulk of the base region is approximated only incertain cells with moderate gradient ^3 x 1018cm~4. Nevertheless, manyimportant quantitative relationships involving photovoltaic and recovery para-meters have been established with respect to the lithium gradient near thejunction with these parameters generally valid for gradients up to approximately5 x 1019 cm"4. This is considered sufficient justification for identifying thelithium gradient as the most important single lithium density parameter, andfor using it as the principle basis for discussions of cell optimization.
It is important that the cell buyer be able to specify the cell he requires to themanufacturer in terms of source and fabrication parameters (sets 1 and 2) .To enable this, three levels of relationship must be established; (1) the directrelationships between set 4 and set 1 parameters (many of which are qualitativein nature), (2) the specific relationships between set 4 and set 3 parameters,many of which can be expressed quantitatively, and (3) the dependence of set3 parameters upon set 2 parameters. Together these three levels give theultimate performance in terms of the fabrication parameters. As was indicatedin Section IV the weak link in this chain is at present level (3). The manu-facturing processes have not yet reached the point where the lithium fabricationparameters can consistently and reproducibly be related to the resultant lithiumgradients. The problem is twofold (1) for a given lithium diffusion (a givencell lot), since unacceptably large cell-to-cell differences in lithium gradientoften occur, and (2) a given lithium diffusion schedule doesn't always yield thesame range of gradients. If the lithium cell is to become a practical alternativeto the n/p cell, then this is one of the areas where advancements must be made.But for the present, the discussion of cell optimization, which ultimately shouldbe couched in terms of fabrication parameters, must be discussed mainly interms of the physical parameter, i. e., lithium gradient.
VI-4

Returning to Table IV, there are several performance parameters (set 4) whichdepend upon certain source parameters (set 1). These are discussed below.(a) The most important of these involves the silicon type. The lithium diffusionconstant (and consequently the recovery rate) at room temperature in quartz-crucible silicon is a factor of approximately 1000 below that in oxyben-lean(Z or L) silicon. This ratio is smaller at higher temperatures since theactivation energy for diffusion is higher in crucible silicon (1.1 eV) than inoxygen-lean silicon (0.66 eV). Due to the great differences in recovery timesthese cell types will be considered separately in the discussion of quantitativerelations, (b) The starting dopant also has been observed to effect cell recoveryspeed in quartz-crucible cells. Antimony (Sb)-doped cells were observed torecover at a much slower rate (approximately one order of magnitude) thanPhosphorus and Arsenic-doped (P and As) cells with comparable lithium (noneof the oxygen-lean cells had antimony as the starting dopant.) The tentativeconclusion was drawn from the results that the antimony was responsible forthe reduction in recovery speed, (c) The filling factor, f, defined by theequation, P = I.V.f, has in specific instances been effected by the startingresistivity, PQ. Cells with high po and low lithium gradient (^1018 cm"4) havedeveloped series resistance during irradiation due to carrier depletion in thebase region. This combination, encountered mainly in oxygen-lean cells (sincepo ^40fi-cm in Q cells) should be avoided especially in heavy radiation environ-ments, (d) The dependence of initial lithium-cell performance on boron (p-skin)diffusion schedule has been studied by the cell manufacturers (Reference 21).They are in agreement that a short boron tack-on* time of 2 minutes yields bettercells than a long, 8 minute, tack-on at the same temperature (1075° C) . Thiswas further confirmed by our pre-irradiation measurements on lot C10C (8 min.)and C10F (2 min.) which showed the latter to have higher power than the former,(e) Another finding by the cell manufacturers was that Lopex cells in generalgave higher initial performance than float-zone cells, (f) Some performanceparameters depend on the cell manufacturer. Most notable among these was afactor of approximately 10 slower recovery speed in the TI(L) cells with respectto the C and H (Z and L) cells.
Before summarizing the relationships between the performance, physical, andenvironmental parameters a few relationships between the performance parametersshould be noted. In addition to the definition P = I.V.f noted above, for a givencell, V is dependent upon the logarithm of I. Finally a relationship between Iand L (I = 34.4 Iog10 L) was derived in this work. It is not universal in that itapplies only to cells illumination at 140 mW/cm2 using the RCA tungsten lightsource but it does apply to all of the many lithium cell-lots thus illuminated andmeasured by us.
* Boron diffusion consists of 3 phases: (1) pre-deposition heating time, (2) borondeposition ("tack-on") time, (3) boron diffusion time. It is the second phasewhich has been reduced from 8 to 2 min.
VI-5

WJ
tdoM
g
J
w
aot>g
1NH
D
er".0PH0)
>— ia
1H
.JW
0SH
AR
AM
E
On
EHo
<
^g
W
PQ
H
dCQ
O3Q.B.
oSOuQz«
w53
2H
a
xwX
o
o
I
"°
~:
u
"^
a
BE
LA
TIO
NS
H
eu
I<o,
Q Q Q co 3« — — u 20 0 0 3 =
^ ^ ^ $ O n c o ? ^
3 5 5 5 3 * * «S •» - - - Q < Q Q Q Q 3 3 On c o e o c o ^ « n ^ ^ r r ^ 1
o o o o 3 S o o o o g"«"
< < < < co n n < S n n cs . n n . . co to cor c i x i o o o s o o o o o u * i o o o o
o
h 13" a Q. J J J w| — J ) " ™ S S o <3
J 1 ' |i Si S !!.fP S! II IiE 1 l o l l t ^ S a'- S S > S eT 7 «8 U <
S S S 2 S 2 2 S S a sooo o o o o o o 22
r t X x X ' X X X X X X X X | |
/ i V A W r t c a c f l « r t v A V A V A r t n ) r t c 3 W / 4 n r t
= 9 * 3 3 S S = s ' = S S * „
I I I ' ^ X X - X X X X X X X X X X X X X X— --. « ^ n n 2 c o c o c o n r t e o c o c o e s - ic jes -. -.rt «,"« *rt "« A II Al v 11 H 11 II II H n n II V "3 VI Al "rt
* .l I I1 £> JS "j 'T- ^ "S ^ z1 sx ?"^j T3 -^- X • Q - i J - ' - O - X j ^ b S ^ o^
10 o S ' i ^ . 2 ' 2 s ' 3 ' S ° "° ^-x
C - ^ ^ t * ° ( ^ 5 l i S t O ' ^ 0 . — ^ ^ ^ f 4 ^ **J-*
'^i > i ; f S i ? | f~ if f >s sO* V?l v"S o ^ o J . . ^ 1 " ^ " • S X p l < u ? « < * 5 1 S - S B 2 <•«;+ £ u S o O g - g - O o x ° ^ ' | 1 o " i o ™ ^ o ^J^J ° - x S S2 > in > < < ^. -' < ^t co ' e^ ,^« v _ J > * > f c « t S S * a - c o — eo eotf t
t N « S c \ l ' S : 5 — SS£ OOO U5 — O OB B 8 ! ) B B B » B 8 B
— ~ O ~ _ . « « O
0 0 c 5 S ~ J £ K E " j "j"j — . - >> 5 B . > s a . s c ; > i r o . b s ^ L t : © < ] <
VI-6

Many quantitative relationships have been empirically found between the perfor-.mance parameters of set 4 and the lithium density and environmental parametersof sets 3 and 5. These relationships for crucible cells are summarized inTable V together with indications of the qualitative relationships observed. Theperformance parameters are listed in Column 1, the appropriate relationship incolumn 2, and the realm of applicability with respect to the independent variablesare given in columns 3 to 5. Cell-lots upon whose measurement the results arebased are listed in column 6. When the word "all" appears in column 3, it in-dicates applicability over the entire fluence range for 3 x 10¹³ to 3 x 10¹⁵ e/cm2."All" in column 4 has the same meaning with respect to lithium gradient, thecrucible-cell experiments usually covering gradients between approximately3 x 1017 cm"4 and 2 x 1019 cm"4. In several of the relationships given in column2 the parameter is subscripted by an "A", e.g., V^(O). This denotes thevalue of the parameter for lithium gradient equal to 1 x 1018 cm"4. "InversedNL/dw" and "direct dNL/dw" in column 2 indicate "decreases with increasinglithium gradient" and "increases with increasing lithium gradient", respectively.
The rows describing Vo, V(O), and V(R) yield some interesting results. BothV0 and V (O) have approximately the same gradient dependence, increasing 16millivolts per decade increase in gradient. Thus the voltage loss during ir-
: radiation is independent of gradient. However in V(R) the gradient dependence,By, was different at different fluences, i.e., By values for both C13 and C14Dcells were 20, 26 and 51 millivolts per gradient decade after fluences of 3 x 1013,3 x 1014 and 3 x 10¹⁵ e/cm2 respectively. Thus while voltage loss during irradi-ation is gradient-insensitive, the degree of recovery varies directly with gradient,this variation being stronger at higher fluences. (This effect was also evident inthe H3A cells which had lower VAO than the C13, and C14D cells. However theincreasing By set in at a lower fluence, By being 40 millivolts per decade afterrecovery from 3 x 10¹⁴ e/cm2) .
It is also interesting to note that V(O), I(O), and P(O) at a given gradient alldecreased at approximately equal increments per decade of flux. This situationis described by the relations for V^(O), IA(°) and PA(°) which apply to the Ccells. The current values were shown in Figure 8, the V^(O) values were 551,505, and 454 mV for fluences of 3 x 10¹³, 3 x 10¹⁴, and 3 x 10¹⁵ e/cm2, respectively;the corresponding values for PA(°) were 24.2, 18.0 and 12.4 mW. The valuesof I(R) generally followed the values of IQ however there was also a gradientdependence which became weaker with increasing fluence (see KL(R) relations) .The approximate relationships for KL(R)/KL(O) indicate that about nine-tenthsof the effective damage sites are annealed except in low-gradient cells at highfluence where recovery is less complete. The important relationships for P(R)indicate that for low fluences, low gradients give the higher values but as fluenceincreases the situation becomes reversed.
VI-7

The time to half recovery, e, is specified as a function of gradient, fluence, andtemperature. It holds, within a factor of approximately two for all crucible cellstested except the Sb-doped cells. The short-circuit current loss (redegradatiori),A I, was generally small with no systematic gradient dependence but with decreas-ing loss as fluence increased. The recovered open-circuit voltage was stable(AV »0).
Table VI indicates some relationships found for the oxygen-lean cells. Exceptfor recovery dynamics the results were sparse due to the spotty performance ofmost lots. The KL(O) relationship was obtained using cells in the gradientrange from 3 x 10¹⁷ to 3 x 1018 cm"4, the V(R) relationship covered gradients of1 x 1018 to 8 x 1019 cm"4 and included significant data scatter. The 9 values wereestablished for a wide range of cells with gradients ranging from 2 x 10¹⁷ to8 x 1019 cm"4. As reported in Section II the recovery for TI cells was approx-imately a factor of 10 slower than for the C and H cells. The instabilitiesobserved were mainly in short-circuit current and curve filling factor, verylittle voltage instability appearing except in lots C4 and C5. The current losseswere severe, especially in high-gradient cells after low fluence, however lower-gradient cells («5 x 1018 cm"4) were not immune to current losses of approximately5 mA (see Figure 37). The filling factor loss, Af, was due to a rounding of theknee of the I-V curve. It occurred mainly in high gradient TI cells, both irradiatedand unirradiated.
The relationships summarized above provide the basis for the establishment ofan optimum cell design. The number-one option involves the choice betweensilicon types, quartz-crucible or oxygen-lean (float-zone or Lopex). Summar-izing the comparisons of these two alternatives:
(1) Quartz-crucible cell lots have consistently been competitive withor better than commercial ion-cm n/p cells in initial and postirradiation performance while only scattered oxygen-lean cell lotshave achieved this level of performance.
(2) Crucible cells are more stable than oxygen-lean cells by a wide mar-gin both on an equal time/temperature basis (Tables II and III) andon an equal life-cycle basis (80° crucible storage vs 26° C oxygen-lean storage, see Figure 37).
(3) Oxygen-lean cells recover, at a given cell temperature, at a fasterrate than crucible cells.
The first two comparisons lead to the conclusion that at the present state ofdevelopment the quartz-crucible lithium cell is the cell to use. The oxygen-lean cell should only be considered in environments where the crucible-cellrecovery speed is insufficient to keep pace with the rate of damage.
VI-8

w55«
H
Q
KHX
O
>H3rn
\PP
LIC
AI
cm"1)
C*< J:
0 ^U Jo zZ -a
«~
. o(D
-e-
RE
LA
TIO
NS
HIP
H
US<K
a,
min
«
inyy
U
<F0
"D
O
1fa
"3
i
dir
ect
dN
L/d
w
O
mU
5yy"
.y
<0
0)
1SCO
'rt
i
:
inv
ers
e d
NL
/dw
tP
Mmy
inyy < «^ co inu x y -g<" y <f &>^* -»H LO **
y y y S
• B B •
S £•o o og -g t? ~" ""4J QJ Qj X . X£ ** *• *^ co +> coS CU Q> ^ ZS "S S0 Q) <U g "QJ 2 UCD CQ CO C O C O
O O O-
X "« *rt x x.in oo in
o o o o-r~t vH TH ^H
, X X X X
CO CO - CO
II II VJ" II
I*"N «
inv
ers
e d
NL
/dw
ral.
Ox
1018
(d
NL
/dw
)1''2
»530
+ 2
3 l
og, 0
(1
0- 1
8 d
Nt
«2
x
10
9 (
dN
L/d
w)-
' 0
°'6
=>6
x 1
01
8(d
NL/d
w)r
'
O —o "7J £ ^^a. ui s> (x)
I&rtB
to
O
X
CO
A
o
V
oft
en g
reate
r th
an 5
mA
' H- 1
<
(
1>>oS
in
U
I
f
0?Z
;><]
CO
1H
]g'eS
^>X
^^
co
I(11T3
ICO
««-(<]
VI-9

Criteria for the sufficiency of recovery speed can be derived by consideringthe time-to-half-recovery relationship (equation 12 and Table V), the shape ofthe recovery curve (Figures 17 and 37) and the radiation environment. Figures17 and 37 indicate that recovery is essentially complete for storage times afactor of ten above the time to half recovery, 6. To allow a factor of safetyfor the spreads in recovery speed and curve shape the time to full recovery willbe considered to be a factor of 40 times 9. Using this conservative criterion,time to full recovery is plotted against lithium gradients for four different orbittemperatures in Figure 61. The curves are plotted for the lower and upperlimits of fluence covered in the experiment, 3 x 101S e/cm2 and 3 x 10¹⁵ e/cm2,respectively. Plots were not made at the intermediate fluence of 3 x 10¹⁴ e/cm2
because this would crowd the figure; however, the appropriate recovery timesat 3 x 10¹³ e/cm2 are simply 3.9 times the values at 3 x 10¹³ e/cm2. The temper-ature range of 30° C to 80° C was chosen because solar panel temperaturesusually vary within this range* during the illuminated portions of most earthorbits.
An appropriate criterion for the sufficiency of recovery speed would be that thecell recovery time for the fluence encountered during the mission be less thanthe mission time. For example, for a mission of one-year's duration encounteringa total equivalent 1-MeV electron flux of 3 x 10¹⁵ e/cm2, Figure 61 indicatesthat cells with gradients above 2 x 1018 cm"4 or 1.2 x 1019 cm"4 would be requiredto satisfy the recovery-speed requirements for 65° C or 50° C orbit temperatures,respectively. A general expression for the minimum acceptable gradient for amission duration of y years can be derived by substituting 9 = 9. ly in equation 12.The result is,
/JXT /A v 6.4 x 10~8 , 0 . 5 9 . 1 .28x10* . / 0_.(dNL/dw)M I N= 0 exp ( ). (27)
It can be seen from Figure 61 that even for the upper fluence level a quartz-crucible lithium cell with practical lithium gradient, in this case <1.2 x 10¹⁹
can satisfy recovery speed requirements for orbit temperature of 50° C andabove.
C. OPTIMUM LITHIUM CELL
While the recovery speed criterion places a minimum acceptable value onthe lithium gradient, this minimum value will not in general give optimum per-formance. For example a mission encountering 3 x 10¹⁵ e/cm2 in a year coulduse lithium cells with gradients of 5 x 1017 cm"4 for an orbit temperature of 80° C
* Actually, maximum orbit temperature is usually above 50 C
VI-10

1000
to
Q 100
05
xo
LU
8LUoc
u.O 10
\
1 YEAR
30°C
0 = 3x101 5e/cm2
0 = 3 x 10¹³ e/cm2
I _L1017 1019
LITHIUM DONOR DENSITY GRADIENT, dNL/dw
. 1020
Figure 61. Time to Full Recovery (40 x 6) vs Lithium Gradient with CellTemperature and 1-MeV Electron Fluence as Parameters:Quartz-Crucible Cells
VI-11

if speed of recovery were the only criterion. However, such a low gradientvalue would be a poor choice in such a high fluence mission as was shown inTable V (and Figures 29 and 30) where recovered power is seen to drop forgradients below about 4 x 1018 cm"4.
In general, having established a minimum gradient for recovery speed, theoptimum gradient can be obtained from the relations for P(R) in Table V togetherwith the anticipated 1-MeV electron fluence. As fluence increases so does theoptimum gradient. In a range where there is no gradient dependence the highestgradient in that range should probably be chosen for the faster recovery speedit yields and the smaller net drop in open-circuit voltage (cf., VQ and V(R) inTable V) . This latter factor is especially important if the solar panel isoperating at a fixed voltage.
In summary, the optimum lithium cell, while differing depending on the missioncan be outlined as follows for orbit temperatures above 50° C:
Silicon type - quartz-crucible
Starting dopant - phosphorus
Starting resistivity - 20 to 40 £2-cm
lithium gradient - greater than (dNj^/dw) MIN
as given in equation (27) and chosen according to thefluence anticipated, i.e.:
dNL/dw «5 x 10¹⁸ for 0 <1 x 10¹⁴ e/cm2
dNL/dw «1 x 10¹⁹ for 0 M x 1014 e/cm2.
For cell temperatures less than about 50° C the crucible cell becomes marginalin a heavy (MO15 e/cm2-year) electron environment but for light-to-moderateenvironments (<3 x 10¹⁴ e/cm2) high gradient crucible cells («1 x 1019 cm"4)should recover with adequate speed for temperatures down to about 40° C.
D. MISSION CONSIDERATIONS
To give the above criteria practical meaning the fluences involved in the ex-periments must be related to the fluence equivalents expected in earth orbitingvehicles. To do this it is necessary to go beyond the scope of the presentexperiments since all earth orbits involve protons as well as electrons.
Damage constants for n/p solar cells have been published (Reference 26) forboth proton-and electron-bombardment as functions of particle energy. It has.been customary to normalize all damage constants to that for 1-MeV electrons.
VI-12

In this manner a damage factor is specified for each particle type and energy,the fluences of each type particle are weighted by this factor and all contri-butions are summed. The resulting weighted fluence is given in terms ofequivalent 1-MeV electron fluence, or DENIs*.
A limited amount of data (References 27 and 28) has been published on proton-and neutron-irradiated lithium cells. This data indicates that the damagefactors under proton irradiation for lithium cells after recovery are only asmall fraction of those for n/p cells, i.e., the lithium cell is much moreresistant to radiation damage under proton irradiation than the n/p cell. Thedata on lithium cells is too limited to site firm numbers but the factors aresomewhere between 0.05 and 0.2 times the n/p cell factors. The electron datain the present work shows the lithium cell damage coefficients to be fluencedependent, unlike the fluence-independent values for n/p cells. Short-circuitcurrent comparisons after recovery (Figure 26) show the lithium cell and then/p cell to have similar damage coefficients. Thus, to be conservative, inthe orbit analysis described below lithium-cell damage factors for protonswere taken to be 0.2 times the values for n/p cells, and the factors for electronswere taken to be equal.
Electron and proton models of the earth's radiation environment have beendeveloped by Vette et al (Reference 29) in which omnidirectional proton andelectron fluxes are given as functions of energy, orbit altitude, and orbitinclination. An orbital integration of these fluxes was recently performed byRCA (Reference 30) as part of a proposal effort for NASA on the AtmosphereExplorer program. The projected Atmosphere Explorer orbits are highlyelliptical orbits which experience very heavy proton fluxes in moving throughthe Van Allen Belts. The most severe projected orbit is a near equatorialorbit with an apogee of approximately 2040 nmi, a perigee of 85 nmi and aninclination of 18° . Since this orbit represents a very severe radiation environ-ment it is considered to provide a good test of the recovery speed of cruciblecells. The equivalent 1-MeV electron fluence over the mission duration ofeight months was calculated from the orbit integration and assumed damagefactors. The lithium cell was assumed to have a 6 mil coverglass for pro-tection against low-energy (<4 MeV)/protons.** The results showed thelithium cell receiving 5.1 x 10¹⁵ DENIs (5.0 x 10¹⁵ DENIs protons, 0.1 x iO15
DENI's electrons). This is slightly above the highest 1-MeV electron fluencein the present experiments. Considering the severity of the orbit chosen the3 x IO15 e/cm2 upper limit will cover the fluence experienced in most NASAmissions presently anticipated. * * *
* Damage Equivalent, Normally Incident 1-MeV electrons* *The n/p solar panel presently planned for the AE missions will have 60
mils coverglass.* * *This statement is correct if the damage factor method used to calculate
DENIs for protons is valid. This, admittedly is a very big "if" especiallywhere carrier (donor) removal is concerned.
VI-13

It is instructive to calculate the lithium gradient required to satisfy the re-covery speed criterion for such a mission. Assuming the 0.59 power dependenceon fluence holds, the recovery-time values at 3 x 10¹⁵ e/cm2 in Figure 61 mustbe multiplied by 1.23, or equivalently the required recovery time of 240 daysdivided by 1.23 giving 195 days. The minimum gradients for sufficient re-covery speeds are then 8 x 10¹⁷, 4 x 10¹⁸, and 2 x 1019 cm"4 for orbit temper-atures of 80, 65 and 50° C, respectively.
The "Solar Array Synthesis Computer Program" (Reference 31) developed byRCA for NASA-GSFC computes a degraded photovoltaic characteristic frominput data consisting of the initial I-V curve, proton and electron fluences inseveral energy increments, proton and electron damage factors in the sameenergy increments, coverglass thickness and cell temperature. AtmosphereExplorer mission calculations for a in-cm n/p cell and a lithium cell were runon this program using the damage factors assumed previously in this section,i.e., lithium-cell proton factors of 0.05 to 0.20 times n/p cell proton factors,lithium cell electron factors equal n/p cell electron factors. Results are shownin Figure 62 which gives maximum power, normalized to the pre-irradiationvalue, as a function of time in orbit. The n/p cell is shielded by 54 mils cover-glass; the lithium cell by only 18 mils. In spite of the large uncertainty, thecalculations for the conservative limit for the lithium cell show it to out-performan n/p cell with three times the coverglass thickness.
1.0
oTtr.ui
Oa.X
aLUN
ccO
0.9
0.8
0.7
Li CELLCI8 MILS)
n/p CELL (54 MILS)
END OF MISSION'
10-2 10°
TIME IN ORBIT (YEARS)
VI-14
Figure 62. Predicted Power Degradation Curves for Lithium Cells With 18mils Coverglass and in-cm/nP Cells with 54 mils Coverglass.Projected Atmosphere Explorer Orbit with 2040 nmi Apogee,80 nmi Perigee and 18° Orbit Inclination

SECTION VII
HALL AND RESISTIVITY MEASUREMENTS
A. INTRODUCTION
Hall-coefficient and resistivity measurements have been used to investi-gate the crystal-growth and irradiation-temperature dependence of the introduc-tion rate and room-temperature annealing of carrier-removal defects in lithium-doped silicon. These studies are necessary to understand the mechanisms bywhich lithium interacts with primary defects. The reaction products (the sec-ondary defects ) are formed during the thermal reordering processes which takeplace after bombardment produces the primary vacancy-interstitial pair. Theelectrical properties of electron-irradiated silicon at moderate electron ener-gies (Ee = 1 to 2 MeV) are dominated by these secondary defects. In general,,impurities are immobile at or below room temperature, but lithium is an im-purity which is highly;mobile at room temperature. This mobility makes it.possible for lithium to diffuse to radiation-induced defect sites. Evidence todate indicates that the interaction of lithium with the defects neutralizes the de-grading effect of these defects on the electrical properties of silicon solar cells.In order to guide the production of radiation-resistant cells, it is necessary toknow the ideal quantity of lithium required in the base region of the cell, and theway in which lithium interacts with phosphorous, oxygen, and radiation-inducedvacancies. Thus, the objectives of the Hall and resistivity measurements onbulk-silicon samples diffused with lithium were (1) to determine the dependenceof carrier-removal on lithium concentration, oxygen concentration, and electronfluences at low and high bombardment temperatures, and (2) to determine thedependence of annealing at room temperature on the same parameters as forcarrier-removal. To achieve these objectives, ingots of high resistivity FZrefined silicon, and QC grown silicon were procured and fabricated into Hallbars. Measurements on Hall samples fabricated from silicon procured duringthe last contract period (Reference 1) were irradiated and measured. Theseresults will be included in this report. A complete description of the methodsand techniques of these measurements can be found in Reference 20.
B. TEMPERATURE DEPENDENCE OF CARRIER-REMOVAL RATE
1. Float-Zone Silicon
Previous work of several investigators (References 32 and 33) demon-strated that the defect intorudction rate in phosphor us-containing silicon de-creases as the bombardment temperature is decreased, and also as the dopent
vn-i

concentration is increased at a fixed bombardment temperature. One of the ob-jectives of our study was to determine the dependence of carrier-removal ratein irradiated silicon on bombardment temperature and lithium concentration. Toachieve this objective, several Hall bars fabricated from 1500 ohm cm and 5000ohm cm float-zone refined silicon and from 30 to 50 ohm cm quartz-crucible sil-icon were diffused with lithium to concentrations from 2 x 10¹⁴ to 3 x 101? Li/cm3
and irradiated at bombardment temperatures from 79°K to 200°K. The rates ofcarrier-removal were determined after each bombardment. These rates,An/A* cm'1 measured in FZ silicon after annealing to a temperature of 200°Kversus the reciprocal of the bombardment temperature are shown in Figure 63.Lithium concentrations of the samples used in the measurements are shown asa parameter. The curves shift along the temperature axis towards lower temp-eratures as the lithium density is decreased over three orders of magnitude.These concentrations of lithium correspond to resistivities from 0.03 to 20ohm/cm. This shift of the temperature dependence portion of the curves is inqualitative agreement with the interstitial-vacancy-close-pair model (References32 and 33) which predicts this dependence of damage on the position of the Fermilevel or change state of the silicon during bombardment. It appears that thesaturated value of carrier-removal rate measured at a bombardment tempera-ture of 200°K increases with lithium concentration.
100
10-'
£u
15
10-2
10-3
ZONE SILICON
I 2 x lO1^ u/cm3II 3 x 10¹⁵ Ll/cm3III Sx 10'« Li/cm3IV 2 x I01« Li,cm3V 3 x I017 Li/cm3
ROOM TEMPERATURE
10 11 12 13
103/TB(°K-1) . .
Figure 63. Carrier-Removal Rates vs Reciprocal Bombardment Temperaturefor Float-Zone (FZ ) Silicon. Measurements at 79° to 81°K afterAnnealing to 200°K
VH-2

2. Quartz-Crucible Silicon
A similar set of curves is shown in Figure 64 for the samples fabricatedfrom quartz-crucible silicon with lithium concentrations from 2 x 10¹⁵ to 3 x 10¹⁷
Li/cm3. The curves also shift along the, temperature axis towards lower temp-eratures as the lithium density is decreased in agreement with the result obtainedon samples of float-zone silicon.
The saturated value of carrier-removal rate obtained for the samples doped with3 x 1017 Li/cm3 is equal to 0.18 cm"1 which is the same value obtained for thesamples doped with 2 x 10¹⁶ Li/cm3, whereas the rate is slightly higher for thesamples doped with the lowest concentration of lithium. This difference is notsignificant, since it is within the experimental error. However, the propertiesof the float-zone samples are significantly different with respect to the saturatedvalues of carrier-removal and also with respect to the slopes of the temperaturedependent portion of the curves in Figures 63 and 64. It seems that differenttypes of carrier-removal defects are dominating the electrical behavior in thesetwo types of silicon.
3. Carrier-Removal in High Resistivity Samples
The temperature dependence of the carrier-removal rate was measured onfive Hall bar samples fabricated from two different sources of high-resistivityfloat-zone silicon. A portion of the data obtained on these samples was included
-in-Figure-63.—This_section_of the jreportjleals with the remainder of the datawhich showed an anomalous effect.
These two sources of silicon had initial resistivities of 1500 and 5000 ohm-cm.Two Hall bar samples were fabricated from the 1500-ohm-cm material anddoped with lithium to a concentration of 5 x 10¹⁵ Li/cm3. The other three sam-ples were made from the 5000-ohm-cm material and doped with lithium to a con-centration of 1.8 x 10¹⁴ Li/cm3. All five samples were irradiated at severaltemperatures (Tg), and then the rate of carrier-removal was determined aftereach bombardment (measurement temperatures, TM, always being 78-81°K).The results obtained on the five samples are shown in Figure 65 where curve Iis based on the measurements obtained on three samples made from the 5000-ohm-cm material (hereafter referred to as " J" material) and curve n is basedon the measurements obtained on the 1500-ohm-cm float-zone silicon (" H " ma-terial). A very surprising result was obtained when samples (previously ir-radiated at lower temperatures) were bombarded at TB = 95°K. The carrier-removal rate decreased to a low value and then increased as successive bombard-ments were completed at higher temperatures. All five samples showed thiseffect, thus the experimental evidence strongly supports the reality of this min-imum in the Tg dependence curve of carrier-removal rate versus reciprocal
VH-3

10°
101-1
Eo
10'I-2
10-'
~I 1 1 TQ.C. SILICON
I 2 x 10¹⁶ Li/cm3
II 2 x 10¹⁵ Li/cm3
10 11 12 13
Figure 64. Carrier-Removal Rates vs Reciprocal Bombardment Temperaturefor Quartz-Crucible Silicon. Measurements at 79°K afterAnnealing to 200°K
0.08
^*
'Eo
•e- o.oec
I
0.04 —
0.02'
=—=0=
FZ SILICON
O 1.8X10¹⁴Li/cm3
D 5 X 10¹⁴Li/cm3
10
c.,-1,
12 13
Figure 65.
10J/TB<°K-')
Carrier-Removal Rates vs Reciprocal Bombardment Temperaturefor Float-Zone Silicon Irradiated by 1-MeV Electrons(Measured at TM = 78°K)
VH-4

bombardment temperature. The only reasonable explanation is that a defect levellocated at an energy corresponding to the position of the Fermi-level at a bombard-ment temperature of 95°K (about 0.14 eV below EC ) would affect the measure-ments. If this defect is being introduced by the bombardment then it would beexpected that an unirradiated sample initially bombarded at TB = 95°K would notexhibit the low value of carrier-removal rate (0. 04 cm"1). To test this theory,one of the three samples of " J " silicon was bombarded initially at a temperatureof 95°K whereas the other two were bombarded starting at TB = 200°K and 85°K,respectively. The bombardment temperatures of the latter two samples was slow-ly decreased to 78°K and increased to 200°K, respectively. As was expected,the sample pristinely bombarded at 95°K indicated a carrier-removal rate of0.092 cm"1 which is approximately twice the value measured on the four pre-viously-irradiated samples. Thus it appears that a radiation-induced defectlevel was responsible for this minimum in the curves of Figure 65. Furtherevidence will be given in later sections to support this hypothesis. The shift ofthe carrier-removal characteristics (Figure 65), along the temperature axis tolower temperatures was in agreement with the interstitial-vacancy-close-pairmodel (References 32 and 33) which predicts this shift with changing resistivity.It should be noted that the saturated value of An/A* (0.1 cm"1) obtained on theselightly-doped samples of float-zone silicon is equal to the saturated value ofAn/A$ obtained on the quartz-crucible samples (Reference 20) which were heav-ily doped with lithium (2 x 10¹⁶ Li/cm3).
4. Fluence and Measuring Temperature _ _.
Measurements of the fluence dependence of carrier-removal in irradiatedsilicon have been made and reported on in the literature (References 4, 34, and35). Samples doped with conventional impurities (e.g., phosphorus, antimony,and arsenic) and with lithium have been investigated by other workers. 'It is oneof the objectives of this work to determine the influence of the degree of damageon the carrier-removal rates and annealing properties at room temperature oflithium-doped silicon. It has been shown (References 4 and 35) that, for a fixedtemperature of bombardment and measurement, the carrier-removal rate de-creases exponentially with fluence when the removal rate and damage level ishigh. However, if the removal rate is low, then it has been shown (References18, 20, and 34) that carriers are removed linearly with fluence, and the carrier-removal rate is constant over a limited range of fluences. However, the situa-tion is more complex when the bombardment temperature and/or measuringtemperatures are varied. This is illustrated in Figure 66 where the curves ofcarrier density, n versus fluence, $ measured at two temperatures on sampleH5-5 are shown. This sample had been bombarded at lower temperatures priorto the bombardment at TB = 250°K. However, the major part of the damage oc-curred during the bombardment at the higher temperature. The sample wasmeasured at a temperature of 250°K, and at 79°K. The latter temperature hasbeen used throughout this work as a reference temperature.
VH-5

The results in Figure 66 demonstrate that carrier-removal rates measured athigh temperature can be lower or higher than those measured at low temperature.There is agreement in the carrire-removal rates measured for either low orhigh measurement temperatures in region I of the curve, where the fluence andcarrier losses are small. In region n, the carrier-removal rate TJ (TM = 250°K)w 12r| (TM = 79°K), and in region HI 77 ( TM = 250°K) « 0. 2r? ( TM = 79°K). Ob-viously the curves for TM = 79°K can be fitted with an exponential dependence on$ and a single constant (for example, n = noe~3$). Three different constants(e.g., B) are required to fit the curve obtained for TM = 250°K in the three re-gions labeled I, n, and El in Figure 66. These results point out the complexityof the physical situation and the necessity for care in comparing the results ofdifferent experiments.
C. CARRIER DENSITY VERSUS MEASURING TEMPERATURE
1. Float-Zone Samples of High Resistivity
The carrier density was measured as a function of temperature at varioustimes during the bombardment of the J-samples, which were previously discussed(see Figure 65). Figure 67 shows the results obtained on one of the " J" samples.All three " J" samples exhibited the same carrier density dependence on measur-ing temperature.
Curve I was obtained from measurements on the sample before bombardment,curve n was obtained following the completion of bombardments, and curve HIwas obtained following the completion of the high temperature annealing cycles(TA = 300°K and 373°K). Curve II clearly shows that the irradiation has intro-duced a defect level or levels covering a wide temperature range. The tempera-ture at which half of the traps are filled is Tt/2
= 146°K as shown in Figure 67.The effective energy level corresponding to this temperature was calculated tobe E = Ec - 0.14 eV. This defect level or levels thus appears to be responsiblefor the minimum carrier-removal rate shown in Figure 65 at a bombardmenttemperature of 95°K. Curve HI indicates that the interaction of lithium with thisunknown defect and other possible lithium centers takes place during the hightemperature annealing cycles. Both the trap density and the carrier density atlow and high temperatures decreased. The lithium density (assuming that thecarrier density can be equated to the lithium density at this temperature) de-creased by a factor of 1. 8 whereas the carrier density measured at low temp-erature (78°K) decreased by a factor of 1.1.
VH-6

ZONE Si
H5 - 5 -1.3 x 10¹⁶ Li/cm3
TB = 250°K
O TM = 250°K
D
1014
44 64 84
<M10ue/cm2)
104 124 144
Figure 66. Carrier Density vs Fluence for FZ Silicon Sample (H5-5)Bombarded at 250°K and Measured at 79° and 250°K
vn-7

o>6
09O
<c6 in
oI _
D
. I
aoo
OT
<B
§NJ,nSO
aSa)H^»e
01
§
13oo!Ha
•rH
o
I sQ -P
IIO ~
CD
bC
VII-8

Figure 68 is particularly interesting since these are the results of carrier den-sity versus temperature measurements taken on the sample of " J" silicon whichwas initially bombarded at TB = 93DK and subsequently bombarded at lower andhigher temperatures. As previously stated, the An/A* measured at TB = 95°Kwas found to be 0. 092 cm"1 rather than 0. 04 cm"1 indicating the absence of thispreviously unknown defect level at the beginning of the bombardment. Figure 68shows that curve II taken right after bombardment at TB = 95°K does not showthe presence of any defect level, but the level does appear in the measurements(curve El) made after the other bombardments were completed. Thus, theseresults support the carrier-removal measurements. Curve IV taken after an-nealing ( TA = 300°K and 373°K) shows that the defect level is reduced in densityand modified in energy but is not completely removed, in agreement with the re-sults of Figure 67. The measurements taken on the third " J" sample were incomplete agreement with those shown in Figures 67 and 68.
2. Quartz-Crucible Silicon
The carrier density was measured as a function of temperature beforebombardment, after bombardment, and following annealing cycles at tempera-tures of 300°K and 373°K, on samples of quartz-crucible silicon doped with2 x io15 Li atoms/cm3. These are the same samples used to obtain the carrier-removal rates which were previously discussed and shown in Figure 64. Fig-ure 69 shows the results obtained on one of the samples which was annealed only
-at-TA-^-300°K.___A .defeatJeyjeljoj3ate^aiji^energy_qf_JIc ^.JL9j3Vjs_shown _in_the data of curve II obtained on the sample immediately after bombardment.There is a slight indication that a second shallower level (« Ec -0.13 eV) is alsopresent. Curve ni illustrates the results obtained after annealing at a tempera-ture of TA = 300°K for 36 days. The defect density decreased slightly and theenergy of the level did not change significantly from the value calculated beforethe annealing cycle took place. It should be noted that the carrier density meas-ured at room temperature decreased during the annealing cycle, but the carrierdensity measured at low temperatures increased. This behavior has been con-sistently observed on « 14 samples of lithium containing silicon.
Figure 70 is a similar set of curves obtained on another sample which differsfrom Figure 69 in that this sample was first annealed for a short period of timeat a temperature of 373°K and then at room temperature for 54 days. Curve Iis based on the initial values of carrier density, curve n was obtained on thesample immediately after bombardment, curve III was obtained following the373°K annealing cycle, and curve IV was measured after the sample annealedat room temperature. Here again, a defect level located at an energy of Ec
-0.16 eV was measured immediately after bombardment and is shown in Figure70 (curve II). There is some evidence that a second shallower level also exists.
VH-9

Ioo
O
(0N
"?
9II
- = >
o>o
ino
ao
aS(!)H
CD
SQ)
oo!Ha
•r-1 .o
0}
0}I
oo«o0?-i3bJD
vn-io

2.2
2.0
^ 1.8
£ 1.6cccc2 1.4
in
^ 1.2
1.0
.8
QC SILICON
1 0 = 0II 0 DAYS 0T = 3.3 x 10¹⁵e/cm2
111 36 DAYS AT TA = 300° K
I I6 7 8 9
103/TM(°K-1)
10 11 12 13
Figure 69. Carrier Density vs Reciprocal Measurement Temperature forQuartz-Crucible Silicon
_2.2
2.0
COE 1.8o
~2o>
1 1-6u,0
1.2
1.0
E = 0
QC Silicon1 0 = 0
H 0 Days <t> = 2.5 x ID15 e/cmz
HI 30 Min Anneal TA = 373° K1ST 54 Days at TA = 300° K
10 11 12 13
Figure 70. Carrier Density vs Reciprocal Measurement Temperature forQuartz-Crucible Silicon
VH-11

This second level is more prominently shown in curve HI after completion of the373°K annealing process located at an energy of Ec -0.13 eV where the energyof the first level was calculated to be Ec -0.18 eV. It should be noted that thecarrier density decrease measured at TM = 300°K and the increase measured at
< 160°K agrees with the results of Figure 69.
D. ANNEALING
1. Dependence of Carrier Density Changes on Resistivity
One of the important properties of irradiated lithium-doped silicon is theannealing of the damage at TA = 297°K, and the dependence of annealing proper-ties on the lithium concentration. Figures 71, 72, and 73 show the dependenceon lithium density of the annealing properties in irradiated float-zone silicon.The unannealed fraction fn of the carrier density is plotted as a function of an-nealing time at room temperature (TA = 297°K) in Figure 71. The unannealedfraction fn is given by Equation (28)
f = n0(TM) -n(TA,t)n n0(TM)-nF(TM)
(28)
i
1.2
1.0
0.8
0.6
c 0.4to
0.2
10-1
Zone Si
TM = 80°KTA = 297°K
QH45 7.2 x 10¹⁵Li/cm3XH55 : 1.3x 10'6 Li/cm3aHS-1: 2x 10¹⁶ Li/cm3• H9-1: 5x 10¹⁴ Li/cm3
100 10
Annealing Time (Hours)
102 103
Figure 71. Unannealed Fraction of Carrier Density vs Annealing Time for FourSamples of Float-Zone Silicon Annealed at 297°K and Measuredat 80°K
VII-12

1.6r_
1.4
1.2
2 1.0•*ure£ 0.8
0.6
0.4
0.2
0io-i
TA = 297°Ko H4-5: 7.2 x 10¹⁵ Li/cm3
XH5-5: 1.3 x 10¹⁶ Li/cni3
QH8-1: 2 x 10^6 Li/cm3
• H9-1-. 5 x 10¹⁴ Li/cm3
J10° 10
Annealing Time (Hours)
10" 103
Figure 72. Unannealed Fraction of Carrier Density vs Annealing Time for FourSamples of Float-Zone Silicon Annealed and Measured at aTemperature of 297°K
TM = 80°K
TA = 297°K7.2xl015 Li/cm3 (H4-5)
1.3xl016 Li/cm3 (H5-5)
2x10¹⁶ Li/cm3 <H8-D
Annealing Time (Hours)
Figure 73. Unannealed Fraction of Reciprocal Mobility vs Annealing Time forFour Samples of Float-Zone Silicon Annealed at a Temperature of297°K and Measured at 80°K
vn-is

where no( TM ) is the carrier density measured at a temperature TM before ir-radiation, n (TA, t ) is the carrier density measured at time t during the anneal-ing cycle carried out at an annealing temperature of TA, and njr(T]y[) is the car-rier density measured at a temperature TM immediately after irradiation andbefore the annealing cycle is initiated. A similar equation was was used to cal-culate f.. the unannealed fraction of the reciprocal mobility. A value of fn orfn < 1 indicates an increase of carrier density or mobility, and a value of fn orfM > 1 indicates a loss of carrier density or mobility. Measurements of carrierdensity were made at a reference temperature of TM = 80°K. First order an-nealing kinetics describe the behavior of the high density samples for approxi-mately the first hour of annealing time. After this period of time, a secondstage of recovery took place which was unstable, and the carrier density de-creased to some equilibrium level. Both samples H4-5 and H8-1 showed thiseffect. Sample H5-5 could have behaved similarly, however measurementswere not made during the annealing time when this effect seemed to occur. Thissample was remeasured eight months after bombardment and the carrier densi-ties and mobility were approximately the same values as shown in Figure 71 foran annealing time of 80 hours. In complete contrast to the behavior of the threeother samples, H9-1 which was lightly doped with lithium (5 x 10¹⁴ Li/cm3) didnot indicate any increase in the carrier density as a function of annealing timebut rather a slight decrease at TA = 297°K. The behavior of the lithium concen-tration during the annealing cycle can be inferred from the behavior of the car-rier density measured at a temperature of 297°K assuming that the density ofdeep acceptors NA is much less than ND the donor density. These measurementsare shown in Figure 72 where the unannealed carrier density fn versus annealingtime is shown for the same four samples. The three samples heavily-doped withlithium (H4-5, H5-5, H8-1) exhibited a recovery of the lithium concentrationduring the annealing cycle. This recovery has been explained in previous work(Reference 20) as evidence for the instability of the LiV complex, and thereforeits subsequent dissociation which returns free lithium to the crystal. Resultsobtained on sample H4-5 showed that the formation of some other defect involv-ing lithium can also take place after dissociation occurs. It should be noted thatthe fastest recovery was shown by the sample with the highest lithium concentra-tion. Sample H5-5 had a lower lithium concentration than H8-1, but slightlyhigher than sample H4-5 after bombardment. These results obtained on solarcells Section II. In contrast to the behavior of the other samples shown in Fig-ure 72 which were heavily doped with lithium, the carrier density of sample H9-1decreased continuously as a function of annealing time. Thus a loss of lithiumas a function of time was observed on H9-1 instead of a gain in lithium concen-tration as observed on the other samples of lower resistivity.
VH-14

2. Dependence of Mobility Changes on Resistivity
Hall and resistivity measurements made during the annealing cycles en-able us to determine changes in the mobility which indicate the presence or ab-sence of charge-scattering centers introduced by the electron bombardment.The results obtained on the four samples are shown in Figure 73 where the un-annealed fraction of reciprocal mobility fu versus annealing time at an annealingtemperature of 297°K is shown. Obviously, the measurement of the mobilityobtained on sample H9-1 is different than the measurements obtained on thelower resistivity samples. These samples recovered within « one hour at arate which depended on the lithium concentration. That is, the faster recoverywas shown by the sample with the highest lithium concentration. In contrast tothis behavior, at the start of the annealing cycle, the mobility measured onsample H9-1 decreased, and then it increased at a very slow rate for approxi-mately 17 hours of annealing at 297°K. The mobility finally increased to its pre-irradiation value after a total annealing time of 150 hours. The mobility did notchange significantly when the sample was annealed at a temperature of 373°K for20 minutes following the room-temperature annealing cycle. It should be notedthat the mobility measured on sample H9-1 was completely dominated by latticescattering before bombardment. The room temperature value of mobility be-fore irradiation was 1600 cm2/volt-sec and the value measured at 80°K was15, 000 cm2/ volt-sec. These values of mobility are values for a sample of sili-con which is very lightly doped with impurities, and with no significant contribu-tion to the total mobility from charged-scattering processes. The recovery-time dependence of the mobility on lithium concentration is in agreement with thedata of Figures 72 and 73. Recovery of the mobility demonstrates that electricalneutralization of charged-scattering defects occurs during the room-temperatureannealing cycles. In previous work (Reference 20) the neutralization was de-scribed as due to a complexing of lithium with a LiV~ acceptor so as to neutralizethe negative charge.
3. Low and High Temperature Anneal of High-Resistivity Float-Zone Silicon
Isothermal annealing of three silicon samples of 20 ohm/cm resistivityand two samples of 10 ohm/cm resistivity samples was carried out at annealingtemperatures of 300°K and 373°K. Figure 74 shows the typical results obtainedon one of the 20 ohm/cm samples after annealing at room temperature (300°K)for a total of 75 minutes, and at 373°K for 60 minutes. The unannealed fractionof carrier density and the reciprocal of mobility are plotted versus the annealingtime. The time scale of the data taken during the 373°K annealing cycle wasmultiplied by a factor of 150 so as to normalize this data to the results obtainedduring the 300°K annealing cycle. An activation energy (Reference 7) of 0. 66 eVwas used to determine this multiplication factor. The two annealing tempera-tures are indicated in Figure 74 where dotted lines connect the last data point
VH-15

2S£H
CD
•3
^ SX5 «
8' "tff
rt
T-
CO
S «*3=2•S s
o co
"S B•a-g
§
0)rH3
<M oo
VII-16

at TA = 300°K to the first data point at TA = 373°K. The unannealed fractionsincrease slowly with time for TA = 373°K. It appears that the higher annealingtemperature initially increases the supply of free lithium and subsequent recov-ery of mobility occurs. However, the carrier density measured at both highand low temperature decreased with time after the initial (t = 0) increase. Aremeasurement of this sample five months after bombardment showed that thebehavior in Figure 74 is unchanged, that is the carrier density measured at lowand high temperature is still decreasing and the mobility is still recovering.This same phenomenon was observed in Q. C. silicon as will be shown. Thethree samples of 20 ohm/cm silicon and the two samples of 10 ohm/cm silicondisplayed the same annealing properties.
4. Quartz-Crucible Compared to High-Resistivity Float-Zone Silicon
A sample of low-resistivity (0.3 ohm/cm ) quartz-crucible silicon wasbombarded and annealed at temperatures of 300°K and 373°K. The unannealedfractions versus annealing time are plotted in Figure 75 together with the re-sults obtained at TA = 300°K on sample H9-1 which is a sample of high-resistivity(10 ohm/cm ) float-zone silicon. The time scale of the quartz-crucible datataken during the 373°K anneal was multiplied by a factor of 2000 which was an ex-perimental factor determined from the behavior of Q. C. silicon measured overa long period of time (540 days). The dotted lines indicate the start of the an-nealing cycle at 373°K. The similarity in the speed of response, and in the be-
-havior-of-car-rier-density-and-mobility_injhe^_twp samples^should^be_compared tothe annealing properties of low-resistivity F. Z. samples shown in Figures 71,72, and 73. High-resistivity float-zone silicon appears to behave similarly tolow-resistivity quartz-crucible silicon during annealing cycles. It should benoted that the oxygen concentration in the F. Z. samples is < 1014 cm"3 which isnow comparable to the lithium concentration in the 10 to 20 ohm/cm samples.
5. Long-Term Annealing Effects
The above results on the annealing effects in lithium-containing quartz-curcible and float-zone samples with low lithium concentrations showed a dis-turbing property, namely, the continuous loss of carrier density (measured atlow and high temperature) as a function of time in irradiated samples annealingat room temperature. Several of these samples were remeasured after a longannealing time, and the carrier densities measured as a function of time areshown in Figure 76 for three samples. Two float-zone samples were doped toa low and a high concentration respectively, and the quartz-crucible samplecontained a high concentration of lithium. It appears that the loss of carriershas finally ceased to occur in the quartz-crucible (> 2 years) and low-lithium
Vn-17

I"rt
§ §-J g «
«- "SSS 9CL . K>
& S *»is*a) o o
id
"o S eo
co
-» ^ oCu O oo> <« „
S e "S ^-i
P H K
c-0)
ad
<oo
IN6
VII-18

i i I i i \ rTTTM = 300°K
-Q.C. 1.9 x 10¹⁶ Ll/cm3
I 1 I I I I I I I o.7
1.7
1.5
C*T
JJV)
1-3 £
trcc5•<r'o
TIME AFTER IRRADIATION (DAYS)
Figure 76. Carrier Density vs Time after,Electron Irradiation forSamples of Float-Zone and Quartz-Crucible Silicon.Measurements at 300°K.Initial Lithium Concentrationis Indicated for Each Sample
density sample of float-zone silicon. Thus, the precipitation-like process whichproduces a charge-neutral defect-complex appears to equilibrate. The behaviorof the other sample of float-zone silicon is typical of the more heavily dopedsamples, namely, an initial dissociation of defects with an increase of carrierdensity with subsequent attainment of equilibrium over the long term period(.Reference 20). However, it should be noted that quartz-crucible solar cells,measured over the time span in which carriers are lost in the bulk samples,experience no loss in open circuit voltage.
6. Activation Energy for Recovery
. Following the completion of the bombardments, the float-zone samplesdoped to 3 x 101? Li/cm3 were annealed at temperatures ranging from 250°K to300°K. Hall and resistivity measurements were obtained on these samples asa function of time and measurement temperature. The time to half recovery,tR of the mobility (TM = 79°K) was determined from these annealing cycles,and the reciprocal of this quantity is shown in Figure 72. The error in the
VII-19

101-1
10'
LLJCO
cc
10~J
FLOAT-ZONESILICON
EA = 0.68 eV
3.0 3.2 3.4 3.6 3.8 4.0 4.2
103/TA(°K-1)
Figure 77. Reciprocal Half Recovery Time of the Mobility in Electron Ir-radiated Float-Zone Silicon vs the Reciprocal AnnealingTemperature. Measurements of Mobility at 79°K. ActivationEnergy E^ for the Recovery Process is Indicated. InitialLithium Concentration 3 x 10¹⁷ Li/cm
measurement is large at the higher temperatures since the sample recovered toits original value of mobility in less than a minute at 300°K. Nevertheless, theactivation energy determined from the slope of curve is 0.68 eV which is closeto the activation energy (0.66 eV) for lithium diffusion in oxygen-lean siliconmeasured by Pell (Reference 7) and also reported in Section V in measurementsmade on solar cells.
E. DISCUSSION OF RESULTS
The irradiation-temperature dependence of the production rate of impur-ity complexes in silicon has been explained (References 32 and 33) by a modelbased on the formation of close-spaced interstitial-vacancy pairs by electronbombardment. This model yields a probability PC, of vacancy liberation fromthe interstitial to form vacancy-impurity defects described by Equation 29,
VH-20
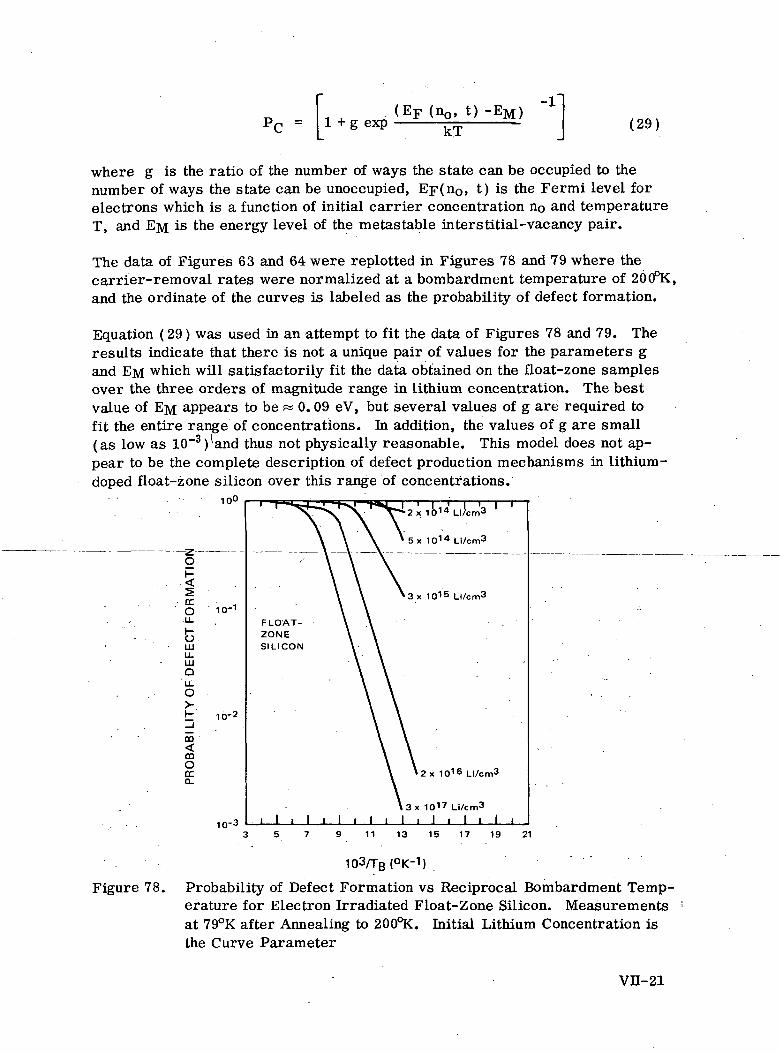
PC = 1 + g exp(EF (n0> t) -EM)
kT (29)
where g is the ratio of the number of ways the state can be occupied to thenumber of ways the state can be unoccupied, EF(no, t) is the Fermi level forelectrons which is a function of initial carrier concentration no and temperatureT, and EM is the energy level of the metastable interstitial-vacancy pair.
The data of Figures 63 and 64 were replotted in Figures 78 and 79 where thecarrier-removal rates were normalized at a bombardment temperature of 200°K,and the ordinate of the curves is labeled as the probability of defect formation.
Equation (29) was used in an attempt to fit the data of Figures 78 and 79. Theresults indicate that there is not a unique pair of values for the parameters gand EM which will satisfactorily fit the data obtained on the float-zone samplesover the three orders of magnitude range in lithium concentration. The bestvalue of EM appears to be « 0. 09 eV, but several values of g are required tofit the entire range of concentrations. In addition, the values of g are small(as low as 10~3)Wd thus not physically reasonable. This model does not ap-pear to be the complete description of defect production mechanisms in lithium-doped float-zone silicon over this range of concentrations.
10°
DCO 10-1
LUu.LUQ
LLO
t 10-2_l
CO
mOccQ_
10~J
FLOAT-ZONESILICON
Li/cm3
3x 10¹⁷ Ll/cm3
I I I I I I I
11 13 15 17 19 21
Figure 78.
103/TB(°K-1)
Probability of Defect Formation vs Reciprocal Bombardment Temp-erature for Electron Irradiated Float-Zone Silicon. Measurementsat 79°K after Annealing to 200°K. Initial Lithium Concentration isthe Curve Parameter
VH-21

10°
gi-
crOLL
LULLLUO
LLO
CD<mOcra.
-110
10-2
i r i i iQUARTZ CRUCIBLE
2 x 10¹⁵ Li/cm3
2 x 10¹⁶
Li/cm3
3x 10¹⁷
Li/cm3
10 11 12 13 14 15 16
Figure 79. Probability of Defect Formation vs Reciprocal Bombardment Tem-perature for Electron Irradiated Quartz-Crucible Silicon. Meas-urements at 79°K after Annealing to 200°K. Initial Lithium Con-centration is the Curve Parameter
The attempts at curve fitting were more successful with the quartz-cruciblesamples. In this case, EM = 0. 07 eV and g = 0.1 gave a reasonablt fit over thetwo orders of magnitude in lithium concentration of these samples. This highervalue of g is more physically reasonable and the lower value of EM is in agree-ment with the value used by previous investigators (Reference 32) in fitting theirdata obtained on phosphorous-doped silicon. Our investigations have shown thatthe oxygen-vacancy defect is the dominating carrier-removal center in the lith-ium-containing silicon. Thus, it is reasonable to expect that these sampleswould behave similarly to the phosphorous-doped (5 x 10¹⁴ P/cm3, p = 100cm)quartz-crucible silicon as our data indicates.
It is quite apparent that oxygen plays an important role in the formation of car-rier-removal defects, and that the dominating defects are different in these twotypes of silicon diffused with lithium. The difference of the carrier-removal de-fect in these two types of silicon is deduced from the difference in the slopes ofthe temperature dependence curves, and also the difference in the dependenceof the saturated value of An/A$ on lithium concentration as shown in Figures63 and 64.
VII-22

The minimum in the carrier-removal curve of Figure 65 is a very unusual re-sult. There is sufficient experimental evidence (4 samples) to support the valid-ity of the measurement but such a phenomenon has not been observed by otherworkers. In addition, the carrier density versus temperature curves indicatethe existence of a defect level or levels close to the bombardment temperaturewhere the minimum occurred. As final confirmatory evidence, we can quote theexperiment where a pristine " J" sample was initially bombarded at TB = 95°Kand did not exhibit this minimum An/A$» but the value of 0. 092 cm"1 which ismore like the expected value. Obviously the existence of this previously un-known defect level has a strong influence on the rate of carrier-removal whichoccurred when the bombardment temperature located the Fermi-level close tothe defect energy level. If the defect is an acceptor, then at best the Fermi-level could alter the net carrier density by the magnitude of the defect density.All the acceptors are filled and emptied of electrons by the passage of the Fermi-level through the acceptor level. The defect density was not great enough tochange the effective carrier density by more than a factor of two. The value ofAn/A$ ifi unaffected by a change in carrier density of this amount, thus it is notclear why An/A$ decreased so much. This effect was substantiated by the car-rier density changes versus measuring temperature, shown in Figures 67 and68 which clearly indicate that a defect level was introduced during bombardment.The spread of the energy level over such a wide temperature range makes thecalculation of the level position uncertain. There can be more than one energylevel within the temperature range of 100°K to 190°K due to this unknown defect.A discrete energy level would be effective only if the Fermi level was within
_±2 kT _of it§_ position.^ This corresponds to^the^ defect level being 88 percent filledto 12 percent filled. Assuming that the level is discrete, the position of theTenergy level was calculated using Equation ( 30 )
ND-
where
00)
is the position of the defect energy level below the conduction band,
is the temperature at which half of the traps are filled,
is the trap density,
is the donor density,
k is Boltzmann constant, and
NC is the density of available states in the conduction band.
VH-23

The energy level, EX, was calculated to be 0.14 eV with Tj/2 = 146°K. EX ±2 kTis equal to 0.163 or 0.117 eV. The Fermi-level is located approximately at theseenergies for T = 170°K and 124°K. These limits indicate an effective tempera-ture spread of 46°K whereas the experimental results indicate a spread of 90°K.This calculation suggests that there is more than one level. The completion ex-pression was also used to fit curve II and to obtain a value of EX- Equation (31)is the relationship which was used.
n 2 + n [NX - ND + NC exp (ET-E c) /kT] -NDNC exp (ET - Ec) kT = 0 (31)
All the quantities in Equation (31) were defined before except for n which is thecarrier density and EC which is the energy of the conduction band. The best fitto curve II of Figure 67 for a temperature range of T = 100°K to 190°K was ob-tained for EX = 0.115 eV, NX = 5.8 x 10¹³ and ND = 1. 08 x 1014 cm'3, this valueof EX is closer to the value suggested by the results shown in Figure 65. Sincethe minimum in the c arrier-removal curve occurred at 95°K, it can be concludedthat the Fermi-level must be close to the effective defect energy level. TheFermi-level was calculated to be at« 0. 085 eV ±2 kT where 2 kT = 0. 016 eV.Thus, this calculation indicates the level is located near EX = 0.1 eV. Whetheror not lithium is involved in the formation of this defect cannot be deduced fromthe present experiments. The defect could involve lithium, a vacancy, and/oroxygen since the lithium concentration is comparable to the oxygen concentra-tion (< 1014 cm"3) in these high resistivity samples. Thi^ defect level cpuldhave been present in the low-resistivity (0.3 ohm/cm) samples, but could havebeen undetected because of the greater density of other lithium-containing de-fects (e.g., LiV). Since this unknown defect formed during low temperaturebombardments (78° to 90°K) as well as high temperature (90°K to 250°K), itmust be formed by the trapping of mobile vacancies at impurity sites. The va-cancy is mobile at 80°K whereas the interstitial is not mobile unitl T « 140°Kand all impurities are frozen in the lattice for temperatures in this range. Itis interesting to note that Stannard (Reference 36) reported finding a defect levelat EX = 0.13 eV in irradiated float-zone silicon doped with lithium to a concen-tration of 1 x 10¹⁴ Li/cm3 after room temperature annealing. However, his ex-periment indicated that the defect was a donor. In our previous work (Reference20) a defect level located at« 0. 08 eV was observed in the measurements madeon quartz-crucible samples after room temperature annealing. All of theselevels may be due to the same defect. The A-center located at 0.186 eV is theonly well-identified center that comes close to the energy of this unknown de-fect, but it is outside the experimental error of the energy determination. Itwas shown (Reference 20) that a carrier-removal center located at an energyof 0.18 eV is the dominant damage center. Lithium paired with oxygen did notappear to form carrier-removal centers in any significant number, howeverlithium did interact with and neutralize defect centers located at energies of0. 08 and 0.18 eV.
VH-24

The results shown in Figures 69 and 70 clearly show that at least one and pos-sibly two defects located at« Ec - 0.18 eV and « Ec - 0.13 eV are introducedduring bombardment of lithium-containing quartz-crucible silicon. The defectlocated at EC - 0.18 eV is most likely the A-center. A defect level located atEC - 0.12 eV was observed in float-zone silicon of high resistivity. It is con-jectured that this level is the LiOV or L2 center which could be the same levelshown in Figure 70. The results of Figures 69 and 70 show that the carrierdensity measured at TM = 300°K decreased during annealing cycles at TA = 300°Kand the carrier density measured at TM « 80°K increased during this time. Thiseffect has been observed in measurements that were made on « 14 samples ofquartz-crucible silicon doped with lithium to concentrations from 2 x 10¹⁵ to2 x io16 Li/cm3. If a single lithium donor neutralizes a single defect (OV~ orLiOV" ), then the net change of carrier density is zero. Assuming that two lith-ium donors are required to neutralize a single defect implies that a decrease incarrier density should be measured at low temperature. Neither one of these .explanations agree with the experimental results. A decrease in carrier den-sity was observed only on samples which had been annealed at high temperature(e. g., 373°K). In this situation, the loss of donor density was severe. Thesame condition is achieved by a high level of damage when the electron fluenceis approximately equal to or exceeds the lithium concentration (bombardmenttemperature 2 200°K). It appears that a stepwise process occurs in which asingle lithium neutralizes the defect and then additional complexing of lithium withthe neutralized defect occurs. Simultaneous with the first processphere must also besome other competing mechanism or mechanisms, since a single lithium ion com-
—plexing.with a.defectjwilLnot produce any nejt-change in carrier-density. The time de-pendence of this multiple complexing process is illustrated by the'annealing resultsT
The carrier-density changes observed in sample H9-1 (5 x IO14 Li/cm3) duringthe annealing cycle at TA = 297°K were not similar to those changes observed inthe more heavily-doped samples which showed a recovery (neutralization of ac-ceptors ) of the carrier density as measured at low temperature, and an increaseof lithium concentration (dissociation of defects) during the annealing cycle. Thisbehavior of sample H9-1 continued until the annealing temperature was increasedto 373°K, then the apparent acceptor density decreased and the free lithium con-centration increased. In contrast to this behavior, the mobility recovered as theapparent acceptor density increased slightly. However, this slight increase iswithin the experimental error; It should be noted that the Fermi level at roomtemperature in this high-resistivity sample (H9-1) is located deep in the for-bidden gap and therefore, the number of ionized donors is larger at low tempera-ture (80°K) than in the low-resistivity samples. Approximately 96 percent ofthe lithium donors are ionized at TM = 80°K compared to 50 percent in previoussamples. Thus, the sensitivity of the measurements to the introduction or an-nealing of acceptors is reduced. The complete recovery of the mobility indi-cated that neutralization of charged scattering centers had taken place without
VII-25
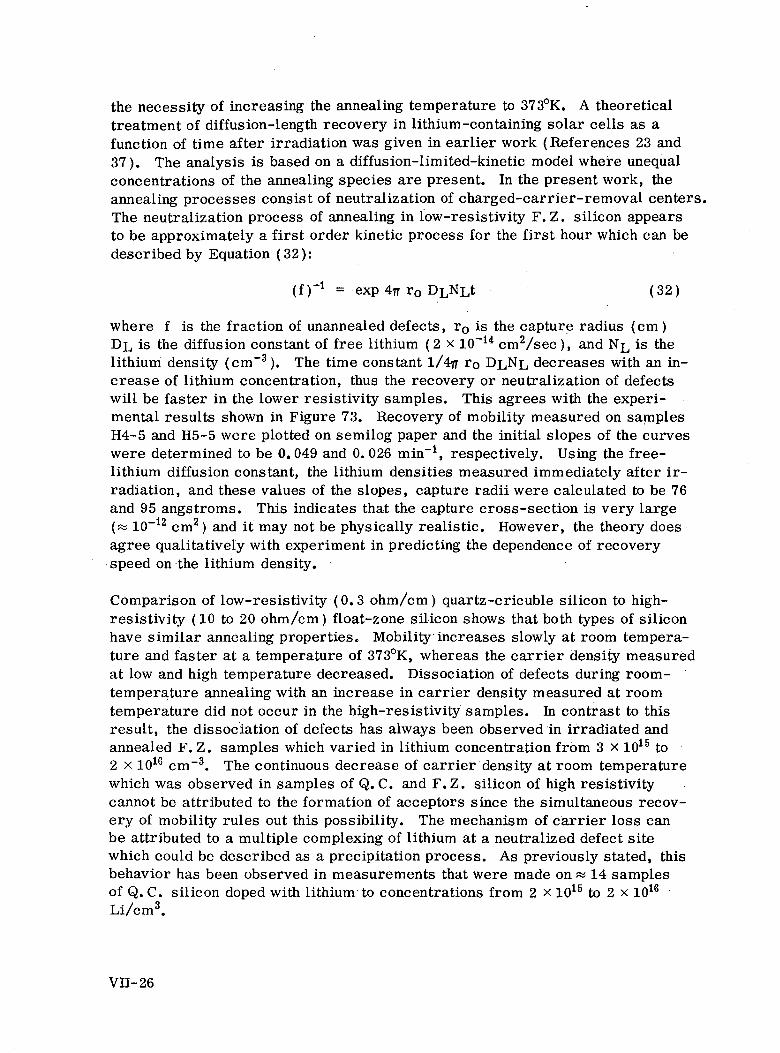
the necessity of increasing the annealing temperature to 373°K. A theoreticaltreatment of diffusion-length recovery in lithium-containing solar cells as afunction of time after irradiation was given in earlier work (References 23 and37). The analysis is based on a diffusion-limited-kinetic model where unequalconcentrations of the annealing species are present. In the present work, theannealing processes consist of neutralization of charged-carrier-removal centers.The neutralization process of annealing in low-resistivity F.Z. silicon appearsto be approximately a first order kinetic process for the first hour which can bedescribed by Equation (32):
(f)-1 = exp 4ir r0 DLNLt (32)
where f is the fraction of unannealed defects, ro is the capture radius (cm )DL is the diffusion constant of free lithium (2 x 10~14 cm2/sec ), and NL is thelithium density (cm~3) . The time constant 1/477 ro DL,NL decreases with an in-crease of lithium concentration, thus the recovery or neutralization of defectswill be faster in the lower resistivity samples. This agrees with the experi-mental results shown in Figure 73. Recovery of mobility measured on samplesH4-5 and H5-5 were plotted on semilog paper and the initial slopes of the curveswere determined to be 0.049 and 0.026 min"1, respectively. Using the free-lithium diffusion constant, the lithium densities measured immediately after ir-radiation, and these values of the slopes, capture radii were calculated to be 76and 95 angstroms. This indicates that the capture cross-section is very large(« 10~12 cm 2 ) and it may not be physically realistic. However, the theory doesagree qualitatively with experiment in predicting the dependence of recoveryspeed on the lithium density.
Comparison of low-resistivity (0.3 ohm/cm) quartz-cricuble silicon to high-resistivity (10 to 20 ohm/cm) float-zone silicon shows that both types of siliconhave similar annealing properties. Mobility increases slowly at room tempera-ture and faster at a temperature of 373°K, whereas the carrier density measuredat low and high temperature decreased. Dissociation of defects during room-temperature annealing with an increase in carrier density measured at roomtemperature did not occur in the high-resistivity samples. In contrast to thisresult, the dissociation of defects has always been observed in irradiated andannealed F. Z. samples which varied in lithium concentration from 3 x 10¹⁵ to2 x 1016 cm"3. The continuous decrease of carrier density at room temperaturewhich was observed in samples of Q. C. and F.Z. silicon of high resistivitycannot be attributed to the formation of acceptors since the simultaneous recov-ery of mobility rules out this possibility. The mechanism of carrier loss canbe attributed to a multiple complexing of lithium at a neutralized defect sitewhich could be described as a precipitation process. As previously stated, thisbehavior has been observed in measurements that were made on « 14 samplesof Q. C. silicon doped with lithium to concentrations from 2 x io15 to 2 x 10¹⁶
Li/cm3.
VE-26

The speed of recovery of mobility in the irradiated Q. C. samples was evidentlymuch slower than in the oxygen-lean F. Z. silicon. This is in agreement withthe description given by Equation (33) or the time dependence of the recoveryprocess, since the presence of oxygen considerably reduces the free-Lithiumdiffusion constant. Equation (33) gives the effective diffusion constant (Refer-ence 5 ) as modified by oxygen,
Dv(33)
where C is a rate constant equal to 1015 cm 3 at room temperature, [o] is theoxygen concentration and Dp is the free-lithium diffusion constant (2 x 10~14
cmVsec ). If we assume that the oxygen concentration is at least 1017 cm"3 thenthe speed of recovery would be reduced by a factor of 100 in Q. C. silicon com-pared to F. Z. silicon. Comparison of the results in Figures 71, 72, 73, withFigure 75 indicates that this factor of 100 is approximately the correct order ofmagnitude for the radio of time constants obtained on the two types of silicon.
The long-term annealing effects shown in Figure 76 are important since they in-dicated that the carrier density changes will finally equilibrate in lightly dopedfloat-zone silicon or in the more heavily doped quartz-crucible silicon after asufficiently long annealing time. This behavior is observed only under the con-ditions of these irradiations, namely the damage level was not large comparedto the .lithium _c one en tration^. Tjie_author_and other investigators (Reference35) have observed that after large fluences the loss of carriers~doies""riot"equili^r~brate, and the samples will return to the starting resistivity of the silicon be-fore diffusion with lithium. This applied to both float-zone and quartz-cruciblesilicon.
The activation energy measurements shown in Figure 77 demonstrated again inagreement with the detailed measurements obtained on solar cells (Section V )that the diffusion of free lithium is definitely related to the recovery process.This conclusion applies to the short-term recovery period, that is within thefirst few minutes or hours following bombardment.
VII-27

SECTION VIM
CONCLUSIONS AND RECOMMENDATIONS
A. SOLAR CELLS
The establishment of the lithium-containing p/n solar cell as a competitivealternative to the presently-used n/p solar cell requires the completion of fourtasks: 1) identification of the physical parameters which determine cell perfor-mance, 2) establishment of the relationships between these parameters andcell performance before irradiation and in the radiation environment, 3) estab-lishment of unique relationships between these parameters and cell fabricationparameters and 4) proof of a superior performance level for the lithium cell inthe radiation environment.
Solar-cell efforts under this contract consisted of the testing and analysis oflithium cells furnished by JPL under a 1-MeV electron radiation environment.Its aims were to contribute to the completion of tasks 1) and 2), to check forthe existence of the relationships suggested in task 3), to evaluate lithium cellperformance in comparison with that of n/p cells, and to provide information tothe cell manufacturers on the proper approach toward achieving tasks 3) and 4).The basic conclusions are listed below together with the impact they have onthese tasks.
—1)—Performance.—At the present_state-of-_theiiart,_the^s_ilicqn type^used iscritical to the performance of the lithium cell. Oxygen-rich cells, fabricatedfrom quartz-crucible silicon, have generally (14 out of 17 lots received sinceJanuary 1970) had pre-irradiation and post-recovery performance levels abovethose of simultaneously tested commercial lOn-cm n/p cells. The oxygen-lean(float-zone and Lopex) cells have usually (7 out of 9 received since January1970) performed at lower levels than the n/p cells. The advantage that theoxygen-rich lithium cells have over the n/p cells is due mainly to a higher open-circuit voltage, the short-circuit-cur rent levels for both being comparable bothbefore irradiation and after recovery. (There is, however, a lithium-densitydependence of both current and voltage; see below.) The advantage in maximumpower amounts to 10 percent or greater after recovery from 1-MeV electronfluences of 3 x 10¹³ and 3 x 10¹⁴ e/cm2. This 10 percent advantage is maintainedafter recovery from high fluences (3 x 10¹⁵ e/cm2) only by cells with sufficientlithium doping (lithium gradients greater than approximately 5 x 1018 cm"4'This is because the advantage in open-circuit voltage which unirradiated lithiumcells have over n/p cells is maintained after recovery from high electron fluences(> 1015 e/cm2) only by lithium cells with relatively heavy doping (lithium gradient>5 x 1018 cm"4) . The oxygen-lean cells perform below the n/p levels mainly dueto lower short-circuit current.
VIH-i

2) Lithium density. The lithium density in the base region of the cell, whichvaries with distance from the junction, has been characterized by a singleparameter, the slope of the lithium density profile or lithium donor densitygradient, dNL/dw. This single-parameter density description was made pos-sible by the observation (from capacitance measurements on hundreds oflithium cells) that the slope of the lithium density profile near the junction isconstant for all but the most heavily doped cells (dNL/dw ^lO20 cm-4) . Thelithium gradient provides the single most important physical parameter (otherthan the oxygen density, determined by the silicon type) in the lithium cell.Measurement of this parameter provides a reliable basis for the prediction ofcell performance in a 1-MeV electron radiation environment (task 2) . Lithiumgradients in most practical cells ranged from approximately 1 x iO17 cm"4 to5 x IO19 cm'4.
3) Parametric relationships (see Tables V and VI in text for a summary) .Quantitative relationships between the lithium gradient, 1-MeV electron fluence,and many cell performance parameters, derived from extensive measurementson large numbers of cells, provide the basis for prediction of cell behavior(task 2) . Prediction based on these results would require only the nondestructivecapacitance measurements from which the lithium gradient is calculated. Forboth oxygen-rich and oxygen-lean cells the following relationships were estab-lished: (a.) recovery speed is linearly proportional to the lithium gradient; (b)the diffusion length damage coefficient immediately after irradiation varieswith the square root of the lithium gradient; (c) open-circuit voltage beforeirradiation, immediately after irradiation, and after recovery all increaselogarithmically with lithium gradient; (d) the damage coefficient immediatelyafter irradiation varies approximately logarithmically with fluence, decreasingwith increasing fluence, and is approximately twice as large in oxygen-lean cellsas in oxygens-rich cells; (e) the recovery speed varies inversely with fluenceraised to the 0.59 power; (f) the activation energies for recovery were measuredto be 0.66 eV and 1.1 eV in oxygen-lean and oxygen-rich cells respectively.(These are the values which Pell (References 5 and 7) has published for thediffusion constants of lithium in these two types of silicon.) (g) maximum powerafter recovery (oxygen-rich cells) is strongly dependent on gradient only afterhigh fluence (3 x 10¹⁵ e/cm2) in which case the trend is toward increased powerat higher gradients.
4) Stability. A significant fraction of oxygen-lean cells suffer from post-recovery loss in short-circuit current (redegradation) which results in powerlosses (as measured from the peak recovered value) ranging to greater than10 percent. The speed, and, to a limited degree, the extent of redegradationare directly proportional to the lithium gradient and inversely proportional tothe fluence. Other instabilities also occuring in isolated oxygen-lean cell lotsinclude open-circuit voltage loss due to carrier flow into the junction and curvepower factor loss due to degradation of forward-bias diode characteristic.These last two instability modes occur in both irradiated and unirradiated cells.
VIII-2

The oxygen-rich cells ("which recover at room temperature at a rate 100 timesslower than the oxygen-lean cells, and at 80° C at approximately the same rateas the oxygen-lean-cell room-temperature rate) are much more stable both atroom temperature and at 80° C for a given storage time than are the oxygen-lean cells at room temperature. The average short-circuit current loss sufferedby 70 crucible cells after recovery during one year's equivalent storage time at80° C was approximately 1 mA (less than 2 percent) . This loss was inverselyproportional to fluence but displayed no gradient dependence.
5) Density Control. To accomplish task 3 it is necessary for a unique rela-tionship between the lithium gradient and the lithium diffusion schedule to exist.Unfortunately, as shown in Section IV, no such unique relationship exists atthis time. The problem is twofold (a) for a given diffusion, intolerably largecell-to-cell differences in gradient occur: up to a factor of 70 between thehighest-and lowest-density cell of a given lot, and (b) for a given diffusionschedule, the gradient range is not always reproducible (Figures 39 and 40) .This is a problem in present lithium cell development which must be overcomeif the lithium cell is to be competitive.
Comparison of the gradient ranges for different cell lots undergoing lithiumdiffusion at the same temperature show the lots with shorter diffusion time tohave a narrower gradient spread and higher average gradient. This led to thehypothesis that the lithium source is being lost to the cell during diffusion.This hypothesis should be tested by the manufacturers. • . . - . - .
J3JL Initial performance and diffusion schedule. Lithium diffusion schedules andperformance can be relatedl.n~a "genefairway; In~crucible-cells long-duration,low-temperature diffusions (180 to 480 minutes at 325 to 375° C) with no re-distribution and shorter-duration high-temperature diffusion (60 to 90 minutesat 425° C) with long redistributions (120 minutes at 425° C) have consistentlyyielded high performance cells. The performance of oxygen-lean cell lotsemploying low temperature diffusions (350 to 375° C) was not good (possiblydue to very high lithium gradients) ; cell lots using a 425° C diffusion followedby a 120 minute redistribution had better initial performance. Both oxygen-rich and oxygen-lean lots using high temperature (^400° C) diffusions with noredistribution had poor initial performance.
7) Mission Compatibility. Since slow recovery is the one possible disadvant-age of the oxygen-rich cells, criteria were established for minimum acceptablelithium gradient to achieve sufficiency of recovery speed for a given orbittemperature and mission fluence. The results indicate that sufficiency can beachieved for a one year's mission fluence of 3 x 10¹⁵ e/cm.2 with gradients1 x 1019 cm"4 if the solar panel temperature is above approximately 50° C. This1-MeV electron fluence corresponds to a rather severe earth-or bit radiationenvironment. Solar panel temperatures in earth orbit usually range above50° C except during the portion in the earth's shadow.
vm-3

8) Optimum Lithium Cell. In the radiation environment of these experimentsa general outline of the optimum lithium cell for a 1 year mission with orbittemperatures above 50° C is as follows:
Silicon type: Quartz-crucible
Starting dopant: phosphorus
Starting resistivity - 20 to 4012-cm
Lithium gradient:5 x 1018 cm"4 for 0 < 1 x 10¹⁴ e/cm2
1 x 1019 cm'4 for 0>i x 1014 e/cm2
Lithium diffusion schedule: within the realm ofconclusion 6) above but can't be specified untiltask 3) is completed.
It should be noted that the starting dopant is specified as phosphorus. Thisis important because improper choice of starting dopant can result in greatlyreduced recovery speeds. This was found to be the case when antimony wasthe starting dopant.
The crucible-grown lithium cell outlined above has been shown to out-performcommercial lOfi-cm n/p cells in a 1-MeV electron environment by approximately10 percent in maximum power, provided the cell temperature is above 50° C.For orbit temperatures below 50° C the competitiveness of lithium cells is atpresent questionable due to insufficient recovery speed in oxygen-rich cells andthe unsolved stability problems in oxygen-lean cells.
9) Since previous results under heavy-particle irradiation (References 27 and28) show the lithium cell to have a potentially commanding advantage over con-ventional cells in a proton dominated environment, a solar-cell degradationanalysis was made for such an orbit based on projected missions in the Atmo-sphere Explorer series. The results, based on approximate damage factorsderived from the limited heavy-particle data, indicate that lithium cells with18 mils coverglass shielding should degrade less rapidly than ln-cm n/p cellswith 54 mils coverglass shielding.
10) Summary. To briefly summarize the above conclusions: (a) the quartz-crucible lithium cell with phosphorus starting dopant and lithium gradient be-tween approximately 5 x 10¹⁸ and 1.5 x 1019 cm"4 has performance levelsapproximately 10 percent above commercial lOfl-cm n/p cells. It maintainsthis advantage after recovery for 1-MeV electron fluences up to 3 x 10¹⁵ e/cm2.(b) The recovery speed of the crucible lithium cell is sufficient for fluencesup to 3 x 10¹⁵ e/cm2 in 1 year for temperatures above 50° C providing that theproper lithium gradient is chosen, (c) The oxygen-lean lithium cell can not
VIII-4

at this time be considered competitive with the n/p cell for ordinary missionsdue to spotty initial performance and instability problems, (d) The oxygen-richand to a lesser degree the oxygen-lean lithium cell behavior in an electronenvironment can be accurately predicted using the parametric relationshipsdeveloped in this work. All that is required for this is a knowledge of the silicontype and starting dopant, and the lithium gradient which is calculated from non-destructive capacitance measurements, fe) General guidelines have beenestablished between lithium diffusion schedule and initial performance. However,further effort is required to establish unique relationships between diffusionschedule and the lithium gradient, which determines cell behavior in the radiationenvironment.
B. BULK SAMPLE MEASUREMENTS
The simple close-pair vacancy-interstitial model does not completelydescribe the dependence of defect introduction on temperature and resistivity in :
lithium containing float-zone silicon. Better agreement of. the model withexperimental results is obtained in samples of lithium-containing quartz-cruciblesilicon.
The saturated rate of carrier-removal (An/A 0cm"1) SAT appears to increasewith decreasing lithium concentration. This suggests that the lithium combinedwith oxygen so as to limit the oxygen concentration available for A-center for-
.mation_andJhe .intrpduetipn rate_o£the LiOV center is lower than the A-centerintroduction rate. This explanation agrees witlTthe results^obtained on"high"resistivity (10 to 20 ohm/cm) float-zone silicon (An/A3» = Golem"1 atsaturation) .
In contrast to this result, the rate of carrier-removal (An/A^cnv1) SATincreases with an increase of lithium concentration in float-zone silicon. Itappears that the LiV defect dominates the electrical properties of low resistivityfloat-zone silicon, and its introduction rate increases as the concentration oflithium increases.
A defect located at « Ec - 0.12 eV is produced by electron bombardment ofoxygen-lean float-zone silicon of high resistivity (2 x 10¹⁴Li/cm3) at low temper-atures. The defect survives in modified form at room temperature. Thisdefect may possibly also be produced in low-resistivity silicon but at a reducedrate, so that it is undetectable. This particular defect level would not influencethe electrical characteristics of solar cells operating at room-temperature un-less the lithium concentration in the cell was very high. Then the Fermi-levelwould be located at an energy of 0.12 eV at 300° K, and this defect would affectsolar cell operating characteristics. However, stability requirements wouldlimit the lithium concentration before this concentration was used.
VIH-5
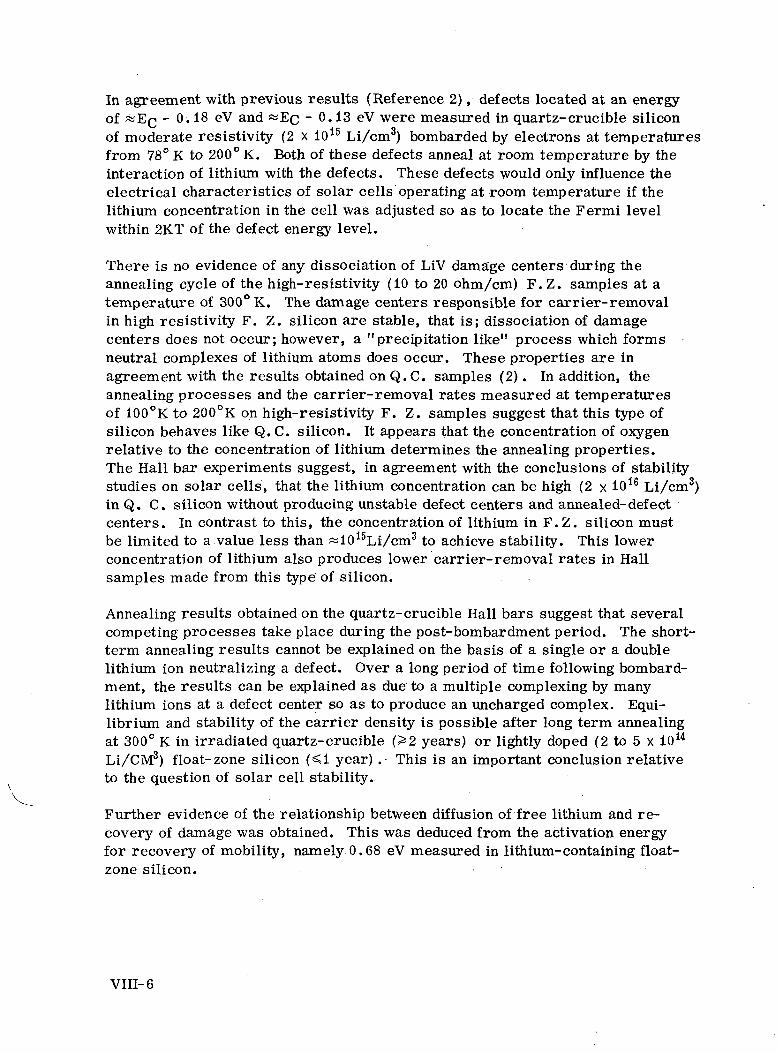
In agreement with previous results (Reference 2), defects located at an energyof «EC - 0.18 eV and «Ec - 0.13 eV were measured in quartz-crucible siliconof moderate resistivity (2 x 10¹⁵ Li/cm3) bombarded by electrons at temperaturesfrom 78° K to 200° K. Both of these defects anneal at room temperature by theinteraction of lithium with the defects. These defects would only influence theelectrical characteristics of solar cells operating at room temperature if thelithium concentration in the cell was adjusted so as to locate the Fermi levelwithin 2KT of the defect energy level.
There is no evidence of any dissociation of LiV dama'ge centers during theannealing cycle of the high-resistivity (10 to 20 ohm/cm) F. Z. samples at atemperature of 300° K. The damage centers responsible for carrier-removalin high resistivity F. Z. silicon are stable, that is; dissociation of damagecenters does not occur; however, a "precipitation like" process which formsneutral complexes of lithium atoms does occur. These properties are inagreement with the results obtained on Q.C. samples (2). In addition, theannealing processes and the carrier-removal rates measured at temperaturesof 100°K to 200°K on high-resistivity F. Z. samples suggest that this type ofsilicon behaves like Q. C. silicon. It appears that the concentration of oxygenrelative to the concentration of lithium determines the annealing properties.The Hall bar experiments suggest, in agreement with the conclusions of stabilitystudies on solar cells, that the lithium concentration can be high (2 x 10¹⁶ Li/cm3)in Q. C. silicon without producing unstable defect centers and annealed-defectcenters. In contrast to this, the concentration of lithium in F.Z. silicon mustbe limited to a value less than «10I5Li/cm3 to achieve stability. This lowerconcentration of lithium also produces lower carrier-removal rates in Hallsamples made from this type of silicon.
Annealing results obtained on the quartz-crucible Hall bars suggest that severalcompeting processes take place during the post-bombardment period. The short-term annealing results cannot be explained on the basis of a single or a doublelithium ion neutralizing a defect. Over a long period of time following bombard-ment, the results can be explained as due to a multiple complexing by manylithium ions at a defect center so as to produce an uncharged complex. Equi-librium and stability of the carrier density is possible after long term annealingat 300° K in irradiated quartz-crucible (^2 years) or lightly doped (2 to 5 x 10¹⁴
Li/CM3) float-zone silicon (*?i year) . This is an important conclusion relativeto the question of solar cell stability.
Further evidence of the relationship between diffusion of free lithium and re-covery of damage was obtained. This was deduced from the activation energyfor recovery of mobility, namely 0.68 eV measured in lithium-containing float-zone silicon.
VIII-6

The experimental results suggest a radiation damage and annealing model toexplain these.results. However, it must be noted that this is a microscopicmodel deduced from purely macroscopic data. It is suggested that the dominantdamage center in low-resistivity float-zone silicon (iO15 to 1016 Li/cm3) is theLi center which is described by Equation (34):
Li +V^r±-LiV~ [Ll-center] (34)
One of the observed (Reference 20) annealing mechanisms is the dissociation ofthe Li center, thus Equation (34) is written with a double arrow indicating thatan equilibrium exists between the formation of the defect center and the dis-sociation of this center. In addition to the dissociative mechanism of annealing,there is the mechanism of neutralization by which lithium complexes with the Licenter. This process is described by Equation (35):
LiV~ + Li ^z±- Li2V [annealed Li Center] (35)
Equatior (35) is written with a double arrow so as to indicate that the annealedLi center is unstable and the reaction can proceed in the reverse direction.The redegradation is caused by this reverse process.
The dominant damage center in high resistivity (^5 x i014Li/cm3) float-zonesilicon appears to be the L2 center which is given by Equation (36):
_, ; LiO _jf V~—»> LiOV~ [L2-center] (36)
The annealing of the L2 center takes place by means of the mechanism of neu-tralization described by Equation (37):
LiOV~ + Li '—•> li2OV [annealed L2 center] (37)
In quartz-crucible silicon, the dominant center (Referenced) appears to bethe A-center in samples with lithium concentrations from'1015 to 2 x l016Li/cm3.The formation of the A-center is described by Equation (38) :
O + V~_>OV~ [A-center] + e~ (38)
In the samples with higher lithium concentrations or samples bombarded byhigher fluences, the production of the Li and L2 centers will contribute to thetotal damage. It is necessary to postulate that lithium continues to complexwith annealed defect centers during the post-irradiation period of annealingsince our results showed that the mobility recovered as a function of annealingtime, but the carrier density continued to decrease at the same time. Thus, apossible mechanism to describe this defect is given by Equation (39):
• * • • + - r 1 ~Li + Li + V [A-center] +e —> ne + Li2OV[annealed L2 center] + Lin
+—* LiQ+2OV ( '
VIH-7

where the subscript n indicates that more than one lithium ion can complexwith the annealed A-center. This mechanism will also apply to the neutrali-zation of the L2 center as given by Equation (40):
LiOV~ JL2-center! + Li—»-ne~+ Li2OV [annealed L2 center! + Li^-Li OV (40)
Equations 37, 39, and 40 will be modified by competing single and double lithium-ion interactions as explained in the discussion. In addition, some unknownannealing processes must also compete since any combination of single anddouble processes cannot explain the increase of carrier density (TM = 78° K)during room temperature annealing of quartz-crucible samples. In contrast tothis conclusion, the results obtained on the high-resistivity (10 to 20 ohm/cm)float-zone silicon can be explained only by a multiple lithium-ion process des-cribed by Equation (49) where the intermediate single lithium process is omitted.
C. RECOMMENDATIONS
In addition to the obvious need for extensive flight testing of lithium cells,additional effort in both cell fabrication and radiation testing and analysis issuggested by the results of this work:
1) Cell Fabrication - A unique relationship must be established between fabri-cation parameters (lithium diffusion schedule) and the test parameters (princi-pally lithium gradient) which determine cell performance in a radiation environ-ment. This requires a fabrication effort to establish procedures yielding re-producible and predictable levels of lithium doping.
2) Radiation Testing and Analysis - Lithium-cell testing should be extended toa range of electron energies and to protons of various energies. The parametricbasis for the investigations should be those developed in the present work. Thegoal should be to include two additional variables; i.e., particle type and energy,into the formulations already evolved for 1-MeV electrons.
vm-8

SYMBOLS AND DEFINITIONS
C - Centralab
H - Heliotek
T or TI - Texas Instruments
F or FZ - Float-zone
L - Lopex
Q or QC - Quartz Crucible
- Diffusion constant of lithium
) - Fermi level for electron
- Energy level of close-pair metastable state
- Recombination level
Isc - Short-circuit current
I(O) - Short-circuit current immediately after irradiation
I(R) - Short-circuit current after recovery
KL - Diffusion length damage coefficient
KL~(O) '•- --- Damage-coefficient immediately-after. irradiation _
KL(R) - Damage coefficient after recovery
Kj- - Lifetime damage constant
L0 - Diffusion length before irradiation
L(O) - Diffusion Length immediately after irradiation
L (R) - Diffusion Length after recovery
Nc - Density of available states in conduction band
Nv - Density of available states in valence
NQ - Donor density
~ Donor density at edge of depletion region
- Lithium donor density
dNL/dw - Lithium donor density gradient
P - maximum power
P(O) - Maximum power immediately after irradiation

SYMBOLS AND DEFINITIONS (Continued)
P (R) - Maximum power after recovery
Pc - Probability of vacancy liberation from interstitial
S - Recovery slope
TA - Annealing temperature
Tjj - Bombardment (irradiation) temperature
TM - Measurement temperature
VQC ~ Open-circuit voltage
V(O) - Open-circuit voltage immediately after irradiation
V(R) - Open-circuit voltage after recovery
fn - Unannealed fraction of carrier density remaining
f^ - Unannealed fraction of carrier mobility remaining
(fr) ~* - Reciprocal fraction of damage remaining
g - Ratio of number of ways the state can be occupied to thenumber of ways state can be unoccupied
n0 - Thermal equilibrium electron concentration
nj - Fictitious electron concentration if Fermi level is at E-p
Po - Thermal equilibrium hole concentration
Pj - Fictitious hole concentration if Fermi level is at EX
ro - Capture radius for lithium by a defect
t - time
tr - time to half recovery of mobility
w - distance from p/n junction
F - flow rate of lithium
FB - flow rate of lithium in base region
y - ratio of hole to electron capture cross section
6 - electric field
€3 - electric field
- mobility of lithium

SYMBOLS AND DEFINITIONS (Continued)
n - carrier removal rate
9 - time to half recovery of short-circuit current
0 - 1-MeV electron fluence
To - minority carrier lifetime
Tbt, - minority carrier lifetime before irradiation
Tpo - minority carrier lifetime of holes when Fermi level is nearconduction band
REFERENCES
1. G.J. Brucker, T.J. Faith, andA.G. Holmes-Siedle, Final Report, JPLContract No. 952249, prepared by RCA and issued April 21, 1969.
2. J. Hilibrand and R.D. Gold, RCA Rev. 21, 245 (1960).
3. W. Rosenzweig, Bell Sys. Tech. Journ. 41, 1573 (1962) .
4. R.G. Downing, J. R. Carter, R. E. Scott, andW.K. Van Atta, TRW FinalReport, Contract No. 952251, May 27, 1969.
5. E.M. Pell, J. Appl. Phys. 31, 291 (1960), J. Appl. Phys. 32, 6 (1961).
6. T.J. Faith, J.P. Corra, andA.G. Holmes-Siedle, Conf. Record of theEighth Photovoltaic Spec. Conf. IEEE Catalog No. 70C32ED, 247 (1970) .
7. E.M. Pell, Phys. Rev. 119, 1222 (1960).
8. P.A. lies, Conf. Record of the Seventh Photovoltaic Spec. Conf. IEEECatalog No. 68C63 ED, 117 (1968) .
9. J.R. Carter, Conf. Record of the Sixth Photovoltaic Spec. Conf. IEEECatalog No. 15C53, Vol. Ill 145 (1967).
10. T.J. Faith, G.J. Brucker, A.G. Holmes-Siedle and J. Wysocki, Conf.Record of the Seventh Photovoltaic Spec. Conf., IEEE Catalog No. 68C63ED,131 (1968).
11. M.B. Prince, J. Appl. Phys., 26, 534 (1955)".
12. T.J. Faith, G.J. Brucker, A. G. Holmes-Siedle and R. Neadle, IEEETrans, on Nuclear Science NS-15, 6 (1968).
13. C.T. Sah, IRE Trans. Electron Devices ED-9, 94 (1962).
14. F.J. Morin and J.P. Maita, Phys. Rev. 96, 28 (1954).
15. R.N. Hall, Phys. Rev. 83, 228 (1951) and 87, 387 (1952).
16. W. Shockley and W.T. Reed, Jr., Phys. Rev. 87, 835 (1952).
17. J.A. Baicker, Phys. Rev. 129. 1174 (1963).
18. H.J. Stein and F.L. Vook, Phys. Rev. 163, 790 (1967).
19. G.K. Wertheim, Phys. Rev. 115. 568 (1959).
20. G.J. Brucker, Phys. Rev., 183, 712, (1969).
21. H.M. DeAngelis, C.P. Carnes, P.J. Drevinsky and R. E. Penczer, Bull.Amer. Phys. Soc. i3, Series II, 380 (1968).
22. M. Hirata, M. Hirata, and H. Saito, Japan. J. Appl. Phys. Vol._5_,pp 252, (1966).

REFERENCES (Continued)
*
23. J.J. Wysocki, IEEE Trans; on Nuclear Sci., NS-14, 103, December 1967.
24. C.S. Fuller and J.C. Severiens, Phy. Rev. 96, 21 (1954).
25. P.A. Berman and J. Weingart,' Pro c of the Third Annual Conf. on Effectsof Lithium Doping on Silicon Solar Cells, JPL Tech Memorandum 33-467,April 1, 1971.
26. W.L. Brown, J.D. Gabbe, and W. Rosenzweig, BTL-Telstar I, NASASP-32 Vol. 2 P1505, June 1963.
27. J.J. Wysocki, IEEE Trans, on Nuclear Sci. NS-13, 168, December (1966).
28. G. J= Brucker and B. Markow, Conf. Record of the Sixth Photovoltaic Spec.Conf., IEEE Catalog No. 15C53 Vol HI, 53 (1967).
29. J. Vette, NASA SP-3024, Models of the Trapped Radiation Environment.
30. Atmosphere Explorer - Missions C, D, and E Final Report Phase B/CStudy Program. Prepared by RCA for NASA Contract NAS5-11268 andissued June 9, 1970.
31. A.F. Obenschain and R. Rasmussen, GSFC X-716-69-390, September 1969.
32. H.Jo Stein and F.L. Vook, Phys. Rev. 163, 790 (1967) ; in RadiationEffects in Semiconductors, edited by F.L. Vook (Plenum PublishingCorp., New York, 1968) pp 99 and 115.
33. B.L. Gregory and E.E. Barnes, in Radiation Effects in Semiconductors,edited by F.L. Vook (Plenum Publishing Corp., New York, 1968) . pp 124.
34. H.J. Stein and R. Gereth, J. Appl. Phys. Vol. 39, pp 2890, 1968.
35. B. Goldstein, RCA Final Report, Contract No. F19628-68-C-0133,Nov. 1, 1967 to July 31, 1968.
36. J. Stannard, Proceedings of the Conference on Effects of Lithium Dopingon Silicon Solar Cells, Jet Propulsion Laboratory, Pasadena, Calif.,May 9, 1969. JPL Report No.
37. T.R. Waite, Phys. Rev. 107, 463 (1957).