final report to - research partnership to secure energy ... · final report to . title of project:...
TRANSCRIPT

Final Report: “Reducing Impacts of New Pit Rules on Small Producers,” PRRC/NMT
1
Final Report to
Title of Project:
Reducing Impacts of New Pit Rules on Small Producers
07123-07.FINAL
Date: November 30, 2011
Team Members: Robert Balch, Program Manger, PI
Tongjun Ruan, Principle Investigator
Point of Contact: Telephone Number: (575) 835-5305 Facsimile Number: (505) 835-6031 e-mail address: [email protected]
Performer: New Mexico Institute of Mining and Technology
New Mexico Petroleum Recovery Research Center Performer Address:
801 Leroy Place Socorro, NM 87801 USA
Participants:
Independent Petroleum Association of New Mexico New Mexico Oil conservation Division
Source3 Computing

Final Report: “Reducing Impacts of New Pit Rules on Small Producers,” PRRC/NMT
2
LEGAL NOTICE
This report was prepared by the Petroleum Recovery Research Center as an account of work sponsored by the Research Partnership to Secure Energy for America, RPSEA. Neither RPSEA members of RPSEA, the National Energy Technology Laboratory, the U.S. Department of Energy, nor any person acting on behalf of any of the entities:
a. MAKES ANY WARRANTY OR REPRESENTATION, EXPRESS OR IMPLIED WITH RESPECT TO ACCURACY, COMPLETENESS, OR USEFULNESS OF THE INFORMATION CONTAINED IN THIS DOCUMENT, OR THAT THE USE OF ANY INFORMATION, APPARATUS, METHOD, OR PROCESS DISCLOSED IN THIS DOCUMENT MAY NOT INFRINGE PRIVATELY OWNED RIGHTS, OR
b. ASSUMES ANY LIABILITY WITH RESPECT TO THE USE OF, OR FOR ANY
AND ALL DAMAGES RESULTING FROM THE USE OF, ANY INFORMATION, APPARATUS, METHOD, OR PROCESS DISCLOSED IN THIS DOCUMENT.
THIS IS A FINAL REPORT. THE DATA, CALCULATIONS, INFORMATION, CONCLUSIONS, AND/OR RECOMMENDATIONS REPORTED HEREIN ARE THE PROPERTY OF THE U.S. DEPARTMENT OF ENERGY. REFERENCE TO TRADE NAMES OR SPECIFIC COMMERCIAL PRODUCTS, COMMODITIES, OR SERVICES IN THIS REPORT DOES NOT REPRESENT OR CONSTIITUTE AND ENDORSEMENT, RECOMMENDATION, OR FAVORING BY RPSEA OR ITS CONTRACTORS OF THE SPECIFIC COMMERCIAL PRODUCT, COMMODITY, OR SERVICE. Submitted and Signed November, 30, 2011 by:
Robert S. Balch Principal Investigator

Final Report: “Reducing Impacts of New Pit Rules on Small Producers,” PRRC/NMT
3
ABSTRACT
In July 2008 the New Mexico Oil Conservation Division (NMOCD) changed regulations to sur-
face waste management rules regulating pits, closed loop systems, below-grade tanks and sumps used in
connection with oil and gas operations, resulting in new “Pit Rules.”1 With adoption of these regulations,
New Mexico’s small producers experienced an increased level of expense for drilling and were also
exposed to significant financial risk due to a more complex, time-consuming, and hence expensive
application process and increases in need for and expense of remediation and re-permitting at both new
and existing well sites. Since 2007 stronger pit rules have been enacted in Colorado and are under
consideration in Texas and other western states, so this is not simply a New Mexico issue.
The primary direct impacts of the new rules were: reduction or elimination of the use of surface
pits in SE New Mexico (Permian Basin) and limitation of their use in NW New Mexico (San Juan Basin);
requirement (in most cases) of the use of more expensive closed-loop drilling systems and costly haul-off
of waste; and implementation of a new form C-144. The new form required extensive use of
georeferenced data and associated map attachments and generally created a significant increase in
application preparation time for the applicant and for review and verification time by the regulatory
agency.
While all producers in New Mexico faced these increased costs, small producers with limited
specialized staff and less ability to absorb substantial unexpected expenses were most strongly affected.
To address this problem the New Mexico Petroleum Recovery Research Center proposed to generate
software and maps, utilizing open source GIS software, that would allow quick generation of C-144 forms
and associated mapped data for any proposed well/pit location in New Mexico, allowing producers to
generate stronger applications in relatively short periods of time, and at the same time giving regulators
an online tool, utilizing all of their required data sources, to more quickly verify applicant data and
process applications. Results of this project have beneficially impacted small producers by providing both
a template for generation of pit applications, a vehicle for justifying exceptions to the Pit Rule, and by
demonstrating effective cooperation between producers and government.
Project software was completed under budget, and a one-year, no-cost extension allowed for ex-
pansion of the mapping to provide access to regulatory data nationwide on a generic regulatory data
website with customizable queries and drawing tools.

Final Report: “Reducing Impacts of New Pit Rules on Small Producers,” PRRC/NMT
4
TABLE OF CONTENTS ABSTRACT .................................................................................................................................... 3 TABLE OF CONTENTS ................................................................................................................ 4 LIST OF FIGURES AND TABLES............................................................................................... 5 LIST OF ACRONYMS .................................................................................................................. 5 EXECUTIVE SUMMARY ............................................................................................................ 6 1. WORK PERFORMED ............................................................................................................... 8
1.1 Introduction ....................................................................................................................... 8 1.2 Pit Rules Mapping Portal ................................................................................................ 12 1.3 National Regulatory Data Portal ..................................................................................... 19
2. Experimental Methods .............................................................................................................. 23 2.1 Design Using Open Source Software ............................................................................. 23 2.2 Design Using Commercial Software .............................................................................. 24 2.3 Pecos River Floodplain Delineation ............................................................................... 24
3. Results and Discussion ............................................................................................................. 26 3.1 Project Results ................................................................................................................ 26 3.2 Impact to Small Producers .............................................................................................. 43 3.3 Technology Transfer Efforts ........................................................................................... 44 3.4 Conclusions ..................................................................................................................... 46 3.5 Recommendations ........................................................................................................... 49
REFERENCES ............................................................................................................................. 50 Appendix I - C-144 Form Pre and Post 2008 ....................................................................... 51 Appendix II – Data and Sources for GIS Map Layers .......................................................... 57
Appendix III – Mapping Portal User’s Manual .................................................................... 58 Appendix IV – Map Legend ................................................................................................. 76

Final Report: “Reducing Impacts of New Pit Rules on Small Producers,” PRRC/NMT
5
LIST OF FIGURES AND TABLES Figure 1. Siting criteria for permitting. ........................................................................................... 9 Figure 2. Additional siting criteria for on-site closure. ................................................................. 10 Figure 3. Examples of rejected C-144 attachments. ..................................................................... 11 Figure 4. Data Availability matrix. ............................................................................................... 13 Figure 5. Pit Rule Mapping Portal framework.............................................................................. 16 Figure 6. Three-tiered architecture of mapping portal. ................................................................. 17 Figure 7. National Mapping Portal framework. ............................................................................ 21 Figure 8. Three-tiered structure for National Mapping Portal. ..................................................... 22 Figure 9. New Mexico FEMA Flood Map.................................................................................... 25 Figure 10. Geometric data for a single stream section. ................................................................. 26 Figure 11. Pit Rule Mapping Portal entry page. .......................................................................... 28 Figure 12. Statement of Certification Pop-up. ............................................................................. 29 Figure 13. The Pit Rule Mapping Portal. ...................................................................................... 29 Figure 14. Expanded Data Panels. ................................................................................................ 31 Figure 15. New Mexico geologic map overlain on topographic data. .......................................... 32 Figure 16. Active Map Panel. ....................................................................................................... 33 Figure 17. PDF image generated using the Print single page panel. ............................................ 34 Figure 18. Query and Identify features. ........................................................................................ 35 Figure 19. Registration application for Mapping Portal with Form C-144 .................................. 36 Figure 20. Sample of an automatically generated map for siting criteria 10-2 ............................. 37 Figure 21. Interface for Pit Rule Mapping Portal with Form C-144 ............................................ 38 Figure 22. Web page for the National Mapping Portal at http://Saturn.nmt.edu. ......................... 39 Figure 23. Current data status for the National Mapping Portal. .................................................. 39 Figure 24. Layout of the National Mapping Portal. ...................................................................... 40 Figure 25. Streams within 3000 ft of a location in Golden CO .................................................... 41 Figure 26. USGS Water table data within 20 miles of a location in Bakersfield, CA. ................. 41 Figure 27 . Karst terrain within 100 miles of a location in Lawrence, KS ................................... 42 Figure 28. Polygon drawn around a football stadium in Lawrence, KS. ...................................... 42 Figure 29. Line segments representing the proposed path of the Keystone XL pipeline ............. 43 Figure 30. User tracking for a two month period during open beta testing .................................. 47 Figure 31. Visitor overview, visitor segmentation, and service providers of users. ..................... 48 Table 1. Open Source Software Component Descriptions and Usage...........................................14
LIST OF ACRONYMS NMT New Mexico Tech aka New Mexico Institute of Mining and Technology
PRRC Petroleum Recovery Research Center
NMOCD New Mexico Oil Conservation Division
IPANM Independent Petroleum Association of New Mexico
GIS Geographic Information System

Final Report: “Reducing Impacts of New Pit Rules on Small Producers,” PRRC/NMT
6
EXECUTIVE SUMMARY
The project “Reducing Impacts of New Pit Rules on Small Producers” was conducted by the Petroleum Recovery Research Center of the New Mexico Institute of Mining and Technolo-gy. The Principal Investigator was Dr. Robert S. Balch and project co-PI was Dr. Tongjun Ruan. Key partners were the Independent Petroleum Association of New Mexico, representing over 250 producers in the state of New Mexico, and the New Mexico Oil Conservation Division, a regulatory agency.
The objective of this project was to minimize the impact of new “pit rules” on New Mex-ico’s small producers. The added cost of compliance and increased difficulty of permitting that developed with implementation of new and more stringent rules regarding pits, surface tanks, and on-site burial of drilling wastes had the potential to price smaller producers, who as a whole produce the majority of New Mexico’s marginal and mature fields, out of future drilling and production—thus reducing future reserves. New compliance requirements included geo-referenced maps for a number of surface and subsurface features such as depth to groundwater, distance to surface water and relationships of proposed sites to a wide variety of cultural and environmental features. Compliance could lead to expensive site surveys and significant permit-ting delays and these additional costs were acquired by small producers, ill-equipped to deal with these expenses.
In partnership with industry and the regulatory agency, this project proposed to make available a wide selection of data needed for compliance, in acceptable automated online for-mats, allowing faster completion of applications without the necessity of expensive specialist surveys in most areas. In addition, producers and regulators both gained access to all required data, which allowed for faster application processing and reductions in delays, thus benefiting New Mexico’s producing regions.
Eight major tasks were performed in order to accomplish the project goals: Data As-sessment occurred during the first six months of the project: this task categorized and located all necessary data and determined acquisition issues such as digitization that needed to be addressed. Data Acquisition was completed by the end of the first project year and collected and organized all data required for the project. Data Cleaning lasted from the middle of the first year to the end of the second year, and overlapped and integrated with data acquisition with data being cleaned as it was acquired. Database Construction also began in the middle of the first year. Database construction was an iterative process and development proceeded through a series of temporary databases as data was acquired and then cleaned. Data Presentation and Feedback represented a key milestone in the project. Toward the end of the first project year a preliminary database and list of acquirable data were presented to industry and government for review and feedback. These were immediately available and used in reducing compliance time and costs. The Build Data Access task involved generation of web pages, GIS layers, downloadable data tables, and maintainable (upgradeable) database software to allow fast and simple use of project results. Software to generate and fill required application forms was also created during this task. The Industry/OCD Feedback task involved iterative presentation and review cycles with active testing of the results by industry and government partners. Based on this feedback, Final Deliv-ery allowed for final adjustments and then public posting of data, software, and GIS implementa-tions online, in maintainable formats.
During the course of the project it became apparent that users were utilizing generated GIS software for non-Pit Rule purposes, such as pipeline routing and supplemental data for

Final Report: “Reducing Impacts of New Pit Rules on Small Producers,” PRRC/NMT
7
forms such as NEPA’s for other regulatory agencies. The project was extended at no-cost for an additional year to allow generation of a second generic regulatory data portal extending some of the utility of the Pit Rule portal nationwide and to implement additional drawing and query tools. The Pit Rule Mapping Portal and associated Automated C-144 Forms can be found at http://ford.nmt.edu and the nationwide generalized regulatory data Mapping Portal can be found at http://saturn.nmt.edu.

Final Report: “Reducing Impacts of New Pit Rules on Small Producers,” PRRC/NMT
8
1. WORK PERFORMED
1.1 Introduction
This work can be divided into three major components: construction of the initial GIS,
known as the Pit Rule Mapping Portal; generation of software to accommodate online, interac-
tive, and partially automated generation of C-144 forms; and construction of a generic Nation-
wide Regulatory Data Mapping Portal. The Initial GIS allowed rapid deployment of mapping
capabilities to producers within the first year of the project. The online automated forms were
then implemented to simplify applications, store created maps, and automatically generate map
attachments with a single click for most of the data needed to submit a C-144 form. Finally a
more generic national mapping portal extended some of the utility of the New Mexico portal to
the entire U.S.
This work was performed in response to changes to the New Mexico regulations regard-
ing siting of surface pits and modifications to the pit and below grade tank permitting form (C-
144). Prior to 2008 the form required one page and had a point system with simple yes and no
questions regarding depth to groundwater, and distance to surface water. Extensive modifications
to the rule (19.15.17.10.NMAC) and the associated C-144 form in July 2008 resulted in a
significantly longer form using five pages and requiring up to 21 attached maps verifying nu-
merous siting requirements listed in boxes 10 and 17 of the modified form. Both versions of the
C-144 form can be found in Appendix I. Siting requirement boxes 10 and 17 are shown in
Figures 1 and 2. For each siting requirement specific sources for data are listed as shown below:
1. Groundwater – NM Office of the State Engineer iWATERS database, USGS well data, data from
nearby wells.
2. Surface Water – Topographic maps and visual inspection
3. Distance to residences, schools, hospitals and churches –Aerial photos, satellite, images, and vis-
ual inspection.
4. Water Wells – NM Office of the State Engineer iWATERS database and visual inspection.
5. Municipal Boundaries – written permission from municipality if within boundaries. Source of
boundaries not specified.
6. Wetlands – US Fish and Wildlife Wetland Identification Maps, and visual inspection.
7. Overlying subsurface mines – NM EMNRD Mining and Minerals Division maps.

Final Report: “Reducing Impacts of New Pit Rules on Small Producers,” PRRC/NMT
9
8. Unstable areas – Geologic Maps from NM Bureau of Geology and Mineral Resources, USGS, or
NM Geological Society topographic maps.
9. 100-year floodplain – FEMA Map.
Figure 1. Siting criteria for permitting.
Under the revised rule producers were required to re-permit (and potentially close) all exist-
ing surface pits and below grade tanks, which created an immediate backlog of permits and
added to permitting delays for new development. While most data needed for compliance were
already available online in one form or another, the data were widely spread among government
agencies or commercial companies and existed in a number of data formats that were not amena-
ble to georeferencing siting criteria, such as pit or tank locations, and required data sources. Data
were found in flat files, spreadsheet queries, printed data/maps, imaged data/maps, and digitized
data/maps. C-144 forms submitted to the regulatory agency immediately following implementa-
tion of the regulation included screenshots with hand-drawn locations and site data, blank
spreadsheet queries, and photocopied reproductions of aerial or satellite images. Not surprisingly
Final Report: “Reducing Impacts of New Pit Rules on Small Producers,” PRRC/NMT
10
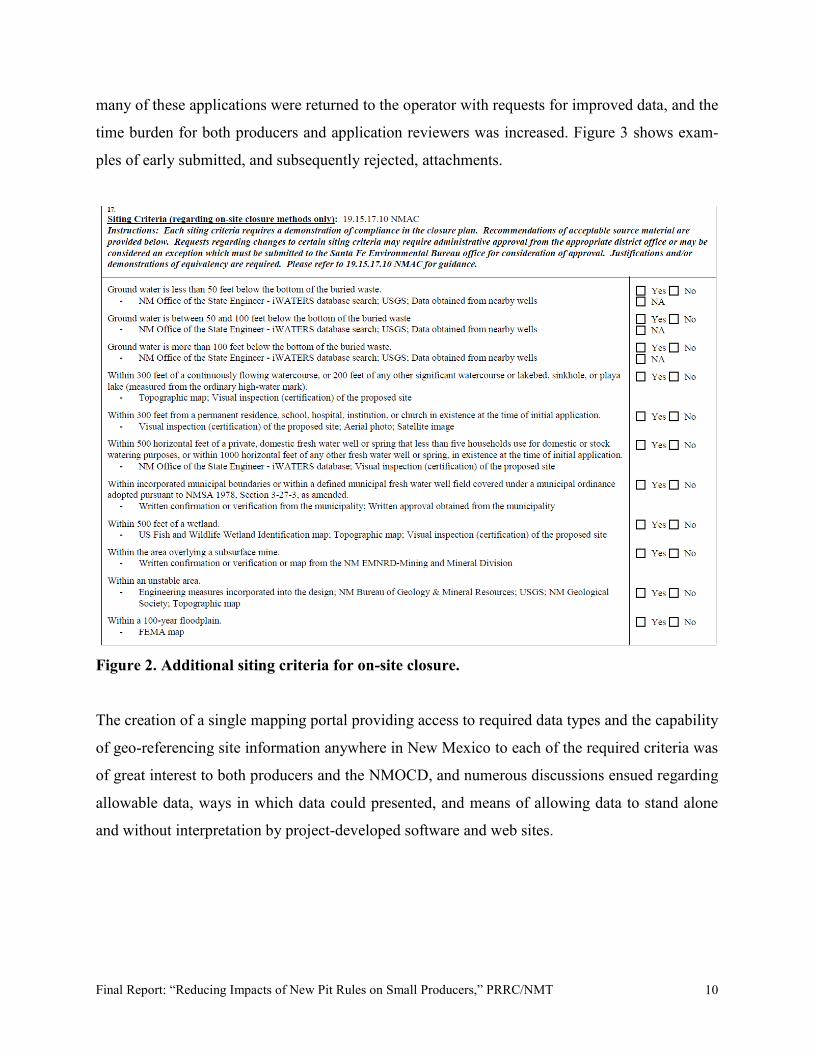
many of these applications were returned to the operator with requests for improved data, and the
time burden for both producers and application reviewers was increased. Figure 3 shows exam-
ples of early submitted, and subsequently rejected, attachments.
Figure 2. Additional siting criteria for on-site closure. The creation of a single mapping portal providing access to required data types and the capability
of geo-referencing site information anywhere in New Mexico to each of the required criteria was
of great interest to both producers and the NMOCD, and numerous discussions ensued regarding
allowable data, ways in which data could presented, and means of allowing data to stand alone
and without interpretation by project-developed software and web sites.

Final Report: “Reducing Impacts of New Pit Rules on Small Producers,” PRRC/NMT
11
Figure 3. Examples of rejected C-144 attachments. Upper left: Aerial photo in which a felt-tipped marker was used to mark the site location. Upper right: Photocopy of a topographic sheet with a compass-drawn radius used to show distance to surface water. Lower left: iWATERS database query showing no water wells in area. Lower right: Screen capture of map showing subsurface mining operations,; well location is marked and labeled by hand.
Final Report: “Reducing Impacts of New Pit Rules on Small Producers,” PRRC/NMT
12
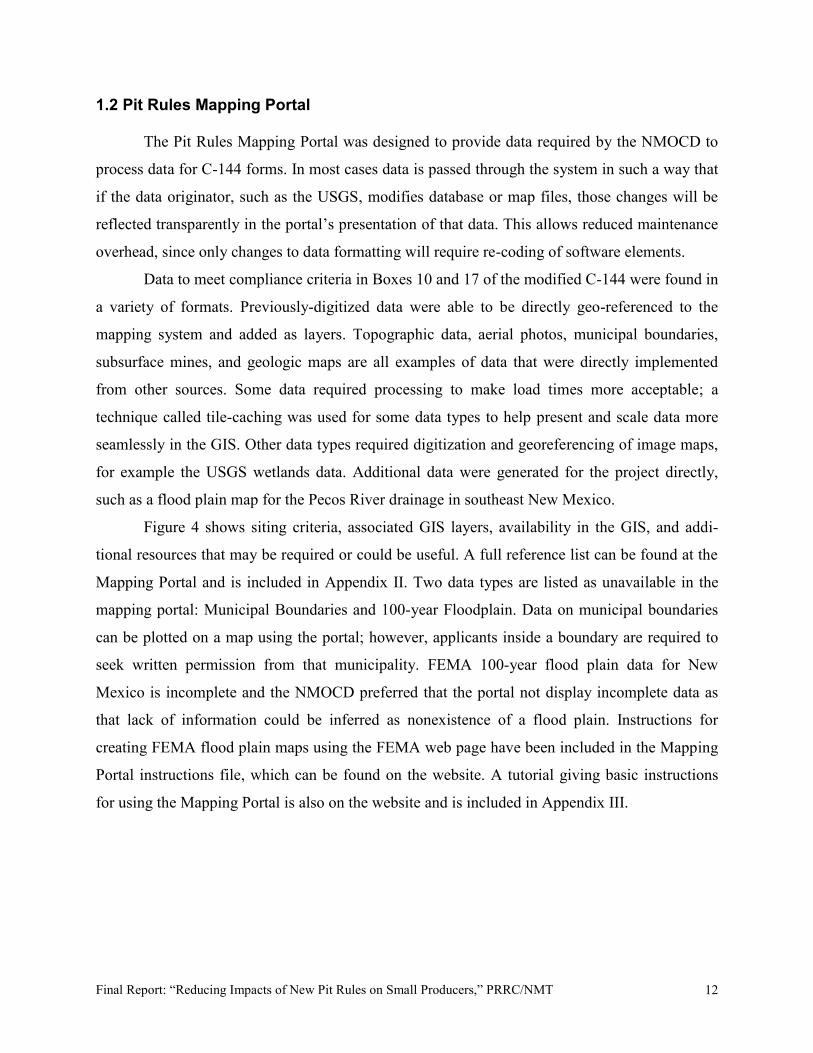
1.2 Pit Rules Mapping Portal
The Pit Rules Mapping Portal was designed to provide data required by the NMOCD to
process data for C-144 forms. In most cases data is passed through the system in such a way that
if the data originator, such as the USGS, modifies database or map files, those changes will be
reflected transparently in the portal’s presentation of that data. This allows reduced maintenance
overhead, since only changes to data formatting will require re-coding of software elements.
Data to meet compliance criteria in Boxes 10 and 17 of the modified C-144 were found in
a variety of formats. Previously-digitized data were able to be directly geo-referenced to the
mapping system and added as layers. Topographic data, aerial photos, municipal boundaries,
subsurface mines, and geologic maps are all examples of data that were directly implemented
from other sources. Some data required processing to make load times more acceptable; a
technique called tile-caching was used for some data types to help present and scale data more
seamlessly in the GIS. Other data types required digitization and georeferencing of image maps,
for example the USGS wetlands data. Additional data were generated for the project directly,
such as a flood plain map for the Pecos River drainage in southeast New Mexico.
Figure 4 shows siting criteria, associated GIS layers, availability in the GIS, and addi-
tional resources that may be required or could be useful. A full reference list can be found at the
Mapping Portal and is included in Appendix II. Two data types are listed as unavailable in the
mapping portal: Municipal Boundaries and 100-year Floodplain. Data on municipal boundaries
can be plotted on a map using the portal; however, applicants inside a boundary are required to
seek written permission from that municipality. FEMA 100-year flood plain data for New
Mexico is incomplete and the NMOCD preferred that the portal not display incomplete data as
that lack of information could be inferred as nonexistence of a flood plain. Instructions for
creating FEMA flood plain maps using the FEMA web page have been included in the Mapping
Portal instructions file, which can be found on the website. A tutorial giving basic instructions
for using the Mapping Portal is also on the website and is included in Appendix III.

Final Report: “Reducing Impacts of New Pit Rules on Small Producers,” PRRC/NMT
13
Figure 4. Data Availability matrix. 1.2.1 Technologies Used
The Pit Rules Mapping Portal was constructed using primarily open source software with
a core focus on GIS Technologies. Open source software allows for shared development, does
not require software licensing or usage fees, and simplifies contractual implementation of any
project software into future or parallel work done at other institutions and companies. Primary
features of open source design that were useful for this project were the ability to design and
code custom components, such as map printing, which were not otherwise available with com-
Final Report: “Reducing Impacts of New Pit Rules on Small Producers,” PRRC/NMT
14
mercial GIS software, and the ability to use publicly maintained databases that do not inherently
support desired features.
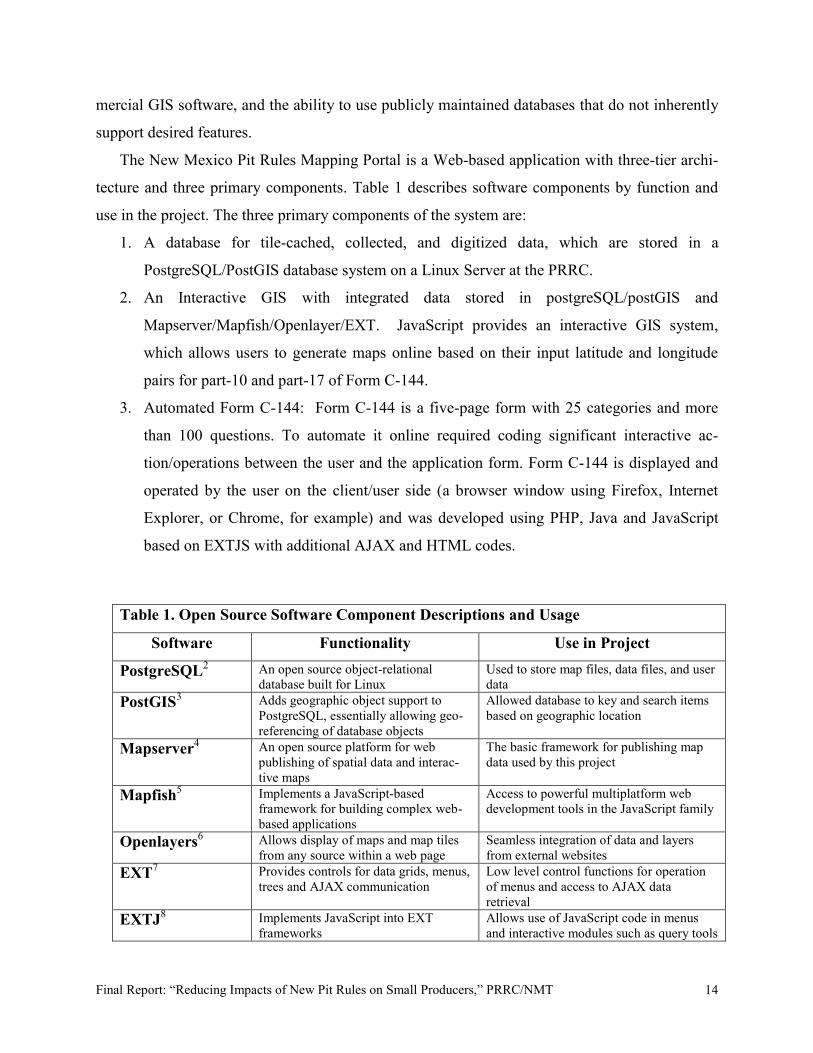
The New Mexico Pit Rules Mapping Portal is a Web-based application with three-tier archi-
tecture and three primary components. Table 1 describes software components by function and
use in the project. The three primary components of the system are:
1. A database for tile-cached, collected, and digitized data, which are stored in a
PostgreSQL/PostGIS database system on a Linux Server at the PRRC.
2. An Interactive GIS with integrated data stored in postgreSQL/postGIS and
Mapserver/Mapfish/Openlayer/EXT. JavaScript provides an interactive GIS system,
which allows users to generate maps online based on their input latitude and longitude
pairs for part-10 and part-17 of Form C-144.
3. Automated Form C-144: Form C-144 is a five-page form with 25 categories and more
than 100 questions. To automate it online required coding significant interactive ac-
tion/operations between the user and the application form. Form C-144 is displayed and
operated by the user on the client/user side (a browser window using Firefox, Internet
Explorer, or Chrome, for example) and was developed using PHP, Java and JavaScript
based on EXTJS with additional AJAX and HTML codes.
Table 1. Open Source Software Component Descriptions and Usage
Software Functionality Use in Project
PostgreSQL2 An open source object-relational database built for Linux
Used to store map files, data files, and user data
PostGIS3 Adds geographic object support to PostgreSQL, essentially allowing geo-referencing of database objects
Allowed database to key and search items based on geographic location
Mapserver4 An open source platform for web publishing of spatial data and interac-tive maps
The basic framework for publishing map data used by this project
Mapfish5 Implements a JavaScript-based framework for building complex web- based applications
Access to powerful multiplatform web development tools in the JavaScript family
Openlayers6 Allows display of maps and map tiles from any source within a web page
Seamless integration of data and layers from external websites
EXT7 Provides controls for data grids, menus, trees and AJAX communication
Low level control functions for operation of menus and access to AJAX data retrieval
EXTJ8 Implements JavaScript into EXT frameworks
Allows use of JavaScript code in menus and interactive modules such as query tools
Final Report: “Reducing Impacts of New Pit Rules on Small Producers,” PRRC/NMT
15
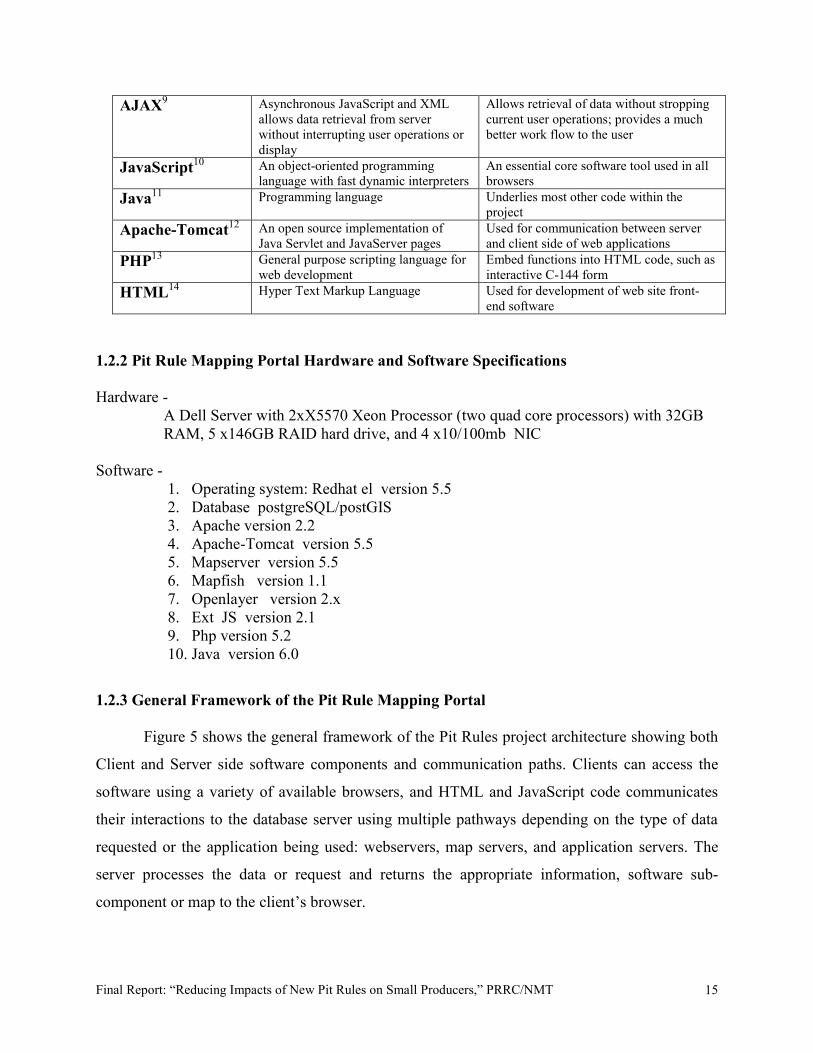
AJAX9 Asynchronous JavaScript and XML allows data retrieval from server without interrupting user operations or display
Allows retrieval of data without stropping current user operations; provides a much better work flow to the user
JavaScript10 An object-oriented programming language with fast dynamic interpreters
An essential core software tool used in all browsers
Java11 Programming language Underlies most other code within the project
Apache-Tomcat12 An open source implementation of Java Servlet and JavaServer pages
Used for communication between server and client side of web applications
PHP13 General purpose scripting language for web development
Embed functions into HTML code, such as interactive C-144 form
HTML14 Hyper Text Markup Language Used for development of web site front-end software
1.2.2 Pit Rule Mapping Portal Hardware and Software Specifications
Hardware - A Dell Server with 2xX5570 Xeon Processor (two quad core processors) with 32GB RAM, 5 x146GB RAID hard drive, and 4 x10/100mb NIC
Software -
1. Operating system: Redhat el version 5.5 2. Database postgreSQL/postGIS 3. Apache version 2.2 4. Apache-Tomcat version 5.5 5. Mapserver version 5.5 6. Mapfish version 1.1 7. Openlayer version 2.x 8. Ext JS version 2.1 9. Php version 5.2 10. Java version 6.0
1.2.3 General Framework of the Pit Rule Mapping Portal
Figure 5 shows the general framework of the Pit Rules project architecture showing both
Client and Server side software components and communication paths. Clients can access the
software using a variety of available browsers, and HTML and JavaScript code communicates
their interactions to the database server using multiple pathways depending on the type of data
requested or the application being used: webservers, map servers, and application servers. The
server processes the data or request and returns the appropriate information, software sub-
component or map to the client’s browser.

Final Report: “Reducing Impacts of New Pit Rules on Small Producers,” PRRC/NMT
16
Figure 5. Pit Rule Mapping Portal framework.
Often software will be developed with a three-layer structure consisting of a Presentation
Layer, a Business Layer, and a Data Layer. The increasing use of web browsers and demand for
supplying interactive and dynamic information requires a modification of the development into a
three-tier system instead, where each of the three common components is treated separately. This
allows better organization of code from disparate software and personnel, faster debugging, and
increases in run time efficiency with multiple communication paths open simultaneously. An
important additional feature of this design is that software in each tier can be tested, modified, or
altered without impacting the other tiers since the interfaces that allow communication between
tiers remains the same. Figure 6 shows the tier-based architecture for the Mapping Portal with
semi-automated C-144 forms. Detailed descriptions of each tier are provided in following
subsections.

Final Report: “Reducing Impacts of New Pit Rules on Small Producers,” PRRC/NMT
17
Figure 6. Three-tiered architecture of mapping portal. Tier 1 (Presentation Tier):
The presentation tier of the Pit Rules Mapping Portal is an interactive interface written in
JavaScript and running on a JavaScript engine (JavaScript Interpreter) embedded in the user’s
browser. It allows the user to perform several operations: obtain an account by registering; log in
to an existing account; manage user’s profile; create new C-144 applications; open, save/save
as/delete/download an existing application; fill in data for the C-144 Form (text and map genera-
tion); review that data and generated maps online with user’s browser; and export the C-144
form and generated maps as PDF files. Key feature classes include:
Registration - Allows a new user to register and setup a name and password.

Final Report: “Reducing Impacts of New Pit Rules on Small Producers,” PRRC/NMT
18
Login - Allow registered users to login with their userIDs and passwords.
User Profile - Registered users can modify or update their information.
Form C-144 – Allows the user to Create, Open, Save, Save As, Delete and Download
applications (Form C-144 ) in PDF format. Also allow users to fill in form online and
create required maps for subsections 10 and 17 by switching to an interactive GIS
panel.
Interactive GIS - Allow the user to zoom in/out, go to any location by inputting
Township-Range-Section, Address, zip code or latitude-longitude coordinates. A
query feature allows searches within certain distance from the marked location. Print
(copy or cut) a map with an input location as center and related/selected features into
a PDF file for the user to review/download.
The Registration/Login/Profile/Form C-144/PDF forms are implemented with JavaScript with
EXTJS. The Interactive Maps are implemented with JavaScript using MapFish/ Openlayer
/EXTJS.
Tier 2 (Business Tier):
There are five sections of the Mapping Portal that interact and mediate between Tier 1
and Tier 3. The task of the business tier is to interactively collect data from the user and process
the data or query to the appropriate sections of Tier 3. The five major processes are:
1. Registration/login process - Implemented with PHP 2. Profile process - Implemented with PHP 3. Form C-144 process - Implemented with PHP and MapServer 4. Maps process - Implemented with MapServer and Java Servlets 5. PDF form generator - Implemented with PHP based on the FPDF package.
Tier 3 (Data Tier):
Tier 3 is the data layer that represents the database of geology and geographical features
of New Mexico, user data (profiles and Form C-144 saved data) on the PostgreSQL/PostGIS
Server and project generated map data files as well as data connections or tile caches from
external server such as Google maps, USGS, University of New Mexico (UNM), and others.
The data Tier also manages PHP codes for Sections 1, 2, 3, and 5 in Tier 2 and controls all

Final Report: “Reducing Impacts of New Pit Rules on Small Producers,” PRRC/NMT
19
access to data and map data files from Tier 2 software. The Java Servlets for printing maps
(Section 4 code in Tier 2) access map data in PostgreSQL/PostGIS through Java Database
Connectivity (JDBC).
1.2.4 Software Statistics and Programming Productivity
Software generated for the project includes code written in three computer languages:
JavaScript = 15,055 lines
PHP codes = 8,343 lines
HTML = 2,669 lines
Total : 26,067 lines
According to Capers Jones, chairman of Software Productivity Research and a respected
expert in the area of software development, the maximum productivity of a skilled Java pro-
grammer is 1,060 lines per month. These overall productivity estimates include requirements
analysis, the time needed to understand the problem, the time needed for testing, and the time
required to ensure that the final product is stable. (It is important to note that only 30% of
productivity is directly related to actual coding time). The 26,067 lines of code developed for the
Pit Rules project is equivalent to ~2.05 programmer years (26067/1,060), or ~24.6 programmer
months.
1.3 National Regulatory Data Portal
Feedback from users indicated that the software was useful for other regulatory compli-
ance purposes, such as creating maps for NEPA documentation and routing of pipelines. To
explore this possibility the project received a short no-cost extension to generate a national map,
populate it with some commonly needed data types, provide querying tools, and to provide some
drawing tools for polygons and lines, including linear and areal measurements. Since full devel-
opment in open source software would have taken more time and resources than were available,
and some specific needs, such as formatted and printed maps were not deemed necessary, for this
portion of the project, existing ArcGIS servers at the PRRC and mapping tools were used to
provide the interface and make available some regulatory mapping utility available nationwide.

Final Report: “Reducing Impacts of New Pit Rules on Small Producers,” PRRC/NMT
20
1.3.1 Technologies Used
The National Mapping Portal is a Web-based application with a three-tier architecture
similar to that which was used for the Pit Rule Mapping Portal described in Chapter 1. The
majority of the system is designed using open source software on the server side and with
business and presentation tiers utilizing commercial software ArcGIS. The primary components
consist of:
1. Collected data, which are stored in a PostgreSQL/PostGIS database system.
2. An interactive GIS with integrated data stored in postgreSQL/postGIS and GeoServer
/Openlayer/EXTJS, which provide an interactive GIS system that allows users to relate
data to geographic locations.
Component software on the server side mimics data found in Table 1 for the Pit Rule Map-
ping Portal.
1.3.2 National Mapping Portal Hardware and Software Specifications
Hardware - A virtual machine with 2 CPUs, 6GB memory, independent IP address (129.138.10.6) and host name (Saturn.nmt.edu) built on the existing Dell Server with 2xX5570 Xeon Processor (two quad core processors) with 32GB RAM, 5 x146GB RAID hard drive, and 4 x10/100mb NIC
Software -
1. Operating system: Ubuntu Linux version 10.04.2 2. Database: postgreSQL/postGIS 3. Apache version 2.2 4. Apache-Tomcat version 6.0 5. GeoServer version 2.1 6. Openlayer version 2.0 7. ExtJS version 3.3.1 8. Php version 5.2 9. Java version 6.0
1.3.3 General Framework of the National Mapping Portal
Figure 7 shows the general framework of the National Mapping Portal showing both Cli-
ent and Server side software components and communication paths. Clients can access the

Final Report: “Reducing Impacts of New Pit Rules on Small Producers,” PRRC/NMT
21
software using a variety of available browsers and HTML and JavaScript code communicates
their interactions to the database server using multiple pathways depending on the type of data
requested or the application being used: webservers, map servers, and application servers. The
server processes the data or request and returns the appropriate information, software sub-
component or map to the client’s browser.
Figure 7. National Mapping Portal framework.
As with the New Mexico Mapping Portal, a system incorporating Presentation, Business,
and Data layers was developed. The primary difference between the two frameworks is the use
of commercial software (geoserver from ArcGIS) to process requests between the user and the
server, and a separate database for national data and maps. Figure 8 shows the tier-based archi-
Server Side
Web Server Apache v2.2 HTML/JavaScript/EXTJS /OpenLayer/PHP
Application Server Tomcat v5.5 Java Servlets
Client Side User Browser: MS Internet Explorer Firefox Chrome
HTML/JavaScript
Map Server GeoServer v2.1
Database Server (PostgresSQL/Postgis)
Database of Geology and Geography Maps

Final Report: “Reducing Impacts of New Pit Rules on Small Producers,” PRRC/NMT
22
tecture for the National Mapping Portal. Detailed descriptions of each tier are provided in
following subsections.
Figure 8. Three-tiered structure for National Mapping Portal.
Tier 1 (Presentation Tier):
The presentation tier of the National Mapping Portal is an interactive interface written in
JavaScript and running on a JavaScript engine (JavaScript Interpreter) embedded in the user’s
browser. It allows the user to perform operations using an Interactive GIS:
Interactive GIS - Allows the user to zoom in/out, go to any location by inputting ad-
dress, zip code or latitude-longitude coordinates. A query feature allows searches
within a certain distance from the marked location.
The interactive maps are implemented with JavaScript using ArcGIS.
Final Report: “Reducing Impacts of New Pit Rules on Small Producers,” PRRC/NMT
23
Tier 2 (Business Tier):
The task of the business tier is to interactively collect data from the user and process the
data or query to the appropriate sections of Tier 3. The National Map has a single primary
process, which allows all necessary interaction including, mapping, database queries, and
drawing tools.
1. Maps process - Implemented with geoserver and Java Servlets
Tier 3 (Data Tier):
Tier 3 is the data layer that represents the database of geology and geographical features
of the U.S., as well as data connections or tile caches from external server such as Google maps,
USGS, and others.
2. Experimental Methods This project does not have experimental work in the usual sense, since it is based entirely
on computer programming and modeling of data using software tools. However, the use of open
source software described in Section 1.2 of this report may be of interest to future researchers
and could constitute an experimental work in that regard. Design work for web-based software
frameworks could also be considered experimental. In addition, flood plain data was generated
for this project, for the Pecos River drainage. A summary of that work is presented in this
section.
2.1 Design Using Open Source Software
The design of the framework for the Pit Rule Mapping Portal involved integration of
multiple open source software components, including modification of MapFish and Mapserver to
allow for generation of PDF maps. Software components and design elements are discussed in
Sections 1.2.1 and 1.2.3 of this report.

Final Report: “Reducing Impacts of New Pit Rules on Small Producers,” PRRC/NMT
24
2.2 Design Using Commercial Software
The design of the framework for the National Mapping Portal involved integration of
multiple open source software components with a commercial GIS interface. Software compo-
nents and design elements are discussed in Section 1.4 of this report.
2.3 Pecos River Floodplain Delineation
In this portion of the study, which resulted in a M.S. thesis in Civil Engineering, flood-
plain maps were created for the entire stretch of the Pecos River in the state of New Mexico.
FEMA flood plain maps of New Mexico are incomplete (Figure 9), posing difficulties for
compliance with the Pit Rules C-144 form. A study of 100- and 500-year floodplains were
considered for the Pecos river drainage as it impacts the Permian Basin in New Mexico. The
study used a method developed by the U.S. Army Corp of Engineers called HEC-GeoRAS
(Hydraulic Engineering Center-GeoRiver Analysis System), which is designed to reach FEMA
flood mapping standards and is accepted by FEMA. HEC-RAS can perform four types of one-
dimensional river analysis: (1) steady flow water surface profile computations, (2) unsteady flow
simulation, (3) movable boundary sediment transport computations, and (4) water quality
analysis. Common geometric data can be used to perform all four types of river analysis. This
procedure presented an enormous savings of time and resources in comparison with traditional
methods of mapping water surface elevation. Data consisted of 117 high resolution Digital
Elevation Models (DEMs) of the river channel and surrounding floodplain. Given this data,
HEC-GeoRAS provided an easy-to- use interface able to create an unlimited number of cross-
sections. This information was subsequently imported into HEC-RAS where a one-dimensional
steady-flow analysis using measured flow line data was performed to determine water surface
extents and depth grids (Figure 10).

Final Report: “Reducing Impacts of New Pit Rules on Small Producers,” PRRC/NMT
25
Figure 9. New Mexico FEMA Flood Map. Data is sparsely presented, often at only the county level. In this figure, the areas in red are the only FEMA designated flood plain areas and the 4 counties in green are grouped into broad classifications.
The entire stretch of the Pecos River in the state of New Mexico was analyzed and flood-
plain maps were calculated for the Pecos Drainage. Two case studies extracted from that data are
presented. Case study 1 comprised central Carlsbad, where the average flood depth for 100- and
500-year floodplains were found to be 1.35 ft and 1.44 ft, respectively. These floods will also
cause 68% and 77.7% of the area within central Carlsbad to be covered with more than 1 ft of
water for 100- and 500-year floods, respectively. Case study 2 consisted of the area surrounding
the Carlsbad Medical Center. Results showed that this area is susceptible to an average of 0.93 ft
and 1.00 ft of water for 100- and 500-year floods, respectively. It was also observed that 35.4%
of the study area would be under water to a depth of 1 ft during a 100-year flood. For a 500-year
flood, 51.7% of the study area would be covered by up to 2 ft of water.

Final Report: “Reducing Impacts of New Pit Rules on Small Producers,” PRRC/NMT
26
Figure 10. Geometric data for a single stream section. Lines represent possible flood extent and the red dots normal stream flow.
3. Results and Discussion
3.1 Project Results
The Pit Rule Mapping Portal was introduced to New Mexico in 2009. The purpose of the
mapping portal was to help oil and gas operators, natural resource environmental managers, and
other related sector professionals evaluate natural resources and man-made features within a
subject area. While initially designed only for the New Mexico Pit Rule, the data provided by
the portal has proven to be useful for other applications and beyond the borders of New Mexico.
A National Mapping Portal was also developed to include data for surrounding states. Mapped
natural resources include, but are not limited to: depth to water and ground water elevation from
USGS gauging stations; topography; aerial photos, digital elevation models; surface geology;

Final Report: “Reducing Impacts of New Pit Rules on Small Producers,” PRRC/NMT
27
karsts; and surface water. In addition, the mapping portal includes spatial search capabilities that
allow querying data to determine proximity of natural resources to a subject site.
The concept behind a mapping portal is to function as an online geographical information
system (GIS). In simple terms, a GIS is a computer mapping application that displays spatial
information on a map of the earth, rather than in tables and spreadsheets, and allows queries and
statistical analyses that display the results on a map. For example, a GIS can be used to plot point
and vector data (i.e., oil and gas wells; water wells with chemistry and ground water measure-
ments; air quality monitoring stations; wind direction) and display the data on aerial photo-
graphs, USGS topographic maps, and many other types of imagery such as a water table map,
karst topography, geologic map, and soils types. This ability to overlay a variety of data layers
and perform statistical and spatial analysis provides an excellent way to obtain or demonstrate
information that has any kind of geographical component.
The New Mexico Mapping Portal can be found at http://ford.nmt.edu and the National
Mapping Portal is available at http://saturn.nmt.edu. Specific results are discussed in more detail
in Sections 3.1.1 and 3.1.2
3.1.1 Results for the New Mexico Pit Rule Mapping Portal
The New Mexico Pit Rule Mapping Portal is a GIS and associated database with forms,
which allow for more rapid and consistent generation of map attachments for the New Mexico
C-144 form for permitting of pits and below grade tanks. To access the Portal, a user can direct
any browser to http://ford.nmt.edu/react/pitrules_index.html, which will place them at the web
page shown in Figure 11. The web page provides background information, a link and a mirrored
link to the GIS if the user desires to make single maps, a link to a version of the Portal that has a
digital C-144 and can auto-generate and save maps, a link to the National Mapping Portal which
will be further discussed in Section 3.1.2, and a link to a user’s guide (Appendix III). If users
select the Mapping Portal link a pop-up menu (Figure 12) requires users to confirm that they
have, or will, perform a physical survey of the site and provides reference and map legend data
to submit with attachments. The reference data sheet can be found in Appendix II, and the
Legend in Appendix IV. The GIS display is divided into four portions (Figure 13): a panel with
Map Layers, Print Single Page, Go to Location, and Query options; a tool bar that allows drag-

Final Report: “Reducing Impacts of New Pit Rules on Small Producers,” PRRC/NMT
28
ging, zooming, drawing points, lines and polygons, manually resetting the site marker, and
identifying map features; a map panel that displays georeferenced data, and a panel with addi-
tional information, such as location of the pointer in latitude and longitude, and map scale.
Figure 11. Pit Rule Mapping Portal entry page. Background information, links to mapping portals, and a user's guide are provided.

Final Report: “Reducing Impacts of New Pit Rules on Small Producers,” PRRC/NMT
29
Figure 12. Statement of Certification Pop-up. Users must agree to a site survey before using the mapping portal. Links to PDF versions of the reference list and map legend are also given.
Figure 13. The Pit Rule Mapping Portal. The left panel allows data selection, the right top panel provides tools, the right center panel displays mapped features, and the bottom panel provides additional information.

Final Report: “Reducing Impacts of New Pit Rules on Small Producers,” PRRC/NMT
30
The data selection panel is expanded in Figure 14, showing four distinct functions. The
first function is to display mapped data relevant to C-144 attachments. Map layers are divided
into base layers and overlays. Only one base map may be selected at a time, while multiple
overlays can be drawn on top of a single base layer. An example of this is shown in Figure 15,
where the New Mexico geologic map is overlain upon topographic data. Map Layers are as
follows with the first four representing the base layers:
No Base Layer – Only overlain maps are displayed
USGS TOPO – US Geologic Survey topographic maps are displayed
2005/06 Aerial (RGIS) – aerial photos for New Mexico are displayed
Shaded Relief – A digital terrain model is displayed
Drilling Pad Radii – C-144 distances drawn as rectangles from average drilling pad
Site Marker – shows selected site location on the map
Site Radii – C-144 distances drawn as circles from the site marker
New Mexico Geology – Geologic map of New Mexico
USGS Karst Map – USGS Karst Terrain map
Land Ownership – Land Ownership
Mines and Minerals – Surface and subsurface mines
Political Boundaries – Roads, counties, cities and Land Grid
Surface Water – Streams, rovers, ponds, lakes, reservoirs, playas, swamps, springs, etc
Statewide Wells – OSE water wells, USGS groundwater data, and oil and gas wells

Final Report: “Reducing Impacts of New Pit Rules on Small Producers,” PRRC/NMT
31
Figure 14. Expanded Data Panels. Upper Left shows map layers, upper right shows Print feature, lower left shows the location tool, and lower right shows the query feature.

Final Report: “Reducing Impacts of New Pit Rules on Small Producers,” PRRC/NMT
32
Figure 15. New Mexico geologic map overlain on topographic data. Also shown are political boundaries, major cities and roads.
The Print single page panel can be used to generate PDF printouts for any generated
map. When the Print panel is selected the user is presented with boxes for a title, Client name,
Figure Number, and Scale. A yellow, moveable box appears on the screen, centered on the site
location, which shows the area that will be converted to a PDF when the print button is selected.
Figure 16 shows an active map panel and Figure 17 shows the resulting map.

Final Report: “Reducing Impacts of New Pit Rules on Small Producers,” PRRC/NMT
33
Figure 16. Active Map Panel. Users can enter personalized information for the captions, and the movable yellow area represents the map image. In this case the site is within 1000 ft of surface water, which is overlain on aerial photo data. Figure 14 (lower left) shows the Go to Location panel. The user can enter locations as an
address, latitude and longitude or in township-section-range format by selecting the appropriate
tab. When the location is entered the map will zoom into that location at a scale that is appropri-
ate for generating C-144 attachments.

Final Report: “Reducing Impacts of New Pit Rules on Small Producers,” PRRC/NMT
34
Figure 17. PDF image generated using the Print single page panel. The Query panel allows searching the OSE and USGS water data for features within a
specified distance. Figure 18 shows a shaded relief map base layer with pad radii, OSE water
wells, oil and gas wells, surface water and the New Mexico Land grid as overlays. Note that the
water well data shows depth to groundwater and date measured. Water wells within 1000 ft have
been queried and are listed in a table in the Query panel. The query feature is also available
using the tool bar menu Identify feature, which allows the user to drag a box on the screen and
query the feature contained within that area. When the Identify feature is used the query results
pop up on the screen. In this example the same five water wells have been queried.

Final Report: “Reducing Impacts of New Pit Rules on Small Producers,” PRRC/NMT
35
Figure 18. Query and Identify features. Tabulated water well data was extracted from the OSE database using both the Query and the Identify features. Also shown are water wells (blue squares), oil and gas wells (orange circles), surface water (blue lines), and the New Mexico land grid (brown lines and labels).
3.1.2 Results for the New Mexico Pit Rule Mapping Portal with Form C-144
In order to utilize the digitized C-144 form a user would select Pit Rules Mapping Por-
tal With Form C-144 at the entry page (Figure 11). Since the C-144 form utilizes a database to
store maps and forms for each user, a simple login procedure is used to ensure that data is easily
and correctly stored and retrieved. Therefore a login is required and if the user has not previously
registered with the system a request for profile information pop-up query will be initiated (Figure
19). After the user fills in required information the login will be processed and a modified

Final Report: “Reducing Impacts of New Pit Rules on Small Producers,” PRRC/NMT
36
version of the mapping portal will be initiated (Figure 20) which has three separate tabs: Profile,
which allows the user to modify their registration data; Forms, which allows the user to manage
their existing applications and create new applications; and Map, which provides access to the
mapping portion of the Pit Rule Mapping Portal.
In the Forms tab, user application data is stored in folders by year and month. Any appli-
cations started in November of 2011, for example, would reside in a folder named “2011-11”.
Users can reopen a previous application to continue, or revise maps, or create a new application.
When a new application is initiated users can give any name they desire, such as API, well name,
or unit number. After the application is opened users have access to an interactive version of the
C-144 form and can enter baseline information such as OGRID number (operator ID code) well
location, company name, and other basic information. They can also create maps in sections 10
and 17 for required attachments. Each siting criteria has two associated buttons: Create Map,
which opens the Map tab and automatically zooms to the applications location and turns on
appropriate layers for determining the status of the location with respect to the criteria; and a
Figure 19. Registration application for Mapping Portal with Form C-144. No data is ever shared.

Final Report: “Reducing Impacts of New Pit Rules on Small Producers,” PRRC/NMT
37
button labeled Attached 10-X, which is a placeholder for the map name users will supply when
they save the map. This second button allows retrievable of previously examined and stored
maps. Additional options within the Form tab are Save, Save As, Download, and Reset. Fea-
tures of the forms page are shown in Figure 21.
Figure 20 shows an automatically generated map showing proximity to surface water.
The topographic sheet base layer has been set, and overlays for Site Marker, Pad Radii, Politi-
cal Boundaries and Surface Water have been turned on. This map can be saved to the form
and/or printed using the Print Single Page panel as demonstrated in Figures 16–17. User-
generated maps and forms are stored indefinitely on servers at the PRRC in case adjustments or
additions need to be made to successfully complete a C-144 form.
Figure 20. Sample of an automatically generated map for siting criteria 10-2. This example demonstrates that the site is greater than 500 feet from any surface water channels.

Final Report: “Reducing Impacts of New Pit Rules on Small Producers,” PRRC/NMT
38
3.1.3 Results for the National Mapping Portal
The purpose of this generalized mapping portal is to expand some of the utility of the
New Mexico Mapping Portal to include data beyond the borders of New Mexico. Currently, the
generalized mapping portal shows the following national data: USGS topographic maps; USGS
aerial photos for 1996–98 and 2008; aerial photography, terrain, and streets from Google Maps;
street data from OpenStreet Maps; karst areas; major rivers, streams, and water bodies; elevation,
and geology. In addition, USGS ground water data, oil and gas wells, detailed river, stream, and
water bodies. Domestic water supply wells are available for New Mexico. The generalized
mapping portal will slowly expand the detailed surface and groundwater data, oil and gas wells,
and local geology and soil data into Texas, Oklahoma, Colorado, Utah, Arizona, and Wyoming.
After these states are mapped, and given time and resources, the detailed data will further expand
Figure 21. Interface for Pit Rule Mapping Portal with Form C-144. Section 10 with interac-tive map generation is shown in this example.

Final Report: “Reducing Impacts of New Pit Rules on Small Producers,” PRRC/NMT
39
into the Gulf States. Figure 22 shows the web page at http://Saturn.nmt.edu, which introduces
and gives access to the National Mapping Portal. Figure 23 tabulates current and planned data for
the portal.
Figure 22. Web page for the National Mapping Portal at http://Saturn.nmt.edu.
Figure 23. Current data status for the National Mapping Portal.

Final Report: “Reducing Impacts of New Pit Rules on Small Producers,” PRRC/NMT
40
The layout of the National Mapping Portal differs from that of the New Mexico Portal
and consists of: 1) a Map panel; 2) a Layers panel; 3) a Toolbar panel; and 4) an Information and
Toolbar options panel. When a tool is selected in the Toolbar, options and additional features
related to that tool are presented in the Toolbar Options panel. Figure 24 shows the layout of the
National Mapping Portal.
In addition to viewing the above listed data, the mapping portal allows the user to enter a
location and perform spatial queries. For example, a user can enter a location and perform a
query to determine the distance to the nearest river or stream (Figure 25). The mapping portal
can then return the result in tabular format and/or highlight the selected feature(s) on the map.
The user can also perform a query to return a list of all water wells within a given distance and
gives the user an option to highlight these features on the map by selecting an element in the
table (Figure 26). A third query could present Karst terrain within several hundred miles (Figure
27). In each case the map will zoom to the appropriate scale, present a selectable table of data
with distances to each queried feature, and allow the user to highlight elements of interest.
Additional tools allow for drawing and measuring polygons and lines (Figures 28 and 29).
Figure 24. Layout of the National Mapping Portal. Panels are: 1) Map, 2) Layers, 3) Tools, and 4) Information and Toolbar Options.

Final Report: “Reducing Impacts of New Pit Rules on Small Producers,” PRRC/NMT
41
Figure 26. USGS Water table data within 20 miles of a location in Bakersfield, CA. The nearest well is 6.4 miles from the site. Data locations are blue circles and the selected element in the table is highlighted in yellow. Depth values are annotated on the map and included in the table.
Figure 25. Streams within 3000 ft of a location in Golden CO. The nearest stream is a Canal/Ditch within 303 ft of the location and highlighted in yellow on the map. Others streams are in blue and listed in the table.
Final Report: “Reducing Impacts of New Pit Rules on Small Producers,” PRRC/NMT
42
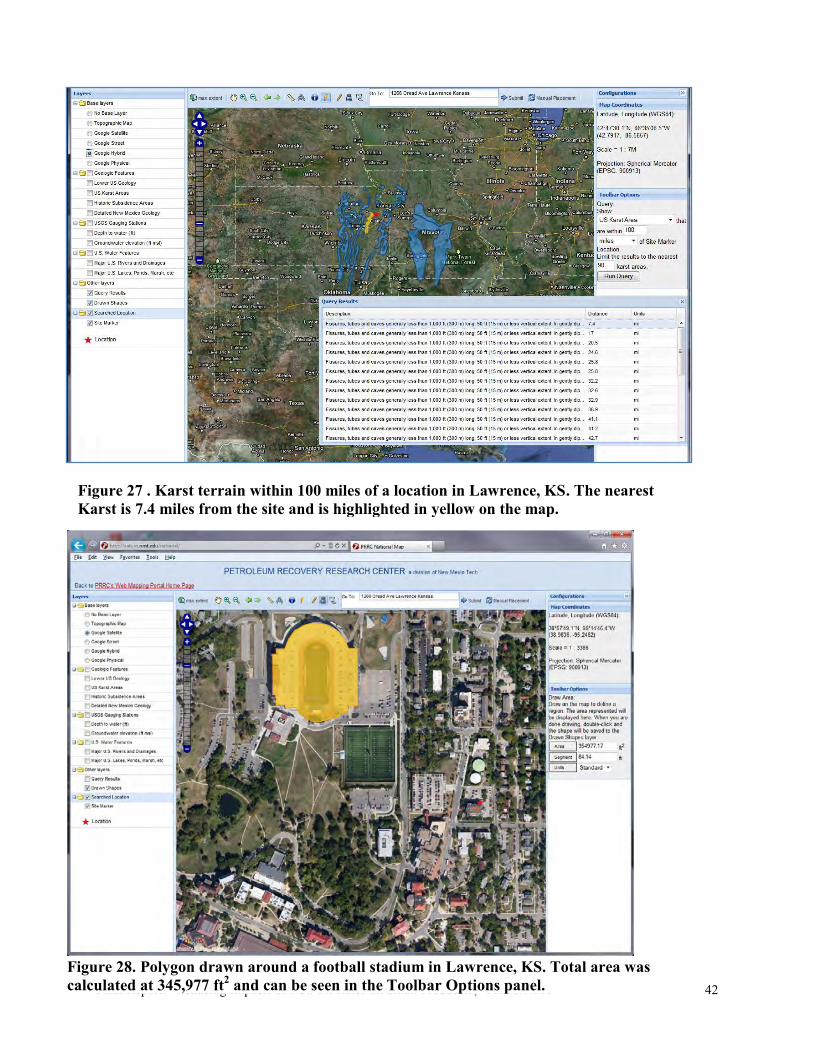
Figure 27 . Karst terrain within 100 miles of a location in Lawrence, KS. The nearest Karst is 7.4 miles from the site and is highlighted in yellow on the map.
Figure 28. Polygon drawn around a football stadium in Lawrence, KS. Total area was calculated at 345,977 ft2 and can be seen in the Toolbar Options panel.

Final Report: “Reducing Impacts of New Pit Rules on Small Producers,” PRRC/NMT
43
Figure 29. Line segments representing the proposed path of the Keystone XL pipeline to carry oil from Alberta, Canada to Oklahoma. The route as drawn is just less than 1,116 miles in length. Of particular interest at the time of this report was the 246-mile segment passing through Nebraska.
3.2 Impact to Small Producers
The proposed research directly impacts both economically producible reserves and
production-related expenses. While closures of pre-existing pits will have a large short-term
financial impact, the larger problem facing independent producers is the extensive changes to
regulations, reporting, and permitting for new pits and therefore for new and workover drilling.
Large companies have access to full time legal, environmental and other specialty expertise and
can more easily assign or hire additional staff to monitor pits, prepare reports and obtain supple-
mentary data for permit applications and required reports. While the new regulations may fulfill
needs for better stewardship of land and water resources they have significantly altered how
smaller producers operate in New Mexico.

Final Report: “Reducing Impacts of New Pit Rules on Small Producers,” PRRC/NMT
44
Additional overhead in time and personnel are required for determining costs associated
with new and recompletion well development in order to maintain or attract investors. In general,
this can require the input of specialists and/or dedicated personnel. In particular, new develop-
ment may be slowed for independents while appropriate data is gathered or acquired with respect
to relevant surface conditions at potential drill sites. These additional expenses may ultimately
impact the economics of the well and prevent smaller companies from developing needed
resources that are not at scales desired by larger companies. Since small producers already work
at scales and on margins that are not palatable to large companies, if their profits are marginal-
ized further due to additional permitting expenses and substantial remediation risks that cannot
be easily predicted, reserves can be lost and production may decline.
Access to tools to verify and justify regulatory requirements in a quick, accurate, and
verifiable manner has the potential to dramatically reduce time spent in meeting those regulatory
requirements and in responsibly addressing environmental concerns addressed by those regula-
tions. The mapping portals constructed for this project meet these goals and have applications
beyond New Mexico and beyond one set of regulations and can provide maps and data for NEPA
forms, pipeline projects, and other reports requiring map validated data.
3.3 Technology Transfer Efforts
The nature of this project predicated the need for extensive technology transfer through-
out the project at a variety of levels including direct contact with producers and regulatory
agencies, regional presentations and short courses, and nationally presented papers and presenta-
tions at trade organizations. The project also generated two masters’ theses and contributed to the
support of four additional students. A list of technology transfer activities performed for the
project includes 38 distinct tech transfer events, papers, or presentations:
Pit Rule Project -Tech Transfer Activities
1. July 2008 – Met with Colorado Oil Conservation Division
2. August 2008 – Spoke about project at Independent Petroleum Association of New Mexi-
co Annual Meeting
3. September 3, 2008 – Gave lunch talk about project to Roswell SPE chapter

Final Report: “Reducing Impacts of New Pit Rules on Small Producers,” PRRC/NMT
45
4. September 8, 2008 – Project meeting and discussion with New Mexico Oil Conservation
Division
5. October 2008 – New Mexico Oil and gas Association Meeting
6. November 12, 2008 – Project meeting and discussion with New Mexico Oil conservation
Division
7. February 2, 2009 – Project discussion with Mentor Jeff Harvard, SPE Meeting
8. March 2009 – First web model of the GIS online
9. June 24, 2009 – Discussions with producers in Farmington New Mexico
10. June 2009 – Full beta model online and introduced to stakeholders
11. June 2010 – Master’s Thesis: Parker, A.: “A Journey Into Open Source Web Mapping: a
non-developers perspective,” MGIS Capstone Project: Penn State University
12. July 2009 – Feature article on project in PRRC review with circulation ~2500 producers
13. August 2009 – Delivered full beta to stakeholders at IPANM annual meeting, distributed
~30 hardcopy manuals. Presented paper:
14. August 7, 2009 – Paper: Balch, R.: “Helping Producers with the Pit Rule,” Presented at
the Independent Petroleum Association of New Mexico Annual Meeting Farmington,
NM
15. September 10, 2009 – Met Project Mentor Jeff Harvard, discussions with producers.
16. October 2009 – New Mexico Oil and gas Association Annual Meeting, meeting with
OCD
17. October 13, 2009 – Feedback meetings with producer’s in Roswell and Artesia NM
18. November 2009 – Feedback meetings with producer’ in Farmington NM
19. January 27, 2010 – Presentation to Four corners SPE chapter on project
20. February 3, 2010 – Midland RPSEA Project Review
21. March 23, 2010 – Presentation of Project results to SPE Roswell Chapter, Artesia NM.
22. Article in Spring 2010 E&P Focus
23. Project displayed at RPSEA Booth at AAPG SW Meeting, June 2010, Durango, Co
24. August, 2010, meeting with RPSEA Project Manager Charlotte Schroeder, Houston TX.
25. September, 2010 – Master’s thesis: Ravada, M.:”Floodplain Delineation, an Integrated
ArcGIS, HEC-RAS Approach,” M.S. Thesis Civil and Environmental Engineering, New
Mexico Institute of Mining and Technology

Final Report: “Reducing Impacts of New Pit Rules on Small Producers,” PRRC/NMT
46
26. October 2010 – New Mexico Oil and Gas Association Annual Meeting, general tech
transfer and specific discussions with Mark Fesmire, Oil Conservation Division Director,
Santa Fe, NM
27. October 2010 – Direct Tech transfer at Roswell Geological Society meeting in Artesia,
NM, including stops at two companies to demonstrate software (Strata Production, Ro-
swell, and Heyco in Roswell, NM).
28. October 2010 – Meeting with NMOCD to finalize forms data, Santa Fe, NM
29. November 2010 – Meetings with NMOCD on web page status, Santa Fe, NM
30. November 2010 – Meeting with Bayless Production Co. to demonstrate software, Farm-
ington, NM
31. February 2011 – Visited DJ Simmons Inc, and Robert L. Bayless Co., in Farmington NM
32. April 20–2, 2011 – Paper and presentation: Balch, R., and Parker, A.: “A Generalized
Oil and Gas Regulatory Data Mapping Portal,” at the Southwest Petroleum Short Course,
Lubbock, Texas
33. April 2011 – Visited Nadel and Gussman producers in Roswell, NM
34. May 2011 – Generic regulatory data site online (Saturn.nmt.edu), mirrored Pit Rule site
(Ford.nmt.edu and pitrule.source3.com)
35. July 19–23, 2011 – Paper and Presentation: Balch, R., and Parker, A.: “A Generalized
Oil and Gas Regulatory Data Mapping Portal,” World Multi-Conference on Cybernetics
and Informatics. Orlando, FL
36. October 10, 2011 – Presentation: Balch, R.: “An Oil and Gas Regulatory Data Mapping
Portal,” Presented at RPSEA Small Producer Forum, Bakersfield, CA
37. November 8, 2011 – Presentation: Balch, R.: “An Oil and Gas Regulatory Data Mapping
Portal,” Presented at RPSEA Small Producer Forum, Lawrence, KS
38. November 30, 2011 – Presentation: Balch, R.: “An Oil and Gas Regulatory Data Map-
ping Portal,” Presented at RPSEA Small Producer Forum, Golden, CO
3.4 Conclusions
The Pit Rule Mapping Portal was introduced to New Mexico in 2009. The purpose of the
mapping portal was to help oil and gas operators, natural resource environmental managers, and
other related sector professionals evaluate natural resources and man-made features within a

Final Report: “Reducing Impacts of New Pit Rules on Small Producers,” PRRC/NMT
47
subject area. While initially designed for the New Mexico Pit Rule, the data provided by the
portal proved to be useful for other applications and beyond the borders of New Mexico. The
mapping portal has been expanded to include data for surrounding states. Mapped natural
resources include, but are not limited to: depth to water and ground water elevation from USGS
gauging stations; topography; aerial photos, digital elevation models; surface geology; karsts;
and surface water. In addition, both mapping portals include spatial search capabilities that
allow querying data to determine proximity of natural resources to a subject site. The New
Mexico Mapping Portal is available at http://ford.nmt.edu and addresses immediate needs of New
Mexico small producers while providing a template that can be used anywhere similar rules are
applied. For more general use and in other states, the National Mapping Portal can be found at
http://saturn.nmt.edu, and can provide useful mapping and information for a variety of regulatory
purposes, such as NEPAs and pipeline routing.
Figure 30. User tracking for a two month period during open beta testing. The site had 922 total visits with 245 unique visitors using the Mapping Portal software.

Final Report: “Reducing Impacts of New Pit Rules on Small Producers,” PRRC/NMT
48
A two-month snapshot of usage taken December 1 2009 to Jan 31, 2010 about six months
after the Pit Rule Mapping Portal was released provides some insight into how many people
were using the websites and how they were using it; this snapshot indicated that people were
using it repeatedly. Figure 30 shows web traffic both at the entry site and to the web portal itself.
During this two-month period there were 922 page views of the Entry page. Figure 31 shows that
these page views were the result of 709 total visits (some of the page visits may be the result of
page refreshes). Of these 709 visits, 245 resulted in visits to the mapping portal. Most visits
occurred during the business week with low activity occurring during weekends and the Christ-
mas and New Year’s Holidays. People spent an average of 9:36 minutes in the mapping portal;
though the data does not yield information on variance for visit times it can be presumed that
some visits were short and others longer.
Figure 31. Visitor overview, visitor segmentation, and service providers of users.

Final Report: “Reducing Impacts of New Pit Rules on Small Producers,” PRRC/NMT
49
Figure 31 describes some statistics collected about users during the two-month monitor-
ing period. Over this period, 314 absolutely unique visitors visited the entry site with repeat
visitors representing 61.21% of the traffic. During the two-month observation period,
38.79% of visitors were new, which indicates that Tech Transfer activities were effective at
drawing traffic.
The service providers of visitors yielded an interesting profile. Over 42% of traffic came
from unspecified sites, which likely means visitors were using proxy servers, browsers config-
ured to not show that information, or service providers that do not provide that information to
Google. Of the traffic with a designated service provider the second largest user was the State of
New Mexico at nearly 8% of all visitors. This yields an important conclusion: namely, that state
regulators or agencies were using the site.
A primary goal of the project was to build a common data site that would be of use to
both operators submitting data, and to regulators reviewing applications. Some inference that this
was successful may be drawn from the site visits from the State of New Mexico service provider.
3.5 Recommendations
The results of this project have been well received at every technology transfer event,
both for the Pit Rule Mapping Portal, and also for the National Mapping Portal. Numerous
suggestions of data to add to the database and utilities to add functionality have been made. As a
useful product for dealing with a specific issue, new pit rules in New Mexico, the project has
successfully met its mandate. Furthermore, the limited efforts at migrating the concept to a
national framework have proven that such software is not only useful but also highly desired by
producers operating at a scale that precludes internal environmental and/or geography depart-
ments. This test of concept suggests that more work on the National Mapping Portal could
provide utility to small producers across the nation and in a variety of regulatory environments.

Final Report: “Reducing Impacts of New Pit Rules on Small Producers,” PRRC/NMT
50
REFERENCES
1. http://www.emnrd.state.nm.us/OCD/documents/ProposedPitRule20070921.pdf
2. http://www.postgresql.org/
3. http://postgis.refractions.net/
4. http://mapserver.org/
5. http://mapfish.org/
6. http://openlayers.org/
7. http://www.ext.net/
8. http://www.sencha.com/products/extjs/
9. http://ajaxian.com/by/topic/ajax
10. http://www.commonjs.org/
11. http://java.com/en/
12. http://tomcat.apache.org/
13. http://www.php.net/
14. http://en.wikipedia.org/wiki/HTML
15. Ravada, M.:”Floodplain Delineation, an Integrated ArcGIS, HEC-RAS Approach,” M.S. Thesis Civil and Environmental Engineering, New Mexico Institute of Mining and Tech-nology, September, 2010.

Final Report: “Reducing Impacts of New Pit Rules on Small Producers,” PRRC/NMT
51
APPENDICES
Appendix I - C-144 Form Pre and Post 2008

Final Report: “Reducing Impacts of New Pit Rules on Small Producers,” PRRC/NMT
52

Final Report: “Reducing Impacts of New Pit Rules on Small Producers,” PRRC/NMT
53

Final Report: “Reducing Impacts of New Pit Rules on Small Producers,” PRRC/NMT
54

Final Report: “Reducing Impacts of New Pit Rules on Small Producers,” PRRC/NMT
55

Final Report: “Reducing Impacts of New Pit Rules on Small Producers,” PRRC/NMT
56

Final Report: “Reducing Impacts of New Pit Rules on Small Producers,” PRRC/NMT
57
Appendix II – Data and Sources for GIS Map Layers

Final Report: “Reducing Impacts of New Pit Rules on Small Producers,” PRRC/NMT
58
Appendix III – Mapping Portal User’s Manual
Final Report: “Reducing Impacts of New Pit Rules on Small Producers,” PRRC/NMT
59

Final Report: “Reducing Impacts of New Pit Rules on Small Producers,” PRRC/NMT
60

Final Report: “Reducing Impacts of New Pit Rules on Small Producers,” PRRC/NMT
61

Final Report: “Reducing Impacts of New Pit Rules on Small Producers,” PRRC/NMT
62

Final Report: “Reducing Impacts of New Pit Rules on Small Producers,” PRRC/NMT
63

Final Report: “Reducing Impacts of New Pit Rules on Small Producers,” PRRC/NMT
64

Final Report: “Reducing Impacts of New Pit Rules on Small Producers,” PRRC/NMT
65

Final Report: “Reducing Impacts of New Pit Rules on Small Producers,” PRRC/NMT
66

Final Report: “Reducing Impacts of New Pit Rules on Small Producers,” PRRC/NMT
67

Final Report: “Reducing Impacts of New Pit Rules on Small Producers,” PRRC/NMT
68

Final Report: “Reducing Impacts of New Pit Rules on Small Producers,” PRRC/NMT
69

Final Report: “Reducing Impacts of New Pit Rules on Small Producers,” PRRC/NMT
70

Final Report: “Reducing Impacts of New Pit Rules on Small Producers,” PRRC/NMT
71

Final Report: “Reducing Impacts of New Pit Rules on Small Producers,” PRRC/NMT
72

Final Report: “Reducing Impacts of New Pit Rules on Small Producers,” PRRC/NMT
73

Final Report: “Reducing Impacts of New Pit Rules on Small Producers,” PRRC/NMT
74
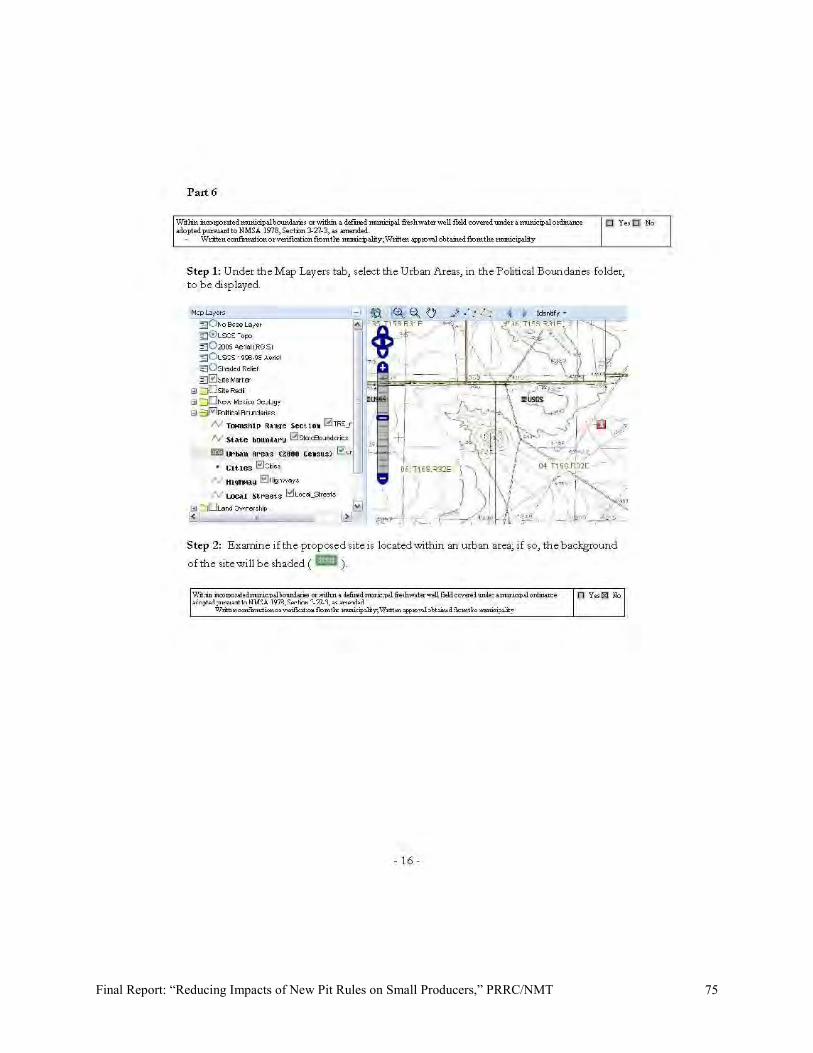
Final Report: “Reducing Impacts of New Pit Rules on Small Producers,” PRRC/NMT
75

Final Report: “Reducing Impacts of New Pit Rules on Small Producers,” PRRC/NMT
76
Appendix IV – Map Legend

Final Report: “Reducing Impacts of New Pit Rules on Small Producers,” PRRC/NMT
77

Final Report: “Reducing Impacts of New Pit Rules on Small Producers,” PRRC/NMT
78
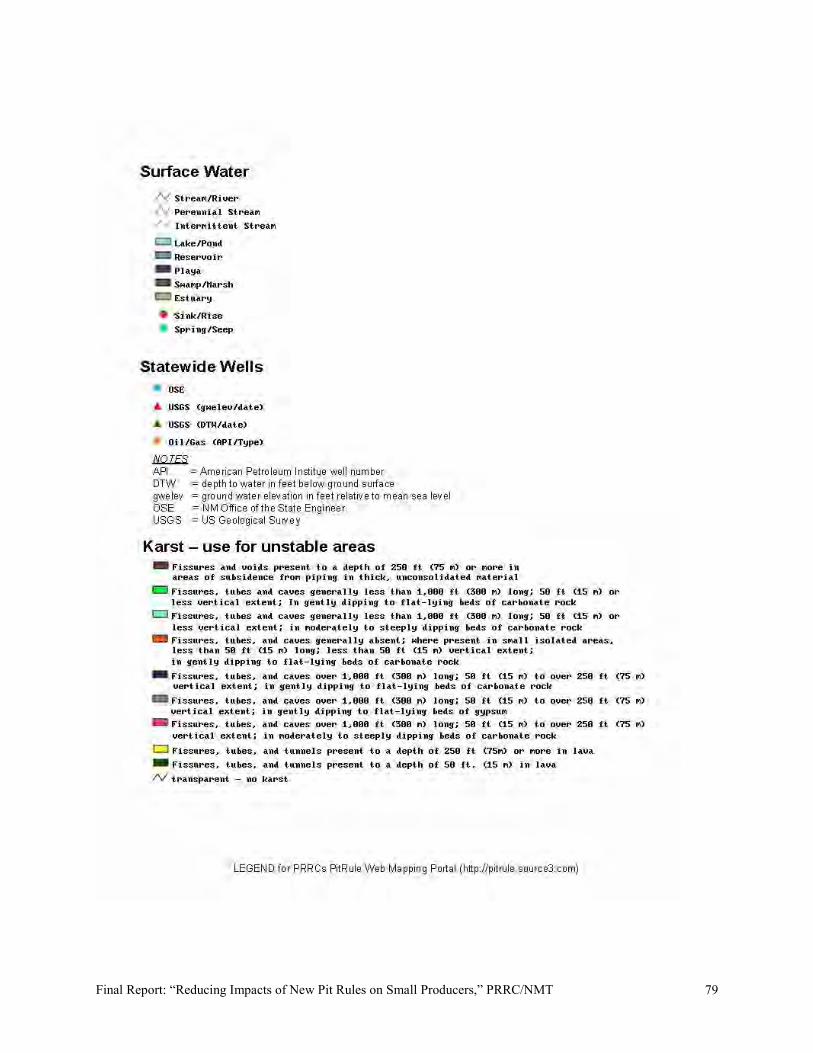
Final Report: “Reducing Impacts of New Pit Rules on Small Producers,” PRRC/NMT
79
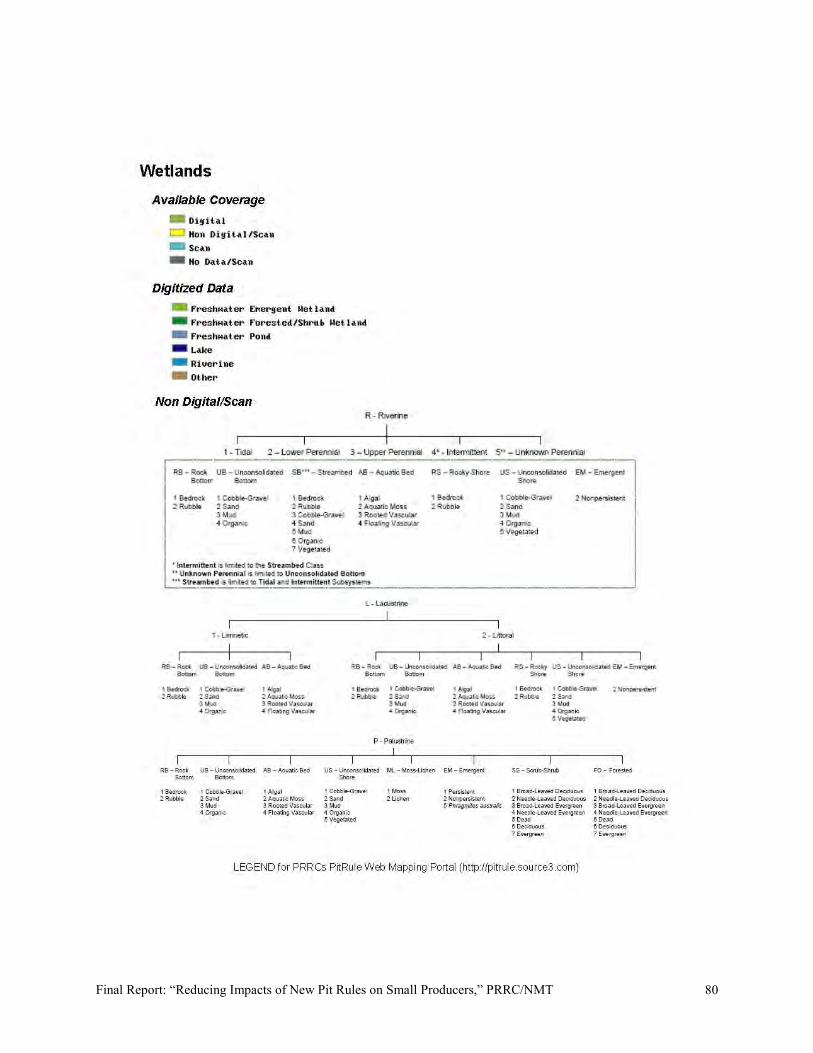
Final Report: “Reducing Impacts of New Pit Rules on Small Producers,” PRRC/NMT
80

Final Report: “Reducing Impacts of New Pit Rules on Small Producers,” PRRC/NMT
81

Final Report: “Reducing Impacts of New Pit Rules on Small Producers,” PRRC/NMT
82
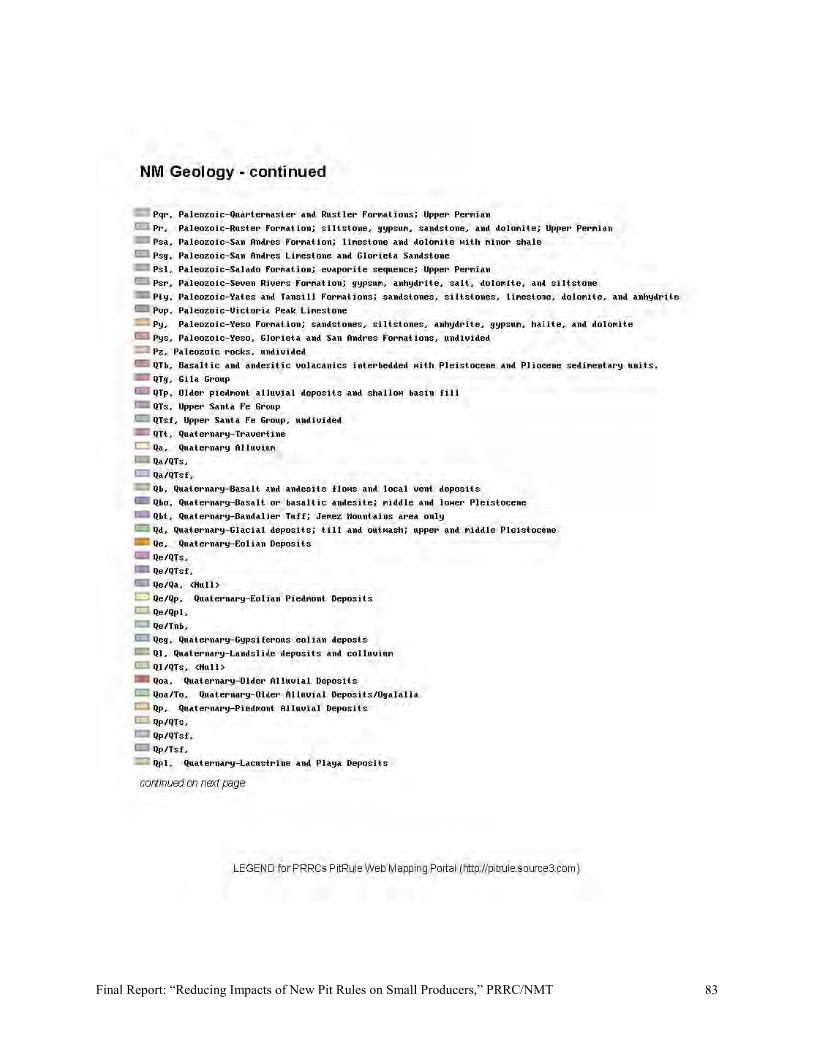
Final Report: “Reducing Impacts of New Pit Rules on Small Producers,” PRRC/NMT
83

Final Report: “Reducing Impacts of New Pit Rules on Small Producers,” PRRC/NMT
84

Final Report: “Reducing Impacts of New Pit Rules on Small Producers,” PRRC/NMT
85