final results presentation - the vault · pdf filefinal results presentation 11 november 2013....
TRANSCRIPT

016
033
141
008
083
166
000
173
226
072
072
072
118
118
118
161
192
218
235
235
235
146
205
220
194
214
155
204
153
255
231
233
241
204
209
225
Table alternative highlight-light
Table alternative highlight-dark
Line chart colour 171
228
245
204
255
204
255
255
000
250
191
143
178
161
199
224
226
241
More colours Main colours
Final Results Presentation
11 November 2013

016
033
141
008
083
166
000
173
226
072
072
072
118
118
118
161
192
218
235
235
235
146
205
220
194
214
155
204
153
255
231
233
241
204
209
225
Table alternative highlight-light
Table alternative highlight-dark
Line chart colour 171
228
245
204
255
204
255
255
000
250
191
143
178
161
199
224
226
241
More colours Main colours
Ben Magara - Chief Executive Officer
Introduction

016
033
141
008
083
166
000
173
226
072
072
072
118
118
118
161
192
218
235
235
235
Lonmin United
016
033
141
008
083
166
000
173
226
072
072
072
118
118
118
161
192
218
235
235
235
146
205
220
194
214
155
204
153
255
231
233
241
204
209
225
Table alternative highlight-light
Table alternative highlight-dark
Line chart colour 171
228
245
204
255
204
255
255
000
250
191
143
178
161
199
224
226
241
More colours Main colours
Key Highlights
LTIFR at 3.50 a 15.9% year on year improvement marred by the 3 fatalities
Production guidance exceeded • Tonnes mined 11,730kt (759,000 mined Platinum ounces - including Pandora) • 751,000 Platinum ounces metal in concentrate, the highest in 6 years • Sales of 696,000 Platinum ounces
Concentrator recoveries at all-time record levels 87.0%
Unit cost increase contained to only 3.8% and productivity increased 6%
Recognition agreement signed with AMCU
Underlying EPS of 20.5 cents per share, up from 3.9 cents in 2012 (restated for Rights Issue)
Capital spend at $159 million in line with guidance in Rand terms
Strengthened financial position - Net cash of $201 million vs. net debt of $421 million at September 2012
4 An exceptional year: Exceeding guidance & Renewal Plan

016
033
141
008
083
166
000
173
226
072
072
072
118
118
118
161
192
218
235
235
235
146
205
220
194
214
155
204
153
255
231
233
241
204
209
225
Table alternative highlight-light
Table alternative highlight-dark
Line chart colour 171
228
245
204
255
204
255
255
000
250
191
143
178
161
199
224
226
241
More colours Main colours
Simon Scott - Chief Financial Officer
Operational Review
016
033
141
008
083
166
000
173
226
072
072
072
118
118
118
161
192
218
235
235
235
146
205
220
194
214
155
204
153
255
231
233
241
204
209
225
Table alternative highlight-light
Table alternative highlight-dark
Line chart colour 171
228
245
204
255
204
255
255
000
250
191
143
178
161
199
224
226
241
More colours Main colours
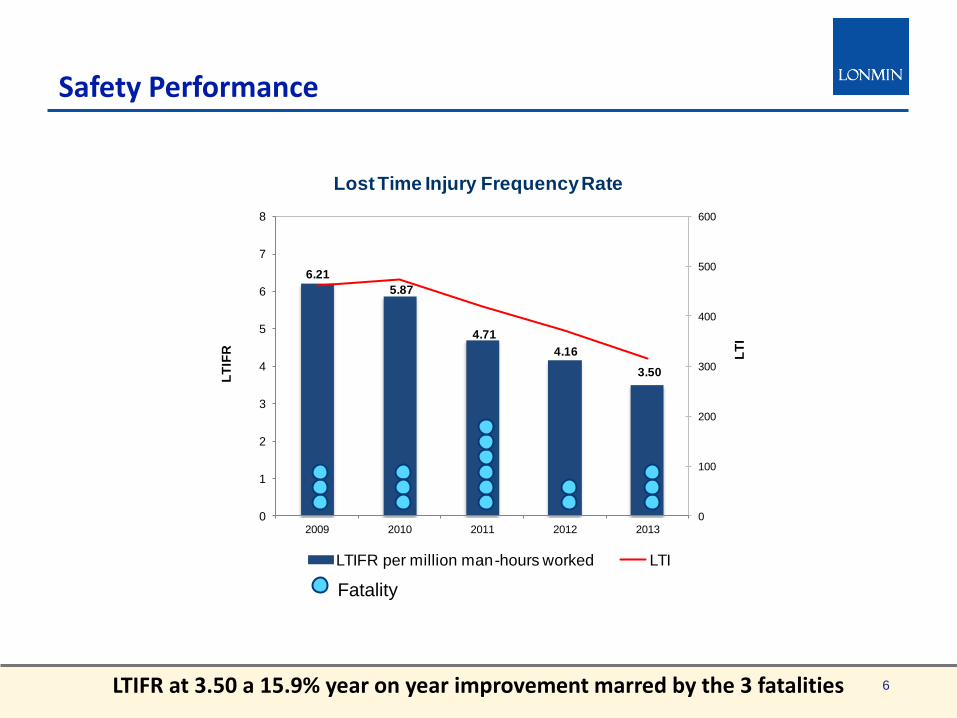
Safety Performance
6 LTIFR at 3.50 a 15.9% year on year improvement marred by the 3 fatalities
6.21
5.87
4.71
4.16
3.50
0
100
200
300
400
500
600
0
1
2
3
4
5
6
7
8
2009 2010 2011 2012 2013
LT
I
LT
IFR
Lost Time Injury Frequency Rate
LTIFR per million man-hours worked LTI
Fatality

016
033
141
008
083
166
000
173
226
072
072
072
118
118
118
161
192
218
235
235
235
146
205
220
194
214
155
204
153
255
231
233
241
204
209
225
Table alternative highlight-light
Table alternative highlight-dark
Line chart colour 171
228
245
204
255
204
255
255
000
250
191
143
178
161
199
224
226
241
More colours Main colours
7
Mining Operational Performance
0
2
4
6
8
10
12
2009 2010 2011 2012 2013
To
nn
es
(millio
ns)
Total Tonnes Mined - Annual Trend
Marikana underground Marikana opencast Pandora opencast
Pandora underground Limpopo
Mining output momentum restored
016
033
141
008
083
166
000
173
226
072
072
072
118
118
118
161
192
218
235
235
235
146
205
220
194
214
155
204
153
255
231
233
241
204
209
225
Table alternative highlight-light
Table alternative highlight-dark
Line chart colour 171
228
245
204
255
204
255
255
000
250
191
143
178
161
199
224
226
241
More colours Main colours
8
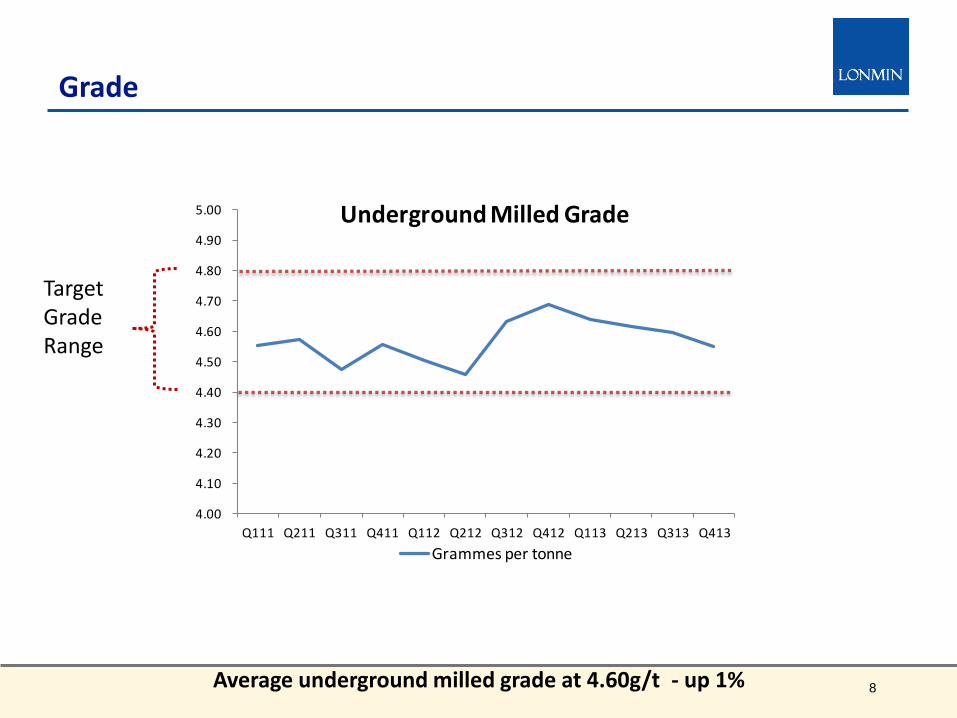
Grade
Target Grade Range
Average underground milled grade at 4.60g/t - up 1%
4.00
4.10
4.20
4.30
4.40
4.50
4.60
4.70
4.80
4.90
5.00
Q111 Q211 Q311 Q411 Q112 Q212 Q312 Q412 Q113 Q213 Q313 Q413
Underground Milled Grade
Grammes per tonne
016
033
141
008
083
166
000
173
226
072
072
072
118
118
118
161
192
218
235
235
235
146
205
220
194
214
155
204
153
255
231
233
241
204
209
225
Table alternative highlight-light
Table alternative highlight-dark
Line chart colour 171
228
245
204
255
204
255
255
000
250
191
143
178
161
199
224
226
241
More colours Main colours
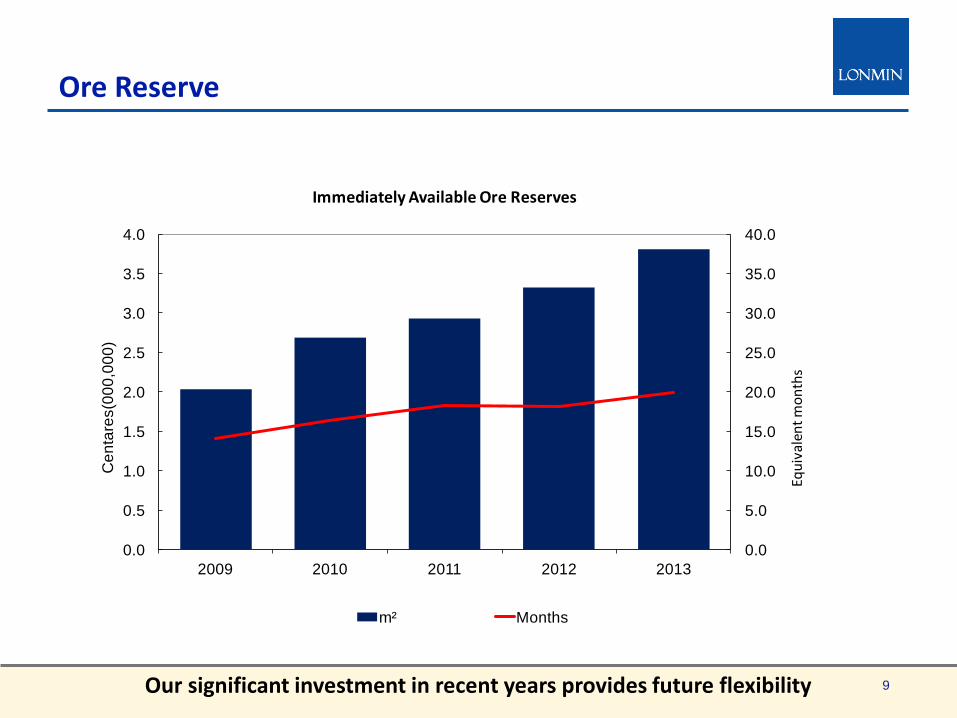
Ore Reserve
9 Our significant investment in recent years provides future flexibility
0.0
5.0
10.0
15.0
20.0
25.0
30.0
35.0
40.0
0.0
0.5
1.0
1.5
2.0
2.5
3.0
3.5
4.0
2009 2010 2011 2012 2013
Equ
ival
ent
mo
nth
s
Ce
nta
res(0
00
,00
0)
Immediately Available Ore Reserves
m² Months
016
033
141
008
083
166
000
173
226
072
072
072
118
118
118
161
192
218
235
235
235
146
205
220
194
214
155
204
153
255
231
233
241
204
209
225
Table alternative highlight-light
Table alternative highlight-dark
Line chart colour 171
228
245
204
255
204
255
255
000
250
191
143
178
161
199
224
226
241
More colours Main colours
Processing Highlights
10
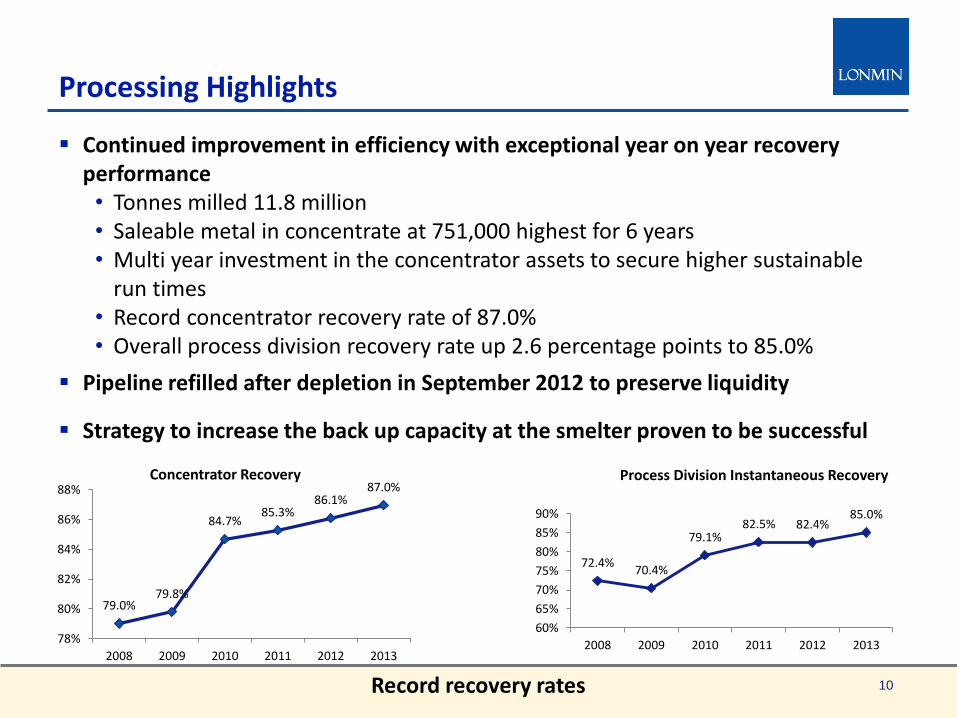
Continued improvement in efficiency with exceptional year on year recovery performance • Tonnes milled 11.8 million • Saleable metal in concentrate at 751,000 highest for 6 years • Multi year investment in the concentrator assets to secure higher sustainable
run times • Record concentrator recovery rate of 87.0% • Overall process division recovery rate up 2.6 percentage points to 85.0%
Pipeline refilled after depletion in September 2012 to preserve liquidity
Strategy to increase the back up capacity at the smelter proven to be successful
72.4% 70.4%
79.1% 82.5% 82.4%
85.0%
60%
65%
70%
75%
80%
85%
90%
2008 2009 2010 2011 2012 2013
Process Division Instantaneous Recovery
79.0% 79.8%
84.7% 85.3%
86.1% 87.0%
78%
80%
82%
84%
86%
88%
2008 2009 2010 2011 2012 2013
Concentrator Recovery
Record recovery rates
016
033
141
008
083
166
000
173
226
072
072
072
118
118
118
161
192
218
235
235
235
146
205
220
194
214
155
204
153
255
231
233
241
204
209
225
Table alternative highlight-light
Table alternative highlight-dark
Line chart colour 171
228
245
204
255
204
255
255
000
250
191
143
178
161
199
224
226
241
More colours Main colours
Simon Scott - Chief Financial Officer
Financial Review
016
033
141
008
083
166
000
173
226
072
072
072
118
118
118
161
192
218
235
235
235
146
205
220
194
214
155
204
153
255
231
233
241
204
209
225
Table alternative highlight-light
Table alternative highlight-dark
Line chart colour 171
228
245
204
255
204
255
255
000
250
191
143
178
161
199
224
226
241
More colours Main colours
12
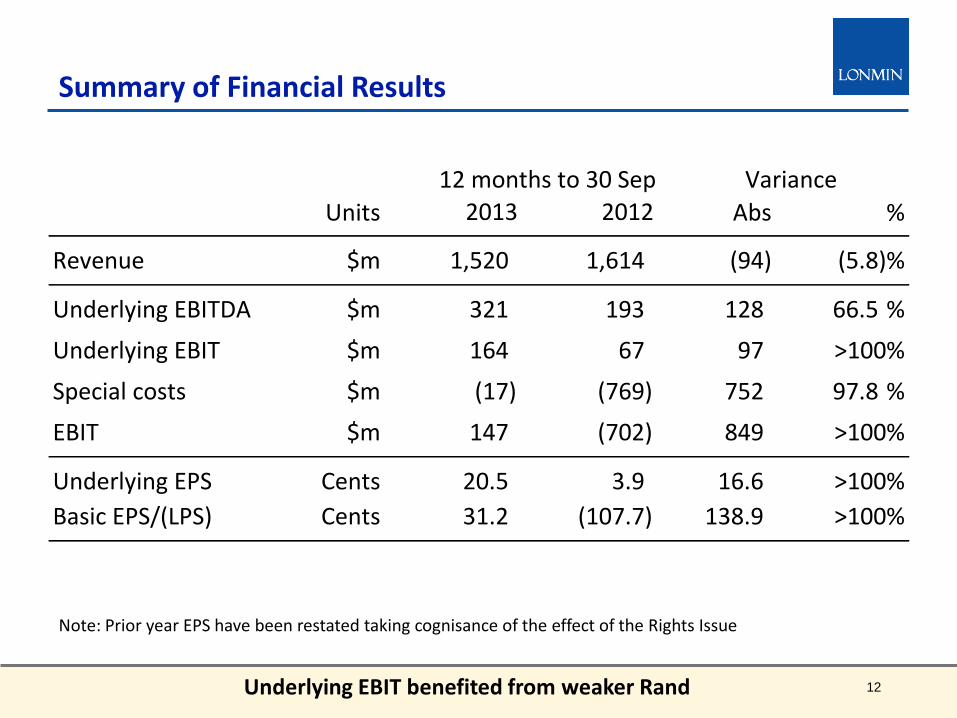
Summary of Financial Results
Underlying EBIT benefited from weaker Rand
Note: Prior year EPS have been restated taking cognisance of the effect of the Rights Issue
Units 2013 2012 Abs %
Revenue $m 1,520 1,614 (94) (5.8)%
Underlying EBITDA $m 321 193 128 66.5 %
Underlying EBIT $m 164 67 97 >100%
Special costs $m (17) (769) 752 97.8 %
EBIT $m 147 (702) 849 >100%
Underlying EPS Cents 20.5 3.9 16.6 >100%
Basic EPS/(LPS) Cents 31.2 (107.7) 138.9 >100%
Variance12 months to 30 Sep

016
033
141
008
083
166
000
173
226
072
072
072
118
118
118
161
192
218
235
235
235
146
205
220
194
214
155
204
153
255
231
233
241
204
209
225
Table alternative highlight-light
Table alternative highlight-dark
Line chart colour 171
228
245
204
255
204
255
255
000
250
191
143
178
161
199
224
226
241
More colours Main colours
Renewal Plan
Full year highlights
• Production and sales targets exceeded coupled with record safety achievements
• Restructuring complete and on track to deliver R200 million annualised savings from 2014
• Delivered R110 million TCO savings versus a target of R100 million
• Capital spend contained at $159 million / R1.5 billion – within guidance
• Mining division capital spend limited to $99 million
• Process division spent $52 million
• Social Labour Plan / other commitments including housing $8 million
Board has recommended no dividend this year in line with Renewal Plan
13 Exceeding the renewal plan

016
033
141
008
083
166
000
173
226
072
072
072
118
118
118
161
192
218
235
235
235
146
205
220
194
214
155
204
153
255
231
233
241
204
209
225
Table alternative highlight-light
Table alternative highlight-dark
Line chart colour 171
228
245
204
255
204
255
255
000
250
191
143
178
161
199
224
226
241
More colours Main colours
Disclosure Change: Cost Reporting
More inclusive and transparent reporting
Included in reports going forward • Detailed disclosure on cost of sales as it relates to the PGM operations
• Excludes Akanani, Exploration and London companies
Unit cost measure changed to “Cost of Production” replacing C1 unit cost • Difference is that Cost of Production includes sales and marketing costs, audit
costs, capital administration costs and management costs from our South African head office
14 Primary costs disclosed
016
033
141
008
083
166
000
173
226
072
072
072
118
118
118
161
192
218
235
235
235
146
205
220
194
214
155
204
153
255
231
233
241
204
209
225
Table alternative highlight-light
Table alternative highlight-dark
Line chart colour 171
228
245
204
255
204
255
255
000
250
191
143
178
161
199
224
226
241
More colours Main colours
15
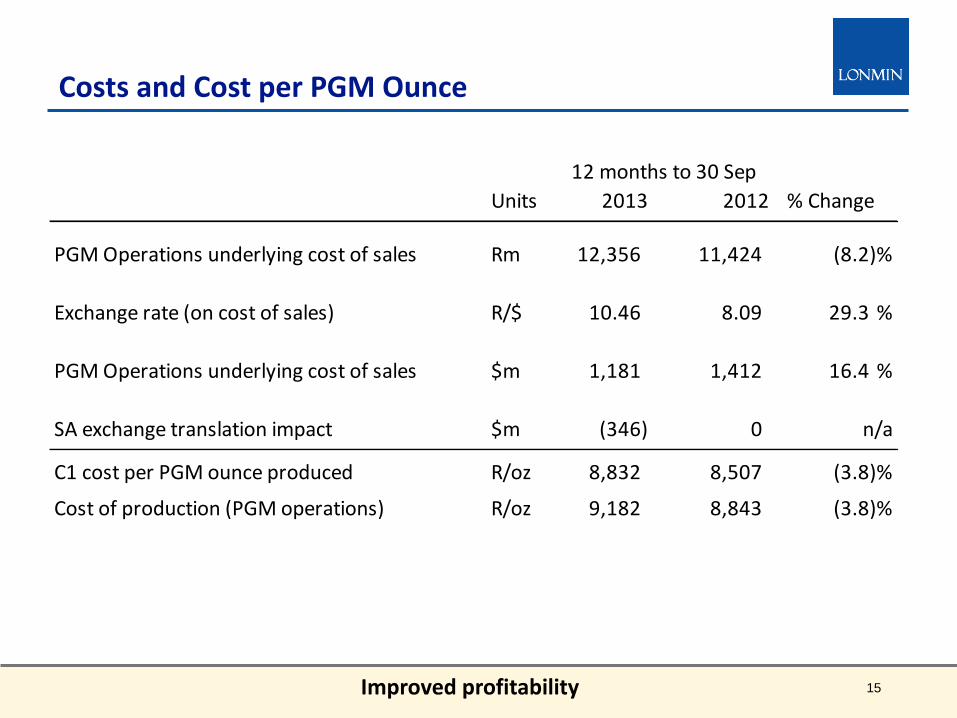
Costs and Cost per PGM Ounce
Units 2013 2012 % Change
PGM Operations underlying cost of sales Rm 12,356 11,424 (8.2)%
Exchange rate (on cost of sales) R/$ 10.46 8.09 29.3 %
PGM Operations underlying cost of sales $m 1,181 1,412 16.4 %
SA exchange translation impact $m (346) 0 n/a
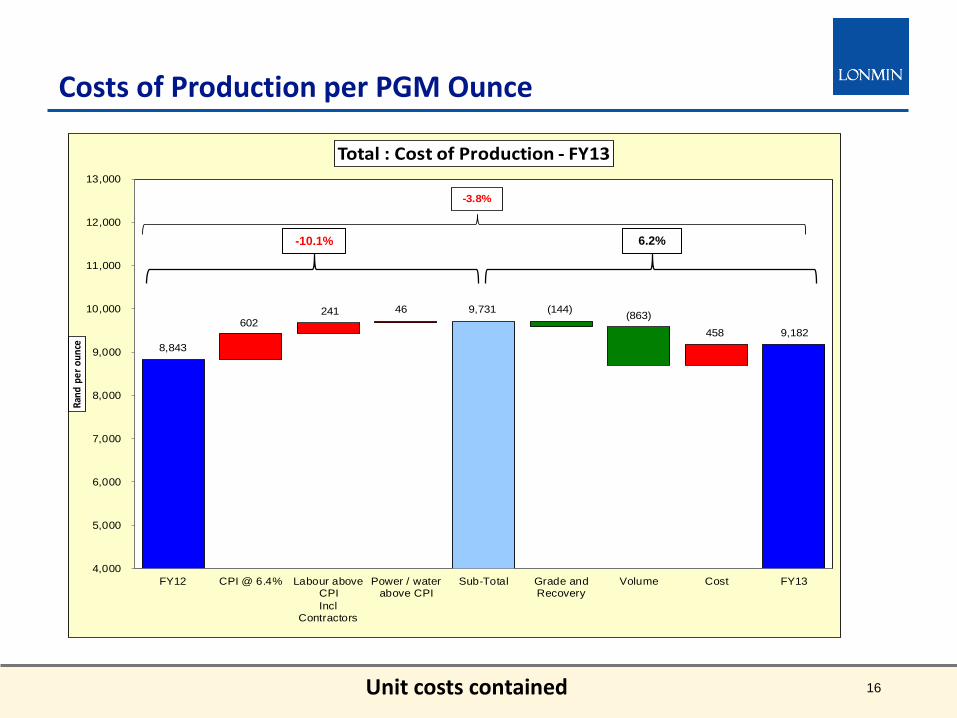
C1 cost per PGM ounce produced R/oz 8,832 8,507 (3.8)%
Cost of production (PGM operations) R/oz 9,182 8,843 (3.8)%
12 months to 30 Sep
Improved profitability
016
033
141
008
083
166
000
173
226
072
072
072
118
118
118
161
192
218
235
235
235
146
205
220
194
214
155
204
153
255
231
233
241
204
209
225
Table alternative highlight-light
Table alternative highlight-dark
Line chart colour 171
228
245
204
255
204
255
255
000
250
191
143
178
161
199
224
226
241
More colours Main colours
16
Costs of Production per PGM Ounce
8,843
602 241 46 9,731 (144)
(863)
458 9,182
4,000
5,000
6,000
7,000
8,000
9,000
10,000
11,000
12,000
13,000
FY12 CPI @ 6.4% Labour aboveCPI
InclContractors
Power / waterabove CPI
Sub-Total Grade andRecovery
Volume Cost FY13
Rand
per
oun
ce
Total : Cost of Production - FY13
-3.8%
-10.1% 6.2%
Unit costs contained

016
033
141
008
083
166
000
173
226
072
072
072
118
118
118
161
192
218
235
235
235
146
205
220
194
214
155
204
153
255
231
233
241
204
209
225
Table alternative highlight-light
Table alternative highlight-dark
Line chart colour 171
228
245
204
255
204
255
255
000
250
191
143
178
161
199
224
226
241
More colours Main colours
17
Underlying EBIT Variance Analysis
EBIT impacted by weaker Rand
67
393 (90)
4 (11) 3
194 (396)
164
0
100
200
300
400
500
600
700
800
PY12 Stock movement PGM volume PGM price Base metals PGM Mix FX incltranslation fx
Costs & depn(like-for-like)
FY13
$m
2013 positive stock movements as a result of refilling the pipeline and the stock lock-up combined with a stock decrease in 2012
Favourable foreign exchange impact. Rand weakened from
R8.30 to R9.99
Higher production volumes resulting in higher costs

016
033
141
008
083
166
000
173
226
072
072
072
118
118
118
161
192
218
235
235
235
146
205
220
194
214
155
204
153
255
231
233
241
204
209
225
Table alternative highlight-light
Table alternative highlight-dark
Line chart colour 171
228
245
204
255
204
255
255
000
250
191
143
178
161
199
224
226
241
More colours Main colours
(421)
767
304 (2) (32)(189)
(24)(33)
(159)
(11) 201
(500)
(400)
(300)
(200)
(100)
-
100
200
300
400
500
600
700
800
900
1,000
1,100
1,200
Opening net
debt
Rights Issue EBITDA Debtors Creditors Stock Deferred
Revenue
Net
financing
Capex Dividends Closing net
cash
$m
$223m
18
Net Cash
Rights Issue proceeds used to pay down debts
• Replenishment of the pipeline stock which was depleted in September 2012 to protect liquidity
• Inventory lock up due to smelter incident in 2013 and higher levels of finished goods

016
033
141
008
083
166
000
173
226
072
072
072
118
118
118
161
192
218
235
235
235
146
205
220
194
214
155
204
153
255
231
233
241
204
209
225
Table alternative highlight-light
Table alternative highlight-dark
Line chart colour 171
228
245
204
255
204
255
255
000
250
191
143
178
161
199
224
226
241
More colours Main colours
Ben Magara - Chief Executive Officer
Market Outlook
016
033
141
008
083
166
000
173
226
072
072
072
118
118
118
161
192
218
235
235
235
146
205
220
194
214
155
204
153
255
231
233
241
204
209
225
Table alternative highlight-light
Table alternative highlight-dark
Line chart colour 171
228
245
204
255
204
255
255
000
250
191
143
178
161
199
224
226
241
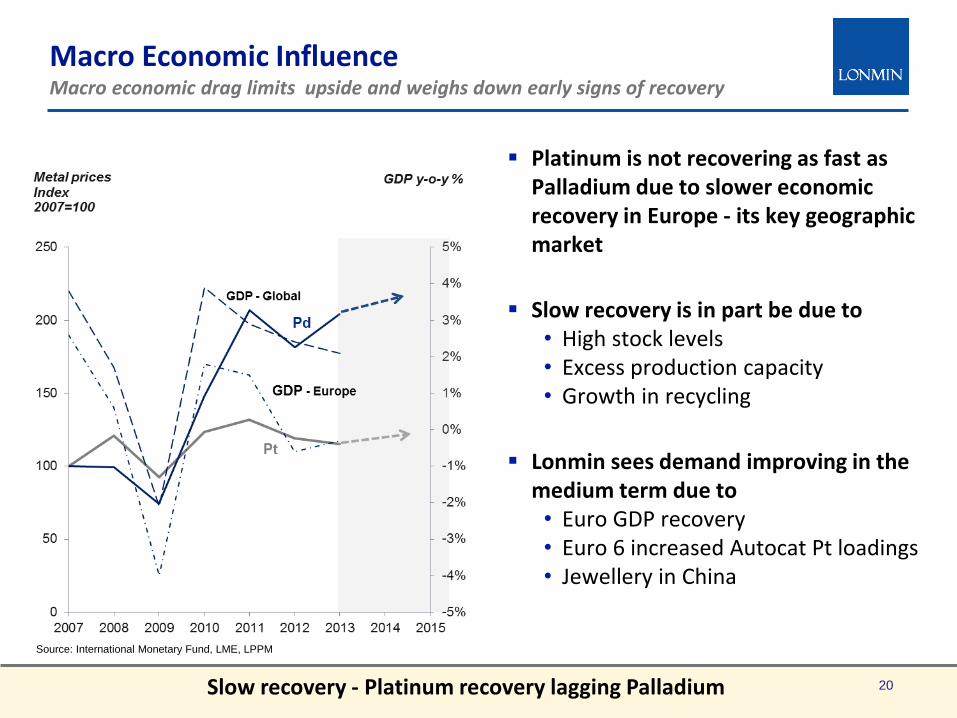
More colours Main colours Macro Economic Influence Macro economic drag limits upside and weighs down early signs of recovery
Source: International Monetary Fund, LME, LPPM
Platinum is not recovering as fast as Palladium due to slower economic recovery in Europe - its key geographic market
Slow recovery is in part be due to • High stock levels • Excess production capacity • Growth in recycling
Lonmin sees demand improving in the medium term due to • Euro GDP recovery • Euro 6 increased Autocat Pt loadings • Jewellery in China
20 Slow recovery - Platinum recovery lagging Palladium
016
033
141
008
083
166
000
173
226
072
072
072
118
118
118
161
192
218
235
235
235
146
205
220
194
214
155
204
153
255
231
233
241
204
209
225
Table alternative highlight-light
Table alternative highlight-dark
Line chart colour 171
228
245
204
255
204
255
255
000
250
191
143
178
161
199
224
226
241
More colours Main colours
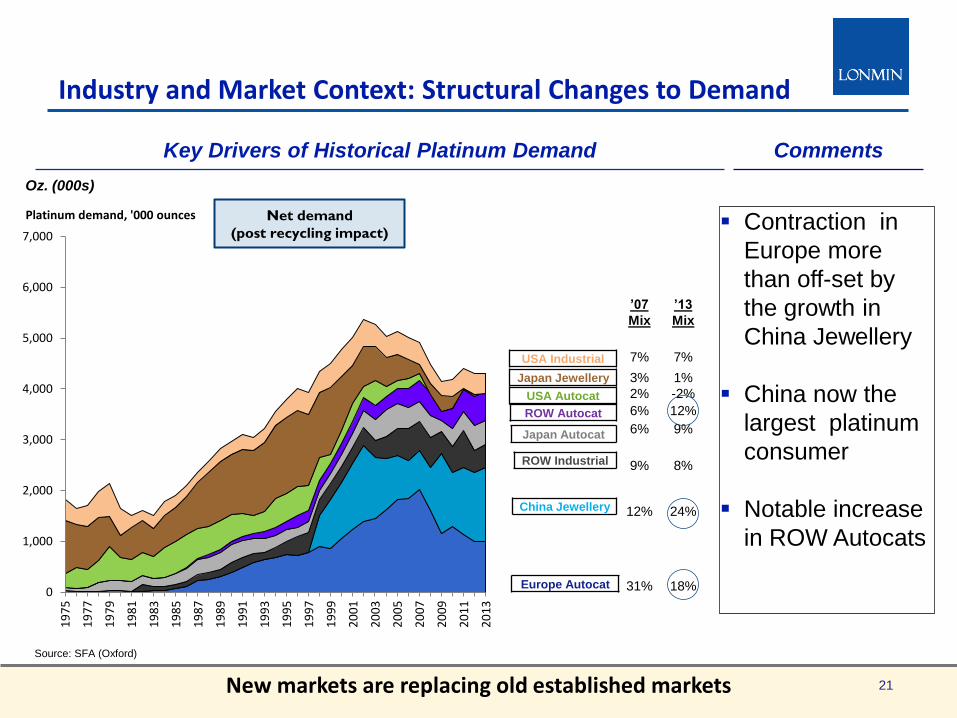
Industry and Market Context: Structural Changes to Demand
Source: SFA (Oxford)
Oz. (000s)
Key Drivers of Historical Platinum Demand
Europe Autocat
China Jewellery
ROW Industrial
Japan Autocat
ROW Autocat
USA Autocat
Japan Jewellery
USA Industrial
Comments
’07
Mix
7%
3%
2%
6%
6%
9%
12%
31%
New markets are replacing old established markets 21
0
1,000
2,000
3,000
4,000
5,000
6,000
7,000
19
75
19
77
19
79
19
81
19
83
19
85
19
87
19
89
19
91
19
93
19
95
19
97
19
99
20
01
20
03
20
05
20
07
20
09
20
11
20
13
Platinum demand, '000 ounces Net demand
(post recycling impact)
’13
Mix
7%
1%
-2%
12%
9%
8%
24%
18%
Contraction in
Europe more
than off-set by
the growth in
China Jewellery
China now the
largest platinum
consumer
Notable increase
in ROW Autocats

016
033
141
008
083
166
000
173
226
072
072
072
118
118
118
161
192
218
235
235
235
146
205
220
194
214
155
204
153
255
231
233
241
204
209
225
Table alternative highlight-light
Table alternative highlight-dark
Line chart colour 171
228
245
204
255
204
255
255
000
250
191
143
178
161
199
224
226
241
More colours Main colours
Long Term PGM fundamentals attractive due to captive demand
PGM prices have been held back by fragile European auto markets and near-term over supply
Primary supply is likely to contract in the short term, primarily as a result of disruption and restructuring in SA
Passenger car and heavy-duty on- and non-road emission legislation ensures captive demand:
• Euro 6 in Europe which started in 2013 (HDV), but will include light duty and non-road (Tier 4) from 2014
• California LEVIII (2014), USA-wide Tier 3 (2017) • Euro 6 in South Korea (2014, 22% diesel market) • India role out of Euro 5 eq. for passenger cars possible
before the end of the decade (40% diesel market)
Medium to long-term outlook for vehicle sales in emerging markets and recovering industrial demand to be positive
Even excluding Euro 5 loadings upside, platinum demand in India is forecast to double by 2018
Other demand drivers such as Chinese jewellery demand to remain positive
Emission Regulations
2014-2015 still tough with emission legislation leading longer term recovery
22
Bharat 5
P P8
Euro 6
Bharat 5
Comments
Timing unconfirmed

016
033
141
008
083
166
000
173
226
072
072
072
118
118
118
161
192
218
235
235
235
146
205
220
194
214
155
204
153
255
231
233
241
204
209
225
Table alternative highlight-light
Table alternative highlight-dark
Line chart colour 171
228
245
204
255
204
255
255
000
250
191
143
178
161
199
224
226
241
More colours Main colours
Ben Magara - Chief Executive Officer
Strategic Imperatives
016
033
141
008
083
166
000
173
226
072
072
072
118
118
118
161
192
218
235
235
235
146
205
220
194
214
155
204
153
255
231
233
241
204
209
225
Table alternative highlight-light
Table alternative highlight-dark
Line chart colour 171
228
245
204
255
204
255
255
000
250
191
143
178
161
199
224
226
241
More colours Main colours
24
Key Management Themes
Our People and Relationships
Operational Credibility and Excellence
Value Optimisation Management (VOMA)
Our Sustainability and Social Agenda
Our Focus Areas:

016
033
141
008
083
166
000
173
226
072
072
072
118
118
118
161
192
218
235
235
235
146
205
220
194
214
155
204
153
255
231
233
241
204
209
225
Table alternative highlight-light
Table alternative highlight-dark
Line chart colour 171
228
245
204
255
204
255
255
000
250
191
143
178
161
199
224
226
241
More colours Main colours
Our People and Relationships A stable and predictable industrial relations environment is essential for business and requires a step change in approach
Reclaiming our relationship with employees and their wellbeing has become business critical
Continuing to reclaim our role as managers and rebuilding trust with employees Improving wellbeing and living conditions for employees and communities
Mining Charter opportunity to increase equity participation for employees and
communities so that they feel the partnership Greater collaboration with government through public-private partnerships to
accelerate delivery of social infrastructure Enhancing participation in key industry and stakeholder forums
• CEO elimination of fatalities forum • ICMM • Market development and emissions legislation advocacy
25
016
033
141
008
083
166
000
173
226
072
072
072
118
118
118
161
192
218
235
235
235
146
205
220
194
214
155
204
153
255
231
233
241
204
209
225
Table alternative highlight-light
Table alternative highlight-dark
Line chart colour 171
228
245
204
255
204
255
255
000
250
191
143
178
161
199
224
226
241
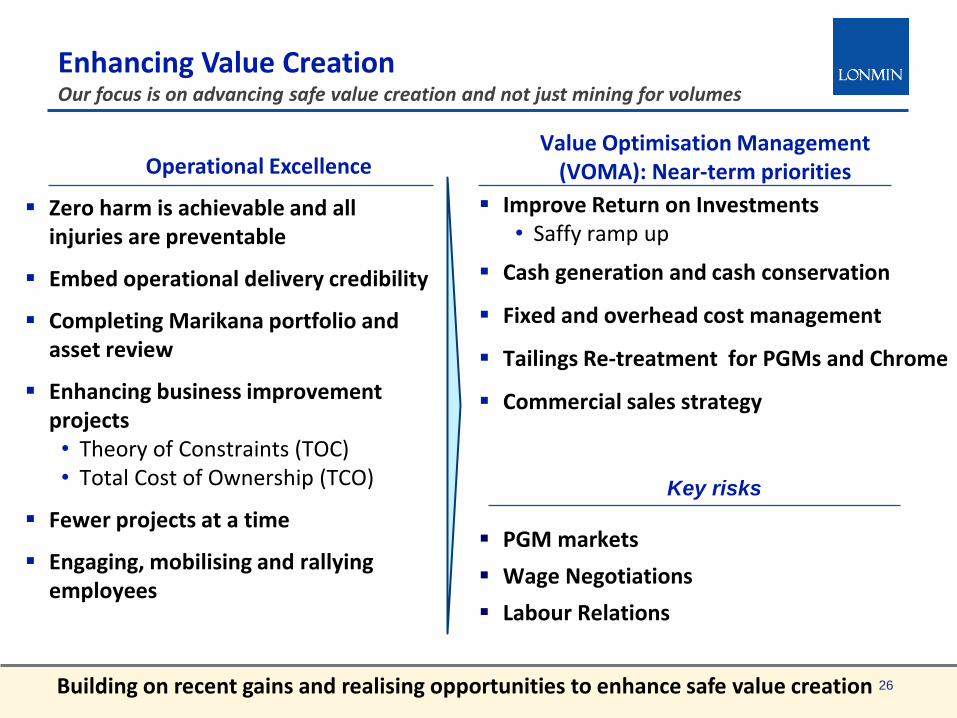
More colours Main colours Enhancing Value Creation Our focus is on advancing safe value creation and not just mining for volumes
Value Optimisation Management (VOMA): Near-term priorities Operational Excellence
Zero harm is achievable and all injuries are preventable
Embed operational delivery credibility
Completing Marikana portfolio and asset review
Enhancing business improvement projects • Theory of Constraints (TOC) • Total Cost of Ownership (TCO)
Fewer projects at a time
Engaging, mobilising and rallying employees
Building on recent gains and realising opportunities to enhance safe value creation
Key risks
Improve Return on Investments • Saffy ramp up
Cash generation and cash conservation
Fixed and overhead cost management
Tailings Re-treatment for PGMs and Chrome
Commercial sales strategy
PGM markets
Wage Negotiations
Labour Relations
26

016
033
141
008
083
166
000
173
226
072
072
072
118
118
118
161
192
218
235
235
235
146
205
220
194
214
155
204
153
255
231
233
241
204
209
225
Table alternative highlight-light
Table alternative highlight-dark
Line chart colour 171
228
245
204
255
204
255
255
000
250
191
143
178
161
199
224
226
241
More colours Main colours
Saffy Ramp Up Our ore reserves now allow us to increase our return on investment by moving crews from low margin shafts
27
Source: Lonmin
Saffy Available Ore Reserves Trend
We Doubled Available Ore Reserves in 2013
Saffy Operational Trend
Ramp up Drives Costs Down
Tonnes Hoisted (000)
500
550
600
650
700
750
800
850
900
950
1,000
600
800
1,000
1,200
1,400
1,600
1,800
2,000
'09A '10A '11A '12A '13A '14F '15F
Shaft Head Costs1 (ZAR/Tonne) M2 (000)
0
150
300
450
600
750
900
'09A '10A '11A '12A '13A '14F '15F
Drive to improve return on investment

016
033
141
008
083
166
000
173
226
072
072
072
118
118
118
161
192
218
235
235
235
146
205
220
194
214
155
204
153
255
231
233
241
204
209
225
Table alternative highlight-light
Table alternative highlight-dark
Line chart colour 171
228
245
204
255
204
255
255
000
250
191
143
178
161
199
224
226
241
More colours Main colours
Our Sustainability and Social Agenda Advancing our social and sustainability efforts to enhance our license to operate requires that we create value for all stakeholders through effective collaboration
Pursuing win-win solutions on the basis that a thriving business makes it possible
A cornerstone of the Renewal Plan
Employee Value Proposition
Community Value Proposition
Financial Value Proposition
What we have done
What we are doing
Contributed land for Integrated Human Settlements (employees and communities)
At least ZAR0.5 billion in five years to housing and community bulk services
Building bridges to enhance trust
Share economic realities (profits make it possible)
8% equity for ESOP and community trusts by December 2014
Championing collaboration through PPPs
Embedding SHE stewardship
28
Five Board Initiatives
016
033
141
008
083
166
000
173
226
072
072
072
118
118
118
161
192
218
235
235
235
146
205
220
194
214
155
204
153
255
231
233
241
204
209
225
Table alternative highlight-light
Table alternative highlight-dark
Line chart colour 171
228
245
204
255
204
255
255
000
250
191
143
178
161
199
224
226
241
More colours Main colours Conclusion & Guidance Enhancing value will help Lonmin in building bridges of trust and success
Focus on operational excellence and value optimisation
• Raise the bar on employee engagement
• Improving living conditions of employees
• Retain balance sheet integrity
Guidance
• 2014 sales guidance in excess of 750,000 Platinum ounces
• Unit cost increase less than wage inflation
• Capital allocation: 2014 - $210 million
• Achieve 26% BEE ownership
29 Building for the future from an established platform
016
033
141
008
083
166
000
173
226
072
072
072
118
118
118
161
192
218
235
235
235
146
205
220
194
214
155
204
153
255
231
233
241
204
209
225
Table alternative highlight-light
Table alternative highlight-dark
Line chart colour 171
228
245
204
255
204
255
255
000
250
191
143
178
161
199
224
226
241
More colours Main colours
Appendices
016
033
141
008
083
166
000
173
226
072
072
072
118
118
118
161
192
218
235
235
235
146
205
220
194
214
155
204
153
255
231
233
241
204
209
225
Table alternative highlight-light
Table alternative highlight-dark
Line chart colour 171
228
245
204
255
204
255
255
000
250
191
143
178
161
199
224
226
241
More colours Main colours
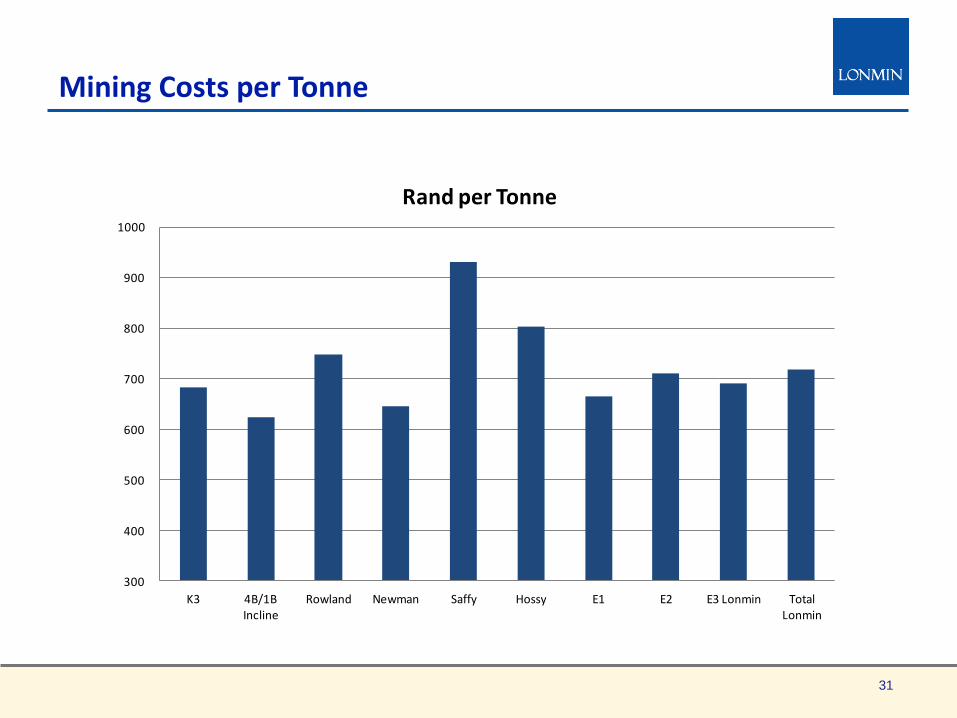
Mining Costs per Tonne
31
300
400
500
600
700
800
900
1000
K3 4B/1B Incline
Rowland Newman Saffy Hossy E1 E2 E3 Lonmin Total Lonmin
Rand per Tonne

016
033
141
008
083
166
000
173
226
072
072
072
118
118
118
161
192
218
235
235
235
146
205
220
194
214
155
204
153
255
231
233
241
204
209
225
Table alternative highlight-light
Table alternative highlight-dark
Line chart colour 171
228
245
204
255
204
255
255
000
250
191
143
178
161
199
224
226
241
More colours Main colours
Management Team
32
Simon Scott Chief Financial Officer
Simon joined Lonmin and the Board in September 2010,
became CFO in November 2010 and was appointed as Acting
CEO on 24 August 2012 in view of Mr Farmer’s illness. He is
a graduate with accounting and commerce degrees from the
University of the Witwatersrand, and has also attended the
management development program at the University of Cape
Town. A South African registered chartered accountant, he
has held a number of financial management roles in South
Africa with local and global employers including over eight
years with Anglo American. Most recently he was CFO of the
JSE-listed Aveng Limited, a globally active engineering and
construction group with significant involvement in the mining
sector.
Mark Munroe EVP Mining and Group Safety
Mark joined Lonmin in March 2008 in the Mining business,
becoming VP Capital Projects & Engineering before being
appointed as EVP Mining in June 2009. Mark joined Lonmin from
DRDGold, where he spent six years, holding a number of senior
management positions including General Manager of DRDGold
and CEO of DRDCapital. Prior to that, he worked for AngloGold for
12 years. He is a mining engineer and also has a degree in
economics.
Thandeka Ncube Business Transformation Manager,
Shanduka Resources
Thandeka works with Shanduka’s investee companies advising on
transformation and broad based empowerment. She holds a Social
Sciences degree from the City University of New York and an MBA
from Henley Business School. She began her career working with
various government institutions, developing strategy and policy for
small and medium enterprises, then joined the retail banking side of
Standard Bank, where she again focussed on the needs of SMEs.
Ben Magara Chief Executive Officer
Ben joined the Company and Board as Chief Executive on 1 July
2013. He is a graduate Mining Engineer from the University of
Zimbabwe and has attended various management programmes
including the Accelerated Development Programme at the London
Business School, UK and the AMP at GIBS, SA. Ben has extensive
mining experience in both underground and surface mining as well
as soft and hard rock mining. He also has experience in the energy
and logistics industries. Ben was the Chief Executive Officer of
Anglo Coal South Africa and the Executive Head responsible for
Engineering and Capital Projects at Anglo Platinum. Ben is a non-
executive director of Foskor and was previously a director of Anglo
American South Africa (2006-2013), was Chairman of Richards Bay
Coal Terminal and the Eskom 2008 Coal Working Group. He is also
a Trustee of the UNISA Foundation and is the Chairman of the
Board of Trustees at St Peters Prep School Foundation.
Abey Kgotle EVP Human Resources
Abey joined Lonmin in April 2008 as Senior Manager
Human Capital. He held several roles including
Executive Manager External Affairs and Executive
Manager Human Capital. He was appointed Executive
Vice President Human Resources in September 2013.
Prior to joining Lonmin, he worked in executive human
resources roles at GrafTech South Africa, City of
Johannesburg, Samancor Manganese and Denel.
Abey has extensive experience in human resource
management, labour relations, community investment
and stakeholder relations. He holds a Bachelor of
Social Sciences from the University of the North West
and a Masters Diploma in Human Resource
Management. Abey has also attended the Global
Executive Development Programme at Pretoria
University’s Gordon Institute of Business Science.
016
033
141
008
083
166
000
173
226
072
072
072
118
118
118
161
192
218
235
235
235
146
205
220
194
214
155
204
153
255
231
233
241
204
209
225
Table alternative highlight-light
Table alternative highlight-dark
Line chart colour 171
228
245
204
255
204
255
255
000
250
191
143
178
161
199
224
226
241
More colours Main colours
Management Team
33
Lerato Molebatsi
EVP Communications and
Public Affairs
Lerato joined Lonmin from the Department of Labour, where she was the
Deputy Director General; Corporate Services. Prior to joining the
Department of Labour in September 2011, Lerato worked in senior
management positions at Alexander Forbes and Old Mutual. She holds a
Bachelor of Arts degree in Psychology from the University of the North and
a Post Graduate Diploma in Rural Policy Development Policy and
Management from the University of Witwatersrand. She has also attended
the Senior Management Development programme at University of
Stellenbosch.
Albert Jamieson
Chief Commercial Officer
Albert joined Lonmin in 1989 after 8 years at Impala Platinum, where
he was responsible for their concentrator operations. At Lonmin, he
has held a number of senior management and executive positions in
the mine production and commercial areas of the business including
responsibility for investments in Africa, South America, North
America, Australia and Japan. The commercial portfolio currently
comprises business development, strategy, marketing and sales,
exploration, legal and life of business planning. Albert has a BSc in
Minerals Engineering from the University of Birmingham and an MBA
from the University of Cape Town.
Natascha Viljoen
EVP Processing and Sustainability
Natascha joined Lonmin in 2008 from BHP Billiton, where she was
General Manager for Klipspruit mine. Her initial responsibility was for
managing Lonmin’s concentrators, and in May 2011 she was
promoted to her current role, covering all concentrating, smelting
and refining operations. She holds an engineering degree and is
currently busy with an executive MBA at University of Cape Town.
Her career stretches over various commodities and disciplines in the
mining industry with 9 years in senior management roles. Before
BHP Billiton she held positions with Anglo American Platinum and
AngloGold.
Barnard Mokwena
EVP Transformation
Barnard joined Lonmin in October 2005 as a Group Manager and
was subsequently promoted to his current position. He previously
worked in senior management positions in a range of sectors for a
number of companies including Sentech, the South African Rail
Commuter Corporation and the National Lottery Operator
(UTHINGO). He holds a BA Phil from Urban Pontifical University,
an MA Licentiate from Gregorian University and an EDP from
Pretoria.
016
033
141
008
083
166
000
173
226
072
072
072
118
118
118
161
192
218
235
235
235
146
205
220
194
214
155
204
153
255
231
233
241
204
209
225
Table alternative highlight-light
Table alternative highlight-dark
Line chart colour 171
228
245
204
255
204
255
255
000
250
191
143
178
161
199
224
226
241
More colours Main colours
34
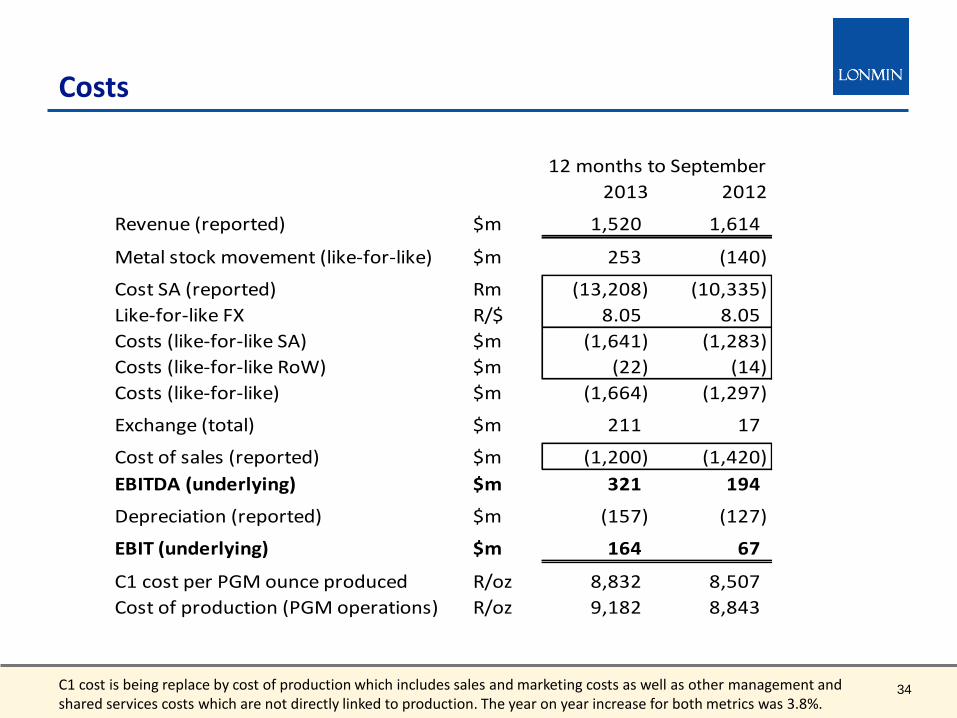
Costs
C1 cost is being replace by cost of production which includes sales and marketing costs as well as other management and shared services costs which are not directly linked to production. The year on year increase for both metrics was 3.8%.
2013 2012
Revenue (reported) $m 1,520 1,614
Metal stock movement (like-for-like) $m 253 (140)
Cost SA (reported) Rm (13,208) (10,335)
Like-for-like FX R/$ 8.05 8.05
Costs (like-for-like SA) $m (1,641) (1,283)
Costs (like-for-like RoW) $m (22) (14)
Costs (like-for-like) $m (1,664) (1,297)
Exchange (total) $m 211 17
Cost of sales (reported) $m (1,200) (1,420)
EBITDA (underlying) $m 321 194
Depreciation (reported) $m (157) (127)
EBIT (underlying) $m 164 67
C1 cost per PGM ounce produced R/oz 8,832 8,507
Cost of production (PGM operations) R/oz 9,182 8,843
12 months to September

016
033
141
008
083
166
000
173
226
072
072
072
118
118
118
161
192
218
235
235
235
146
205
220
194
214
155
204
153
255
231
233
241
204
209
225
Table alternative highlight-light
Table alternative highlight-dark
Line chart colour 171
228
245
204
255
204
255
255
000
250
191
143
178
161
199
224
226
241
More colours Main colours
Current Shaft Life Cycle
Source: Lonmin
Fewer than the ideal number of shafts in steady state 35
016
033
141
008
083
166
000
173
226
072
072
072
118
118
118
161
192
218
235
235
235
146
205
220
194
214
155
204
153
255
231
233
241
204
209
225
Table alternative highlight-light
Table alternative highlight-dark
Line chart colour 171
228
245
204
255
204
255
255
000
250
191
143
178
161
199
224
226
241
More colours Main colours
36
Disclaimer
This presentation, which is personal to the recipient, has been issued by Lonmin. This presentation includes forward-looking statements. All statements other than statements of historical fact included in this announcement, including without limitation those regarding Lonmin's plans, objectives and expected performance, are forward-looking statements. Lonmin has based these forward-looking statements on its current expectations and projections about future events, including numerous assumptions regarding its present and future business strategies, operations, and the environment in which it will operate in the future. Forward-looking statements generally can be identified by the use of forward-looking terminology such as 'ambition', 'may', 'will', 'could', 'would', 'expect', 'intend', 'estimate', 'anticipate', 'believe', 'plan', 'seek' or 'continue', or negative forms or variations of similar terminology. Such forward-looking statements involve known and unknown risks, uncertainties, assumptions and other factors related to Lonmin, including, among other factors: (1) material adverse changes in economic conditions generally or in relevant markets or industries in particular; (2) fluctuations in demand and pricing in the mineral resource industry and fluctuations in exchange rates; (3) future regulatory and legislative actions and conditions affecting Lonmin's operating areas; (4) obtaining and retaining skilled workers and key executives; and (5) acts of war and terrorism. By their nature, forward-looking statements involve risks, uncertainties and assumptions and many relate to factors which are beyond Lonmin‘ control, such as future market conditions and the behaviour of other market participants. Actual results may differ materially from those expressed in forward-looking statements. Given these risks, uncertainties, and assumptions, you are cautioned not to put undue reliance on any forward-looking statements. In addition, the inclusion of such forward-looking statements should under no circumstances be regarded as a representation by Lonmin that Lonmin will achieve any results set out in such statements or that the underlying assumptions used will in fact be the case. Other than as required by applicable law or the applicable rules of any exchange on which Lonmin's securities may be listed, Lonmin has no intention or obligation to update or revise any forward-looking statements included in this presentation after the publication of this presentation. This presentation is for information only and does not constitute or form part of any offer or invitation to sell, or any solicitation of any offer to purchase, any shares in Lonmin or any other securities, nor shall it or any part of it nor the fact of its distribution form the basis of, or be relied upon in connection with, any contract or investment decision related thereto. Information supplied by host presenters may not be used, referenced or published without the prior written consent of the author of the presentations.