final surface preparation for superconducting cavities...
TRANSCRIPT

Final Surface Preparation for
Superconducting Cavities
An attempt to describe an optimized procedure
Reply to the
Request for Consultancy from TTC
raised by
the ILC R&D Board Task Force on High Gradients (S0/S1)
TESLA Technology CollaborationTTC-Report 2008-05

TTC-Report 2008-05

1
Preface........................................................................................................................................ 3 Overview .................................................................................................................................... 4 1. Superconducting Cavity Electropolishing Procedure for Cavity Qualification .................. 5 1.1. Background.......................................................................................................................... 5 1.2. Basics of Electropolishing ................................................................................................... 5 1.3. Standard Electropolishing Procedure for Cavity Qualification........................................... 7 1.4. Typical Electropolishing Parameters................................................................................... 9
1.4.1. Degreasing the Cavity ........................................................................................ 9 1.4.2. Electrical connections ........................................................................................ 9 1.4.3. Cavity Rotation .................................................................................................. 9 1.4.4. Electrolyte Temperature................................................................................... 10 1.4.5. Electrolyte Mixing............................................................................................ 10 1.4.6. Depletion of Hydrofluoric Acid from Use ....................................................... 11 1.4.7. Electrolyte Flow Rate....................................................................................... 11 1.4.8. Cathode Shielding ............................................................................................ 11 1.4.9. Typical Etch Rates ........................................................................................... 12 1.4.10. Water Rinsing After Processing....................................................................... 12
1.5. HF Safety........................................................................................................................... 13 1.6. Alcohol Rinsing................................................................................................................. 14 1.7. Supporting Material: Recommended acid quality monitoring .......................................... 17 1.8. Supporting Material: Ultrasonic Degreasing Procedure Used For Cleaning Cavities after
Electropolishing ....................................................................................................... 26 2. Optimum set of High Pressure Ultrapure Water Rinse parameter .................................... 28 2.1. Pure water systems ............................................................................................................ 28
2.1.1. Layout and parameters of ultra pure water system .......................................... 28 2.1.2. Quality control.................................................................................................. 29
2.2. Overview of HPR systems................................................................................................. 29 2.3. Process quality monitoring ................................................................................................ 30
2.3.1. Force measurements of HPR jet....................................................................... 30 2.3.2. Canary cavity.................................................................................................... 33 2.3.3. Other quality control procedures...................................................................... 33
2.4. Summary............................................................................................................................ 33 2.5. Supporting material ........................................................................................................... 34 3. Baking Procedures and optimum parameters .................................................................... 39 3.1. “In-situ” Baking Parameters .............................................................................................. 39 3.2. “Fast” Baking Parameters.................................................................................................. 40 References Appendix: Request for Consultancy from TTC
TTC-Report 2008-05

TTC-Report 2008-05

3
Preface At the beginning of 2007 the ILC R&D Board Task Force on High Gradients (S0/S1) submitted a request for consultancy to TTC. The Task Force was seeking advice on the following issues to improve the yield of the “final preparation steps”:
• Optimum cavity preparation process o A detailed list of preparation steps would be desirable
• Optimum set of EP parameters established today • Optimum set of HPR parameters
o A proposal on how to implement a consistent and verifiable parameter set for these systems would be desirable
• Optimum set of bake-out o An optimum parameter set should include temperature, duration and vacuum
• List of critical process parameters to be monitored during cavity preparation o This applies to all of the processes above o Recommended monitoring devices for process control
The original request is attached to this document as an annex. The Request for Consultancy was extensively discussed at the TTC Technical Board Meeting (FNAL, April 23-26, 2007). There was agreement that the request should be officially answered by the TTC. The proper body within TTC is its Technical Board. The TTC Technical Board decided to aim for a well structured document giving the requested answers. Background information completing the picture should be attached. Since the TTC Technical Board includes experts from all relevant fields, just a few additional authors were needed. The following authors and editors have directly contributed to this document:
G. Ciovati / JLAB D. Reschke / DESY T. Higo / KEK T. Rothgeb / JLAB P. Kneisel / JLAB T. Saeki / KEK J. Mammosser / SNS K. Saito / KEK A. Matheisen / DESY B. Visentin / CEA Saclay P. Michelato / INFN H. Weise / DESY H. Padamsee / Cornell Chr. Oevermann / DESY
The document is based on information and knowledge widely distributed and collected within the TESLA Technology Collaboration. Many colleagues and institutions have contributed to this effort.
TTC-Report 2008-05

4
Overview This report attempts to describe the “final preparation” procedures known to yield the highest gradients for 9-cell cavities. These final steps include degreasing, light electropolishing (EP), high pressure rinsing (HPR) with ultra-pure water (UPW), drying, evacuation, and mild baking. A core set of final treatment parameters is followed by all the laboratories working towards high gradient 9-cell cavities. These laboratories are (in alphabetical order) Cornell, DESY, KEK and JLAB. The bulk of the 9-cell high gradient data is coming from DESY. Work on single cell cavities at these and other labs (e.g. Saclay, INFN) has also contributed to defining and understanding the procedures. The procedures are yielding similar results and similar gradient spreads across the laboratories. Therefore it is reasonable to conclude that the essential steps needed for high gradient results are known and are being followed. However there is a substantial variation in many details, as for example the voltage selected for EP or the temperature for mild baking. Tables are given for some of these parameter ranges. It is possible that the gradient spread observed at all laboratories is partly due to the variation in some of the key parameters, but this is far from certain. Specific experience at individual laboratories have also suggested that certain key parameters are critical to good performance, such as the HF content during EP, or the impact of the HPR pressure jet during rinsing. Studies are underway to identify the best method of measuring and controlling such parameters. This report also tries to list some of these key parameters and methods under development. The sequence of pre-treatment steps in cavity preparation is not covered here. But the general principles for the common items in the final preparation treatment cycle are also applicable to pre-treatment steps.
TTC-Report 2008-05
5
1. Superconducting Cavity Electropolishing Procedure for Cavity Qualification
1.1. Background
The niobium electropolishing process has evolved from the original Siemens recipe over the last 10 years. Today’s procedures are a combination of learned experiences and new developments that were generated from Kenji Saito’s effort working with Nomura Plating Companies to develop higher gradients as well as DESY’s effort to utilize this process for large scale production of cavities for their XFEL project. The results of these efforts have progressed the basic knowledge of this complicated process and have demonstrated the utility of this method in producing the highest gradients achievable in superconducting cavities to date. This document is meant to be used as a guide to additional users of this method as well as to document the current best parameters used today. Process parameters are strongly dependent on the hardware and system design, therefore variation in these parameters is inevitable at different locations as well as different systems in use. For the critical details of this process it is necessary to fully understand each system and therefore an explanation is provided as well as the parameters currently being used at each laboratory.
1.2. Basics of Electropolishing
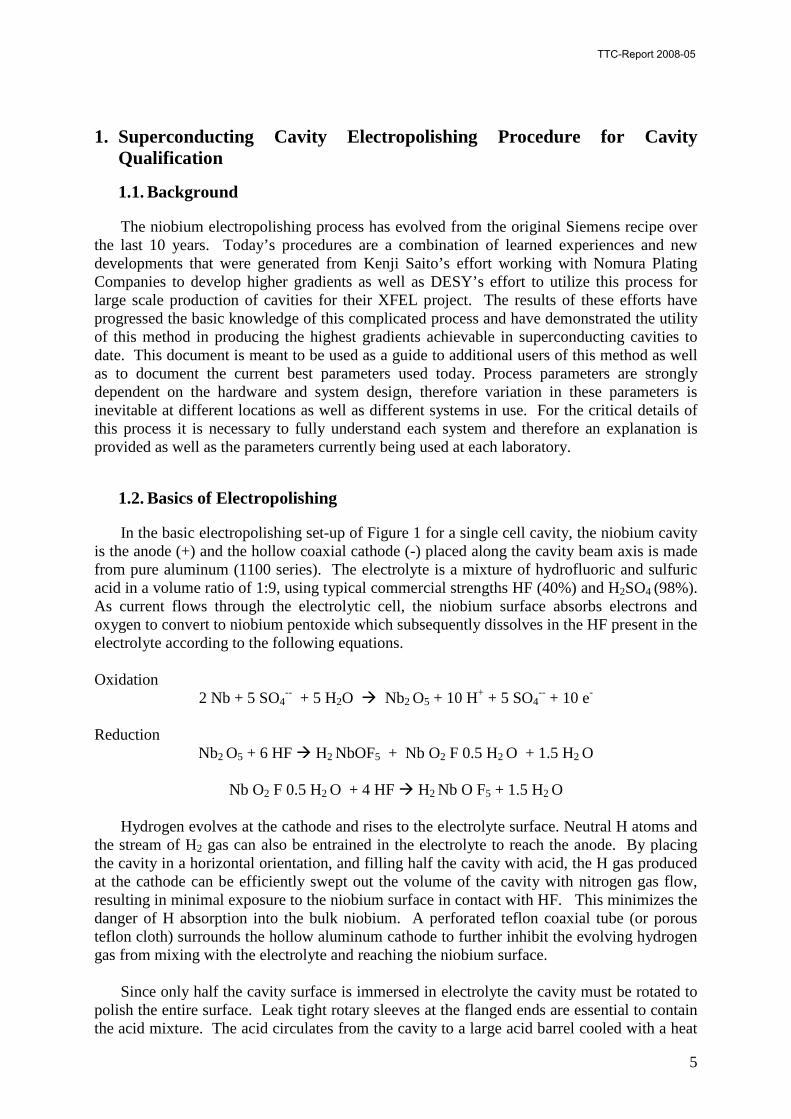
In the basic electropolishing set-up of Figure 1 for a single cell cavity, the niobium cavity is the anode (+) and the hollow coaxial cathode (-) placed along the cavity beam axis is made from pure aluminum (1100 series). The electrolyte is a mixture of hydrofluoric and sulfuric acid in a volume ratio of 1:9, using typical commercial strengths HF (40%) and H2SO4 (98%). As current flows through the electrolytic cell, the niobium surface absorbs electrons and oxygen to convert to niobium pentoxide which subsequently dissolves in the HF present in the electrolyte according to the following equations. Oxidation
2 Nb + 5 SO4-- + 5 H2O Nb2 O5 + 10 H+ + 5 SO4
-- + 10 e- Reduction
Nb2 O5 + 6 HF H2 NbOF5 + Nb O2 F 0.5 H2 O + 1.5 H2 O
Nb O2 F 0.5 H2 O + 4 HF H2 Nb O F5 + 1.5 H2 O Hydrogen evolves at the cathode and rises to the electrolyte surface. Neutral H atoms and the stream of H2 gas can also be entrained in the electrolyte to reach the anode. By placing the cavity in a horizontal orientation, and filling half the cavity with acid, the H gas produced at the cathode can be efficiently swept out the volume of the cavity with nitrogen gas flow, resulting in minimal exposure to the niobium surface in contact with HF. This minimizes the danger of H absorption into the bulk niobium. A perforated teflon coaxial tube (or porous teflon cloth) surrounds the hollow aluminum cathode to further inhibit the evolving hydrogen gas from mixing with the electrolyte and reaching the niobium surface. Since only half the cavity surface is immersed in electrolyte the cavity must be rotated to polish the entire surface. Leak tight rotary sleeves at the flanged ends are essential to contain the acid mixture. The acid circulates from the cavity to a large acid barrel cooled with a heat
TTC-Report 2008-05

6
exchanger which maintains the acid temperature. A significant acid chilling system with adequate heat exchangers must be used to maintain acid temperature during the process. A membrane pump drives the acid mixture through the cooled barrel, and through a 1 µm pore filter before it reaches the inlet of the hollow cathode. From here the electrolyte fills the center of the cells through openings in the hollow cathode. The acid returns to the storage tank via an overflow. Figure 2 shows a generic schematic of acid flow for a 9-cell EP system.
Figure 1: (a) Schematic for continuous EP (b) Single cell EP set up at Saclay.
Figure 2: Generic schematic of acid flow for a 9-cell EP system
Great care must be exercised in controlling the key parameters to achieve reproducible operating conditions. These parameters are: voltage, current density, temperature, acid flow rate, and electrolyte composition. One of the key parameters characterizing the EP process is the current (I)-voltage (U) characteristic curve. The best EP takes place in the plateau region of this curve, where the current density remains constant even though the voltage increases. Maintaining the relative composition of HF and H2SO4 is important to avoid excessive synthesis of solid sulfur. Therefore the aging of the EP bath should be monitored for HF concentration to determine the maximum EP time for a particular set-up. There is not yet one universally accepted theory of electropolishing. An attractive but naïve explanation is that electric field is higher at edges and projections than inside wells and craters so that material removal takes place preferentially at protrusions. More generally accepted EP theories are based on the formation of passive films at the anode. In one model [1] the anodic film has higher viscosity and correspondingly higher electrical resistivity than the bulk of the electrolyte. Above protrusions the film is thinner than in the valleys resulting in a higher current density and more rapid dissolution. An alternate proposal [2] is that surface leveling occurs due to the diffusion of anodic products from the anode through the film, driven by differences in the concentration gradients of metal ions.
TTC-Report 2008-05

7
1.3. Standard Electropolishing Procedure for Cavity Qualification
In this section we describe the final EP procedure assuming that the cavity has already undergone bulk electropolish chemistry, RF tuning and furnace treatment to remove any hydrogen that may have been absorbed during the bulk EP. The principles for the bulk EP stage are the same as for the final EP, except for the need to control the HF concentration and the quantity of dissolved Nb over the longer time period. Before connecting the cavity to the EP system the cavity is ultrasonically cleaned in a detergent degreaser in a de-ionized (DI) water bath that’s typically heated. The process takes place in a clean area or clean room environment. Process time of ~1 hour is typical with minimal of a few percent by volume of concentrated detergent as the degreasing agent within the DI water. After degreasing, the cavity surface is rinsed with DI water to remove residual detergent and then dried in a clean or clean room environment. The cavity is then attached to the electropolish system in the horizontal position. Figure 3 shows the 9-cell EP systems at DESY, and KEK. Each system includes the rotation device, electrode contacts, plumbing connections and diagnostics. All components exposed to acid are made from teflon (PTFE) material which is inert against corrosive acid. Each system includes a handling frame which allows lifting the cavity into the vertical position for final acid drainage after EP. The current leads are made from copper. The electrical connections to the cavity are sliding contacts made from a copper carbon alloy. A large number of sensors are installed to ensure safe and reproducible operation (25 at DESY). During connections to the system personnel must keep cavity clean and avoid contact when possible, and appropriate gloves must be used during handling and contact. Additionally, contact of any material with interior surface of the cavity must be avoided throughout the processing operations.
Figure 3: DESY EP set up (b) KEK EP set up After the assembly of hardware for the rotation device, electrode contacts, plumbing connections and diagnostics the cavity is filled with acid through the circulation system, and the level is maintained at ~60 % volume completely covering the cathode. Electrolyte temperature is adjusted to the appropriate starting temperature. The cavity rotation is switched on and a fluid leak check is done.
TTC-Report 2008-05

8
DC power is turned on and voltage is set to ~17 (15 to 18) volts constant voltage. Current is monitored (typically 300 A) and voltage is adjusted to maintain acid temperature below 35 C at exit of cavity. The cavity is processed for enough time to adequately remove 10-20um from the equator. Typical time for this amount of etching is around 25-50 minutes. When the desired amount of niobium material has been removed, the current is switched off. The rotation is stopped and the cavity is put into vertical position to drain the acid mixture. The draining process takes about 1-3 minutes. The cavity is then filled and drained several times with DI water until the pH of the exiting rinse water is raised to a level of 4 to 5 depending on the system design. This exchange of water on the surface followed by draining is the fastest method to achieve higher pH on the cavity surface. The cavity is then rinsed again by overfilling for ~60 minutes. Note that these final steps of the electropolishing procedure, of the removal of rinse water, and the cathode differ substantially for each laboratory.
JLAB – positions cavity horizontally, drains the DI water and then removes the cathode. Next the cavity is completely disassembled and ultrasonically cleaned in detergent as in above step. DESY – removes the cathode vertically and the cavity remains filled with water until reaching the next cleaning steps.
KEK – removes the cathode then fills the cavity with DI water before proceeding. Next the residual contamination from the chemistry, mainly sulfur particulates should be removed to reduce field emission. Methods under investigation are: alcohol rinsing and ultrasonic degreasing. All methods have shown significant reduction of onset of field emission. Each method differs slightly in procedure but all are carried out in clean conditions with internal rinsing of the cavity surface. Additionally a light BCP etch after bulk EP and 800 C has been used at DESY and has also shown good results.
TTC-Report 2008-05

9
1.4. Typical Electropolishing Parameters
1.4.1. Degreasing the Cavity
To remove grease, oils and surface contamination from the cavity interior surface it is necessary to degrease the cavity prior to electropolishing the cavity. This is typically done in an ultrasonic bath with DI water and a detergent at an elevated temperature by heating the water. Location / User
Detergent Brand
Volume of Detergent Ultrasonic Frequency/Time
DI Water Temperature
DESY Ticopour 33 200 liter / 3 % solution / 20 Min 50 C KEK Not performed
JLAB Micro-90 567 liter / 2-3% solution 80 kHz/60 min 30 C
1.4.2. Electrical connections
To perform electropolishing on niobium cavities two electrical connections are needed to the DC power supply, the positive anode connection and the negative cathode connection. The anode connection can be connected to the cavity anywhere along the cavity outer surface as the contact makes good electrical connection. The cathode can be connected from either end. It is important that connections and cables are able to handle the full current needed for the process with a safety margin. Typically multiple cables and connections are used for this application to increase the flexibility of the system and to handle up to ~350 amperes of current. Due to the high conductivity of both the anode and cathode materials, very little voltage is dropped along their electrical path and therefore less importance is placed on where the contacts are made as to the quality of the contacts at those connections. Electrical Connections DESY KEK JLAB Location of connections Ref ring; Iris
2;3;4;7;8;9;Ref ring 2
Equator 1,3,5,7,9 Equator 2,4,6,8
Contact material Nb at contact area / CU brackets
Aluminum/carbon brush
Aluminum/Cu braid
1.4.3. Cavity Rotation
The cavity should rotate at a speed of around 1 rpm to allow for the double layer (viscous layer) to form, to provide for adequate polishing time and to maintain electrolyte temperature within the boundaries discussed in this document. In addition to the pumped acid circulation the rotation also serves to mix the electrolyte within the cavity. Decreasing speeds will require a larger heat exchanger and electrolyte chiller capacity and faster speeds will increase etch rates in unpredictable ways, and possibly result in a rougher surface finish. Cavity Rotation DESY KEK JLAB Rotation speed (rpm) 0.8 1.0 0.9
TTC-Report 2008-05

10
1.4.4. Electrolyte Temperature
One of the most important polishing factors is maintaining the electrolyte temperature to allow for efficient etch rates, to prevent excess evaporation of the hydrofluoric acid and to maintain thermal stability during the process. At low temperatures below 25 degrees Celsius the etch rate is very low causing excessively long process times. As the amount of HF within the electrolyte falls below 6% by volume, the etch rate falls off rapidly and this again will extend the etch time and may reduce the quality of the surface finish. If the electrolyte temperature is allowed to exceed 35 degrees Celsius, the etch rate will dramatically rise making the control of the process much more difficult due to the strongly increasing current density. Monitoring of the electrolyte temperature can be easily achieved using thermo-couples. Typically the temperature of the electrolyte bath, the inlet at one end of the cathode and the electrolyte exiting the cavity at either end is monitored during the process. Internal probes that contact the electrolyte as well as standard thermo-couples can be used if strapped externally to plumbing lines. Typically there is a temperature differential from inlet to outlet of around 7-9 degrees Celsius during the process. The electrolyte temperature from the bath of around 24 or 25 degrees Celsius is a good starting point to reduce the time it takes for the exiting electrolyte to reach its optimal operating point. Typically when starting the process the voltage can be set to 17 volts and raised slowly. The current will slowly raise and level off around 200-300 amperes. In some cases the power is turned on directly to the set voltage. If the current is rising too fast the voltage can be lowered to around 14 volts to reduce the electrolyte temperature rise and maintain the temperature below 35 degrees Celsius. Electrolyte temperature
DESY KEK JLAB
Chemical Sump (C) 19-35 21-25 17-26 Inlet Typical (C) 18 at start 23-26
steady stat Not measured 24-26
Outlet Typical (C) 19 at start 26-35 steady state
Center of cavity 30-35C
30-35
Voltage rise 0 to 18 in 1 min 0 to 17 Directly or step Designed cooling capacity (kW)
20 design, 6KW actual
20 design, 5-6 KW actual
1.4.5. Electrolyte Mixing
One important factor in electropolishing is the proper mixing of the electrolyte prior to use. Whether the electrolyte is mixed in the industry and shipped to the user location or is mixed on site it is important how the acids are mixed together to get the right starting mixture. Today’s standard recipe calls for the mixture to contain 10% by volume hydrofluoric acid and 90% sulfuric acid. Note the concentration of acids varies slightly in different regions and the mixtures are adjusted slightly different depending on the region. The concentrations of the starting acid should be ~49% for the hydrofluoric acid and ~96% for the sulfuric acid. It is important to note that the slight variations of this mixture or concentrations have been and are used successfully and have generated good cavity performance. The most important factor in mixing acids is to cool the sulfuric acid first, then add the hydrofluoric acid to the bottom of the sulfuric bulk to reduce the chemical reaction (and temperature) and loss of HF in an uncontrolled way. Hydrofluoric acid has a high vapor pressure and the reaction can evaporate a significant amount of it if mixed improperly. Quality assurance analysis of the resulting solution is necessary in all cases to ensure the proper starting mixture. Storage of electrolyte
TTC-Report 2008-05

11
under a normal temperature range is also necessary so as to prevent venting the hydrofluoric acid from the mixture. Reducing the percentage of hydrofluoric acid in the mixture will reduce the current density under normal operating conditions of bath temperature and voltage setting. Process runs that showing too low a starting current can be good indicators for low hydrofluoric concentration in the mixture. Electrolyte mixing DESY KEK JLAB HF conc. (%) 49 49 49 H2SO4 conc. (%) 96 96 96 HF volume (%) 10 10 10 H2SO4 (%) 90 90 90 Premix/onsite mix Outside company onsite onsite
1.4.6. Depletion of Hydrofluoric Acid from Use
During the course of electropolishing, the hydrofluoric acid content is reduced in the mixture which increases the process times as well as leads to uncertainty in the proper operating points. It is important to note that increasing the hydrofluoric acid concentration in the mixture by adding additional hydrofluoric acid from bottles or bulk storage to the electrolyte under operation also adds additional water to the mixture. Methods to add HF are under study. Frequent exchange of the electrolyte will give the best result but will add additional cost. Typically the acid should be exchanged above a Nb concentration of 9-10 g/l in the electrolyte. But different criteria have been reported in the literature.
1.4.7. Electrolyte Flow Rate
The optimal electrolyte flow rate is around 10 lpm into the cavity. Typically the acids are pumped through the center of cathode and out through small holes in each location of an equator. Preferably, the holes should face down towards the lower portion of the cell to introduce fresh electrolyte directly to the polishing surface. The exiting hole diameter should be adjusted to provide equal flows into each cell and this will depend on the type of pump used as well as the sizing of cathode. Typically holes around 0.6 cm diameter work well for 10 lpm flow rates, cathode ID of 2.6 cm and a diaphragm style pump. Reducing the flow rate will increase the electrolyte temperature. Increasing the electrolyte flow will increase the agitation at the cavity surfaces such as the irises, possibly disturbing the viscous layer, and increasing the etch rate at those locations. Another side effect of higher flow rates is increasing the liquid level within the cavity and increasing the exposed surface area. Electrolyte flow rate DESY KEK JLAB Nominal flow rate (lpm)
8-11 10-13 9-12
Hole Locations Equator Equator Equator only Position (Up/Down) Down Up Down Cathode hole ID (cm) 0.2-0.3 staged Distributed center-
1.0,0.8,0.80.60.6 0.6 fixed
1.4.8. Cathode Shielding
In order to prevent excessive hydrogen from entering the niobium during processing and to reduce etch rates within the end groups, the cathode must have shielding on at various places. This shielding is implemented differently at each laboratory, and there is no single
TTC-Report 2008-05

12
correct solution. Generically, the shielding is accomplished using a combination of Teflon material or tape and Teflon coated materials and wrapping the cathode at various locations to reduce the current density at those locations. Typically, the cathode has a perforated cloth attached either standing off from the cathode by Teflon blocks or tied around it via Teflon coated string. The purpose of this cloth is to break up hydrogen bubbles which are formed on the cathode and will propagate towards the cell walls following the ion movement. Additionally the cathode is shielded at the iris and in the end groups to help reduce the etch rate at those locations. Location Cathode
Material Cathode OD (cm)
Cathode ID (cm)
Cathode Distance from Iris (cm)
DESY Al 99,5 3.0 2.2 ~ 1.5 KEK Al 2.5 1.9
JLAB Al 99.8 3.3 2.62 ~1.0 Cathode Shielding DESY KEK JLAB Wrapped/open at bottom
Closed Closed Open
Iris/ end group shielding
Iris and end group Iris and end group Iris and end group
1.4.9. Typical Etch Rates
Typical etch rates for an electropolishing setup are strongly dependent on the system design, cathode setup as well as the operating parameters. Resulting removal rates are typically higher at the cavity irises then the equators by a factor of 2. Typical Etch Rates DESY KEK JLAB Removal rate iris/equator
1.5 ~2 ~2.0
Removal rate per (µm/min)
0.3-0.4 0.3 0.4
Freq change (kHz/um) 10.5 7-8 ~7-8
1.4.10. Water Rinsing After Processing
For safety and performance reasons, the cavity must be rinsed after the electrolyte is drained from the cavity. The best way to raise the pH inside the cavity is to fill the cavity with de-ionized water and then drain it completely, several times in sequence. This method provides the best mechanism for interacting directly with the cavity cell surfaces without adding to the complexity of the system design. This type of rinsing is then followed by extensive over flow rinsing while monitoring the pH or water resistivity. These procedures will adequately remove any excess acids trapped in the system as well as make the subsequent handling safe for personnel. Water Rinsing DESY KEK JLAB Rinse water volume 1200 liter 600 liter 900 liter # of Fill & Dumps 2*4 5-10 6 Time for overflowing 2*20 min 60 min 60 min Final pH typical 3-4 3-4 3
TTC-Report 2008-05

13
1.5. HF Safety
An important aspect of this electropolishing procedure is the safety for personnel from exposure to process chemicals during operation and maintenance of the electropolishing system. The exposure of personnel to the wet cavity and equipment surfaces coupled with the use of HF acid in the electrolyte recipe leads to the possibility of serious personnel safety conditions if the proper procedures for first response to exposures are not in place. The following details about HF exposures should be understood and or addressed before implementing an electropolishing program Any contact between pure HF and the skin (as for example during mixing) will NOT be felt as an acid burn because HF directly kills the nerve endings. Any hint of wetness at this stage should immediately be followed by a thorough water rinse or safety shower. Absorption of HF through the skin surface happens quickly and provides an extended release of fluorine ions over time even after the skin surface is neutralized due to the deep absorption into body tissues. Fluorine ions bond strongly with calcium and other electrolytes and can bond over an extended period of time of days. Bonding of calcium in the blood stream can lead to cardiac arrest many hours after the initial exposure. If an exposure occurs of greater then 8 % of the body surface with concentrated HF acid, it could lead to fatality if proper first aid and follow up medical procedure is not applied. The most critical aspect is the amount of time from exposure to removal of the acid from the skin and the start of bonding of the fluorine ion with injection of a bonding agent. Constant training of all personnel in contact with chemistry facilities and of chemistry staff who perform electropolishing procedures and maintenance in the proper response to an exposure, is necessary to ensure personnel safety. Constant training of first responders in applying HF first aid procedures is also necessary to ensure quick response and reduce time from exposure to bonding of HF. Best procedure to treat exposure:
• Quickly remove of excess acid from the skin surface from water rinsing. • Rinse time should be adjusted to minimal time to remove the excess acid from the skin
surface to stop the source of fluorine and to allow for quickly starting the bonding of HF with calcium gluconate cream.
• The eyes need constant flushing with water to neutralize which takes significant supplies and trained personnel to apply properly.
• Removal of personnel clothing is necessary to ensure proper reduction of HF source and personnel privacy concerns must be protected to ensure proper response to procedures.
• Procedure is best applied with additional first responders and must be trained in chemical and HF safety and in the proper personnel protective equipment.
• Bonding of fluorine ions on the skin surface with calcium gluconate cream. • This procedure includes a constantly applying fresh calcium gluconate while in
transportation to medical facilities. • Calcium gluconate should not be applied to the eyes, the eyes should have extended
water rinsing.
TTC-Report 2008-05

14
1.6. Alcohol Rinsing
The electropolishing process is well known as an origin of solid sulfur precipitates. Sulfur origins from a chemical reaction of the EP acid with the Aluminium electrode in use for the electro polishing [3]. Sulfur is able to settle and stick aggressively on the cavity surface. Sulfur particles are a well known source of field emission. Sample Studies Studies made on samples at DESY show that sulfur removal by High Pressure Rinsing (HPR) or ultrasonic treatments with the Ticopour detergent (in use at DESY) followed by rinsing in ultra pure water is not very efficient. Nevertheless ultrasonic degreasing immediately after EP at Jlab has resulted in low incidents of field emission. The application of alcohol or methanol rinses as part of cavity preparation was reported in the 1990s. Here no clear evidence on improvements of field emission levels was found. Alcohol is a known solvent for Sulfur. As a proposal for a cleaning procedure removing field emitters originating from sulfur contamination, pure ethanol rinsing was tested at DESY. The solubility of sulfur in ethanol at 20°C amounts to 1,14g S / 100g C2H5OH. The efficiency of transfer from granular to dissolved S has been studied on test samples, polluted with granular sulfur inside the DESY EP apparatus. Tubes and gaskets from the EP apparatus were exposed to pure alcohol. It was found by optical inspection that pure ethanol removed the sulfur segregations on the samples efficiently. Optical microscopy did not show residues of the granular sulfur after the exposure of the samples to ethanol Figure 4 and Figure 5.
Figure 4: Tube with a thin sulfur layer
(White, shadowed layer left side of tube)
Figure 5: Tube before and after ethanol rinsing
Application of Alcohol rinsing at DESY Alcohol rinsing has been shown to substantially reduce field emission in 9-cell cavity tests [4]. Alcohol rinsing is introduced into the preparation line before the 800°C annealing (to remove H) and prior to the final HPR. The rinsing procedure takes place in Cl 4 clean room after assembly of flanges for vertical test (Table 1 and Table 2). To fulfill safety regulations in handling of flammable liquids, the alcohol is circulated between a sealed tank and the cavity. For reproducible processes the alcohol is pre-filtered via a 0.2 µm filter unit, and stored inside a particle-free reservoir (Figure 6). This container gets pressurized by nitrogen to feed the ethanol via a second filter unit (0.2 µm pore size) into the cavity.
TTC-Report 2008-05

15
Figure 6: Set up of alcohol cleaning apparatus at DESY
Table 1: Test set-up and applied sequences for alcohol rinse on EP fine grain niobium cavities Alcohol in use: Ethanol 98% Ethanol Volume: 12 l Filtration: 0.2 µm filters Cavity set up All flanges for test installed Application Before 800C annealing
Before final 6 times HPR equipment Fill in /out flange on beam pipe Mech. impact: Cavity shaking during treatment Treatment time: 10 min
Table 2: Handling sequence for ethanol rinse Connect fill in flange to beam tube (Quick connect ) Fill in 12 l Alcohol via particle filter of the fill in line Disconnect reservoir “Shake” cavity for 10 minutes Connect Nitrogen purge line to fill in flange Backfill alcohol to reservoir Disconnect fill in flange from cavity Continue with HPR sequences
TTC-Report 2008-05

16
Analysis On the Teflon substrate used to study alcohol rinse at DESY there were no residuals visible under a light microscope with a magnification of about 100. The Cornell University reported on measurements on efficiency of S removal at the TTC meeting in Jan 2008 at Hamburg. Commercial available sulfur powder was diluted in water and dried on a Niobium substrate. Even after 1 hour of exposure to ethanol several S particles remained on the surface. In addition a chemical reaction of Sulfur and Nb is observed. At the places where sulfur particulates are removed, a surface layer of Nb and Sulfur remained. It is under discussion whether these residues are origin of quenches or influence the cavity performance. Conclusion and remarks on Alcohol Rinsing The alcohol rinse after the EP process was applied at DESY. The RF test results gained up to now showed no or very little field emission after applying of the alcohol rinsing process [4]. Based on these reduced field emission results, the alcohol rinse is now part of the standard processing of electro polished cavities at DESY. More test results will be gained soon to fix the process for the XFEL cavity preparation. Some Questions remain to be answered:
• Is the granular sulfur found in the DESY apparatus of the same nature like commercial
available S particulates? • Is the Teflon substrate representative for the analysis of the S removal studies or are
the chemical reactions between S and Nb dominant in the removal process? • Further investigations on samples of the DESY procedures are scheduled to study the
difference of measurements done at the Cornell University and the DESY tests.
TTC-Report 2008-05

17
1.7. Supporting Material: Recommended acid quality monitoring
Introduction Based on the Siemens recipe, the electropolishing mixture of Hydrofluoric and sulfuric acid electropolishing was investigated and improved by KEK. There is still some variation in the acid mixture used for the electropolishing process in different labs and industrial companies for preparation of superconducting cavities as listed below. During the mixing of the acid components a strong exothermic reaction and the formation of sulfurous (SUA) acid and fluor sulfonic acid (FSA) takes place. The formulas for the electro chemical reaction during the EP process published do not consider such components build up during the mixing process. For a good quality control and assurance these components have therefore to be analyzed and properly controlled. Besides reactions during mixing and storage, the acid mixture undergoes an aging process related to the consumption of free HF. The reduction of the “free “HF is accompanied by a decrease of the Nb removal rate as the EP process progresses. For all these reasons it is important to establish reliable methods for electrolyte quality control. Several methods are under investigation: titration, inductively coupled plasma optical emission spectroscopy, ionic-chromatography, nuclear magnetic resonance, Fourier transformation infrared spectroscopy, attenuated total reflection, ion selective electrode method, capillary and electrophoresis. The best method is not yet established, but the discussion below lists the techniques under investigation. EP parameters in use Mixtures in use Mixed by volume from From 1:8 HF (45%) /H2SO4 (96%) to 1:10 HF (45%)/H2SO4 (96%) + H2O [due to hygroscopic reaction of H2SO4!] Voltage in use Mostly applied constant voltage operation (15 to 20 V) Single cell EP in industry constant current (40 to 100 A Removal rate with 17 V applied 1:9 at 20C 0, 3-0, 5 µm/min 1:10 a t 20 C 0, 3 – 0, 4 µm/min Activity No reaction on Niobium without voltage applied! Currents of 100 to 500 A @15-20 V Most commonly used parameters Most common Mixture in use 1:9 HF (45%): H2SO4 (>96%) Most common Voltage in use 17 V
TTC-Report 2008-05
18
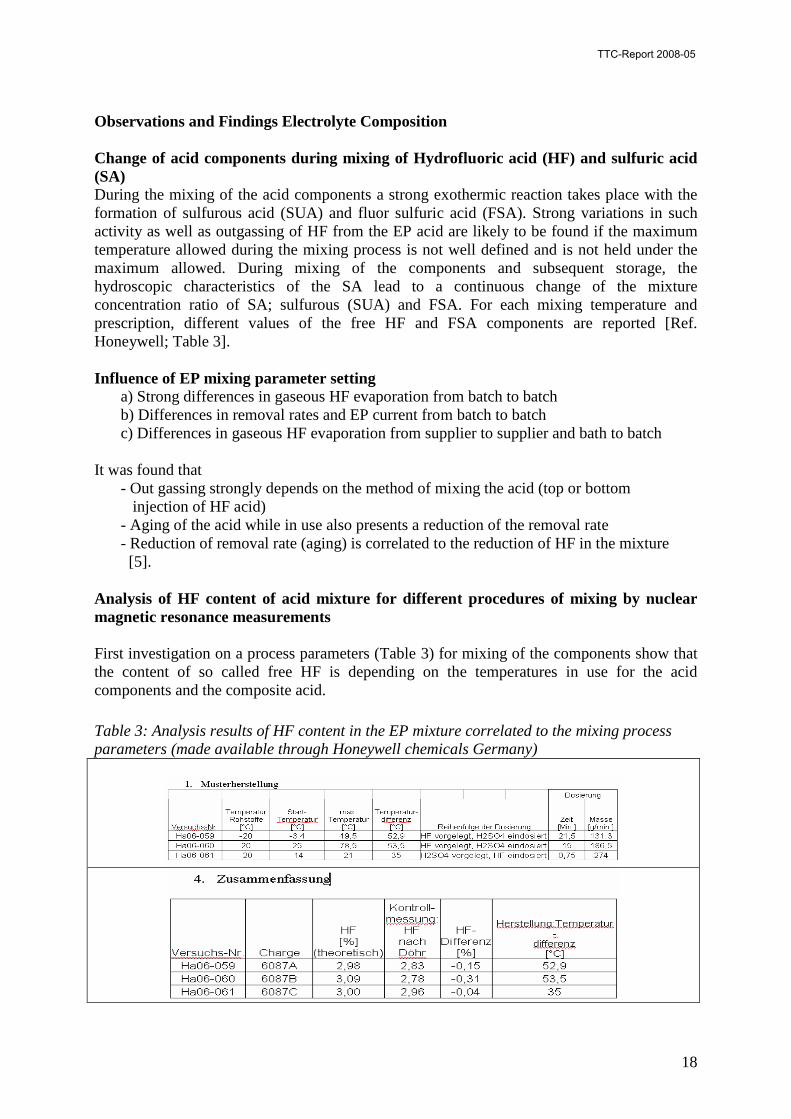
Observations and Findings Electrolyte Composition Change of acid components during mixing of Hydrofluoric acid (HF) and sulfuric acid (SA) During the mixing of the acid components a strong exothermic reaction takes place with the formation of sulfurous acid (SUA) and fluor sulfuric acid (FSA). Strong variations in such activity as well as outgassing of HF from the EP acid are likely to be found if the maximum temperature allowed during the mixing process is not well defined and is not held under the maximum allowed. During mixing of the components and subsequent storage, the hydroscopic characteristics of the SA lead to a continuous change of the mixture concentration ratio of SA; sulfurous (SUA) and FSA. For each mixing temperature and prescription, different values of the free HF and FSA components are reported [Ref. Honeywell; Table 3]. Influence of EP mixing parameter setting a) Strong differences in gaseous HF evaporation from batch to batch b) Differences in removal rates and EP current from batch to batch c) Differences in gaseous HF evaporation from supplier to supplier and bath to batch It was found that - Out gassing strongly depends on the method of mixing the acid (top or bottom injection of HF acid) - Aging of the acid while in use also presents a reduction of the removal rate - Reduction of removal rate (aging) is correlated to the reduction of HF in the mixture [5]. Analysis of HF content of acid mixture for different procedures of mixing by nuclear magnetic resonance measurements First investigation on a process parameters (Table 3) for mixing of the components show that the content of so called free HF is depending on the temperatures in use for the acid components and the composite acid.
Table 3: Analysis results of HF content in the EP mixture correlated to the mixing process parameters (made available through Honeywell chemicals Germany)
TTC-Report 2008-05

19
Baseline of selection of QC instruments The formulas for the electro chemical reaction during the EP process published (Figure 7) do not consider the components build up during the mixing process. For quality control and quality assurance these components have to be analyzed and controlled.
Figure 7: Standard electro chemical reaction during the EP process The formation of sub chemical components (Figure 8) during and after mixing according to the EP prescription was analyzed by experimental studies as reported in the literature.
Figure 8: Components build up in the EP mixture: Mixture 1:9 HF (45%) / H2SO4 (96%) + H2O [due to hygroscopic reaction of H2SO4!] H2SO4 + H2O ----> H2SO3 + H2SO4 + HF ----> FSO3H + H2O QC Method’s in use in the EP acid analysis For analysis of the EP acid different approaches are under investigation. Methods in use at DESY; CEA Saclay; INFN are analytical test set-ups to control the U/I curve (voltage/current) of the acid. For the commercial pre-mixed acid a standard analysis with NMR is done at the supplying company before hand over of the acid mixture to DESY. Methods in use for the DESY EP acid QC 1) NMR Analysis method, available at commercial acid suppliers
For the detailed analysis of acids, nuclear magnetic resonance measurements are industrial available systems. They are in use in industry to qualify and control acid mixtures for chip fabrication.
Pros.: - Detailed information on individual components measured. - Direct detection of non specified material (contamination) measured. - Well established data base of pure components available. - Standard QC instrument of basis components.
TTC-Report 2008-05

20
Drawback: - Analysis is time consuming (Delays between mixing, acceptance and delivery) - Data base and acceptance criteria for the EP mixture not existing (needs to be investigated).
- Not applicable for pure acid needs to be diluted for analysis (specialized laboratory and experiences necessary).
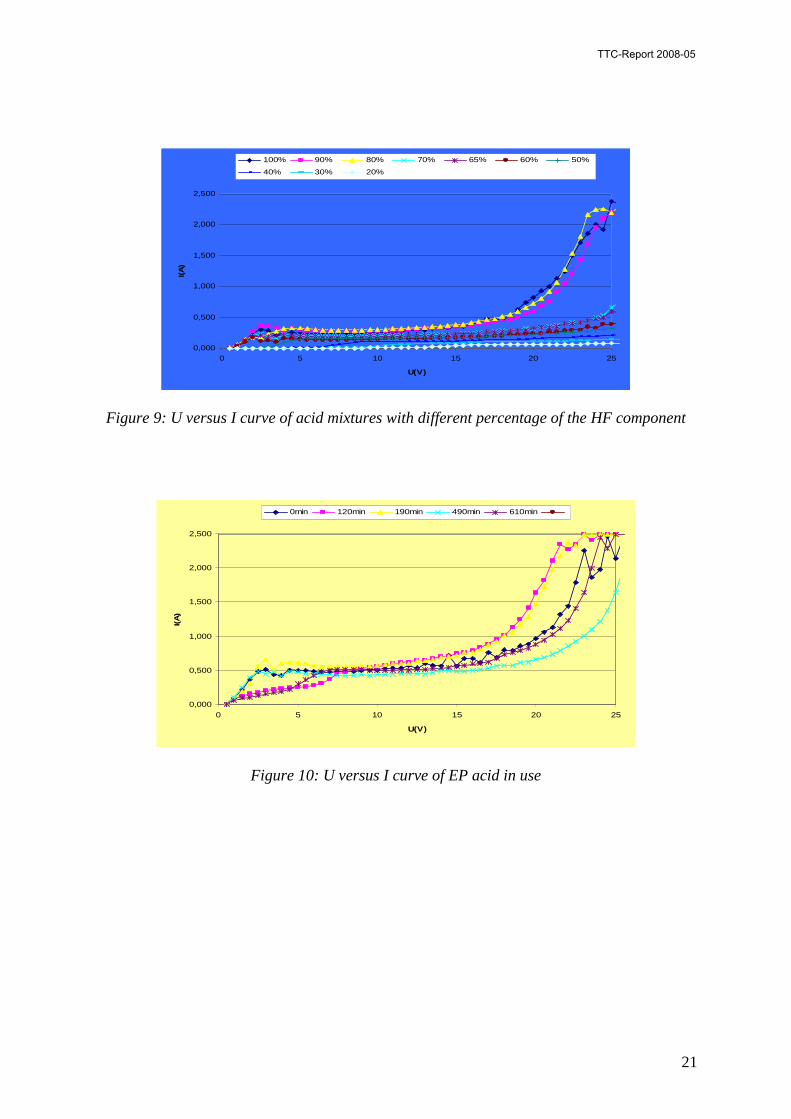
. 2) UI Measurements cell in use at DESY and Saclay for general analysis of acid. Pros.: - Fast test and low budget instrument. - Basic info of the overall behavior of the acid delivered and prediction on treatment time. Drawback: - No detailed info on origin of deviations of the components, - Not applicable as analysis instrument U/I measurement cells The acid polishing process is determined by the current density which is mainly determined by the voltage applied and the amount of HF available for the de-oxidation of the Niobium (Figure 9) The finger print of the EP process is a typical non linear behavior with a plateau formed in a Voltage area of 10 to 19 V, where oscillation of the current (voltage) is observed. This UI behavior allows a basic and fast test to determine whether the acid in use is appropriate for process stability. It can be applied in an off-line test cell or in-line with the EP apparatus. An automated EP, developed at INFN Legnaro [6] makes use of the U/I behavior to control and steer the EP process. The U/I curve is measured at start and during the polishing process in defined time intervals by ramping up the voltage during the process in defined time intervals. Software allows analysis of the U/I behavior and re adjusts the process parameters (mostly Voltage) for optimum Nb removal conditions. Application of U/I acid analysis Control of acid mixture (Figure 9) Control of aging process Consumption of components (Figure 10) Application: Automated EP at INFN Legnaro Acid QC at DESY Online acid analysis in the DESY EP apparatus Studies with U/I cells DESY INFN CEA Saclay
TTC-Report 2008-05
21
0,000
0,500
1,000
1,500
2,000
2,500
0 5 10 15 20 25
U(V)
I(A
)
100% 90% 80% 70% 65% 60% 50%
40% 30% 20%
Figure 9: U versus I curve of acid mixtures with different percentage of the HF component
0,000
0,500
1,000
1,500
2,000
2,500
0 5 10 15 20 25
U(V)
I(A
)
0min 120min 190min 490min 610min
Figure 10: U versus I curve of EP acid in use
TTC-Report 2008-05

22
Chemical analysis To ensure the reproducibility and reliability of the EP process for industrial application, a detailed study [7]* was carried out. In addition to the relation of mixture components, pollutions coming from equipment transport or storage vessels as well as non adequate material installed in the apparatus, have to be analyzed to ensure a continuous and well defined process. To determine the optimal analysis method and to compare different chemical analysis methods the study is split in 3 steps
1) Overview of the commercially available analysis infrastructure and tests of method by standard mixture.
Outcome: list of equipment and test costs 2) define and measure the sensitivity and reproducibility of the methods selected Outcome data base and limits of the different methods 3) field test in running processes
Table 4: Overview on commercial analysis methods 1. spectroscopic methods 1.1 molecular spectroscopy 1.1.1 (UV/VIS) ultraviolet spectroscopy 1.1.2 (FT-IR) infrared spectroscopy 1.1.3 Raman spectroscopy 1.1.4 (NMR) nuclear magnetic resonance spectroscopy 1.1.5 (ESR) electron spin resonance spectroscopy 1.1.6 (MS) mass spectrometry 1.1.7 (ICP-MS) inductively coupled plasma mass spectrometry 1.2 atom spectroscopy 1.2.1 (AAS) atom absorption spectrometry 1.2.2 (AES) atom emission spectrometry 1.2.3 (ICP-OES) inductively coupled plasma optical emission spectrometry 1.2.4 (RFA) Röntgen fluorescence spectroscopy 2. Chromatography (GC) gas chromatography (HP-LC) liquid chromatography (IC) ionic chromatography (CE) capillary electrophoresis 3. electrophoresis (ISE) ion sensitive / selective electrodes (ISE) pH electrodes Karl-Fischer titration Titration 4. measurement of physical characteristics determination of density conductivity measurement definition index of refraction
* We acknowledge the support of the European Community-Research Infrastructure Activity under the FP6 “Structuring the European Research Area” Program (CARE, contract number RII3-CT-2003-506395).
TTC-Report 2008-05

23
Table 5: Overview on methods and instruments applicable for the analysis of the EP mixture HF and H2SO4
Method Analysis Investments Analysis time applicability
AAS Element analysis 15-50 k€ 2 min / Analysis for 10 elements No
ICP-OES
Element analysis all elements in parallel ca. 60 k€
3 min / Analysis for 20 elements Yes
IC Ion chromatography
Ions (SO4, F-, FSO3H) 15 – 20 k€ 20 min / Analysis Yes
TOC Total Carbon Org. contamination 15 – 25 k€
ca. 15 min / Analysis Yes
FTIR-ATR (Infrared) Ions (SO4, F-, FSO3H ?) 110 k€ 3 min / analysis needs studies
NMR Org. contamination 0.1 – 4 M€ 15 min / analysis no
CE capillar electrophorese
Ions (SO4, F-, FSO3H) 25 – 53 k€ 60 min / analysis yes CE or ITP
ITP Isotachophorese Ions (SO4, F-, FSO3H) 26 k€ 20 min / analysis yes CE or ITP
Titration total acid content 10 – 15 k€ ca. 30 - 45 min / analysis Should be done
Analysis methods applicable for EP quality control From the measurement and analysis of QC instruments and equipments, commercially available, the following methods are chosen as best candidates for EP quality control.
• Titration • ICP-OES (inductively coupled plasma- optical emission spectroscopy) • IC (ionic-chromatography) • TOC (total organic carbon) • NMR (nuclear magnetic resonance) • FTIR-ATR-probe (Fourier transformation infrared spectroscopy –attenuated total
reflection) None of the analysis instruments allows users to detect the full set of parameters necessary for the overall quality control and quality assurance of the EP acid. Beside the composition of the acid contaminations by oil or softener of PVC tubing’s like sometimes in use in industry have to be detected and incorporated in the QC of an acid management
Table 6: Applicability of the chosen analysis instruments Titration + total acidity ICP-OES + all elements (Nb, Fe,) IC + distillation + Ions (SO4, F-, FSO3H) TOC + organic impurities NMR + organic impurities FTIR-ATR-probe + total overview of components defined by the ATR data base
TTC-Report 2008-05

24
Conclusion 1) Mixing process Based on the actual knowledge and experiences with the DESY EP apparatus a well defined prescription of the components (H2SO4- and HF acid) and the mixing process is now established in industry. Most companies supplying chemicals are able to handle this prescription. NMR analysis of the basic components Pre-cooling of the acid basic components Temperature control and recording during mixing process. 2) Application of EP acid QC instruments At this stage only the U/I instrumentation allows to determine the acid quality. This analysis is mostly connected to the EP apparatus and a constant process flow in cavity preparation. It is applied at DESY as QC before and during the EP process. A correlation between U/I measurements and RF measurements and test results of superconducting resonators is not apparent up to now. 3) Outlook on QC Due to a lag of funding, the detailed calibration and test on application in the cavity preparation (part 2 and 3 of the acid management study) could not be launched until now. There is not much experience with the mixture in use at the different suppliers and institutes, which use the pre-selected infrastructure routinely. Available data bases information to analyze the curves resulting from chromatic or spectroscopic measurements are limited as well and do not allow to use the infrastructure without a calibration of the method by well defined samples.
TTC-Report 2008-05

25
It can be expected that the most promising candidates for an industrial acid management are Titration (total acidity) - Easy standard method in chemical labs. - Risk of falsification of results of measurement. A dilution before analysis is necessary and requires well trained personal and process description FTIR-ATR-probe: - Allows a total overview of components by diagrams of the spectra
- Applicable on line on the EP acid mixture for analysis of the full set of molecules and atom content
- Applicable without dilution by water. - Total overview of components defined by the ATR TOC: organic impurities. - Easy to use after dilution with water; Risk of falsification of results of measurement. A dilution before analysis is necessary and requires well trained personal and process description - Commercial equipment in use for ultra pure water systems and standard analysis of no acid liquids Less promising in respect of online QC in a production due to limited and expensive apparatus is ICP-OES - Analysis on elements to limit impurities; limited application on molecules
Must be combined with IC +distillation to get full set of elements and ions existing in the EP mixture
IC + distillation
- Actually looks only use full in combination with ICP-OE
NMR - Extreme sensitive Analysis method - NMR spectra need well trained personnel for down concentration with water and analysis of the spectra
TTC-Report 2008-05

26
1.8. Supporting Material: Ultrasonic Degreasing Procedure Used For Cleaning Cavities after Electropolishing
Background: It is now clear that additional cavity surface cleaning is necessary after electropolishing, and has been applied. One cleaning method investigated that has shown reduction of field emission onset has been the use of standard ultrasonic degreasing method. This procedure outlines the steps necessary to carry out a standard cavity degreasing step for improving the cavity surface cleanliness from electropolish surface contaminates. JLAB Degreasing System Parameters: Ultrasound Frequency - ~ 80 kHz Heater – capable of raising the bath temperature to 50-60 C in 60 minutes Detergent – Micro-90, concentrated liquid, 2-3% concentration Procedure:
1. Note: Appropriate gloves must be worn for all cavity handling and ultrasonic tank must be located in a clean work area and cleaned before each use with DI water rinsing prior to cavity insertion.
2. Cavity is transported to the ultrasonic cleaning station either sealed and filled with DI water or sealed with all surfaces wet.
3. If the cavity is filled with DI water, the water is drained at the tank location and all flanges on the cavity are removed in preparation for insertion into cleaning tank.
4. Tank cover is removed. 5. Cavity is then inserted into the ultrasonic tank and positioned as to not contact any of
the tanks surfaces. Top of tank is open for the process run. 6. The tank is then filled to cover all cavity surfaces with ultra pure water. 7. Next the degreasing agent is added by pouring directly down the center of the cavity to
ensure detergent reaches the interior cavity surfaces. 8. The heater and ultrasound is then turned on and run for 60 minutes. 9. Cavity is then removed from the tank slowly while draining the water from the cavity. 10. Cavity is then rinsed with ultra pure DI water using a water pistol with a standard DI
water spray nozzle. Cavity is rinsed down the top beam pipe all open flange ports and then from the bottom beam port. Care must be taken as to remove all soap residues as well as to not recontamination the cavity.
11. Cavity is then moved a short distance to the clean room and transferred into the Class 100 area.
12. Cavity is now ready for insertion into the HPR cabinet for subsequent surface cleaning.
TTC-Report 2008-05
27
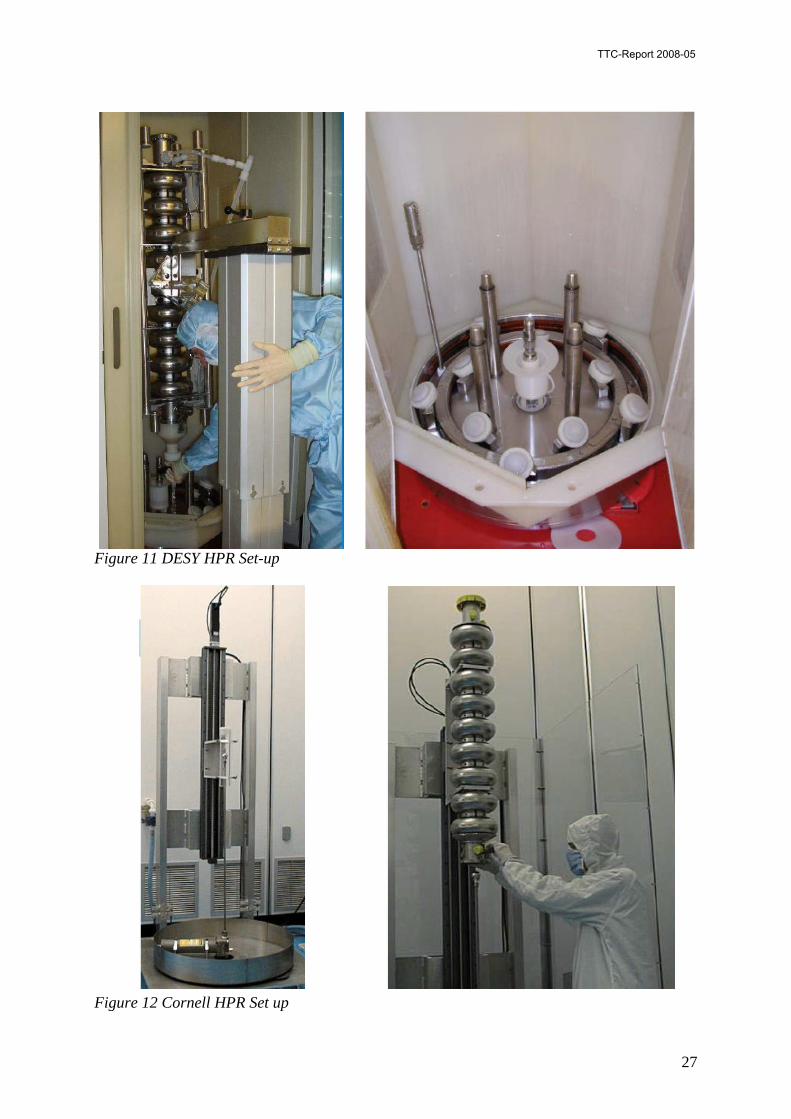
Figure 11 DESY HPR Set-up
Figure 12 Cornell HPR Set up
TTC-Report 2008-05

28
2. Optimum set of High Pressure Ultrapure Water Rinse parameter Micro-particle contamination has been identified to be the leading cause of field emission. This stresses the importance of cleanliness in all final treatment and assembly procedures. Rinsing with high-pressure ultra-pure water (HPR) is the most effective tool to remove micro-particles and therefore reduces field emission. HPR has also been effective in reducing field emission which cannot be processed during an rf test. HPR must be carried out in a Class 10 – 100 clean room to prevent re-contamination with dust. For best cleaning, it is important to avoid drying between final water rinse after chemistry and the start of the first HPR
2.1. Pure water systems
2.1.1. Layout and parameters of ultra pure water system
A stable and reliable pure water supply is fundamental for the successful operation of High Pressure Ultrapure Water Rinse (HPR) systems. The technology of ultra pure water (UPW) processing, handling and quality monitoring is well established due to the needs of electronic and semiconductor industry. The available water quality – even in large scale applications - exceeds by far the needs of srf cavity cleaning (see below). The basic definitions, standards and guidelines can be found in the wide literature like ASTM D5127 [8], VDI standard 2083, Blatt 9 and 10 (in german) [9], the SEMI standards E49.2-0298, E49.3-0298, F63-0701, F75-1102 [10], VDI textbook “Reinraumtechnik” [11] and others. Though in this literature a number of sample solutions for the design of UPW plants is described, the exact layout depends not only on the required amount of water and its quality, but also on the local raw water quality as well as on technical, administrative and safety regulations. Therefore no design of a water plant will be described here. High quality UPW system solutions including the required engineering are commercially available in all three regions. Though the technology of ultra pure water is well established and no R & D is required, a few specific topics and open questions related to the application in the field of srf cavity cleaning will be discussed. The experience of the last decade shows, that the application of a water quality between the 0.5 µm Technology (“16 MB integration”, ASTM Type E-1 and Type E-1.1 [8]) and the more challenging 0.25 µm Technology (“256 MB integration”, ASTM Type E-1.1 [8]) has the ability of excellent cavity performances. Experiments at KEK with a reduced water quality (10 MΩcm, filtered to 0.22 µm) used for HPR of single-cell cavities [12] have not been followed up and ultra pure water is used now. In general a reduced pure water quality results in less required technical effort and finally in reduced cost for construction phase, operation and maintenance. Due to the limited current data using a reduced rinse water quality – especially on multi-cell cavities – we strongly recommend the application of state-of-the-art ultra pure water according to at least 0.5 µm Technology standard. Up to now all HPR systems are based on cold (≈ 20°C) ultra pure water and no experience with hot UPW in this field is available. Hot water acts as a better solvent than cold water. Therefore the application of hot UPW might improve the cleaning effect. At JLAB, hot UPW is used for initial rinsing after chemical surface treatment. We strongly encourage R & D activities in this field. In order to reduce the consumption of raw water and the expense of UPW production, in electronic and semiconductor industry the reclaim of used UPW is frequent. At the best marginal contaminated UPW can be fed back into the water production after a quality control of TOC (total organic carbon) and specific conductivity without any further treatment [11]. In
TTC-Report 2008-05

29
the case of HPR this can be applied to the final rinse or rinses, where no chemical contamination of the previous chemical or electrochemical treatment is present any more. Nevertheless, the danger of a backward contamination needs careful consideration. No use of a reclaim system is reported for the existing HPR systems, which are all part of prototype or small scale cavity treatment installations. For a production scale installation a reclaim system is a considerable option with respect to cost saving.
2.1.2. Quality control
For the quality control of ultra pure water the same arguments as above are valid. The necessary quality control is well-defined according to the required pure water quality and described including instrumentation in the standards. The instruments are commercially available. More sophisticated analysis can be performed by analytical labs specializing in UPW. As an example JLAB makes routinely use of such a laboratory once or twice a year, especially after a major maintenance. The specific quality control of HPR systems is described in chapter 3.3.
2.2. Overview of HPR systems
It is general practice to apply high pressure ultra pure water rinsing (> 18 MΩcm) to the niobium cavities as a final cleaning procedure after chemical surface treatments have been applied. The methods of how these rinsing steps are done vary from laboratory to laboratory and even within the same laboratory (e.g. Jlab and DESY for R&D or production). The variations/differences are the following:
• System design ( e.g. stationary wand or moving wand, stationary cavity vertical or moving cavity, wand from below or above…)
• Pumping system (piston pump, membrane pump, pump capacity, pressure...) • Spray nozzle layout (number of jets, jet configuration (round, fan...) • Nozzle design (material ( sapphire, SS, W...), orifice size, water flow, water pressure
at surface..) • Water quality/ water monitoring (water system layout, particle counting, TOC
monitoring, polishing loops, make-up rate..) • HPR procedure (slow axial pass while cavity is rotating, “scanning”: up/down while
rotating, axial speed and rotational speeds..) • Protection of cavity openings… • Length of rinsing, repeated rinsing after assembly of most components • Cleaning of components to be attached to cavity • Drying prior to assembly and after final assembly prior to evacuation… • Enclosure of HPR system and location (e.g. clean room, pressurized cabinet…) There does not yet exist a clear understanding of the force needed at the cavity surface to
dislodge residual contamination from the chemical processing or handling. Of course, this depends – as discussed in [13] – on many parameters, one of which is the particle size. In order to apply an optimal/effective high pressure water jet to a niobium cavity surface, one has to know the nature of the particles clinging to the surfaces. Recent efforts [14] are dedicated to the question of the necessary forces for dislodging particles and the investigations are underway to compare the various systems in the various laboratories. In the context of the request for a “optimum set of HPR parameters” (this is not a very reasonable request) it seems only possible to collect all available data for the operations
TTC-Report 2008-05

30
of the different HPR systems in the different labs: This is done in Table 9 (see Supporting Material). It is important to keep in mind, that the high pressure rinse procedures are only one step in generating contamination-free surfaces; re-contamination can occur during the drying and assembly processes, from contaminated auxiliary parts attached to the cavities, from vacuum systems and/or test stands. At DESY the following procedures are established. After the last EP, HPR is used for 90 minutes in a 9-cell cavity; the nozzle is moved up once, and down again. Each cell gets rinsed twice, for five minutes. After rinsing, the 9-cell cavity is drying under laminar flow conditions in a class 10 clean room. Assembly of antennas etc. follows. The last step in cavity preparation is 6 times 90 minutes under the conditions mentioned above.
2.3. Process quality monitoring
All existing HPR systems are prototype systems and developed at individual laboratories. No standards for the specific process quality monitoring – except of a “good” cavity performance in the subsequent rf test (chapter 3.3.3) –exist as yet. Very useful approaches are the force measurement of the HPR jet developed at INFN Milano (chapter 3.3.1), the water particle counting of the high pressure supply water at JLAB (chapter 3.3.2) and checks of the drained water immediately after the cavity rinse (chapter 3.3.2). More over it is evident that the rules of a good laboratory practice (GLP) and clean room operation need to be transferred to an HPR system. This includes a well-defined maintenance schedule as well as regular visual inspections. These - often simple - checks can give helpful hints for the identification of upcoming or present system failures. Examples are leaks, corrosion, mildew and other distinctive features.
2.3.1. Force measurements of HPR jet
HPR water jet investigation had been done, characterizing the water jet used for the HPR process at different pump pressures and distances. The technique is based on the measure of the transferred momentum between the water jet and a target connected to a load cell [8]. The device is compatible with the clean room environment. The device has been used to characterize, up to now, the following HPR systems: DESY (main clean room) [16] JLAB HPR for cavity production, JLAB R&D laboratory, KEK Tsukuba and KEK Nomura Plating [14]. Two kinds of measurements have been done: Total force measurement and water jet profiling. Total force measurements In this measurement the water jet fully interacts on the target and transferred force is measured. This measure, feasible at different nozzle – target distances, enables the evaluation of the velocity of the water at the nozzle exit as well as the water jet power. A simple comparison of the measured speed and force, with respect to the theoretical values (derived from the Bernoulli law and momentum conservation), gives a first check of the consistency of all the HPR system parameters (e.g. nozzle diameter, pump pressure, etc). Moreover the recording of the force vs. time gives information about the jet and pump stability. An accurate measure of the water throughput is needed for all these measurements.
Data relative to DESY, KEK and JLAB are in Table 1 of reference [16].
TTC-Report 2008-05
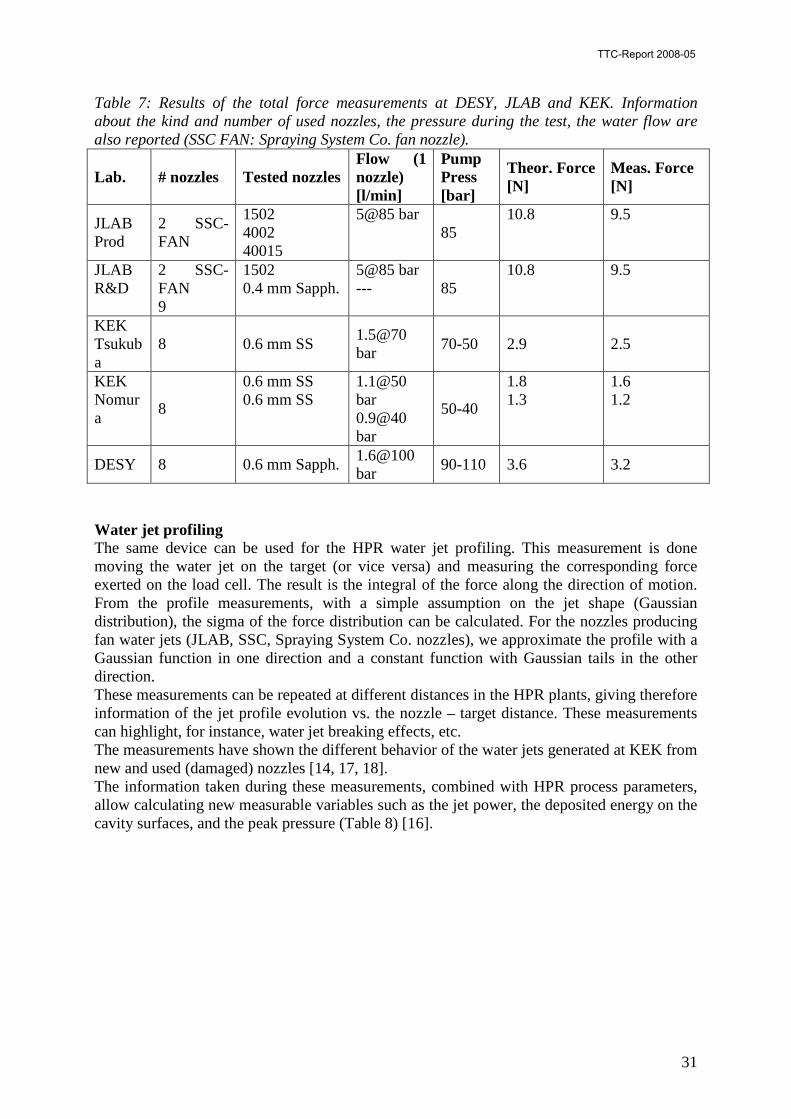
31
Table 7: Results of the total force measurements at DESY, JLAB and KEK. Information about the kind and number of used nozzles, the pressure during the test, the water flow are also reported (SSC FAN: Spraying System Co. fan nozzle).
Lab. # nozzles Tested nozzles Flow (1 nozzle) [l/min]
Pump Press [bar]
Theor. Force [N]
Meas. Force [N]
JLAB Prod
2 SSC-FAN
1502 4002 40015
5@85 bar 85
10.8 9.5
JLAB R&D
2 SSC-FAN 9
1502 0.4 mm Sapph.
5@85 bar --- 85
10.8 9.5
KEK Tsukuba
8 0.6 mm SS 1.5@70 bar
70-50 2.9 2.5
KEK Nomura
8
0.6 mm SS 0.6 mm SS
1.1@50 bar 0.9@40 bar
50-40
1.8 1.3
1.6 1.2
DESY 8 0.6 mm Sapph. 1.6@100 bar
90-110 3.6 3.2
Water jet profiling The same device can be used for the HPR water jet profiling. This measurement is done moving the water jet on the target (or vice versa) and measuring the corresponding force exerted on the load cell. The result is the integral of the force along the direction of motion. From the profile measurements, with a simple assumption on the jet shape (Gaussian distribution), the sigma of the force distribution can be calculated. For the nozzles producing fan water jets (JLAB, SSC, Spraying System Co. nozzles), we approximate the profile with a Gaussian function in one direction and a constant function with Gaussian tails in the other direction. These measurements can be repeated at different distances in the HPR plants, giving therefore information of the jet profile evolution vs. the nozzle – target distance. These measurements can highlight, for instance, water jet breaking effects, etc. The measurements have shown the different behavior of the water jets generated at KEK from new and used (damaged) nozzles [14, 17, 18]. The information taken during these measurements, combined with HPR process parameters, allow calculating new measurable variables such as the jet power, the deposited energy on the cavity surfaces, and the peak pressure (Table 8) [16].
TTC-Report 2008-05

32
Table 8: Comparison of basic water jet parameters, evaluated at distances equivalent to the 1.3 GHz iris (35 mm) and equator (103 mm). Laboratory Distance
from axis [mm]
Force [N]
Velocity at nozzle exit [m.s-1]
Power [W]
σ [mm]
Peak Pressure [N.mm-2]
35 1.73 0.169 DESY
103.3 3.2 120 186
3.71 0.037 35 1.734 (σx)
0.826(σy)/7.515 (plateau)
0.226 JLAB Production SSC-FAN 1502
103.3 9.4 112.8 530
3.578 (σx) 2.937 (σy)/41.87 (plateau)
0.021
35 1.75 0.068 JLAB R&D
103.3 1.3 - -
4.42 0.011 35 0.49 1.657
KEK Tsukuba 103.3
2.5 100.0 125 0.899 0.492
35 1.32 0.146 KEK Nomura (50 bar-used) 103.3
1.6 87.3 70 3.50 0.021
At present there is no evident correlation of the measured quantities with the quality of the cleaning process. However the acquired and calculated data can be used to compare different systems, as a diagnostic tool for controlling periodically the quality of the HPR water jet, to develop and to compare the behavior of the jets produced by different nozzle geometries, nozzle head structures, water HP pumps, etc. In principle, using the measured data, one can think to “optimize” the HPR process, for instance, producing a constant pressure distribution or constant energy deposition on the cavity surface. This can be easily done changing for instance the pump pressure during the HPR process or the cavity/wand speeds. Water particle counting at HPR systems Particle measurement of the high pressure supply water (information by Tim Rothgeb, JLAB) At JLAB the particle data of the HPR supply water are counted and analyzed down stream of the final filter (0.04 µm filter). The particle counter measures particles between 0.2 µm and 1 µm. It is located off a tee that feeds a high pressure regulator, on the low pressure side. Typically values are about 1 – 2 counts per ml for cumulative counting of > 0.2 µm particles. Even if the counts are higher, no correlation between the particle counts and the cavity performance could be found. Nevertheless, it is our opinion, that these measurements are necessary in order to identify problems in the high pressure system as early as possible. A similar system at DESY is still under commissioning, but no data are available up to now. Particle measurement of the drain water At DESY the particle contamination of the drain water of the cavity rinsing is analysed [19, 20]. The rinsing water is collected in a funnel below the bottom beam tube flange of the cavity. Approximately 10 % of the rinsing water of about 1200 liter UPW is collected and filtered with a 2.0 µm membrane filter. A scanning light microscope allows the determination of size and quantity of the collected particles. Each HPR rinse following the assembly of the cavity flanges is measured separately.
TTC-Report 2008-05

33
Typically a reduction of the particulate numbers is found during the six successively HP rinses (DESY standard preparation) after EP, 1st HPR and flange assembly. No correlation between particle numbers and cavity performance is reported up to now. During the last years this technique – though basically simple – has shown a number of problems and weak points, which makes it sensible towards measurement errors. Cited as examples are: - high sensitivity of water collection system towards remaining contamination of previous rinse cycles; - complex handling and preparation of the filters until read-out; - operator dependent adjustment of the particle detection software, which may result in a lack of reproducibility. All these technical difficulties can be overcome, but make the operation elaborate. Improvements towards easier handling are desirable for routine and effective QA purposes. In order to avoid the filter handling a direct measurement of the particles using a laser particle counter is considered and has been tested. The biggest problem is the counting of air bubbles as particles, which results in a completely incorrect measurement. Therefore, an effective degassing is indispensable. The second drawback is the relatively low amount of water (typically < 100 ml/min) analyzed by a laser particle counter. Due to the lack of other working and effective quality control procedures, we recommend a drain water analysis, though it is obvious that substantially developments are necessary.
2.3.2. Canary cavity
Especially for the fast and reliable ramp-up of the HPR system after a shut-down or maintenance period, a well characterized and field-emission free single-cell cavity can be used as “canary cavity”. Despite all other QC measures, the – compared to a multi-cell cavity- fast and easy rf cold test of a single-cell cavity shows the overall quality of the HPR and all subsequent handling of the cavity. This practice is applied successfully at least at JLAB and DESY. Beyond this a demountable cavity would allow to study the cleaning effect on well defined samples, provided that the sensitivity of the system gives significant evidence.
2.3.3. Other quality control procedures
No further established quality control procedures of HPR systems are known to the authors. A trickle flow through the HPR system combined with an analysis adapter to the nozzle system allows all common low pressure water analysis techniques like TOC, bacteria, water particle counter, etc. to be applied. Though this gives only the system status at low pressure and problems may occur only during high pressure operation, this option should be part of the HPR system. Particular attention needs to be paid to the danger of bacteria contamination of the extensive dead end water pipes, which typically are existing in HPR systems. A thorough system design and QC concept is necessary in order to tackle this problem. Experience at DESY and KEK shows, that stainless steel nozzles hold the risk of damaging and widening of the nozzle after long and intensive usage. Regular checks are necessary.
2.4. Summary
A stable and reliable pure water supply is fundamental for the successful operation of High Pressure Ultrapure Water Rinse (HPR) systems. The technology of ultra pure water generation is well established and any facility should adhere to the standards. Quality control of the water system by particle monitoring, TOC, resistivity, Si contents is desirable, but not everywhere implemented in existing systems.
TTC-Report 2008-05

34
There is no optimal set of high pressure rinse parameters: as collected in Table 9, each laboratory applies its own “successful“ procedures. A measuring system has been developed at INFN for measuring high pressure water jet parameters and forces generated by the systems at the surfaces to be cleaned. Comparative measurements employing this system have been done at DESY, JLAB and KEK/Nomura Plating. Even though there are significant differences in the system parameters, there is no evident correlation of the measured quantities with the quality of the cleaning process at present. In principle the data could be used to “optimize” the HPR process, for instance, producing a constant pressure distribution or constant energy deposition on the cavity surface. However, since the adhesion forces for contaminating particles depend on particle size, nature of particle…., one needs to know more about the contamination distribution.
2.5. Supporting material
a) Literature and Standards [8] ASTM D5127-99 and update D5127-07: “Standard Guide for Ultrapure Water in
the Electronics and Semiconductor Industry” (1999 + 2007). [9] VDI 2083, Blatt 9: “Qualität, Erzeugung und Verteilung von Reinstwasser” in
German and VDI 2083, Blatt 10: “Reinstmedienversorgungssysteme” in German, VDI-Verlag, Berlin, Germany.
[10] SEMI standards: SEMI F63-0701, SEMI F49.3-0298. [11] L. Gail, H.-P. Hortig (editors), “Reinraumtechnik” in German, Springer Verlag,
ISBN 3-540-66885-3 (2002). [12] K. Saito et al., “High Gradient Performance by Electropolishing with 1300 MHz
Single and Multi-cell Niobium Superconducting Cavities”. Proc. of 9th Workshop on RF Superconductivity, Santa Fe, USA (1999), p.288-291.
[13] P. Kneisel, B. Lewis; Proc. 7th SRF-Workshop, Gif-sur-Yvette, France (1995), p. 311ff.
[14] D. Sertore et al., WEPMN021, PAC 2007, Albuquerque, NM, USA (2007). [15] E. Cavaliere et al., Physica C, 441 (2006), 254. [16] D. Sertore et al., Proc. 13th Workshop on RF Superconductivity (SRF2007), Peking
University, Beijing, China. [17] T. Higo, ILC Asia 2007-01. [18] D. Wright, J. Wolgamott, G. Zink, WJTA Conf. (2003). [19] D. Reschke, “ New Aspects of Quality Control during preparation of TTF 1.3 GHz
Cavities”, Proc. of 9th Workshop on RF Superconductivity, Santa Fe, USA (1999). [20] N. Krupka et al., “ Quality Control Update of the Clean Room for Superconducting
Multi Cell Cavities at DESY”, Proc. 12th Workshop on RF Superconductivity (SRF2005), Cornell University, Ithaca, USA (2005).
b) Table of HPR systems by P. Kneisel
TTC-Report 2008-05

35
Table 9: Collection of HPR systems and operations in different labs Item / Lab ANL/FNAL Cornell DESY
Hall 3 old DESY Hall NO, SC
INFN Jlab Production
Jlab R&D
KEK ARE2
Nomura Saclay
High pressure pump Type diaphragm Positive
displacement plunger
membrane membrane Piston (ceramic)
membrane Positive displacement plunger
Plunger diaphragm
plunger
Operating Pressure
Up to 1700 psi 1050 psi 0-249 bar used: 100 bar
150 bar 50 to 150 bar 1300-2060 psi 1200 psi 6 MPa 6 MPa 100-1500 psi
Flow Rate 4.5 GPM 2.3 GPM max 20 l/min ~400 l/hr 10 l/min 5.8 GPM 2 GPM 10 l/min 10 l/min 5 GPM
Material of pump 316TiSS SS, ceramic SS 3/1.4571 SS 1.4571 SS/bronze SS SS, ceramic SUS SUS SS
Material of membrane
PTFE N/A PTFE PTFE PTFE-M N/A Viton Ceramic
Manufacturer LEWA LDE2 M911S
CAT model 231
LEWA ES 1 Boxer
LEWA LDE1/M9/XXV1
Kaercher HD600C Interpump SEL1411
LEWA LDE3/M9/42
CAT model 241
Kaercher Model HDS 8/14C
Wanner Eng; D15XDS
CAT Pumps Model 351
High pressure wand Material of Wand 316SS SS SS, EP SS SS SS SS SS, EP
Diameter of wand
Not yet chosen
0.875” x 0.065” wall
27.63x2.8 mm 42 mm 21 mmOD 18 mm ID
¾” OD ¼” ID
½” OD ¼” ID
21.3 mm OD 19.7 mm ID
Movement of wand Variable programmable
2 rpm rotation Variable programmable
no Variable programmable
Variable programmable
no
fix
Mech.Guidance Of wand
Bosch CKK 20-145 linear rail
none slide fixed slide slide fixed
Orientation (above/below)
below below below below below below below below
TTC-Report 2008-05

36
HPR Nozzle (Used in present ANL system)
Material 17-6 SS SS sapphire SS commercial
Sapphire Commercial (Spraying system)
SS commercial
SS commercial
SUS SUS SS, EP
# of orifices 8 12 8 2 6 2 2 8 8 3
Size of orifice 0.024 “ 0.013” 0.6 mm(M8) 0.6 mm 0.55 mm 0.6 mm dia 0.6 mm dia
0.8 mm dia
Geometry of jet Holes from 150 forward to 300 backward
pinpoint 4 nozzles 300
up, 4 nozzles 300 down
Round 50
Fan, 150 Fan, 150 straight straight straight
Flow rate 4 gpm at 1750 psi
N/A 1200 l/hr ~250 l/hr 1.6 l/min 4.5 GPM 2 GPM 10 l/min 10 l/min
Filter System
Housing Material 316SS SS SS, final Ti? Ti SS, EP SS SS SUS SUS SS
Filter type cellulose membrane 10” “posidyne”
10” “posidyne”
Super Cheminert PallT-01115-1
“posidyne” “posidyne” “durapore” “durapore”
“fluorodyne”
Pore size 0.04 µm 0.1µm 0.04 µm 0.03 µm 0.05 µm 0.04 µm 0.04µm 0.22 µm 0.22 µm 0.1 µm
Filter manufacturer Domnick-Hunter Demi PREPORPES
Trac-Etch Pall ClariFlow Pall Pall Pall Millipore Millipore Pall
On-Line Water Quality Monitoring Particle count Not yet none yes yes no yes yes No No Yes
Counter type laser laser laser laser laser
TTC-Report 2008-05

37
Manufacturer HIAC/ Royco
Rion KL28
PMS PMS ARTI-ART Instruments Inc. Model HHPC6
TOC monitoring Not yet no yes Yes Anatel A10
Yes Anatel A10
yes Yes(manual)
yes no
HPR Procedure Length Not yet
determined 16 hrs 125 min/pass 60
min/pass single cell
No standard 12 hrs 0.5 to 2 hrs 15 min (single) 1 hr (9-cell)
1 hr(single) 3 hrs(9-cell)
1 hr (single)
# of passes Not yet determined
8 6 3-4 4 continuous 6 2
Cavity Movement Not yet determined
Vertical, programmable
4450 /min 4 rpm (cell), 8rpm at beamtube
0.45 – 4 rpm 2 rpm variable 22 rpm 15 rpm 9 rpm
What kind of “Scanning”?
Not yet determined
variable 1-1.5 cm /min down, fast up
Up/down (0.8-1 cm/min
3-115 mm/min up/down, variable
Down 0.2”/min
Up/down + rotating
Up/dpwn 22 mm/min
Up/dpwn 48 mm/min
Up/dpwn 4 cm/min
Protection of cavity openings
Not yet determined
Open 1. rinse SS flanges 2.rinse
SS flange 1.pass: plastic cap final pass: SS pick-up probe flange
Closed with Nb plates
Closed with Nb plates
Top:SUS-flange+filter+valve Bottom:SUS flange+gate valve Others:SUS blank
Top:SUS-flange+filter+valve Bottom:SUS flange+gate valve Others:SUS blank
open
“Cabinet” pressure Not yet determined
positiv no Positive (nitrogen)
positiv N/A none none Clean room pressure
TTC-Report 2008-05

38
Operation and maintenance of HPR system
Location Class 10 Class 100 Class 10000/100
Class 10/100
Class 100 Class 100 Chem. room
Class 1000 Class 1000
Class 100
Cabinet type or free standing
Free standing Free standing cabinet free Cabinet removable
cabinet Free standing
cabinet free free
Maintenance in “off” periods
Trickle flow none Trickle flow
Alcohol, Trickle flow possible
Trickle flow Trickle flow
Flushing 5 min before use
Flushing 5 min before use
Trickle flow
Maintenance Not yet determined
As required Annual/filter change when needed
Annual filter change + water system maintenance
Periodic filter change
Semi-annual Filter change
As required Filter replacement When pressure drop
Filter replacement When pressure drop
6 months
Completion of HPR
Cavity moved to Class 10 drying area
Class 10 on HPR stand,lower beam tube open
Class 10 All openings closed Bottom open
Class 10, Single cell: Top closed ,bottom open
Cavity is dried on HPR support
Class 10, all openings closed
Class 10, all openings closed
Close valve Class 10
Close valve, transfer to KEK by truck, move to class 10
Cavity moved to class 10, beam tubes open
TTC-Report 2008-05

39
3. Baking Procedures and optimum parameters Introduction The heat treatment of niobium cavity at moderate temperature (100 – 130 C) has a beneficial impact on its RF performances by reducing the non-quadratic losses at high accelerating field, also known as the high field Q-drop. The baking benefit persists beyond several years as reported in [21]. It is definitive as long as there is no renewal of the niobium surface (few microns scale) by chemical etching or electropolishing; on the other hand a simple oxide layer removal by hydrofluoric rinsing does not affect the “baking effect”. Baking also improves the low field BCS Q due to reduction of the electron mean free path, most likely by absorption of oxygen in the rf layer. The origin of the high field Q-drop and the mechanism of its removal by baking are not understood yet but it seems linked to a change of niobium properties at or very close to the « niobium oxide – niobium » interface. At this time two baking procedures exist: the ‘in-situ baking”, widely used in laboratories since 1998 and the “fast baking” still under investigation.
3.1. “In-situ” Baking Parameters
For in-situ baking the cavity is assembled, ready to be tested on the RF test stand, fully equipped with RF antennas, thermal sensors and the inner part of the cavity is under vacuum. The optimum value of baking parameters (Table 11) depends on the niobium grain structure (fine-grain, large grain, or single crystal) and of the type of chemistry used (electropolishing or chemical-polishing) for the surface preparation. The best temperature range and duration of treatment also depend on these specifications. The end result of the baking benefit on BCP fine-grain cavities is generally less than for EP cavities with significant variation from cavity to to cavity depending on the prior history of the surface and the Nb material. In some cases the Q-drop onset field is higher but there remains a residual Q-drop. In other cases the Q-drop is removed but the maximum field accessible is not much higher due to a quench. For large grain and single grain cavities prepared by BCP the baking benefit is almost as large as for EP treatment, although the data on this subject is still accumulating. The baking benefit is possibly linked to diffusion of interstitial oxygen, but this explanation is provisional. Fine Grain Niobium The evidence of the baking effect has been first discovered on fine grain niobium cavities, chemically-treated by BCP (Buffered Chemical Polishing) using a acid mixture (HF:HNO3:H3PO4 / 1:1:2). The parameters values vary around 105-110°C for 48-60 hours: baking has no effect at lower temperature and cavity performances are deteriorated for higher values [22]. The optimized parameters temperature-duration is about 110°C for 60 hours with BCP treatment with a narrow range [22]. On the other hand the baking benefit after electropolishing, widely reproduced in laboratories worldwide, shows better latitude in baking parameters needed for Q-drop removal. Nevertheless the optimum parameters set for fine grain cavities with electropolishing treatment converge towards 120°C for 48 hours (Table 10) [23, 24].
TTC-Report 2008-05

40
Large Grain and Single Crystal When large grain or single crystal niobium is used, treatment duration can be reduced by a factor 4: temperature around 120°C for 12 hours seems to be enough in many cases at JLAB [23] after BCP 1:1:1 chemistry. One case of baking for 6 hours on single crystal cavity after BCP 1:1:2 is reported in [24]. Even if baking at 120°C for 48 hours is routinely applied on large grain cavities at DESY [25], observation of time reduction are reported on electropolished cavities by DESY (130°C for 12 h) and KEK (see Table 10). Experimental set-up The full equipped cavity is kept under vacuum during the baking process and it is actively evacuated by an ion pump, at Saclay and KEK, or by a turbomolecular pump at JLAB and DESY. The installation required to perform baking treatment varies according to the different laboratories (Figure 12 to Figure 16). Saclay, uses the vertical cryostat in the RF test pit as the baking chamber, while dedicated boxes are used at JLAB, DESY, KEK and Cornell. Everywhere a buffer atmosphere exists between heating resistance and outer cavity walls (helium at Saclay, nitrogen at Jefferson Lab, nitrogen or argon at DESY and the air at KEK and Cornell). The advantage of such devices is the homogeneous baking of the cavity. However, the time to reach the required temperature is several hours. The different outside baking atmospheres possibly lead to a variation in the Kapitza conductivity of the Nb-He interface.
3.2. “Fast” Baking Parameters
The main disadvantage of the “in-situ” technique is the long duration over 2 days (12 hours in special cases). The condition of ultra high vacuum also requires cavity assembly before baking. The risk of leaks after baking and the long duration are costly for mass production. Studies are in progress to get around these disadvantages: A drastic reduction of baking time is possible because a strong correlation exists between baking duration and temperature, linked to the possible diffusion of interstitial oxygen. The vacuum requirement can be replaced by an inert gas atmosphere. Argon is chosen because of its atomic size to prevent any diffusion during baking and is preferred to nitrogen to avoid reaction with niobium. To perform a “fast baking” on the few hour time-scale, specific solutions have been found to decrease the temperature rise time. The use of infrared light (Figure 17) allows the temperature to reach 145°C in 5 minutes. “Fast argon baking” experiments have been carried out with success at Saclay on BCP and electropolished cavities [26]. Baking parameters (145°C / 3 hours) have been determined through the equivalence, in terms of oxygen diffusion in niobium, with the “in-situ” parameters. Fast baking experiment is continuing on an electropolished cavity (Ichiro shape) to determine the right duration (2 or 3 hours). The equivalence between “in-situ UHV baking” and “fast Argon baking” is effective in terms of high fields Q-drop removal with a good regulation [26]. Nevertheless “fast argon baking” should be preferred for cavity mass production because of the very short duration (2 or 3 hours) and the possibility to do the treatment before the assembly on an open-ended cavity in clean room.
TTC-Report 2008-05

41
References [21] B. Visentin "Low, Medium, High Field Q-Slopes Change with Surface Treatments", ICFA Beam Dynamics Newsletter n°39 (2006) p. 94-106. ICFA BD 39 2006 [22] B. Visentin et al., "A Non-Electropolished Cavity… ", EPAC2002: THPDO013 [23] D. Reschke et al., “Recent Experiment with…” SRF Workshop 2007 Beijing - CHINA (2007): SRF2007 – TUP77 [24] T. Saeki et al., " Series Tests of High Gradient Single-cell Superconducting Cavity … ", EPAC Conf. 2006 Edinburgh - UK (2006) p.756 - EPAC2006: MOPLS087 [25] G. Ciovati et al., "Performances of High Purity Nb Cavities with different Grain Sizes", LINAC Conf. 2006 Knoxville - USA (2006) p.318 - LINAC2006: TUP033 [26] P. Kneisel, “Review on Large Grain…” SRF Workshop 2007 Beijing - CHINA (2007): SRF2007 - TH102 [27] W. Singer et al., "Large Grain Superconducting Cavities at DESY ", LINAC Conf. 2006 Knoxville - USA (2006) p.327 - LINAC2006: TUP036 [28] B. Visentin et al., “Optimization of Baking Parameters…” SRF Workshop 2007 Beijing - CHINA (2007): SRF2007 – TUP69
TTC-Report 2008-05

42
Figure13: “in-situ” baking at Saclay (vertical cryostat).
TTC-Report 2008-05

43
Figure14: Baking installation at KEK for single and multi-cell cavities.
TTC-Report 2008-05

44
Figure 15: Installation at Jefferson Lab for “in-situ” baking.
TTC-Report 2008-05

45
Figure 16: Baking installation at DESY.
Figure17: “in-situ” Baking at Cornell.
TTC-Report 2008-05

46
Figure18: “Fast Baking” at Saclay with infrared heaters.
TTC-Report 2008-05

47
Table 10: General characteristics for baking
Laboratory Saclay DESY JLAB KEK Cornell
Correspondent
B. Visentin [email protected]
D. Reschke [email protected]
G. Ciovati [email protected]
F. Furuta [email protected]
E. Kako [email protected]
W. Ashmanskas [email protected]
Temperature [ºC] Baking time [h]
Fine grain Large grain
Heater Location External
environment Inside
environment Pressure [mbar]
Pump type Cavity Equipment
(RF test ready) Gasket
110
60 -
resistors cryostat
helium
vacuum 1×10⁻⁹ ionic
closed
yes Sn
helicoflex
145
2 or 3 -
infrared clean room
air
argon 1×10³
- closed
no Sn
helicoflex
120 / 130
48 48 / 12
resistors & fan
box
nitrogen / argon
vacuum 2×10⁻⁸
turbo molecular closed
yes Al
alloy
120
48 12
resistors & blower box
nitrogen
vacuum 2×10⁻⁸
turbo molecular closed
yes In
wire
ICHIRO 1-cell
120
48 12 - 48
resistors jacket
air
vacuum 1×10⁻⁸
ion closed
yes In
ICHIRO 9-cell
120
48 -
resistors box
air
vacuum 1×10⁻⁸
ion closed
yes
In / Al coated & In
STF 9-cell
120
40 – 48 -
resistors jacket
air
vacuum 2×10⁻⁹
Ion closed
yes In
helicoflex
105
48 -
resistors & blower box
air
vacuum 2×10⁻⁹
ion closed
yes Al
alloy Table 11: Baking parameters Baking “in-situ” vacuum “fast” argon Chemistry BCP EP EP Fine Grain Nb 110 ºC / 60 h 120 ºC / 48 h 145 ºC / 2-3 h Large Grain Nb 120 ºC / 12 h 120 ºC / 48 h (12 h) - Single Crystal Nb 120 ºC / 12 h (6 h) - -
TTC-Report 2008-05

48
References [1] Jacquet [2] Elmore [3] Impuretes aliminium et soufre dans les bains délectropolisage A.Aspart et al Care note
PUB -05 - 004 [4] Detlef Reschke et al., “Recent experience with nine-cell cavity performance at
DESY”, Proc. of the 13th Workshop on RF Superconductivity, Beijing, China (2007) [5] Ref NSK Saclay [6] Legnaro automated EP [7] To be published as CARE deliverable report 2007, no. 13 at
http://care.lal.in2p3.fr/Deliverables/CARE_Deliverables.htm [8] ASTM D5127-99 and update D5127-07: “Standard Guide for Ultrapure Water in the
Electronics and Semiconductor Industry” (1999 + 2007) [9] VDI 2083, Blatt 9: “Qualität, Erzeugung und Verteilung von Reinstwasser” in
German and VDI 2083, Blatt 10: “Reinstmedienversorgungssysteme” in German, VDI-Verlag, Berlin, Germany
[10] SEMI standards: SEMI F63-0701, SEMI F49.3-0298 [11] L. Gail, H.-P. Hortig (editors), “Reinraumtechnik” in German, Springer Verlag, ISBN
3-540-66885-3 (2002) [12] K. Saito et al., “High Gradient Performance by Electropolishing with 1300 MHz
Single and Multi-cell Niobium Superconducting Cavities”. Proc. of 9th Workshop on RF Superconductivity, Santa Fe, USA (1999), p.288-291
[13] P. Kneisel, B. Lewis; Proc. 7th SRF-Workshop, Gif-sur-Yvette, France (1995), p. 311ff
[14] D. Sertore et al., WEPMN021, PAC 2007, Albuquerque, NM, USA (2007) [15] E. Cavaliere et al., Physica C, 441 (2006), 254. [16] D. Sertore et al., Proc. 13th Workshop on RF Superconductivity (SRF2007), Peking
University, Beijing, China. [17] T. Higo, ILC Asia 2007-01. [18] D. Wright, J. Wolgamott, G. Zink, WJTA Conf. (2003) [19] D. Reschke, “ New Aspects of Quality Control during preparation of TTF 1.3 GHz
Cavities”, Proc. of 9th Workshop on RF Superconductivity, Santa Fe, USA (1999) [20] N. Krupka et al., “ Quality Control Update of the Clean Room for Superconducting
Multi Cell Cavities at DESY”, Proc. 12th Workshop on RF Superconductivity (SRF2005), Cornell University, Ithaca, USA (2005)
[21] B. Visentin "Low, Medium, High Field Q-Slopes Change with Surface Treatments", ICFA Beam Dynamics Newsletter n°39 (2006) p. 94-106. ICFA BD 39 2006
[22] B. Visentin et al., "A Non-Electropolished Cavity… ", EPAC2002: THPDO013 [23] D. Reschke et al., “Recent Experiment with…” SRF Workshop 2007 Beijing -
CHINA (2007): SRF2007 – TUP77 [24] T. Saeki et al., " Series Tests of High Gradient Single-cell Superconducting Cavity …
", EPAC Conf. 2006 Edinburgh - UK (2006) p.756 - EPAC2006: MOPLS087 [25] G. Ciovati et al., "Performances of High Purity Nb Cavities with different Grain
Sizes", LINAC Conf. 2006 Knoxville - USA (2006) p.318 - LINAC2006: TUP033 [26] P. Kneisel, “Review on Large Grain…” SRF Workshop 2007 Beijing - CHINA
(2007): SRF2007 - TH102 [27] W. Singer et al., "Large Grain Superconducting Cavities at DESY ", LINAC Conf.
2006 Knoxville - USA (2006) p.327 - LINAC2006: TUP036 [28] B. Visentin et al., “Optimization of Baking Parameters…” SRF Workshop 2007
Beijing - CHINA (2007): SRF2007 – TUP69
TTC-Report 2008-05

ILC R&D Board Task Force on High Gradients (S0/S1)
Request for Consultancy from TTC H. Hayano, T. Higo, L. Lilje, J. Mammosser, H. Padamsee, M. Ross, K. Saito
Version: 31-Aug-06
1 Introduction
The TTC has been addressing issues related to the high-gradient performance of bulk niobium cavities since a long time. Although very high gradients have been achieved in individual nine-cell cavities, a significant variation of maximum gradients has been observed in production-like experiments in the preparatory work for the XFEL1. For the demanded higher gradients of the ILC the current yield of the cavity preparation cycle is not sufficient. Therefore, a task force has been set up by the GDE R&D board to develop an R&D programme which addresses this issue2. The ILC R&D Task Force on High Gradients (or S1 Task Force for short) acknowledges the important work of the TTC in addressing the cavity performance issues. Specifically, the TTC has addressed the following issues related to cavity surface preparation in the past:
• A comparison of EP parameters in the various EP facilities has been compiled • A website has been set up for exchange of information and activities on EP3 • A proposal for a dedicated programme of single cells has been written up4 • A Setup to compare HPR systems5 • Experience on acid QC
The above information has entered the discussions for conceiving a focused R&D programme for the ILC on multi-cell cavities for 20076.
1 See e.g. talk by A. Matheisen: https://ilcsupport.desy.de/cdsagenda/askArchive.php?base=agenda&categ=a0561&id=a0561s3t7/document2 For S1 Task Force information see: http://www.linearcollider.org/wiki/doku.php?id=rdb:rdb_external:rdb_s1_home3 See: http://ilc-dms.fnal.gov/Members/tajima/EP/4For the TTC Proposal see: http://www.linearcollider.org/wiki/lib/exe/fetch.php?cache=cache&media=rdb%3Ardb_external%3Attc_proposal17jan2006.pdf5 See: https://ilcsupport.desy.de/cdsagenda/askArchive.php?base=agenda&categ=a0561&id=a0561s4t3/document6 This can be found on the S1 Task Force Wiki page.
TTC-Report 2008-05

2
3
The need for further information from TTC Nonetheless more specific details are required for the ILC R&D to compile a focused programme yielding high-gradient performance. Several institutes are pursuing these goals. Currently, the various setups result in a large variety of recipes. Although, the basic recipe for “final surface preparation” has been agreed upon (EP, HPR and ‘In-situ’ bakeout as described in the ILC BCD7) several other activities are not consistent between the laboratories such as after-EP rinses, rinse times etc. A significant effort has now been directed towards high gradient work on the basis of the documents mentioned above. The S1 Task Force is seeking advice on the following issues to improve the yield of the “final preparation steps” :
• Optimum cavity preparation process o A detailed list of preparation steps would be desirable.
• Optimum set of EP parameters established today • Optimum set of HPR parameters
o A proposal on how to implement a consistent and verifiable parameter set for these systems would be desirable
• Optimum set of bakeout o An optimum parameter set should include temperature, duration and
vacuum. • List of critical process parameters to be monitored during cavity preparation
o This applies to all of the processes above o Recommended monitoring devices for process control
The task force would like to request a document prepared by TTC which includes the aforementioned information. This document should serve as a guide book/manual. It is assumed that the upcoming TTC Meeting at KEK will address this with a focus on a next generation EP systems for production. The task force hopes that the resulting document will help to synchronize the efforts on the cavity preparation.
R&D towards Improvements of the Current Preparation Process
The success of the first phase R&D programme critically depends on the realization of the aforementioned issues. For the second phase of the ILC multi-cell R&D programme further improvements could be added. These improvements need to be verified in a dedicated single-cell programme which would compare several tests of single cells with improved treatments with several tests of the baseline treatment. For inclusion of improvements into the ILC R&D programme the information needs to be available by October 2007.
3.1.1 Rinsing studies Special attention has to be paid to the rinses of the cavities after the EP process. Several
7 ILC Baseline Configuration Document. This can be found at: http://www.linearcollider.org/wiki/doku.php?id=bcd:bcd_home
TTC-Report 2008-05

methods of rinsing have been proposed. The list reflects a prioritized view of the task force:
1. Oxipolishing a. HF rinsing
2. US degrease 3. Megasonic rinse with water only 4. Ethanol 5. H2O2
It is proposed that the TTC develops a focused, detailed single-cell programme studying and comparing the various rinses. This is needs to be augmented by sample studies. This should be implemented at the labs interested in the ILC as soon as possible.
3.1.2 Acid quality monitoring The quality control of the electrolyte needs further improvement. This is true for both offline measurements between EP cycles and online during the EP process. A standard set of data should include the HF content and the polarization curve amongst others. Methods for offline acid quality control should be developed in each region and compared to each other. This should be supplemented with niobium sample studies. It is acknowledged that work has already started within the XFEL framework pursued at DESY. It would be desirable to get a report of the TTC on the potential methods for analysis, so that they could be implemented and verified as soon as possible in the ILC R&D programme.
3.1.3 High Pressure Rinsing parameters A method needs to be established to make water rinsing cycles in the different labs comparable. This should follow the method proposed by P. Michelato et al. A proposal by TTC on how to implement a consistent parameter set for these systems would be welcome.
4 Final remarks The new initiative on high-gradient research originates from previous activities and achievements of TTC and naturally extends the research on cavity performance to the levels currently foreseen by the ILC.
TTC-Report 2008-05