final technical report - dspace at...
TRANSCRIPT
Laramie Projects Office Morgantown Energy Technology Center
United States Department of Energy P.O. Box 1189
Laramie, Wyoming 82070
DRAFT FINAL TECHNICAL REPORT
Contract Number: DE-FG21-87MC11090 TPO: James Westhoff
Production of Bitumen-Derived Hydrocarbon Liquids from Utah's Tar Sands
Principal Investigators: Alex G. Oblad Distinguished Professor Department of Fuels Engineering
Francis V. Hanson Associate Professor Department of Fuels Engineering
Laboratory of Coal Science, Synthetic Fuels and Catalysis Department of Fuels Engineering Salt Lake City, Utah 84112-1183
September 30, 1987 to July 31, 1988
EXECUTIVE SUMMARY
In previous work done on Utah's tar sands, it had been shown that the fluidized-bed pyrolysis
of the sands to produce a bitumen-derived hydrocarbon liquid was feasible. The research and
development work conducted in the small-scale equipment utilized as feed a number of samples from
the various tar sand deposits of Utah and elsewhere. The results obtained from these studies in yields
and quality of products and the operating experience gained strongly suggested that larger scale
operation was in order to advance this technology. Accordingly, funding was obtained from the State
of Utah through Mineral Leasing Funds administered by the College of Mines and Earth Sciences of
the University of Utah to design and build a 4-1/2 inch diameter fluidized-bed pilot plant reactor with
the necessary feeding and recovery equipment. The current United States Department of Energy
contract supplied the funds to test and operate the unit.
This report covers the calibration and testing studies carried out on this equipment. The tests
conducted with the Circle Cliffs tar sand ore gave good results. The equipment was found to operate
as expected with this lean tar sand (less than 5% bitumen saturation). The hydrocarbon liquid yield
with the Circle Cliffs tar sand was found to be greater in the pilot plant than it was in the small unit at
comparable conditions. Following this work, the program called for an extensive run to be carried out
on tar sands obtained from a large representative tar sand deposit to produce barrel quantities of liquid
product.
For the extended run, a moderately high grade ore from Whiterocks was obtained. Operation
with this grade of tar sand (8-11%) bitumen presented many difficulties, including significant problems
with ore preparation, ore feeding, and product recovery. The problems encountered and solutions
devised are described in the report in detail. The unit w as made operable and many days of operation
were accomplished. Approximately one barrel of product was made and extensively evaluated. The
overall material balance from the operation was excellent, and yields of liquid product in excess of 55
wt % of the bitumen fed to the unit were obtained. The API gravity was increased and weight percent
of the product boiling below residuum temperatures was 87.5%, as compared with only 25.4% for the
native bitumen.

The experience obtained with these studies has provided sufficient data to justify further
development of the fluidized-bed concept for tar sand processing. We feel very confident that with
further upgrading of the unit, it will be ready for around-the-clock operation with Utah's tar sands with
excellent results.
i i i

TABLE OF CONTENTS
EXECUTIVE SUMMARY ii
LIST OF FIGURES vii
LIST OF TABLES x
INTRODUCTION 1
ACQUISITION OF TAR SAND ORES 7
Circle Cliffs Tar Sand 7
Whiterocks Tar Sand 10
CHARACTERIZATION OF THE NATIVE CIRCLE CLIFFS AND WHITEROCKS BITUMENS 13
Native Bitumen Analysis 13 Bitumen Extraction and Recovery 13 Analysis of the Native Bitumen from the Circle Cliffs Tar Sand Deposit 14 Analysis of the Native Bitumen from the Whiterocks Tar Sand Deposit 17
FEED SAND PREPARATION 17
Crushing and Sizing/Screening Operations 17
DESIGN OF FLUIDIZED-BED PYROLYSIS PILOT UNIT 18
Phase I Design Concept 19 Phase II Design Concept 19 Experimental Pilot Plant Apparatus 19 Fluid Bed Reactor Assembly 24 Solids Handling System 25 Feed Sand Hopper and Screw Feeder 25 Solids Control Valve 28 Gas Handling System 35 Disengager 35 Cyclones 35 Fine Sand Filter 38 Produced Oil Recovery System 38 Instrumentation 45 Reactor Furnace 45 Fluidization Gas Preheater 50 Temperature Measurement 50 Pressure and Flow Measurement 50 Computer Control and Data Logging 50 Pilot Plant Component Calibration Experiments 51 Calibration of the Screw Feeder 51 Mass Flow Meter Calibration 54 Differential Pressure Controller Calibration 63 Rotameter Calibration 63
Computer Data Logging Calibration 63 Pressure Drop Across the Distributor Plate 63
EXPERIMENTAL OPERATING PROCEDURES 72
PRELIMINARY FLUIDIZATION TESTS 73
Glass Reactor Studies 73 Studies of Pressure Drop Fluctuations 81 Pilot Plant Reactor Fluidization Tests 88 Room-Temperature Fluidization Test with Circle Cliffs Tar Sand 88 Determination of Minimum Fluidization Velocity (Umf) by Calculation 94 High-Temperature Fluidization Test 95 Discussion of the Fluidization Test at High Temperatures 110
PRELIMINARY PYROLYSIS EXPERIMENTS 111
Circle Cliffs Tar Sand 111 Material Balance Calculations 111 Gas Yield 113 Produced Liquid Yield 114 Coke Yield 114 Characterization of the Produced Liquid from the
Circle Cliffs Pyrolysis Experiments 114 Solvent Soxhlet Extraction 114 Simulated Distillation 115 Density 120 Viscosity 120 Pour Point 121 Chemical Analysis 121 Asphaltene and Maltene Content 122
PYROLYSIS REACTOR PRODUCTION RUN WITH WHITEROCKS TAR SAND 122
DESIGN MODIFICATIONS SUGGESTED BY PRELIMINARY PYROLYSIS EXPERIMENTS AND IMPLEMENTED DURING PRODUCTION RUN 124
Feed System 124 Disengager 125 Reactor 126 Solids Control Valve 128 Product Recovery 129 Off Gas Disposal System 130
MATERIAL BALANCE FOR PRODUCTION RUN 130
ANALYSIS OF BITUMEN-DERIVED HYDROCARBON LIQUID
PRODUCED IN PRODUCTION RUN 137
DESIGN MODIFICATIONS SUGGESTED BY PRODUCTION PYROLYSIS EXPERIMENTS 138
CONCLUSIONS 148
ACKNOWLEDGEMENTS 148
v

REFERENCES 149
APPENDICES
A. COMPUTER PROGRAM FOR PILOT PLANT CONTROL AND DATA LOGGING 150
B. COMMENTS FROM PREUMINARY PILOT PLANT EXPERIMENTS 154
v i
LIST OF FIGURES
Figure Page
1. Effect of Temperature on the Yield of C5+ Hydrocarbon Liquid
During the Fluidized-Bed Pyrolysis of Bitumen-Impregnated Sandstone 2
2. Effect of Feed Sand Retention Time on the Yield of C5* Hydrocarbon
Liquid During the Fluidized-Bed Pyrolysis of Bitumen-Impregnated Sandstone 4
3. Location of the Sample Site on the Circle Cliffs Tar Sand Deposit 8
4. Location of the Sample Site on the Whiterocks Tar Sand Deposit 11
5. Fluidized-Bed Pyrolysis Pilot Plant-Phase I 20
6. Fluidized-Bed Pyrolysis Pilot Plant-Phase II 22
7. Schematic of the Solids Handling System 26
8. Diagram of the Hopper Assembly 29
9. Schematic of the Screw Feeder 31
10. Schematic of the Solids Flow Control Valve 33
11. Schematic of the Gas Flow System 36
12. Schematic of the Cyclone 39
13. Cyclone Grade Efficiency 41
14. Diagram of the Filter 43
15. Diagram of the Mist Collector 46
16. Diagram of the Control Panel 48
17. Feed Rate Test for the Circle Cliffs Tar Sand 52
18. Diagram of Purge System for Feed Hopper and Screw Feeder 55
19. Effect of Purge Gas on Screw Feeder Feed Rate 47
20. Schematic Diagram of the Mass Flow Meter Calibration System 59
21. Calibration Charts for the Mass Flow Meter 61
22. Calibration Chart for Differential Pressure Controller 64
23. Calibration Chart for Rotameter 66
24. Calibration Chart for Computer Temperature Data Logging 68
25. Pressure Drop Across the Distributor Plate 70
26. Glass Tube Fluidization Study Mass Flow Rate: 9.7 g min"1 75
27. Glass Tube Fluidization Study Mass Flow Rate: 13.0 g min"1 77
28. Glass Tube Fluidization Study Mass Flow Rate: 47.0 g min"1 79
29. Glass Tube Fluidization Study
Mass Flow Rate: 178.6 g min"1 82
30. Flow Chart for Glass Tube Reactor Studies 84
31. Glass Tube Fluidization Test at Room Temperature
Average Particle Size: 399 /tin 86
32. Particle Size Distribution; Circle Cliffs Tar Sand 90
33. Pyrolysis Reactor Fluidization Test at Room Temperature
Average Particle Size: 399 /tm 92
34. Particle Size Distribution; Circle Cliffs Spent Sand 97
35. High Temperature Fluidization Tests Average Particle Size: 345 /im; Temperature: 582 K 99
36. High Temperature Fluidization Tests Average Particle Size: 345 /tin; Temperature: 674 K 101
37. High Temperature Fluidization Tests Average Particle Size: 345 ion; Temperature: 778 K 103
38. High Temperature Fluidization Tests Average Particle Size: 345 ion; Temperature: 870 K 105
39. Effect of Temperature on the Minimum Fluidization Velocity 108
40. Boiling Point Distribution Curve for the Native Bitumen and the Bitumen-Derived Hydrocarbon Liquid Circle Cliffs Tar Sand 118
41. Flow Diagram of Fluidized-Bed Pilot Plant for Production Run 131
42. Produced Gas/Flue Gas Disposal System 133
v i i i

43. Boiling Point Distribution Curve for the Native and the Bitumen-Derived Hydrocarbon Liquid Whiterocks Tar Sand 139
44. Diagram of Proposed Solids Flow Control Valve 144
45. Proposed Sand Fines Slurry Recycle System 146
i x

LIST OF TABLES
Table Page
1. Effect of Fluidization Gas Flow Rate and the Yield of C5+
Bitumen-Derived Hydrocarbon Liquid 6
2. Solvent Extraction of Native Bitumen from Tar Sands 15
3. Analysis of the Native Bitumens from the Circle Cliffs and
Whiterocks Tar Sand Deposits 16
4. Circle Cliffs Tar Sand Particle Size Distribution 89
5. Circle Cliffs Spent Sand Particle Size Distribution 96
6. Comparison of Experimental and Theoretical Values of the Minimum Fluidization Velocity 107
7. Simulated Distillation Data Bitumen-Derived Hydrocarbon Liquid Product Circle Cliffs Tar Sand 117
8. Comparison of the Properties of the Native Bitumen and Produced Liquid
Circle Cliffs Tar Sand 123
9. Production Run Feed Sand Specifications 136
10. Simulated Distillation Data Native Bitumen and Bitumen-Derived Liquid Product Whiterocks Tar Sand 141
11. Analysis of Native Bitumen and Bitumen-Derived Liquid Product from the Whiterocks Tar Sand 142
Production of Bitumen-Derived Hydrocarbon Liquids from Utah's Tar Sands
Principal Investigators A.G. Oblad F.V. Hanson
Graduate Students S.M. Cha LC. Un D.C. Longstaff D. Shun K.P. Sunavala S.H. Sung H.P. Wang
Research Associate: J. Wiser
INTRODUCTION
The small diameter bench scale fluidized-bed reactor has been used to conduct a series of
exploratory process variable studies with the bitumen-impregnated sandstone from the tar sand deposits
of Utah. The deposits studied include Tar Sand Triangle,1,2 Sunnyside,1 Whiterocks,2'3 PR Spring,3
Circle Cliffs,4 and Asphalt Ridge5. These studies were intended to demonstrate the feasibility of the
fluidized-bed pyrolysis process as a method for the production of bitumen-derived hydrocarbon liquids
and to determine the influence of process operating variables on the product distribution and quality.
In these studies, presized tar sand was fed continuously to the fluidized-bed reactor while the coked
sand was withdrawn continuously from the bed by use of a solids control valve. The unit was operated
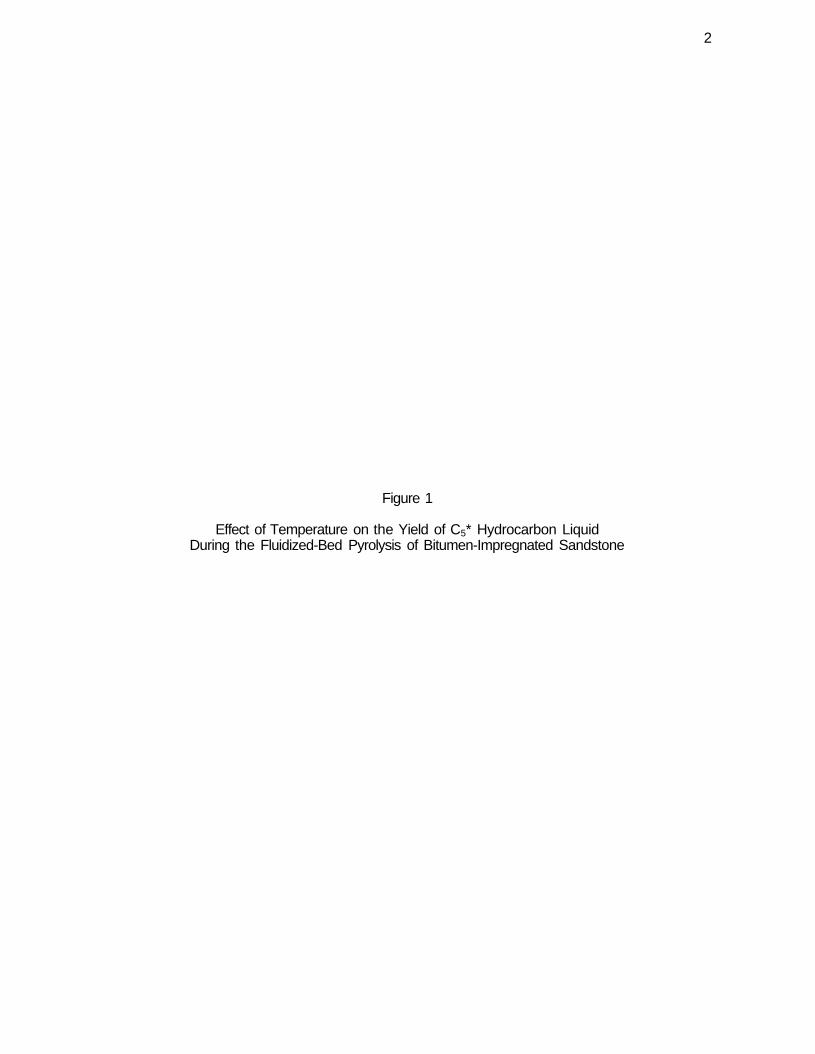
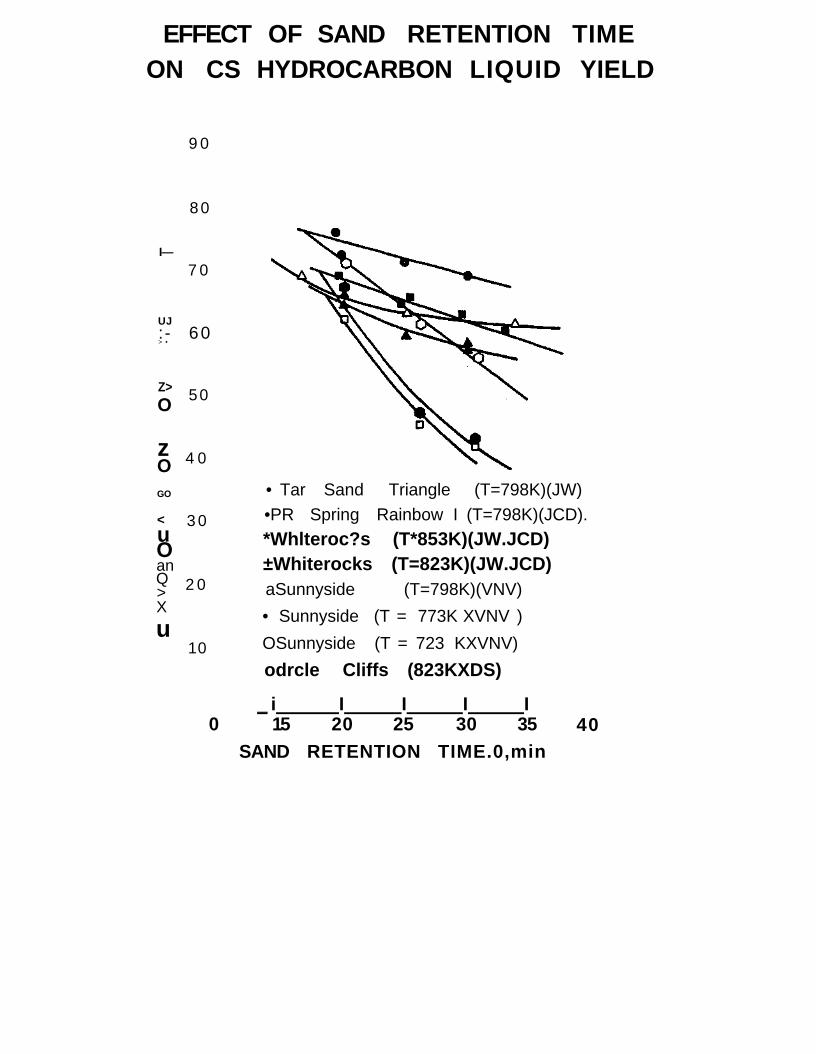
in such a way that the weight of the bed was maintained constant. The yield of C5+ bitumen-derived
hydrocarbon liquid decreased with increased pyrolysis temperature at constant feed sand retention time
and fluidizing gas flow rate (Figure 1) and increased with decreased sand retention time at constant
pyrolysis zone temperature and fluidizing gas flow rate (Figure 2). The hydrocarbon product distribution
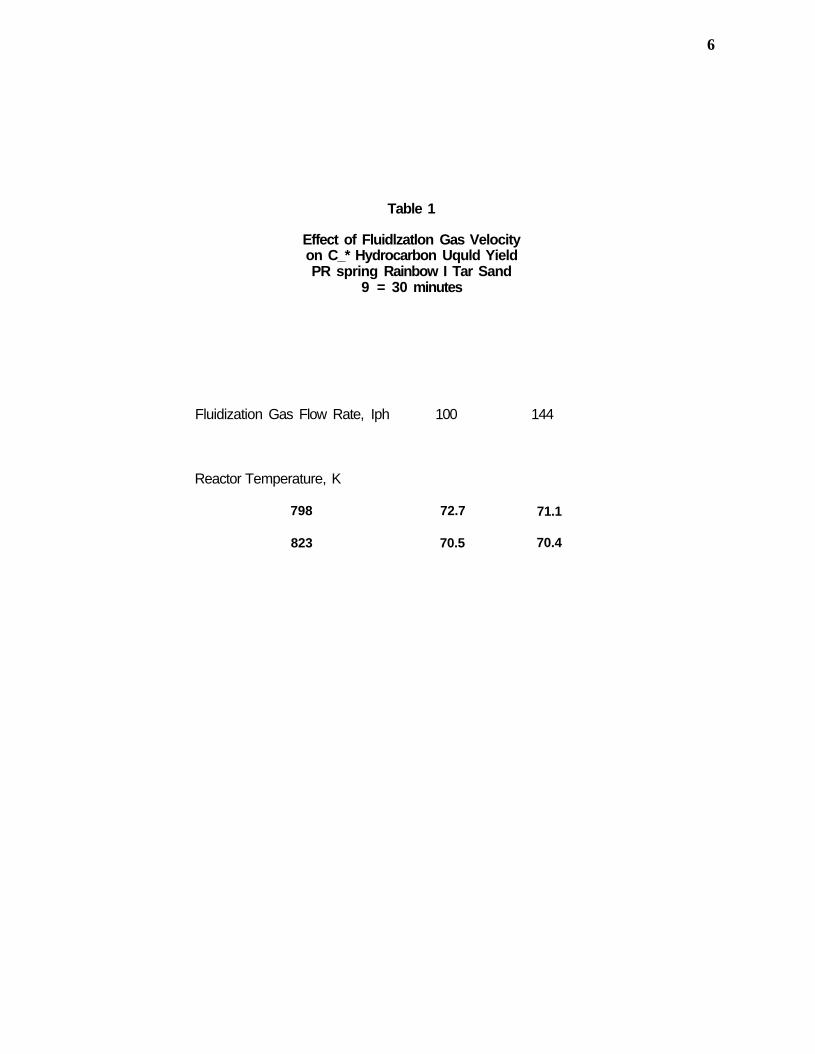
and yields appeared to be insensitive to the fluidization gas velocity in the rate of velocities investigated:
up to three times the minimum fluidization gas flow rate (Table 1). The carbonaceous residue yields
were independent of process operating variables above a pyrolysis zone temperature of 723 K; however,
the coke yields were dependent upon the source of the tar sand feed. The most important operating
variables were determined to be the pyrolysis reactor temperature and the sand retention time in the
2
Figure 1
Effect of Temperature on the Yield of C5* Hydrocarbon Liquid During the Fluidized-Bed Pyrolysis of Bitumen-Impregnated Sandstone
3
EFFECT OF TEMPERATURE ON CJ HYDROCARBON LIQUID YIELD
90
80
-> 70 1X1
2 60 13
50 -
4 0
3 0
2 0
• Circle Cliffs (0=21.6min)(DS) • PR Spring Rainbow I (9 = 20min)(JCD)
_ 0 PR Spring Rainbow E (9 = 20min)( JCD) O PR Spring South (9= 27.1 min)( JCD) OSunnyside(9 = 27. 2 min )(VNV ) • Tar Sand Triangle (9 = 24.8 min)( JW) oTar Sand Triangle (9= 27.2 min )(VNV) AWhiterocks (9 = 20min)(JW.JCD) *Whiterocks (9=25min)(JW.JCD)
! I I I I I 648 673 698 723 748 773 798 823 848 873 898
REACTOR TEMPERATURE, K
A
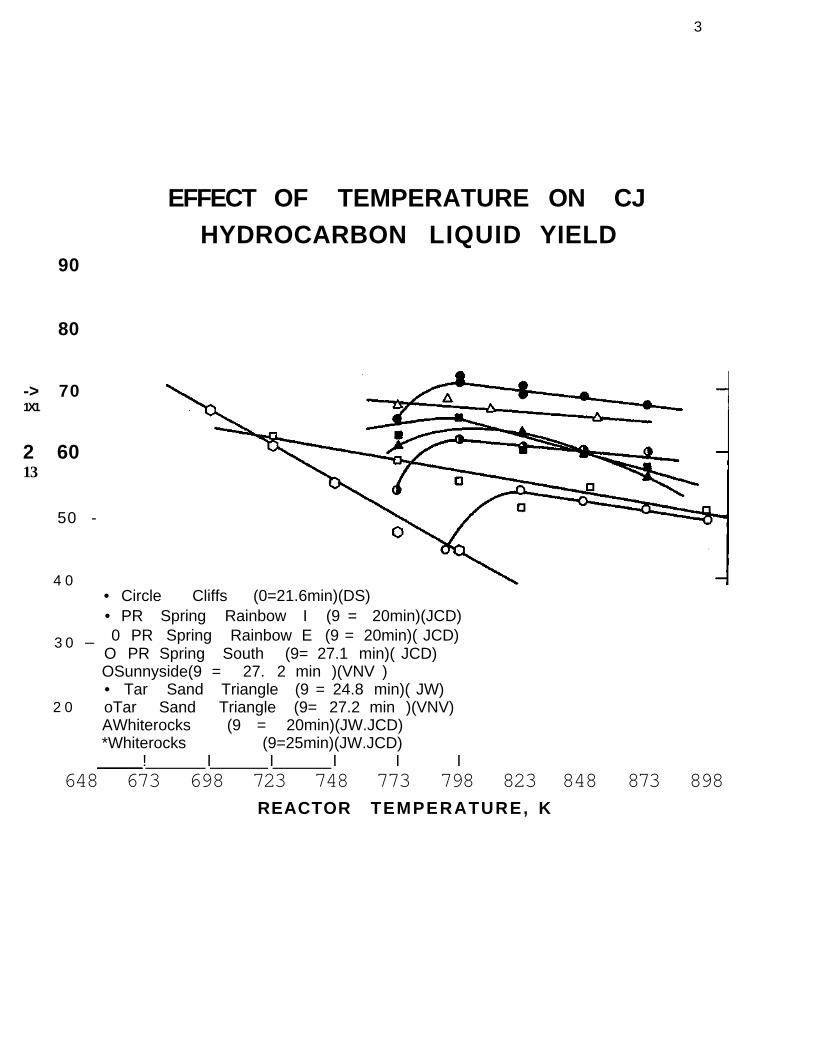
Figure 2
Effect of Feed Sand Retention Time on the Yield of C5+ Hydrocarbon Liquid
During the FIuidized-Bed Pyrolysis of Bitumen-Impregnated Sandstone
EFFECT OF SAND RETENTION TIME ON CS HYDROCARBON LIQUID YIELD
I—
UJ
> •
Z>
O
z O GO
< u O an Q > X
u
9 0
80
7 0
: - 60
50
4 0
3 0
2 0
10
• Tar Sand Triangle (T=798K)(JW) •PR Spring Rainbow I (T=798K)(JCD). *Whlteroc?s (T*853K)(JW.JCD) ±Whiterocks (T=823K)(JW.JCD) aSunnyside (T=798K)(VNV)
• Sunnyside (T = 773K XVNV )
OSunnyside (T = 723 KXVNV)
odrcle Cliffs (823KXDS)
_ i I I I I 0 15 20 25 30 35
SAND RETENTION TIME.0,min 40
6
Table 1
Effect of Fluidlzatlon Gas Velocity on C_* Hydrocarbon Uquld Yield PR spring Rainbow I Tar Sand
9 = 30 minutes
Fluidization Gas Flow Rate, Iph 100 144
Reactor Temperature, K
798
823
72.7
70.5
71.1
70.4

7
pyrolysis zone. In general, the most significant variable affecting the product distribution appeared to
be the sand retention time at a fixed pyrolysis zone temperature.
The quality of the produced hydrocarbon liquids was superior to that of the native bitumen.
The product distribution and yields were quantitatively correlated by the Conradson carbon residue, the
atomic hydrogen-to-carbon ratio, and the asphaltene content of the native bitumen. The ranges of
process operating variables studied in the bench-scale fluidized-bed reactor studies were limited by the
quality of fluidization achieved in the small-diameter reactor. Thus, it was recognized that shorter sand
retention times could only be achieved in a larger diameter reactor.
The mined ores from the Circle Cliffs and Whiterocks tar sand deposits were selected for use
in the production run studies in the large-diameter reactor. The Circle Cliffs tar sand was chosen for
the preliminary experiments because the crushed and sized ore exhibited excellent Theological
properties in the screw feeder and in the fluidized bed due to its low bitumen saturation (~ 4 wt%).
The Whiterocks tar sand was chosen for the production-run experiments because of its intermediate
bitumen saturation (~ 8-11 wt%), the availability of fresh run-of-mine ore and the uniform size
distribution sand grains of the Navajo sandstone reservoir rock.
ACQUISITION OF TAR SAND ORES
The tar sand ores from the Circle Cliffs and Whiterocks tar sand deposits were acquired in the
field by the Laboratory of Coal Science, Synthetic Fuels and Catalysis. In each case, the deposit was
dynamited to expose unweathered bitumen-impregnated sandstone. The freshly exposed tar sands
were then dynamited so that the ore could be collected for use in the fluidized-bed process studies.
Circle Cliffs Tar Sand
The bitumen-impregnated sandstone from the Circle Cliffs tar sand deposit used in this
investigation was acquired through Kirkwood Oil and Gas Exploration and Production of Casper,
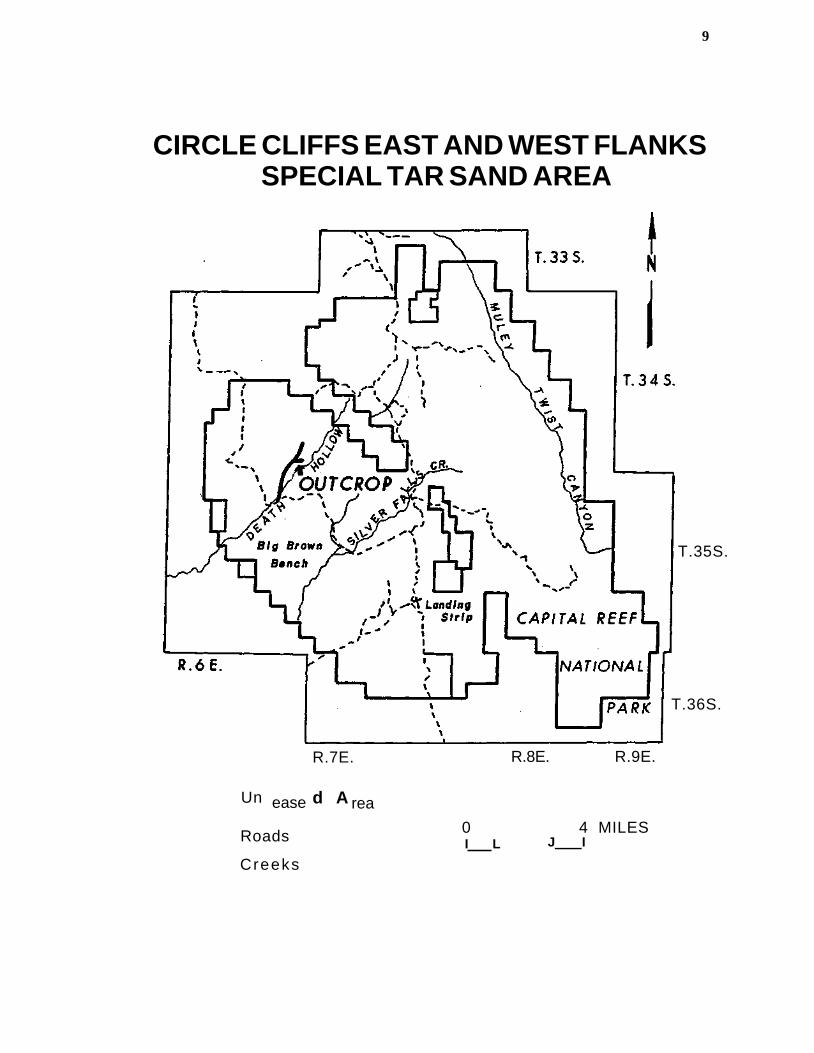
Wyoming. The location of the sample site is indicated on the map of the Circle Cliffs deposit presented
in Figure 3. Initially, an outcrop of the deposit was located and a section of the outcrop was dynamited

Figure 3
Location of the Sample Site on the Circle Cliffs Tar Sand Deposit
9
CIRCLE CLIFFS EAST AND WEST FLANKS SPECIAL TAR SAND AREA
T.35S.
T.36S.
R.7E. R.8E.
Un ease d A rea
Roads
Creeks
0 I L
R.9E.
4 MILES J I
10
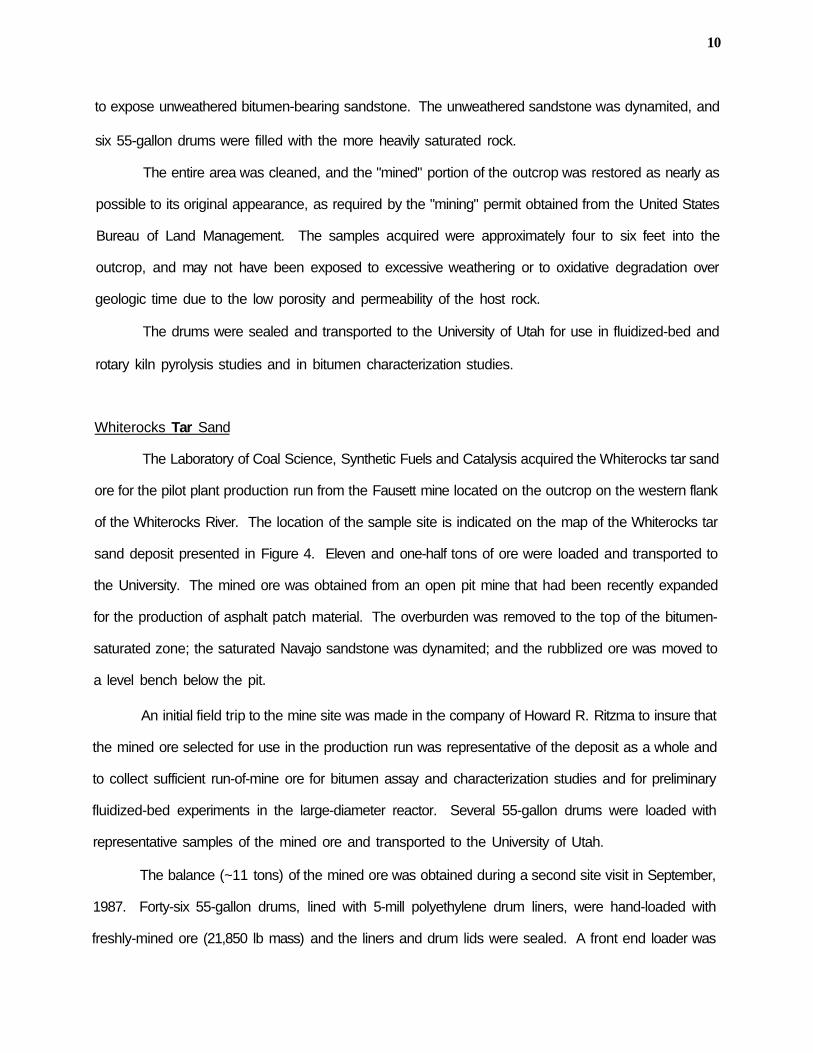
to expose unweathered bitumen-bearing sandstone. The unweathered sandstone was dynamited, and
six 55-gallon drums were filled with the more heavily saturated rock.
The entire area was cleaned, and the "mined" portion of the outcrop was restored as nearly as
possible to its original appearance, as required by the "mining" permit obtained from the United States
Bureau of Land Management. The samples acquired were approximately four to six feet into the
outcrop, and may not have been exposed to excessive weathering or to oxidative degradation over
geologic time due to the low porosity and permeability of the host rock.
The drums were sealed and transported to the University of Utah for use in fluidized-bed and
rotary kiln pyrolysis studies and in bitumen characterization studies.
Whiterocks Tar Sand
The Laboratory of Coal Science, Synthetic Fuels and Catalysis acquired the Whiterocks tar sand
ore for the pilot plant production run from the Fausett mine located on the outcrop on the western flank
of the Whiterocks River. The location of the sample site is indicated on the map of the Whiterocks tar
sand deposit presented in Figure 4. Eleven and one-half tons of ore were loaded and transported to
the University. The mined ore was obtained from an open pit mine that had been recently expanded
for the production of asphalt patch material. The overburden was removed to the top of the bitumen-
saturated zone; the saturated Navajo sandstone was dynamited; and the rubblized ore was moved to
a level bench below the pit.
An initial field trip to the mine site was made in the company of Howard R. Ritzma to insure that
the mined ore selected for use in the production run was representative of the deposit as a whole and
to collect sufficient run-of-mine ore for bitumen assay and characterization studies and for preliminary
fluidized-bed experiments in the large-diameter reactor. Several 55-gallon drums were loaded with
representative samples of the mined ore and transported to the University of Utah.
The balance (~11 tons) of the mined ore was obtained during a second site visit in September,
1987. Forty-six 55-gallon drums, lined with 5-mill polyethylene drum liners, were hand-loaded with
freshly-mined ore (21,850 lb mass) and the liners and drum lids were sealed. A front end loader was

11
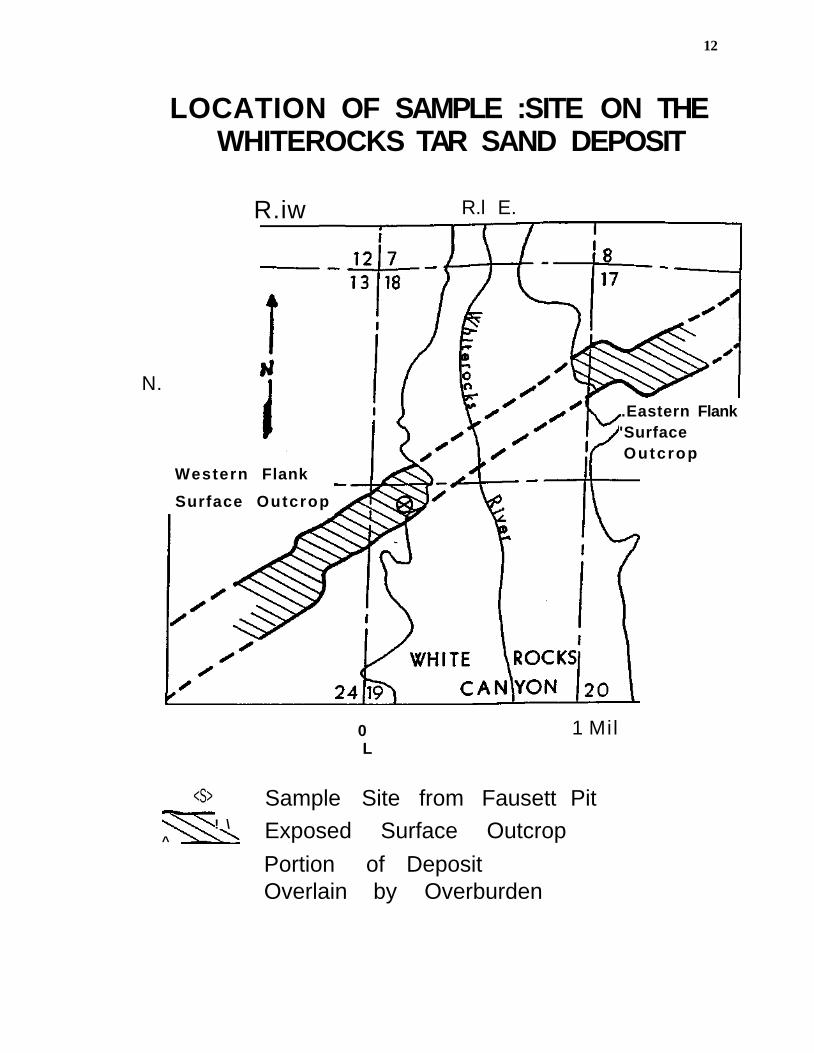
Figure 4
Location of the Sample Site on the Whiterocks Tar Sand Deposit
12
LOCATION OF SAMPLE :SITE ON THE WHITEROCKS TAR SAND DEPOSIT
R.iw R.l E.
N.
Western Flank
Surface Outcrop
.Eastern Flank 'Surface Outcrop
0 L
1 Mil
<S> ! \
^
Sample Site from Fausett Pit Exposed Surface Outcrop
Portion of Deposit Overlain by Overburden
13
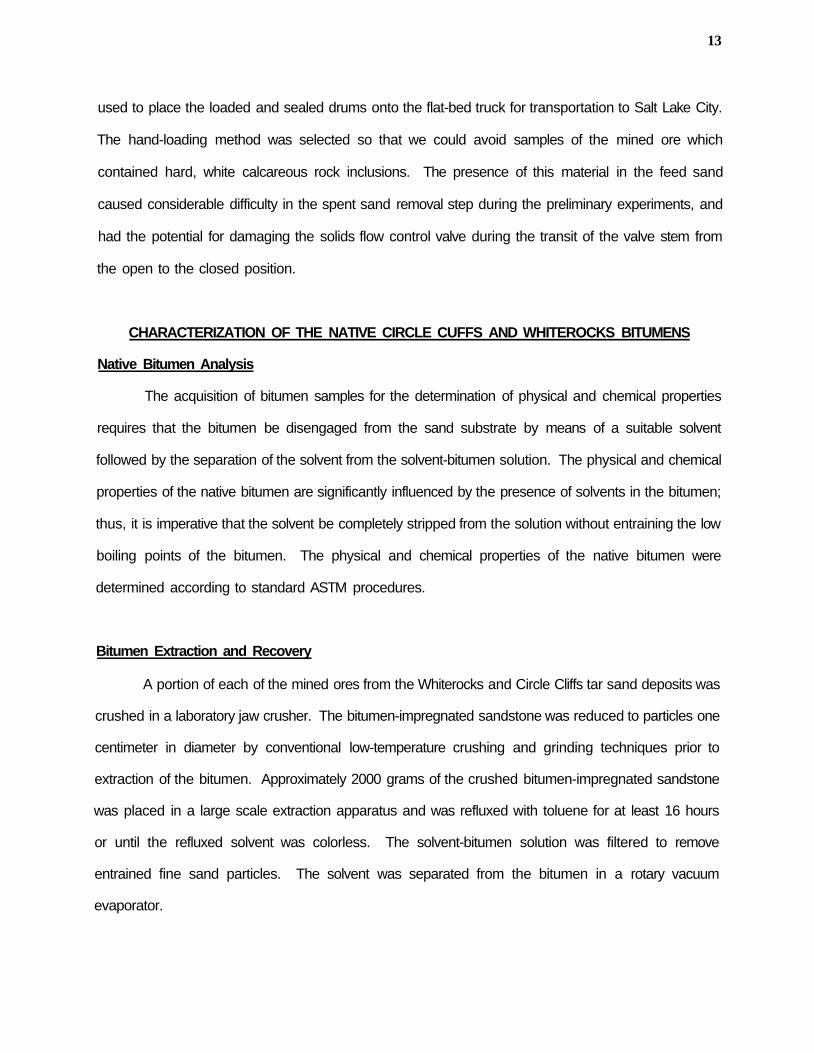
used to place the loaded and sealed drums onto the flat-bed truck for transportation to Salt Lake City.
The hand-loading method was selected so that we could avoid samples of the mined ore which
contained hard, white calcareous rock inclusions. The presence of this material in the feed sand
caused considerable difficulty in the spent sand removal step during the preliminary experiments, and
had the potential for damaging the solids flow control valve during the transit of the valve stem from
the open to the closed position.
CHARACTERIZATION OF THE NATIVE CIRCLE CUFFS AND WHITEROCKS BITUMENS
Native Bitumen Analysis
The acquisition of bitumen samples for the determination of physical and chemical properties
requires that the bitumen be disengaged from the sand substrate by means of a suitable solvent
followed by the separation of the solvent from the solvent-bitumen solution. The physical and chemical
properties of the native bitumen are significantly influenced by the presence of solvents in the bitumen;
thus, it is imperative that the solvent be completely stripped from the solution without entraining the low
boiling points of the bitumen. The physical and chemical properties of the native bitumen were
determined according to standard ASTM procedures.
Bitumen Extraction and Recovery
A portion of each of the mined ores from the Whiterocks and Circle Cliffs tar sand deposits was
crushed in a laboratory jaw crusher. The bitumen-impregnated sandstone was reduced to particles one
centimeter in diameter by conventional low-temperature crushing and grinding techniques prior to
extraction of the bitumen. Approximately 2000 grams of the crushed bitumen-impregnated sandstone
was placed in a large scale extraction apparatus and was refluxed with toluene for at least 16 hours
or until the refluxed solvent was colorless. The solvent-bitumen solution was filtered to remove
entrained fine sand particles. The solvent was separated from the bitumen in a rotary vacuum
evaporator.

14
The recovered solvent and the solvent-free bitumen were analyzed chromatographically to
determine the extent of bitumen entrainment during the evaporation procedure and to assess the
amount of solvent remaining in the bitumen. If extreme care is not taken during the evaporation step,
one to two percent of the bitumen can be entrained with the solvent while 0.2 to 0.4 percent of the
solvent can remain with the bitumen. The amount of residual solvent in the bitumen is a function of
the nature of the solvent and of the bitumen.
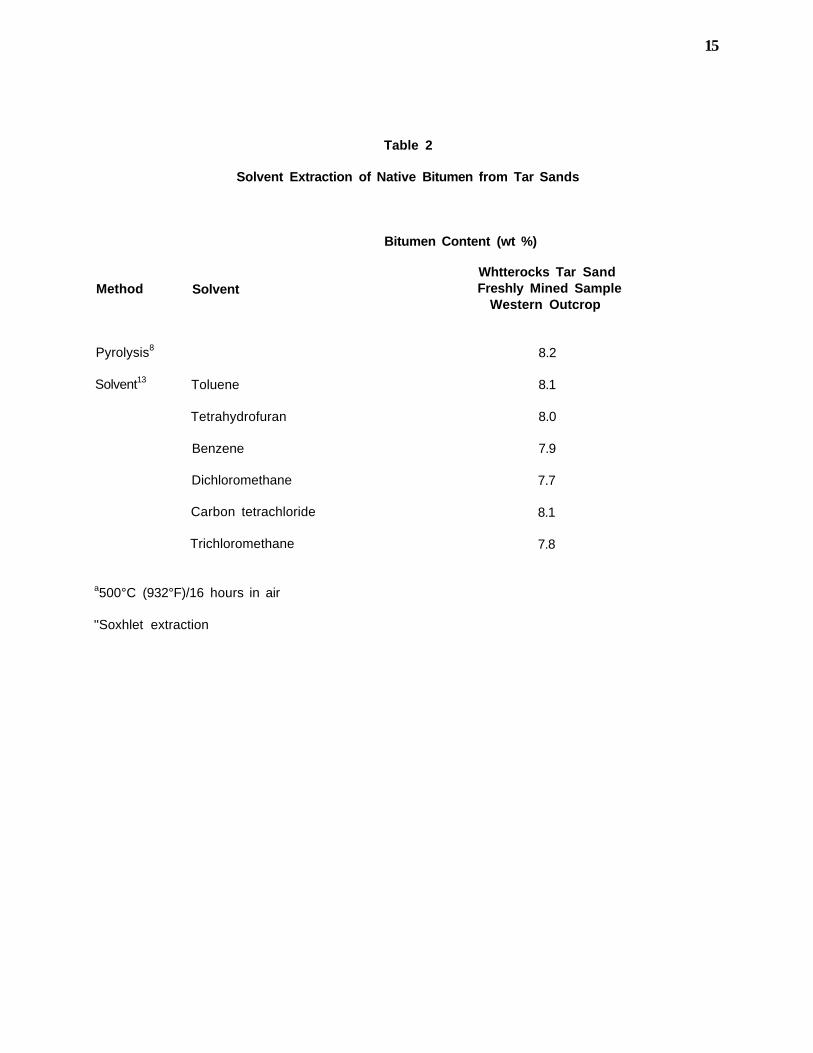
A series of experiments was conducted to evaluate the efficiency of a series of hydrocarbon
solvents for the extraction of the bitumen from the ore from the Whiterocks tar sand. The solvents
selected for evaluation included toluene, benzene, tetrahydrofuran, dichloromethane, carbon
tetrachloride, and trichloromethane. The results of these extraction experiments are reported in Table
2. Toluene was the most effective solvent for the extraction of the bitumen from the Whiterocks tar
sand, and extracted 99 percent of the bitumen from the sand substrate. The consistently high
separation efficiency of toluene and its relative safety compared to the other solvent candidates led to
its selection as the primary solvent for the extraction of bitumen samples in the investigation of the
fluidized-bed pyrolysis of the Circle Cliffs and Whiterocks tar sands. The residual amount of toluene
left in the bitumen was generally below the detectable limit of 0.25 weight percent.
Analysis of the Native Bitumen from the Circle Cliffs Tar Sand Deposit
The contention of R'rtzma6 that the Circle Cliffs bitumen was a poor or low quality bitumen
relative to other Utah tar sand bitumens, coupled with the lack of data in the literature, required that
the Circle Cliffs bitumen be extensively analyzed in this study. Samples of the native Circle Cliffs
bitumen which contained less than 0.25 weight percent retained solvent (toluene) were used for the
chemical, physical, and spectroscopic characterization studies. The physical and chemical properties
of the bitumen that are routinely determined are reported in Table 3 for the Circle Cliffs bitumen. Only
the gravity of the Circle Cliffs bitumen, 14.3°API, appears to differ significantly from the data reported
in the literature.
15
Table 2
Solvent Extraction of Native Bitumen from Tar Sands
Method Solvent
Bitumen Content (wt %)
Whtterocks Tar Sand Freshly Mined Sample
Western Outcrop
Pyrolysis8
Solvent13 Toluene
Tetrahydrofuran
Benzene
Dichloromethane
Carbon tetrachloride
Trichloromethane
8.2
8.1
8.0
7.9
7.7
8.1
7.8
a500°C (932°F)/16 hours in air
''Soxhlet extraction
16
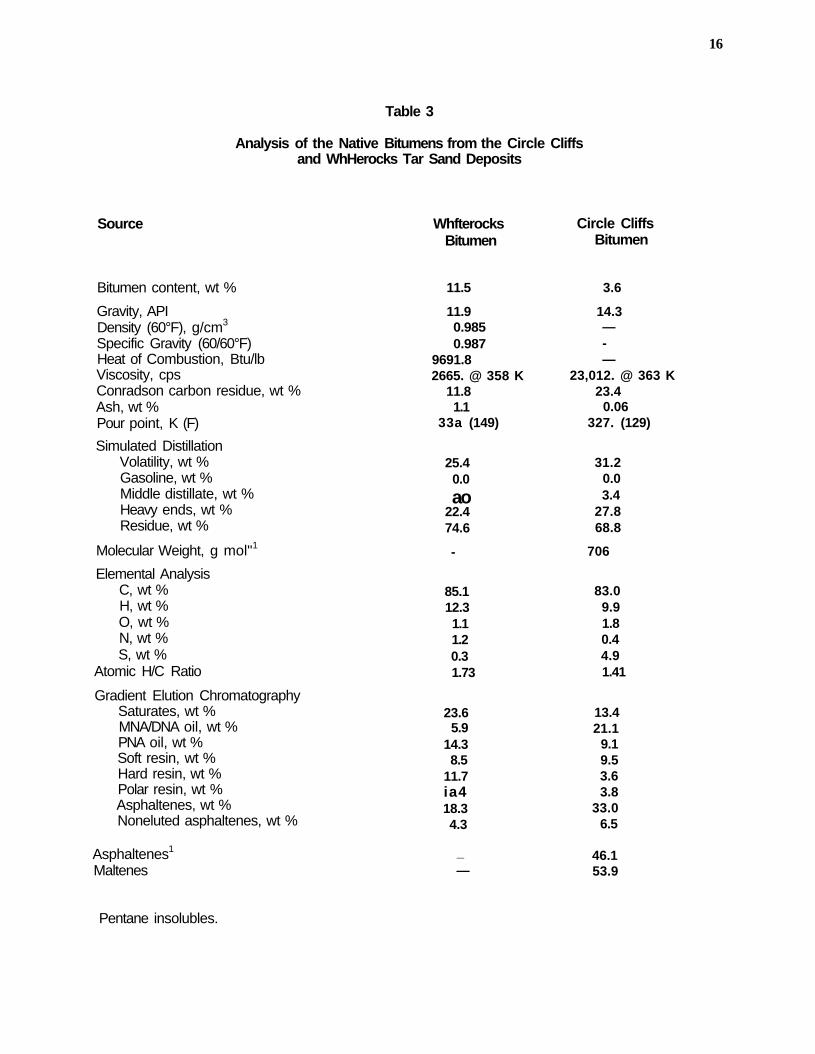
Table 3
Analysis of the Native Bitumens from the Circle Cliffs and WhHerocks Tar Sand Deposits
Source Whfterocks Bitumen
Circle Cliffs Bitumen
Bitumen content, wt %
Gravity, API Density (60°F), g/cm3
Specific Gravity (60/60°F) Heat of Combustion, Btu/lb Viscosity, cps Conradson carbon residue, wt % Ash, wt % Pour point, K (F)
Simulated Distillation Volatility, wt % Gasoline, wt % Middle distillate, wt % Heavy ends, wt % Residue, wt %
Molecular Weight, g mol"1
Elemental Analysis C, wt % H, wt % O, wt % N, wt % S, wt %
Atomic H/C Ratio
Gradient Elution Chromatography Saturates, wt % MNA/DNA oil, wt % PNA oil, wt % Soft resin, wt % Hard resin, wt % Polar resin, wt % Asphaltenes, wt % Noneluted asphaltenes, wt %
Asphaltenes1
Maltenes
11.5
11.9 0.985 0.987
9691.8 2665. @ 358 K
11.8 1.1
33a (149)
25.4 0.0
ao 22.4 74.6
-
85.1 12.3 1.1 1.2 0.3 1.73
23.6 5.9
14.3 8.5
11.7 ia4 18.3 4.3
_ —
3.6
14.3 — -—
23,012. @ 363 K 23.4
0.06 327. (129)
31.2 0.0 3.4
27.8 68.8
706
83.0 9.9 1.8 0.4 4.9 1.41
13.4 21.1
9.1 9.5 3.6 3.8
33.0 6.5
46.1 53.9
Pentane insolubles.
17
Analysis of the Native Bitumen from the Whiterocks Tar Sand Deposit
The physical and chemical properties of the native Whiterocks bitumen from the western flank
outcrop are presented in Table 3. The high quality of the native bitumen is obvious from the atomic
hydrogen-to-carbon ratio, the gradient elution chromatographic analysis, and the Conradson carbon
residue. Furthermore, the properties determined for the native bitumen were consistent with data
reported in the literature.
FEED SAND PREPARATION
A major cost in any mining-surface recovery process scheme will be the size reduction step
from run-of-mine ore to the size consist required for the specific surface recovery process. This is
especially true for the consolidated host rock found in the majority of Utah's tar sand deposits.
Although energy consumption in the size reduction or crushing operation was not a source of concern
for the overall pilot plant operation, it did provide an opportunity to gain some insight into the difficulties
which might be experienced with a field pilot plant operating in the continuous mode. Not only was
the mined ore from the Whiterocks tar sand deposit consolidated, it was also heavily saturated, 8-11.5
weight percent bitumen. Thus, the crushed ore tended to agglomerate during the size reduction step.
Crushing and Sizing/Screening Operations
The initial feed preparation procedure included crushing the run-of-mine ore in an eight-inch jaw
crusher followed by screening through a screen with 1/2-inch openings. The crushed and screened
tar sand was mixed with spent sand. The mixture of fresh and spent sand was placed in a 30-gallon
drum and rolled in an attempt to achieve complete mixing prior to use as feed to the pyrolysis reactor.
This method, while producing a feed sand which could be adequately fed to the reactor, was quite
labor-intensive and was used only to prepare feed material for the short-term preliminary runs.
The feed preparation scheme was significantly modified for the preparation of large quantities
of feed sand for the production run experiments. A feed preparation train consisting of a jaw crusher,

18
a roller crusher, and a power screen was set up and used to prepare barrel quantities of crushed and
sized Whiterocks tar sand ore. The ore which did not pass through the 1/2-inch openings in the screen
was recycled to the roller crusher for further size reduction. The crushing operations were complicated
by the high bitumen saturation of the run-of-mine ore. The primary size reduction in the jaw crusher
was facilitated by maintaining a thin film of water on the jaw faces during the crushing operation. This
film prevented agglomeration of the crushed tar sand on the faces of the jaw crusher, thus permitting
continuous operation of the crusher. Agglomeration and plugging of the roller crusher was avoided by
mixing the crushed ore from the jaw crusher with spent sand produced in the tar sand pyrolysis
process. The crushed and screened feed sand was blended with spent sand in a cement mixer to
produce a homogeneous mixture which was easily fed to the reactor on a continuous basis.
A critical factor in the crushing operation was the temperature of the run-of-mine ore to be
crushed. The ore was cooled to 32-36°F prior to primary crushing, and at this temperature, the
crushing operation proceeded smoothly.
DESIGN OF FLUIDIZED-BED PYROLYSIS PILOT UNIT
The influence of process operating variables on the product distribution and the yields has been
investigated in a small scale fluidized-bed pyrolysis unit originally designed and constructed by
Venkatesan.1 The system was subsequently modified by Wang,2 Dorius,3 and Shun.4 The apparatus
was a continuous bench-scale fluidized-bed reactor, designed for a maximum throughput capacity of
2.25 kilograms of feed sand per hour. Venkatesan studied the effects of reactor temperature, solids
retention time, and feed sand particle size using a reactor that was 1.38 inches in diameter and 35
inches long. Extrapolation of the data in both the retention time and particle size indicated the need
for a larger diameter reactor.
Dorius3 studied the effects of the same process variables on three distinctly different feed sands,
PR Spring Rainbow I, PR Spring Rainbow II, and PR Spring South, from a single deposit. The amount
of carbonaceous residue on the sand was a function of the feed properties, but the data from all three
samples also pointed to shorter residence times and larger particle size in order to maximize liquid yield
19
and minimize the gas produced. Therefore, a continuous flow, pilot plant scale fluidized-bed reactor
system was designed and fabricated for the study of the pyrolysis of bitumen-impregnated sandstone.
The design, construction, and operation of the system were intended to take place in two
phases.
Phase I Design Concept
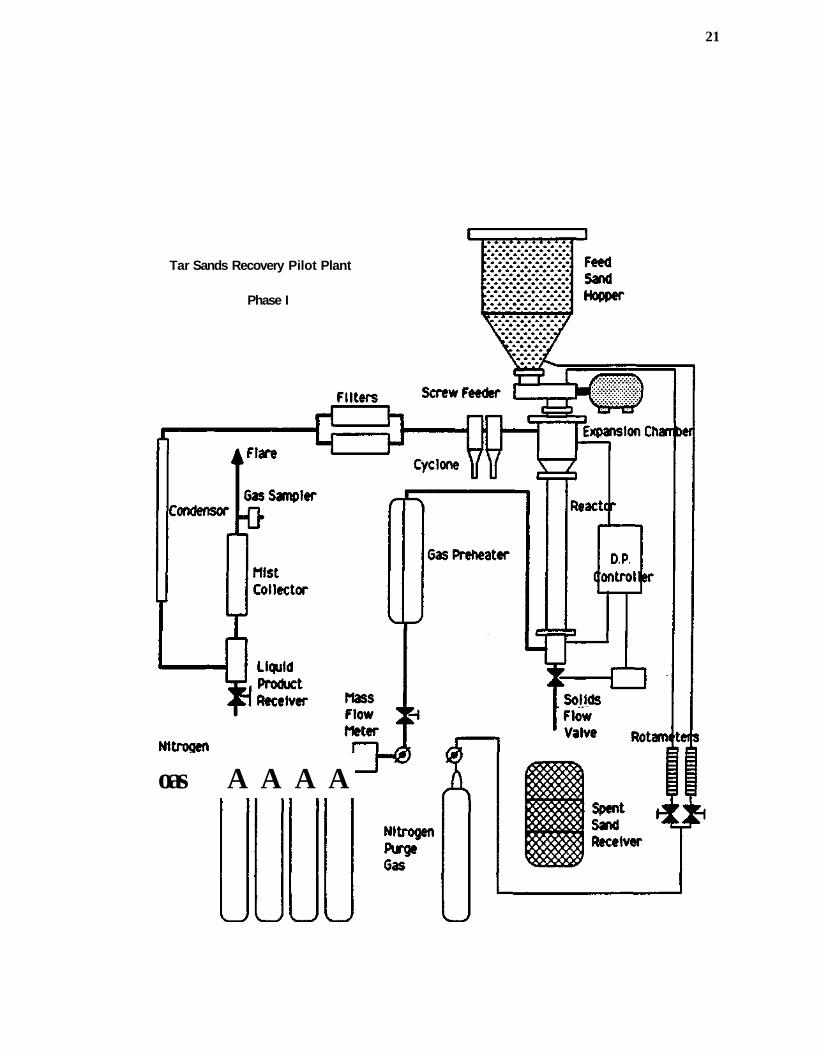
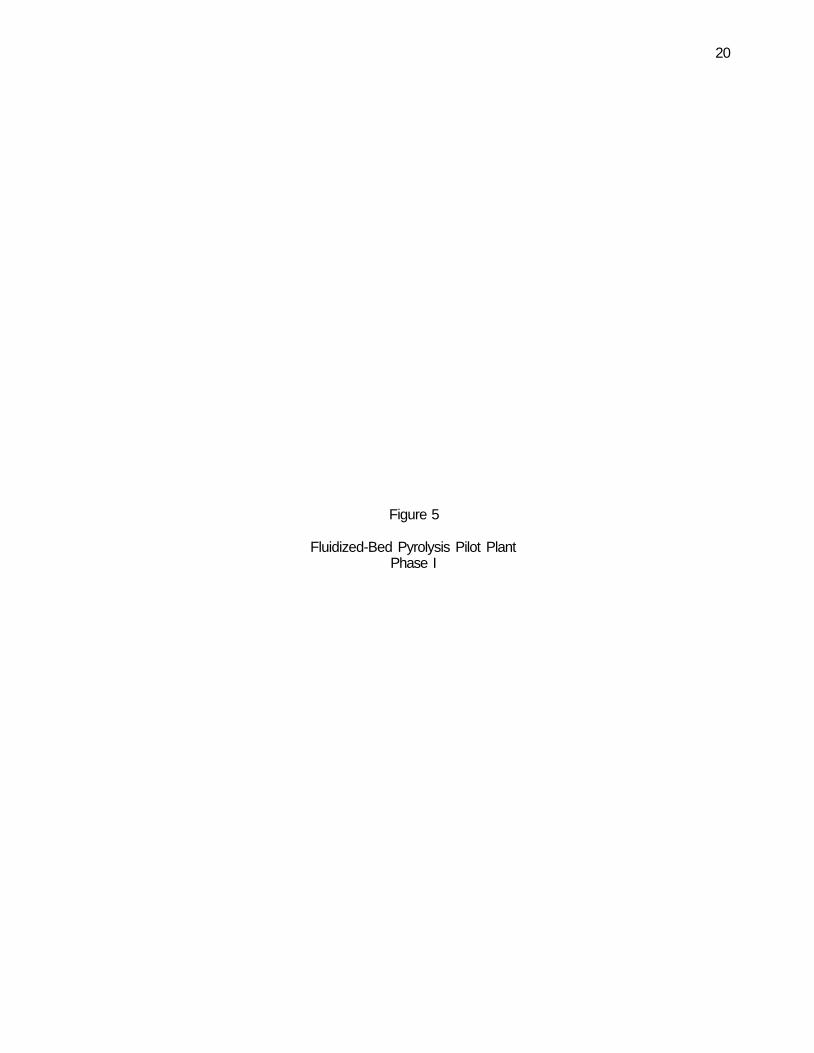
Phase I (Figure 5) was designed for once-through operation with regard to the fluidizing gas.
A bank of high pressure nitrogen cylinders or a liquid nitrogen tank supplied the fluidizing gas to the
system. The fine sand particles were separated from the sweep gas in the cyclone-filter train. The
condensible vapors were separated from the sweep gas in a product recovery train which consisted
of a condenser, a cyclone, and a fiber mist eliminator system. The sweep gas (N2) and the non-
condensible gases leaving the system were sampled and vented. Operating variables were set
manually and the data was logged on an IBM micro computer. The data logged included the
disengager, preheater, and reactor assembly temperatures, and the product recovery system
temperatures for the cyclone and filter.
Phase II Design Concept
In Phase II (Figure 6), a fluidizing gas recycle compressor/blower will be incorporated into the
apparatus. This will allow the bed to be fluidized using the hydrocarbon gases produced in the
pyrolysis process. Phase II will also incorporate automatic process control using the IBM PC-XT used
in Phase I.
Experimental Pilot Plant Apparatus
The basis for the design included the following considerations:
• the unit had to operate continuously for 48 hours or longer;
• the feed system had to accept feed sand particle sizes up to 0.50 inch;
• the system had to achieve solids retention times of 4-25 minutes;
21
Tar Sands Recovery Pilot Plant
Phase I
oas A A A A
20
Figure 5
Fluidized-Bed Pyrolysis Pilot Plant Phase I

22
Figure 6
Fluidized-Bed Pyrolysis Pilot Plant Phase II

23
Tar Sands Recovery Pilot Plant
Phase II
Condensor
r Cyclone y
Filters Screw Feeder mmmm •
Expansion Charr ier
v a f
Liquid Product Receiver
Mist Collector
Gas Preneater
Vent
Combust! Furnace
I n
I Furnace J I
Nitrogen Fluldlzlng Gas
^ Mass X^Flow
Meter
£OT?
Reactc r
D.P. (tontrolfcr
Solids Flow V a , v e Rotamjteils
V J V t
25
The height of the bed inside the reactor was controlled using a differential pressure (DP)
controller. Tar sand was continuously added to the reactor, making it necessary to continuously remove
spent sand at approximately the same rate in order to maintain a constant solids inventory in the
reactor. The DP controller operated a solids control valve which allowed the spent sand to pass from
the reactor to the spent sand receiver. The DP cell measured the pressure drop across the reactor
using pressure taps installed below the gas distributor plate and in the disengager. One of the
characteristics of a fluidized bed is that the pressure drop across the bed is equal to its static head.
The Foxboro DP controller accurately controlled the pressure drop across the bed and kept the bed
height constant by allowing the sand to flow out of the reactor. Under these conditions, the retention
time was determined by the feed rate. The faster tar sand was fed to the reactor, the shorter the
sand retention time in the bed.
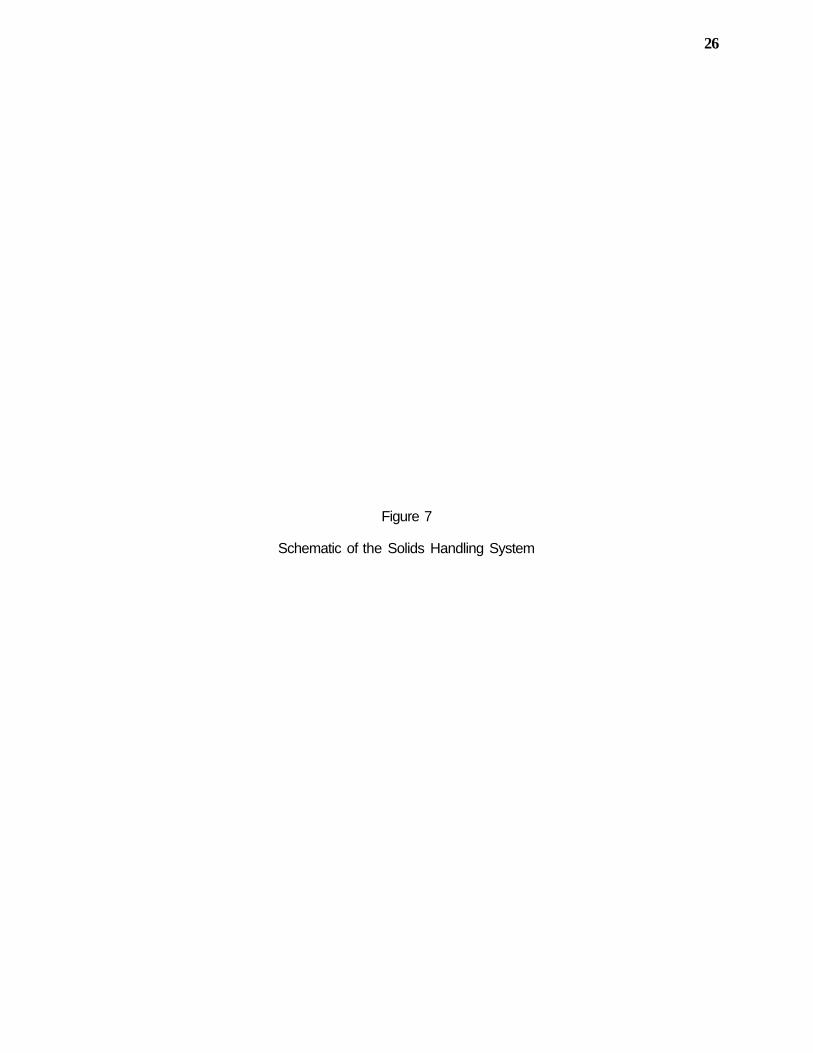
Solids Handling System
Crushed and presized feed tar sand was fed to the reactor from the storage hopper under free
fall conditions by means of a screw feeder. The coked sand was continuously withdrawn from the
reactor through the solids control valve. A schematic diagram of the solids handling system is
presented in Figure 7.
Feed Sand Hopper and Screw Feeder
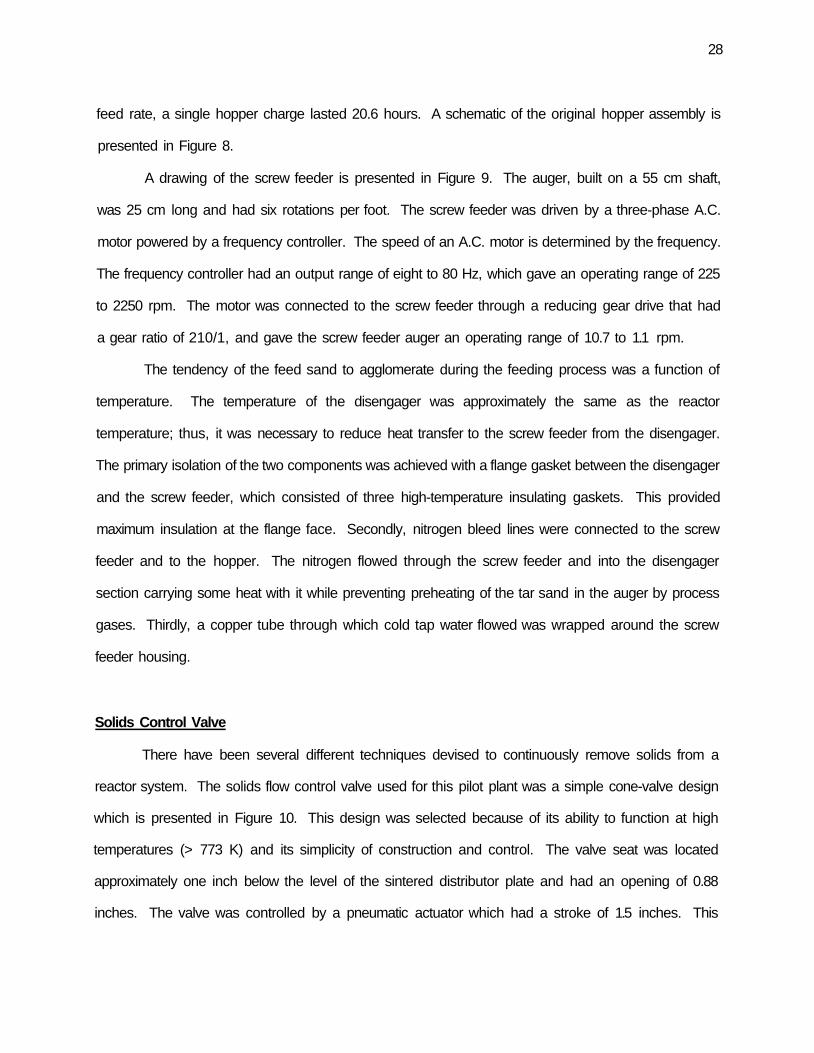
The fluidized-bed reactor solids inventory was six kilograms at the standard operating conditions.
At a retention time of 20 minutes, the design feed sand feed rate was 18 kg per hour. Under ordinary
circumstances, an experiment was expected to last for 20 hours; thus, the mass of feed sand required
was 370 kg. If the bulk density of the feed sand was 1.9 g/cm3 (1900 kg/m3) the volume of feed sand
required was 0.2 to 0.25 cubic meters. The hopper was sized to hold 0.2 cubic meters of feed sand.
The volume of the hopper as designed was 195,340 cm3, so that for a feed sand bulk density of 1.9
g/cm3, the charge to the hopper was 371.1 kg when fully loaded. When the sand inventory in the
fluidized bed was six kilograms and the residence time was 20 min, the feed rate was 18 kg/hr. At this
24
• the system must allow continuous addition of feed sand and withdrawal of spent sand;
• the unit had to be computer controlled;
• the reactor had to maintain steady state temperatures in the pyrolysis zone of the reactor
up to 900 K at maximum capacity; and
• the unit had to be capable of producing bitumen-derived hydrocarbon liquids at a rate
of at least 300 g/h.
Fluid Bed Reactor Assembly
The reactor was fabricated from stainless steel pipe with a standard 300 pound flange welded
to each end. The solids control valve was bolted to the lower flange of the reactor, and the disengager
section was bolted to the upper flange. Four thermowells were located approximately equidistant along
the axis of the reactor. The distributor plate located in the lower reactor flange was made of sintered
Inconel with an average "pore" size of 40 microns.
Reactor specifications:
• Small Reactor Tube
1.25 inch Schedule 40S Pipe, S.S. 304
I.D. = 1.380 inches = 3.505 cm
O.D. = 1.660 inches = 4.216 cm
Length = 35.4 inches = 90 cm
Cross Sectional Area = 1.49 in2 = 9.65 cm2
• Large Reactor Tube
4 inch Schedule 40S Pipe, S.S. 304
I.D. = 4.026 inches = 10.116 cm
O.D. = 4.500 inches = 11.430 cm
Length = 52.25 inches = 132.70 cm
Cross Sectional Area = 12.73 in2 = 83.13 cm2
26
Figure 7
Schematic of the Solids Handling System
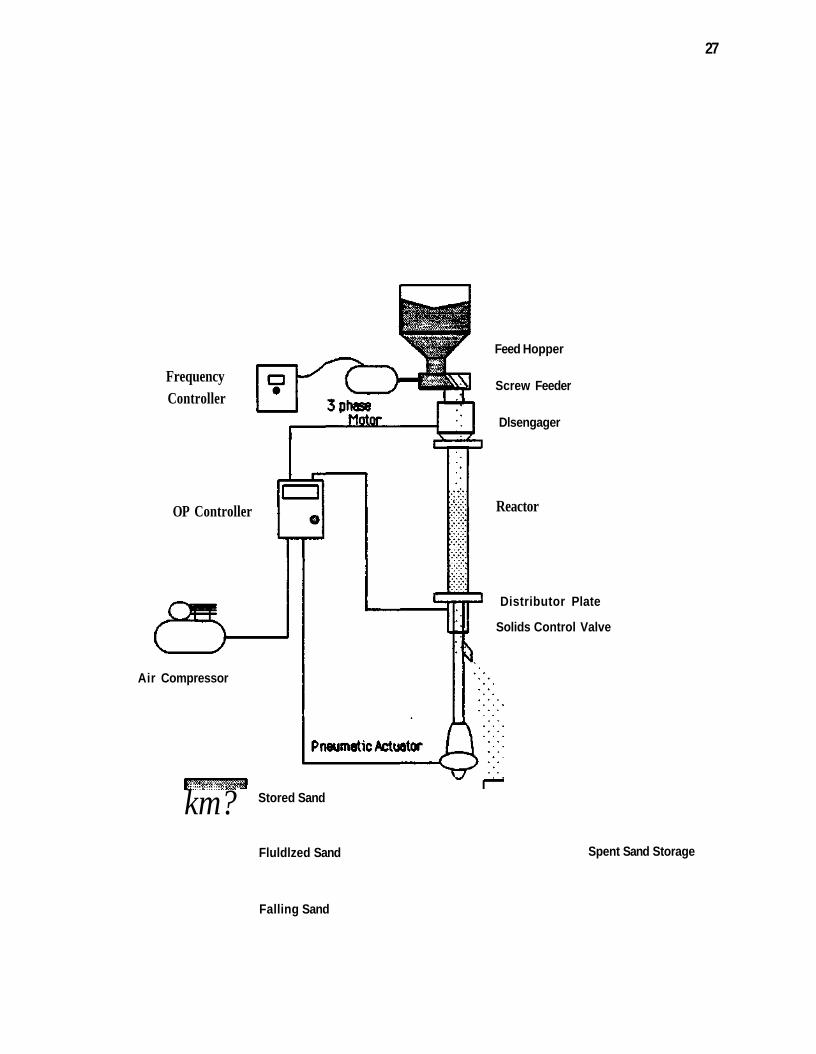
27
Frequency Controller
OP Controller
Feed Hopper
Screw Feeder
Dlsengager
Reactor
Distributor Plate
Solids Control Valve
Air Compressor
km? Stored Sand
Fluldlzed Sand
Falling Sand
Spent Sand Storage
28
feed rate, a single hopper charge lasted 20.6 hours. A schematic of the original hopper assembly is
presented in Figure 8.
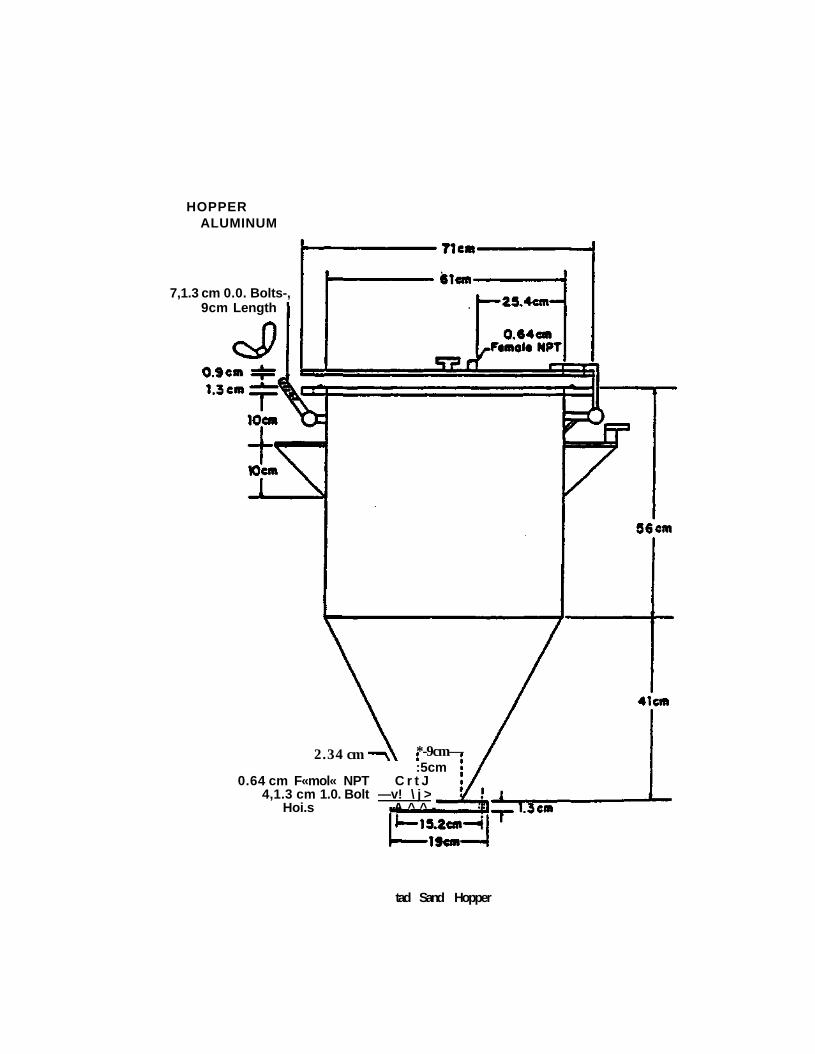
A drawing of the screw feeder is presented in Figure 9. The auger, built on a 55 cm shaft,
was 25 cm long and had six rotations per foot. The screw feeder was driven by a three-phase A.C.
motor powered by a frequency controller. The speed of an A.C. motor is determined by the frequency.
The frequency controller had an output range of eight to 80 Hz, which gave an operating range of 225
to 2250 rpm. The motor was connected to the screw feeder through a reducing gear drive that had
a gear ratio of 210/1, and gave the screw feeder auger an operating range of 10.7 to 1.1 rpm.
The tendency of the feed sand to agglomerate during the feeding process was a function of
temperature. The temperature of the disengager was approximately the same as the reactor
temperature; thus, it was necessary to reduce heat transfer to the screw feeder from the disengager.
The primary isolation of the two components was achieved with a flange gasket between the disengager
and the screw feeder, which consisted of three high-temperature insulating gaskets. This provided
maximum insulation at the flange face. Secondly, nitrogen bleed lines were connected to the screw
feeder and to the hopper. The nitrogen flowed through the screw feeder and into the disengager
section carrying some heat with it while preventing preheating of the tar sand in the auger by process
gases. Thirdly, a copper tube through which cold tap water flowed was wrapped around the screw
feeder housing.
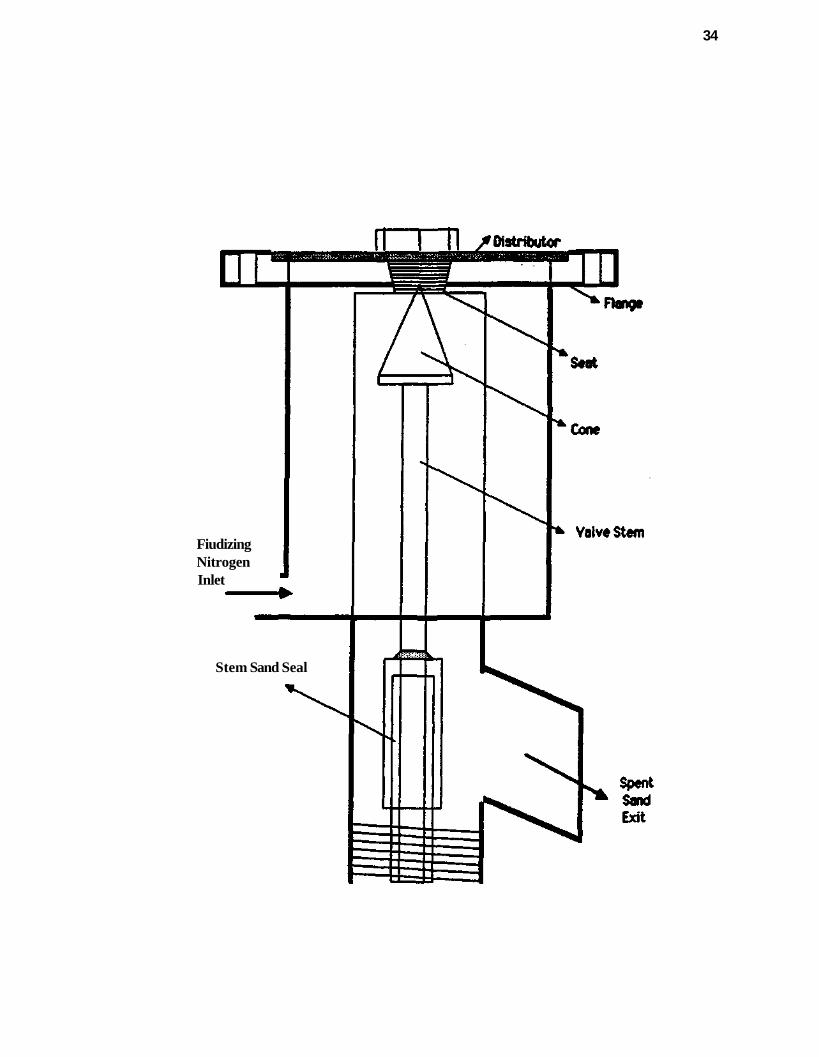
Solids Control Valve
There have been several different techniques devised to continuously remove solids from a
reactor system. The solids flow control valve used for this pilot plant was a simple cone-valve design
which is presented in Figure 10. This design was selected because of its ability to function at high
temperatures (> 773 K) and its simplicity of construction and control. The valve seat was located
approximately one inch below the level of the sintered distributor plate and had an opening of 0.88
inches. The valve was controlled by a pneumatic actuator which had a stroke of 1.5 inches. This

29
Figure 8
Diagram of the Hopper Assembly
HOPPER ALUMINUM
7,1.3 cm 0.0. Bolts-, 9cm Length
2.34 cm *-9cm— :5cm
0.64 cm F«mol« NPT C r t J 4,1.3 cm 1.0. Bolt —v! \ j >
Hoi.s A ^ ^ -
tad Sand Hopper

31
Figure 9
Schematic of the Screw Feeder
SCREW FEEOER STAINLEES STEEL 304
•,1.3e»l.O. cm| Boll Holes
6,13em 1.0. Boll H«lt«

33
Figure 10
Schematic of the Solids Flow Control Valve
34
Fiudizing Nitrogen Inlet
Stem Sand Seal
35
stroke length was sufficient to completely remove the cone from the valve opening, providing an
unobstructed passage through which the spent sand flowed.
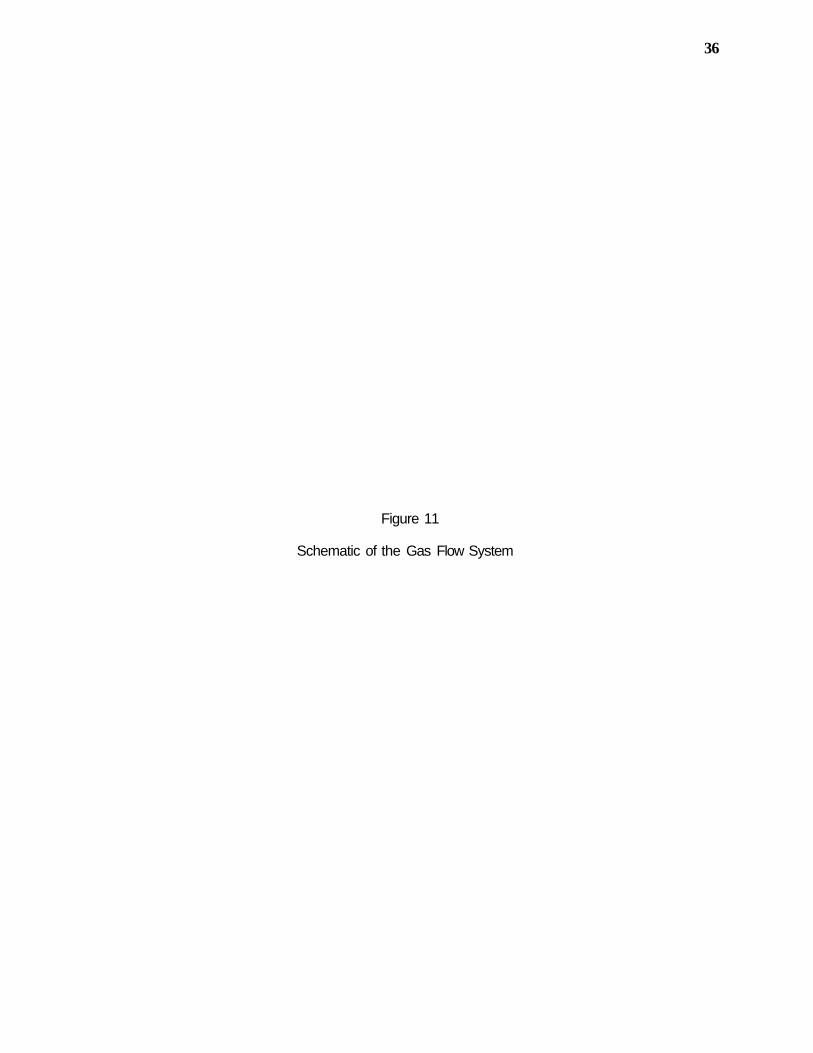
Gas Handling System
Fluidizing gas for the bed was stored in a manifold of four high-pressure cylinders which were
capable of being replaced without interrupting the nitrogen flow for the preliminary experiments. The
nitrogen from the manifold passed through a mass flow meter, a pressure regulator which reduced the
pressure to about 20 psig, and a flow control valve. Once the pressure and flow rate had been set,
the nitrogen entered a preheater where it was heated prior to entering the reactor. As the nitrogen
fluidized the bed, it was mixed with vaporized liquid product and the hydrocarbon gases produced in
the pyrolysis reaction and swept the products out of the system.
As the gas left the bed, fine particles were entrained from the bed into the vapor space above
the bed. The dust removal train consisted of three components: a disengager section, a series of
cyclones, and a filter. A schematic diagram of the gas introduction and fines removal system is shown
in Figure 11. In the production run the source of nitrogen was a liquid nitrogen cylinder.
Disengager
The gas-solid disengager section was mounted directly above the reactor. The increased cross-
sectional area of the disengager caused a decrease of the fluid velocity, allowing the largest of the
entrained particles to fall back into the bed.
Cyclones
The gas passed from the disengager into the cyclones. The cyclones were designed according
to the methods of Wolfgang and William.7 Cyclones have been widely used for dust removal due to
the simplicity of construction, low energy requirements, and ability to operate at high temperatures
and pressures. The three cyclones were designed for maximum efficiency over different flow ranges
36
Figure 11
Schematic of the Gas Flow System
37
j-y • Disengager
Cyclones
Reactor
•n
• • • • •
Filters
Liquid Product Vessel
*
Product 6as
Condensed Product
Fluldlzed Sand
Condenser
i v^^^^v—*^^ *•*•••
iMISt Ellmlntator
" ""•• To Vent
:low Meter
WWWw

38
because of the wide variation in possible flow rates. The cyclones were mounted external to the
disengager section to facilitate cleaning and maintenance.
The drawing of the cyclone is presented in Figure 12. A dust collector was attached below
each cyclone body to remove the collected dust from the cyclone using a valve mounted under the
dust collector. The cyclone design predicted gains in efficiency with increasing values of particle
density, inlet velocity and cyclone body height, and declines in efficiency with increasing fluid viscosity,
cyclone diameter, outlet diameter, and inlet width. The "grade" or fractional" efficiency of the cyclones
can be compared at different inlet velocities from the graph presented in Figure 13. Also the minimum
particle diameter which was collected for a given cyclone was calculated for both inlet velocities.7
D mfn was 2.6 nm for the high inlet velocity (89.3 ft/sec), and 10.0 pm for the low inlet velocity (6.0
ft/sec).
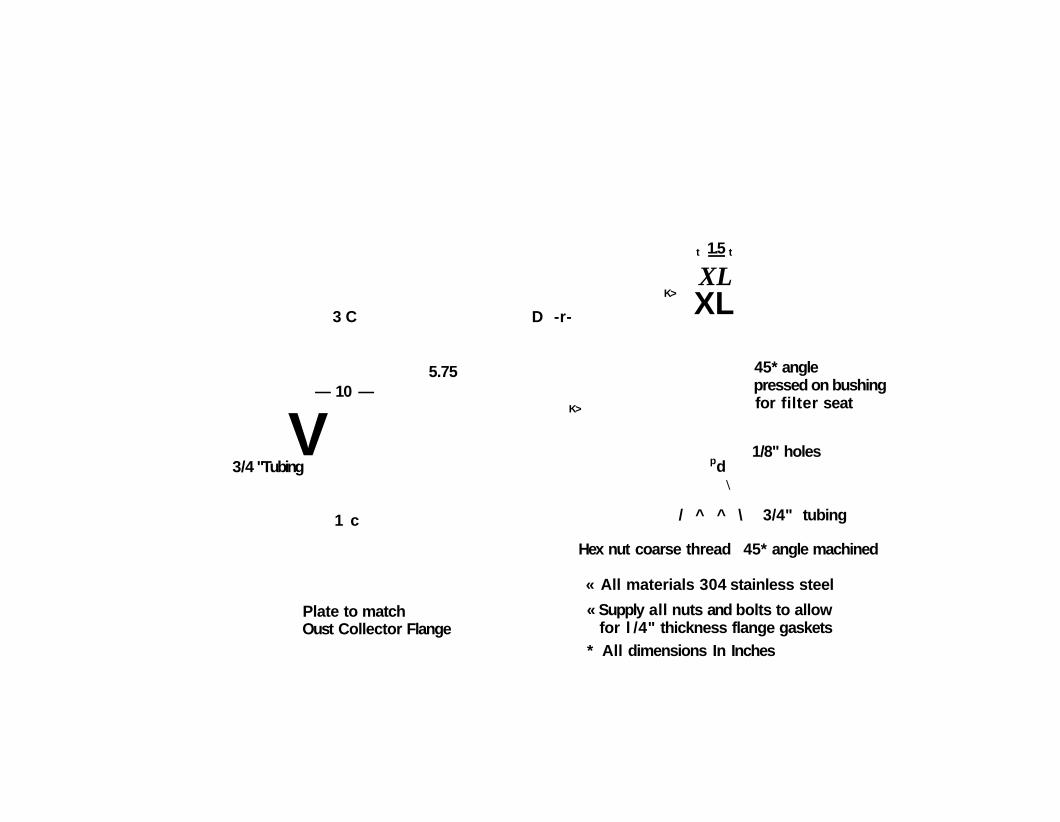
Fine Sand Filter
Two filters were mounted in a parallel configuration to remove the entrained sand fines in the
gas stream which passed from the cyclone to the filter. The filter elements were sintered stainless steel
cartridges which had an estimated nominal pore size of 10 microns. A schematic diagram of the filter
is presented in Figure 14. It was important to maintain the temperature of the cyclones and the filter
close to the reactor temperature to prevent condensation of liquid product while avoiding coking of the
produced vapors on the inner surfaces of the filter housings. The gas entering the cyclones and filter
was still close to the reactor temperature; therefore, the only heat input required was that necessary
to offset losses through the insulation.
Produced OH Recovery System
Once the solid particles were removed from the gas stream, it was cooled to allow the
hydrocarbon products to condense and be collected in the liquid product receiver. The condenser was
a simple tube and shell heat exchanger which used cold tap water as the cooling fluid.

39
Figure 12
Schematic of the Cyclone
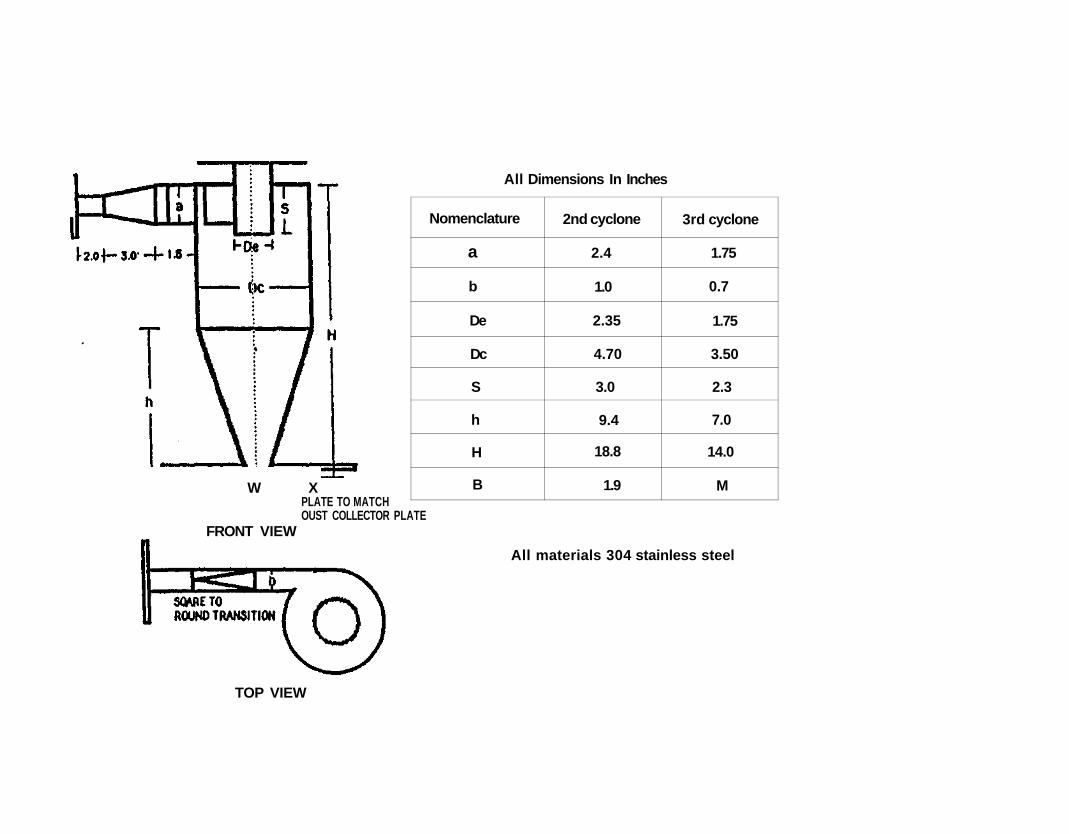
All Dimensions In Inches
W X PLATE TO MATCH OUST COLLECTOR PLATE
Nomenclature
a
b
De
Dc
S
h
H
B
2nd cyclone
2.4
1.0
2.35
4.70
3.0
9.4
18.8
1.9
3rd cyclone
1.75
0.7
1.75
3.50
2.3
7.0
14.0
M
FRONT VIEW
All materials 304 stainless steel
TOP VIEW
41
Figure 13
Cyclone Grade Efficiency

42
100
i I i 4
•tot V - 893 (fl/st*)
T-900*C
bW V - 6J) ( f t / m )
50 10° to1
M ^ M ^ B B — ^ B ^ • — P - ^
102
Parttefe sfe», pa

43
Figure 14
Diagram of the Filter
— 10 —
3/4 "Tubing
3 C
V 1 c
5.75
D -r-
K>
K>
t 1.5 t
XL XL
pd
45* angle pressed on bushing for filter seat
1/8" holes
\
/ ^ ^ \ 3/4" tubing
Hex nut coarse thread 45* angle machined
Plate to match Oust Collector Flange
« All materials 304 stainless steel
« Supply all nuts and bolts to allow for l /4" thickness flange gaskets
* All dimensions In Inches
45
Parameters used for the condenser heat duty calculation were as follows:
Nitrogen heat capacity: 0.26 cal/g°C @ 498 K
Nitrogen flow rate: 100,000 l/hr.
Heat of evaporation of C5+ hydrocarbon liquid: 80 cal/g°C
Rate of oil vapor condensation: 300 g/hr.
The rate of heat transfer required in the condenser was 1.3x10⁴ (Kcal/hr). Heat transfer
calculations indicated that the required surface area could be achieved using a 20 foot long tube and
shell heat exchanger. The condenser was fabricated in four sections of equal length to facilitate
integration into the pilot plant.
Experience with the operation of the small reactor indicated that an aerosol mist formed which
contained droplets that approached sub-micron size. The technique used to remove this mist in the
small reactor was a fiber mist eliminator. The same technique was used in the initial, Phase I
experiments with this pilot plant. The diagram of the mist collector is presented in Figure 15. The
non-condensible gases that passed through the mist collector were sampled and then flared.
Instrumentation
All instrumentation was located on the control panel located on the second level of the three-
story pilot plant facility. A diagram of the control panel is presented in Figure 16.
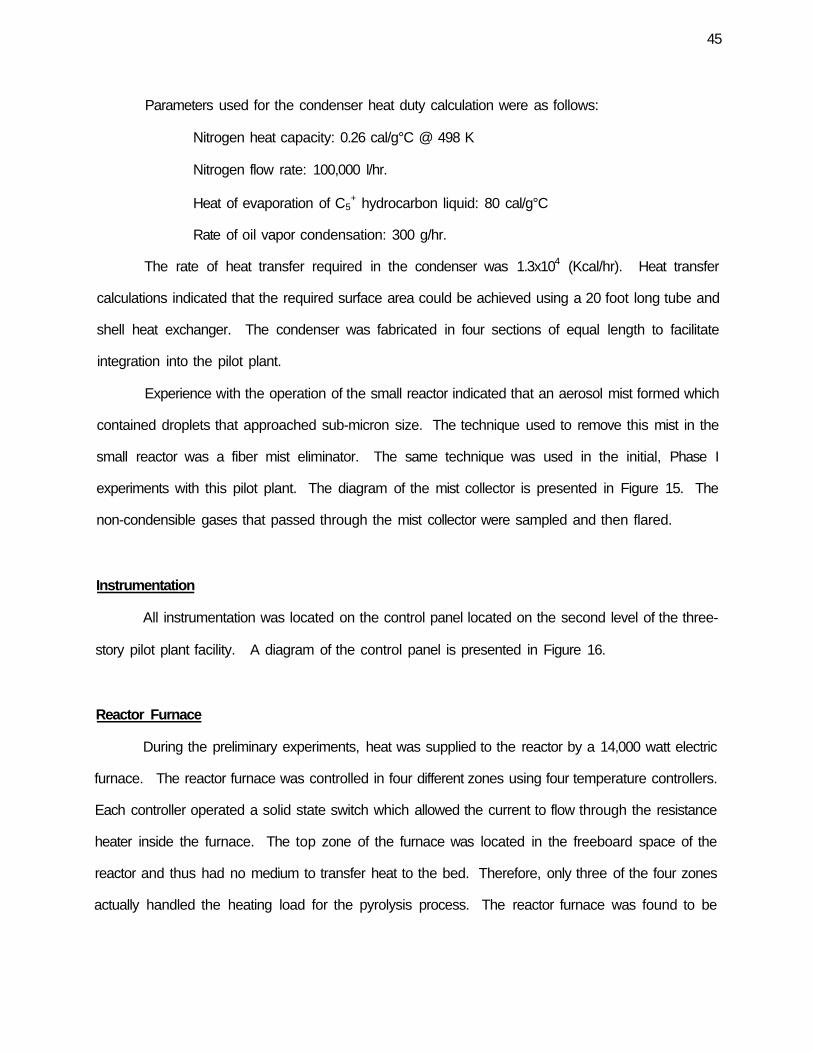
Reactor Furnace
During the preliminary experiments, heat was supplied to the reactor by a 14,000 watt electric
furnace. The reactor furnace was controlled in four different zones using four temperature controllers.
Each controller operated a solid state switch which allowed the current to flow through the resistance
heater inside the furnace. The top zone of the furnace was located in the freeboard space of the
reactor and thus had no medium to transfer heat to the bed. Therefore, only three of the four zones
actually handled the heating load for the pyrolysis process. The reactor furnace was found to be
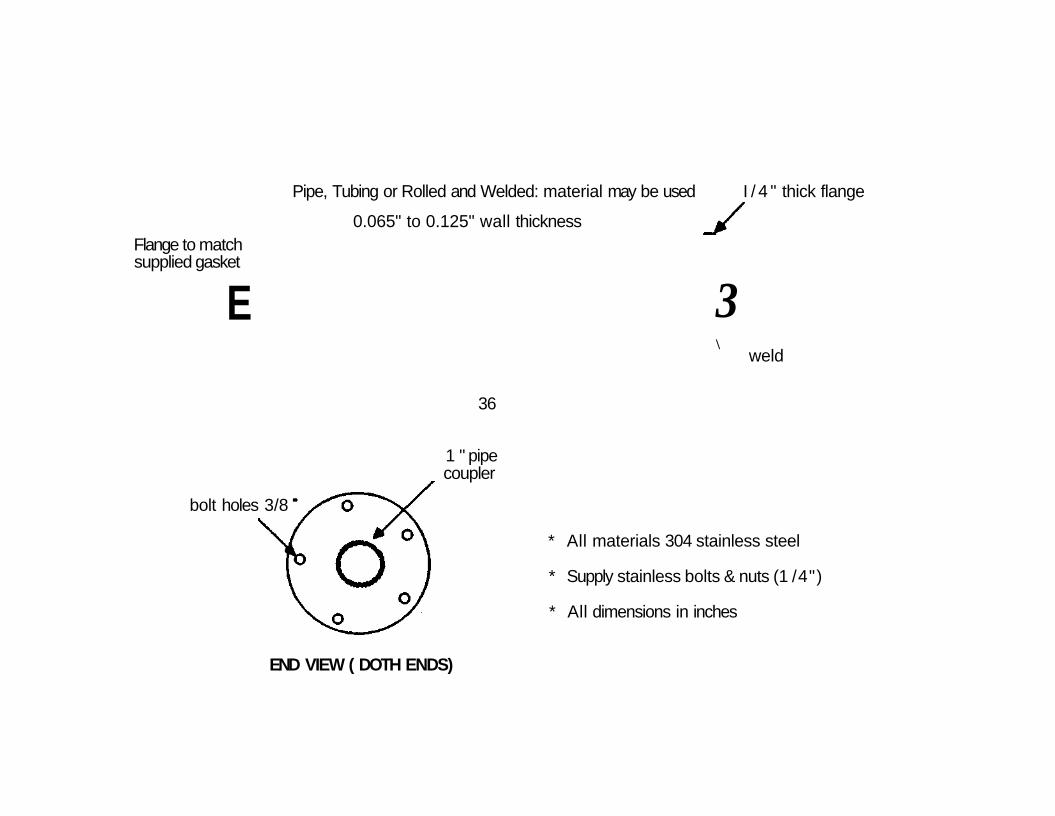
Pipe, Tubing or Rolled and Welded: material may be used I / 4 " thick flange
0.065" to 0.125" wall thickness Flange to match supplied gasket
E
36
3 \
weld
bolt holes 3/8
1 " pipe coupler
* All materials 304 stainless steel
* Supply stainless bolts & nuts (1 /4")
* All dimensions in inches
END VIEW ( DOTH ENDS)

46
Figure 15
Diagram of the Mist Collector

48
Figure 16
Diagram of the Control Panel
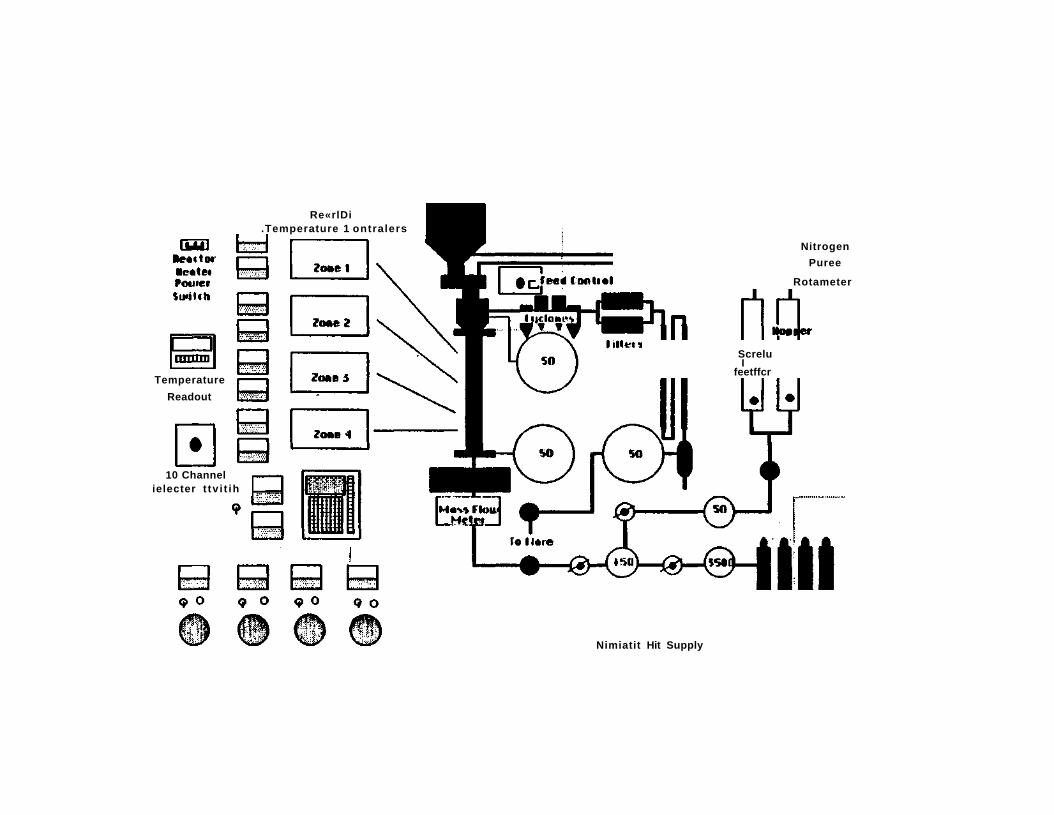
Re«rlDi .Temperature 1 ontralers
Temperature
Readout
10 Channel ielecter t tv i t ih
Nitrogen
Puree
Rotameter
Screlu I
feetffcr
Nimiatit Hit Supply
50
inadequate at high feed sand throughput rates (i.e., short feed-sand retention times) and eventually was
replaced by a direct-fired natural gas furnace.
Fluldlzatlon Gas Preheater
The fluidizing nitrogen was preheated by passing it through a two-inch pipe mounted inside a
5,500 watt Lindburg furnace inside the preheater. Three high-temperature heating rods were located
inside the pipe. The preheater heated the nitrogen to approximately 1073 K. The nitrogen was heated
to a temperature several hundred degrees above the desired reactor temperature to offset the heat
losses in the insulated tubing leading from the preheater to the reactor.
Temperature Measurement
The temperatures measured in this pilot plant ranged from 298 K to 823 K. The system was
designed to use K-type thermocouples and digital temperature read out with built-in cold junction
compensation. Reactor and gas stream temperatures were measured and controlled by using the
appropriate tube fittings such that the thermocouple could be inserted directly into the process stream.
Pressure and Flow Measurement
A Foxboro differential pressure (DP) controller and three 0-30 psi precision pressure gauges
were used to measure the pressures in the system. The data from DP cell pressure measurement was
used to control the bed height and the sand inventory in the reactor. The pressure gauge readings
were used to monitor plugging of the cyclones and filters. The nitrogen carrier gas flow rate was
measured by Micro Motion mass flow meter model D-6.
Computer Control and Data Logging
Data logging and heater control were accomplished using an IBM PC-XT. This micro computer
has a 20 megabyte fixed disk drive which was capable of storing experimental data. A single floppy
51
disk drive and a printer were available to print reports after each run. MetraByte products were chosen
for the interface hardware in this system.
Data logging for this system consisted of 16 thermocouples and four mechanical relays which
controlled the heaters and alarms. Each temperature was measured by a thermocouple and was
recorded as a function of time. The nitrogen preheater furnace temperature was also controlled by the
computer.
Pilot Plant Component Calibration Experiments
Several pieces of equipment required calibration to provide accurate data for the particular
environment in which it was used or to generate charts to determine set points for some of the process
variables.
Calibration of the Screw Feeder
The purpose of the initial run was to compare data at similar conditions with a run on the small
reactor using the same tar sand. Ten to 12 kilograms of crushed and sized tar sand from the Circle
Cliffs deposit were loaded into the hopper. The dial on the frequency controller was varied from eight
to 80 Hz, and the flow rate of solids per minute was determined by collecting the sand over 10-minute
intervals and weighing the collected sample. Six different feed sand particle size fractions were used:
1. less than 14 mesh (0.046 inch);
2. -7 mesh (0.11 inch) + 14 mesh (0.046 inch);
3. -14 mesh (0.046 inch) + 25 mesh (0.028 inch);
4. -25 mesh (0.028 inch) + 45 mesh (0.014 inch);
5. less than 45 mesh (0.014 inch); and
6. less than 7 mesh (0.11 inch).
The results of the feed sand rate calibration for different particle size fractions are presented in Figure
17. It is interesting to note that the data for both of the samples with the broad particle size
distributions, less than 14 mesh and less than seven mesh, fell on the same line.

52
Figure 17
Feed Rate Test for the Circle Cliffs Tar Sands

80-
60-
40-
20-
0 n
jfjtapT ^^y^
•
D
• o
y '
< 0.04* fa 0.046-0.11 fa 0.028-0.046fa 0.014-0.028fa < 0.014 fa < 0.11 fa
1 O
f—A Rate (Kfl/nfa)
<J1 00
54
When the reactor inventory was six kilograms at a residence time of 20 minutes and a feed
sand with a particle size distribution of less than 14 mesh (0.046 inch) was used, then for a screw
feeder feed rate of 0.3 kg/min, the calibration curve indicated the frequency set point should be 8.6
(Hz).
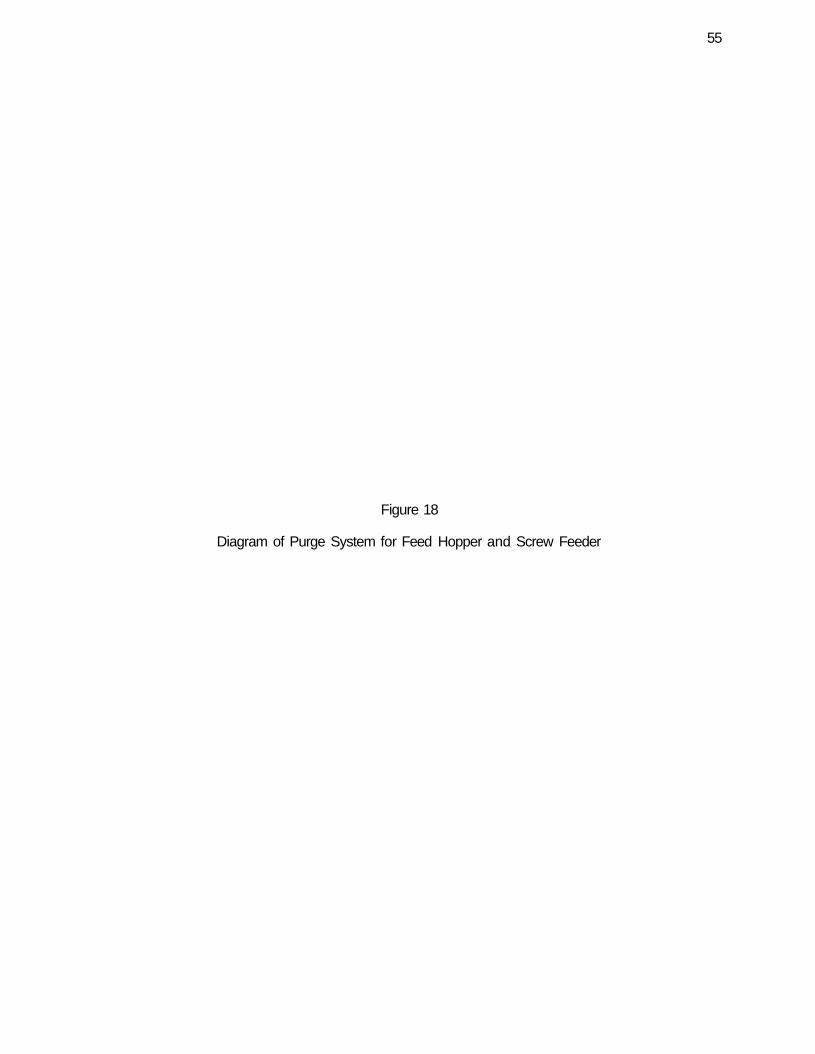
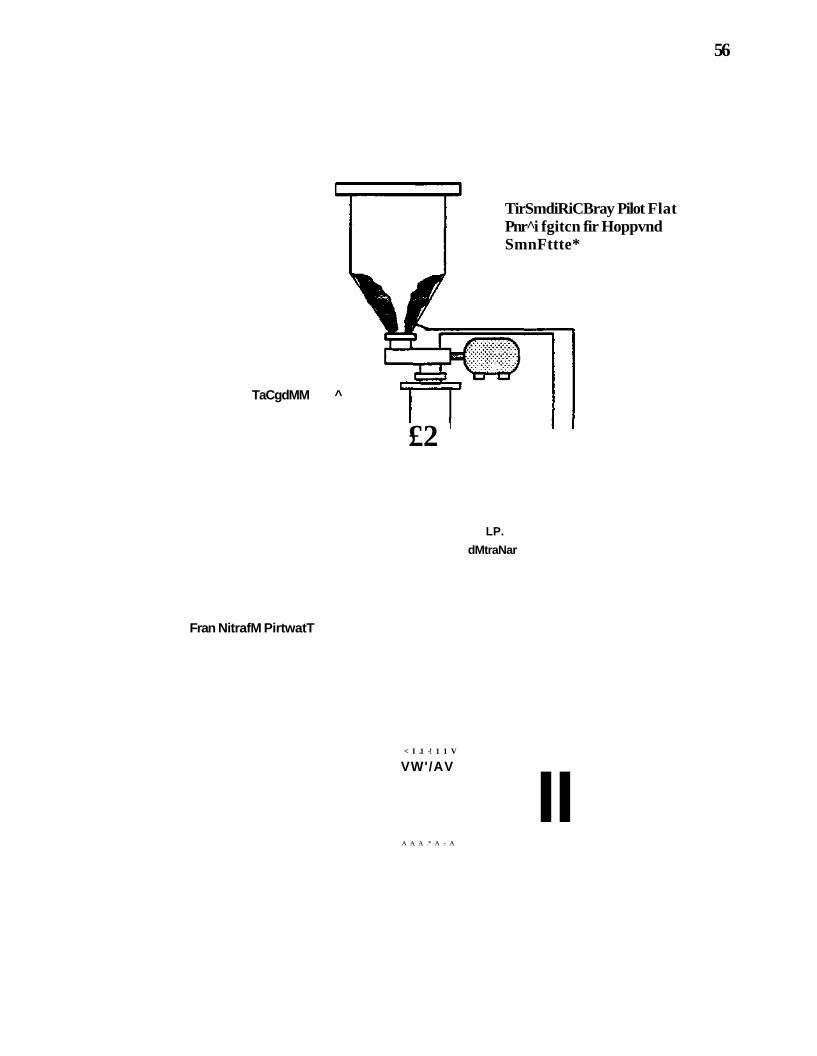
A nitrogen gas line was connected to the hopper and screw feeder through a rotameter. The
diagram of the purge system for the hopper and screw feeder is presented in Figure 18. The purge
gas was required to prevent hydrocarbon vapor from passing into the screw feeder and hopper where
it could condense. During several experiments, it was observed that the screw feeder did not feed
consistently: feed rates calculated at the end of the run were two times the predicted value. It was
suspected that the purge gas to the hopper carried the feed sand past the screw feeder causing
inconsistent feeding rates. This was demonstrated by a feed rate test in which the nitrogen purge line
to the hopper was eliminated. The results of this test are presented in Figure 19. The feed hopper
purge was eliminated in subsequent experiments.
In addition, a feeding problem was identified during these experiments. The feed tar sands
adhered to the hopper wall instead of flowing down into the screw feeder housing. This observation
led to a radical modification of the feed system prior to the production run.
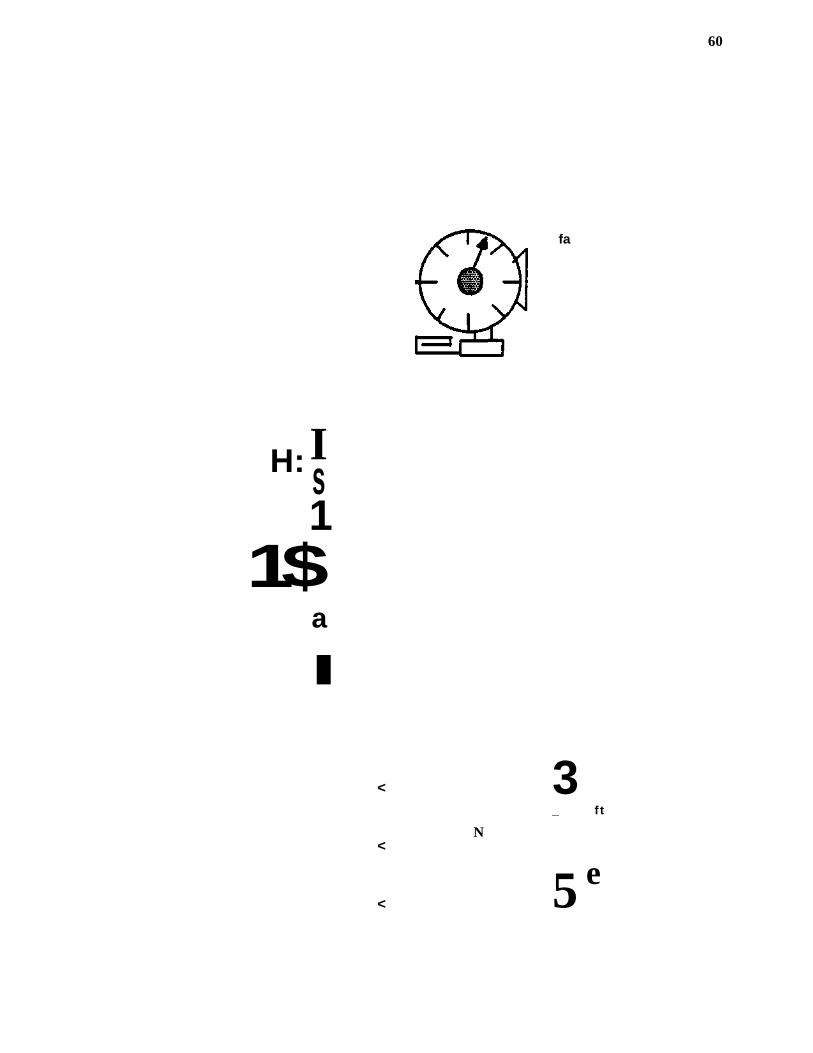
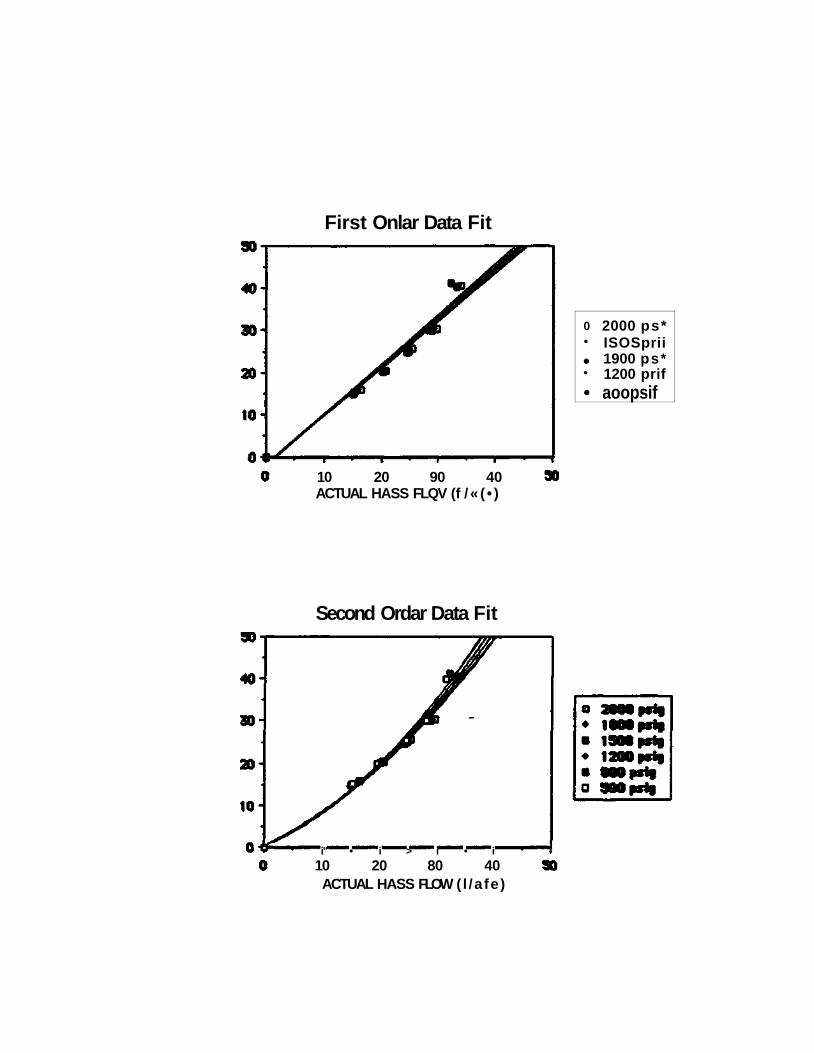
Mass Flow Meter Calibration
A Micro Motion mass flow meter, model D-6, was used to measure the amount of the fluidizing
gas flowing into the reactor system. It was tested for linearity over the full range of inlet pressures.
A wet test meter was used to measure the flow of nitrogen leaving the reactor. A schematic of the
apparatus used for the calibration experiment is presented in Figure 20. The calibration was performed
at a series of nitrogen source pressures which ranged from 500 psig through 2,000 psig. Linear and
second-order polynomial fits appeared to correlate the calibration data well at higher pressures, whereas
the fits were not as good at the lower pressures (Figure 21). However, the source pressure did not
significantly affect the mass flow of the fluidizing gas through the meter.
55
Figure 18
Diagram of Purge System for Feed Hopper and Screw Feeder
56
TaCgdMM ^
Fran NitrafM PirtwatT
TirSmdiRiCBray Pilot Flat Pnr̂ i fgitcn fir Hoppvnd SmnFttte*
£2
LP.
dMtraNar
< I .1 -! 1 1 V
VW'/AV
A A A .* A .- A
II

57
Figure 19
Effect of Purge Gas on Screw Feeder Rate
AMOUNT OF SARD COLLECTED (fl)
I £
* wKKEKKKKKtKKMKKEK/KKIKEl
CO
. _
• ••• ' • •• •• • • • !
. ' . •"' •*'. x . •''. •"" 1
S ^ : ; ^ ^ ^
w • • • • • • •NBHNNNNNBNHNNN1 \ \ •-. \ \ \ ••. \ \1
v>! v •?VA''•'•" vX!X' • '•'•»•'•'•'•'•'•l
_» ^^a^^M I B^B^B^a^B l^^_ O N • • • • • • •
S
8
•
• • ' \ ' " ' . . ' • . ' • . • • • . * ' . . ' . . ' - . 1
•' '* ' • '•-• '••• v . - i
'*.* \ ' \ " \ " \ \ ' \ \ " ••.1
s S s s .' .•• y / |
M p i l N I N N N N N N I l \ \ \ •: \ \ \ \ \\
I . I .
•
85
59
Figure 20
Schematic of the Mass Flow Meter Calibration System
60
fa
H: I s 1
1$ a
I
<
<
<
N
3 _ f t
5 e
61
Figure 21
Calibration Charts for the Mass Flow Meter
First Onlar Data Fit
0 •
• •
•
2000 ps* ISOSprii 1900 ps* 1200 prif aoopsif
10 20 90 40 ACTUAL HASS FLQV (f / « ( • )
Second Ordar Data Fit
i" • i > i • i
10 20 80 40 ACTUAL HASS FLOW ( l /a fe)
63
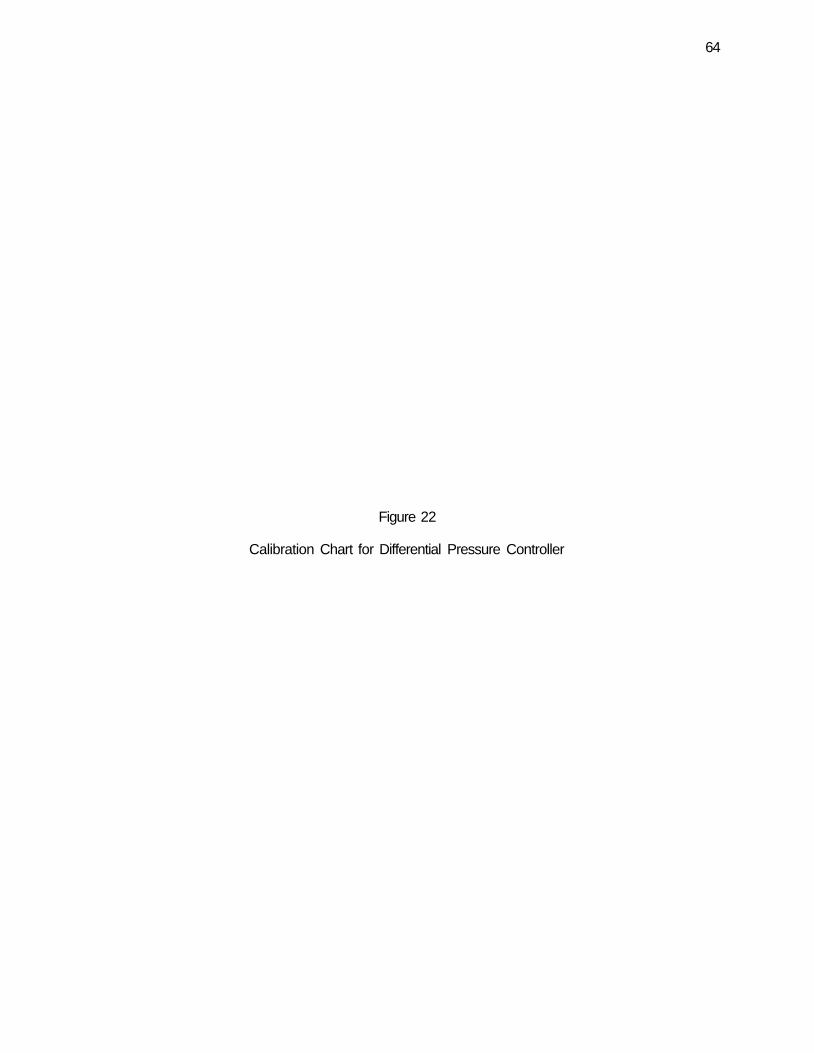
Differential Pressure Controller Calibration
The range of the differential pressure (DP) cell was 0-50 cm H20. The pressure drop across
the reactor was measured in millimeters of mercury by an accurate pressure gauge and was compared
with the indicated value from the DP cell. The calibration chart is presented in Figure 22.
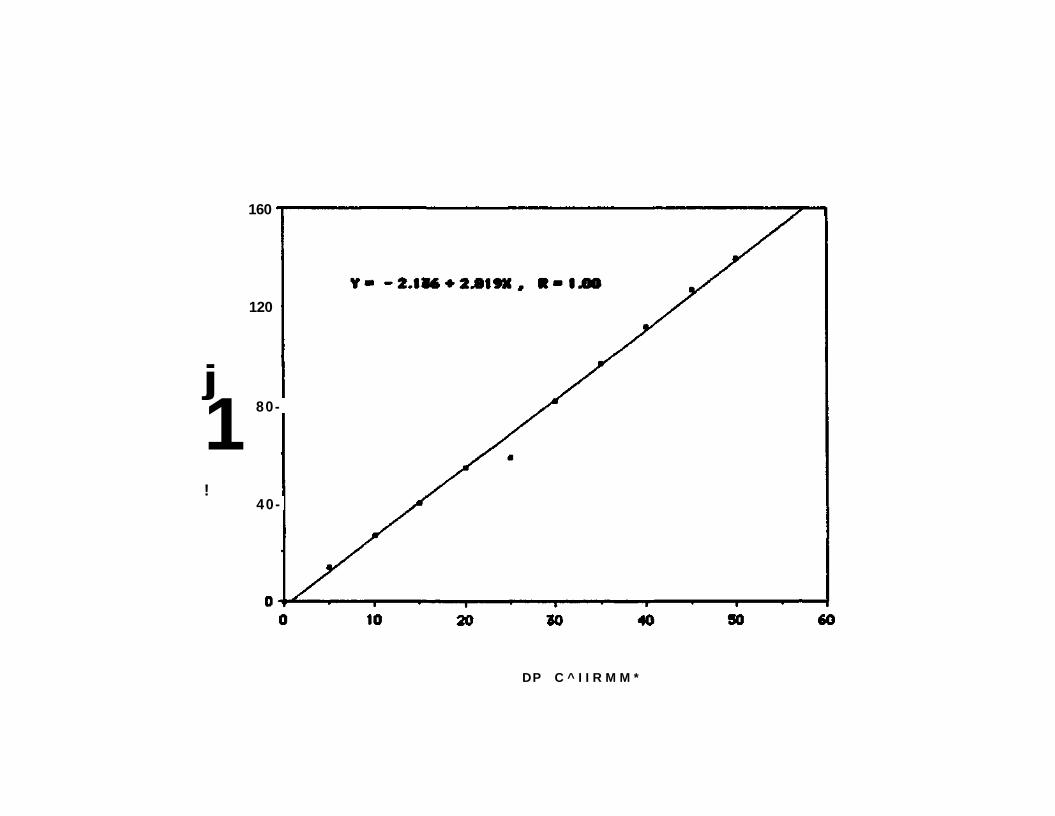
Rotameter Calibration
The rotameter used to measure the flow rate of purge gas was also calibrated. The volume
of gas flow during a fixed time was measured with a wet test meter and the volumetric flow rate at
standard conditions was computed. The calibration curve for the purge gas (nitrogen) is presented in
Figure 23.
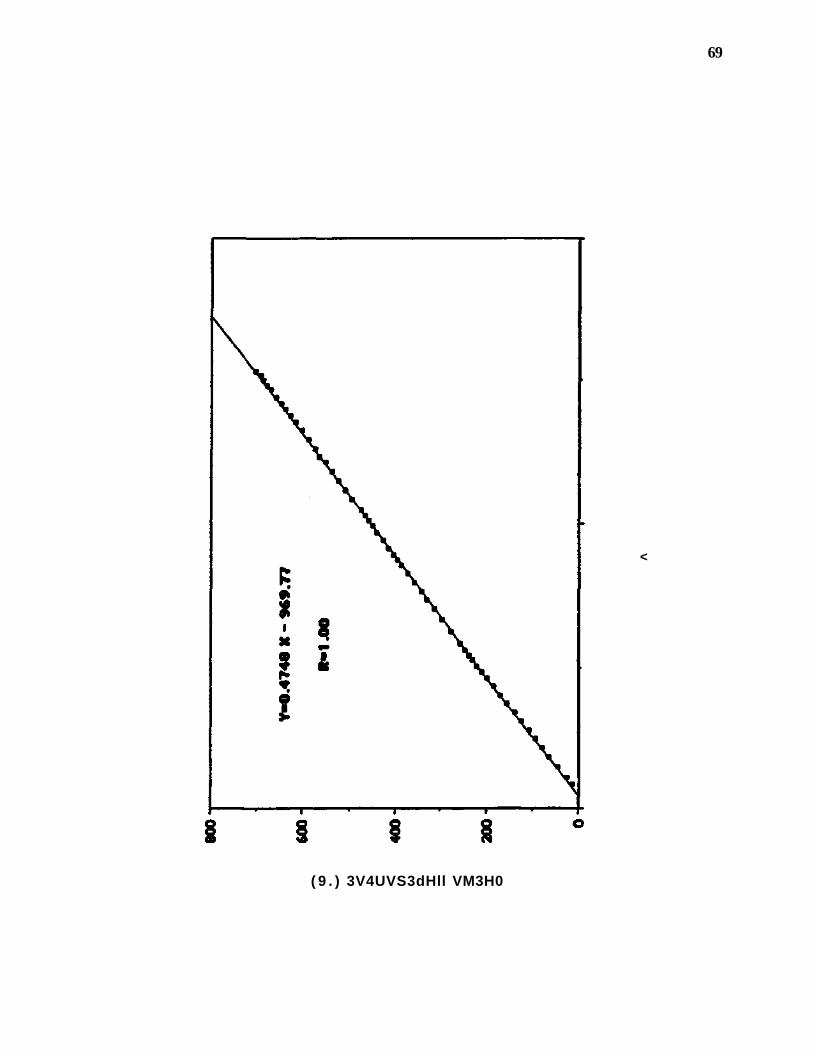
Computer Data Logging Calibration
Data from the pilot plant was recorded by an IBM PC-XT using MetraByte interface hardware
and a basic program developed for data logging. A thermocouple calibration chart is presented in
Figure 24, where the counts from the analog to digital converter are plotted versus temperature. The
temperatures were measured with an OMEGA model 199 digital temperature indicator during the
calibration procedure.
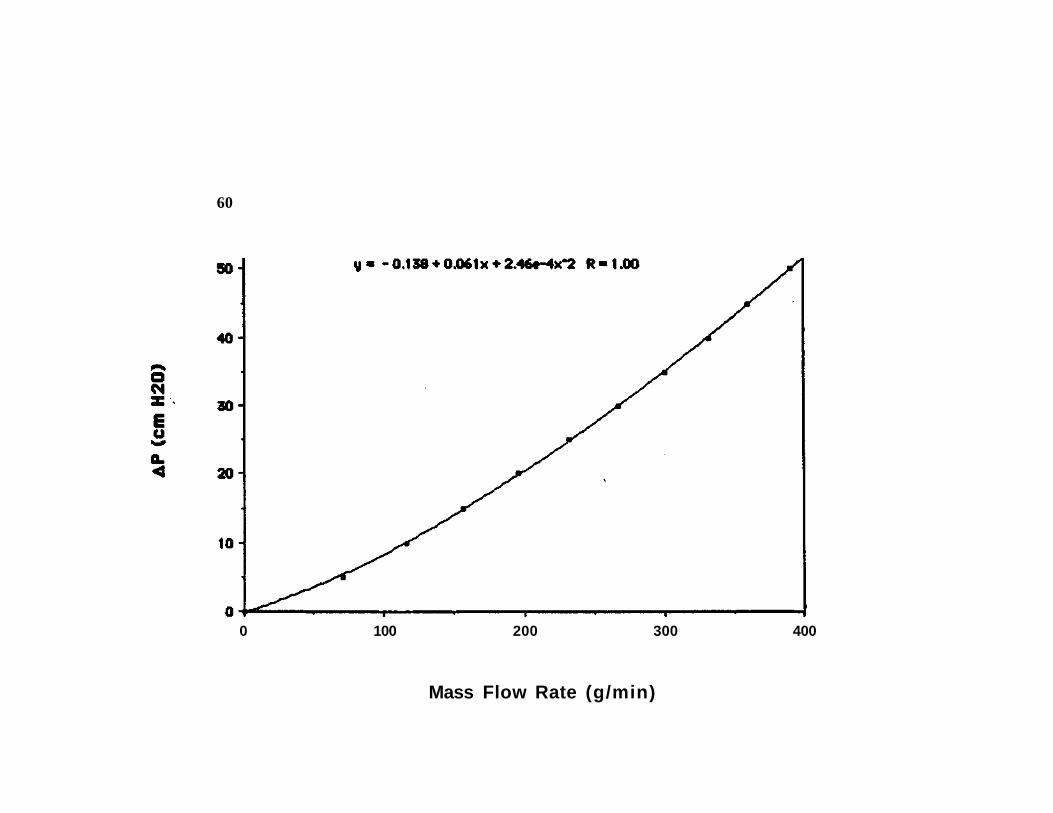
Pressure Drop Across the Distributor Plate
The pressure drop across the distributor plate was required to establish a base line for
measurement pressure drop across the fluidized bed. Therefore the relationship between the pressure
drop and mass flow rate across the distributor plate was measured in an empty reactor. The mass flow
rate required for fluidization was already known from the high temperature fluidization test. Therefore,
the actual pressure drop across the distributor was calculated using a second-order correlation of the
experimental data. A plot of the distributor plate pressure drop as a function of the mass flow rate is
presented in Figure 25. The actual pressure drop across the distributor plate would be 2.70 cm H20
for a mass flow rate of 40 g/min at the high-temperature operating condition.
64
Figure 22
Calibration Chart for Differential Pressure Controller
160
120
j
1 !
80-
40-
DP C ^ I I R M M *

66
Figure 23
Calibration Chart for Rotameter
190
!
I
100
0.3
VOLUMETRIC FLOV RATE C8CM/HR)
<* ^J
68
Figure 24
Calibration Chart for Computer Temperature Data Logging
69
<
( 9 . ) 3V4UVS3dHll VM3H0

70
Figure 25
Pressure Drop Across the Distributor Plate
60
0 100 200 300 400
Mass Flow Rate (g/min)
72
EXPERIMENTAL OPERATING PROCEDURES
The experimental procedures followed during the preliminary pyrolysis experiments are outlined
in this section. Significant details and observations from each experiment are reported in Appendix B.
1. Spent sand (6-7 kg) from the previous run was screened with a Tyler 14 mesh sieve to
eliminate aggregates of sand bonded by the carbonaceous residue formed during pyrolysis as well as
any calcareous rock fragments. The screened sand was loaded into the reactor.
2. The system was checked to be certain that it was completely assembled and that all
electrical connections were properly attached to the heaters. An anti-seize compound was used to
seal all threaded parts.
3. The weight of cellulose fiber in the mist collector system was determined and it was placed
in the collector.
4. The temperature controllers were set to the desired operating temperature.
5. The compressor supplying air to the differential pressure controller and pneumatic actuator
was started and the DP cell was set at 90 cm H20.
6. The cooling water flow rate to the condenser and the vent system for the system off gas
were checked.
7. The fluidizing and purge gas flow rates were adjusted to the desired values using the mass
flow meter and rotameter, respectively.
8. The desired preheater temperature was set by the computer and the preheater, reactor,
expansion chamber, cyclones, and the filter heaters were energized after the desired bed height and
pressure drop across the bed were established for the spent sand which had been charged to the
reactor. The system was held at the preset conditions for a short period of time (~ 30 minutes) to
establish thermal and hydrodynamic stability in the reactor.
9. After the temperatures reached the desired values, a known quantity of crushed and
screened bituminous sand was weighed and loaded into the hopper.
10. The screw feeder motor was turned on and adjusted to the desired speed using the screw
feeder frequency controller.
73
11. The temperature indicated by each thermocouple was monitored and recorded every
minute by computer.
12. During the experiment, constancy of the feed rate was checked using the DP controller
which was connected across the distributor plate and the disengager section of the reactor.
13. Gas samples were taken by syringe from the gas sampler in the system and injected into
a gas chromatograph periodically.
14. Spent sand samples were also taken periodically by collecting them in liquid nitrogen to
minimize the oxidation of the carbonaceous residue on the sand during sampling. The cooled, spent
sand samples were stored in sealed containers for analysis.
15. After the experiment was complete, the produced hydrocarbon liquid was withdrawn from
the liquid receiver and the amount produced was determined.
16. The weight of the cellulose fiber plus absorbed hydrocarbon in the mist collector was
measured. The condensed hydrocarbons were recovered from the fiber and combined with the liquid
product recovered from the liquid product receiver.
17. The gas and coked sand samples were analyzed and the material balance was calculated.
PRELIMINARY FLUIDIZATION TESTS
Two preliminary fluidization tests were carried out with the fluidized-bed pyrolysis reactor before
actually conducting a pyrolysis experiment. The tests consisted of a room-temperature fluidization test
and a high-temperature fluidization test which was done at actual operating conditions. In addition,
fluidization tests were conducted in a four-inch diameter glass tube to study particle motion within the
reactor. These tests were conducted with the Circle Cliffs tar sand and with the spent sand produced
during pyrolysis.
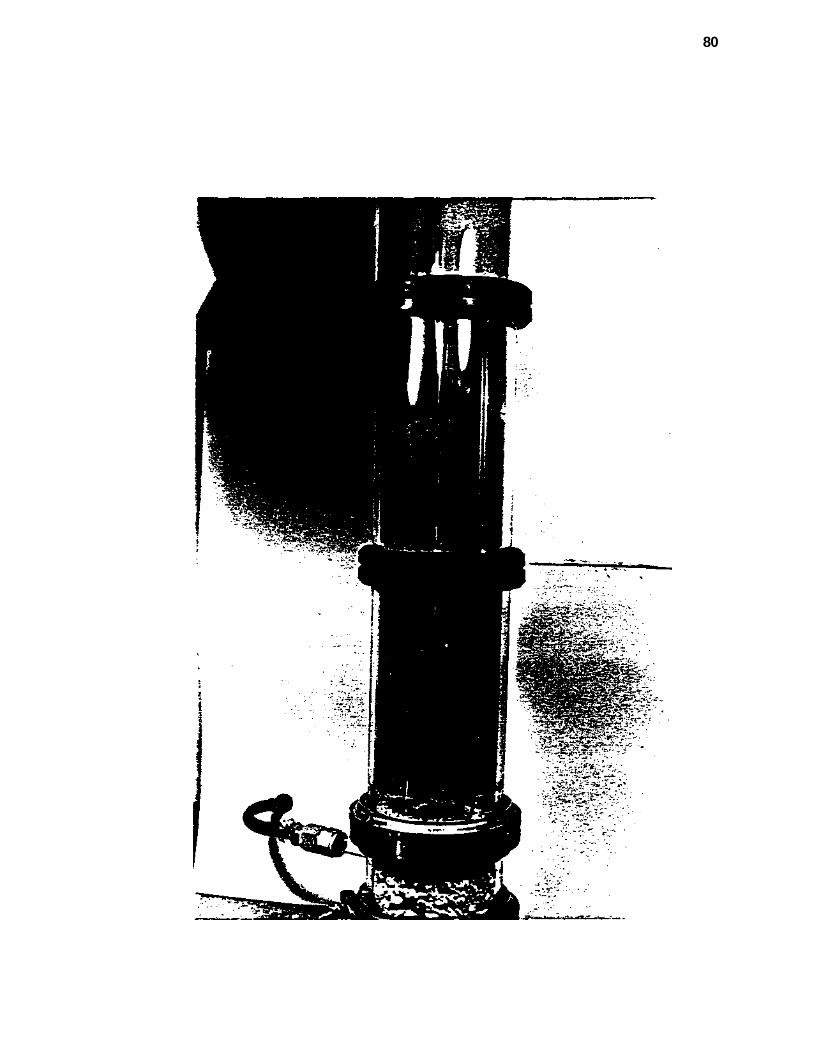
Glass Reactor Studies
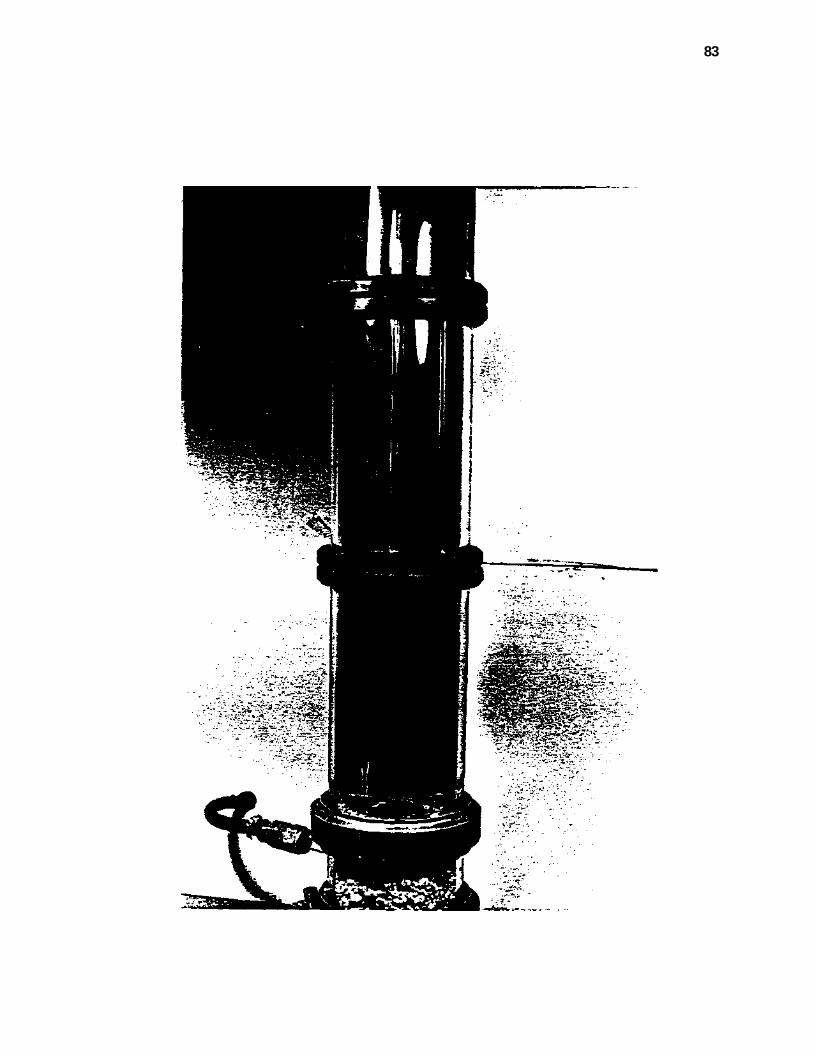
Two types of tests were conducted in the glass reactor. The initial tests were primarily visual.
The reactor assembly was set up with the capability of measuring the fluidizing gas. Photographs were

74
taken each time there was an apparent rearrangement of the particles comprising the fluidized bed.
The flow indicator was positioned in such a way that the mass flow rate of the fluidizing gas was
recorded in each of these photographs. The second test involved measuring the change in pressure
across the reactor as a function of fluidizing gas flow rate.
Specifications for the glass tube fluidization reactor were as follows:
Diameter: 4 inches
Length: 40 inches
Distributor: acryl perforated (1.5% open area)
Fluidizing gas: nitrogen
Flow measurement: Micro Motion mass flow meter model D-6
Screen size: less than 14 mesh Tyler sieve
Average particle size: 399 pm
Sand weight: 3.3 kg
Collapsed bed height: 14.5 inches
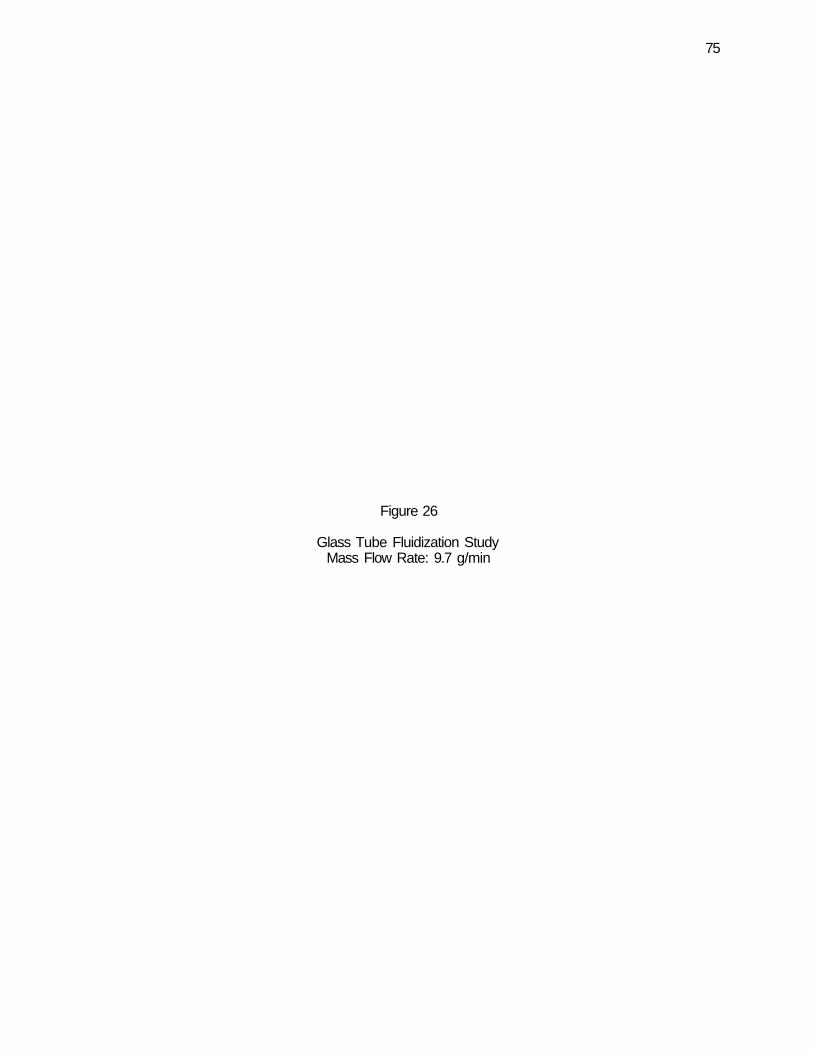
The tar sand in the tube was fluidized with nitrogen at different flow rates, with the flow rate
being noted at the point where a change in the bed characteristics was observed. These changes
were photographically recorded. Starting with a collapsed bed, the nitrogen flow was increased to the
point where the bed expanded momentarily, allowing some of the smallest particles to move to the
surface. At a flow rate of 9.7-13 g/min, a slug was observed. The slug moved up to the reactor,
broke apart, and fell back into the bed (Figure 26). A region of small particles measuring approximately
one inch deep at the top of the bed was well fluidized, while the remainder of the bed moved back to
a collapsed condition with obvious channels present (Figure 27). The flow rate at which the first
decrease in AP relative to the room-temperature fluidization test in the pilot plant reactor was 14.3 g/min.
The next event was similar to the first, this time occurring with slightly larger particles. After the second
bed movement, approximately the top three inches of the bed was fluidized, with the remainder of the
bed material in a settled condition with channels for passage of the gas (Figure 28). This same pattern
repeated itself, although it was less obvious as the flow rate reached higher levels. The highest flow
75
Figure 26
Glass Tube Fluidization Study Mass Flow Rate: 9.7 g/min
76
77
Figure 27
Glass Tube Fluidization Study Mass Flow Rate: 13.0 g/min
78
,™-.~>..'~iS v J ^ ^ ' i
*$*£.
m 3&£
79
Figure 28
Glass Tube Fluidization Study Mass Flow Rate: 47.0 g/min
80
81
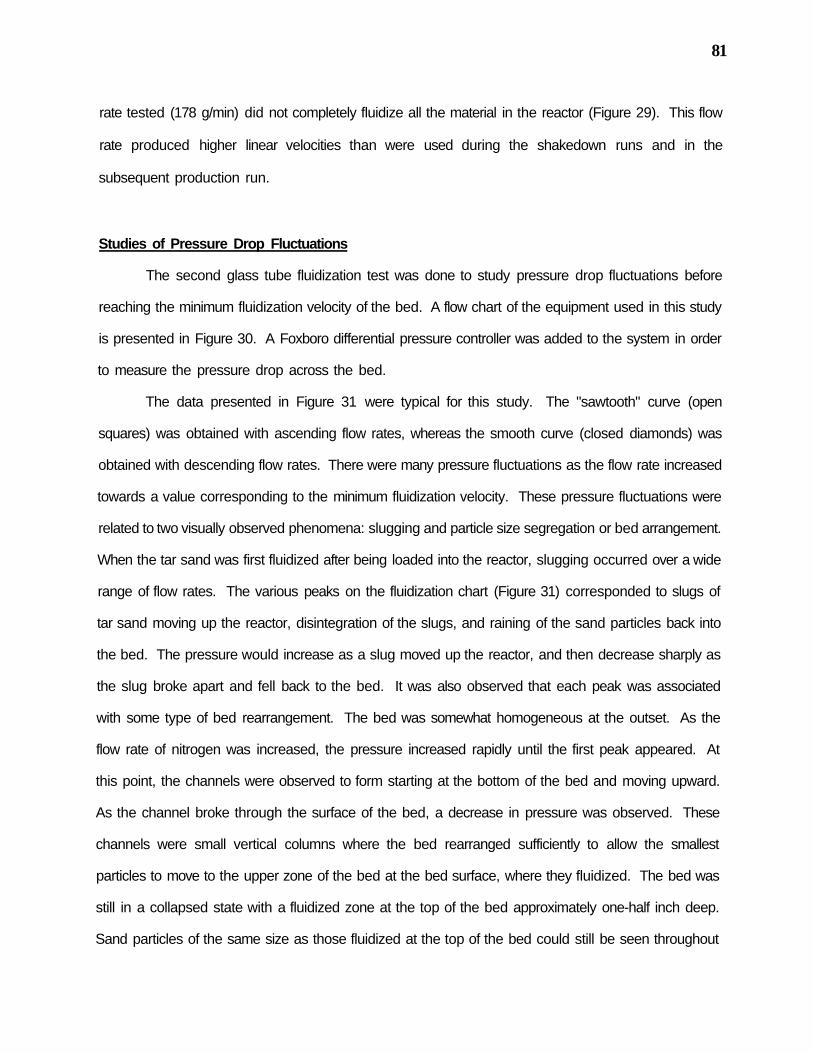
rate tested (178 g/min) did not completely fluidize all the material in the reactor (Figure 29). This flow
rate produced higher linear velocities than were used during the shakedown runs and in the
subsequent production run.
Studies of Pressure Drop Fluctuations
The second glass tube fluidization test was done to study pressure drop fluctuations before
reaching the minimum fluidization velocity of the bed. A flow chart of the equipment used in this study
is presented in Figure 30. A Foxboro differential pressure controller was added to the system in order
to measure the pressure drop across the bed.
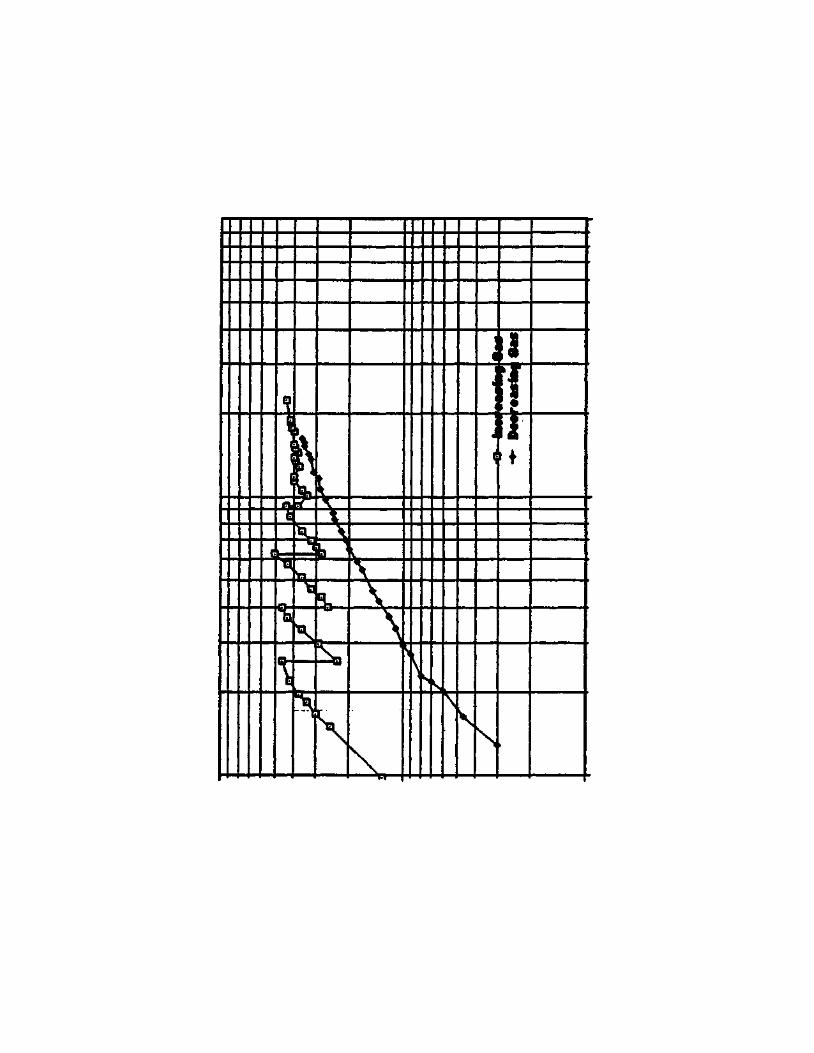
The data presented in Figure 31 were typical for this study. The "sawtooth" curve (open
squares) was obtained with ascending flow rates, whereas the smooth curve (closed diamonds) was
obtained with descending flow rates. There were many pressure fluctuations as the flow rate increased
towards a value corresponding to the minimum fluidization velocity. These pressure fluctuations were
related to two visually observed phenomena: slugging and particle size segregation or bed arrangement.
When the tar sand was first fluidized after being loaded into the reactor, slugging occurred over a wide
range of flow rates. The various peaks on the fluidization chart (Figure 31) corresponded to slugs of
tar sand moving up the reactor, disintegration of the slugs, and raining of the sand particles back into
the bed. The pressure would increase as a slug moved up the reactor, and then decrease sharply as
the slug broke apart and fell back to the bed. It was also observed that each peak was associated
with some type of bed rearrangement. The bed was somewhat homogeneous at the outset. As the
flow rate of nitrogen was increased, the pressure increased rapidly until the first peak appeared. At
this point, the channels were observed to form starting at the bottom of the bed and moving upward.
As the channel broke through the surface of the bed, a decrease in pressure was observed. These
channels were small vertical columns where the bed rearranged sufficiently to allow the smallest
particles to move to the upper zone of the bed at the bed surface, where they fluidized. The bed was
still in a collapsed state with a fluidized zone at the top of the bed approximately one-half inch deep.
Sand particles of the same size as those fluidized at the top of the bed could still be seen throughout

82
Figure 29
Glass Tube Fluidization Study Mass Flow Rate: 178.6 g/min
83

84
Figure 30
Flow Chart for Glass Tube Reactor Studies
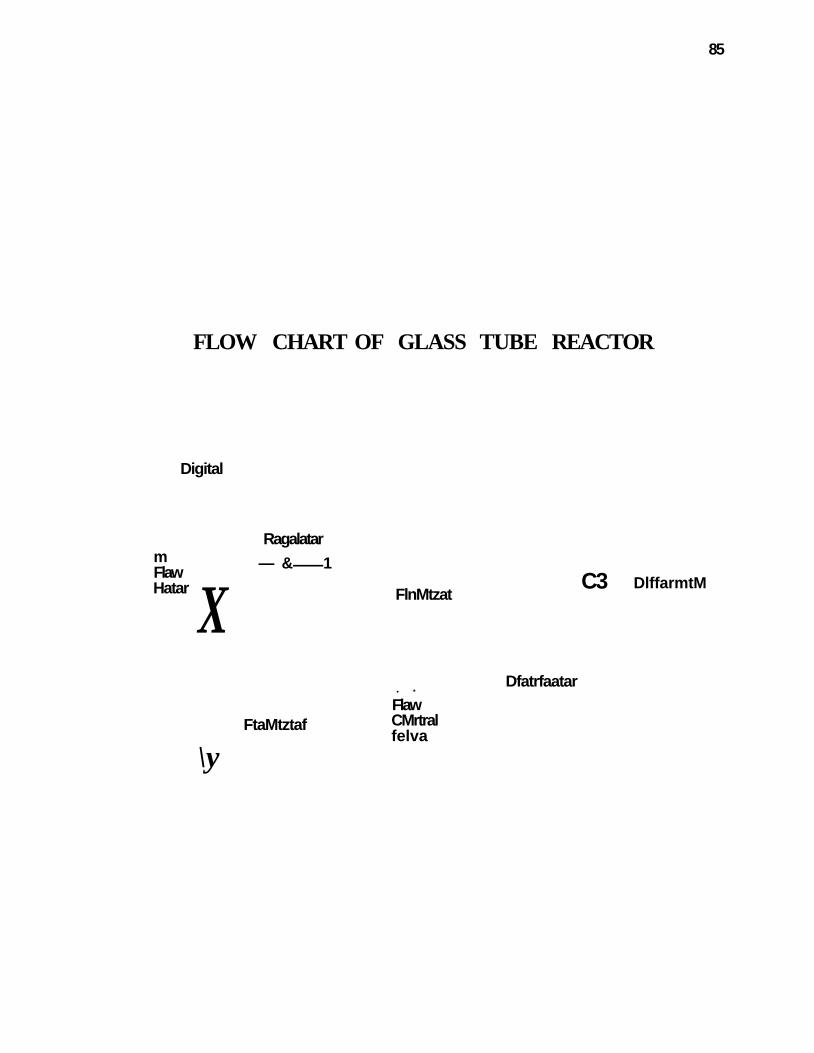
85
FLOW CHART OF GLASS TUBE REACTOR
Digital
m Flaw Hatar
Ragalatar
— & 1
X
\y
FlnMtzat
• *
FtaMtztaf Flaw CMrtral felva
C3
Dfatrfaatar
DlffarmtM
86
Figure 31
Glass Tube Fluidization Test at Room Temperature Average Particle Size: 399 jtm
88
the bed except where the channels had appeared. The next peak was similar to the first; that is, a
slight movement in the fixed bed and more or larger channels appeared which transported smaller
particles to the upper zone of the bed. The depth of the fluidized material at the top of the bed
increased each time this event occurred. Subsequent peaks were related to a repeat of this process;
however, each time the event repeated itself, slightly larger particles were transported to the upper
zone of the bed. At the highest flow rate tested, there was still a three-inch zone of large particles
sitting on the distributor plate that would not fluidize and through which channels formed.
Pilot Plant Reactor Fluidization Tests
The pilot plant reactor was used to conduct both room-temperature and high-temperature
fluidization tests with the crushed Circle Cliffs feed tar sand and with the spent Circle Cliffs sand.
Room-Temperature Fluidization Test with Circle Cliffs Tar Sand
A routine fluidization test at room temperature was conducted as the first step in determining
the minimum fluidization velocity for a sample of the Circle Cliffs tar sand in the reactor. The sample
was crushed, ground, and screened to obtain a less than 14 mesh Tyler sieve fraction. The particle
size distribution is presented in Table 4 and Figure 32. Six kilograms of this screened sample were
loaded into the pilot plant reactor for the fluidization test. The test consisted of measuring the pressure
drop across the reactor at low nitrogen flow rates and increasing the flow rate to a point well beyond
the minimum fluidization velocity. Typically there was a single point where the pressure decreased
slightly with increased flow which indicated the onset of fluidization.
The Circle Cliffs tar sand samples gave several such points. A plot of the data is presented
in Figure 33. Equipment specifications for the experiment were as follows:
Reactor 4" Schedule 40S pipe, S.S. 304
Diameter 4.026 inches
Length 52.25 inches
Distributor Sintered Plate

89
Table 4
Circle Cliffs Tar Sand Particle Size Distribution
Total Weight = 1657.03 g
14 mesh (0.046 inch, 1190 pun)
20 mesh (0.0328 inch, 850 urn)
30 mesh (0.0234 inch, 600 /un)
45 mesh (0.0139 inch, 355 nm)
70 mesh (0.0083 inch, 212 /un)
100 mesh (0.0059 inch, 150 /un)
Ut (g)
294.87
259.15
274.82
160.89
276.08
391.22
Ut.fr(X)
17.80
15.64
16.59
9.71
16.66
23.60
100 X
82.20 %
65.56 X
49.97 X
40.26 X
23.60 X
(23.60, 0.0059) fran these data points, (40.26, 0.0083) Y = 0.00048 X - 0.00835 (49.97, 0.0139) R = 0.9781 (66.56, 0.0234) (82.20, 0.0328) average particle
size= 0.0157 inch = 399 tun
90
Figure 32
Particle Size Distribution Circle Cliffs Tar Sand

9*1 -JO 'fj 'Ml M l / I ) i j l 'Ml .)|i i<l
r~r™ r i r i r i ~i n i Circle Cliff Tar Sand
' 0 1 0 O'j 0 0 1
998 999 99 99
Cumulative Weight Fraction (*)

92
Figure 33
Pyrolysis Reactor Fluidization Test at Room Temperature Average Particle Size: 399 pm
93
\
\
- \ 1 £
^v •c
- ^ *
^ 7\
\
-3 S
! i E
asm

94
Fluidizing gas Nitrogen
Flow measurement Micro Motion mass flow meter, model D-6
AP measurement Foxboro differential pressure controller
Screen size less than 14 mesh Tyler Sieve
Average particle size 399 MID
Sand weight 6 kg
Collapsed bed height 24 inches
The pressure drop was approximately proportional to the gas velocity for the relatively low flow
rates in a packed bed. A further increase in gas velocity caused the packed bed to suddenly unlock.
With gas velocities beyond the minimum fluidization velocity, the bed expanded and gas bubbles rose
through the bed with a resulting nonhomogeneity in the bed. The pressure drop remained practically
unchanged with further increase in the gas flow rate. The pressure drop fluctuations subsequently
observed in the pilot plant reactor were presumed to be related to those observed in the glass tube
fluidization test.
Determination of Minimum Fluidization Velocity (U^) by Calculation8
The minimum fluidization velocity was calculated from the following equation:
3 d P U m f ^ = (33.72 + 0.048 x dP V ' s " V9
}o.3 . 3 3 i 7
where
T = 288 K;
P = 13 psia;
a = 1.7x10"4(g/cm sec) @ 288 K, 13 psia, N2;
p = 1.048x10"3(g/cm sec) @ 288 K, 13 psia, N2
Ps = 1.9 (g/cm3);
d = 0.0157 inch;

95
Re, P = 2.5;
therefore, Umf = 10.16 (cm/sec).
The calculated minimum fluidization velocity can be compared to the experimental value
determined from Figure 33.
Umf by calculation = 8.52 (cm/sec) @ STP; and
Umf by experiment = 13.03 (cm/sec) @ STP.
The difference may be related to the irregular shapes and to the size distribution of the tar sand
particles, since the equation was derived for a uniform size particle of spherical shape.
High-Temperature Fluidization Test
A high-temperature fluidization experiment was conducted prior to making the first tar sand
pyrolysis run. The intent of this test was to fluidize clean sand over a range of operating temperatures.
This test was also intended to evaluate the solids handling system, which included the screw feeder,
the solids control valve, the DP controller, and the cyclones. Sand was loaded into the hopper and the
reactor furnace was heated from 582 K to 870 K using a Lindberg electric heater. The lower reactor
pressure tap had been moved from the reactor zone to the chamber below the distributor plate after
conducting the room-temperature fluidization tests. This eliminated the need for installing filters in the
DP controller plumbing which was susceptible to plugging by fine dust. The slight decrease in
sensitivity that resulted from this relocation also acted as a damper and gave smoother response for
the solids control valve.
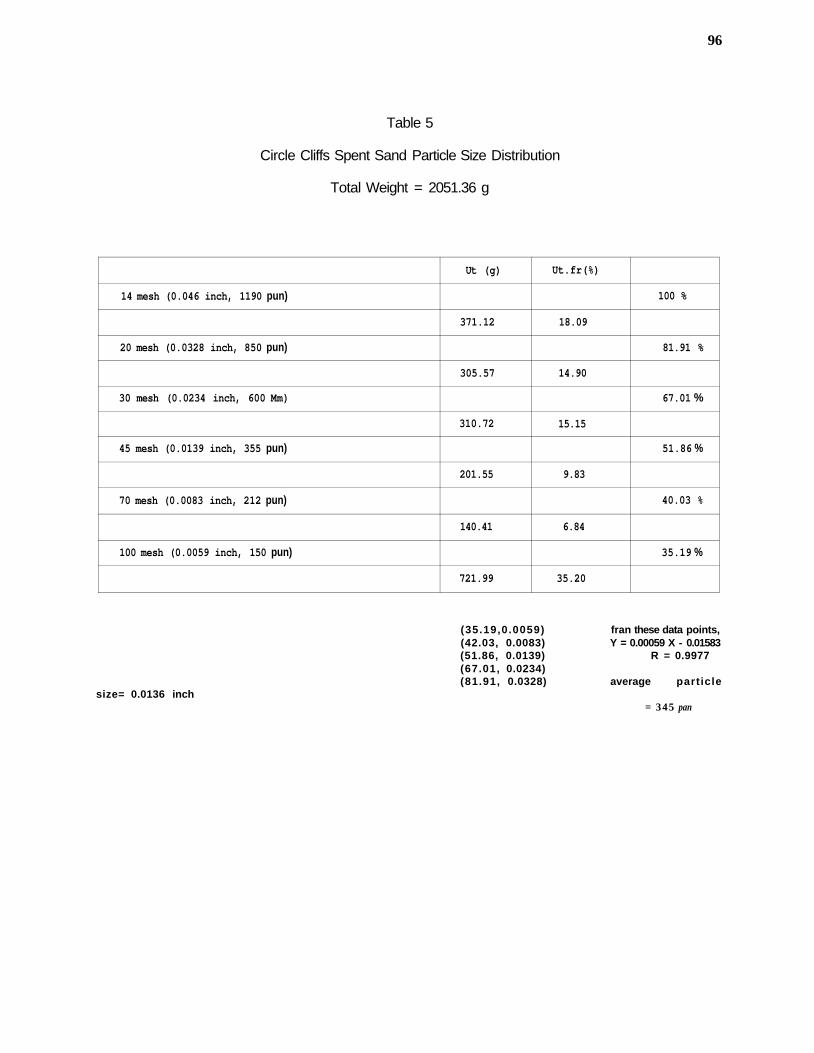
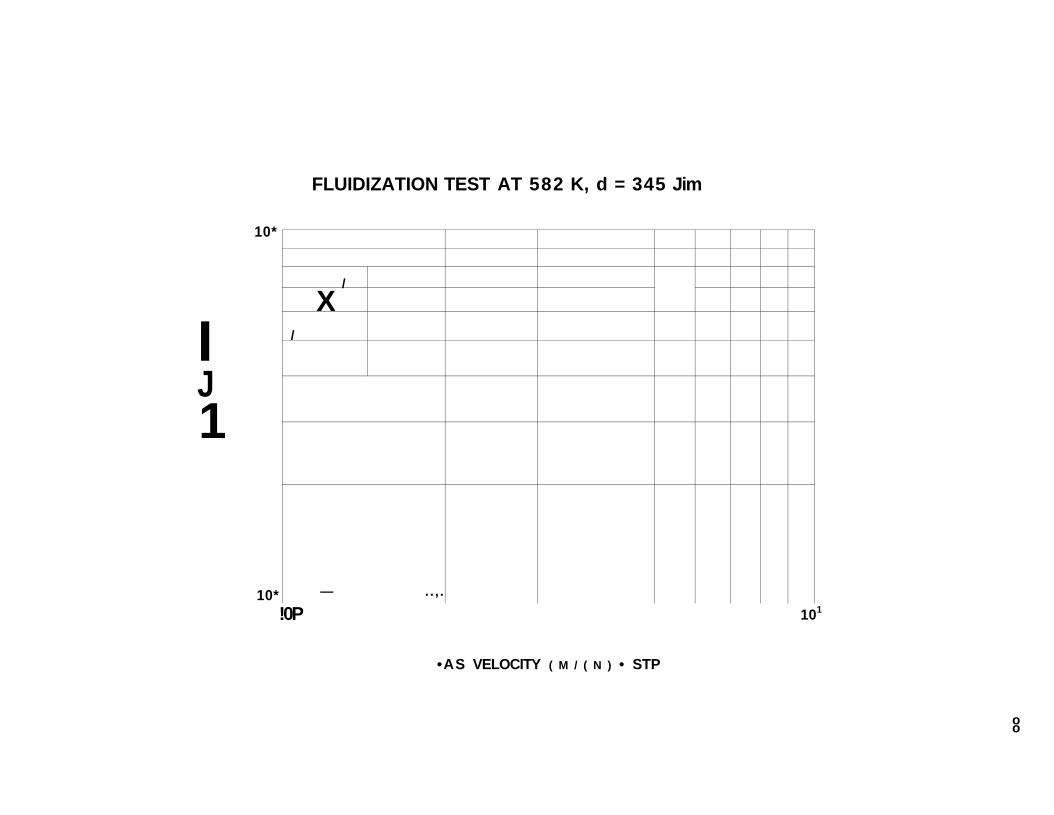
The particle size distribution of the spent sand is presented in Table 5 and Figure 34. The
pressure-drop/flow rate curves for the high-temperature fluidization tests are presented in Figures 35
through 38. A comparison between experimental and theoretical values of minimum fluidization velocity
for the temperature range 298.15 to 870.15 K is presented in Table 6 and Figure 39.
96
Table 5
Circle Cliffs Spent Sand Particle Size Distribution
Total Weight = 2051.36 g
14 mesh (0.046 inch, 1190 pun)
20 mesh (0.0328 inch, 850 pun)
30 mesh (0.0234 inch, 600 Mm)
45 mesh (0.0139 inch, 355 pun)
70 mesh (0.0083 inch, 212 pun)
100 mesh (0.0059 inch, 150 pun)
Ut (g)
371.12
305.57
310.72
201.55
140.41
721.99
Ut.fr(%)
18.09
14.90
15.15
9.83
6.84
35.20
100 %
81.91 %
67.01 %
51.86 %
40.03 %
35.19 %
(35.19,0.0059) fran these data points, (42.03, 0.0083) Y = 0.00059 X - 0.01583 (51.86, 0.0139) R = 0.9977 (67.01, 0.0234) (81.91, 0.0328) average particle
size= 0.0136 inch = 345 pan
97
Figure 34
Particle Size Distribution; Circle Cliffs Spent Sand
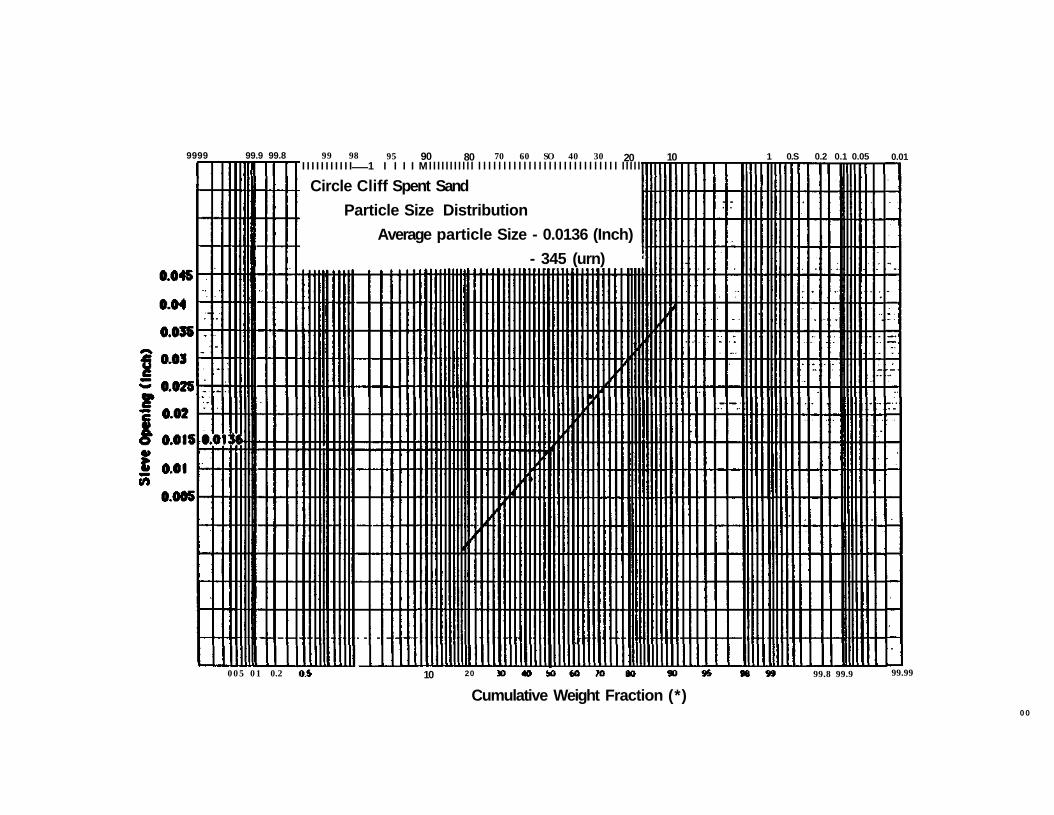
9999 99.9 99.8 99 98 95 90 80 70 60 SO 40 30 20 I I I I I I I I I I I 1 I I I I Ml l l l l l l l l l l l l l l l l l l l l l l l l l l l l l l l l l l l l l l l l l l l
Circle Cliff Spent Sand
Particle Size Distribution
Average particle Size - 0.0136 (Inch)
- 345 (urn)
10 1 0.S 0.2 0.1 0.05 0.01
0 0 5 0 1 0.2 10 20 99.8 99.9 99.99
Cumulative Weight Fraction (*) 0 0

99
Figure 35
High-Temperature Fluidization Tests Average Particle Size: 345 pm; Temperature: 582 K
FLUIDIZATION TEST AT 582 K, d = 345 Jim
10*
I J 1
10*
/
X /
— . . , .
!0P 101
•AS VELOCITY ( M / ( N ) • STP
o o
101
Figure 36
High-Temperature Fluidization Tests Average Particle Size: 345 pm; Temperature: 674 K
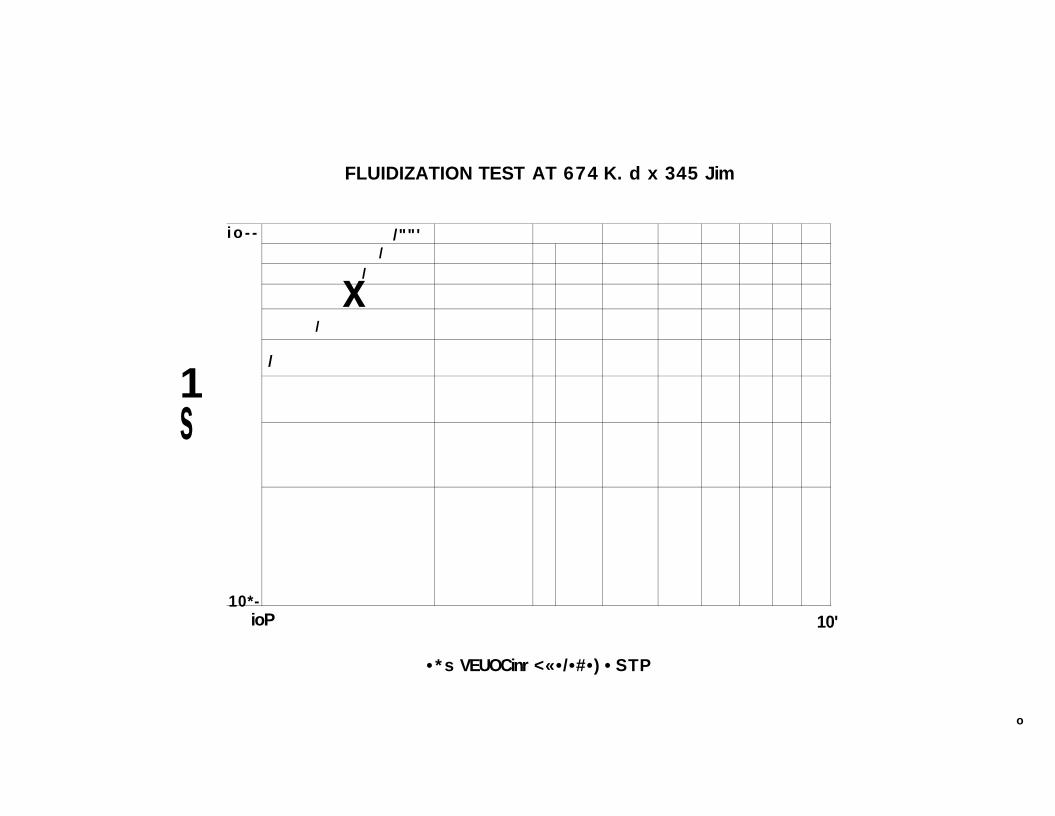
FLUIDIZATION TEST AT 674 K. d x 345 Jim
1 s
i o - -
10*-
/""' /
/ x /
/
ioP 10'
• * s VEUOCinr <«•/•#•) • STP
o
103
Figure 37
High-Temperature Fluidization Tests Average Particle Size: 345 /im; Temperature: 778 K
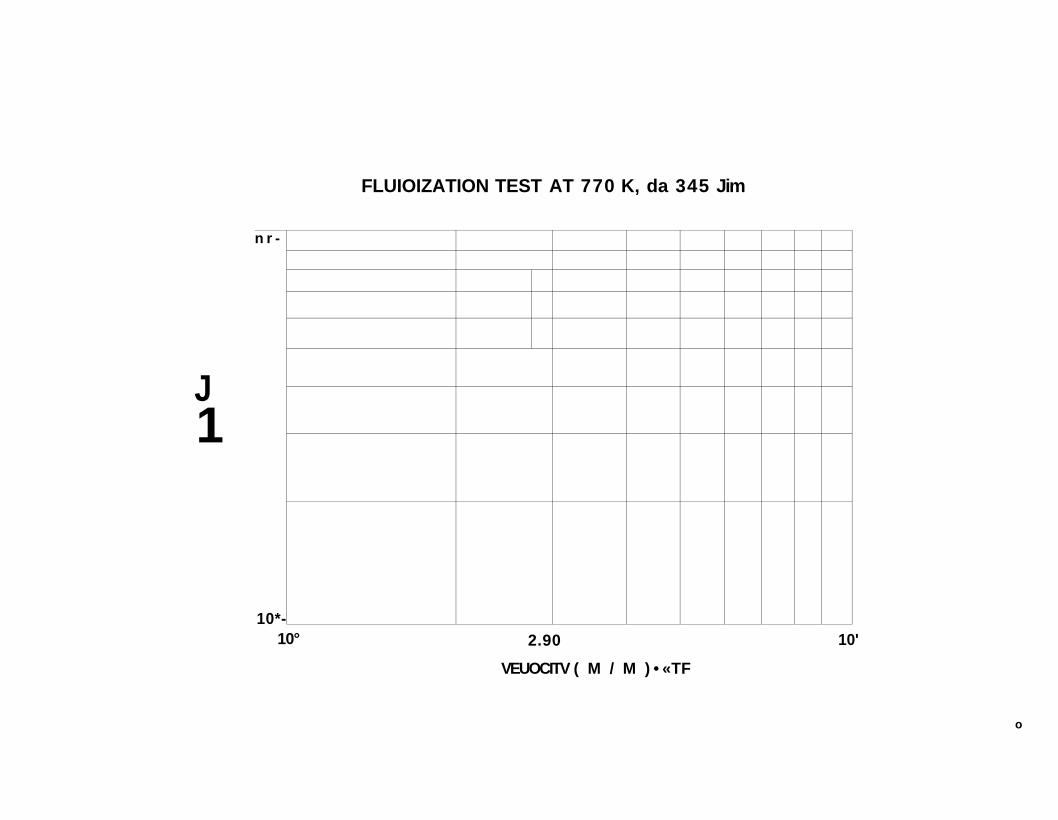
FLUIOIZATION TEST AT 770 K, da 345 Jim
J 1
n r -
10*-10° 2.90
VEUOCITV ( M / M ) • «TF
10'
o
105
Figure 38
High-Temperature Fiuidization Tests Average Particle Size: 345 pm; Temperature: 870 K

FLUIDIZATION TEST AT 870 K, d = 345 Jim
10*
§ i S
I 10*
10° 2.09 101
•AS VELOCITY ( • « / • • • ) # SIP
o
y
/
/
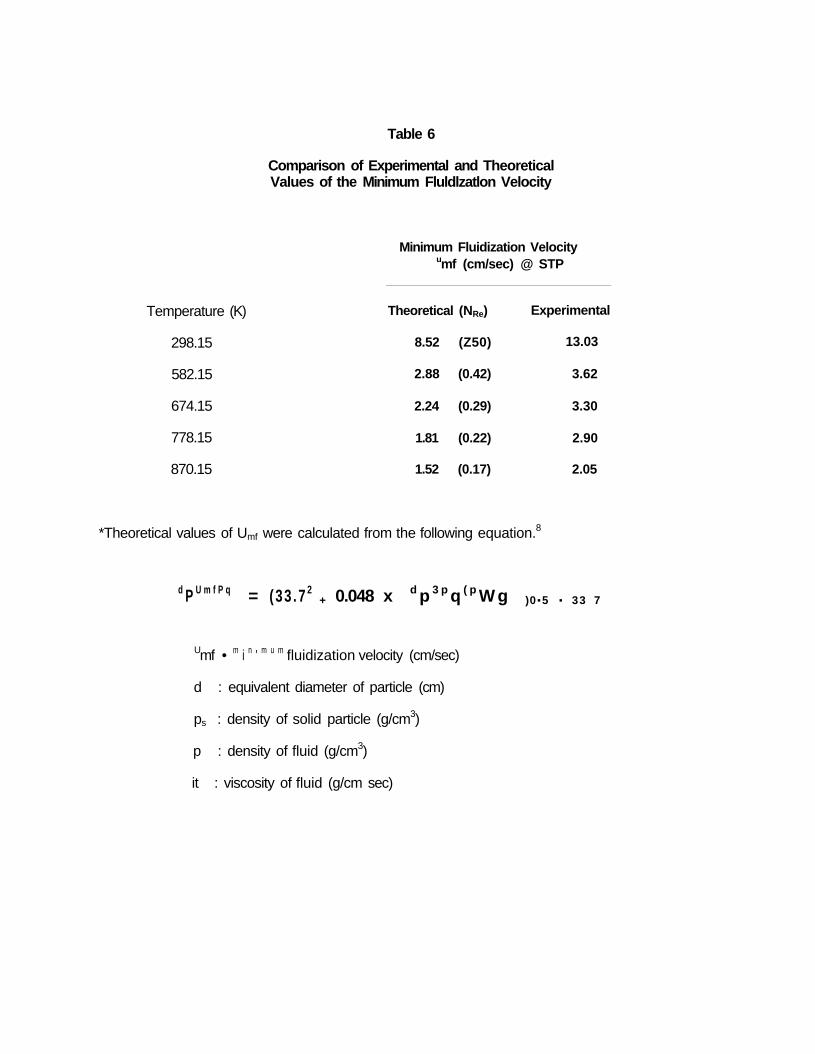
Table 6
Comparison of Experimental and Theoretical Values of the Minimum Fluldlzatlon Velocity
Temperature (K)
298.15
582.15
674.15
778.15
870.15
Minimum Fluidization Velocity umf (cm/sec) @ STP
Theoretical (NRe)
8.52 (Z50)
2.88 (0.42)
2.24 (0.29)
1.81 (0.22)
1.52 (0.17)
Experimental
13.03
3.62
3.30
2.90
2.05
*Theoretical values of Umf were calculated from the following equation.8
d P U m f P q = (33 .7 2 + 0.048 x d p 3 p q ( p W g )0.5 . 33 7
Umf • m i n ' m u m fluidization velocity (cm/sec)
d : equivalent diameter of particle (cm)
ps : density of solid particle (g/cm3)
p : density of fluid (g/cm3)
it : viscosity of fluid (g/cm sec)
108
Figure 39
Effect of Temperature on the Minimum Fluidization Velocity

TEMPERATURE («K)
o

110
Discussion of the Fluidization Test at High Temperatures
The Ergun equation9 was used to compute the pressure drop across the settled or packed
bed of spent sand, and is given by:
AP 1S011-C)2 BU L " 3J3 . 2
s p
where
AP : pressure drop;
L : bed height;
11 : fluid viscosity;
. 1.75(l-tf)u2p
u : fluid superficial velocity;
d : particle diameter;
p : fluid density;
0 : voidage; and
^s: sphericity.
If the pressure drop across the bed at incipient fluidization is set equal to the pressure drop
predicted by the above equation, a quadratic equation in Re^ is obtained.10
1.75 C^Re^2 + 150 C2Remf = Ar (kinetic term) (viscous term)
where
Ar: Archimedes number (d \{p -p)g/u2);
Cv C2 : shape-voidage factor; and
Remf : Reynolds number at minimum fluidization velocity (U^dp/rf.
The equation reduces to 150 C2Remf = Ar or nU^ is constant for small Reynolds numbers
(Remf varied from 0.42 to 0.17 as the temperature increased from 582 K to 870 K). The viscosity
increases with increasing temperature for a gas so that U^ decreases with temperature. The minimum
I l l
fluidization velocity decreases with increasing temperature for small particles (less than about two mm
for sand with hot fluidizing medium). The equation reduces to 1.75 C^Re^2 = Ar or pUmf2 is constant
for large Reynolds numbers. The density of a gas decreases with increasing temperature so that Umf
increases with temperature. For small particles at high temperatures, the viscous forces are dominant.
For larger particles (greater than two mm for sand), kinetic forces are dominant. The minimum
fluidization velocity determined by experiment (Figure 39) was higher than the calculated value. This
difference arose because particles such as particles of coked spent sand with rugged edges tended
to hook at the edges and interlock with each other and behave as if they were larger particles.10
Also, Pattipati and Wen10 reported no influence of temperature on the voidage and shape factor.
PRELIMINARY PYROLYSIS EXPERIMENTS
The preliminary pyrolysis experiments were conducted with the mined ore from the Circle Cliffs
deposits because the hopper-screw feeder calibration studies indicated that the Circle Cliffs ore could
be easily fed to the reactor in a continuous mode of operation. Furthermore, the small-diameter reactor
studies indicated that the quality of fluidization with the Circle Cliffs tar sand was excellent. Thus, the
use of the Circle Cliffs tar sand as feed sand in the preliminary pyrolysis experiments was intended to
eliminate feeding and fluidization problems during the initial pyrolysis experiments so that other
problems in the system would be revealed.
Circle Cliffs Tar Sand
A primary objective of the preliminary pyrolysis experiments with the Circle Cliffs tar sand was
to evaluate the material balance capabilities of the large-diameter fluidized-bed reactor.
Material Balance Calculations
The material balance calculations for a typical experiment were carried out as follows.
A. Identities
1. Run I.D.: CC-A-#5 Run
112
2. Date: 11.4. 1987
3. Source of feed sand: Circle Cliffs Tar Sand Deposit
4. Average particle size: 399 iim
5. Pyrolysis weight loss: 5.80 wt% (bitumen plus bound water)
(Based on tar sand pyrolysis @ 773°C, 15 hrs. in the muffle furnace)
B. Operating Conditions
1. Reactor temperature: 773 K
2. Average retention time: 24 min
3. Feed sand weight: 29,964 g
4. Tar Sand feed rate: 250 g/min
5. Run time: 2.0 hrs
6. Initial bed weight: 6.0 Kg
7. Bitumen plus bound water feed rate: 868.96 g/hr
8. Nitrogen flow rate: 44.7 g/min
9. Purge gas flow rate: 174 LPH
10. D.P. controller set point: 96 cm H20
The initial material balance calculations were based on 5.80 wt% pyrolysis weight loss, which
included 3.30 wt% bitumen and 2.50 wt% water.
Material Balance Calculation from CC-#5 Run
INPUT
* Initial feed amount: Circle Cliffs tar sand, 29,964 g
* Amount of bitumen plus bound water. 1737.91 g
OUTPUT
* Liquid product: 473.88 g
Weight difference in mist collector paper: 140.09 g
* Gas
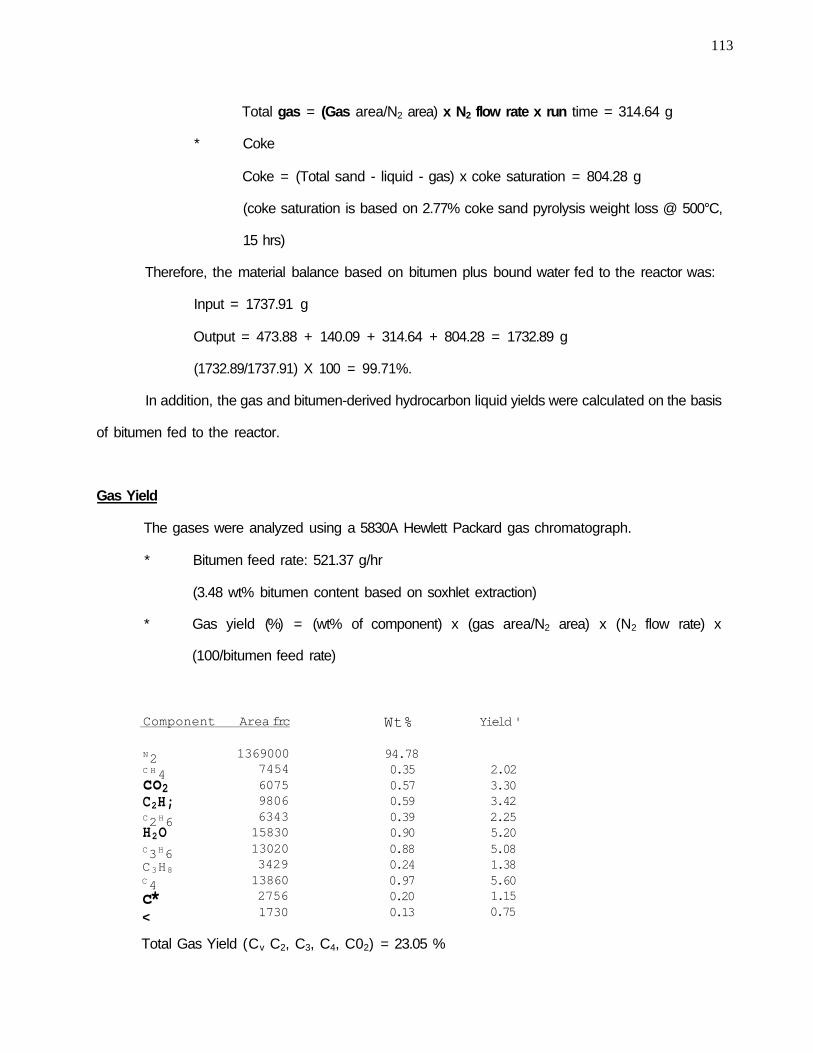
113
Total gas = (Gas area/N2 area) x N2 flow rate x run time = 314.64 g
* Coke
Coke = (Total sand - liquid - gas) x coke saturation = 804.28 g
(coke saturation is based on 2.77% coke sand pyrolysis weight loss @ 500°C,
15 hrs)
Therefore, the material balance based on bitumen plus bound water fed to the reactor was:
Input = 1737.91 g
Output = 473.88 + 140.09 + 314.64 + 804.28 = 1732.89 g
(1732.89/1737.91) X 100 = 99.71%.
In addition, the gas and bitumen-derived hydrocarbon liquid yields were calculated on the basis
of bitumen fed to the reactor.
Gas Yield
The gases were analyzed using a 5830A Hewlett Packard gas chromatograph.
* Bitumen feed rate: 521.37 g/hr
(3.48 wt% bitumen content based on soxhlet extraction)
* Gas yield (%) = (wt% of component) x (gas area/N2 area) x (N2 flow rate) x
(100/bitumen feed rate)
Component
N2 C H 4 co2 C2H; C2H6 H2O C3H6 C3H8 C4 c* <
Area frc
1369000 7454 6075 9806 6343 15830 13020 3429 13860 2756 1730
Wt%
94.78 0.35 0.57 0.59 0.39 0.90 0.88 0.24 0.97 0.20 0.13
Yield '
2.02 3.30 3.42 2.25 5.20 5.08 1.38 5.60 1.15 0.75
Total Gas Yield (Cv C2, C3, C4, C02) = 23.05 %
114
Produced Liquid Yield
* Liquid product: 473.88 g
Amount of water: 121 g (25.5 weight % of liquid product)
(based on Dean-Stark analysis)
* Bitumen feed rate: 521.37 g/hr
* Liquid recovery rate: 246.49 g/hr
* Liquid yield (%): (liquid recovery rate/bitumen feed rate) x 100 + (C5+, C6
+ from gas
analysis) = 49.18 %
Coke Yield
The carbonaceous residue on the sand was determined by burning a weighed sample of coked
sand in a muffle furnace at 773 K for 15 hours. The percentage of coke was determined from the
weight loss. However, the spent sand from the Circle Cliffs tar sand contained considerable water. The
presence of the water complicated the determination of the coke on the spent sand from the Circle
Cliffs tar sand. An appropriate method for coke determination for tar sands of this type is being
developed at present in conjunction with the small-diameter reactor studies using the Circle Cliffs tar
sand.
Characterization of the Produced Liquid from the Circle Cliffs Pvrolysls Experiments
The physical and chemical properties of the native bitumen and the produced liquid from the
Circle Cliffs tar sand were determined as a part of this study. The complete analyses of the Circle Cliffs
native bitumen are summarized in Table 3.
Solvent Soxhlet Extraction
The Circle Cliffs tar sand used in the preliminary pyrolysis experiments was crushed and the
bitumen was extracted using technical grade toluene as the solvent. The native bitumen was recovered

115
from the bitumen-toluene mixture using a vacuum distillation system after being filtered to remove sand
fines. The weight percentage of the recovered bitumen was calculated as follows.
#1 #2
initial weight of tar sand
wt. of sand after extraction
wt. of sand with filter paper
wt. of bitumen
sand material balance
wt. % of recovered bitumen
1500.00 g
1437.57 g
7.02 g
52.96 g
99.84 %
3.53 %
1500.00 g
1436.36 g
8.23 g
51.51 g
99.74 %
3.43%
After extraction, the sand was dried and pyrolyzed in a muffle furnace at 773 K for 15 hours.
The weight percent change in the sandstone was as follows.
#1 2.90 %
#2 2.90 %
#3 3.00 %
This additional weight loss was due to the release of bound water. This water was not connate
water, but rather was water produced by dehydration of the kaolinite present in the reservoir rock. The
kaolinite-bound water was released at 773 K. The loss of bound water was not observed at 673 K.
Simulated Distillation
Simulated Distillation was used to determine the boiling point distribution. The simulated
distillation was performed on a 5730A series Hewlett-Packard gas chromatograph with dual flame
ionization detectors (FID) using a 3 % Dexsil 300 on Anachrom Q column packing (6.35 mm O.D. x 0.46
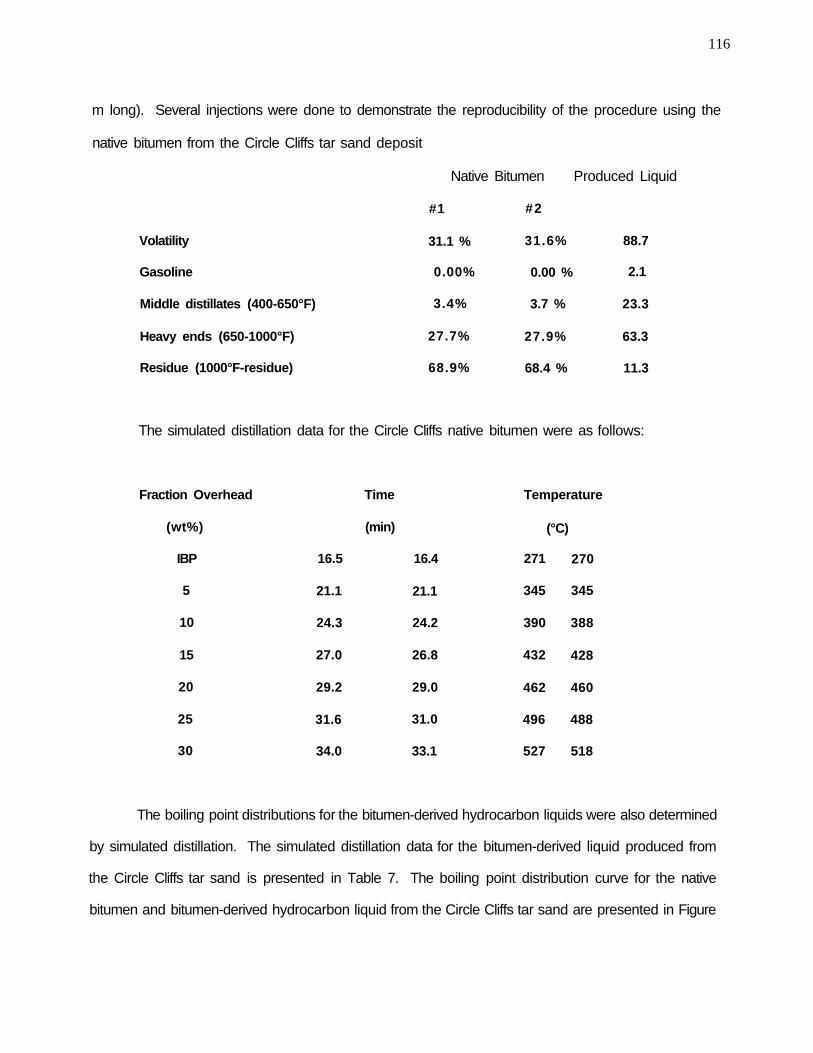
116
m long). Several injections were done to demonstrate the reproducibility of the procedure using the
native bitumen from the Circle Cliffs tar sand deposit
Native Bitumen Produced Liquid
Volatility
Gasoline
Middle distillates (400-650°F)
Heavy ends (650-1000°F)
Residue (1000°F-residue)
#1
31.1 %
0.00%
3.4%
27.7%
68.9%
#2
31.6%
0.00 %
3.7 %
27.9%
68.4 %
88.7
2.1
23.3
63.3
11.3
The simulated distillation data for the Circle Cliffs native bitumen were as follows:
Fraction Overhead
(wt%)
IBP
5
10
15
20
25
30
16.5
21.1
24.3
27.0
29.2
31.6
34.0
Time
(min)
16.4
21.1
24.2
26.8
29.0
31.0
33.1
Temperature
(°C)
271
345
390
432
462
496
527
270
345
388
428
460
488
518
The boiling point distributions for the bitumen-derived hydrocarbon liquids were also determined
by simulated distillation. The simulated distillation data for the bitumen-derived liquid produced from
the Circle Cliffs tar sand is presented in Table 7. The boiling point distribution curve for the native
bitumen and bitumen-derived hydrocarbon liquid from the Circle Cliffs tar sand are presented in Figure

117
Table 7
Simulated Distillation Data Bitumen-Derived Hydrocarbon liquid Product
Circle Cliffs Tar Sand
Fraction Overhead Time Temperature (wt %) (min) (°C)
IBP
10
20
30
40
50
60
70
80
85
10.3
15.5
18.6
21.2
23.4
25.6
27.8
29.5
32.5
33.8
183
257
305
346
377
409
443
472
506
525
118
Figure 40
Boiling Point Distribution for the Native Bitumen and the Bitumen-Derived Hydrocarbon Liquid
Circle Cliffs Tar Sand

119
0 0 IBM OT1M
40. This figure illustrates the extent of the boiling point reduction for the produced liquid relative to the
native bitumen.
Density
The density of the bitumen-derived hydrocarbon liquid was measured with a Mettler/Parr digital
density meter, DMA 40.
Native Bitumen Produced Liquid
Density @ 60°F (g/cm3) — 0.962
API gravity 14.3 15.4
It is interesting to note that despite the shift in the boiling range distribution, the API gravities of the
native bitumen and produced liquid were not significantly different. This may be related to the cracking
of the bitumen-derived hydrocarbon liquid over and above the expected thermal cracking due to the
presence of kaolinite in the solid matrix of the tar sand which was activated as a cracking catalyst at
the pyrolysis conditions.
Viscosity
The viscosity of the Circle Cliffs native bitumen was measured with a Brookfield Thermosel
System at the American Gilsonite Laboratory located in Salt Lake City, Utah. The viscosity of the liquid
product was measured by a Brookfield Synchro-lectric viscometer available at the University.
Viscosity (cps)
Native bitumen 23012 @ 363 K
Liquid product 13.0 @ 388.7 K
This significant reduction in viscosity may also be related to the apparent catalytic cracking activity of
the kaolinite, that is, cracking of normal and long chain iso-paraffins in the bitumen-derived hydrocarbon
liquid.
121
Pour Point
The pour point was measured according to the ASTM D97-66 method. The measured pour
points of the native bitumen and the bitumen-derived hydrocarbon liquid were as follows:
Pour Point (°F)
Native bitumen 129.2
Liquid product 31.0
Chemical Analysis
Elemental analysis and the molecular weight determination for the bitumens and the bitumen-
derived hydrocarbon liquids were performed by Galbraih Laboratories, Inc., located in Knoxville,
Tennessee.
Molecular weight
Carbon, wt. %
Hydrogen, wt. %
Nitrogen, wt. %
Oxygen, wt. %
Sulfur, wt. %
V (ppm)
Ni (ppm)
H/C Atomic Ratio
Native Bitumen
Sample #1
742
83.32
9.77
0.39
1.93
4.87
177
66
1.41
Sample #2
746
83.27
9.92
0.34
1.58
4.92
155
52
1.43
Liquid Product
288
88.08
10.21
1.05
0.70
0.24
<3
18
1.39
The sulfur content of the bitumen-derived liquid was an order of magnitude less than that of
the native bitumen. The absence of significant quantities of H2S in the produced gas implied that the
organic sulfur in the bitumen remained with the carbonaceous residue on the spent sand. The increase
in the nitrogen content of the bitumen-derived liquid relative to the native bitumen may be related to
the selective cracking of the low molecular weight hydrocarbon species in the produced vapor by the

122
activated kaolinite component of the reservoir rock (~ 14% by weight). The removal of a portion of the
hydrocarbon fraction while the nitrogen heteroatom species are not converted would result in a
concentration of these species in the unconverted produced liquid. Thus, the nitrogen content of the
produced liquid would be greater than that of the native bitumen. As expected, a significant reduction
in the metals content was observed due to the deposition of nickel and vanadium with the
carbonaceous residue on the spent sand.
Asphaltene and Maltene Content
The asphaltene and maltene content of the Circle Cliffs tar sand bitumen and bitumen-derived
hydrocarbon liquid were also determined. The asphaltene and deasphalted heavy oil fractions were
isolated by diluting the bitumen with n-pentane and agitating the mixture for not less than five hours.
This procedure afforded a pentane-insoluble fraction; the asphaltenes, and a pentane soluble fraction;
the deasphalted heavy oil or maltenes.
Native Bitumen Liquid Product
Asphaltenes, wt. % 51.05 6.90
Maltenes, wt. % 48.95 93.10
A reduction in asphaltene content of the produced liquid relative to the native bitumen was
expected since it is presumed that the asphaltenes are converted to a carbonaceous residue and low
molecular gases; however, previous experience with the small-diameter reactor would not have led to
a prediction of this large a reduction in the asphaltene content.
A summary of the physical and chemical properties for the native bitumen and the produced
liquid product from the Circle Cliffs tar sand is presented in Table 8.
PYROLYSIS REACTOR PRODUCTION RUN WITH WHITEROCKS TAR SAND
The large-diameter fluidized-bed pyrolysis reactor was designed and fabricated for processing
bitumen-impregnated sandstone or tar sand to produce a bitumen-derived hydrocarbon liquid for use
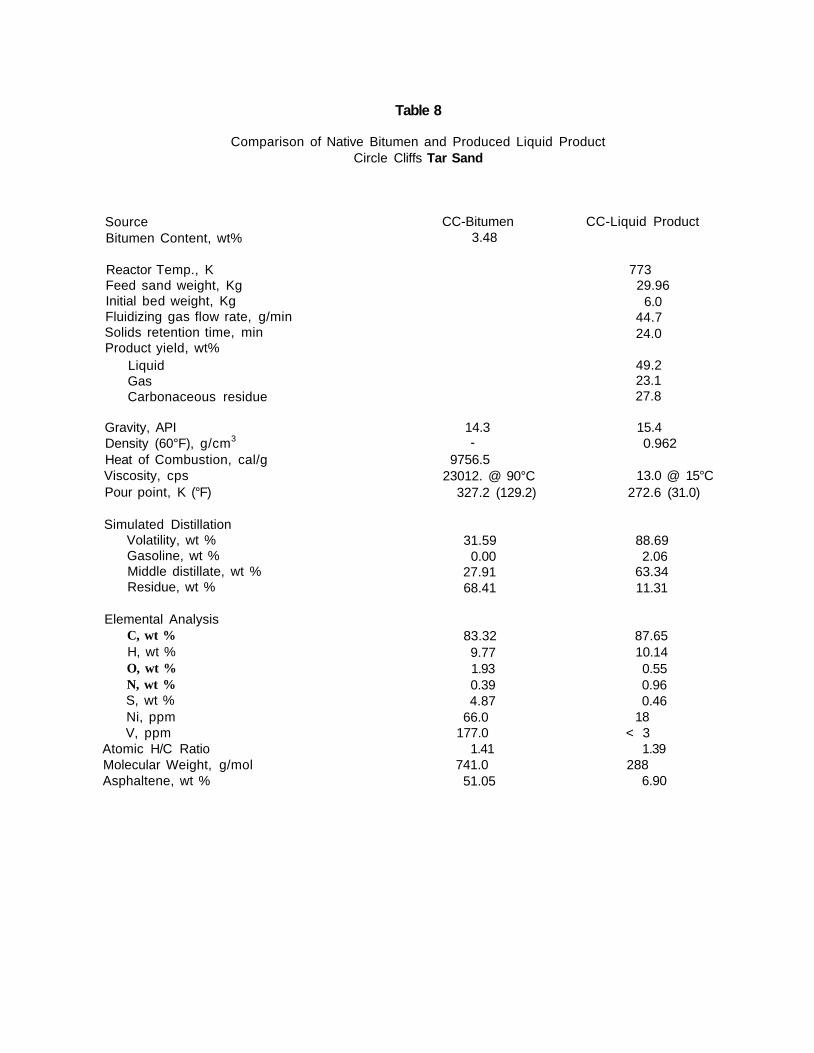
Table 8
Comparison of Native Bitumen and Produced Liquid Product Circle Cliffs Tar Sand
Source Bitumen Content, wt%
CC-Bitumen 3.48
CC-Liquid Product
Reactor Temp., K Feed sand weight, Kg Initial bed weight, Kg Fluidizing gas flow rate, g/min Solids retention time, min Product yield, wt%
Liquid Gas Carbonaceous residue
Gravity, API Density (60°F), g/cm3
Heat of Combustion, cal/g Viscosity, cps Pour point, K (°F)
Simulated Distillation Volatility, wt % Gasoline, wt % Middle distillate, wt % Residue, wt %
Elemental Analysis C, wt % H, wt % O, wt % N, wt % S, wt % Ni, ppm V, ppm
Atomic H/C Ratio Molecular Weight, g/mol Asphaltene, wt %
14.3 -
9756.5 23012. @ 90°C
327.2 (129.2)
31.59 0.00
27.91 68.41
83.32 9.77 1.93 0.39 4.87
66.0 177.0
1.41 741.0
51.05
773 29.96
6.0 44.7 24.0
49.2 23.1 27.8
15.4 0.962
13.0 @ 15°C 272.6 (31.0)
88.69 2.06
63.34 11.31
87.65 10.14 0.55 0.96 0.46
18 < 3
1.39 288
6.90
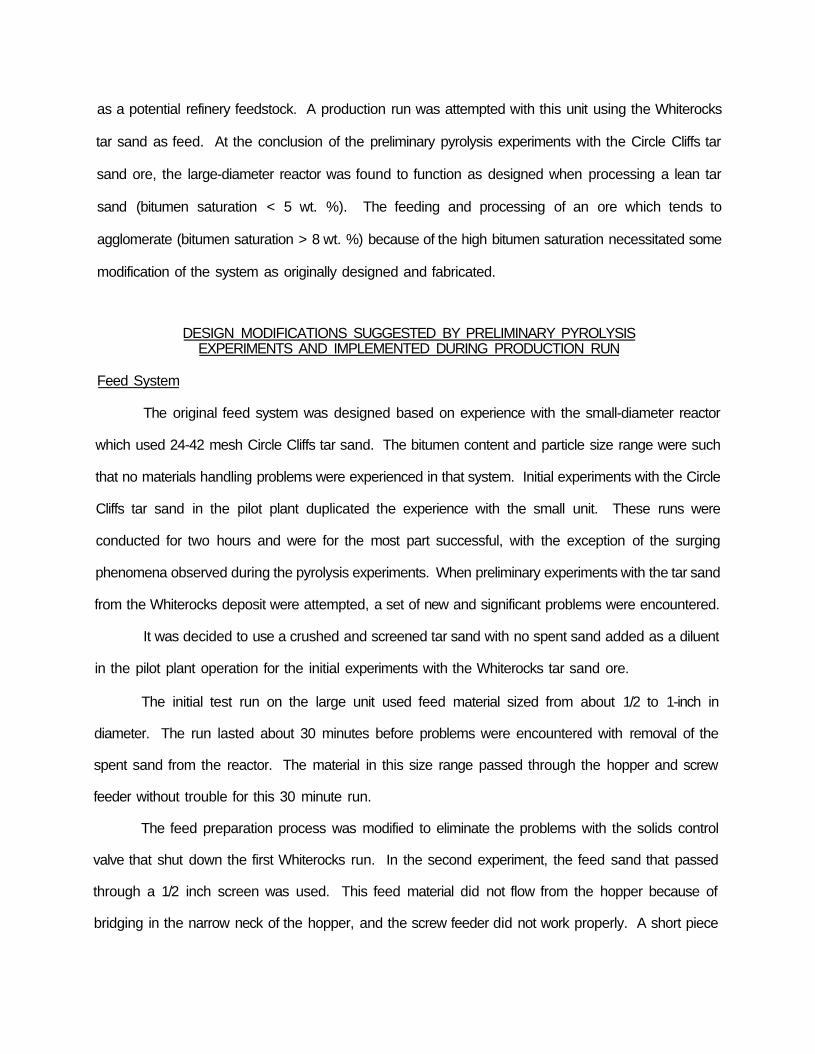
as a potential refinery feedstock. A production run was attempted with this unit using the Whiterocks
tar sand as feed. At the conclusion of the preliminary pyrolysis experiments with the Circle Cliffs tar
sand ore, the large-diameter reactor was found to function as designed when processing a lean tar
sand (bitumen saturation < 5 wt. %). The feeding and processing of an ore which tends to
agglomerate (bitumen saturation > 8 wt. %) because of the high bitumen saturation necessitated some
modification of the system as originally designed and fabricated.
DESIGN MODIFICATIONS SUGGESTED BY PRELIMINARY PYROLYSIS EXPERIMENTS AND IMPLEMENTED DURING PRODUCTION RUN
Feed System
The original feed system was designed based on experience with the small-diameter reactor
which used 24-42 mesh Circle Cliffs tar sand. The bitumen content and particle size range were such
that no materials handling problems were experienced in that system. Initial experiments with the Circle
Cliffs tar sand in the pilot plant duplicated the experience with the small unit. These runs were
conducted for two hours and were for the most part successful, with the exception of the surging
phenomena observed during the pyrolysis experiments. When preliminary experiments with the tar sand
from the Whiterocks deposit were attempted, a set of new and significant problems were encountered.
It was decided to use a crushed and screened tar sand with no spent sand added as a diluent
in the pilot plant operation for the initial experiments with the Whiterocks tar sand ore.
The initial test run on the large unit used feed material sized from about 1/2 to 1-inch in
diameter. The run lasted about 30 minutes before problems were encountered with removal of the
spent sand from the reactor. The material in this size range passed through the hopper and screw
feeder without trouble for this 30 minute run.
The feed preparation process was modified to eliminate the problems with the solids control
valve that shut down the first Whiterocks run. In the second experiment, the feed sand that passed
through a 1/2 inch screen was used. This feed material did not flow from the hopper because of
bridging in the narrow neck of the hopper, and the screw feeder did not work properly. A short piece
of PVC pipe was inserted into the hopper and filled with tar sand to test the screw feeder and to
identify and isolate the feed flow problem. The purpose of the pipe was to provide tar sand to the
screw feeder that did not have to pass through a reduction in diameter where bridging could occur.
Several short experiments were conducted. These runs terminated due to problems elsewhere in the
system; however, although the feed system worked, it did not function without problems: the screw
feeder would work properly for a period of time and then the auger would become packed with
agglomerated tar sand and the solids flow would stop.
At this point, it was obvious that a new feed system was required. Some effort was made to
design such a system, including the use of a star valve in place of the screw feeder; however, these
attempts at major modification of the feed system were abandoned in the interests of time vis-a-vis the
production run. A temporary solution to this problem was to add spent sand to the feed sand, thus
allowing continuous operation of the unit in order to identify other problems with the design. The
hopper was replaced by an eight-foot long three-inch diameter PVC pipe. A lock hopper was built
using a three inch gate valve and another piece of PVC pipe about three feet long. This configuration
was used throughout the remainder of the pilot plant operation with good success. A key element in
using this temporary system was the premixing of the spent sand and the feed tar sand. Initial
attempts failed when the mixing was attempted by placing ten gallons of feed tar sand and five gallons
of spent sand in a 30-gallon barrel and rolling it around for several minutes. Even though the mixture
appeared to be homogeneous, the screw feeder auger would plug often when feeding the mixture.
When the fresh tar sand and spent sand were mixed for about 10 to 15 minutes in a cement mixer,
the feed moved smoothly through the screw feeder. Different feed tar sand/spent sand ratios were
tried; however, it was concluded that two-to-one was the minimum feed sand-to-spent sand ratio
necessary to permit consistent, long-term feeding of the tar sand to the reactor.
Dlsenqaqer
The disengager performed well during the preliminary pilot plant experiments and during the
production run. No larger particles were found in the cyclones or other dust removal equipment, which
indicated that the disengager accomplished the task for which it was designed. There were, however,
several problems which could be easily corrected in future designs.
The screw feeder was mounted on top of the disengager. The outlet for the product gases was
about an inch from the top of the disengager. The screw feeder had to remain at room temperature,
and the disengager required temperatures of 723 to 823 K. Thus, it was difficult to simultaneously keep
the screw feeder cool and the disengager hot. It was proposed that the length of the disengager be
increased above the product gas exit, thus increasing the temperature gradient across the disengager.
Temperature control of the disengager was also important. During the initial runs, an electric
heater was used to maintain the temperature above the condensation temperature of the produced
vapor. The heater was sized only to offset heat losses, which proved to be inadequate. Larger electric
heaters were installed, but because of the size and shape of the disengager they were undependable:
the heater elements would short-circuit to the wall of the disengager or the resistance wire would fail
due to the high loads required to maintain the required temperature.
An adequate solution was devised when the electrical resistance reactor furnace was replaced
by a direct fired, natural gas burner: the burner exhaust gas was used to heat the disengager.
Reactor
The initial reactor configuration worked well for the 24-42 mesh Circle Cliffs tar sand. The initial
runs using tar sand from the Whiterocks deposit experienced difficulty in spent sand removal. Upon
disassembly of the reactor it was found that a small amount of the tar sand did not disintegrate during
pyrolysis as expected. The bitumen was the only cementing medium for the sand grains in Whiterocks
tar sand. As the bitumen was driven from the sand, most of the large particles were completely broken
down into individual sand grains which fluidized easily. In a few particles, however, the carbonaceous
residue formed during pyrolysis replaced the bitumen as the cementing medium, thus leaving a large
particle which settled to the bottom of the reactor. Enough of these settled particles were of sufficient
size to plug the passageway through the solids control valve.
127
Prior to the production run, experiments were conducted using baffles inside a four inch glass
tube fluidized bed. The purpose of the baffles was to slow the descent of the larger particles through
the bed while still allowing the bed to fluidize. An experimental baffle was constructed by welding 1/8-
inch drill rod about 2/3 of the way across the reactor diameter with a 1/4-inch space between each rod.
There was no observable deterioration of the quality of fluicfization. However, because of the location
of the thermowells, some difficulty was encountered in installing baffles in the reactor system. A series
of the baffles could be used to increase the residence time of the larger particles in the turbulent region
of the bed, thus leading to their eventual disintegration. Otherwise, these particles sink rapidly to the
distributor plate where they coke rather than disintegrate. In addition to the operational problems these
large particles cause, they represent a potential for a decrease in the liquid yield as the coke rather
than pyrolyze.
There were four thermowells approximately equidistant along the length of the reactor entering
from the side. Only the lower two of these were ultimately used because the temperatures along the
axial dimension of the bed and reactor were observed to be consistently the same during the
preliminary experiments.
The reactor furnace was the source of many delays. Originally, a 14,000 watt Lindburg furnace
was used to heat the reactor. The heat input was the limiting factor for this system. A major reason
for the construction of the four-inch diameter reactor was to test shorter sand residence times.
Unfortunately, the shortest residence time achievable with the electric furnace was about 25 minutes,
because the heater was operating at maximum capacity at this residence time. During the first few
months of operation, the longest run achieved was about five hours and the heater required four new
heater elements. After facing the possibility of a long downtime to await shipping of new heater
elements, it was decided to build a gas fired furnace. The design of the furnace and control system
was kept as simple as possible. The reactor was lowered into a 10-inch diameter pipe that extended
from the distributor plate to the top flange of the disengager. Two burners were installed in the space
between the pipe and the reactor. Compressed air and natural gas were mixed in a premixing section
to produce an efficient flame in the burners. The resulting flame reached about halfway up to the
reactor and provided sufficient heat at sand residence times down to 15 minutes. The control system
consisted of a Honeywell solid state igniter and gas solenoid valve assembly that was controlled by the
IBM PC. The temperature of the reactor was read by the computer every 60 seconds, and a control
routine switched the furnace on and off via the MetraByte interface hardware. This heating system
provided virtually troublefree operation from the time it was placed in service. The flue gas from the
furnace was allowed to circulate around the disengager replacing the electrical resistance disengager-
heater. Some overheating was experienced initially, but was eliminated by injecting compressed air just
above the furnace flame. The flow rate of the injected air provided control of the flue gas temperature
and thus control of the disengager temperature.
Solids Control Valve
The solids control valve (SCV) worked effectively for the Circle Cliffs tar sand runs in which the
feed was sized to 24-42 mesh or smaller. The level of the fluidized bed in the reactor was controlled
by the Foxboro DP controller. Plugging occurred when feed from the Whiterocks deposit was
introduced. Large particles would accumulate on the solids control valve and within 20 to 30 minutes,
sand removal could no longer be accomplished. The Foxboro controller was equipped with a
differential function in its control mechanism. As the differential pressure across the bed approached
the setpoint, the SCV was opened a small amount. This method of control caused particle size
partitioning to occur at this inlet to the standpipe. The small sand grains passed through the partially
open SCV, but the larger particles did not, which caused an accumulation on the distributor plate.
Initially, the smaller grains found their way past the larger particles and through the SCV; however, after
a period of time, only the nitrogen gas flowed out of the reactor. This loss of nitrogen gas from the
reactor caused the fluidized bed to collapse and the differential pressure reading decreased below the
setpoint, signalling the controller to close the SCV. Once the SCV was closed, the nitrogen pressure
would build up below the bed until the DP reached the setpoint. Even though the bed had not had
adequate time to refluidize, the SCV opened, releasing the nitrogen pressure once again. This cycle
continued and ultimately caused the system to shut down.

129
This problem was temporarily solved by discontinuing automatic control of the SCV and
switching to manual control of the SCV. This was done by installing a three-way valve on the air inlet
line to the pneumatic actuator. The three-way valve exposed the pneumatic actuator diaphragm of the
normally open actuator to either the 15 psi line pressure, causing it to close, or to the atmosphere,
allowing it to open. Spent sand was successfully removed from the reactor on a continuous basis by
manually opening the SCV to the fully opened position and then closing it immediately. This procedure
was repeated every five minutes or so, depending on the need to remove sand from the bed, as
determined by the differential pressure reading taken by the operator from the Foxboro controller.
Product Recovery
Initial design of the product recovery system was patterned after the small reactor; however,
these techniques proved to be inadequate for a large-scale continuous flow system operating in excess
of four hours onstream.
The product gases were swept from the bed by the fluidizing gases. The sweep gas-
hydrocarbon vapor left the reactor and passed into the disengager, and from the disengager into two
cyclones mounted in series, where much of the fines and dust were removed. The remaining dust was
collected using two filters in parallel. The stream temperature to this point in the process maintained
higher than 673 K to prevent condensation of the hydrocarbon vapors. From the beginning, problems
with plugging were experienced with both the cyclones and the filters. The boiling point distribution
of the liquid product indicated that about 10 percent of the material boiled above 673 K. As the gases
entered the disengager, some of the heavier material probably condensed, forming a mist. These mist
particles impinged on the wall of the cyclone at the entrance. The cyclones were surrounded by
heaters; thus, the wall temperature was high enough that coking of the condensed hydrocarbon phase
occurred. Over a period of several hours onstream, the coke built up so as to obstruct the entrance
to the first cyclone.
The filters experienced a similar problem. Material removed from the filter elements contained
a small amount of heavy hydrocarbons. Enough hydrocarbon condensate formed so as to "cement"
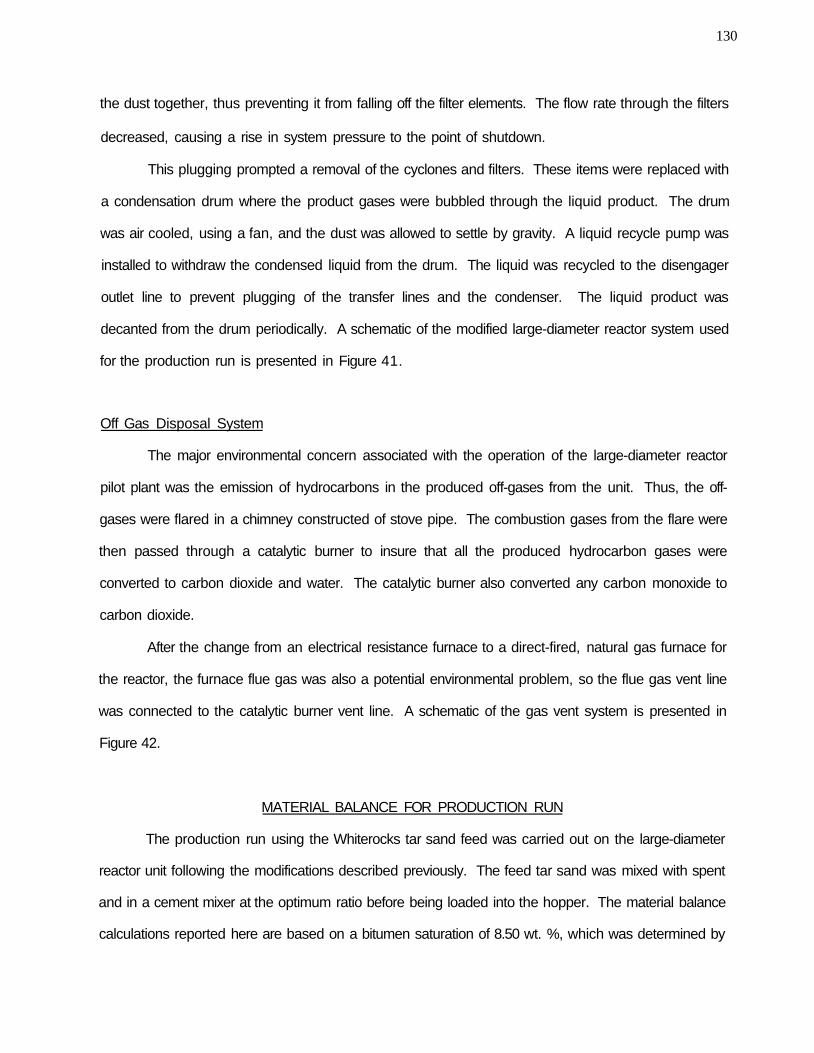
130
the dust together, thus preventing it from falling off the filter elements. The flow rate through the filters
decreased, causing a rise in system pressure to the point of shutdown.
This plugging prompted a removal of the cyclones and filters. These items were replaced with
a condensation drum where the product gases were bubbled through the liquid product. The drum
was air cooled, using a fan, and the dust was allowed to settle by gravity. A liquid recycle pump was
installed to withdraw the condensed liquid from the drum. The liquid was recycled to the disengager
outlet line to prevent plugging of the transfer lines and the condenser. The liquid product was
decanted from the drum periodically. A schematic of the modified large-diameter reactor system used
for the production run is presented in Figure 41.
Off Gas Disposal System
The major environmental concern associated with the operation of the large-diameter reactor
pilot plant was the emission of hydrocarbons in the produced off-gases from the unit. Thus, the off-
gases were flared in a chimney constructed of stove pipe. The combustion gases from the flare were
then passed through a catalytic burner to insure that all the produced hydrocarbon gases were
converted to carbon dioxide and water. The catalytic burner also converted any carbon monoxide to
carbon dioxide.
After the change from an electrical resistance furnace to a direct-fired, natural gas furnace for
the reactor, the furnace flue gas was also a potential environmental problem, so the flue gas vent line
was connected to the catalytic burner vent line. A schematic of the gas vent system is presented in
Figure 42.
MATERIAL BALANCE FOR PRODUCTION RUN
The production run using the Whiterocks tar sand feed was carried out on the large-diameter
reactor unit following the modifications described previously. The feed tar sand was mixed with spent
and in a cement mixer at the optimum ratio before being loaded into the hopper. The material balance
calculations reported here are based on a bitumen saturation of 8.50 wt. %, which was determined by

131
Figure 41
Flow Diagram of Fluidized-Bed Pilot Plant for Production Run
132-
a PVC look hopper
A To flare
L«tL2
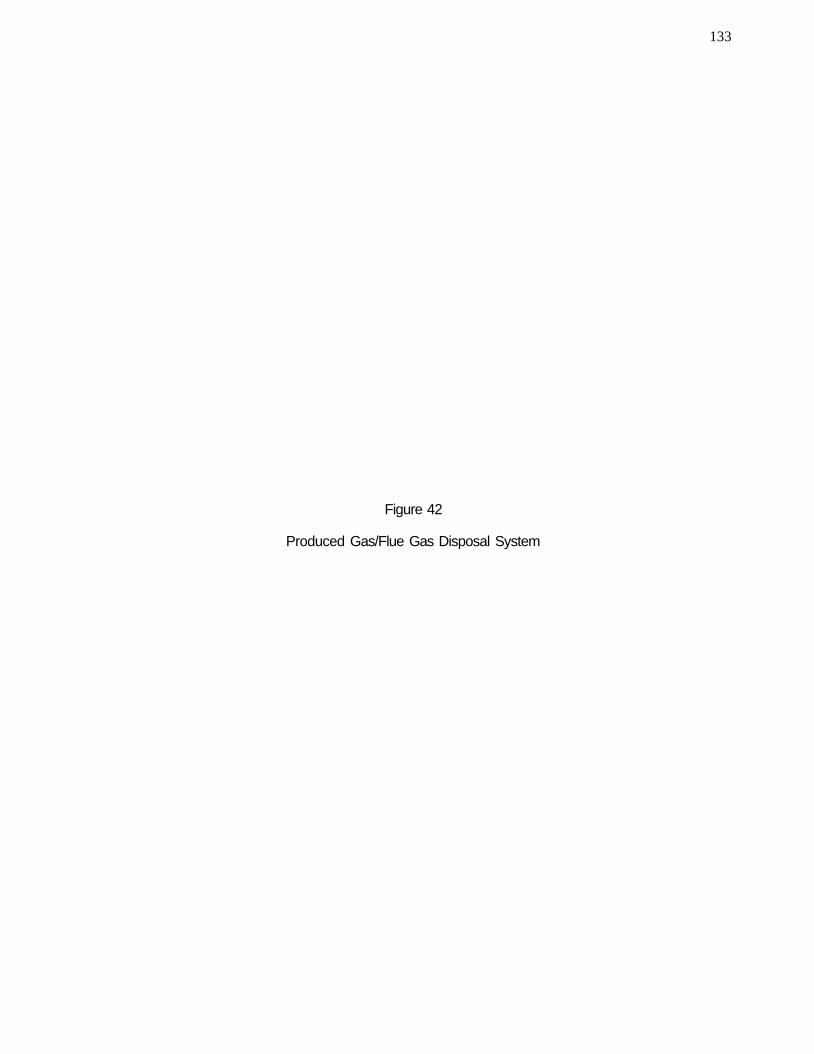
133
Figure 42
Produced Gas/Flue Gas Disposal System
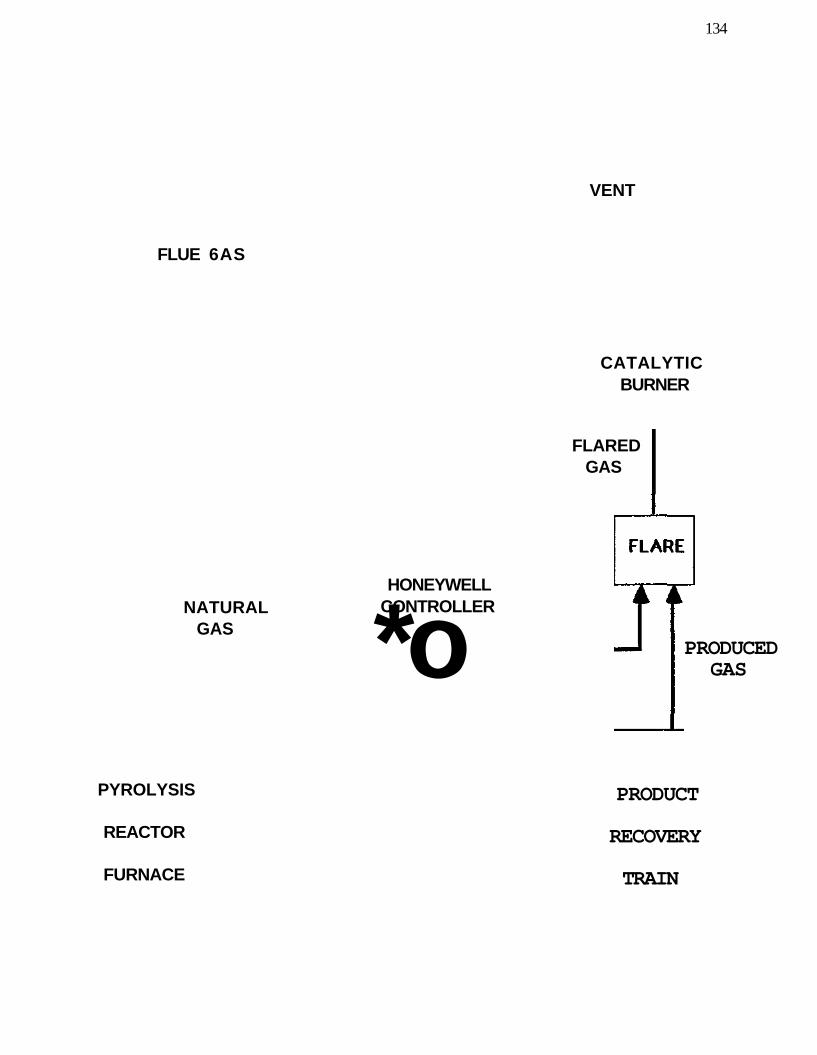
134
VENT
FLUE 6AS
NATURAL GAS
HONEYWELL CONTROLLER
*o PYROLYSIS
REACTOR
FURNACE
CATALYTIC BURNER
FLARED GAS
PRODUCED GAS
PRODUCT
RECOVERY
TRAIN
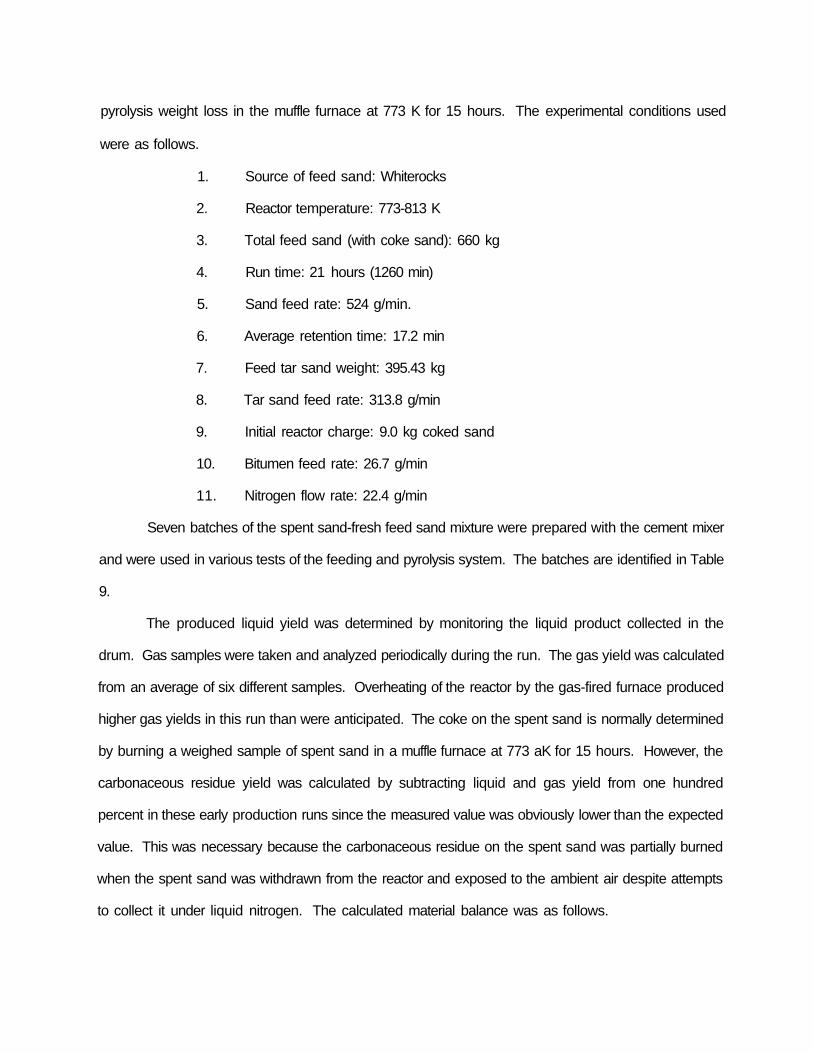
pyrolysis weight loss in the muffle furnace at 773 K for 15 hours. The experimental conditions used
were as follows.
1. Source of feed sand: Whiterocks
2. Reactor temperature: 773-813 K
3. Total feed sand (with coke sand): 660 kg
4. Run time: 21 hours (1260 min)
5. Sand feed rate: 524 g/min.
6. Average retention time: 17.2 min
7. Feed tar sand weight: 395.43 kg
8. Tar sand feed rate: 313.8 g/min
9. Initial reactor charge: 9.0 kg coked sand
10. Bitumen feed rate: 26.7 g/min
11. Nitrogen flow rate: 22.4 g/min
Seven batches of the spent sand-fresh feed sand mixture were prepared with the cement mixer
and were used in various tests of the feeding and pyrolysis system. The batches are identified in Table
9.
The produced liquid yield was determined by monitoring the liquid product collected in the
drum. Gas samples were taken and analyzed periodically during the run. The gas yield was calculated
from an average of six different samples. Overheating of the reactor by the gas-fired furnace produced
higher gas yields in this run than were anticipated. The coke on the spent sand is normally determined
by burning a weighed sample of spent sand in a muffle furnace at 773 aK for 15 hours. However, the
carbonaceous residue yield was calculated by subtracting liquid and gas yield from one hundred
percent in these early production runs since the measured value was obviously lower than the expected
value. This was necessary because the carbonaceous residue on the spent sand was partially burned
when the spent sand was withdrawn from the reactor and exposed to the ambient air despite attempts
to collect it under liquid nitrogen. The calculated material balance was as follows.
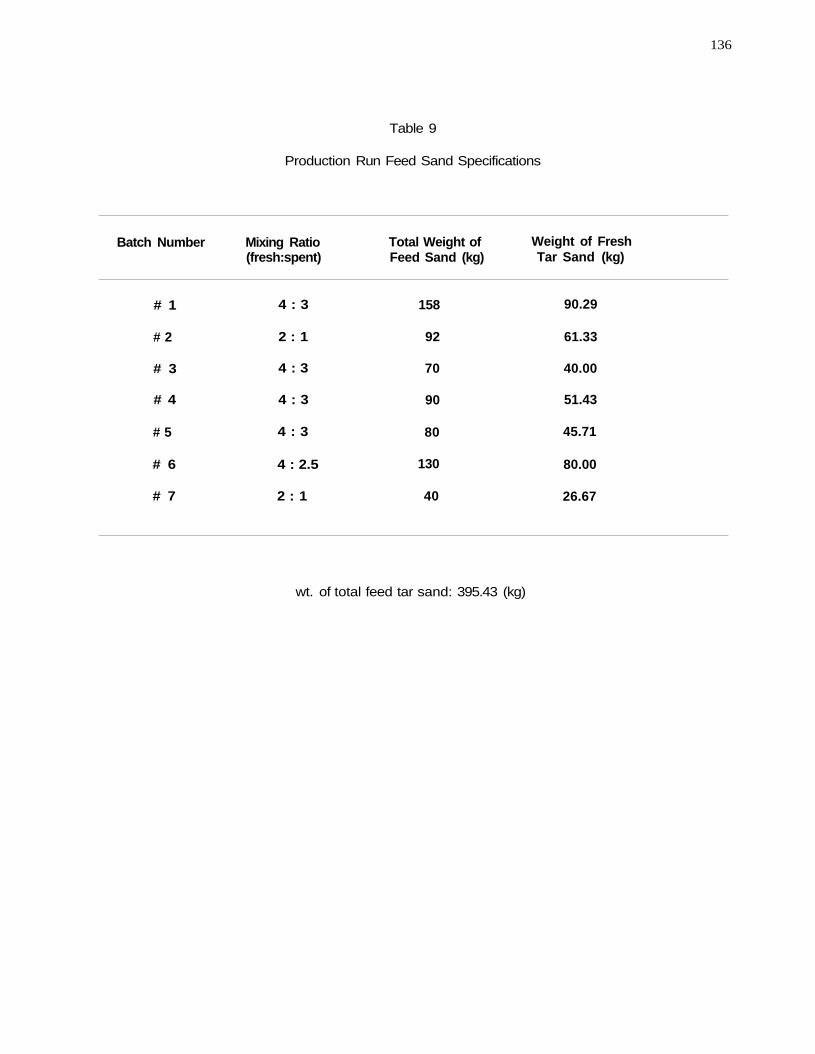
136
Table 9
Production Run Feed Sand Specifications
Batch Number
# 1
# 2
# 3
# 4
# 5
# 6
# 7
Mixing Ratio (fresh:spent)
4 : 3
2 : 1
4 : 3
4 : 3
4 : 3
4 : 2.5
2 : 1
Total Weight of Feed Sand (kg)
158
92
70
90
80
130
40
Weight of Fresh Tar Sand (kg)
90.29
61.33
40.00
51.43
45.71
80.00
26.67
wt. of total feed tar sand: 395.43 (kg)
Liquid yield: 44.7 wt %
Gas yield: 29.3 wt %
Coke yield: 25.0 wt %
The normalized material balance was:
Liquid yield: 44.7 wt %
Gas yield: 29.3 wt %
Coke yield: 26.0 wt %
The data were normalized by adding the material for which we could not account to the coke
yield rather than distributing it over all three fractions.
The shift in yields for the large-diameter reactor relative to those obtained in the small diameter
reactor are probably related to the problems associated with the reactor furnace system. After
replacement of the electrical furnace with the gas-fired furnace and the development of a technique for
controlling the temperature of the expansion chamber, the liquid yield increased and the gas make
decreased.
ANALYSIS OF BITUMEN-DERIVED HYDROCARBON LIQUID PRODUCED IN PRODUCTION RUN
The native bitumen and bitumen-derived hydrocarbon liquids from the Whiterocks tar sand were
analyzed to determine physical and chemical properties. A summary of the native bitumen properties
is presented in Table 3.
There was an improvement in the liquid product quality relative to the native bitumen due to
the decomposition of the bitumen. The viscosity of the bitumen-derived hydrocarbon, 85 centipoise
(289 K), can be compared to the viscosity of native bitumen, 2665 centipoise (358 K). The API gravity
of the produced liquid, 19.1°API was greater than that of native bitumen, 11.9°API. Also, from the
simulated distillation, the volatility (fraction boiling below 811 K) of the bitumen-derived hydrocarbon
liquid, 87.5 weight percent, relative to the native bitumen, 25.4 weight percent, indicated that the quality
of the produced liquid was significantly upgraded relative to the native bitumen. The boiling point
distribution curves for the native Whiterocks bitumen and the produced bitumen-derived hydrocarbon
liquid are presented in Figure 43. The simulated distillation data for the native bitumen and the
bitumen-derived liquid product are reported in Table 10. It is interesting to note the decrease in the
hydrogen-to-carbon atomic ratio which had not been observed previously with the Sunnyside,
Whiterocks, Asphalt Ridge, or PR Spring Rainbow I tar sands. It is believed that this difference may
be related to the thermal cracking of saturated hydrocarbons boiling above 371 K to lower molecular
weight gases resulting in a lower atomic hydrogen-to-carbon ratio. The analyses are summarized in
Table 11.
DESIGN MODIFICATIONS SUGGESTED BY PRODUCTION PYROLYSIS EXPERIMENTS
1. There are some advantages to building a six-inch diameter reactor. First, this would allow
space for a larger solids control valve opening. Second, a larger diameter would be more amenable
to fluid bed height-to-width ratio studies; that is, the influence of the aspect ratio could be investigated.
2. The current feed hopper is located above the disengager, allowing the sand to drop through
the rising pyrolysis gases. There was some evidence to suggest that feeding the bed from a different
position, thus eliminating the contact between cold sand and hot gas, may aid in product recovery.
3. Suggested solids control valve (SCV) changes based on the operating experience of the
Whiterocks production run are outlined in the following discussion:
Change the shape of the distributor plate from fat to a funnel shape. This would direct all
particles to the opening of the SCV.
Enlarge the opening of the SCV leaving the reactor. Currently, the opening is 7/8 inch, and
the feed size is minus 1/2 inch. The ratio of exit diameter to feed size should be increased to about
four-to-one. This would allow operation of the SCV without the need for tapping.
Change control of the SCV from a DP controller to a computer subroutine. This subroutine
would need to read the differential pressure drop across the bed from a differential pressure transducer
and would control a pneumatic transducer and would control a pneumatic actuator using a solenoid
valve in the air pressure line. This routine would include the following steps: (1) initial DP reading, (2)
139
Figure 43
Boiling Point Distribution Curve for the Native Bitumen and the Bitumen-Derived Hydroarbon Liquid
Whiterocks Tar Sand
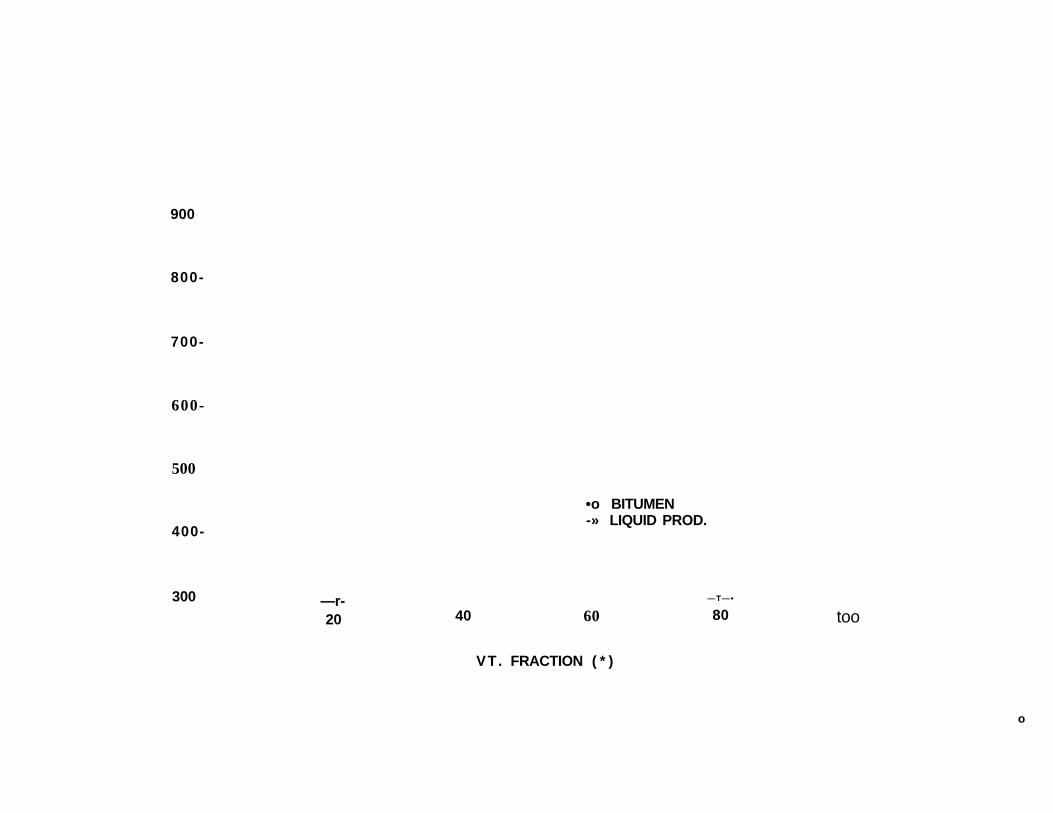
900
800-
700-
600-
500
400-
•o BITUMEN -» LIQUID PROD.
300 —r-20 40 60
—T—•
80 too
VT. FRACTION ( * )
o
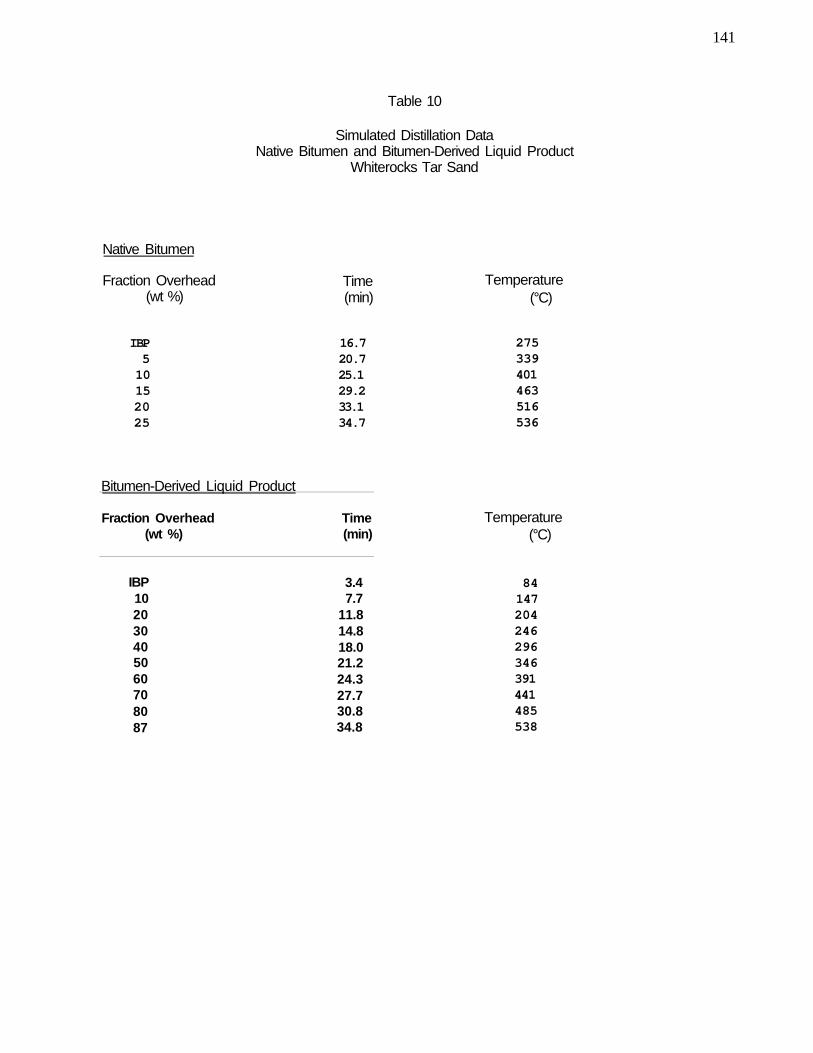
Table 10
141
Simulated Distillation Data Native Bitumen and Bitumen-Derived Liquid Product
Whiterocks Tar Sand
Native Bitumen
Fraction Overhead (wt %)
Time (min)
Temperature (°C)
IBP 5 10 15 20 25
16.7 20.7 25.1 29.2 33.1 34.7
275 339 401 463 516 536
Bitumen-Derived Liquid Product
Fraction Overhead (wt %)
IBP 10 20 30 40 50 60 70 80 87
Time (min)
3.4 7.7
11.8 14.8 18.0 21.2 24.3 27.7 30.8 34.8
Temperature (°C)
84 147 204 246 296 346 391 441 485 538
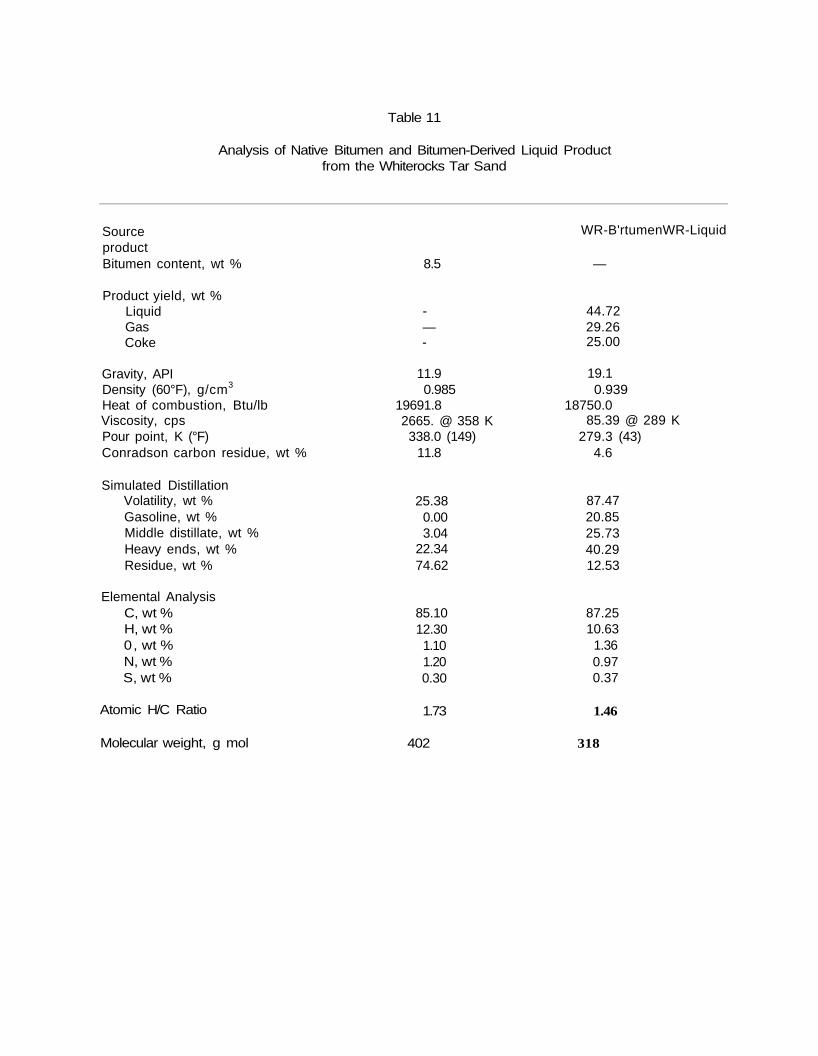
Table 11
Analysis of Native Bitumen and Bitumen-Derived Liquid Product from the Whiterocks Tar Sand
Source product Bitumen content, wt %
Product yield, wt % Liquid Gas Coke
Gravity, API Density (60°F), g/cm3
Heat of combustion, Btu/lb Viscosity, cps Pour point, K (°F) Conradson carbon residue, wt %
Simulated Distillation Volatility, wt % Gasoline, wt % Middle distillate, wt % Heavy ends, wt % Residue, wt %
Elemental Analysis C, wt % H, wt % 0, wt % N, wt % S, wt %
8.5
-— -
11.9 0.985
19691.8 2665. @ 358 K
338.0 (149) 11.8
25.38 0.00 3.04
22.34 74.62
85.10 12.30 1.10 1.20 0.30
WR-B'rtumenWR-Liquid
—
44.72 29.26 25.00
19.1 0.939
18750.0 85.39 @ 289 K
279.3 (43) 4.6
87.47 20.85 25.73 40.29 12.53
87.25 10.63
1.36 0.97 0.37
Atomic H/C Ratio 1.73 1.46
Molecular weight, g mol 402 318
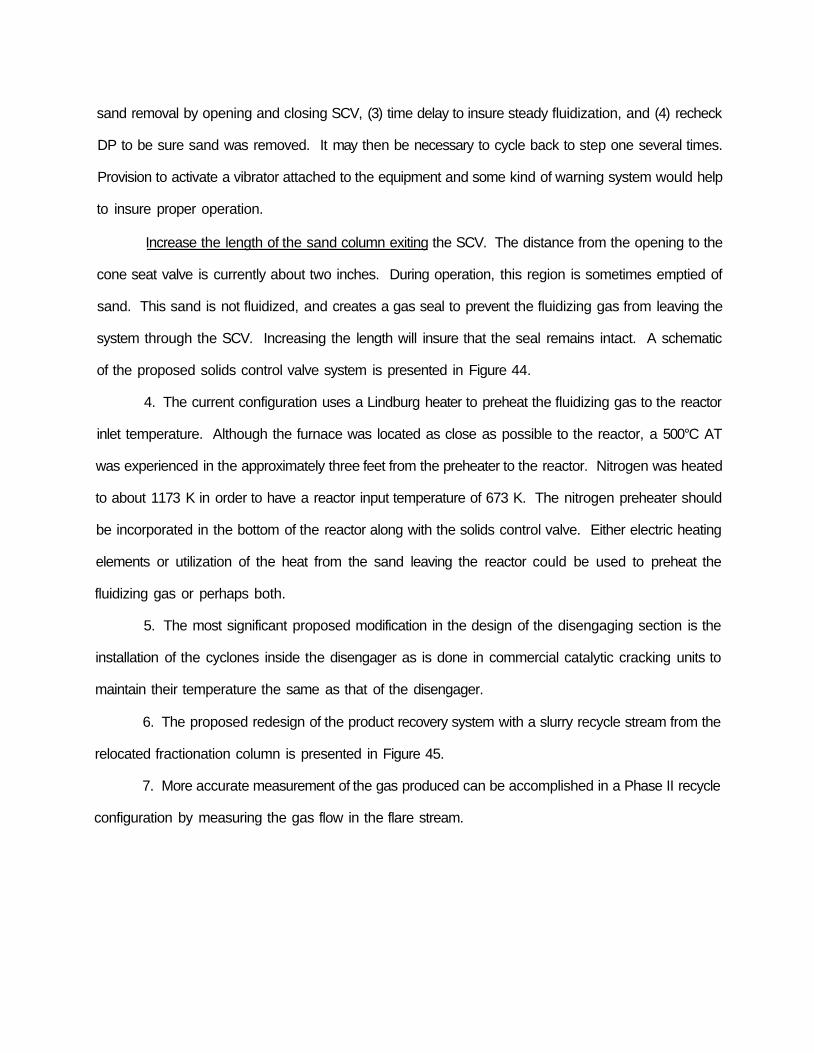
sand removal by opening and closing SCV, (3) time delay to insure steady fluidization, and (4) recheck
DP to be sure sand was removed. It may then be necessary to cycle back to step one several times.
Provision to activate a vibrator attached to the equipment and some kind of warning system would help
to insure proper operation.
Increase the length of the sand column exiting the SCV. The distance from the opening to the
cone seat valve is currently about two inches. During operation, this region is sometimes emptied of
sand. This sand is not fluidized, and creates a gas seal to prevent the fluidizing gas from leaving the
system through the SCV. Increasing the length will insure that the seal remains intact. A schematic
of the proposed solids control valve system is presented in Figure 44.
4. The current configuration uses a Lindburg heater to preheat the fluidizing gas to the reactor
inlet temperature. Although the furnace was located as close as possible to the reactor, a 500°C AT
was experienced in the approximately three feet from the preheater to the reactor. Nitrogen was heated
to about 1173 K in order to have a reactor input temperature of 673 K. The nitrogen preheater should
be incorporated in the bottom of the reactor along with the solids control valve. Either electric heating
elements or utilization of the heat from the sand leaving the reactor could be used to preheat the
fluidizing gas or perhaps both.
5. The most significant proposed modification in the design of the disengaging section is the
installation of the cyclones inside the disengager as is done in commercial catalytic cracking units to
maintain their temperature the same as that of the disengager.
6. The proposed redesign of the product recovery system with a slurry recycle stream from the
relocated fractionation column is presented in Figure 45.
7. More accurate measurement of the gas produced can be accomplished in a Phase II recycle
configuration by measuring the gas flow in the flare stream.

144
Figure 44
Diagram of Proposed Solids Flow Control Valve
145
•aactar
Flange
•fetriftutor Plata
III* Packing
Nitrogen Intet
Cane Value

146
Figure 45
Proposed Sand Fines-Slurry Recycle System

147
Dlsengager
"*" Product Recovery
w \
T
Nitrogen Inlet
Fractionation Column
Cycl<*es
Slurry Recycle
Cone shaped distrtbutor plate
Packing for heat transfer
Spent sand outlet
To pneumatic actuator
CONCLUSIONS
The following general conclusions can be drawn from this investigation.
1. The hydrocarbon liquid yield was greater in the pilot plant than in the small fluidized-bed
unit for a lean tar sand from the Circle Cliffs deposit at a similar set of operating conditions.
2. The hydrocarbon liquid yield based on the overall production run with the Whiterocks tar
sand ore was 55-60 wt % based on the bitumen fed to the reactor.
3. The continuous operation of this pilot plant scale fluidized-bed was successfully conducted
at feed rates up to 69 Ib/hr, which gives a 17.2 min. residence time using a high bitumen saturation
tar sand from the Whiterocks deposit.
4. Liquid recovery rates of 715.9 g/hr for the Whiterocks tar sand and 246.5 g/hr for the Circle
Cliffs tar sand were achieved in the large-diameter reactor.
5. There was a significant improvement in the liquid product quality relative to the native
bitumen for the Whiterocks tar sand as reflected by the viscosity, API gravity, and simulated distillation
volatility.
ACKNOWLEDGEMENTS
The Tar Sand Research Group of the Department of Fuels Engineering wishes to express their
sincere appreciation to Dean Milton E. Wadsworth, College of Mines and Earth Sciences, University
of Utah, for a special equipment grant from the Mineral Leasing Funds of the State of Utah which
permitted fabrication of the large diameter fluidized-bed pilot plant. Special thanks are expressed to
the Mobil Research and Development Corporation for Mobil Foundation Grants to the Laboratory of Coal
Science, Synthetic Fuels and Catalysis of the Department of Fuels Engineering at the University of Utah.
The authors wish to express their appreciation to the American Giisonite Company, a subsidiary of
Chevron Resources, for permitting us to use their high-temperature viscometer to determine the
viscosities of the native bitumen. Special appreciation is extended to Kirkwood Oil and Gas Exploration
and Production of Casper, Wyoming, for supplying the tar sand ore from the Circle Cliffs deposit and
to John E. Fausett of Roosevelt, Utah, for providing the mined tar sand ore from the Whiterocks deposit.
The principal investigators would like to express their sincere appreciation to the students who
were directly responsible for the success achieved in this project: Jerry Wiser, Dowon Shun, Seung-
Hyun Sung, Soon-Man Cha, Kaizad Sunavala, Hong Paul Wang, and Liang C. Lin.
REFERENCES
1. Venkatesan, V.N. Fluidized-bed thermal recovery of synthetic crude from bituminous sands of Utah. PhD dissertation. Univ. Utah, Salt Lake City, Utah (1979)
2. Wang, J. The production of hydrocarbon liquids from a bitumen-impregnated sandstone in a fluidized-bed pyrolysis reactor. M.S. thesis. Univ. Utah, Salt Lake City, Utah (1983
3. Dorius, J.C. The pyrolysis of bitumen impregnated sandstone from the PR Spring (Utah) deposit in a fluidized bed. M.S. thesis. Univ. Utah, Salt Lake City, Utah (1985)
4. Shun, D. The pyrolysis of the bitumen-impregnated sandstone from the Circle Cliffs (Utah) deposit in a fluidized-bed reactor. Ph.D. dissertation, Univ. Utah, Salt Lake City, Utah (1989).
5. Smart, LM. Thermal processing of tar sands. M.S. thesis. Univ. Utah, Salt Lake City, Utah (1984).
6. Ritzma, H.R. Oil Impregnated Sandstone Deposits, Circle Cliffs Uplift (Utah)' Utah Geological Association Henry Mountains Symposium, 343-351 (1980).
7. Wolfgang, H.K., and William, L, New Design Approach Boosts Cyclone Efficiency, Chem. Eng. 84. 80-88 (1977).
8. Kunii, D., and Levenspiel, O., Fluidization Engineering, John Wiley & Sons, Inc., (1969) 73.
9. Ergun, S., Fluid Flow Through Packed Columns, Chem. Eng. Progr., (1952) 48 (2), 89.
10. Pattipati, R.R., and Wen, C.Y., Minimum Fluidization Velocity at High Temperatures, Ind. Eng. Chem. Process Des. Dev., (1981) 20 (4), 705-708.

APPENDIX A
COMPUTER PROGRAM FOR PILOT PLANT CONTROL AND DATA LOGGING
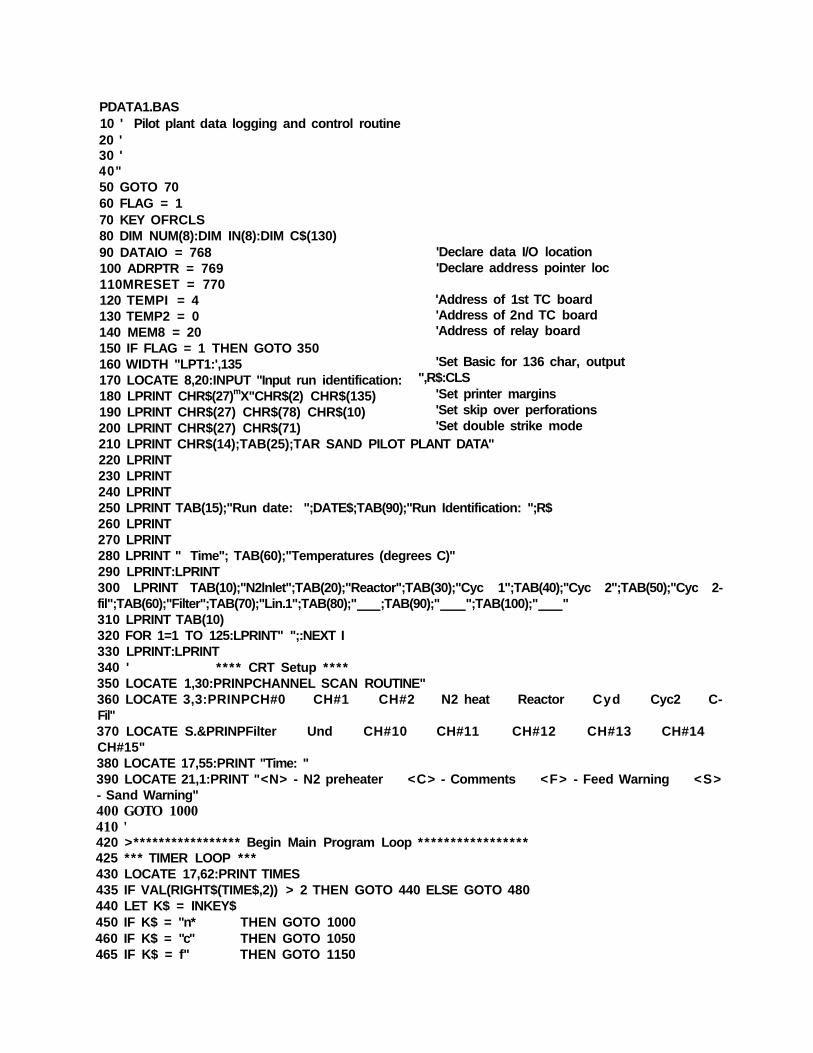
'Declare data I/O location 'Declare address pointer loc
'Address of 1st TC board 'Address of 2nd TC board 'Address of relay board
'Set Basic for 136 char, output ",R$:CLS
'Set printer margins 'Set skip over perforations 'Set double strike mode
PDATA1.BAS 10 ' Pilot plant data logging and control routine 20 ' 30 ' 40" 50 GOTO 70 60 FLAG = 1 70 KEY OFRCLS 80 DIM NUM(8):DIM IN(8):DIM C$(130) 90 DATAIO = 768 100 ADRPTR = 769 110MRESET = 770 120 TEMPI = 4 130 TEMP2 = 0 140 MEM8 = 20 150 IF FLAG = 1 THEN GOTO 350 160 WIDTH "LPT1:',135 170 LOCATE 8,20:INPUT "Input run identification: 180 LPRINT CHR$(27)mX"CHR$(2) CHR$(135) 190 LPRINT CHR$(27) CHR$(78) CHR$(10) 200 LPRINT CHR$(27) CHR$(71) 210 LPRINT CHR$(14);TAB(25);TAR SAND PILOT PLANT DATA" 220 LPRINT 230 LPRINT 240 LPRINT 250 LPRINT TAB(15);"Run date: ";DATE$;TAB(90);"Run Identification: ";R$ 260 LPRINT 270 LPRINT 280 LPRINT " Time"; TAB(60);"Temperatures (degrees C)" 290 LPRINT:LPRINT 300 LPRINT TAB(10);"N2lnlet";TAB(20);"Reactor";TAB(30);"Cyc 1";TAB(40);"Cyc 2";TAB(50);"Cyc 2-fil";TAB(60);"Filter";TAB(70);"Lin.1";TAB(80);" ;TAB(90);" ";TAB(100);" " 310 LPRINT TAB(10) 320 FOR 1=1 TO 125:LPRINT" ";:NEXT I 330 LPRINT:LPRINT 340 ' **** CRT Setup **** 350 LOCATE 1,30:PRINPCHANNEL SCAN ROUTINE" 360 LOCATE 3,3:PRINPCH#0 CH#1 CH#2 N2 heat Reactor Cyd Cyc2 C-Fil" 370 LOCATE S.&PRINPFilter Und CH#10 CH#11 CH#12 CH#13 CH#14 CH#15" 380 LOCATE 17,55:PRINT "Time: " 390 LOCATE 21,1:PRINT "<N> - N2 preheater <C> - Comments <F> - Feed Warning <S> - Sand Warning" 400 GOTO 1000 410 ' 420 >***************** Begin Main Program Loop ***************** 425 *** TIMER LOOP *** 430 LOCATE 17,62:PRINT TIMES 435 IF VAL(RIGHT$(TIME$,2)) > 2 THEN GOTO 440 ELSE GOTO 480 440 LET K$ = INKEY$ 450 IF K$ = "n* THEN GOTO 1000 460 IF K$ = "c" THEN GOTO 1050 465 IF K$ = f" THEN GOTO 1150

152
'Channel loop 0-15 'Point to Tempi gain/ch selection mode 'Set gain for channel 'Point to 12-bit A/D conversion 'Start A/D conversion 'Select the MSBs address 'Read the 8 MSBs 'Select the LSBs address 'Read the 4 LSBs 'Combine MSB & LSB 'Convert to degrees C
5 THEN DEGREE = DEGREE+1 'Round off degree Truncate to integer "Print to screen
'Print Hardcopy 'Control for relay 0 'Control for relay 2 'Control for relay 3
468 IF K$ = 's" THEN GOTO 1400 470 GOTO 430 480 LET R=4:C=33 489 '*** END TIMER LOOP *** 490 LPRINT LEFT$fnME$,5); 500 FOR CH = 3 TO 9 510 OUT ADRPTR, TEMPI+2 520 OUT DATAIO, CH 530 OUT ADRPTR, TEMPI 540 OUT DATAIO, 4 550 OUT ADRPTR, TEMPI 560 MSB = INP(DATAIO) 570 OUT ADRPTR, TEMPI+1 580 LSB = INP(DATAIO) 590 AD = MSB*16+LSB/16 600 DEGREE = .47485*AD - 969.77 610 IF DEGREE-FIX(DEGREE) > 620 DEGREE = INT(DEGREE) 630 LOCATE R,C:PRINT USING ' # # # C';DEGREE 640 C=C+10 650 IF CH=7 THEN R=9:C=3 660 X=(CH-2)*10 670 LPRINT TAB(X);DEGREE; 680 IF CH=9 THEN GOSUB 880 700 IF CH=9 THEN GOSUB 940 710 IF CH=9 THEN GOSUB 970 720 RELYOUT = 0 730 FOR I = 1 TO 8 740 IF NUM(I) = 1 THEN RLYOUT=RLYOUT + 2^(1-1) 750 NEXT I 760 OUT ADRPTR.MEM8 770 RLYSTAT=INP(DATAIO) 780 RLY=RLYSTAT 790 FOR I = 7 TO 0 STEP -1 'Relay status decimal to binary 800 IF RLY > 2~l THEN IN(I+1) = 1:RLY=RLY-2~I:ELSE IN(I+1)=0 810 IF RLY = 0 THEN IN(1) = 1:ELSE IN(1)=0 820 NEXT I 830 OUT ADRPTR, MEM8:OUT DATAIO, RLYOUT 840 LOCATE 14,30:PRINT 'Relay Out: •;RLYOUT 850 NEXT CH 860 LPRINT 865 '*** Buzzer sound routine *** 866 LET T=VAL(MID$(TIME$,4,2)) 867 IF T = STIME THEN GOSUB 2000 868 IF T = FTIME THEN GOSUB 2100 870 GOTO 430 ****************** End Main Program Loop *** * * * * * * * * * * * * * * 880 ' **** Relay 0 Subroutine **** 890 IF SETPT > DEGREE THEN NUM(1)=1 ELSE NUM(1)=0 900 RETURN 910 ' **** Relay 1 Subroutine **** 920 IF SETPT > DEGREE THEN NUM(2)=1 ELSE NUM(2)=0 930 RETURN 940 ' **** Relay 2 Subroutine **** 950 IF SETPT > DEGREE THEN NUM(3)=1 ELSE NUM(3)=0
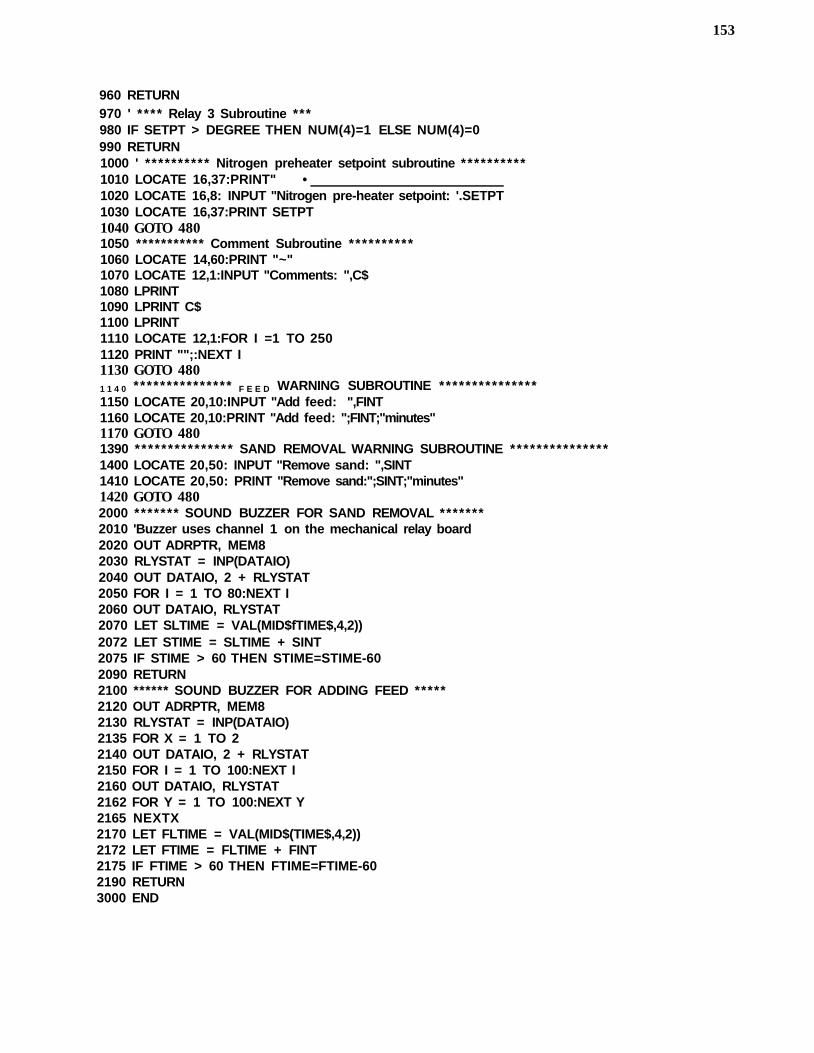
153
960 RETURN 970 ' **** Relay 3 Subroutine *** 980 IF SETPT > DEGREE THEN NUM(4)=1 ELSE NUM(4)=0 990 RETURN 1000 ' ********** Nitrogen preheater setpoint subroutine ********** 1010 LOCATE 16,37:PRINT" • 1020 LOCATE 16,8: INPUT "Nitrogen pre-heater setpoint: '.SETPT 1030 LOCATE 16,37:PRINT SETPT 1040 GOTO 480 1050 *********** Comment Subroutine ********** 1060 LOCATE 14,60:PRINT "~" 1070 LOCATE 12,1:INPUT "Comments: ",C$ 1080 LPRINT 1090 LPRINT C$ 1100 LPRINT 1110 LOCATE 12,1:FOR I =1 TO 250 1120 PRINT "";:NEXT I 1130 GOTO 480 1 1 4 0 * * * ************ F E E D WARNING SUBROUTINE *************** 1150 LOCATE 20,10:INPUT "Add feed: ",FINT 1160 LOCATE 20,10:PRINT "Add feed: ";FINT;"minutes" 1170 GOTO 480 1390 *************** SAND REMOVAL WARNING SUBROUTINE *************** 1400 LOCATE 20,50: INPUT "Remove sand: ",SINT 1410 LOCATE 20,50: PRINT "Remove sand:";SINT;"minutes" 1420 GOTO 480 2000 ******* SOUND BUZZER FOR SAND REMOVAL ******* 2010 'Buzzer uses channel 1 on the mechanical relay board 2020 OUT ADRPTR, MEM8 2030 RLYSTAT = INP(DATAIO) 2040 OUT DATAIO, 2 + RLYSTAT 2050 FOR I = 1 TO 80:NEXT I 2060 OUT DATAIO, RLYSTAT 2070 LET SLTIME = VAL(MID$fTIME$,4,2)) 2072 LET STIME = SLTIME + SINT 2075 IF STIME > 60 THEN STIME=STIME-60 2090 RETURN 2100 ****** SOUND BUZZER FOR ADDING FEED ***** 2120 OUT ADRPTR, MEM8 2130 RLYSTAT = INP(DATAIO) 2135 FOR X = 1 TO 2 2140 OUT DATAIO, 2 + RLYSTAT 2150 FOR I = 1 TO 100:NEXT I 2160 OUT DATAIO, RLYSTAT 2162 FOR Y = 1 TO 100:NEXT Y 2165 NEXTX 2170 LET FLTIME = VAL(MID$(TIME$,4,2)) 2172 LET FTIME = FLTIME + FINT 2175 IF FTIME > 60 THEN FTIME=FTIME-60 2190 RETURN 3000 END

APPENDIX B
COMMENTS FROM PREUMINARY PILOT PLANT EXPERIMENTS
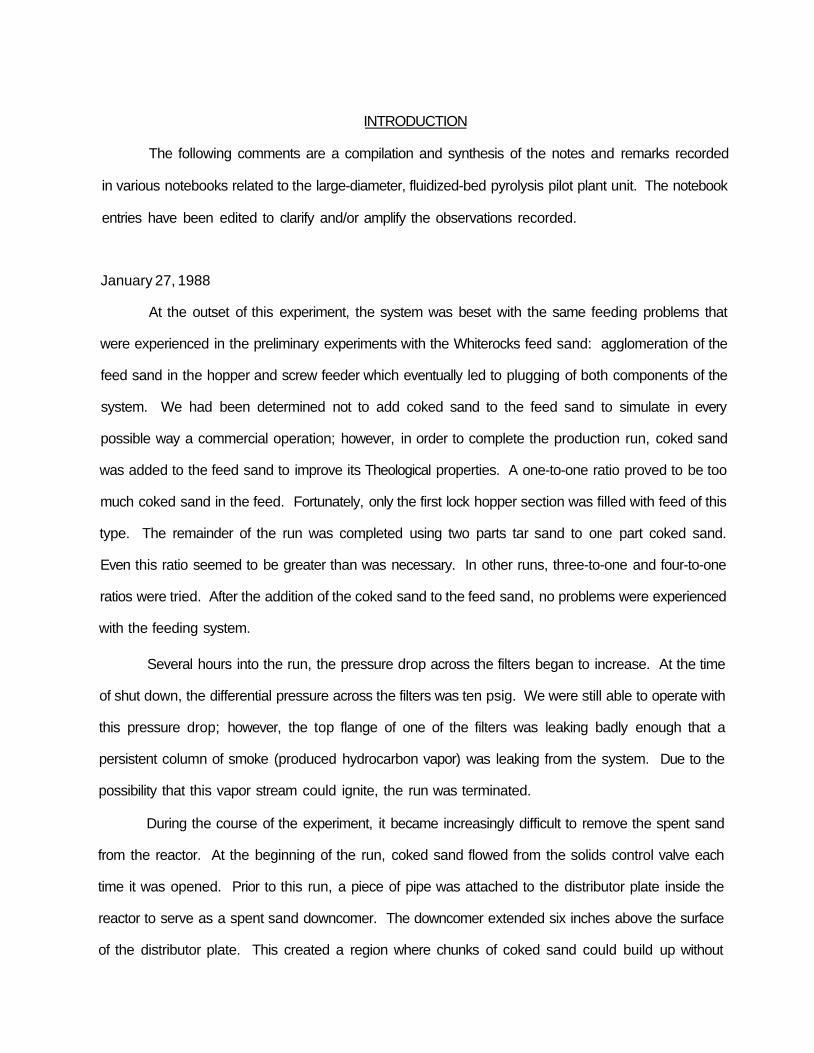
INTRODUCTION
The following comments are a compilation and synthesis of the notes and remarks recorded
in various notebooks related to the large-diameter, fluidized-bed pyrolysis pilot plant unit. The notebook
entries have been edited to clarify and/or amplify the observations recorded.
January 27, 1988
At the outset of this experiment, the system was beset with the same feeding problems that
were experienced in the preliminary experiments with the Whiterocks feed sand: agglomeration of the
feed sand in the hopper and screw feeder which eventually led to plugging of both components of the
system. We had been determined not to add coked sand to the feed sand to simulate in every
possible way a commercial operation; however, in order to complete the production run, coked sand
was added to the feed sand to improve its Theological properties. A one-to-one ratio proved to be too
much coked sand in the feed. Fortunately, only the first lock hopper section was filled with feed of this
type. The remainder of the run was completed using two parts tar sand to one part coked sand.
Even this ratio seemed to be greater than was necessary. In other runs, three-to-one and four-to-one
ratios were tried. After the addition of the coked sand to the feed sand, no problems were experienced
with the feeding system.
Several hours into the run, the pressure drop across the filters began to increase. At the time
of shut down, the differential pressure across the filters was ten psig. We were still able to operate with
this pressure drop; however, the top flange of one of the filters was leaking badly enough that a
persistent column of smoke (produced hydrocarbon vapor) was leaking from the system. Due to the
possibility that this vapor stream could ignite, the run was terminated.
During the course of the experiment, it became increasingly difficult to remove the spent sand
from the reactor. At the beginning of the run, coked sand flowed from the solids control valve each
time it was opened. Prior to this run, a piece of pipe was attached to the distributor plate inside the
reactor to serve as a spent sand downcomer. The downcomer extended six inches above the surface
of the distributor plate. This created a region where chunks of coked sand could build up without
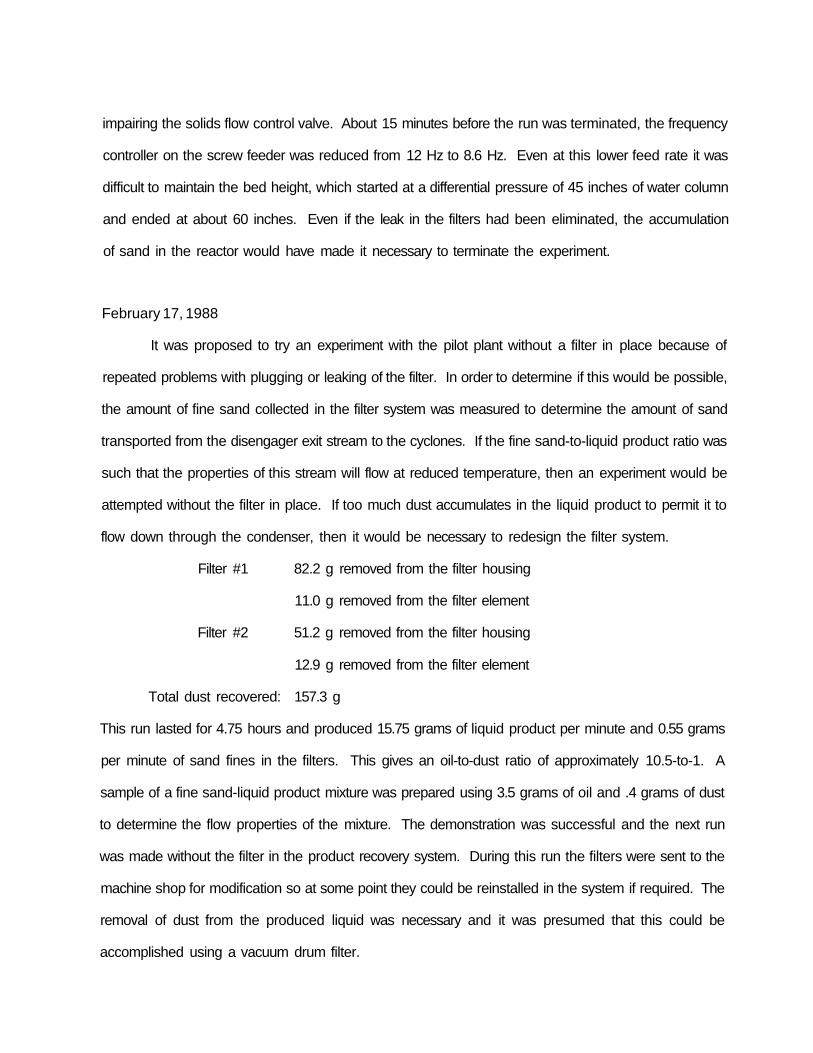
impairing the solids flow control valve. About 15 minutes before the run was terminated, the frequency
controller on the screw feeder was reduced from 12 Hz to 8.6 Hz. Even at this lower feed rate it was
difficult to maintain the bed height, which started at a differential pressure of 45 inches of water column
and ended at about 60 inches. Even if the leak in the filters had been eliminated, the accumulation
of sand in the reactor would have made it necessary to terminate the experiment.
February 17, 1988
It was proposed to try an experiment with the pilot plant without a filter in place because of
repeated problems with plugging or leaking of the filter. In order to determine if this would be possible,
the amount of fine sand collected in the filter system was measured to determine the amount of sand
transported from the disengager exit stream to the cyclones. If the fine sand-to-liquid product ratio was
such that the properties of this stream will flow at reduced temperature, then an experiment would be
attempted without the filter in place. If too much dust accumulates in the liquid product to permit it to
flow down through the condenser, then it would be necessary to redesign the filter system.
Filter #1 82.2 g removed from the filter housing
11.0 g removed from the filter element
Filter #2 51.2 g removed from the filter housing
12.9 g removed from the filter element
Total dust recovered: 157.3 g
This run lasted for 4.75 hours and produced 15.75 grams of liquid product per minute and 0.55 grams
per minute of sand fines in the filters. This gives an oil-to-dust ratio of approximately 10.5-to-1. A
sample of a fine sand-liquid product mixture was prepared using 3.5 grams of oil and .4 grams of dust
to determine the flow properties of the mixture. The demonstration was successful and the next run
was made without the filter in the product recovery system. During this run the filters were sent to the
machine shop for modification so at some point they could be reinstalled in the system if required. The
removal of dust from the produced liquid was necessary and it was presumed that this could be
accomplished using a vacuum drum filter.
The filter elements were back flushed using a high flow of nitrogen while still in the filter housing
prior to removal of the collected sand fines. The data reported above for the fines removed from the
filter elements resulted from this backflush operation. This process seemed to remove most of the dust
from the element, although the pressure drop across the filters in the forward direction was not
determined after the backflush had been completed.
February 19, 1988 Experiment II
The objective of this run was to determine if it was possible to operate the system without the
filters in the system. The system appeared to function satisfactorily without the filters during the course
of the two-hour experiment.
The feed material used in this experiment was the Whiterocks tar sand ore which had been
screened to minus 1/2 inch and consisted of three parts (by volume) fresh tar sand mixed with one part
spent sand produced in previous runs. This was the first run attempted with this blending ratio and
it did not feed to the unit properly. Less than one kilogram of sand fed to the reactor before the auger
in the screw feeder plugged. The screw feeder was disassembled and cleaned out. The hopper was
reloaded with a feed blend of two parts fresh tar sand to one part coked sand (by volume). This feed
was used throughout the remainder of the run without any feeding problem. The reactor was fluidized
at the rate of 40 g/min and tar sand was fed at a controller setpoint of 12 Hz which corresponds to a
feed rate of about 360 g/min of tar sand. The differential pressure across the reactor was held at 45
inches of water column. This gave a residence time of about 25 minutes. A problem developed with
the reactor heater: two of the heating elements burned out, thus decreasing the potential heat input
by 25 percent. The temperature setpoint for this run was 793 K, which was approximately the average
temperature during the material balance portion of the run. After the two hour material balance was
complete, the feed rate was increased to 16 Hz, which corresponded to a calculated feed rate of 480
g/min and a residence time of 19 minutes. At this feed rate, the reactor temperature dropped and
fluctuated between 750 to 768 K. The run was terminated because of the inability of the reactor
furnace to maintain the desired pyrolysis temperature.
This run was the first time we found the combination of feed characteristics and solids flow
control valve operating procedures which would permit continuous operation. In all previous runs it had
become increasingly difficult to remove coked sand from the reactor because of the chunks of coked
sand which build up and ultimately plug the solids control valve. The success achieved in this run was
a result of the reduction in size distribution of the feed material and the change in the solids flow
control valve operating procedure. Although the feed had been referred to as minus 1/2 inch, the
screen being used was actually giving about minus 3/4 inch, with some particles larger than one inch
in the longest dimension. The feed sand was passed through a Tyler 1/2 inch sieve which effected a
reduction in the feed sand particle size distribution. The solids control valve operating procedure was
changed. Previously the valve was opened less than half the full stroke about every 20 seconds to
prevent collapse of the bed. During this run, the solids control valve was opened full stroke to remove
a large amount of sand from the reactor. By using feed material smaller than the opening in the solids
control valve and flushing sand out rapidly each time the valve is opened, there was no build-up of
large chunks in the reactor. Even with this procedure it was necessary to tap on the solids flow control
valve housing with a hammer to get the coked sand to flow. The problem experienced previously with
collapsing the bed when the solids control valve was opened did not occur. The solids control valve
remained sufficiently full of sand to create an effective pressure seal.
The liquid product from this run appeared to be more viscous than that produced in previous
experiments as it flowed from the liquid product receiver. After the liquid sat for several days, the sand
fines settled to the bottom of the vessel in which the produced liquid had been stored. The clarified
bitumen-derived liquid looked the same as that produced in runs in which the filter was in place.
February 23, 1988 Experiment 12
The minimum fluidization mass flow rate was determined prior to the pyrolysis experiment. The
minimum fluidization mass flow rate was determined by the following procedure. Approximately nine
kilograms of spent Whiterocks sand in the reactor and beginning at zero mass flow rate, the nitrogen
flow control valve was opened until the mass flow meter registered its lowest flow rate. The pressure
drop was determined from the differential pressure controller. The flow control valve was opened in
small increments, each time noting an increase in the pressure drop across the bed. The point at
which no increase in the pressure drop was observed was recorded as the minimum fluidization flow
rate. The flow control valve was opened several more increments without an increase in the pressure
drop. The measured valve for the minimum fluidization flow rate with the Whiterocks spent sand was
12 g/min at 298 K
The feed system did not function properly during this experiment. The auger on the screw
feeder plugged due to inadequate mixing of the spent sand and the fresh tar sand. After the plug
occurred, an inspection of the feed material found softball size pieces of feed which had no coked sand
inside. The feed was properly mixed, the auger disassembled and clean, and the system restarted.
Another problem occurred with the feed system, but turned out to be a secondary problem caused by
a plug in the cyclone. As the pressure increased, the leak rate out through the hopper also increased
to the point where a significant amount of liquid product was condensing in the screw feeder. When
the pressure in the system reached about ten psig, the screw feeder plugged because of the product
oil lubricating the wall of the screw feeder, thus allowing the tar sand to rotate rather than move through
the unit.
This experiment was discontinued due to the plugging of the cyclones. Apparently, the
temperature in the tubing connecting the disengager and cyclone train was too low. The passage filled
with dust wetted with heavy oil similar in appearance to bitumen at room temperature. The dust trap
of cyclone #1 filled to the top with oil-saturated dust, and the dust trap of cyclone #2 was almost
empty. When the trap of #2 was emptied, liquid saturated with fine sand flowed from the valve.
Because the second cyclone had collected such a small amount of material, it was decided to use a
single cyclone in the system. The entire cyclone train, including transfer lines, was heated to ensure
there would be no cold spots where hydrocarbon vapors could condense.
160
March 2, 1988 Experiment 13
This experiment was conducted with a single cyclone in the recovery train. The smallest of the
cyclones was used because the design calculations indicated that it should be the most efficient at the
flow rates being used. The cyclone was heated using ceramic heater elements and the power input
was tripled. The heat-up time for the cyclone was about one hour. About one hour into the run, the
pressure increased to about five or six psig and then returned to normal (one or two psig). The
pressure did this several more times over the next two hours until finally the pressure increased to
around ten psig and remained constant. The run was terminated and the condenser, which appeared
to be plugged, was removed from the system. The same type of liquid-saturated sand fines material
that plugged the cyclone was present in the line which connected the cyclone to the condenser.
March 3, 1988 Experiment 14
The plug in Run 13 was probably a result of a long low-temperature zone which caused the
heavier vapors to condense. The sand fines adhered to the condensed liquid and rapidly accumulated
to form a plug. The plug was located in a 3/4 inch heavy wall tube that was about two feet long. It
was thought that by shortening this tube, the low-temperature region would be sufficiently diminished
in size that plugging would not occur. The tube was shortened and another run initiated. Plugging
occurred about 40 minutes into the run; however, it was unclear as to the cause. The condenser
plugged about four to six inches from the upstream side. As usual, the plug material was sand fines
bound together by condensed oil. The reactor temperature history indicated that the feeding stopped
about 30 minutes into the run. Past experience has shown that fluidizing even for a short time without
producing liquid will fill the condenser with dust. It was also shown that when the system plugs,
produced vapors are forced up into the screw feeder and liquid condenses on the wall of the screw
feeder housing, causing the auger to plug with feed material. Which happened first we don't know.
The system was cleaned and the present configuration was evaluated in a second experiment.
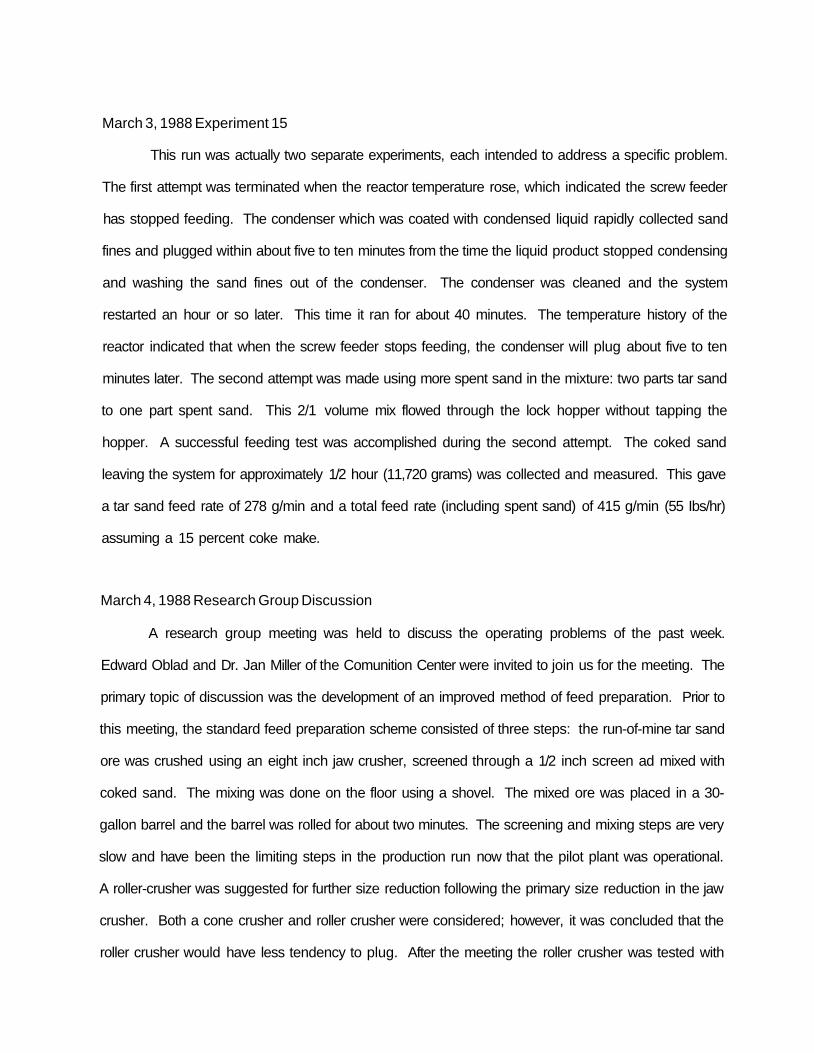
March 3, 1988 Experiment 15
This run was actually two separate experiments, each intended to address a specific problem.
The first attempt was terminated when the reactor temperature rose, which indicated the screw feeder
has stopped feeding. The condenser which was coated with condensed liquid rapidly collected sand
fines and plugged within about five to ten minutes from the time the liquid product stopped condensing
and washing the sand fines out of the condenser. The condenser was cleaned and the system
restarted an hour or so later. This time it ran for about 40 minutes. The temperature history of the
reactor indicated that when the screw feeder stops feeding, the condenser will plug about five to ten
minutes later. The second attempt was made using more spent sand in the mixture: two parts tar sand
to one part spent sand. This 2/1 volume mix flowed through the lock hopper without tapping the
hopper. A successful feeding test was accomplished during the second attempt. The coked sand
leaving the system for approximately 1/2 hour (11,720 grams) was collected and measured. This gave
a tar sand feed rate of 278 g/min and a total feed rate (including spent sand) of 415 g/min (55 Ibs/hr)
assuming a 15 percent coke make.
March 4, 1988 Research Group Discussion
A research group meeting was held to discuss the operating problems of the past week.
Edward Oblad and Dr. Jan Miller of the Comunition Center were invited to join us for the meeting. The
primary topic of discussion was the development of an improved method of feed preparation. Prior to
this meeting, the standard feed preparation scheme consisted of three steps: the run-of-mine tar sand
ore was crushed using an eight inch jaw crusher, screened through a 1/2 inch screen ad mixed with
coked sand. The mixing was done on the floor using a shovel. The mixed ore was placed in a 30-
gallon barrel and the barrel was rolled for about two minutes. The screening and mixing steps are very
slow and have been the limiting steps in the production run now that the pilot plant was operational.
A roller-crusher was suggested for further size reduction following the primary size reduction in the jaw
crusher. Both a cone crusher and roller crusher were considered; however, it was concluded that the
roller crusher would have less tendency to plug. After the meeting the roller crusher was tested with
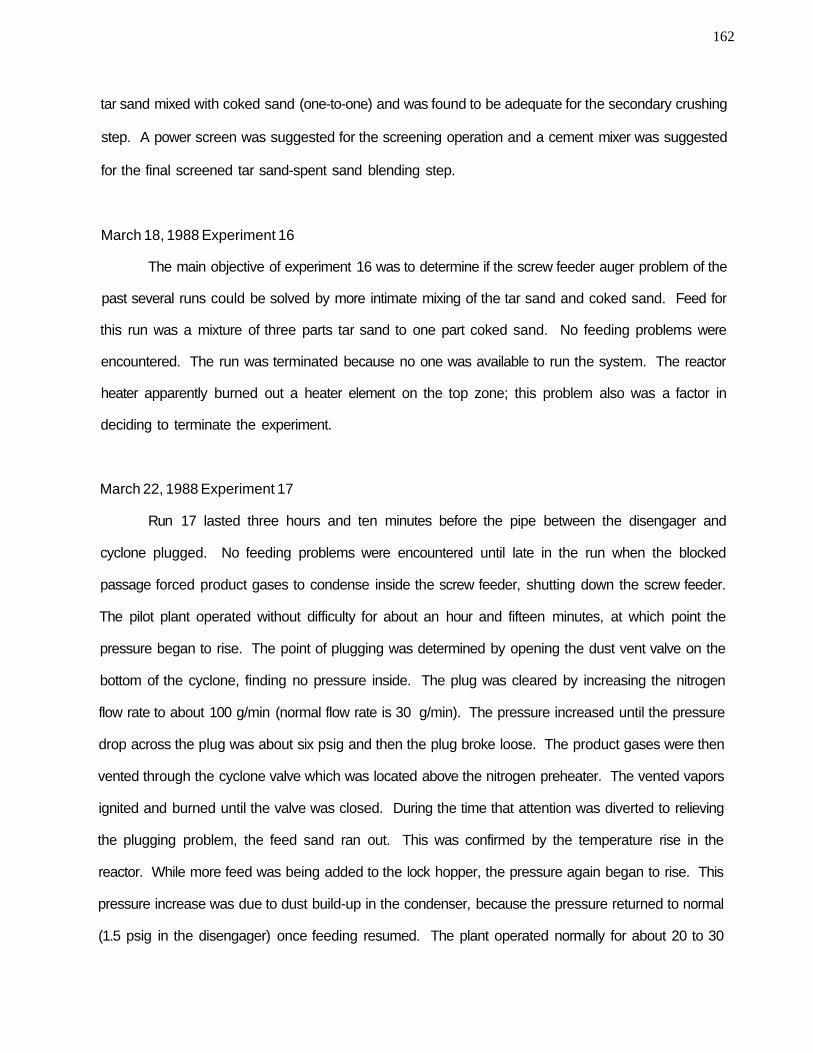
162
tar sand mixed with coked sand (one-to-one) and was found to be adequate for the secondary crushing
step. A power screen was suggested for the screening operation and a cement mixer was suggested
for the final screened tar sand-spent sand blending step.
March 18, 1988 Experiment 16
The main objective of experiment 16 was to determine if the screw feeder auger problem of the
past several runs could be solved by more intimate mixing of the tar sand and coked sand. Feed for
this run was a mixture of three parts tar sand to one part coked sand. No feeding problems were
encountered. The run was terminated because no one was available to run the system. The reactor
heater apparently burned out a heater element on the top zone; this problem also was a factor in
deciding to terminate the experiment.
March 22, 1988 Experiment 17
Run 17 lasted three hours and ten minutes before the pipe between the disengager and
cyclone plugged. No feeding problems were encountered until late in the run when the blocked
passage forced product gases to condense inside the screw feeder, shutting down the screw feeder.
The pilot plant operated without difficulty for about an hour and fifteen minutes, at which point the
pressure began to rise. The point of plugging was determined by opening the dust vent valve on the
bottom of the cyclone, finding no pressure inside. The plug was cleared by increasing the nitrogen
flow rate to about 100 g/min (normal flow rate is 30 g/min). The pressure increased until the pressure
drop across the plug was about six psig and then the plug broke loose. The product gases were then
vented through the cyclone valve which was located above the nitrogen preheater. The vented vapors
ignited and burned until the valve was closed. During the time that attention was diverted to relieving
the plugging problem, the feed sand ran out. This was confirmed by the temperature rise in the
reactor. While more feed was being added to the lock hopper, the pressure again began to rise. This
pressure increase was due to dust build-up in the condenser, because the pressure returned to normal
(1.5 psig in the disengager) once feeding resumed. The plant operated normally for about 20 to 30

minutes, and then the pressure began rising again. This time the feed rate was increased in an effort
to clear the plug without opening the cyclone valve. The attempt was unsuccessful. A two-inch
diameter aluminum flexible pipe was installed on the cyclone valve and the vale opened. A gain the
nitrogen flow was increased. This time the plug was again blown out; however, the vented vapors did
not ignite. The pressure drop required to remove the plug this time was about ten psig. SEveral
times during the next 20 minutes the pressure fluctuated up and down as the passage between the
cyclone and disengager would plug and then would be blown free. The procedure of increasing the
nitrogen flow rate and venting the plug through the cyclone valve was used once more to keep the
system on-stream. finally, after about three hours and 15 minutes, the plug was bad enough to force
product gases into the screw feeder where they condensed and eventually shut down the feed system.
About 1200 grams of material were collected during the repeated cyclone blow-down
procedures used to clear the plug. This was not the total amount of contribution to the plugs. The
first time this procedure was used, the solids were blown all over the floor; since the dust collector
wasn't cleaned at the end of the run, there may have been material left in the sand fines collection
vessel. The sand fines were oil soaked in each case. Some of the material appeared to be sand
grains rather than fines that were expected to be entrained in a gas stream. The sand grains may have
been transported into the disengager outlet during the procedure to clear the plug. The presence of
oil in the sand fines making up the plug was unexpected since the vapor temperature leaving the
cyclone never was below about 683 K and toward the end of the run was measured as high as 774
K. When the experiment was terminated, the temperature was measured at the outside surface of the
disengager was 603 K.
April 13, 1988
The past several weeks were spent redesigning the cyclones and having them built. The feed
preparation scheme was also revamped. Crushing experiments were conducted in an effort to develop
the most efficient feed preparation process. These experiments included the evaluation of a roll crusher
and a power screen. The results of these experiments are outlined as follows:
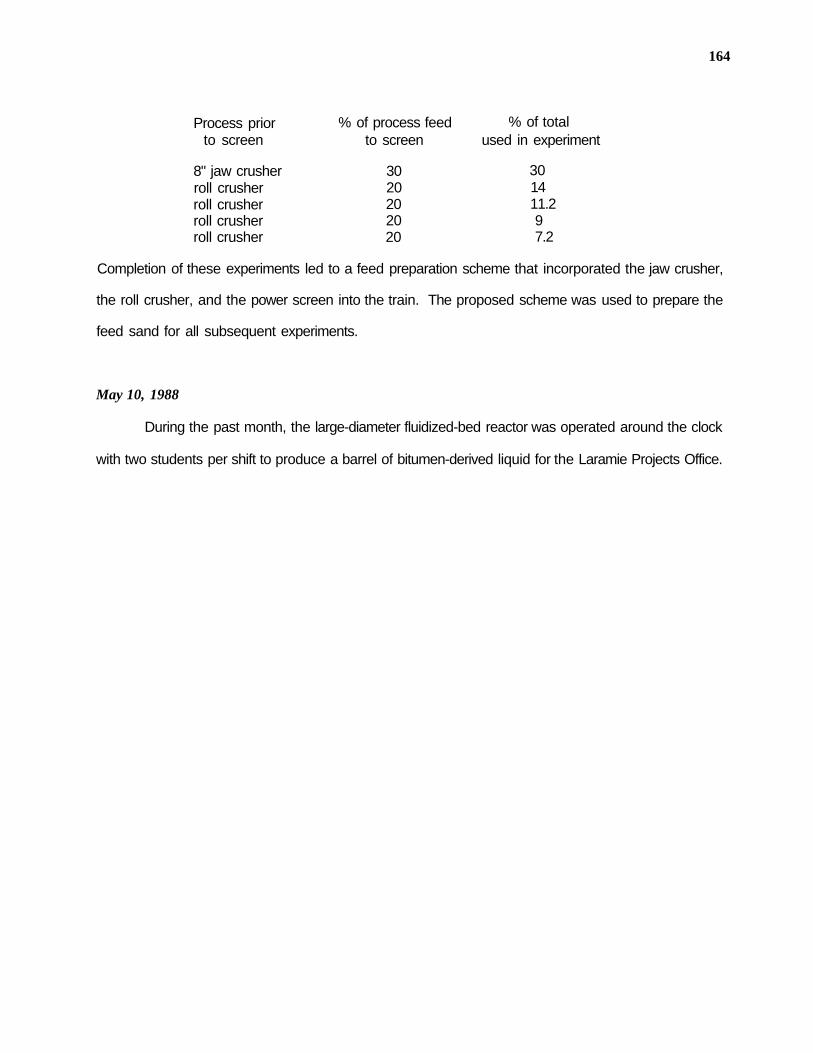
164
Process prior to screen
8" jaw crusher roll crusher roll crusher roll crusher roll crusher
% of process feed to screen
30 20 20 20 20
% of total used in experiment
30 14 11.2 9 7.2
Completion of these experiments led to a feed preparation scheme that incorporated the jaw crusher,
the roll crusher, and the power screen into the train. The proposed scheme was used to prepare the
feed sand for all subsequent experiments.
May 10, 1988
During the past month, the large-diameter fluidized-bed reactor was operated around the clock
with two students per shift to produce a barrel of bitumen-derived liquid for the Laramie Projects Office.