final tom steed lake chlorophyll-a total maximum daily
TRANSCRIPT

Rocky Lake
Tom Steed Lake
Rocky Lake
Tom Steed Lake
FINAL
CHLOROPHYLL-a TOTAL MAXIMUM DAILY LOADS FOR ROCKY LAKE (OK311500030060_00) AND TOM STEED LAKE (OK311500020060_00)
Prepared for:
OKLAHOMA DEPARTMENT OF ENVIRONMENTAL QUALITY
Prepared by:
SEPTEMBER 2011

CHLOROPHYLL-a TOTAL MAXIMUM DAILY LOADS
FOR ROCKY LAKE (OK311500030060_00) AND TOM STEED LAKE (OK311500020060_00)
Prepared for:
OKLAHOMA DEPARTMENT OF ENVIRONMENTAL QUALITY
Prepared by:
8000 Centre Park Drive, Suite 200 Austin, TX 78754
SEPTEMBER 2011
Chlorophyll-a TMDLs for Rocky and Tom Steed Lakes Table of Contents
i FINAL
September 2011
TABLE OF CONTENTS
EXECUTIVE SUMMARY ................................................................................................ ES-1
E.1 Problem Identification and Water Quality Target ......................................................... 2
E.2 Pollutant Source Assessment ......................................................................................... 3
E.3 Technical Approach and Methods ................................................................................. 6
E.4 TMDLs and Load Allocations ....................................................................................... 7
E.5 Public Participation ....................................................................................................... 9
SECTION 1 INTRODUCTION ............................................................................................. 1-1
1.1 TMDL Program Background ..................................................................................... 1-1
1.2 Watershed and Lake Description ................................................................................ 1-2
1.3 Flow Characteristics ................................................................................................. 1-10
SECTION 2 PROBLEM IDENTIFICATION AND WATER QUALITY TARGET ...... 2-1
2.1 Oklahoma Water Quality Standards ........................................................................... 2-1
2.2 Problem Identification ................................................................................................ 2-3
2.2.1 Chlorophyll-a Data Summary ........................................................................ 2-3
2.2.2 Nutrient Data Summary .................................................................................. 2-5
2.3 Water Quality Target .................................................................................................. 2-5
SECTION 3 POLLUTANT SOURCE ASSESSMENT ....................................................... 3-1
3.1 Assessment of Point Sources ...................................................................................... 3-1
3.2 Assessment of Nonpoint Sources ............................................................................... 3-2
3.2.1 SWAT Model Development for Nonpoint Sources Loadings ....................... 3-2
3.2.2 Estimated Nutrient Loading from Nonpoint Sources ..................................... 3-7
SECTION 4 TECHNICAL APPROACH AND METHODS .............................................. 4-1
4.1 BATHTUB Model Description .................................................................................. 4-1
4.2 BATHTUB Model Setup and Input Data ................................................................... 4-1
4.3 BATHTUB Model Calibrations and Output .............................................................. 4-3
4.4 Modeled Load Reduction Scenarios ........................................................................... 4-3
SECTION 5 TMDLS AND LOAD ALLOCATIONS .......................................................... 5-1
5.1 Wasteload Allocation ................................................................................................. 5-1
5.2 Load Allocation .......................................................................................................... 5-1
5.3 Seasonal Variability .................................................................................................... 5-1
5.4 Margin of Safety ......................................................................................................... 5-1
5.5 TMDL Calculations .................................................................................................... 5-2
SECTION 6 PUBLIC PARTICIPATION ............................................................................ 6-1
SECTION 7 REFERENCES .................................................................................................. 7-1
Chlorophyll-a TMDLs for Rocky and Tom Steed Lakes Table of Contents
ii FINAL
September 2011
APPENDICES
Appendix A State of Oklahoma Antidegradation Policy
Appendix B Ambient Water Quality Data
Appendix C Response to Comments
LIST OF FIGURES
Figure 1-1 Rocky Lake ........................................................................................................... 1-4
Figure 1-2 Tom Steed Lake .................................................................................................... 1-5
Figure 1-3 Rocky Lake Watershed Land Use ........................................................................ 1-8
Figure 1-4 Tom Steed Lake Watershed Land Use ................................................................. 1-9
Figure 3-1 NPDES No-Discharge Facilities in Rocky Lake Watershed ................................ 3-3
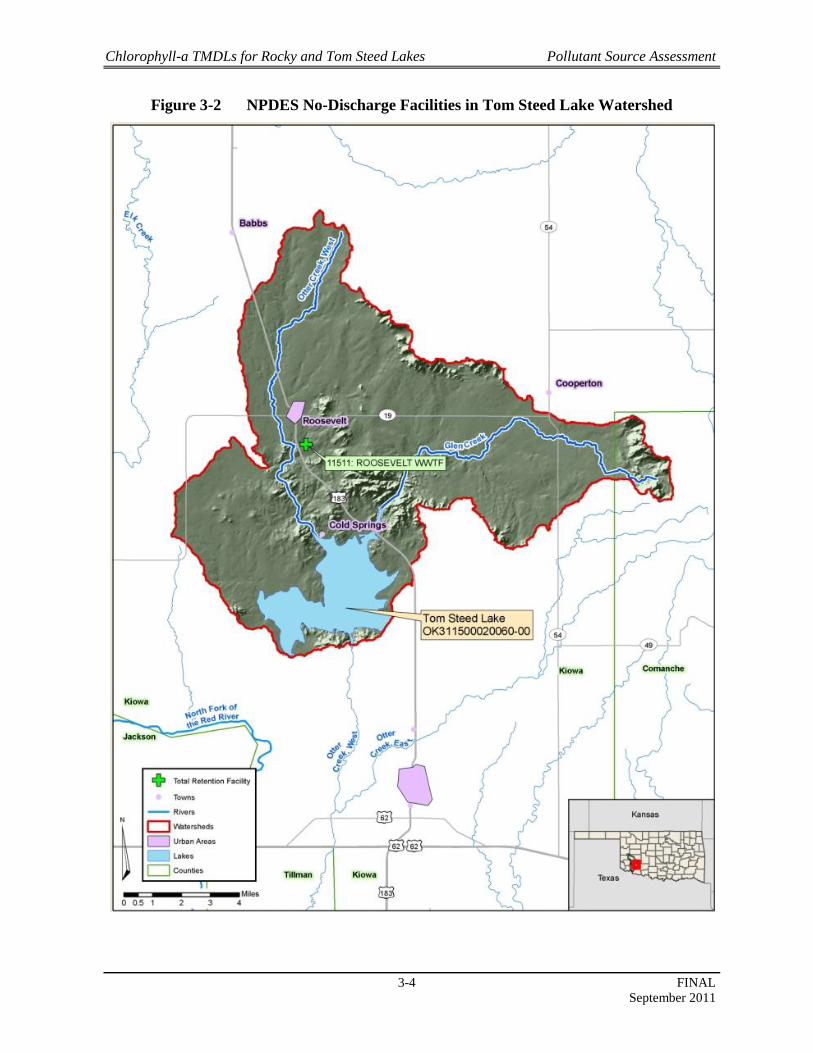
Figure 3-2 NPDES No-Discharge Facilities in Tom Steed Lake Watershed ......................... 3-4
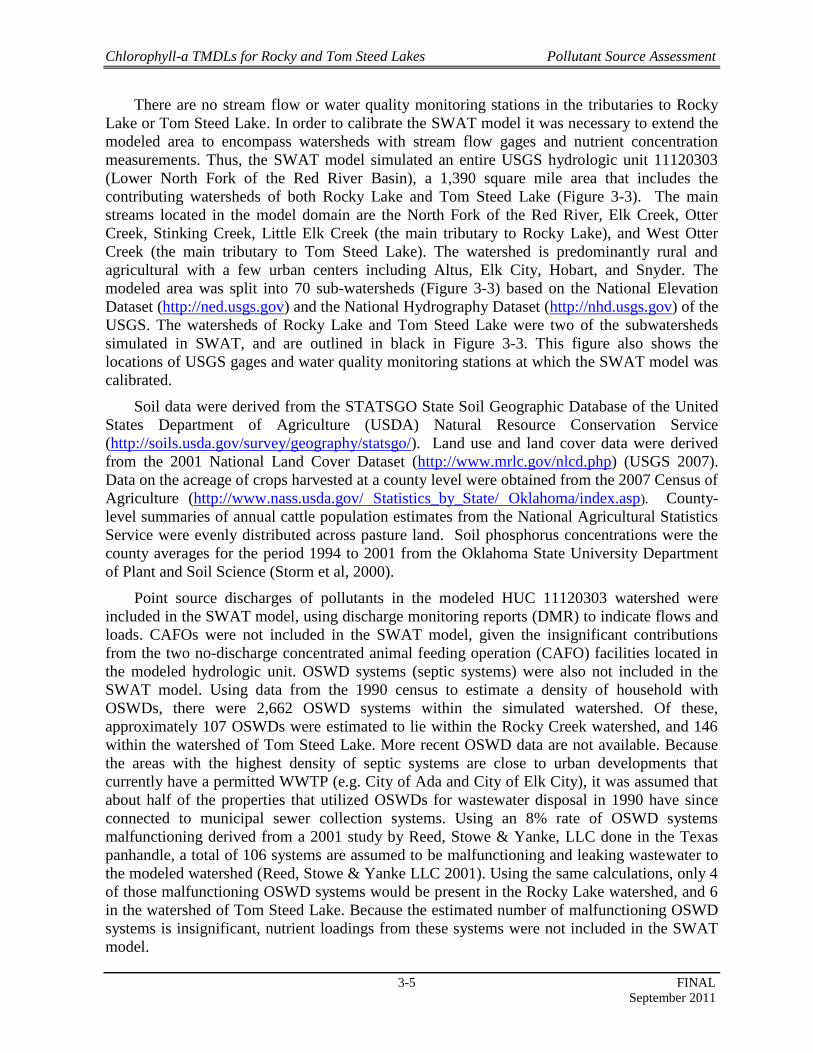
Figure 3-3 Subwatersheds Simulated in the SWAT Watershed Model ................................. 3-6
Figure 3-4 Observed and SWAT Modeled Average Monthly Flows .................................... 3-8
Figure 3-5 Observed and SWAT Modeled Nutrient Concentrations ..................................... 3-9
Figure 3-6 Average Total Phosphorus Loading from SWAT Subwatersheds ..................... 3-11
Figure 3-7 Average Total Nitrogen Loading from SWAT Subwatersheds ......................... 3-12
Figure 4-1 Total N and Total P Combinations Resulting in 10 µg/L Chlorophyll-a - Rocky
Lake ...................................................................................................................... 4-5
Figure 4-2 Total N and Total P Reduction Combinations Resulting in 10 µg/L Chlorophyll-a
- Tom Steed Lake ................................................................................................. 4-6

Chlorophyll-a TMDLs for Rocky and Tom Steed Lakes Table of Contents
iii FINAL
September 2011
LIST OF TABLES
Table ES-1 Average Daily Flows and Nutrient Loads Discharging to Rocky Lake and Tom
Steed Lake ............................................................................................................... 6
Table ES-2 Model Predicted and Measured Water Quality Parameter Concentrations ............. 7
Table ES-3 Total Phosphorus and Nitrogen Load Reductions to Meet a 10 µg/L Chlorophyll-a
Water Quality Target ............................................................................................... 7
Table ES-4 TMDLs for Chlorophyll-a Expressed in Kilograms of Total Phosphorus and
Nitrogen Per Day ..................................................................................................... 9
Table 1-1 General Lake Characteristics ................................................................................ 1-3
Table 1-2 County Population and Density ............................................................................ 1-6
Table 1-3 Average Annual Precipitation by Watershed 1994-2009 ..................................... 1-6
Table 1-4 Land Use Summary by Watershed ....................................................................... 1-7
Table 2-1 Excerpt from the 2008 Integrated Report – Oklahoma §303(d) List of Impaired
Waters (Category 5a) ............................................................................................ 2-1
Table 2-2 Water Quality Monitoring Stations used for 2008 §303(d) Listing Decision ...... 2-3
Table 2-3 Summary of Chlorophyll-a Measurements in Rocky Lake 2003-2009 (all values in
µg/L) ..................................................................................................................... 2-4
Table 2-4 Summary of Chlorophyll-a Measurements in Tom Steed Lake 2002-2007 (all
values in µg/L) ..................................................................................................... 2-4
Table 2-5 Summary of Average Nutrient Measurements in Rocky Lake 1998-2009 (all
values in mg/L)‡ ................................................................................................... 2-5
Table 2-6 Summary of Average Nutrient Measurements in Tom Steed Lake 2002-2007 (all
values in mg/L)‡ ................................................................................................... 2-6
Table 3-1 NPDES No-Discharge Facilities in the Study Area ............................................. 3-2
Table 3-2 Average Flows and Nutrient Loads Discharging to Rocky Lake and Tom Steed
Lake .................................................................................................................... 3-10
Table 4-1 Lake Morphometric Characteristics ..................................................................... 4-2
Table 4-2 Estimate of Atmospheric Loads ........................................................................... 4-2
Table 4-4 Model Predicted and Measured Water Quality Parameter Concentrations .......... 4-3
Table 4-5 Total Phosphorus and Nitrogen Load Reductions to Meet a 10 µg/L Chlorophyll-a
In-lake Water Quality Target ............................................................................... 4-4
Table 5-1 TMDLs for Chlorophyll-a Expressed in Kilograms of Total Phosphorus and
Nitrogen Per Day .................................................................................................. 5-3
Ambient Water Quality Data for Tom Steed Lake, 1999-2010 ................................................... 2
Ambient Water Quality Data for Rocky Lake, 1998-2009 ........................................................ 13

Chlorophyll-a TMDLs for Rocky and Tom Steed Lakes Acronyms and Abbreviations
iv FINAL
September 2011
ACRONYMS AND ABBREVIATIONS
BUMP Beneficial Use Monitoring Program
CAFO Concentrated Animal Feeding Operation
CFR Code of Federal Regulations
CV Coefficient of Variation
CWA Clean Water Act
DMR Discharge monitoring report
HUC Hydrologic unit code
kg Kilograms
LA Load allocation
mg/L Milligram per liter
MOS Margin of safety
NPDES National Pollutant Discharge Elimination System
NSE Nash-Sutcliffe Efficiency
NLW Nutrient limited watershed
NPS Nonpoint source
O.S. Oklahoma statutes
ODEQ Oklahoma Department of Environmental Quality
OSWD Onsite wastewater disposal
OWRB Oklahoma Water Resources Board
SWAT Soil and Water Assessment Tool
SWS Sensitive public and private water supply
TMDL Total maximum daily load
TSI Trophic state index
USBOR United States Bureau of Reclamation
USDA United States Department of Agriculture
USEPA United States Environmental Protection Agency
USGS United States Geological Survey
µg/L Microgram per liter
WLA Wasteload allocation
WQM Water quality monitoring
WQMP Water quality management plan
WQS Water quality standard
WWTP Wastewater treatment plant

Chlorophyll-a TMDLs for Rocky and Tom Steed Lakes Executive Summary
ES-1 FINAL
September 2011
Executive Summary
This report documents the data and assessment methods used to establish total maximum
daily loads (TMDLs) for Rocky Lake (OK311500030060_00), and Tom Steed Lake
(OK311500020060_00). The Oklahoma Department of Environmental Quality (ODEQ) placed
these waterbodies in Category 5 of the Water Quality in Oklahoma (2008 Integrated Report) for
nonsupport of the public and private water supply designated use because of elevated levels of
chlorophyll-a.
Both of these lakes are in the Lower North Fork of the Red River basin, in southwest
Oklahoma. Rocky Lake, also known as Hobart Lake, is a 347 acre lake in Washita County with
a conservation pool storage of 4,210 acre-feet. It was impounded in 1933, and serves as a
recreational lake and also the supplemental municipal water supply for the city of Hobart
(OWRB 2009). Tom Steed Lake is a 6,400 acre lake in Kiowa County with a conservation pool
storage of 88,970 acre-feet. It was first impounded in 1975 by the construction of Mountain
Park Dam on West Otter Creek by the U.S. Bureau of Reclamation. It functions as a flood
control lake and is also used as a supplemental water supply, recreation, and fish and wildlife
propagation (OWRB 2009).
The watersheds of both lakes are sparsely populated, with developed land accounting for
less than 2 percent of the watershed area. The most dominant land use category throughout both
watersheds is cultivated cropland. Both watersheds also have a significant percentage of land
classified as scrub and shrubland.
Data assessment and TMDL calculations are conducted in accordance with requirements of
Section 303(d) of the federal Clean Water Act (CWA), Water Quality Planning and
Management Regulations (40 CFR Part 130), United States Environmental Protection Agency
(USEPA) guidance, and ODEQ guidance and procedures. ODEQ is required to submit all
TMDLs to USEPA for review and approval. Once the USEPA approves a TMDL, then the
waterbody may be moved to Category 4a of a State’s Integrated Water Quality Monitoring and
Assessment Report, where it remains until compliance with water quality standards (WQS) is
achieved (USEPA 2003).
The purpose of this TMDL report is to establish nutrient load allocations necessary for
reducing chlorophyll-a levels in the lakes, which is the first step toward restoring water quality
and protecting public health. TMDLs determine the pollutant loading a waterbody can
assimilate without exceeding applicable WQS. TMDLs also establish the pollutant load
allocation necessary to meet the WQS established for a waterbody based on the relationship
between pollutant sources and water quality conditions in the waterbody. A TMDL consists of
a wasteload allocation (WLA), load allocation (LA), and a margin of safety (MOS). The WLA
is the fraction of the total pollutant load apportioned to point sources, and includes stormwater
discharges regulated under the National Pollutant Discharge Elimination System (NPDES) as
point sources. The LA is the fraction of the total pollutant load apportioned to nonpoint
sources. The MOS is a percentage of the TMDL set aside to account for the lack of knowledge
associated with natural process in aquatic systems, model assumptions, and data limitations.
This report does not stipulate specific control actions (regulatory controls) or management
measures (voluntary best management practices) necessary to reduce nutrients within each
watershed. Watershed-specific control actions and management measures will be identified,
Chlorophyll-a TMDLs for Rocky and Tom Steed Lakes Executive Summary
ES-2 FINAL
September 2011
selected, and implemented under a separate process involving stakeholders who live and work
in the watersheds, along with tribes, and local, state, and federal government agencies.
E.1 Problem Identification and Water Quality Target
Elevated levels of chlorophyll-a in lakes reflect excessive algae growth, which can have
deleterious effects on the quality and treatment costs of drinking water. Excessive algae growth
can also negatively impact the aquatic biological communities of lakes. Elevated chlorophyll-a
levels typically indicate excessive loading of the primary growth-limiting algal nutrients
nitrogen and phosphorus to the waterbody, a process known as eutrophication.
The following excerpt from the Oklahoma WQS (Oklahoma Administrative Code [OAC]
Chapter 45: 785:45-5-10) stipulates the numeric criterion that has been set for sensitive public
and private water supply (SWS) lakes including Rocky Lake and Tom Steed Lake (OWRB
2008).
785:45-5-10. Public and private water supplies
The following criteria apply to surface waters of the state having the designated
beneficial use of Public and Private Water Supplies:
(7) Chlorophyll-a numerical criterion for certain waters. The long term average
concentration of chlorophyll-a at a depth of 0.5 meters below the surface shall not
exceed 0.010 milligrams per liter in Wister Lake, Tenkiller Ferry Reservoir, nor any
waterbody designated SWS in Appendix A of this Chapter. Wherever such criterion is
exceeded, numerical phosphorus or nitrogen criteria or both may be promulgated.
Rocky Lake is also assigned the designation of “nutrient limited watershed” (NLW) in
OAC Chapter 45: 785:45-5-29. A NLW means a watershed of a waterbody with a designated
beneficial use which is adversely affected by excess nutrients as determined by Carlson's
Trophic State Index (using chlorophyll-a) of 62 or greater, or is otherwise listed as "NLW" in
Appendix A of Chapter 45 (OWRB 2010). In the case of Rocky Lake the NLW designation
applies to its entire watershed and drainage area, including all direct and indirect tributaries
(OWRB 2010).
In Rocky Lake, chlorophyll-a levels averaged 43.0 µg/L from 2003 to 2009, which is
equivalent to a Carlson’s Trophic State Index (TSI) of 67 (Carlson 1977). These data were used
in the Beneficial Use Monitoring Program to support the decision to place the lake on the
ODEQ 2008 §303(d) list (ODEQ 2008) for non-support of the Public and Private Water Supply
Use.
Pooling data from all sites in Tom Steed Lake, chlorophyll-a levels averaged 23.1 µg/L
(TSI = 61), significantly lower than in Rocky Lake but still elevated relative to the long-term
average SWS criterion of 10 µg/L. Data available for the period of record were used in the
Beneficial Use Monitoring Program to support the decision to place Tom Steed Lake on the
ODEQ 2008 §303(d) list (ODEQ 2008) for non-support of the Public and Private Water Supply
Use.
During the years 1998 to 2009, total nitrogen levels in Rocky Lake averaged
approximately 1.5 mg/L, and total phosphorus levels averaged 0.13 mg/L. Total nitrogen is
calculated as the sum of Kjeldahl nitrogen and two inorganic forms in different oxidation
states: nitrate and nitrite nitrogen. Kjeldahl nitrogen is the sum of organic nitrogen and
Chlorophyll-a TMDLs for Rocky and Tom Steed Lakes Executive Summary
ES-3 FINAL
September 2011
ammonia nitrogen. Total phosphorus is comprised of organic phosphorus, inorganic
orthophosphorus, and inorganic polyphosphates. Thermal stratification was not observed
during the 2006-2007 assessment period, likely due to the shallow nature of the lake (OWRB
2007). Thus, nutrient fluxes from sediments were available year-round in the photic zone where
light permits algal photosynthesis.
Total nitrogen levels in Tom Steed Lake averaged approximately 0.70 mg/L, and total
phosphorus levels averaged 0.073 mg/L. As in Rocky Lake, thermal stratification was not
observed during 2006-2007 in Tom Steed Lake (OWRB 2007).
The Code of Federal Regulations (40 CFR §130.7(c)(1)) states that “TMDLs shall be
established at levels necessary to attain and maintain the applicable narrative and numerical
water quality standards.” The water quality target established for each lake must demonstrate
compliance with the numeric criterion prescribed for SWS lakes in the Oklahoma WQS
(OWRB 2008). Therefore the water quality target established for Rocky Lake and Tom Steed
Lake is to achieve a long-term average in-lake concentration of 10 µg/L for chlorophyll-a.
Rocky Lake is also included in the 303(d) list for turbidity and color impairments, while Tom
Steed Lake is listed for turbidity exceedances. The implementation of this TMDL will at least
partially address the impairment resulting from turbidity levels and color in the lakes.
However, these water quality issues will be addressed specifically on a future date.
E.2 Pollutant Source Assessment
This section includes an assessment of the known and suspected sources of nutrients
contributing to the eutrophication of Rocky Lake and Tom Steed Lake. Nutrient sources
identified are categorized and quantified to the extent that reliable information is available.
Generally, nutrient loadings causing eutrophication of lakes originate from point or nonpoint
sources of pollution. Point sources are permitted through the NPDES program. Nonpoint
sources are diffuse sources that typically cannot be identified as entering a waterbody through a
discrete conveyance at a single location. Nonpoint sources may emanate from land activities
that contribute nutrient loads to surface water as a result of rainfall runoff. For the TMDLs in
this report, all sources of pollutant loading not regulated by NPDES are considered nonpoint
sources.
Under 40 CFR, §122.2, a point source is described as a discernable, confined, and discrete
conveyance from which pollutants are or may be discharged to surface waters. NPDES-
permitted facilities classified as point sources that may contribute nutrient loading include:
NPDES municipal wastewater treatment plant (WWTP) discharges;
NPDES industrial WWTP discharges;
NPDES municipal no-discharge WWTPs;
NPDES concentrated animal feeding operations (CAFOs);
NPDES municipal separate storm sewer system discharges;
Of these five types of facilities only one type occurs within Rocky Lake and Tom Steed
watersheds – municipal no-discharge WWTPs. Therefore there are no point sources
discharging to the lakes or the tributaries of each lake within the Study Area. For the purposes
of these TMDLs, no-discharge facilities are not considered a source of nutrient loading. It is
possible that the wastewater collection system associated with no-discharge facilities could be a
Chlorophyll-a TMDLs for Rocky and Tom Steed Lakes Executive Summary
ES-4 FINAL
September 2011
source of nutrient loading, or that discharges from the wastewater plant may occur during large
rainfall events that exceed the systems’ storage capacities. These types of unauthorized
discharges are typically reported as sanitary sewer overflows. However, the facilities in Table
3-1 have not reported a sanitary sewer overflow since 2000. Furthermore, given the small size
of the wastewater collection systems of these no-discharge facilities the contributions of
nutrient loads would be negligible.
As there are no point source discharges in the Study Area, the external nutrient loading to
each lake originates from nonpoint sources. Nonpoint sources include those sources that cannot
be identified as entering the waterbody at a specific location. The relatively homogeneous land
use/land cover categories throughout the Study Area associated with agricultural and forest and
range management activities have a strong influence on the origin and pathways of nutrient
sources to surface water. Nutrient sources in rural watersheds originate from soil erosion,
agricultural fertilization, residues from mowing and harvesting, atmospheric deposition of
nutrients, failing onsite wastewater disposal (OSWD) systems, and fecal waste deposited in the
watershed by wildlife, livestock, and pets. Causes of soil erosion can include natural causes
such as flooding and winds, construction activities, vehicular traffic, and agricultural activates.
Given a lack of instream water quality data and pollutant source data available to quantify
nutrient and sediment loading directly from the tributaries of Rocky Lake and Tom Steed Lake,
a watershed loading model – the Soil and Water Assessment Tool (SWAT) – was used to
develop nonpoint source loading estimates. These estimates from SWAT were used to quantify
the nutrient contributions to each lake. SWAT is a basin-scale watershed model that can be
operated on a daily time step (Neitsch et al. 2007). SWAT is designed to predict the impact of
management strategies on water, nutrient, sediment, and agricultural chemical yields. The
model is physically (and empirically) based, computationally efficient, and capable of
continuous simulation over long time periods. The major components of the model include
weather, hydrology, soil temperature and properties, plant growth, nutrients, and land
management. The development and calibration of the SWAT model is described in detail in
the report Technical Methods Summary for Watershed and Water Quality Modeling of Sensitive
Water Supply Lakes in Oklahoma (Parsons 2010).
There are no stream flow or water quality monitoring stations in the tributaries to Rocky
Lake or Tom Steed Lake. In order to calibrate the SWAT model it was necessary to extend the
modeled area to encompass watersheds with stream flow gages and nutrient concentration
measurements. Thus, the SWAT model simulated the entire United States Geologic Survey
(USGS) hydrologic unit 11120303 (Lower North Fork of the Red River Basin), a 1,390 square
mile area that includes the contributing watersheds of both Rocky Lake and Tom Steed Lake.
A fifteen year period (1994 - 2008) was simulated in the SWAT model. However, the first
four years were considered a “spin-up” period for stabilizing model initial conditions, and the
model output consisted of only the latter 11 years (1998 - 2008). The variables simulated in
SWAT included flow, organic phosphorus, mineral ortho-phosphorus, organic nitrogen,
ammonia nitrogen, nitrate nitrogen, nitrite nitrogen, and total suspended solids.
The SWAT hydrologic calibration was primarily performed based on flow data available at
the USGS gages located on the North Fork Red River near Tipton (0730728) and Otter Creek
near Snyder (07307010). The primary calibration targets included annual water balances, but
modeled monthly flows and the resulting flow duration curves were also compared to measured

Chlorophyll-a TMDLs for Rocky and Tom Steed Lakes Executive Summary
ES-5 FINAL
September 2011
values. Overall, the model reproduces the annual flows within 15 percent in most years, with
overall errors for the calibration and validation periods well below the target (-5% for North
Fork Red River and <1% for Otter Creek). Resulting Nash-Sutcliffe Efficiency (NSE)
Coefficients and correlation coefficient values were 0.860 and 0.861 for North Fork Red River
and 0.939 and 0.943 for Otter Creek. Both of those two coefficients meet the targets of 0.5 for
NSE and 0.6 for r2, indicating very good model performance.
After hydrologic calibration, the SWAT-predicted nutrient concentrations were compared
to measured nutrient concentrations at the two water quality stations where they were available:
Elk Creek near Hobart (OK311500030010-001AT) and the North Fork Red River near
Headrick (OK311500010020-001AT). In most cases, the SWAT model reproduced the
average nutrient concentrations within 20 percent of the averages calculated using measured
concentrations. In some instances, the model does not replicate observed nutrient speciation
for a given period, but nevertheless the total phosphorus and nitrogen predicted averages are
within target for both the calibration and verification periods. Overall, the model reproduces
the average concentrations of all nutrients within 20 percent of the observed averages.
Based on the calibrated SWAT model, average loads of nutrients from each of the
individual subwatersheds were estimated for the period 1998 to 2008. The average daily flows
and loads into Rocky Lake and Tom Steed Lake are displayed in Table ES-1. Under current
conditions, Rocky Lake is estimated to receive a total annual load of 38,000 kg of phosphorus
and 62,000 kg of nitrogen, on average, from nonpoint sources in its watershed. Tom Steed Lake
is estimated to receive a total annual load of 68,600 kg of phosphorus and 116,400 kg of
nitrogen, on average, from nonpoint sources in its watershed.

Chlorophyll-a TMDLs for Rocky and Tom Steed Lakes Executive Summary
ES-6 FINAL
September 2011
Table ES-1 Average Daily Flows and Nutrient Loads Discharging to Rocky Lake and
Tom Steed Lake
Parameter Rocky Lakea
Tom Steed Lakeb
Watershed Size (square miles) 55 119
Flow (m3/day) 3.97 x 10
4 1.20 x 10
5
Organic Phosphorus (kg/year) 14,600 14,600
Mineral Ortho-Phosphorus (kg/year) 23,400 54,000
Total Phosphorus (kg/year) 38,000 68,600
Organic Nitrogen (kg/year) 24,500 50,000
Ammonia Nitrogen (kg/year) 10,200 33,200
Nitrite Nitrogen (kg/year) 700 5,100
Nitrate Nitrogen (kg/year) 26,600 28,100
Total Nitrogen (kg/year) 62,000 116,400
E.3 Technical Approach and Methods
The objective of a TMDL is to estimate allowable pollutant loads and to allocate these
loads to the known pollutant sources in the watershed so appropriate control measures can be
implemented and the WQS achieved. In order to ascertain the effect of management measures
on in-lake water quality, it is necessary to establish a linkage between the external loading of
nutrients and the waterbody response in terms of lake water quality conditions, as evaluated by
chlorophyll-a concentrations. This section describes the water quality analysis of the linkage
between chlorophyll-a levels in Rocky Lake and Tom Steed Lake and the nutrient loadings
from their watersheds.
The water quality linkage analysis was performed using the BATHTUB model (Walker
1986). BATHTUB is a U.S. Army Corps of Engineers model designed to simulate
eutrophication in reservoirs and lakes. BATHTUB has been cited as an effective tool for
reservoir and lake water quality assessment and management, particularly where data are
limited. The model incorporates several empirical equations of nutrient settling and algal
growth to predict steady-state water column nutrient and chlorophyll-a concentrations based on
water body characteristics, hydraulic characteristics, and external nutrient loadings.
The model was run under existing average, steady-state conditions. An averaging period of
one year was used to depict the duration of mass-balance calculations for both lakes. A single,
well-mixed lake was assumed for both reservoirs. Key water quality parameters for BATHTUB
input include total phosphorus, inorganic ortho-phosphorus, total nitrogen, and inorganic
nitrogen. Output from the SWAT model was the primary source of data inputs to the
BATHTUB model. Although SWAT can provide daily output, BATHTUB is a steady-state
model and not appropriate for interpreting short-term responses of lakes to nutrients. Therefore,
the long-term average annual loads from the SWAT modeled period were applied as inputs to
BATHTUB.
The BATHTUB models were calibrated to measured in-lake water quality conditions
(based on 2002-2008 data) using phosphorus and nitrogen calibration factors. The model-
Chlorophyll-a TMDLs for Rocky and Tom Steed Lakes Executive Summary
ES-7 FINAL
September 2011
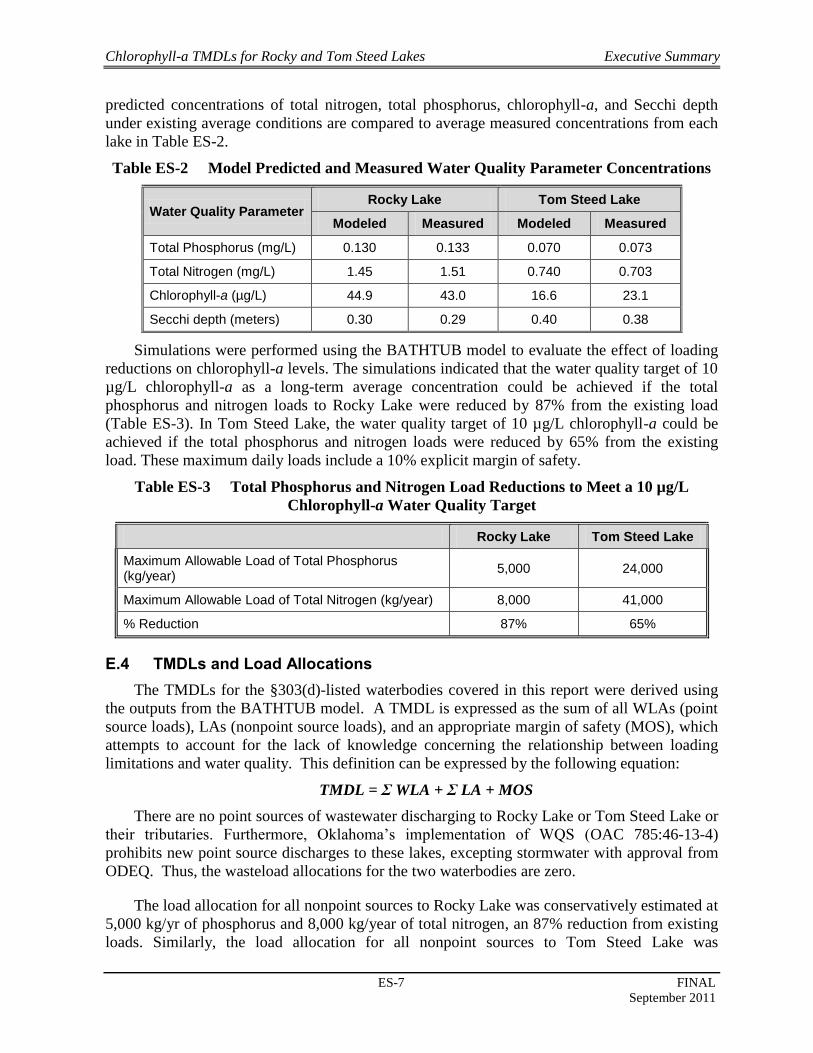
predicted concentrations of total nitrogen, total phosphorus, chlorophyll-a, and Secchi depth
under existing average conditions are compared to average measured concentrations from each
lake in Table ES-2.
Table ES-2 Model Predicted and Measured Water Quality Parameter Concentrations
Water Quality Parameter Rocky Lake Tom Steed Lake
Modeled Measured Modeled Measured
Total Phosphorus (mg/L) 0.130 0.133 0.070 0.073
Total Nitrogen (mg/L) 1.45 1.51 0.740 0.703
Chlorophyll-a (µg/L) 44.9 43.0 16.6 23.1
Secchi depth (meters) 0.30 0.29 0.40 0.38
Simulations were performed using the BATHTUB model to evaluate the effect of loading
reductions on chlorophyll-a levels. The simulations indicated that the water quality target of 10
µg/L chlorophyll-a as a long-term average concentration could be achieved if the total
phosphorus and nitrogen loads to Rocky Lake were reduced by 87% from the existing load
(Table ES-3). In Tom Steed Lake, the water quality target of 10 µg/L chlorophyll-a could be
achieved if the total phosphorus and nitrogen loads were reduced by 65% from the existing
load. These maximum daily loads include a 10% explicit margin of safety.
Table ES-3 Total Phosphorus and Nitrogen Load Reductions to Meet a 10 µg/L
Chlorophyll-a Water Quality Target
Rocky Lake
Tom Steed Lake
Maximum Allowable Load of Total Phosphorus (kg/year)
5,000 24,000
Maximum Allowable Load of Total Nitrogen (kg/year) 8,000 41,000
% Reduction 87% 65%
E.4 TMDLs and Load Allocations
The TMDLs for the §303(d)-listed waterbodies covered in this report were derived using
the outputs from the BATHTUB model. A TMDL is expressed as the sum of all WLAs (point
source loads), LAs (nonpoint source loads), and an appropriate margin of safety (MOS), which
attempts to account for the lack of knowledge concerning the relationship between loading
limitations and water quality. This definition can be expressed by the following equation:
TMDL = Σ WLA + Σ LA + MOS
There are no point sources of wastewater discharging to Rocky Lake or Tom Steed Lake or
their tributaries. Furthermore, Oklahoma’s implementation of WQS (OAC 785:46-13-4)
prohibits new point source discharges to these lakes, excepting stormwater with approval from
ODEQ. Thus, the wasteload allocations for the two waterbodies are zero.
The load allocation for all nonpoint sources to Rocky Lake was conservatively estimated at
5,000 kg/yr of phosphorus and 8,000 kg/year of total nitrogen, an 87% reduction from existing
loads. Similarly, the load allocation for all nonpoint sources to Tom Steed Lake was

Chlorophyll-a TMDLs for Rocky and Tom Steed Lakes Executive Summary
ES-8 FINAL
September 2011
conservatively estimated at 24,000 kg/yr of total phosphorus and 41,000 kg/year of total
nitrogen, a 65% reduction from existing loads.
USEPA guidance allows for use of implicit or explicit expressions of the MOS, or both.
When conservative assumptions are used in development of the TMDL, or conservative factors
are used in the calculations, the MOS is implicit. When a specific percentage of the TMDL is
set aside to account for the lack of knowledge, then the MOS is considered explicit. In these
TMDLs, the MOS has both an explicit component, 10%, and an implicit component that is
incorporated by the application of load reductions for both nitrogen and phosphorus. Seasonal
variation was accounted for in these TMDLs by using more than 5 years of water quality data
collected in each of the four seasons.
Load reduction scenario simulations were run using the BATHTUB model to calculate and
express the TMDL as annual average phosphorus and nitrogen loads (in kg/yr) that, if achieved,
should decrease chlorophyll-a concentrations to meet the water quality target. However, a
recent court decision (Friends of the Earth, Inc. v. EPA, et al., often referred to as the
Anacostia decision) states that TMDLs must include a daily load expression. It is important to
recognize that the chlorophyll-a response to nutrient loading in both Rocky Lake and Tom
Steed Lake is affected by many factors such as: internal lake nutrient loading, water residence
time, wind action and the interaction between light penetration, nutrients, sediment load and
algal response. As such it is important to note that expressing this TMDL in daily time steps
does not imply a daily response to a daily load is practical from an implementation perspective.
The USEPA’s Technical Support Document for Water Quality-Based Toxics Control
(USEPA 1991b) provides a statistical method for identifying a statistical maximum daily limit
that is based on a long-term average and considering variation in a dataset. The method is
represented by the following equation:
where MDL = maximum daily load
LTA = long-term average load
z = z statistic of the probability of occurrence (0.95 is assumed for this value)
σ2 = ln(CV
2+1)
CV = coefficient of variation
The coefficient of variation of daily nitrogen and phosphorus nonpoint source (NPS) loads
were calculated from SWAT model output and ranged from 8.2 to 11 for phosphorus and from
5.7 to 7.9 for nitrogen. Assuming a probability of occurrence of 95 percent, the maximum daily
load corresponding to the allowable average load of 5,000 kg of phosphorus and 8,000 kg of
nitrogen per year to Rocky Lake is translated to a daily maximum load of 13.7 kg/day of
phosphorus and 21.9 kg/day of nitrogen. For Tom Steed Reservoir, the allowable average load
of 24,000 kg of phosphorus and 41,000 kg of nitrogen per year is translated to a daily
maximum load of 65 kg/day of phosphorus and 112.3 kg/day of nitrogen. Reduction of total
phosphorus and total nitrogen loads to these levels is expected to result in achievement of WQS
for chlorophyll-a in each lake.
Chlorophyll-a TMDLs for Rocky and Tom Steed Lakes Executive Summary
ES-9 FINAL
September 2011
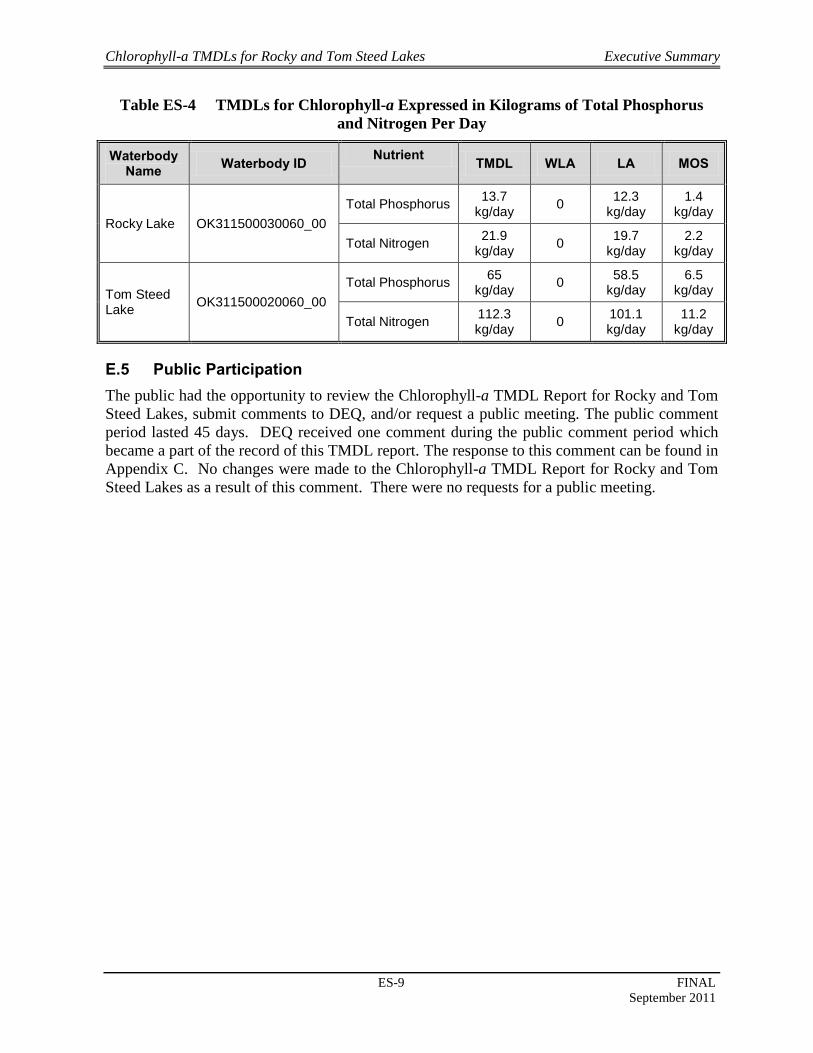
Table ES-4 TMDLs for Chlorophyll-a Expressed in Kilograms of Total Phosphorus
and Nitrogen Per Day
Waterbody Name
Waterbody ID Nutrient
TMDL WLA LA MOS
Rocky Lake OK311500030060_00
Total Phosphorus 13.7
kg/day 0
12.3 kg/day
1.4 kg/day
Total Nitrogen 21.9
kg/day 0
19.7 kg/day
2.2 kg/day
Tom Steed Lake
OK311500020060_00
Total Phosphorus 65
kg/day 0
58.5 kg/day
6.5 kg/day
Total Nitrogen 112.3 kg/day
0 101.1 kg/day
11.2 kg/day
E.5 Public Participation
The public had the opportunity to review the Chlorophyll-a TMDL Report for Rocky and Tom
Steed Lakes, submit comments to DEQ, and/or request a public meeting. The public comment
period lasted 45 days. DEQ received one comment during the public comment period which
became a part of the record of this TMDL report. The response to this comment can be found in
Appendix C. No changes were made to the Chlorophyll-a TMDL Report for Rocky and Tom
Steed Lakes as a result of this comment. There were no requests for a public meeting.
Chlorophyll-a TMDLs for Rocky and Tom Steed Lakes Introduction
1-1 FINAL
September 2011
SECTION 1 INTRODUCTION
1.1 TMDL Program Background
Section 303(d) of the federal Clean Water Act (CWA) and U.S. Environmental Protection
Agency (USEPA) Water Quality Planning and Management Regulations (40 Code of Federal
Regulations [CFR] Part 130) require states to develop total maximum daily loads (TMDLs) for
waterbodies not meeting designated uses where technology-based controls are in place. TMDLs
establish the allowable loadings of pollutants or other quantifiable parameters for a waterbody
based on the relationship between pollution sources and instream water quality conditions, so
States can implement water quality-based controls to reduce pollution from point and nonpoint
sources and restore and maintain water quality (USEPA 1991a).
This report documents the data and assessment used to establish TMDLs for chlorophyll-a
for two lakes (reservoirs) in the Lower North Fork of the Red River (hydrologic unit code
[HUC] 11120303) basin. Elevated levels of chlorophyll-a in lakes reflect excessive algae
growth, which can have deleterious effects on the quality and treatment costs of drinking water.
Excessive algae growth can also negatively impact the aquatic biological communities of lakes.
Elevated chlorophyll-a levels typically indicate excessive loading of the primary growth-
limiting algal nutrients nitrogen and phosphorus to the waterbody, a process known as
eutrophication. Data assessment and TMDL calculations are conducted in accordance with
requirements of Section 303(d) of the CWA, Water Quality Planning and Management
Regulations (40 CFR Part 130), USEPA guidance, and Oklahoma Department of
Environmental Quality (ODEQ) guidance and procedures. ODEQ is required to submit all
TMDLs to USEPA for review and approval. Once the USEPA approves a TMDL, then the
waterbody may be moved to Category 4a of a State’s Integrated Water Quality Monitoring and
Assessment Report, where it remains until compliance with water quality standards (WQS) is
achieved (USEPA 2003). The purpose of this TMDL report is to establish nutrient load
allocations necessary for reducing chlorophyll-a levels in the lakes, which is the first step
toward restoring water quality and protecting public health. TMDLs determine the pollutant
loading a waterbody can assimilate without exceeding applicable WQS. TMDLs also establish
the pollutant load allocation necessary to meet the WQS established for a waterbody based on
the relationship between pollutant sources and water quality conditions in the waterbody. A
TMDL consists of a wasteload allocation (WLA), load allocation (LA), and a margin of safety
(MOS). The WLA is the fraction of the total pollutant load apportioned to point sources, and
includes stormwater discharges regulated under the National Pollutant Discharge Elimination
System (NPDES) as point sources. The LA is the fraction of the total pollutant load
apportioned to nonpoint sources. The MOS is a percentage of the TMDL set aside to account
for the lack of knowledge associated with natural process in aquatic systems, model
assumptions, and data limitations.
This report does not stipulate specific control actions (regulatory controls) or management
measures (voluntary best management practices) necessary to reduce nutrients within each
watershed. Watershed-specific control actions and management measures will be identified,
selected, and implemented under a separate process involving stakeholders who live and work
in the watersheds, along with tribes, and local, state, and federal government agencies.

Chlorophyll-a TMDLs for Rocky and Tom Steed Lakes Introduction
1-2 FINAL
September 2011
This TMDL report focuses on waterbodies that ODEQ placed in Category 5 [303(d) list] of
the Water Quality in Oklahoma, 2008 Integrated Report (2008 Integrated Report) for non-
support of the public and private water supply use. The waterbodies addressed in this report
include:
Rocky Lake (OK311500030060_00), and
Tom Steed Lake (OK311500020060_00).
Figures 1-1 and 1-2 are location maps showing these Oklahoma waterbodies and their
contributing watersheds. These maps also display locations of the water quality monitoring
(WQM) stations used as the basis for placement of these waterbodies on the Oklahoma §303(d)
list. These waterbodies and their surrounding watersheds are hereinafter referred to as the Study
Area.
1.2 Watershed and Lake Description
Lake Characteristics. Rocky Lake, also known as Hobart Lake, is a 347 acre lake in
Washita County with a conservation pool storage of 4,210 acre-feet. It was impounded in 1933,
and serves as a recreational lake and also the supplemental municipal water supply for the city
of Hobart (OWRB 2009). Little Elk Creek, which is 15 miles long, is the primary tributary
flowing to Rocky Lake. Based on the Beneficial Use Monitoring Program (BUMP) sample
period of October 2008 through August 2009, the average secchi disk depth in Rocky Lake was
only 20 centimeters (OWRB 2009).
Tom Steed Lake is a 6,400 acre lake in Kiowa County with a conservation pool storage of
88,970 acre-feet. It was first impounded in 1975 by the construction of Mountain Park Dam on
West Otter Creek by the United States Bureau of Reclamation (USBOR) (OWRB 2009). It
functions as a flood control lake and is also used for supplemental water supply, recreation, and
fish and wildlife propagation (OWRB 2009). An aqueduct system constructed by the USBOR
is designed to convey water from Tom Steed Lake to the cities of Altus, Snyder, Frederick, and
the Hackberry Flat Wildlife Management Area for municipal use (USBOR 2010). Great Plains
State Park borders the eastern and southern shores of Tom Steed Lake. The 5,000 acre
Mountain Park Wildlife Management Area is located along the northern shores of Tom Steed
Lake. West Otter Creek and Glenn Creek, which are both approximately 14 miles long, are the
two main tributaries that flow into Tom Steed Lake. The Bretch Diversion Dam and Canal also
diverts streamflow from Elk Creek into the watershed of Tom Steed Lake. Based on the
BUMP sample period of November 2006 through July 2007, the average secchi disk depth in
Tom Steed Lake was 57 centimeters (OWRB 2009).
There is very little developed land bordering the shoreline of either lake. Both lakes are
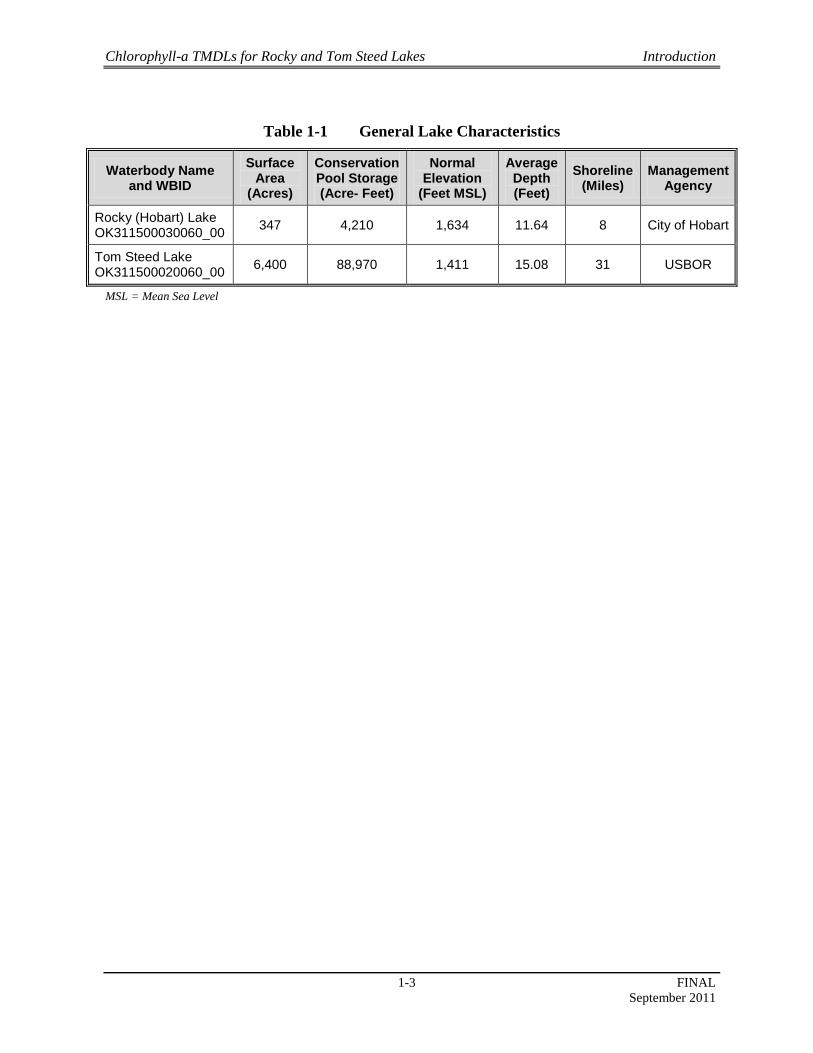
popular fishing and boating recreation destinations. Table 1-1 provides general characteristics
of each lake.
Chlorophyll-a TMDLs for Rocky and Tom Steed Lakes Introduction
1-3 FINAL
September 2011
Table 1-1 General Lake Characteristics
Waterbody Name and WBID
Surface Area
(Acres)
Conservation Pool Storage (Acre- Feet)
Normal Elevation
(Feet MSL)
Average Depth (Feet)
Shoreline (Miles)
Management Agency
Rocky (Hobart) Lake OK311500030060_00
347 4,210 1,634 11.64 8 City of Hobart
Tom Steed Lake OK311500020060_00
6,400 88,970 1,411 15.08 31 USBOR
MSL = Mean Sea Level

Chlorophyll-a TMDLs for Rocky and Tom Steed Lakes Introduction
1-4 FINAL
September 2011
Figure 1-1 Rocky Lake

Chlorophyll-a TMDLs for Rocky and Tom Steed Lakes Introduction
1-5 FINAL
September 2011
Figure 1-2 Tom Steed Lake

Chlorophyll-a TMDLs for Rocky and Tom Steed Lakes Introduction
1-6 FINAL
September 2011
General. Both lakes are within the larger Lower North Fork of the Red River basin which
is located in the southwestern portion of Oklahoma. Rocky Lake’s contributing watershed is
located entirely in Washita County. The majority of the watershed of Tom Steed Lake is
located in Kiowa County, but a small portion lies in Comanche County. These counties are part
of the Central Great Plains Level III ecoregions (Woods et al 2005). Once dominated by
grassland, with scattered low trees and shrubs in the south, much of this ecological region is
now cropland. The eastern boundary of the region marks the eastern limits of the major winter
wheat growing area of the United States (Woods et al 2005). The Rocky Lake watershed is
located in the Anadarko Basin geological province and the Tom Steed Lake watershed is
located in the Wichita Mountain Uplift Basin geological province. Table 1-2, derived from the
2010 U.S. Census, demonstrates that the counties in which these watersheds are located are
sparsely populated (U.S. Census Bureau 2010). The town of Dill City is located in the Rocky
Lake watershed and the towns of Roosevelt and Cold Springs are in the Tom Steed Lake
watershed.
Table 1-2 County Population and Density
County Name Population
(2010 Census)
Population Density
(per square mile)
Washita 11,269 11.1
Kiowa 9,446 9.1
Comanche 124,098 114
Climate. Table 1-3 summarizes the average annual precipitation for Rocky Lake
(OK311500030060_00) and Tom Steed Lake (OK311500020060_00). Average annual
precipitation values were derived from the Oklahoma Mesonet Dataset
(http://www.mesonet.org) based on a period of record of 1994 to 2009.
Table 1-3 Average Annual Precipitation by Watershed 1994-2009
Waterbody Name Waterbody ID Average Annual
Precipitation (inches)
Rocky Lake OK311500030060_00 29.81
Tom Steed Lake OK311500020060_00 29.62
1 at Bessie Mesonet station 2 at Hobart Mesonet station
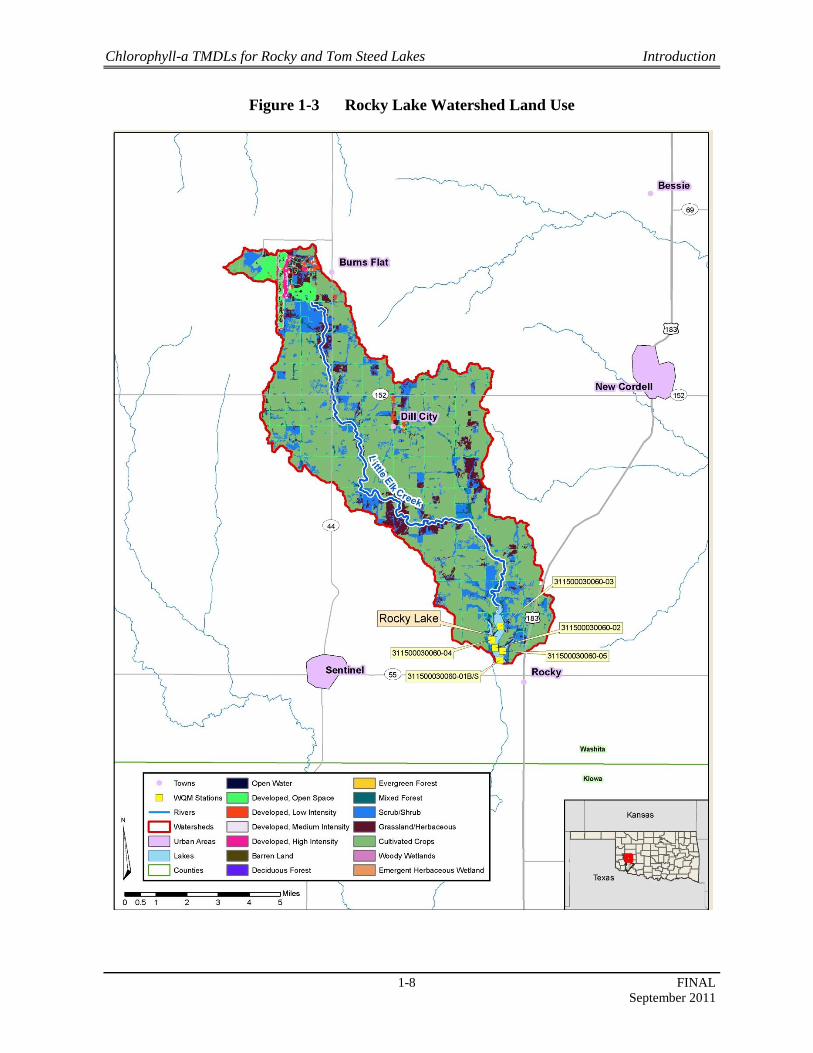
Land Use. The contributing drainage areas of the Rocky Lake and Tom Steed Lake
watersheds are approximately 55 and 119 square miles, respectively. Table 1-4 summarizes the
percentages and acreages of the land use categories for the contributing watersheds. The land
use/land cover data were derived from the United States Geological Survey (USGS) 2001
National Land Cover Dataset (USGS 2007). Land use in the watersheds of Rocky Lake and
Tom Steed Lake is displayed in Figures 1-3 and 1-4, respectively. The most dominant land use

Chlorophyll-a TMDLs for Rocky and Tom Steed Lakes Introduction
1-7 FINAL
September 2011
category throughout the Study Area is cultivated cropland. Both watersheds in the Study Area
also have a significant fraction of land classified as scrub and shrubland. The aggregated total
of low, medium, and high intensity developed land accounts for less than 2 percent of the land
use in each watershed.
Table 1-4 Land Use Summary by Watershed
NLCD2001 Code
Description Tom Steed Lake Rocky Lake
Acres Percent Acres Percent
11 Open Water 6,195 8.2 366 1.0
21 Developed, Open Space 2,462 3.2 2,185 6.2
22 Developed, Low Intensity 94 0.1 281 0.8
23 Developed, medium Intensity 21 0.0 144 0.4
24 Developed, High Intensity 0 0.0 144 0.4
31 Barren Land 1 0.0 2 0.0
41 Deciduous Forest 247 0.3 0 0.0
42 Evergreen Forest 182 0.2 0 0.0
43 Mixed Forest 2,684 3.5 792 2.2
52 Scrub/Shrub 26,988 35.5 5,661 16.0
71 Grassland/Herbaceous 5,170 6.8 2,274 6.4
82 Cultivated Crops 31,657 41.7 23,463 66.3
90 Palustrine Forested Wetland 275 0.4 50 0.1
95 Emergent Herbaceous Wetland 5 0.0 0 0.0
Total Drainage Area 75,982 35,363
Chlorophyll-a TMDLs for Rocky and Tom Steed Lakes Introduction
1-8 FINAL
September 2011
Figure 1-3 Rocky Lake Watershed Land Use

Chlorophyll-a TMDLs for Rocky and Tom Steed Lakes Introduction
1-9 FINAL
September 2011
Figure 1-4 Tom Steed Lake Watershed Land Use

Chlorophyll-a TMDLs for Rocky and Tom Steed Lakes Introduction
1-10 FINAL
September 2011
1.3 Flow Characteristics
Stream flow characteristics and data are key information when conducting water quality
assessments such as TMDLs. However, there are no flow gages located on any of the
tributaries to Rocky Lake and Tom Steed Lake. Given the lack of historical or instantaneous
stream flow data, flow estimates for these tributaries, based on flow data derived from USGS
gage stations on tributaries in adjacent watersheds, were developed using watershed modeling
discussed in further detail in Section 3. There is no USGS stage gage station below Rocky
Lake and therefore there is no historical flow release or lake stage volume data available. From
October 1972 to June 2003, the USGS measured streamflow in West Otter Creek just
downstream of the Tom Steed Lake dam on West Otter Creek at gage station 070305500.
Since July 2000, the USGS has measured streamflow at gage station 07307010, downstream on
Otter Creek near Snyder, Oklahoma.

Chlorophyll-a TMDLs for Rocky and Tom Steed Lakes Problem Identification and Water Quality Target
2-1 FINAL
September 2011
SECTION 2 PROBLEM IDENTIFICATION AND WATER QUALITY TARGET
2.1 Oklahoma Water Quality Standards
Chapters 45 and 46 of Title 785 of the Oklahoma Administrative Code (OAC) contain
Oklahoma’s WQS and implementation procedures (OWRB 2008), respectively. The Oklahoma
Water Resources Board (OWRB) has statutory authority and responsibility concerning
establishment of state water quality standards, as provided under 82 Oklahoma Statute [O.S.],
§1085.30. This statute authorizes the OWRB to promulgate rules …which establish
classifications of uses of waters of the state, criteria to maintain and protect such
classifications, and other standards or policies pertaining to the quality of such waters. [O.S.
82:1085:30(A)]. Beneficial uses are designated for all waters of the state. Such uses are
protected through restrictions imposed by the antidegradation policy statement, narrative water
quality criteria, and numerical criteria (OWRB 2008). An excerpt of the Oklahoma WQS
(Chapter 45,Title 785) summarizing the State of Oklahoma Antidegradation Policy is provided
in Appendix A. The beneficial uses designated for Rocky Lake and Tom Steed Lake include
primary body contact recreation, the warm water aquatic community subcategory of the fish
and wildlife propagation, irrigation agricultural water supply, public and private water supply,
and aesthetics. The entire watershed of Rocky Lake is designated as a “nutrient-limited
watershed” in §785:45-5-29 (OWRB 2008). Table 2-1, an excerpt from the 2008 Integrated
Report (ODEQ 2008), summarizes the public/private water supply use attainment status and the
waterbody/pollutant combinations that require TMDLs for the two waterbodies. The TMDL
priority shown in Table 2-1 is directly related to the TMDL target date. The TMDLs
established in this report, which are a necessary step in the process of restoring water quality,
only address the nonattainment of the public and private water supply use.
Table 2-1 Excerpt from the 2008 Integrated Report – Oklahoma §303(d) List of
Impaired Waters (Category 5a)
Waterbody Name and WBID
Waterbody Size
(Acres)
TMDL Date
TMDL
Priority
Causes of Impairment
Designated Use Not Supported
Rocky (Hobart) Lake
OK311500030060_00 347 2016 3
Chlorophyll-a
Turbidity
Color
Public and Private Water Supply
Warm Water Aquatic Community
Aesthetic
Tom Steed Lake
OK311500020060_00 6,400 2010 1
Chlorophyll-a
Turbidity
Public and Private Water Supply
Warm Water Aquatic Community
Source: 2008 Integrated Report, ODEQ 2008.

Chlorophyll-a TMDLs for Rocky and Tom Steed Lakes Problem Identification and Water Quality Target
2-2 FINAL
September 2011
The definition of SWS is summarized by the following excerpt from OAC 785:45-5-25 of
the Oklahoma WQS (OWRB 2008).
Sensitive Public and Private Water Supplies (SWS). (A) Waters designated "SWS" are those waters of the state which constitute sensitive
public and private water supplies as a result of their unique physical conditions and are
listed in Appendix A of this Chapter as "SWS" waters. These are waters (a) currently
used as water supply lakes, (b) that generally possess a watershed of less than
approximately 100 square miles or (c) as otherwise designated by the Board.
(B) New point source discharges of any pollutant after June 11, 1989, and increased
load of any specified pollutant from any point source discharge existing as of June 11,
1989, shall be prohibited in any waterbody or watershed designated in Appendix A of
this Chapter with the limitation "SWS". Any discharge of any pollutant to a waterbody
designated "SWS" which would, if it occurred, lower existing water quality shall be
prohibited, provided however that new point source discharge(s) or increased load of
specified pollutants described in 785:45-5-25(b) may be approved by the permitting
authority in those circumstances where the discharger demonstrates to the satisfaction
of the permitting authority that a new point source discharge or increased load from an
existing point source discharge will result in maintaining or improving the water
quality of both the direct receiving water and any downstream waterbodies designated
SWS.
The following excerpt from the Oklahoma WQS (OAC 785:45-5-10) stipulates the numeric
criterion that has been set for SWS lakes including Rocky Lake and Tom Steed Lake (OWRB
2008).
785:45-5-10. Public and private water supplies
The following criteria apply to surface waters of the state having the designated
beneficial use of Public and Private Water Supplies:
(7) Chlorophyll-a numerical criterion for certain waters. The long term average
concentration of chlorophyll-a at a depth of 0.5 meters below the surface shall not
exceed 0.010 milligrams per liter in Wister Lake, Tenkiller Ferry Reservoir, nor any
waterbody designated SWS in Appendix A of this Chapter. Wherever such criterion is
exceeded, numerical phosphorus or nitrogen criteria or both may be promulgated.
Rocky Lake is also assigned the designation of “nutrient limited watershed” (NLW) in OAC
785:45-5-29. A NLW means a watershed of a waterbody with a designated beneficial use
which is adversely affected by excess nutrients as determined by Carlson's Trophic State
Index (TSI) (using chlorophyll-a) of 62 or greater, or is otherwise listed as "NLW" in
Appendix A of Chapter 45 (OWRB 2010). In the case of Rocky Lake the NLW designation
applies to its entire watershed and drainage area, including all direct and indirect tributaries
(OWRB 2010).
Due to the location of the Mountain Park Wildlife Management Area within its
watershed, the OWRB placed Tom Steed Lake on Table 1, Appendix B of Chapter 45 as an
area with waters of recreational and/or ecological significance. New discharges or increased
loading from existing discharges to Appendix B waters may be allowed under such conditions
Chlorophyll-a TMDLs for Rocky and Tom Steed Lakes Problem Identification and Water Quality Target
2-3 FINAL
September 2011
that ensure that the recreational and ecological significance of these waters will be maintained
(OWRB 2010).
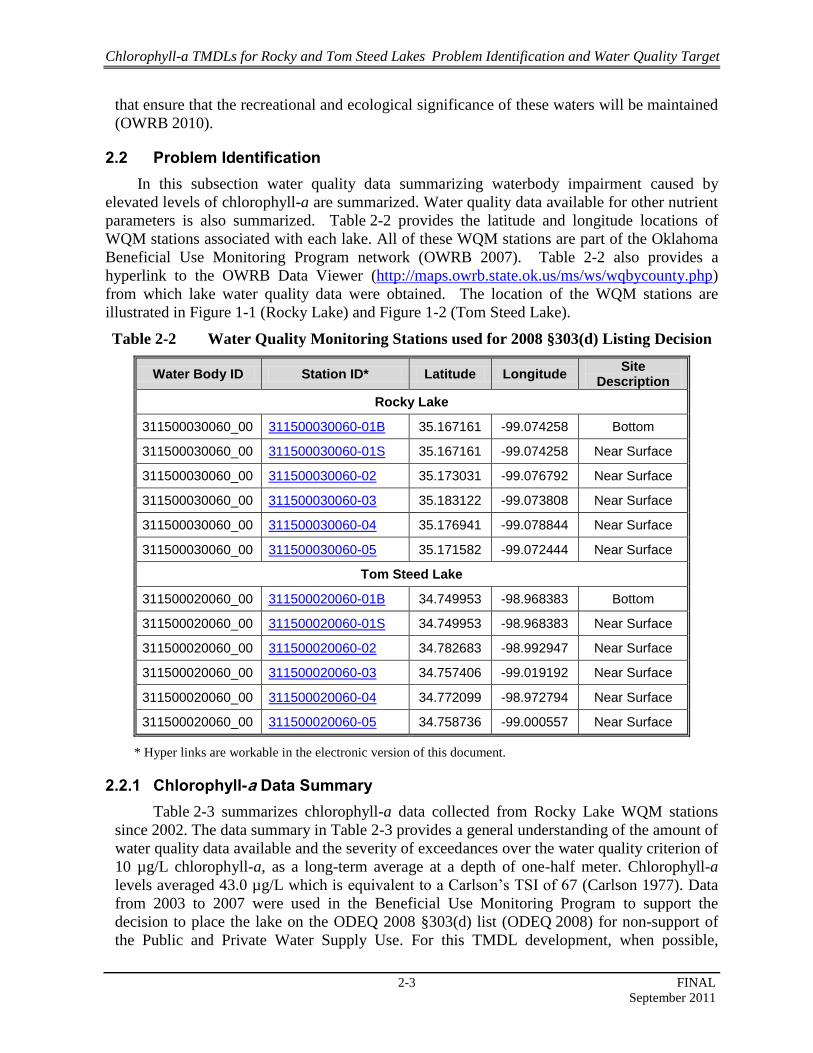
2.2 Problem Identification
In this subsection water quality data summarizing waterbody impairment caused by
elevated levels of chlorophyll-a are summarized. Water quality data available for other nutrient
parameters is also summarized. Table 2-2 provides the latitude and longitude locations of
WQM stations associated with each lake. All of these WQM stations are part of the Oklahoma
Beneficial Use Monitoring Program network (OWRB 2007). Table 2-2 also provides a
hyperlink to the OWRB Data Viewer (http://maps.owrb.state.ok.us/ms/ws/wqbycounty.php)
from which lake water quality data were obtained. The location of the WQM stations are
illustrated in Figure 1-1 (Rocky Lake) and Figure 1-2 (Tom Steed Lake).
Table 2-2 Water Quality Monitoring Stations used for 2008 §303(d) Listing Decision
Water Body ID Station ID* Latitude Longitude Site
Description
Rocky Lake
311500030060_00 311500030060-01B 35.167161 -99.074258 Bottom
311500030060_00 311500030060-01S 35.167161 -99.074258 Near Surface
311500030060_00 311500030060-02 35.173031 -99.076792 Near Surface
311500030060_00 311500030060-03 35.183122 -99.073808 Near Surface
311500030060_00 311500030060-04 35.176941 -99.078844 Near Surface
311500030060_00 311500030060-05 35.171582 -99.072444 Near Surface
Tom Steed Lake
311500020060_00 311500020060-01B 34.749953 -98.968383 Bottom
311500020060_00 311500020060-01S 34.749953 -98.968383 Near Surface
311500020060_00 311500020060-02 34.782683 -98.992947 Near Surface
311500020060_00 311500020060-03 34.757406 -99.019192 Near Surface
311500020060_00 311500020060-04 34.772099 -98.972794 Near Surface
311500020060_00 311500020060-05 34.758736 -99.000557 Near Surface
* Hyper links are workable in the electronic version of this document.
2.2.1 Chlorophyll-a Data Summary
Table 2-3 summarizes chlorophyll-a data collected from Rocky Lake WQM stations
since 2002. The data summary in Table 2-3 provides a general understanding of the amount of
water quality data available and the severity of exceedances over the water quality criterion of
10 µg/L chlorophyll-a, as a long-term average at a depth of one-half meter. Chlorophyll-a
levels averaged 43.0 µg/L which is equivalent to a Carlson’s TSI of 67 (Carlson 1977). Data
from 2003 to 2007 were used in the Beneficial Use Monitoring Program to support the
decision to place the lake on the ODEQ 2008 §303(d) list (ODEQ 2008) for non-support of
the Public and Private Water Supply Use. For this TMDL development, when possible,

Chlorophyll-a TMDLs for Rocky and Tom Steed Lakes Problem Identification and Water Quality Target
2-4 FINAL
September 2011
available data from the most recent 10 years (2000-2009) were used (OAC 785:46-15-
3(c)(3)). The water quality data are provided in Appendix B.
Table 2-3 Summary of Chlorophyll-a Measurements in Rocky Lake 2003-2009 (all
values in µg/L)
Station ID Number of Samples
Minimum Maximum Average Median
311500030060-01B† 7 26.2 76.7 44.2 40.9
311500030060-01S 16 13.8 67.8 33.3 26.9
311500030060-02 11 26.1 92.3 51.1 40.7
311500030060-03 9 20.7 88.4 52.7 52.7
311500030060-04 9 25.3 80.8 47.4 44.5
311500030060-05 8 22.3 47.9 35.3 36.2
All* 53 26.1 47.9 43.0 38.8
†note that data from this deep station cannot be compared to the water quality criterion, which applies to samples collected at
a depth of 0.5 meter. It is included for informational purposes only.
* Bottom data was excluded
Table 2-4 summarizes chlorophyll-a measurements collected from Tom Steed Lake from
2002 through 2007. Pooling data from all sites, chlorophyll-a levels averaged 23.1 µg/L (TSI =
61), significantly lower than in Rocky Lake but still elevated relative to the long-term average
SWS criterion of 10 µg/L. Data from 2002 to 2007 were used in the Beneficial Use Monitoring
Program to support the decision to place the lake on the ODEQ 2008 §303(d) list (ODEQ 2008)
for non-support of the Public and Private Water Supply Use. The water quality data are
provided in Appendix B.
Table 2-4 Summary of Chlorophyll-a Measurements in Tom Steed Lake 2002-2007
(all values in µg/L)
Station ID Number of Samples
Minimum Maximum Average Median
311500020060-01B† 8 3.4 99 20.7 9.5
311500020060-01S 22 2.2 96 11.2 5.8
311500020060-02 12 3.1 302 34.2 10.0
311500020060-03 12 2.8 222 29.4 9.7
311500020060-04 12 2.2 232 26.5 6.9
311500020060-05 11 2.1 174 24.3 7.4
All* 69 2.1 302.0 23.1 7.65
†note that data from this deep station cannot be compared to the water quality criterion, which applies to samples collected
at a depth of 0.5 meter. It is included for informational purposes only.
* Bottom data was excluded

Chlorophyll-a TMDLs for Rocky and Tom Steed Lakes Problem Identification and Water Quality Target
2-5 FINAL
September 2011
2.2.2 Nutrient Data Summary
During the years 1998 to 2009, total nitrogen levels in Rocky Lake averaged
approximately 1.5 mg/L, and total phosphorus levels averaged 0.13 mg/L (Table 2-5). Total
nitrogen is calculated as the sum of Kjeldahl nitrogen and two inorganic forms in different
oxidation states: nitrate and nitrite nitrogen. Kjeldahl nitrogen is the sum of organic nitrogen
and ammonia nitrogen. Total phosphorus is comprised of organic phosphorus, inorganic
orthophosphorus, and inorganic polyphosphates. Thermal stratification was not observed
during the 2006-2007 assessment period, likely due to the shallow nature of the lake (OWRB
2007). Thus, nutrient fluxes from sediments were available year-round in the photic zone where
light permits algal photosynthesis.
Table 2-5 Summary of Average Nutrient Measurements in Rocky Lake 1998-2009 (all
values in mg/L)‡
Station ID Nitrogen, Ammonia
Nitrogen, Kjeldahl
Nitrogen, Nitrate+Nitrite
Phosphorus, Ortho
Phosphorus, Total
311500020060-01B
0.340 1.385 0.140 0.104 0.210
311500020060-01S
0.095 1.281 0.222 0.052 0.132
311500020060-02
0.089 1.297 0.188 0.037 0.127
311500020060-03
0.085 1.362 0.259 0.038 0.141
311500020060-04
0.034 1.318 0.124 0.030 0.123
311500020060-05
0.034 1.301 0.145 0.035 0.125
All 0.091 1.316 0.194 0.041 0.133
‡ Non-detects were averaged at the detection limit
Total nitrogen levels in Tom Steed Lake averaged approximately 0.70 mg/L, and total
phosphorus levels averaged 0.073 mg/L (Table 2-6). As in Rocky Lake, thermal stratification
was not observed during 2006-2007 in Tom Steed Lake (OWRB 2007).
Water quality data for nutrient parameters in both lakes are provided in Appendix B.
2.3 Water Quality Target
The Code of Federal Regulations (40 CFR §130.7(c)(1)) states that, “TMDLs shall be
established at levels necessary to attain and maintain the applicable narrative and numerical
water quality standards.” The water quality target established for each lake must demonstrate
compliance with the numeric criterion prescribed for SWS lakes in the Oklahoma WQS
(OWRB 2008). Therefore the water quality target established for Rocky Lake and Tom Steed
Lake is to achieve a long-term average in-lake concentration of 10 µg/L for chlorophyll-a.
Rocky Lake is also included in the 303(d) list for turbidity and color, while Tom Steed Lake is

Chlorophyll-a TMDLs for Rocky and Tom Steed Lakes Problem Identification and Water Quality Target
2-6 FINAL
September 2011
listed for turbidity exceedances. The implementation of this TMDL will at least partially
address the impairment resulting from turbidity levels and color in the lakes. However, these
water quality issues will be addressed specifically on a future date.
Table 2-6 Summary of Average Nutrient Measurements in Tom Steed Lake 2002-
2007 (all values in mg/L)‡
Station ID Nitrogen, Ammonia
Nitrogen, Kjeldahl
Nitrogen, Nitrate+Nitrite
Phosphorus, Ortho
Phosphorus, Total
311500020060-01B 0.025 0.547 0.084 0.035 0.067
311500020060-01S 0.039 0.630 0.088 0.048 0.071
311500020060-02 0.028 0.617 0.072 0.044 0.075
311500020060-03 0.039 0.619 0.070 0.041 0.073
311500020060-04 0.031 0.641 0.091 0.053 0.076
311500020060-05 0.031 0.663 0.083 0.050 0.073
All 0.033 0.624 0.078 0.046 0.073
‡ Non-detects were averaged at the detection limit
Chlorophyll-a TMDLs for Rocky and Tom Steed Lakes Pollutant Source Assessment
3-1 FINAL
September 2011
SECTION 3 POLLUTANT SOURCE ASSESSMENT
This section includes an assessment of the known and suspected sources of nutrients
contributing to the eutrophication of Rocky Lake and Tom Steed Lake. Nutrient sources
identified are categorized and quantified to the extent that reliable information is available.
Generally, nutrient loadings causing eutrophication of lakes originate from point or nonpoint
sources of pollution. Point sources are permitted through the NPDES program. Nonpoint
sources are diffuse sources that typically cannot be identified as entering a waterbody through a
discrete conveyance at a single location. Nonpoint sources may emanate from land activities
that contribute nutrient loads to surface water as a result of rainfall runoff. For the TMDLs in
this report, all sources of pollutant loading not regulated by NPDES are considered nonpoint
sources. The following discussion provides a general summary of the point and nonpoint
sources of nutrients emanating from the contributing watersheds of each lake.
3.1 Assessment of Point Sources
Under 40 CFR §122.2, a point source is described as a discernable, confined, and discrete
conveyance from which pollutants are or may be discharged to surface waters. NPDES-
permitted facilities classified as point sources that may contribute nutrient loading include:
NPDES municipal wastewater treatment plant (WWTP) discharges;
NPDES industrial WWTP discharges;
NPDES municipal no-discharge WWTPs;
NPDES concentrated animal feeding operations (CAFOs);
NPDES municipal separate storm sewer system discharges;
Of these five types of facilities only one type occurs within Rocky Lake and Tom Steed
watersheds – municipal no-discharge WWTPs. Therefore there are no point sources
discharging to the lakes or the tributaries of each lake within the Study Area. The no-discharge
facilities permitted within each watershed are listed in Table 3-1 and their location is shown in
Figures 3-1 and 3-2. For the purposes of these TMDLs, no-discharge facilities are not
considered a source of nutrient loading. It is possible that the wastewater collection system
associated with no-discharge facilities could be a source of nutrient loading, or that discharges
from the wastewater plant may occur during large rainfall events that exceed the systems’
storage capacities. These types of unauthorized discharges are typically reported as sanitary
sewer overflows. However, the facilities in Table 3-1 have not reported a sanitary sewer
overflow since 2000. Furthermore, given the small size of the wastewater collection systems of
these no-discharge facilities the contributions of nutrient loads would be negligible.

Chlorophyll-a TMDLs for Rocky and Tom Steed Lakes Pollutant Source Assessment
3-2 FINAL
September 2011
Table 3-1 NPDES No-Discharge Facilities in the Study Area
Facility Facility
ID County Facility Type Type
Waterbody ID and Name
Burns Flat-North Lagoon
10809 Washita Lagoon Total Retention
Municipal Rocky (Hobart) Lake
OK311500030060_00
Clinton-Sherman Industrial Airpark
11506† Washita
Lagoon Total Retention
Municipal Rocky (Hobart) Lake
OK311500030060_00
Dill City WWTF 11507 Washita Lagoon Total Retention
Municipal Rocky (Hobart) Lake
OK311500030060_00
Roosevelt WWTF
11511 Kiowa Lagoon Total Retention
Municipal Tom Steed Lake OK311500020060_00
† Until 2002, this facility discharged wastewater under NPDES permit OK0027031
3.2 Assessment of Nonpoint Sources
As previously stated, there are no point source discharges in the Study Area; therefore all
of the nutrient loading to each lake originates from nonpoint sources. Nonpoint sources include
those sources that cannot be identified as entering the waterbody at a specific location. The
relatively homogeneous land use/land cover categories throughout the Study Area associated
with agricultural and forest and range management activities have a strong influence on the
origin and pathways of nutrient sources to surface water. Nutrient sources in rural watersheds
originate from soil erosion, agricultural fertilization, residues from mowing and harvesting, and
fecal waste deposited in the watershed by livestock. Causes of soil erosion can include natural
causes such as flooding and winds, construction activities, vehicular traffic, and agricultural
activities. Other sources of nutrient loading in a watershed include atmospheric deposition,
failing onsite wastewater disposal (OSWD) systems, and fecal waste deposited in the watershed
by wildlife and pets. The following sections provide general information on nonpoint sources
contributing nutrient loading within the Study Area.
3.2.1 SWAT Model Development for Nonpoint Sources Loadings
Given the lack of instream water quality data and pollutant source data available to
quantify nutrient and sediment loading directly from the tributaries of Rocky Lake and Tom
Steed Lake, a watershed loading model – the Soil and Water Assessment Tool (SWAT) – was
used to develop nonpoint source loading estimates. These estimates from SWAT were used to
quantify the nutrient contributions to each lake. SWAT is a basin-scale watershed model that
can be operated on a daily time step (Neitsch et al. 2005). SWAT is designed to predict the
impact of management strategies on water, nutrient, sediment, and agricultural chemical yields.
The model is physically (and empirically) based, computationally efficient, and capable of
continuous simulation over long time periods. The major components of the model include
weather, hydrology, soil temperature and properties, plant growth, nutrients, and land
management. The development and calibration of the SWAT model is described in detail in
the report Technical Methods Summary for Watershed and Water Quality Modeling of Sensitive
Water Supply Lakes in Oklahoma (Parsons 2010). A summary of the SWAT modeling of
nonpoint sources is provided below.

Chlorophyll-a TMDLs for Rocky and Tom Steed Lakes Pollutant Source Assessment
3-3 FINAL
September 2011
Figure 3-1 NPDES No-Discharge Facilities in Rocky Lake Watershed
Chlorophyll-a TMDLs for Rocky and Tom Steed Lakes Pollutant Source Assessment
3-4 FINAL
September 2011
Figure 3-2 NPDES No-Discharge Facilities in Tom Steed Lake Watershed
Chlorophyll-a TMDLs for Rocky and Tom Steed Lakes Pollutant Source Assessment
3-5 FINAL
September 2011
There are no stream flow or water quality monitoring stations in the tributaries to Rocky
Lake or Tom Steed Lake. In order to calibrate the SWAT model it was necessary to extend the
modeled area to encompass watersheds with stream flow gages and nutrient concentration
measurements. Thus, the SWAT model simulated an entire USGS hydrologic unit 11120303
(Lower North Fork of the Red River Basin), a 1,390 square mile area that includes the
contributing watersheds of both Rocky Lake and Tom Steed Lake (Figure 3-3). The main
streams located in the model domain are the North Fork of the Red River, Elk Creek, Otter
Creek, Stinking Creek, Little Elk Creek (the main tributary to Rocky Lake), and West Otter
Creek (the main tributary to Tom Steed Lake). The watershed is predominantly rural and
agricultural with a few urban centers including Altus, Elk City, Hobart, and Snyder. The
modeled area was split into 70 sub-watersheds (Figure 3-3) based on the National Elevation
Dataset (http://ned.usgs.gov) and the National Hydrography Dataset (http://nhd.usgs.gov) of the
USGS. The watersheds of Rocky Lake and Tom Steed Lake were two of the subwatersheds
simulated in SWAT, and are outlined in black in Figure 3-3. This figure also shows the
locations of USGS gages and water quality monitoring stations at which the SWAT model was
calibrated.
Soil data were derived from the STATSGO State Soil Geographic Database of the United
States Department of Agriculture (USDA) Natural Resource Conservation Service
(http://soils.usda.gov/survey/geography/statsgo/). Land use and land cover data were derived
from the 2001 National Land Cover Dataset (http://www.mrlc.gov/nlcd.php) (USGS 2007).
Data on the acreage of crops harvested at a county level were obtained from the 2007 Census of
Agriculture (http://www.nass.usda.gov/ Statistics_by_State/ Oklahoma/index.asp). County-
level summaries of annual cattle population estimates from the National Agricultural Statistics
Service were evenly distributed across pasture land. Soil phosphorus concentrations were the
county averages for the period 1994 to 2001 from the Oklahoma State University Department
of Plant and Soil Science (Storm et al, 2000).
Point source discharges of pollutants in the modeled HUC 11120303 watershed were
included in the SWAT model, using discharge monitoring reports (DMR) to indicate flows and
loads. CAFOs were not included in the SWAT model, given the insignificant contributions
from the two no-discharge concentrated animal feeding operation (CAFO) facilities located in
the modeled hydrologic unit. OSWD systems (septic systems) were also not included in the
SWAT model. Using data from the 1990 census to estimate a density of household with
OSWDs, there were 2,662 OSWD systems within the simulated watershed. Of these,
approximately 107 OSWDs were estimated to lie within the Rocky Creek watershed, and 146
within the watershed of Tom Steed Lake. More recent OSWD data are not available. Because
the areas with the highest density of septic systems are close to urban developments that
currently have a permitted WWTP (e.g. City of Ada and City of Elk City), it was assumed that
about half of the properties that utilized OSWDs for wastewater disposal in 1990 have since
connected to municipal sewer collection systems. Using an 8% rate of OSWD systems
malfunctioning derived from a 2001 study by Reed, Stowe & Yanke, LLC done in the Texas
panhandle, a total of 106 systems are assumed to be malfunctioning and leaking wastewater to
the modeled watershed (Reed, Stowe & Yanke LLC 2001). Using the same calculations, only 4
of those malfunctioning OSWD systems would be present in the Rocky Lake watershed, and 6
in the watershed of Tom Steed Lake. Because the estimated number of malfunctioning OSWD
systems is insignificant, nutrient loadings from these systems were not included in the SWAT
model.
Chlorophyll-a TMDLs for Rocky and Tom Steed Lakes Pollutant Source Assessment
3-6 FINAL
September 2011
Figure 3-3 Subwatersheds Simulated in the SWAT Watershed Model
Chlorophyll-a TMDLs for Rocky and Tom Steed Lakes Pollutant Source Assessment
3-7 FINAL
September 2011
A fifteen year period (1994 - 2008) was simulated in the SWAT model. However, the first
four years were considered a “spin-up” period for stabilizing model initial conditions, and the
model output consisted of only the latter 11 years (1998 - 2008). The variables simulated in
SWAT included flow, organic phosphorus, mineral ortho-phosphorus, organic nitrogen,
ammonia nitrogen, nitrate nitrogen, nitrite nitrogen, and total suspended solids.
The SWAT hydrologic calibration was primarily performed based on flow data available at
the USGS gages (Figure 3-3) located on the North Fork Red River near Tipton (0730728) and
Otter Creek near Snyder (07307010). The primary calibration targets included annual water
balances, but modeled monthly flows (Figure 3-4) and the resulting flow duration curves were
also compared to measured values. Overall, the model reproduces the annual flows within the
15 percent target for most years, with overall errors for the calibration and validation periods
well below the target (-5% for North Fork Red River and <1% for Otter Creek). Resulting
Nash-Sutcliffe Efficiency coefficients (NSE) and correlation coefficient (r2) values were 0.860
and 0.861 for North Fork Red River and 0.939 and 0.943 for Otter Creek. Both of those two
coefficients are above the minimum targets of 0.5 for NSE and 0.6 for r2, indicating very good
model performance.
After hydrologic calibration, the SWAT-predicted nutrient concentrations were compared
to the average measured nutrient concentrations at the two water quality stations where they
were available (Figure 3-3): Elk Creek near Hobart (OK311500030010-001AT) and the North
Fork Red River near Headrick (OK311500010020-001AT). In most cases, the SWAT model
reproduced the average nutrient concentrations within 20 percent of the measured averages
(Figure 3-5). In some instances, the model does not replicate speciation for a given period, but
nevertheless the total phosphorus and nitrogen predicted averages are within target for both the
calibration and verification periods. Overall (calibration+validation), the model reproduces the
average concentrations of all nutrients within 20 percent of the observed averages. However, it
is noted that the monitoring data available for calibration are from low to moderate flow
conditions. As a result, there is more uncertainty on high flow loading values.
3.2.2 Estimated Nutrient Loading from Nonpoint Sources
The SWAT modeling was used to estimate nutrient loads from land management activities
such as soil erosion, agricultural fertilization, residues from mowing and harvesting, and fecal
waste deposited in the field by livestock. Nutrient loading associated with atmospheric
deposition is incorporated into the lake model BATHTUB (see Section 4). Fecal waste
deposited in the watershed by wildlife and pets is not considered to be a significant source of
nutrient loading in either watershed so it was not quantified as model input.
Based on the calibrated SWAT model, average loads of nutrients from each of the
individual subwatersheds were estimated for the period 1998 to 2008. For comparative
purposes, the phosphorus and nitrogen loads are expressed on an areal basis in kilograms per
hectare per year (kg/ha/yr) in Figures 3-6 and 3-7. Results for other nutrients are provided in
Technical Methods Summary for Watershed and Water Quality Modeling of Sensitive Water
Supply Lakes in Oklahoma (Parsons 2010). The average daily flows and loads into Rocky Lake
and Tom Steed Lake are displayed in Table 3-2. Under current conditions, Rocky Lake is
estimated to receive a total annual load of 38,000 kg of phosphorus and 62,000 kg of nitrogen,
on average, from nonpoint sources in its watershed. Tom Steed Lake is estimated to receive a

Chlorophyll-a TMDLs for Rocky and Tom Steed Lakes Pollutant Source Assessment
3-8 FINAL
September 2011
total annual load of 68,600 kg of phosphorus and 116,400 kg of nitrogen, on average, from
nonpoint sources in its watershed.
Figure 3-4 Observed and SWAT Modeled Average Monthly Flows
0
10
20
30
40
50
60
70
80
Jan-98 Jan-99 Jan-00 Dec-00 Dec-01 Dec-02 Dec-03 Dec-04 Dec-05 Dec-06 Dec-07 Dec-08
Mo
nth
ly A
vera
ge F
low
(m
3/s
)
Date
USGS Gage 07307028 (Subbasin 63)
Observed
Modeled
ValidationCalibration
0
2
4
6
8
10
12
14
16
Jan-98 Jan-99 Jan-00 Dec-00 Dec-01 Dec-02 Dec-03 Dec-04 Dec-05 Dec-06 Dec-07 Dec-08
Mo
nth
ly A
vera
ge F
low
(m
3/s
)
Date
USGS Gage 07307010 (Subbasin 53)
Observed
ModeledValidationCalibration

Chlorophyll-a TMDLs for Rocky and Tom Steed Lakes Pollutant Source Assessment
3-9 FINAL
September 2011
Figure 3-5 Observed and SWAT Modeled Nutrient Concentrations
OrgP = organic phosphorus; PO4 = mineral phosphate phosphorus; TP = total phosphorus; OrgN = organic nitrogen; NH4
= ammonia nitrogen; NOx = nitrate+nitrite nitrogen
0.0
0.2
0.4
0.6
0.8
1.0
1.2
1.4
1.6
1.8
2.0
OrgP PO4 TP OrgN NH4 NOx TN
Ave
rage
Co
nce
ntr
atio
n (
mg/
L)
Parameter
Subbasin 26 - Elk Creek near Hobart
Observed
Modeled
0.0
0.2
0.4
0.6
0.8
1.0
1.2
1.4
OrgP PO4 TP OrgN NH4 NOx TN
Ave
rage
Co
nce
ntr
atio
n (
mg/
L)
Parameter
Subbasin 51 - North Fork Red River near Headrick
Observed
Modeled

Chlorophyll-a TMDLs for Rocky and Tom Steed Lakes Pollutant Source Assessment
3-10 FINAL
September 2011
Table 3-2 Average Flows and Nutrient Loads Discharging to Rocky Lake and Tom
Steed Lake
Parameter Rocky Lake
Tom Steed Lake
Watershed Size (square miles) 55 119
Flow (m3/day) 3.97 x 10
4 1.20 x 10
5
Organic Phosphorus (kg/year) 14,600 14,600
Mineral Ortho-Phosphorus (kg/year) 23,400 54,000
Total Phosphorus (kg/year) 38,000 68,600
Organic Nitrogen (kg/year) 24,500 50,000
Ammonia Nitrogen (kg/year) 10,200 33,200
Nitrite Nitrogen (kg/year) 700 5,100
Nitrate Nitrogen (kg/year) 26,600 28,100
Total Nitrogen (kg/year) 62,000 116,400
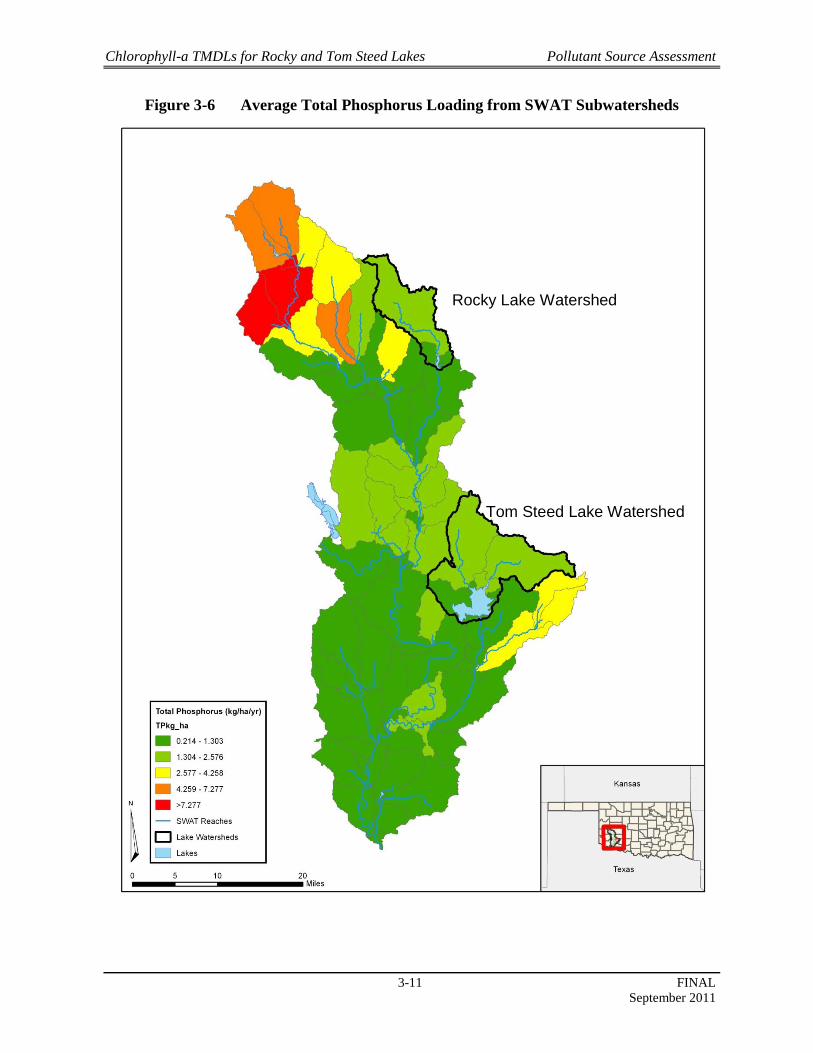
Chlorophyll-a TMDLs for Rocky and Tom Steed Lakes Pollutant Source Assessment
3-11 FINAL
September 2011
Figure 3-6 Average Total Phosphorus Loading from SWAT Subwatersheds
Rocky Lake Watershed
Tom Steed Lake Watershed

Chlorophyll-a TMDLs for Rocky and Tom Steed Lakes Pollutant Source Assessment
3-12 FINAL
September 2011
Figure 3-7 Average Total Nitrogen Loading from SWAT Subwatersheds
Rocky Lake Watershed
Tom Steed Lake Watershed
Chlorophyll-a TMDLs for Rocky and Tom Steed Lakes Technical Approach and Methods
4-1 FINAL
September 2011
SECTION 4 TECHNICAL APPROACH AND METHODS
The objective of a TMDL is to estimate allowable pollutant loads and to allocate these
loads to the known pollutant sources in the watershed so appropriate control measures can be
implemented and the WQS achieved. In order to ascertain the effect of management measures
on in-lake water quality, it is necessary to establish a linkage between the external loading of
nutrients and the waterbody response in terms of lake water quality conditions, as evaluated by
chlorophyll-a concentrations. This section describes the water quality analysis of the linkage
between chlorophyll-a levels in Rocky Lake and Tom Steed Lake and the nutrient loadings
from their watersheds.
The report Technical Methods Summary for Watershed and Water Quality Modeling of
Sensitive Water Supply Lakes in Oklahoma (Parsons 2010) provides a thorough description of
the water quality modeling analysis. The sections below summarize the inputs and results of
that modeling.
4.1 BATHTUB Model Description
The water quality linkage analysis was performed using the BATHTUB model (Walker
1986). BATHTUB is a U.S. Army Corps of Engineers model designed to simulate
eutrophication in reservoirs and lakes. BATHTUB has been cited as an effective tool for
reservoir and lake water quality assessment and management, particularly where data are
limited. The model incorporates several empirical equations of nutrient settling and algal
growth to predict steady-state water column nutrient and chlorophyll-a concentrations based on
water body characteristics, hydraulic characteristics, and external nutrient loadings.
BATHTUB predicts steady-state concentrations of chlorophyll-a, total phosphorus, total
nitrogen, water transparency, and a conservative substance (e.g., chloride or a dye tracer) in a
water body under various hydrologic and loading conditions. To do this, the model requires
inputs that describe the physical characteristics of each lake (e.g., depth, surface area), tributary
flow rates and loadings (which can be estimated by BATHTUB or input from another model),
and observed water quality concentrations to use as calibration targets.
4.2 BATHTUB Model Setup and Input Data
The model was run under average, steady-state conditions.
Lake Morphometry. BATHTUB allows the user to segment a lake into a hydraulic
network. However, significant lake morphometry data is required to justify the complex
assumptions inherent in partitioning a reservoir into multiple hydraulically linked segments. A
single segment was deemed applicable for both reservoirs which are considered relatively well-
mixed horizontally. Bathymetric data for Tom Steed Lake was available through the U.S.
Bureau of Reclamation; however no morphometric data is available for Rocky Lake.
Therefore, for the purposes of this study and given the narrow, shallow characteristics of Rocky
Lake, a well-mixed lake of oblong shape was assumed. Based on availability of both flow and
water quality data, for the purposes of TMDL development, a single segment was determined
as sufficient for both lakes. In addition, an averaging period of one year was used to depict the
duration of mass-balance calculations (e.g., a single filling and emptying event in a year) for
Chlorophyll-a TMDLs for Rocky and Tom Steed Lakes Technical Approach and Methods
4-2 FINAL
September 2011
both lakes. Lake characteristics are provided in Table 4-1, based on the lake’s size when the
conservation pool is full.
Table 4-1 Lake Morphometric Characteristics
Lake Lake Volume (m3) Surface Area (km
2)
Mean Depth (m)
Tom Steed Lake 120,000,000 25.9 4.63
Rocky Lake 3,784,000 1.376 2.75
Meteorology. The BATHTUB model requires both precipitation and evaporation data.
Precipitation data are available from the Oklahoma MESONET system and were provided in
Section 1.2. Water surface evaporation rates in Oklahoma have been reported by the Oklahoma
Water Resources Board to vary from 48 inches per year in the eastern part of the state to 65
inches per year in the southwest (http://www.owrb.ok.gov/util/waterfact.php). A rate of 65
inches per year was applied for both Tom Steed Lake and Rocky Lakes due to their location in
the southwest corner of the state.
Inflows and Loads. Key water quality parameters for BATHTUB input include total
phosphorus, inorganic ortho-phosphorus, total nitrogen, and inorganic nitrogen. Output from
the SWAT model, described in Section 3.2, was the primary source of data inputs to the
BATHTUB model. Although SWAT can provide daily output, BATHTUB is a steady-state
model and not appropriate for interpreting short-term responses of lakes to nutrients. Therefore,
the long-term average annual loads from the SWAT modeled period were applied as inputs to
BATHTUB.
BATHTUB also requires an estimate of atmospheric deposition of total and inorganic
nitrogen and phosphorus. Atmospheric deposition can contribute a significant amount of
phosphorus and nitrogen directly to a lake surface when the ratio of watershed area to lake
surface area is low. Atmospheric deposition measurements from site OK17 (Kessler Farm Field
Laboratory, in McClain County) of the National Atmospheric Deposition Program
(http://nadp.sws.uiuc.edu/) were used. Table 4-2 summarizes the estimate of atmospheric loads
based on the data compiled from site OK17 for the period 1983-2010. These loads are
insignificant when compared to the loads from the watersheds.
Table 4-2 Estimate of Atmospheric Loads
Atmospheric Loads
Areal Mean (mg/m
2-yr)
Estimated Load to Rocky Lake
(kg/year)
Estimated Load to Tom Steed Lake
(kg/year) CV
Total Nitrogen 1127 1.55 29.2 0.2
Inorganic Nitrogen 200 0.28 5.2 0.5
Empirical equations. BATHTUB consists of a series of empirical equations that have
been calibrated and tested for lake application. These empirical relationships are used to
calculate steady-state concentrations of total phosphorus, total nitrogen, chlorophyll-a, and
transparency based on the inputs and forcing functions. To predict each output (e.g., total
phosphorus concentration), one of several built-in empirical equations must be selected. The
BATHTUB model was run using the following options:

Chlorophyll-a TMDLs for Rocky and Tom Steed Lakes Technical Approach and Methods
4-3 FINAL
September 2011
Phosphorus and Nitrogen balance: second-order decay rate function
Chlorophyll-a: phosphorus, nitrogen, light, flushing
Water transparency: Secchi vs. chlorophyll-a and turbidity
4.3 BATHTUB Model Calibrations and Output
The model was run under average existing conditions, and calibrated to measured in-lake
water quality conditions for the period of record of the available sampling data using
phosphorus and nitrogen calibration factors. Table 4-3 includes the calibration factors used for
both lakes.
Table 4-3 Calibration Factors Used for Lakes
Calibration Factor Rocky Lake Tom Steed Lake
Total Phosphorus 0.95 3.6
Total Nitrogen 2.07 20
Chlorophyll-a 1.95 1.65
Secchi Disk 1 1
The model-predicted concentrations of total nitrogen, total phosphorus, chlorophyll-a, and
Secchi depth under existing average conditions are compared to average measured
concentrations from each lake in Table 4-4. The measured average values are derived from the
available water quality data set provided in Appendix B.
Table 4-4 Model Predicted and Measured Water Quality Parameter Concentrations
Water Quality Parameter
Rocky Lake Tom Steed Lake
Modeled Measured (average)
Modeled Measured
(average)
Total Phosphorus (mg/L) 0.130 0.133 0.070 0.073
Total Nitrogen (mg/L) 1.45 1.51 0.740 0.703
Chlorophyll-a (µg/L) 44.9 43.0 16.6 23.1
Secchi depth (meters) 0.30 0.29 0.40 0.38
4.4 Modeled Load Reduction Scenarios
Simulations were performed using the BATHTUB model to evaluate the effect of loading
reductions on chlorophyll-a levels. The simulations indicated that the water quality target of 10
µg/L chlorophyll-a as a long-term average concentration could be achieved if the total nitrogen
and phosphorus loads to Rocky Lake were reduced by 87% from the existing loads, to 8,000
kg/year of total nitrogen and 5,000 kg/year of total phosphorus. In Tom Steed Lake, the water
quality target of 10 µg/L chlorophyll-a could be achieved if the total nitrogen and phosphorus
loads were reduced by 65% from existing loading, to 41,000 kg/year of total nitrogen and

Chlorophyll-a TMDLs for Rocky and Tom Steed Lakes Technical Approach and Methods
4-4 FINAL
September 2011
24,000 kg/year of total phosphorus. Table 4-5 summarizes the percent reduction goals for
nutrient loading established for each lake. In addition to these maximum allowable loads, an
explicit margin of safety of 10 percent places further limits on loading of both nitrogen and
phosphorus.
Table 4-5 Total Phosphorus and Nitrogen Load Reductions to Meet a 10 µg/L
Chlorophyll-a In-lake Water Quality Target
Rocky Lake
Tom Steed Lake
Maximum Allowable Load of Total Phosphorus (kg/year)
5,000 24,000
Maximum Allowable Load of Total Nitrogen (kg/year)
8,000 41,000
% Reduction 87% 65%
Eutrophication is one of the leading causes of pollution in lakes and reservoirs throughout
the world (Smith 2003). Therefore, determining which nutrients limit phytoplankton growth is
an important step in the development of effective lake and watershed management strategies
(Dodds and Priscu 1990; Elser et al. 1990; Smith et al. 2002). It is often assumed that algal
productivity of most freshwater lakes and reservoirs is primarily limited by the availability of
the nutrient phosphorus. Therefore, limits on phosphorus loading to lakes are sometimes
considered a necessary, and typically sufficient, mechanism to reduce eutrophication.
However, more recent studies in reservoirs indicate that both nitrogen and phosphorus play key
roles, along with light, mixing conditions, predation by zooplankton, and residence time, in
limiting algal growth (Kimmel et al., 1990). In a study of 19 Kansas reservoirs, Dzialowski et
al. (2005) utilized bioassays to measure algal growth limitation, and found that phytoplankton
growth substantially increased with phosphorus addition (implying that phosphorus alone
limited growth) in only 8% of the bioassays. Nitrogen was the sole limiting nutrient in 16% of
the bioassays. In 67% of the bioassays, significant algal growth did not occur upon addition of
nitrogen or phosphorus singly, but did grow in response to addition of both nitrogen and
phosphorus. In these systems, algal growth was considered to be co-limited by availability of
phosphorus and nitrogen. Co-limitation by nitrogen and phosphorus was also reported to be the
most common condition for two lakes in north Texas (Chrzanowski and Grover 2001). In some
cases, growth limitation by phosphorus has been observed to be more common in the spring,
followed by a shift to nitrogen limitation in the summer and fall.
Figures 4-1 and 4-2 display summary plots of multiple combinations of N and P
concentrations and percent reductions that result in 10 µg/L chlorophyll-a estimated by
BATHTUB. While the relative importance of nitrogen and phosphorus in limiting algal
productivity in Tom Steed and Rocky Lakes has not been established, this TMDL calculates
load allocations for both nitrogen and phosphorus as a conservative approach to ensure that
water quality targets are met. While the BATHTUB model is capable of simulating
chlorophyll-a concentrations from both P and N concentrations, it is an empirically derived
statistical algorithm that does not include the concept of a limiting nutrient. In other words,
chlorophyll-a concentrations are a continuous function of both N and P contributions which can
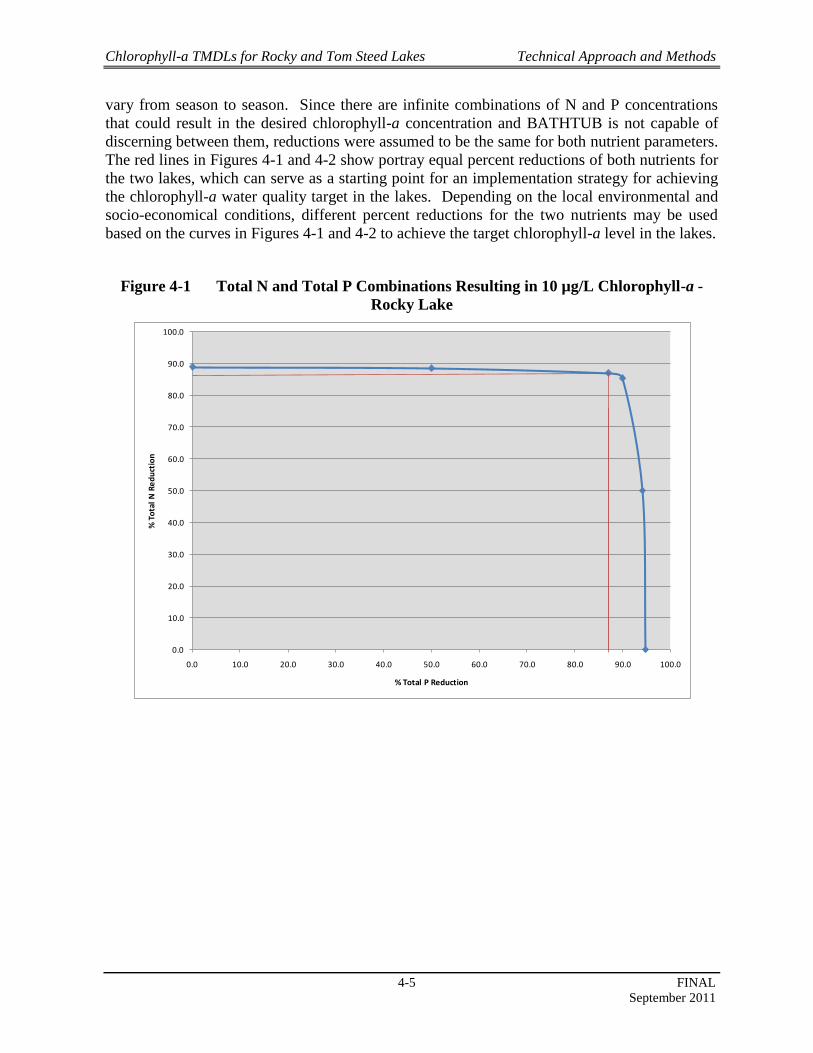
Chlorophyll-a TMDLs for Rocky and Tom Steed Lakes Technical Approach and Methods
4-5 FINAL
September 2011
vary from season to season. Since there are infinite combinations of N and P concentrations
that could result in the desired chlorophyll-a concentration and BATHTUB is not capable of
discerning between them, reductions were assumed to be the same for both nutrient parameters.
The red lines in Figures 4-1 and 4-2 show portray equal percent reductions of both nutrients for
the two lakes, which can serve as a starting point for an implementation strategy for achieving
the chlorophyll-a water quality target in the lakes. Depending on the local environmental and
socio-economical conditions, different percent reductions for the two nutrients may be used
based on the curves in Figures 4-1 and 4-2 to achieve the target chlorophyll-a level in the lakes.
Figure 4-1 Total N and Total P Combinations Resulting in 10 µg/L Chlorophyll-a -
Rocky Lake
0.0
10.0
20.0
30.0
40.0
50.0
60.0
70.0
80.0
90.0
100.0
0.0 10.0 20.0 30.0 40.0 50.0 60.0 70.0 80.0 90.0 100.0
% T
ota
l N
Re
du
ctio
n
% Total P Reduction
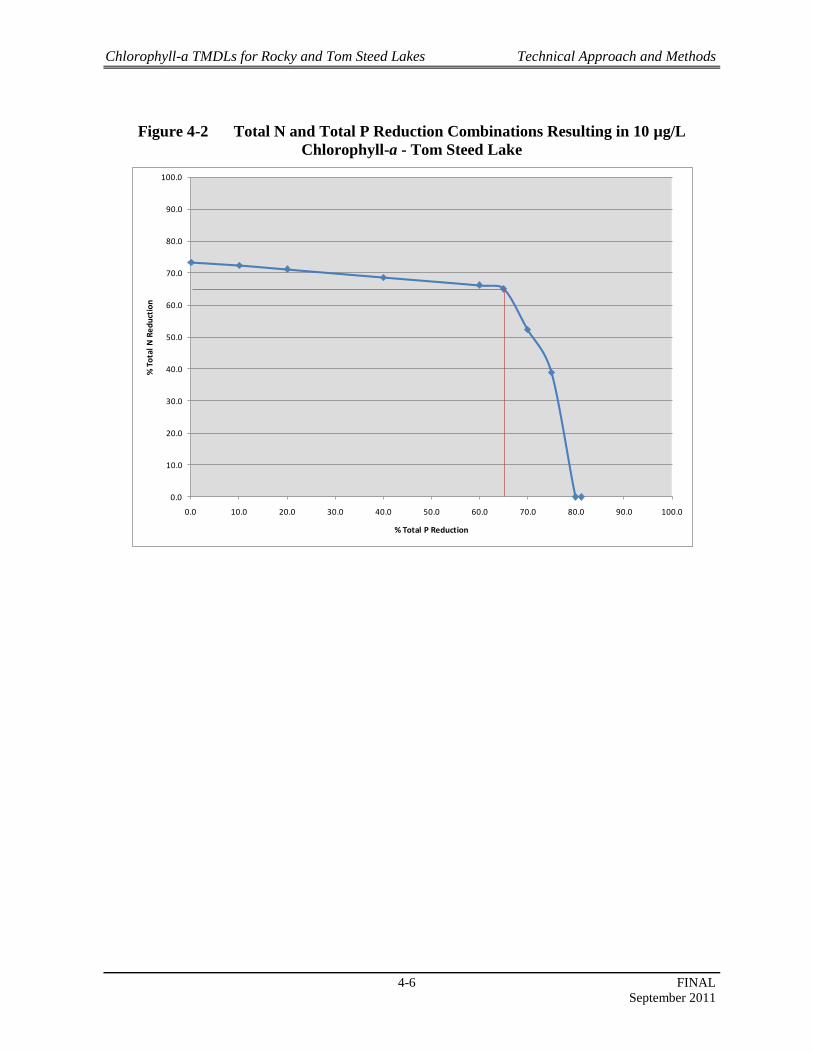
Chlorophyll-a TMDLs for Rocky and Tom Steed Lakes Technical Approach and Methods
4-6 FINAL
September 2011
Figure 4-2 Total N and Total P Reduction Combinations Resulting in 10 µg/L
Chlorophyll-a - Tom Steed Lake
0.0
10.0
20.0
30.0
40.0
50.0
60.0
70.0
80.0
90.0
100.0
0.0 10.0 20.0 30.0 40.0 50.0 60.0 70.0 80.0 90.0 100.0
% T
ota
l N
Re
du
ctio
n
% Total P Reduction
Chlorophyll-a TMDLs for Rocky and Tom Steed Lakes TMDLs and Load Allocations
5-1 FINAL
September 2011
SECTION 5 TMDLS AND LOAD ALLOCATIONS
Models were used to calculate and express TMDLs for each lake as annual average
phosphorus and nitrogen loads (kg/yr) that, if achieved, should meet the water quality target
established for chlorophyll-a.
5.1 Wasteload Allocation
There are no point sources of wastewater discharging to Rocky Lake or Tom Steed Lake or
their tributaries. Furthermore, Oklahoma’s implementation of WQS (OAC 785:46-13-4)
prohibits new point source discharges to these lakes, excepting stormwater with approval from
ODEQ. “New point source discharges of any pollutant after June 11, 1989, and increased load
of any specified pollutant from any point source discharge existing as of June 11, 1989, shall
be prohibited in any waterbody or watershed designated in Appendix A of OAC 785:45 with the
limitation "SWS". Thus, the wasteload allocations for the two waterbodies are zero.
5.2 Load Allocation
The load allocation for all nonpoint sources to Rocky Lake was conservatively estimated
as 5,000 kg/yr of total phosphorus and 8,000 kg/yr of total nitrogen, representing an 87%
reduction from existing loading. Similarly, the load allocation for all nonpoint sources to Tom
Steed Lake was conservatively estimated based on modeling analysis as 24,000 kg/yr of total
phosphorus and 41,000 kg/yr of total nitrogen, representing a 65% reduction from existing
loading.
5.3 Seasonal Variability
Federal regulations (40 CFR §130.7(c)(1)) require that TMDLs account for seasonal
variation in watershed conditions and pollutant loading. The WQS for chlorophyll-a
specifically apply as a long-term average concentration (OAC 785:45-5-10(7)). Oklahoma
procedures to implement WQS (OAC 785:46-7-2) specify that the mean annual average
outflow represents the long term average flow in lakes. Seasonal variation was accounted for in
these TMDLs by using more than 5 years of water quality data collected in each of the four
seasons.
5.4 Margin of Safety
Federal regulations (40 CFR §130.7(c)(1)) require that TMDLs include a MOS. The MOS
is a conservative measure incorporated into the TMDL equation that accounts for the lack of
knowledge associated with calculating the allowable pollutant loading to ensure WQSs are
attained. USEPA guidance allows for use of implicit or explicit expressions of the MOS, or
both. When conservative assumptions are used in development of the TMDL, or conservative
factors are used in the calculations, the MOS is implicit. When a specific percentage of the
TMDL is set aside to account for the lack of knowledge, then the MOS is considered explicit.
These TMDLs include both an explicit and implicit MOS. The explicit MOS is 10%. The
implicit MOS is incorporated by the application of load reductions for both nitrogen and
phosphorus.

Chlorophyll-a TMDLs for Rocky and Tom Steed Lakes TMDLs and Load Allocations
5-2 FINAL
September 2011
At the outset of developing these TMDLs a method was developed to use Monte Carlo
analysis to investigate the uncertainty as an effective means to quantify an explicit MOS. This
approach works well and, toward that end, a Monte Carlo version of BATHTUB was refined
and applied (Parsons 2010). Although the BATHTUB model is available in the public domain,
the source code is not. As part of this TMDL development effort, to develop the Monte Carlo
version of BATHTUB, a separate code was created that encompasses the state equations
described in the BATHTUB documentation. During testing of the method, it was discovered
that, under certain circumstances, the Monte Carlo code and BATHTUB version 6.1 produce
different answers. DEQ will conduct further investigation with the U.S. Army Corps of
Engineers to try to determine the source of the differences. Until the computational differences
are reconciled within the BATHTUB model, DEQ will rely on an explicit MOS of 10% for
both lakes in addition to the implicit MOS derived from establishing TMDLs for both nitrogen
and phosphorus for each lake.
5.5 TMDL Calculations
A TMDL is expressed as the sum of all WLAs (point source loads), LAs (nonpoint source
loads), and an appropriate MOS, which attempts to account for the lack of knowledge
concerning the relationship between loading limitations and water quality. This definition can
be expressed by the following equation:
TMDL = Σ WLA + Σ LA + MOS
Load reduction scenario simulations were run using the BATHTUB model to calculate and
express the TMDL as annual average phosphorus and nitrogen loads (in kg/yr) that, if achieved,
should decrease chlorophyll-a concentrations to meet the water quality target. Given that
transport, assimilation, and dynamics of nutrients vary both temporally and spatially, nutrient
loading to both lakes from a practical perspective must be managed on a long-term basis
typically as pounds or kilograms per year. However, a recent court decision (Friends of the
Earth, Inc. v. EPA, et al., often referred to as the Anacostia decision) states that TMDLs must
include a daily load expression. It is important to recognize that the chlorophyll-a response to
nutrient loading in both Rocky Lake and Tom Steed Lake is affected by many factors such as:
internal lake nutrient loading, water residence time, wind action and the interaction between
light penetration, nutrients, sediment load and algal response. As such it is important to note
that expressing this TMDL in daily time steps does not imply a daily response to a daily load is
practical from an implementation perspective.
The USEPA’s Technical Support Document for Water Quality-Based Toxics Control
(USEPA 1991b) provides a statistical method for identifying a statistical maximum daily limit
that is based on a long-term average and considering variation in a dataset. The method is
represented by the following equation:
where MDL = maximum daily load
LTA = long-term average load
z = z statistic of the probability of occurrence (0.95 is used for this value)
σ2 = ln(CV
2+1)
CV = coefficient of variation
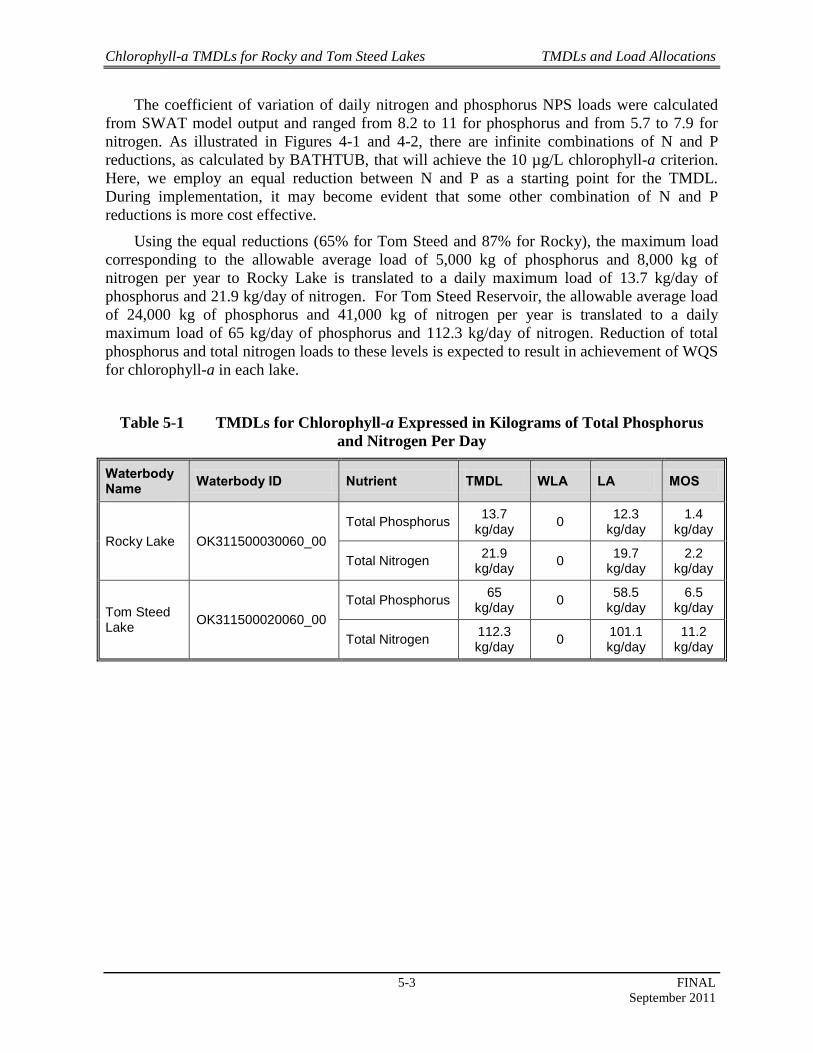
Chlorophyll-a TMDLs for Rocky and Tom Steed Lakes TMDLs and Load Allocations
5-3 FINAL
September 2011
The coefficient of variation of daily nitrogen and phosphorus NPS loads were calculated
from SWAT model output and ranged from 8.2 to 11 for phosphorus and from 5.7 to 7.9 for
nitrogen. As illustrated in Figures 4-1 and 4-2, there are infinite combinations of N and P
reductions, as calculated by BATHTUB, that will achieve the 10 µg/L chlorophyll-a criterion.
Here, we employ an equal reduction between N and P as a starting point for the TMDL.
During implementation, it may become evident that some other combination of N and P
reductions is more cost effective.
Using the equal reductions (65% for Tom Steed and 87% for Rocky), the maximum load
corresponding to the allowable average load of 5,000 kg of phosphorus and 8,000 kg of
nitrogen per year to Rocky Lake is translated to a daily maximum load of 13.7 kg/day of
phosphorus and 21.9 kg/day of nitrogen. For Tom Steed Reservoir, the allowable average load
of 24,000 kg of phosphorus and 41,000 kg of nitrogen per year is translated to a daily
maximum load of 65 kg/day of phosphorus and 112.3 kg/day of nitrogen. Reduction of total
phosphorus and total nitrogen loads to these levels is expected to result in achievement of WQS
for chlorophyll-a in each lake.
Table 5-1 TMDLs for Chlorophyll-a Expressed in Kilograms of Total Phosphorus
and Nitrogen Per Day
Waterbody Name
Waterbody ID Nutrient TMDL WLA LA MOS
Rocky Lake OK311500030060_00
Total Phosphorus 13.7
kg/day 0
12.3 kg/day
1.4 kg/day
Total Nitrogen 21.9
kg/day 0
19.7 kg/day
2.2 kg/day
Tom Steed Lake
OK311500020060_00
Total Phosphorus 65
kg/day 0
58.5 kg/day
6.5 kg/day
Total Nitrogen 112.3 kg/day
0 101.1 kg/day
11.2 kg/day

Chlorophyll-a TMDLs for Rocky and Tom Steed Lakes Public Participation
6-1 FINAL
September 2011
SECTION 6 PUBLIC PARTICIPATION
The Chlorophyll-a TMDL Report for Rocky and Tom Steed Lakes was sent to other related
governmental agencies for peer review and then submitted to EPA to be Preliminarily
Reviewed on June 16, 2011. EPA completed their review on July 7, 2011. On July 26, 2011 a
public notice about the Chlorophyll-a TMDL Report for Rocky and Tom Steed Lakes was sent
to all persons on the DEQ contact list either who have requested all notices or who live in the
watershed of interest. In addition, the public notice was posted on the DEQ webpage at
http://www.deq.state.ok.us/wqdnew/index.htm and sent to local newspapers and/or other
publications in the watershed area affected by this TMDL.
The public was given a 45-day opportunity to review the Chlorophyll-a TMDL Report for
Rocky and Tom Steed Lakes, submit comments to DEQ, and/or request a public meeting. The
public comment period ended on September 9, 2011. DEQ received one comment during the
public comment period. This written comment became a part of the record of this TMDL
report. The response to this comment can be found in Appendix C. No changes were made to
the Chlorophyll-a TMDL Report for Rocky and Tom Steed Lakes as a result of this comment.
There were no requests for a public meeting.
Chlorophyll a TMDLs for Rocky and Tom Steed Lakes References
7-1 FINAL
September 2011
SECTION 7 REFERENCES
Carlson, R.E. 1977. A Trophic State Index for Lakes. Limnology and Oceanography. 22:361-369.
Chrzanowski, T.H., and J.P. Grover. 2001. Effects of Mineral Nutrients on the Growth of Bacterio- and
Phytoplankton in Two Southern Reservoirs. Limnology and Oceanography 46(6): 1319-1330.
Dodds, W. K. and Priscu, J. C. (1990) A comparison of methods for assessment of nutrient deficiency of
phytoplankton in a large oligotrophic lake. Can. J. Fish. Aquat. Sci., 4, 2328–2338.Dzialowski,
A.R., S-H Wang, N-C Lim, W.W. Spotts, and D.G. Huggins. 2005. Nutrient Limitation of
Phytoplankton Growth in Central Plains Reservoirs, USA. J. Plankton Res. 27(60: 587-595.
Elser, J. J., Marzolf, E. R. and Goldman, C. R. (1990) Phosphorus and nitrogen limitation of
phytoplankton growth in the freshwaters of North America: a review and critique of
experimental enrichment. Can. J. Fish. Aquat. Sci., 47, 1468–1477.
Kimmel, B.L., O.T. Lind, and L.J. Paulson. 1990. Reservoir Primary Production. In Reservoir
Limnology: Ecological Perspectives. Thornton, K.W., B.L. Kimmel, and F.E. Payne, eds. Wiley-
Interscience: New York, NY.
Neitsch, S.L., J.G. Arnold, J.R. Kiniry, and J.R. Williams. 2005. Soil and Water Assessment Tool
Theoretical Documentation, Version 2005. Temple, TX: USDA-ARS Grassland, Soil and Water
Research Laboratory. Available at http://swatmodel.tamu.edu/media/1292/SWAT2005theory.pdf
Accessed June 28, 2010.
ODEQ 2008. Water Quality in Oklahoma, 2008 Integrated Report. 2008.
OWRB 2007. Oklahoma Water Resources Board. 2007 Report of the Oklahoma Beneficial Use
Monitoring Program. Lakes Report.
OWRB 2008. Oklahoma Water Resources Board. Implementation of Oklahoma's Water Quality
Standards. Title 785, Chapter 46. May 27, 2008.
OWRB 2009. Oklahoma Water Resources Board. 2008-2009 Oklahoma Lakes Report. Beneficial Use
Monitoring Program.
OWRB 2010. Oklahoma Water Resources Board. Oklahoma’s Water Quality Standards. Title 785,
Chapter 45. July 1, 2010.
Parsons. 2010. Technical Methods Summary for Watershed and Water Quality Modeling of
Sensitive Water Supply Lakes in Oklahoma. November 2010.
Reed, Stowe and Yanke, LLC 2001. Study to Determine the Magnitude of, and Reasons for, Chronically
Malfunctioning On-Site Sewage Facility Systems in Texas. September 2001.
Smith, V. H., Sieber-Denlinger, J., deNoyelles, F. et al. (2002) Managing taste and odor problems in a
eutrophic drinking water reservoir. J. Lake Reserv. Manage., 18, 319–323.
Smith, V. H. (2003) Eutrophication of freshwater and coastal marine ecosystems: a global problem.
Environ. Sci. Pollut. Res. Int., 10,126–139.
Storm, D.E., D. Gade, R. Tejral, M.D. Smolen, P. Kenkel, and M.S. Gregory. 2000. Estimating
Watershed Level Nonpoint Source Loading for the State of Oklahoma. Final Report. Accessed at
http://storm.okstate.edu/reports/vol_1&2_draft_okstate_nonpoint_loading_final_report_rev_4_p
df.zip
USBOR (United States Bureau of Reclamation) 2010. Accessed via Internet on May 24, 2010.
http://www.usbr.gov/projects/Project.jsp?proj_Name=Mountain%20Park%20Project
U.S. Census Bureau 2010. http://2010.census.gov/2010census/data/
Chlorophyll a TMDLs for Rocky and Tom Steed Lakes References
7-2 FINAL
September 2011
USEPA 1991a. Guidance for Water Quality-Based Decisions: The TMDL Process. Office of Water,
USEPA 440/4-91-001
USEPA 1991b. Technical Support Document for Water Quality-Based Toxics Control. Office of Water,
USEPA 505/2-90-001.
USEPA 2003. Guidance for 2004 Assessment, Listing and Reporting Requirements Pursuant to Sections
303(d) and 305(b) of the Clean Water Act, TMDL -01-03 - Diane Regas-- July 21, 2003.
USGS 2007. Multi-Resolution Land Characteristics Consortium. http://www.mrlc.gov/index.asp
Walker, W. W., 1986. Empirical Methods for Predicting Eutrophication in Impoundments; Report 3,
Phase III: Applications Manual. Technical Report E-81-9, U.S. Army Engineer Waterways
Experiment Station, Vicksburg, MS.
Woods, A.J., Omernik, J.M., Butler, D.R., Ford, J.G., Henley, J.E., Hoagland, B.W., Arndt, D.S., and
Moran, B.C., 2005. Ecoregions of Oklahoma (color poster with map, descriptive text, summary
tables, and photographs): Reston, Virginia, U.S. Geological Survey (map scale 1:1,250,000).
Chlorophyll-a TMDLs for Rocky and Tom Steed Lakes Appendix A
Appendix B-1 FINAL
September 2011
APPENDIX A
STATE OF OKLAHOMA ANTIDEGRADATION POLICY
Chlorophyll-a TMDLs for Rocky and Tom Steed Lakes Appendix A
Appendix B-2 FINAL
September 2011
Appendix A
State of Oklahoma Antidegradation Policy
785:45-3-1. Purpose; Antidegradation policy statement
(a) Waters of the state constitute a valuable resource and shall be protected, maintained
and improved for the benefit of all the citizens.
(b) It is the policy of the State of Oklahoma to protect all waters of the state from
degradation of water quality, as provided in OAC 785:45-3-2 and Subchapter 13 of
OAC 785:46.
785:45-3-2. Applications of antidegradation policy
(a) Application to outstanding resource waters (ORW). Certain waters of the state
constitute an outstanding resource or have exceptional recreational and/or ecological
significance. These waters include streams designated "Scenic River" or "ORW" in
Appendix A of this Chapter, and waters of the State located within watersheds of
Scenic Rivers. Additionally, these may include waters located within National and
State parks, forests, wilderness areas, wildlife management areas, and wildlife
refuges, and waters which contain species listed pursuant to the federal Endangered
Species Act as described in 785:45-5-25(c)(2)(A) and 785:46-13-6(c). No degradation
of water quality shall be allowed in these waters.
(b) Application to high quality waters (HQW). It is recognized that certain waters of the
state possess existing water quality which exceeds those levels necessary to support
propagation of fishes, shellfishes, wildlife, and recreation in and on the water. These
high quality waters shall be maintained and protected.
(c) Application to Sensitive Public and Private Water Supplies (SWS). It is recognized
that certain public and private water supplies possess conditions that make them more
susceptible to pollution events and require additional protection. These sensitive water
supplies shall be maintained and protected.
(d) Application to beneficial uses. No water quality degradation which will interfere with
the attainment or maintenance of an existing or designated beneficial use shall be
allowed.
(e) Application to improved waters. As the quality of any waters of the state improve, no
degradation of such improved waters shall be allowed.
785:46-13-1. Applicability and scope
(a) The rules in this Subchapter provide a framework for implementing the
antidegradation policy stated in OAC 785:45-3-2 for all waters of the state. This
policy and framework includes three tiers, or levels, of protection.
(b) The three tiers of protection are as follows:
(1) Tier 1. Attainment or maintenance of an existing or designated beneficial use.
(2) Tier 2. Maintenance or protection of High Quality Waters and Sensitive Public
and Private Water Supply waters.

Chlorophyll-a TMDLs for Rocky and Tom Steed Lakes Appendix A
Appendix B-3 FINAL
September 2011
(3) Tier 3. No degradation of water quality allowed in Outstanding Resource Waters.
(c) In addition to the three tiers of protection, this Subchapter provides rules to implement
the protection of waters in areas listed in Appendix B of OAC 785:45. Although
Appendix B areas are not mentioned in OAC 785:45-3-2, the framework for
protection of Appendix B areas is similar to the implementation framework for the
antidegradation policy.
(d) In circumstances where more than one beneficial use limitation exists for a
waterbody, the most protective limitation shall apply. For example, all antidegradation
policy implementation rules applicable to Tier 1 waterbodies shall be applicable also
to Tier 2 and Tier 3 waterbodies or areas, and implementation rules applicable to Tier
2 waterbodies shall be applicable also to Tier 3 waterbodies.
(e) Publicly owned treatment works may use design flow, mass loadings or concentration,
as appropriate, to calculate compliance with the increased loading requirements of this
section if those flows, loadings or concentrations were approved by the Oklahoma
Department of Environmental Quality as a portion of Oklahoma's Water Quality
Management Plan prior to the application of the ORW, HQW or SWS limitation.
785:46-13-2. Definitions
The following words and terms, when used in this Subchapter, shall have the following
meaning, unless the context clearly indicates otherwise:
"Specified pollutants" means
(A) Oxygen demanding substances, measured as Carbonaceous Biochemical Oxygen
Demand (CBOD) and/or Biochemical Oxygen Demand (BOD);
(B) Ammonia Nitrogen and/or Total Organic Nitrogen;
(C) Phosphorus;
(D) Total Suspended Solids (TSS); and
(E) Such other substances as may be determined by the Oklahoma Water Resources
Board or the permitting authority.
785:46-13-3. Tier 1 protection; attainment or maintenance of an existing or designated
beneficial use
(a) General.
(1) Beneficial uses which are existing or designated shall be maintained and
protected.
(2) The process of issuing permits for discharges to waters of the state is one of
several means employed by governmental agencies and affected persons which
are designed to attain or maintain beneficial uses which have been designated
for those waters. For example, Subchapters 3, 5, 7, 9 and 11 of this Chapter are
rules for the permitting process. As such, the latter Subchapters not only
implement numerical and narrative criteria, but also implement Tier 1 of the
antidegradation policy.
Chlorophyll-a TMDLs for Rocky and Tom Steed Lakes Appendix A
Appendix B-4 FINAL
September 2011
(b) Thermal pollution. Thermal pollution shall be prohibited in all waters of the state.
Temperatures greater than 52 degrees Centigrade shall constitute thermal pollution
and shall be prohibited in all waters of the state.
(c) Prohibition against degradation of improved waters. As the quality of any waters of
the state improves, no degradation of such improved waters shall be allowed.
785:46-13-4. Tier 2 protection; maintenance and protection of High Quality Waters and
Sensitive Water Supplies
(a) General rules for High Quality Waters. New point source discharges of any pollutant
after June 11, 1989, and increased load or concentration of any specified pollutant
from any point source discharge existing as of June 11, 1989, shall be prohibited in
any waterbody or watershed designated in Appendix A of OAC 785:45 with the
limitation "HQW". Any discharge of any pollutant to a waterbody designated "HQW"
which would, if it occurred, lower existing water quality shall be prohibited. Provided
however, new point source discharges or increased load or concentration of any
specified pollutant from a discharge existing as of June 11, 1989, may be approved by
the permitting authority in circumstances where the discharger demonstrates to the
satisfaction of the permitting authority that such new discharge or increased load or
concentration would result in maintaining or improving the level of water quality
which exceeds that necessary to support recreation and propagation of fishes,
shellfishes, and wildlife in the receiving water.
(b) General rules for Sensitive Public and Private Water Supplies. New point source
discharges of any pollutant after June 11, 1989, and increased load of any specified
pollutant from any point source discharge existing as of June 11, 1989, shall be
prohibited in any waterbody or watershed designated in Appendix A of OAC 785:45
with the limitation "SWS". Any discharge of any pollutant to a waterbody designated
"SWS" which would, if it occurred, lower existing water quality shall be prohibited.
Provided however, new point source discharges or increased load of any specified
pollutant from a discharge existing as of June 11, 1989, may be approved by the
permitting authority in circumstances where the discharger demonstrates to the
satisfaction of the permitting authority that such new discharge or increased load will
result in maintaining or improving the water quality in both the direct receiving water,
if designated SWS, and any downstream waterbodies designated SWS.
(c) Stormwater discharges. Regardless of subsections (a) and (b) of this Section, point
source discharges of stormwater to waterbodies and watersheds designated "HQW"
and "SWS" may be approved by the permitting authority.
(d) Nonpoint source discharges or runoff. Best management practices for control of
nonpoint source discharges or runoff should be implemented in watersheds of
waterbodies designated "HQW" or "SWS" in Appendix A of OAC 785:45.
785:46-13-5. Tier 3 protection; prohibition against degradation of water quality in
outstanding resource waters
(a) General. New point source discharges of any pollutant after June 11, 1989, and
increased load of any pollutant from any point source discharge existing as of June 11,
1989, shall be prohibited in any waterbody or watershed designated in Appendix A of

Chlorophyll-a TMDLs for Rocky and Tom Steed Lakes Appendix A
Appendix B-5 FINAL
September 2011
OAC 785:45 with the limitation "ORW" and/or "Scenic River", and in any waterbody
located within the watershed of any waterbody designated with the limitation "Scenic
River". Any discharge of any pollutant to a waterbody designated "ORW" or "Scenic
River" which would, if it occurred, lower existing water quality shall be prohibited.
(b) Stormwater discharges. Regardless of 785:46-13-5(a), point source discharges of
stormwater from temporary construction activities to waterbodies and watersheds
designated "ORW" and/or "Scenic River" may be permitted by the permitting
authority. Regardless of 785:46-13-5(a), discharges of stormwater to waterbodies and
watersheds designated "ORW" and/or "Scenic River" from point sources existing as
of June 25, 1992, whether or not such stormwater discharges were permitted as point
sources prior to June 25, 1992, may be permitted by the permitting authority;
provided, however, increased load of any pollutant from such stormwater discharge
shall be prohibited.
(c) Nonpoint source discharges or runoff. Best management practices for control of
nonpoint source discharges or runoff should be implemented in watersheds of
waterbodies designated "ORW" in Appendix A of OAC 785:45, provided, however,
that development of conservation plans shall be required in sub-watersheds where
discharges or runoff from nonpoint sources are identified as causing or significantly
contributing to degradation in a waterbody designated "ORW".
(d) LMFO's. No licensed managed feeding operation (LMFO) established after June 10,
1998 which applies for a new or expanding license from the State Department of
Agriculture after March 9, 1998 shall be located...[w]ithin three (3) miles of any
designated scenic river area as specified by the Scenic Rivers Act in 82 O.S. Section
1451 and following, or [w]ithin one (1) mile of a waterbody [2:9-210.3(D)]
designated in Appendix A of OAC 785:45 as "ORW".
785:46-13-6. Protection for Appendix B areas
(a) General. Appendix B of OAC 785:45 identifies areas in Oklahoma with waters of
recreational and/or ecological significance. These areas are divided into Table 1,
which includes national and state parks, national forests, wildlife areas, wildlife
management areas and wildlife refuges; and Table 2, which includes areas which
contain threatened or endangered species listed as such by the federal government
pursuant to the federal Endangered Species Act as amended.
(b) Protection for Table 1 areas. New discharges of pollutants after June 11, 1989, or
increased loading of pollutants from discharges existing as of June 11, 1989, to waters
within the boundaries of areas listed in Table 1 of Appendix B of OAC 785:45 may be
approved by the permitting authority under such conditions as ensure that the
recreational and ecological significance of these waters will be maintained.
(c) Protection for Table 2 areas. Discharges or other activities associated with those
waters within the boundaries listed in Table 2 of Appendix B of OAC 785:45 may be
restricted through agreements between appropriate regulatory agencies and the United
States Fish and Wildlife Service. Discharges or other activities in such areas shall not
substantially disrupt the threatened or endangered species inhabiting the receiving
water.

Chlorophyll-a TMDLs for Rocky and Tom Steed Lakes Appendix A
Appendix B-6 FINAL
September 2011
(d) Nonpoint source discharges or runoff. Best management practices for control of
nonpoint source discharges or runoff should be implemented in watersheds located
within areas listed in Appendix B of OAC 785:45.

Chlorophyll-a TMDLs for Rocky and Tom Steed Lakes Appendix B
Appendix B-1 FINAL
September 2011
APPENDIX B
AMBIENT WATER QUALITY DATA
CHLOROPHYLL-A DATA ― 2002 TO 2009
PHOSPHORUS AND NITROGEN DATA – 1998 TO 2009
SECHI DEPTH AND TURBIDITY DATA – 2001 TO 2010
TOTAL SUSPENDED SOLIDS DATA ― 1998 TO 2000
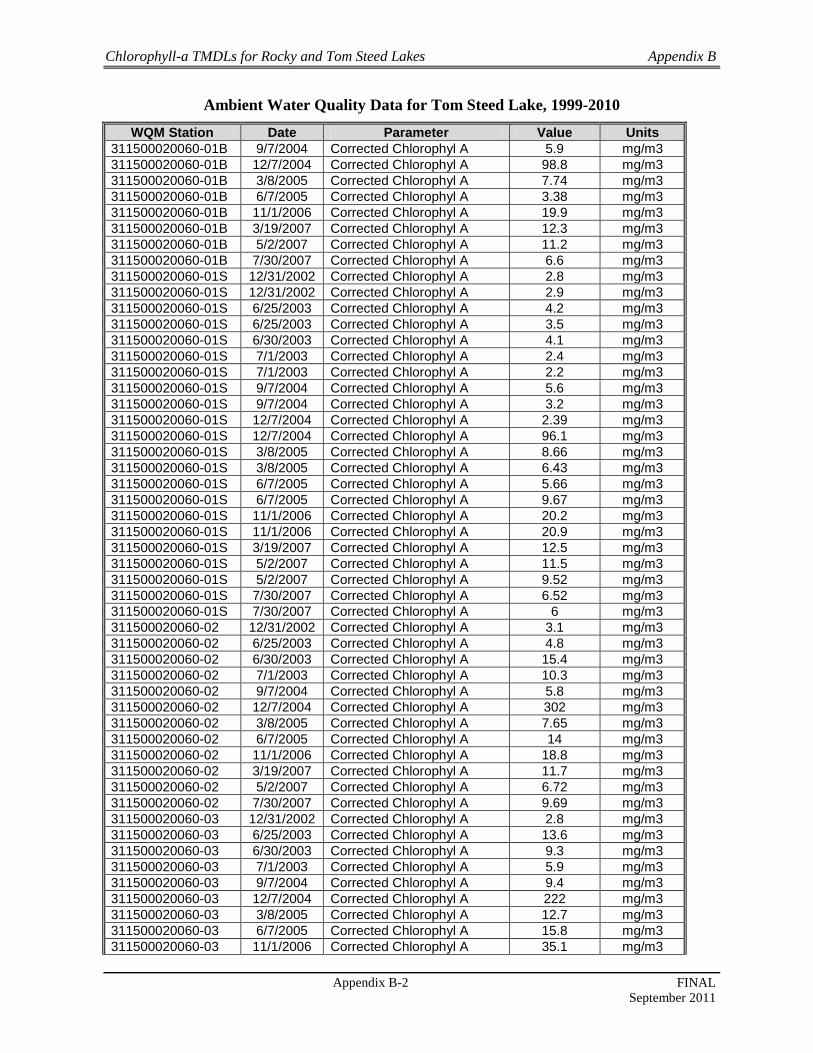
Chlorophyll-a TMDLs for Rocky and Tom Steed Lakes Appendix B
Appendix B-2 FINAL
September 2011
Ambient Water Quality Data for Tom Steed Lake, 1999-2010
WQM Station Date Parameter Value Units
311500020060-01B 9/7/2004 Corrected Chlorophyl A 5.9 mg/m3
311500020060-01B 12/7/2004 Corrected Chlorophyl A 98.8 mg/m3
311500020060-01B 3/8/2005 Corrected Chlorophyl A 7.74 mg/m3
311500020060-01B 6/7/2005 Corrected Chlorophyl A 3.38 mg/m3
311500020060-01B 11/1/2006 Corrected Chlorophyl A 19.9 mg/m3
311500020060-01B 3/19/2007 Corrected Chlorophyl A 12.3 mg/m3
311500020060-01B 5/2/2007 Corrected Chlorophyl A 11.2 mg/m3
311500020060-01B 7/30/2007 Corrected Chlorophyl A 6.6 mg/m3
311500020060-01S 12/31/2002 Corrected Chlorophyl A 2.8 mg/m3
311500020060-01S 12/31/2002 Corrected Chlorophyl A 2.9 mg/m3
311500020060-01S 6/25/2003 Corrected Chlorophyl A 4.2 mg/m3
311500020060-01S 6/25/2003 Corrected Chlorophyl A 3.5 mg/m3
311500020060-01S 6/30/2003 Corrected Chlorophyl A 4.1 mg/m3
311500020060-01S 7/1/2003 Corrected Chlorophyl A 2.4 mg/m3
311500020060-01S 7/1/2003 Corrected Chlorophyl A 2.2 mg/m3
311500020060-01S 9/7/2004 Corrected Chlorophyl A 5.6 mg/m3
311500020060-01S 9/7/2004 Corrected Chlorophyl A 3.2 mg/m3
311500020060-01S 12/7/2004 Corrected Chlorophyl A 2.39 mg/m3
311500020060-01S 12/7/2004 Corrected Chlorophyl A 96.1 mg/m3
311500020060-01S 3/8/2005 Corrected Chlorophyl A 8.66 mg/m3
311500020060-01S 3/8/2005 Corrected Chlorophyl A 6.43 mg/m3
311500020060-01S 6/7/2005 Corrected Chlorophyl A 5.66 mg/m3
311500020060-01S 6/7/2005 Corrected Chlorophyl A 9.67 mg/m3
311500020060-01S 11/1/2006 Corrected Chlorophyl A 20.2 mg/m3
311500020060-01S 11/1/2006 Corrected Chlorophyl A 20.9 mg/m3
311500020060-01S 3/19/2007 Corrected Chlorophyl A 12.5 mg/m3
311500020060-01S 5/2/2007 Corrected Chlorophyl A 11.5 mg/m3
311500020060-01S 5/2/2007 Corrected Chlorophyl A 9.52 mg/m3
311500020060-01S 7/30/2007 Corrected Chlorophyl A 6.52 mg/m3
311500020060-01S 7/30/2007 Corrected Chlorophyl A 6 mg/m3
311500020060-02 12/31/2002 Corrected Chlorophyl A 3.1 mg/m3
311500020060-02 6/25/2003 Corrected Chlorophyl A 4.8 mg/m3
311500020060-02 6/30/2003 Corrected Chlorophyl A 15.4 mg/m3
311500020060-02 7/1/2003 Corrected Chlorophyl A 10.3 mg/m3
311500020060-02 9/7/2004 Corrected Chlorophyl A 5.8 mg/m3
311500020060-02 12/7/2004 Corrected Chlorophyl A 302 mg/m3
311500020060-02 3/8/2005 Corrected Chlorophyl A 7.65 mg/m3
311500020060-02 6/7/2005 Corrected Chlorophyl A 14 mg/m3
311500020060-02 11/1/2006 Corrected Chlorophyl A 18.8 mg/m3
311500020060-02 3/19/2007 Corrected Chlorophyl A 11.7 mg/m3
311500020060-02 5/2/2007 Corrected Chlorophyl A 6.72 mg/m3
311500020060-02 7/30/2007 Corrected Chlorophyl A 9.69 mg/m3
311500020060-03 12/31/2002 Corrected Chlorophyl A 2.8 mg/m3
311500020060-03 6/25/2003 Corrected Chlorophyl A 13.6 mg/m3
311500020060-03 6/30/2003 Corrected Chlorophyl A 9.3 mg/m3
311500020060-03 7/1/2003 Corrected Chlorophyl A 5.9 mg/m3
311500020060-03 9/7/2004 Corrected Chlorophyl A 9.4 mg/m3
311500020060-03 12/7/2004 Corrected Chlorophyl A 222 mg/m3
311500020060-03 3/8/2005 Corrected Chlorophyl A 12.7 mg/m3
311500020060-03 6/7/2005 Corrected Chlorophyl A 15.8 mg/m3
311500020060-03 11/1/2006 Corrected Chlorophyl A 35.1 mg/m3

Chlorophyll-a TMDLs for Rocky and Tom Steed Lakes Appendix B
Appendix B-3 FINAL
September 2011
WQM Station Date Parameter Value Units
311500020060-03 3/19/2007 Corrected Chlorophyl A 8.84 mg/m3
311500020060-03 5/2/2007 Corrected Chlorophyl A 7.41 mg/m3
311500020060-03 7/30/2007 Corrected Chlorophyl A 10.03 mg/m3
311500020060-04 12/31/2002 Corrected Chlorophyl A 2.2 mg/m3
311500020060-04 6/25/2003 Corrected Chlorophyl A 4 mg/m3
311500020060-04 6/30/2003 Corrected Chlorophyl A 9.7 mg/m3
311500020060-04 7/1/2003 Corrected Chlorophyl A 6.9 mg/m3
311500020060-04 9/7/2004 Corrected Chlorophyl A 6.9 mg/m3
311500020060-04 12/7/2004 Corrected Chlorophyl A 232 mg/m3
311500020060-04 3/8/2005 Corrected Chlorophyl A 5.28 mg/m3
311500020060-04 6/7/2005 Corrected Chlorophyl A 8.56 mg/m3
311500020060-04 11/1/2006 Corrected Chlorophyl A 18.4 mg/m3
311500020060-04 3/19/2007 Corrected Chlorophyl A 11.8 mg/m3
311500020060-04 5/2/2007 Corrected Chlorophyl A 5.64 mg/m3
311500020060-04 7/30/2007 Corrected Chlorophyl A 6.71 mg/m3
311500020060-05 12/31/2002 Corrected Chlorophyl A 2.1 mg/m3
311500020060-05 6/25/2003 Corrected Chlorophyl A 5 mg/m3
311500020060-05 6/30/2003 Corrected Chlorophyl A 12.9 mg/m3
311500020060-05 7/1/2003 Corrected Chlorophyl A 7.4 mg/m3
311500020060-05 9/7/2004 Corrected Chlorophyl A 6.4 mg/m3
311500020060-05 12/7/2004 Corrected Chlorophyl A 174 mg/m3
311500020060-05 3/8/2005 Corrected Chlorophyl A 7.03 mg/m3
311500020060-05 6/7/2005 Corrected Chlorophyl A 16.8 mg/m3
311500020060-05 11/1/2006 Corrected Chlorophyl A 17.7 mg/m3
311500020060-05 5/2/2007 Corrected Chlorophyl A 6.28 mg/m3
311500020060-05 7/30/2007 Corrected Chlorophyl A 11.79 mg/m3
311500020060-01B 10/13/1999 Nitrogen, Ammonia <0.05 mg/L
311500020060-01B 4/26/2000 Nitrogen, Ammonia <0.05 mg/L
311500020060-01B 7/19/2000 Nitrogen, Ammonia <0.05 mg/L
311500020060-01B 10/1/2002 Nitrogen, Ammonia <0.05 mg/L
311500020060-01B 12/30/2002 Nitrogen, Ammonia <0.05 mg/L
311500020060-01B 4/1/2003 Nitrogen, Ammonia <0.05 mg/L
311500020060-01B 7/1/2003 Nitrogen, Ammonia <0.05 mg/L
311500020060-01S 10/13/1999 Nitrogen, Ammonia <0.05 mg/L
311500020060-01S 1/11/2000 Nitrogen, Ammonia 0.1 mg/L
311500020060-01S 4/26/2000 Nitrogen, Ammonia <0.05 mg/L
311500020060-01S 7/19/2000 Nitrogen, Ammonia 0.05 mg/L
311500020060-01S 10/1/2002 Nitrogen, Ammonia <0.05 mg/L
311500020060-01S 12/30/2002 Nitrogen, Ammonia <0.05 mg/L
311500020060-01S 4/1/2003 Nitrogen, Ammonia <0.05 mg/L
311500020060-01S 7/1/2003 Nitrogen, Ammonia <0.05 mg/L
311500020060-01S 9/8/2004 Nitrogen, Ammonia 0.07 mg/L
311500020060-01S 12/7/2004 Nitrogen, Ammonia 0.05 mg/L
311500020060-01S 3/8/2005 Nitrogen, Ammonia <0.05 mg/L
311500020060-01S 6/7/2005 Nitrogen, Ammonia <0.05 mg/L
311500020060-02 10/13/1999 Nitrogen, Ammonia <0.05 mg/L
311500020060-02 1/11/2000 Nitrogen, Ammonia <0.05 mg/L
311500020060-02 4/26/2000 Nitrogen, Ammonia <0.05 mg/L
311500020060-02 7/19/2000 Nitrogen, Ammonia <0.05 mg/L
311500020060-02 10/1/2002 Nitrogen, Ammonia <0.05 mg/L
311500020060-02 12/30/2002 Nitrogen, Ammonia <0.05 mg/L
311500020060-02 4/1/2003 Nitrogen, Ammonia <0.05 mg/L

Chlorophyll-a TMDLs for Rocky and Tom Steed Lakes Appendix B
Appendix B-4 FINAL
September 2011
WQM Station Date Parameter Value Units
311500020060-02 7/1/2003 Nitrogen, Ammonia <0.05 mg/L
311500020060-02 9/8/2004 Nitrogen, Ammonia 0.06 mg/L
311500020060-02 12/7/2004 Nitrogen, Ammonia <0.05 mg/L
311500020060-02 3/8/2005 Nitrogen, Ammonia <0.05 mg/L
311500020060-02 6/7/2005 Nitrogen, Ammonia <0.05 mg/L
311500020060-03 10/13/1999 Nitrogen, Ammonia <0.05 mg/L
311500020060-03 1/11/2000 Nitrogen, Ammonia 0.11 mg/L
311500020060-03 4/26/2000 Nitrogen, Ammonia <0.05 mg/L
311500020060-03 7/19/2000 Nitrogen, Ammonia 0.08 mg/L
311500020060-03 10/1/2002 Nitrogen, Ammonia <0.05 mg/L
311500020060-03 12/30/2002 Nitrogen, Ammonia <0.05 mg/L
311500020060-03 4/1/2003 Nitrogen, Ammonia <0.05 mg/L
311500020060-03 7/1/2003 Nitrogen, Ammonia <0.05 mg/L
311500020060-03 9/8/2004 Nitrogen, Ammonia 0.05 mg/L
311500020060-03 12/7/2004 Nitrogen, Ammonia <0.05 mg/L
311500020060-03 3/8/2005 Nitrogen, Ammonia <0.05 mg/L
311500020060-03 6/7/2005 Nitrogen, Ammonia <0.05 mg/L
311500020060-04 10/1/2002 Nitrogen, Ammonia <0.05 mg/L
311500020060-04 12/30/2002 Nitrogen, Ammonia <0.05 mg/L
311500020060-04 4/1/2003 Nitrogen, Ammonia <0.05 mg/L
311500020060-04 7/1/2003 Nitrogen, Ammonia <0.05 mg/L
311500020060-04 9/8/2004 Nitrogen, Ammonia 0.07 mg/L
311500020060-04 12/7/2004 Nitrogen, Ammonia <0.05 mg/L
311500020060-04 3/8/2005 Nitrogen, Ammonia <0.05 mg/L
311500020060-04 6/7/2005 Nitrogen, Ammonia <0.05 mg/L
311500020060-05 10/1/2002 Nitrogen, Ammonia <0.05 mg/L
311500020060-05 12/30/2002 Nitrogen, Ammonia <0.05 mg/L
311500020060-05 4/1/2003 Nitrogen, Ammonia <0.05 mg/L
311500020060-05 7/1/2003 Nitrogen, Ammonia <0.05 mg/L
311500020060-05 9/8/2004 Nitrogen, Ammonia 0.07 mg/L
311500020060-05 12/7/2004 Nitrogen, Ammonia <0.05 mg/L
311500020060-05 3/8/2005 Nitrogen, Ammonia <0.05 mg/L
311500020060-05 6/7/2005 Nitrogen, Ammonia <0.05 mg/L
311500020060-01B 10/13/1999 Nitrogen, Kjeldahl 0.41 mg/L
311500020060-01B 4/26/2000 Nitrogen, Kjeldahl 0.69 mg/L
311500020060-01B 7/19/2000 Nitrogen, Kjeldahl 0.45 mg/L
311500020060-01B 10/1/2002 Nitrogen, Kjeldahl 0.64 mg/L
311500020060-01B 12/30/2002 Nitrogen, Kjeldahl 0.46 mg/L
311500020060-01B 4/1/2003 Nitrogen, Kjeldahl 0.5 mg/L
311500020060-01B 7/1/2003 Nitrogen, Kjeldahl 0.68 mg/L
311500020060-01S 10/13/1999 Nitrogen, Kjeldahl 0.48 mg/L
311500020060-01S 1/11/2000 Nitrogen, Kjeldahl 0.33 mg/L
311500020060-01S 4/26/2000 Nitrogen, Kjeldahl 0.99 mg/L
311500020060-01S 7/19/2000 Nitrogen, Kjeldahl 0.54 mg/L
311500020060-01S 10/1/2002 Nitrogen, Kjeldahl 0.78 mg/L
311500020060-01S 12/30/2002 Nitrogen, Kjeldahl 0.49 mg/L
311500020060-01S 4/1/2003 Nitrogen, Kjeldahl 0.48 mg/L
311500020060-01S 7/1/2003 Nitrogen, Kjeldahl 0.76 mg/L
311500020060-01S 9/8/2004 Nitrogen, Kjeldahl 0.75 mg/L
311500020060-01S 12/7/2004 Nitrogen, Kjeldahl 0.59 mg/L
311500020060-01S 3/8/2005 Nitrogen, Kjeldahl 0.52 mg/L
311500020060-01S 6/7/2005 Nitrogen, Kjeldahl 0.43 mg/L

Chlorophyll-a TMDLs for Rocky and Tom Steed Lakes Appendix B
Appendix B-5 FINAL
September 2011
WQM Station Date Parameter Value Units
311500020060-01S 11/1/2006 Nitrogen, Kjeldahl 0.93 mg/L
311500020060-01S 5/2/2007 Nitrogen, Kjeldahl 0.69 mg/L
311500020060-01S 7/30/2007 Nitrogen, Kjeldahl 0.69 mg/L
311500020060-02 10/13/1999 Nitrogen, Kjeldahl 0.34 mg/L
311500020060-02 1/11/2000 Nitrogen, Kjeldahl 0.36 mg/L
311500020060-02 4/26/2000 Nitrogen, Kjeldahl 0.59 mg/L
311500020060-02 7/19/2000 Nitrogen, Kjeldahl 0.41 mg/L
311500020060-02 10/1/2002 Nitrogen, Kjeldahl 0.62 mg/L
311500020060-02 12/30/2002 Nitrogen, Kjeldahl 0.51 mg/L
311500020060-02 4/1/2003 Nitrogen, Kjeldahl 0.46 mg/L
311500020060-02 7/1/2003 Nitrogen, Kjeldahl 1.02 mg/L
311500020060-02 9/8/2004 Nitrogen, Kjeldahl 0.75 mg/L
311500020060-02 12/7/2004 Nitrogen, Kjeldahl 0.63 mg/L
311500020060-02 3/8/2005 Nitrogen, Kjeldahl 0.56 mg/L
311500020060-02 6/7/2005 Nitrogen, Kjeldahl 0.62 mg/L
311500020060-02 11/1/2006 Nitrogen, Kjeldahl 0.79 mg/L
311500020060-02 3/19/2007 Nitrogen, Kjeldahl 0.92 mg/L
311500020060-02 5/2/2007 Nitrogen, Kjeldahl 0.61 mg/L
311500020060-02 7/30/2007 Nitrogen, Kjeldahl 0.61 mg/L
311500020060-02 11/17/2009 Nitrogen, Kjeldahl 0.69 mg/L
311500020060-03 10/13/1999 Nitrogen, Kjeldahl 0.31 mg/L
311500020060-03 1/11/2000 Nitrogen, Kjeldahl 0.46 mg/L
311500020060-03 4/26/2000 Nitrogen, Kjeldahl 0.53 mg/L
311500020060-03 7/19/2000 Nitrogen, Kjeldahl 0.45 mg/L
311500020060-03 10/1/2002 Nitrogen, Kjeldahl 0.64 mg/L
311500020060-03 12/30/2002 Nitrogen, Kjeldahl 0.46 mg/L
311500020060-03 4/1/2003 Nitrogen, Kjeldahl 0.46 mg/L
311500020060-03 7/1/2003 Nitrogen, Kjeldahl 0.78 mg/L
311500020060-03 9/8/2004 Nitrogen, Kjeldahl 0.77 mg/L
311500020060-03 12/7/2004 Nitrogen, Kjeldahl 0.62 mg/L
311500020060-03 3/8/2005 Nitrogen, Kjeldahl 0.46 mg/L
311500020060-03 6/7/2005 Nitrogen, Kjeldahl 0.64 mg/L
311500020060-03 11/1/2006 Nitrogen, Kjeldahl 0.85 mg/L
311500020060-03 3/19/2007 Nitrogen, Kjeldahl 1.04 mg/L
311500020060-03 5/2/2007 Nitrogen, Kjeldahl 0.7 mg/L
311500020060-03 7/30/2007 Nitrogen, Kjeldahl 0.62 mg/L
311500020060-03 11/17/2009 Nitrogen, Kjeldahl 0.74 mg/L
311500020060-04 10/1/2002 Nitrogen, Kjeldahl 0.64 mg/L
311500020060-04 12/30/2002 Nitrogen, Kjeldahl 0.44 mg/L
311500020060-04 4/1/2003 Nitrogen, Kjeldahl 0.45 mg/L
311500020060-04 7/1/2003 Nitrogen, Kjeldahl 0.67 mg/L
311500020060-04 9/8/2004 Nitrogen, Kjeldahl 0.69 mg/L
311500020060-04 12/7/2004 Nitrogen, Kjeldahl 0.68 mg/L
311500020060-04 3/8/2005 Nitrogen, Kjeldahl 0.47 mg/L
311500020060-04 6/7/2005 Nitrogen, Kjeldahl 0.58 mg/L
311500020060-04 11/1/2006 Nitrogen, Kjeldahl 0.78 mg/L
311500020060-04 3/19/2007 Nitrogen, Kjeldahl 0.94 mg/L
311500020060-04 5/2/2007 Nitrogen, Kjeldahl 0.76 mg/L
311500020060-04 7/30/2007 Nitrogen, Kjeldahl 0.59 mg/L
311500020060-05 10/1/2002 Nitrogen, Kjeldahl 0.94 mg/L
311500020060-05 12/30/2002 Nitrogen, Kjeldahl 0.54 mg/L
311500020060-05 4/1/2003 Nitrogen, Kjeldahl 0.42 mg/L

Chlorophyll-a TMDLs for Rocky and Tom Steed Lakes Appendix B
Appendix B-6 FINAL
September 2011
WQM Station Date Parameter Value Units
311500020060-05 7/1/2003 Nitrogen, Kjeldahl 0.72 mg/L
311500020060-05 9/8/2004 Nitrogen, Kjeldahl 0.74 mg/L
311500020060-05 12/7/2004 Nitrogen, Kjeldahl 0.58 mg/L
311500020060-05 3/8/2005 Nitrogen, Kjeldahl 0.37 mg/L
311500020060-05 6/7/2005 Nitrogen, Kjeldahl 0.58 mg/L
311500020060-05 11/1/2006 Nitrogen, Kjeldahl 0.87 mg/L
311500020060-05 3/19/2007 Nitrogen, Kjeldahl 0.92 mg/L
311500020060-05 5/2/2007 Nitrogen, Kjeldahl 0.66 mg/L
311500020060-05 7/30/2007 Nitrogen, Kjeldahl 0.62 mg/L
311500020060-01B 10/13/1999 Nitrogen, Nitrate as N <0.05 mg/L
311500020060-01B 4/26/2000 Nitrogen, Nitrate as N 0.09 mg/L
311500020060-01B 7/19/2000 Nitrogen, Nitrate as N <0.05 mg/L
311500020060-01B 10/1/2002 Nitrogen, Nitrate as N <0.01 mg/L
311500020060-01B 12/30/2002 Nitrogen, Nitrate as N 0.11 mg/L
311500020060-01B 4/1/2003 Nitrogen, Nitrate as N <0.05 mg/L
311500020060-01B 7/1/2003 Nitrogen, Nitrate as N 0.07 mg/L
311500020060-01S 10/13/1999 Nitrogen, Nitrate as N <0.05 mg/L
311500020060-01S 1/11/2000 Nitrogen, Nitrate as N 0.09 mg/L
311500020060-01S 4/26/2000 Nitrogen, Nitrate as N 0.08 mg/L
311500020060-01S 7/19/2000 Nitrogen, Nitrate as N <0.05 mg/L
311500020060-01S 10/1/2002 Nitrogen, Nitrate as N <0.05 mg/L
311500020060-01S 12/30/2002 Nitrogen, Nitrate as N 0.08 mg/L
311500020060-01S 4/1/2003 Nitrogen, Nitrate as N <0.05 mg/L
311500020060-01S 7/1/2003 Nitrogen, Nitrate as N 0.07 mg/L
311500020060-01S 9/8/2004 Nitrogen, Nitrate as N <0.05 mg/L
311500020060-01S 12/7/2004 Nitrogen, Nitrate as N 0.29 mg/L
311500020060-02 10/13/1999 Nitrogen, Nitrate as N <0.05 mg/L
311500020060-02 1/11/2000 Nitrogen, Nitrate as N 0.07 mg/L
311500020060-02 4/26/2000 Nitrogen, Nitrate as N 0.07 mg/L
311500020060-02 7/19/2000 Nitrogen, Nitrate as N <0.05 mg/L
311500020060-02 10/1/2002 Nitrogen, Nitrate as N <0.05 mg/L
311500020060-02 12/30/2002 Nitrogen, Nitrate as N 0.1 mg/L
311500020060-02 4/1/2003 Nitrogen, Nitrate as N <0.05 mg/L
311500020060-02 7/1/2003 Nitrogen, Nitrate as N <0.05 mg/L
311500020060-02 9/8/2004 Nitrogen, Nitrate as N <0.05 mg/L
311500020060-02 12/7/2004 Nitrogen, Nitrate as N 0.28 mg/L
311500020060-03 10/13/1999 Nitrogen, Nitrate as N 0.06 mg/L
311500020060-03 1/11/2000 Nitrogen, Nitrate as N <0.05 mg/L
311500020060-03 4/26/2000 Nitrogen, Nitrate as N 0.06 mg/L
311500020060-03 7/19/2000 Nitrogen, Nitrate as N <0.05 mg/L
311500020060-03 10/1/2002 Nitrogen, Nitrate as N 0.05 mg/L
311500020060-03 12/30/2002 Nitrogen, Nitrate as N 0.1 mg/L
311500020060-03 4/1/2003 Nitrogen, Nitrate as N <0.05 mg/L
311500020060-03 7/1/2003 Nitrogen, Nitrate as N <0.05 mg/L
311500020060-03 9/8/2004 Nitrogen, Nitrate as N <0.05 mg/L
311500020060-03 12/7/2004 Nitrogen, Nitrate as N 0.27 mg/L
311500020060-04 10/1/2002 Nitrogen, Nitrate as N <0.05 mg/L
311500020060-04 12/30/2002 Nitrogen, Nitrate as N 0.09 mg/L
311500020060-04 4/1/2003 Nitrogen, Nitrate as N <0.05 mg/L
311500020060-04 7/1/2003 Nitrogen, Nitrate as N <0.05 mg/L
311500020060-04 9/8/2004 Nitrogen, Nitrate as N <0.05 mg/L
311500020060-04 12/7/2004 Nitrogen, Nitrate as N 0.29 mg/L

Chlorophyll-a TMDLs for Rocky and Tom Steed Lakes Appendix B
Appendix B-7 FINAL
September 2011
WQM Station Date Parameter Value Units
311500020060-05 10/1/2002 Nitrogen, Nitrate as N <0.05 mg/L
311500020060-05 12/30/2002 Nitrogen, Nitrate as N 0.09 mg/L
311500020060-05 4/1/2003 Nitrogen, Nitrate as N <0.05 mg/L
311500020060-05 7/1/2003 Nitrogen, Nitrate as N 0.05 mg/L
311500020060-05 9/8/2004 Nitrogen, Nitrate as N <0.05 mg/L
311500020060-05 12/7/2004 Nitrogen, Nitrate as N 0.26 mg/L
311500020060-01S 3/8/2005 Nitrogen, Nitrate/Nitrite as N 0.21 mg/L
311500020060-01S 6/7/2005 Nitrogen, Nitrate/Nitrite as N 0.05 mg/L
311500020060-01S 11/1/2006 Nitrogen, Nitrate/Nitrite as N <0.05 mg/L
311500020060-01S 5/2/2007 Nitrogen, Nitrate/Nitrite as N <0.05 mg/L
311500020060-01S 7/30/2007 Nitrogen, Nitrate/Nitrite as N <0.05 mg/L
311500020060-02 3/8/2005 Nitrogen, Nitrate/Nitrite as N 0.21 mg/L
311500020060-02 6/7/2005 Nitrogen, Nitrate/Nitrite as N <0.05 mg/L
311500020060-02 11/1/2006 Nitrogen, Nitrate/Nitrite as N <0.05 mg/L
311500020060-02 3/19/2007 Nitrogen, Nitrate/Nitrite as N <0.05 mg/L
311500020060-02 5/2/2007 Nitrogen, Nitrate/Nitrite as N <0.05 mg/L
311500020060-02 7/30/2007 Nitrogen, Nitrate/Nitrite as N <0.05 mg/L
311500020060-02 11/17/2009 Nitrogen, Nitrate/Nitrite as N <0.05 mg/L
311500020060-03 3/8/2005 Nitrogen, Nitrate/Nitrite as N 0.15 mg/L
311500020060-03 6/7/2005 Nitrogen, Nitrate/Nitrite as N 0.06 mg/L
311500020060-03 11/1/2006 Nitrogen, Nitrate/Nitrite as N <0.05 mg/L
311500020060-03 3/19/2007 Nitrogen, Nitrate/Nitrite as N <0.05 mg/L
311500020060-03 5/2/2007 Nitrogen, Nitrate/Nitrite as N <0.05 mg/L
311500020060-03 7/30/2007 Nitrogen, Nitrate/Nitrite as N <0.05 mg/L
311500020060-03 11/17/2009 Nitrogen, Nitrate/Nitrite as N <0.05 mg/L
311500020060-04 3/8/2005 Nitrogen, Nitrate/Nitrite as N 0.23 mg/L
311500020060-04 6/7/2005 Nitrogen, Nitrate/Nitrite as N 0.07 mg/L
311500020060-04 11/1/2006 Nitrogen, Nitrate/Nitrite as N <0.05 mg/L
311500020060-04 3/19/2007 Nitrogen, Nitrate/Nitrite as N <0.05 mg/L
311500020060-04 5/2/2007 Nitrogen, Nitrate/Nitrite as N 0.05 mg/L
311500020060-04 7/30/2007 Nitrogen, Nitrate/Nitrite as N <0.05 mg/L
311500020060-05 3/8/2005 Nitrogen, Nitrate/Nitrite as N 0.2 mg/L
311500020060-05 6/7/2005 Nitrogen, Nitrate/Nitrite as N 0.07 mg/L
311500020060-05 11/1/2006 Nitrogen, Nitrate/Nitrite as N <0.05 mg/L
311500020060-05 3/19/2007 Nitrogen, Nitrate/Nitrite as N <0.05 mg/L
311500020060-05 5/2/2007 Nitrogen, Nitrate/Nitrite as N <0.05 mg/L
311500020060-05 7/30/2007 Nitrogen, Nitrate/Nitrite as N <0.05 mg/L
311500020060-01B 10/13/1999 Nitrogen, Nitrite as N <0.05 mg/L
311500020060-01B 4/26/2000 Nitrogen, Nitrite as N <0.05 mg/L
311500020060-01B 7/19/2000 Nitrogen, Nitrite as N <0.05 mg/L
311500020060-01B 10/1/2002 Nitrogen, Nitrite as N <0.05 mg/L
311500020060-01B 12/30/2002 Nitrogen, Nitrite as N <0.05 mg/L
311500020060-01B 4/1/2003 Nitrogen, Nitrite as N <0.05 mg/L
311500020060-01B 7/1/2003 Nitrogen, Nitrite as N 0.09 mg/L
311500020060-01S 10/13/1999 Nitrogen, Nitrite as N 0.06 mg/L
311500020060-01S 1/11/2000 Nitrogen, Nitrite as N <0.05 mg/L
311500020060-01S 4/26/2000 Nitrogen, Nitrite as N <0.05 mg/L
311500020060-01S 7/19/2000 Nitrogen, Nitrite as N <0.05 mg/L
311500020060-01S 10/1/2002 Nitrogen, Nitrite as N <0.05 mg/L
311500020060-01S 12/30/2002 Nitrogen, Nitrite as N <0.05 mg/L
311500020060-01S 4/1/2003 Nitrogen, Nitrite as N <0.05 mg/L
311500020060-01S 7/1/2003 Nitrogen, Nitrite as N 0.09 mg/L

Chlorophyll-a TMDLs for Rocky and Tom Steed Lakes Appendix B
Appendix B-8 FINAL
September 2011
WQM Station Date Parameter Value Units
311500020060-01S 9/8/2004 Nitrogen, Nitrite as N <0.05 mg/L
311500020060-01S 12/7/2004 Nitrogen, Nitrite as N <0.05 mg/L
311500020060-02 10/13/1999 Nitrogen, Nitrite as N <0.05 mg/L
311500020060-02 1/11/2000 Nitrogen, Nitrite as N <0.05 mg/L
311500020060-02 4/26/2000 Nitrogen, Nitrite as N <0.05 mg/L
311500020060-02 7/19/2000 Nitrogen, Nitrite as N <0.05 mg/L
311500020060-02 10/1/2002 Nitrogen, Nitrite as N <0.05 mg/L
311500020060-02 12/30/2002 Nitrogen, Nitrite as N <0.05 mg/L
311500020060-02 4/1/2003 Nitrogen, Nitrite as N <0.05 mg/L
311500020060-02 7/1/2003 Nitrogen, Nitrite as N <0.05 mg/L
311500020060-02 9/8/2004 Nitrogen, Nitrite as N <0.05 mg/L
311500020060-02 12/7/2004 Nitrogen, Nitrite as N <0.05 mg/L
311500020060-03 10/13/1999 Nitrogen, Nitrite as N <0.05 mg/L
311500020060-03 1/11/2000 Nitrogen, Nitrite as N <0.05 mg/L
311500020060-03 4/26/2000 Nitrogen, Nitrite as N <0.05 mg/L
311500020060-03 7/19/2000 Nitrogen, Nitrite as N <0.05 mg/L
311500020060-03 10/1/2002 Nitrogen, Nitrite as N <0.05 mg/L
311500020060-03 12/30/2002 Nitrogen, Nitrite as N <0.05 mg/L
311500020060-03 4/1/2003 Nitrogen, Nitrite as N <0.05 mg/L
311500020060-03 7/1/2003 Nitrogen, Nitrite as N <0.05 mg/L
311500020060-03 9/8/2004 Nitrogen, Nitrite as N <0.05 mg/L
311500020060-03 12/7/2004 Nitrogen, Nitrite as N <0.05 mg/L
311500020060-04 10/1/2002 Nitrogen, Nitrite as N <0.05 mg/L
311500020060-04 12/30/2002 Nitrogen, Nitrite as N <0.05 mg/L
311500020060-04 4/1/2003 Nitrogen, Nitrite as N <0.05 mg/L
311500020060-04 7/1/2003 Nitrogen, Nitrite as N 0.06 mg/L
311500020060-04 9/8/2004 Nitrogen, Nitrite as N <0.05 mg/L
311500020060-04 12/7/2004 Nitrogen, Nitrite as N <0.05 mg/L
311500020060-05 10/1/2002 Nitrogen, Nitrite as N <0.05 mg/L
311500020060-05 12/30/2002 Nitrogen, Nitrite as N <0.05 mg/L
311500020060-05 4/1/2003 Nitrogen, Nitrite as N <0.05 mg/L
311500020060-05 7/1/2003 Nitrogen, Nitrite as N <0.05 mg/L
311500020060-05 9/8/2004 Nitrogen, Nitrite as N <0.05 mg/L
311500020060-05 12/7/2004 Nitrogen, Nitrite as N <0.05 mg/L
311500020060-01B 10/13/1999 Nitrogen, Organic 0.41 mg/L
311500020060-01S 10/13/1999 Nitrogen, Organic 0.48 mg/L
311500020060-01S 1/11/2000 Nitrogen, Organic 0.23 mg/L
311500020060-02 10/13/1999 Nitrogen, Organic 0.34 mg/L
311500020060-02 1/11/2000 Nitrogen, Organic 0.36 mg/L
311500020060-03 10/13/1999 Nitrogen, Organic 0.31 mg/L
311500020060-03 1/11/2000 Nitrogen, Organic 0.35 mg/L
311500020060-01B 10/13/1999 Nitrogen, Total 0.41 mg/L
311500020060-01S 10/13/1999 Nitrogen, Total 0.54 mg/L
311500020060-01S 1/11/2000 Nitrogen, Total 0.42 mg/L
311500020060-02 10/13/1999 Nitrogen, Total 0.34 mg/L
311500020060-02 1/11/2000 Nitrogen, Total 0.43 mg/L
311500020060-03 10/13/1999 Nitrogen, Total 0.37 mg/L
311500020060-03 1/11/2000 Nitrogen, Total 0.46 mg/L
311500020060-01B 10/13/1999 Phosphorous, Ortho 0.039 mg/L
311500020060-01B 4/26/2000 Phosphorous, Ortho 0.022 mg/L
311500020060-01B 7/19/2000 Phosphorous, Ortho 0.04 mg/L
311500020060-01B 10/1/2002 Phosphorous, Ortho 0.023 mg/L

Chlorophyll-a TMDLs for Rocky and Tom Steed Lakes Appendix B
Appendix B-9 FINAL
September 2011
WQM Station Date Parameter Value Units
311500020060-01B 12/30/2002 Phosphorous, Ortho 0.036 mg/L
311500020060-01B 4/1/2003 Phosphorous, Ortho 0.036 mg/L
311500020060-01B 7/1/2003 Phosphorous, Ortho 0.049 mg/L
311500020060-01S 10/13/1999 Phosphorous, Ortho 0.036 mg/L
311500020060-01S 1/11/2000 Phosphorous, Ortho 0.035 mg/L
311500020060-01S 4/26/2000 Phosphorous, Ortho 0.02 mg/L
311500020060-01S 7/19/2000 Phosphorous, Ortho 0.022 mg/L
311500020060-01S 10/1/2002 Phosphorous, Ortho 0.019 mg/L
311500020060-01S 12/30/2002 Phosphorous, Ortho 0.035 mg/L
311500020060-01S 4/1/2003 Phosphorous, Ortho 0.035 mg/L
311500020060-01S 7/1/2003 Phosphorous, Ortho 0.049 mg/L
311500020060-01S 9/8/2004 Phosphorous, Ortho 0.074 mg/L
311500020060-01S 12/7/2004 Phosphorous, Ortho 0.132 mg/L
311500020060-01S 3/8/2005 Phosphorous, Ortho 0.091 mg/L
311500020060-01S 6/7/2005 Phosphorous, Ortho 0.041 mg/L
311500020060-01S 11/1/2006 Phosphorous, Ortho 0.06 mg/L
311500020060-01S 5/2/2007 Phosphorous, Ortho 0.034 mg/L
311500020060-01S 7/30/2007 Phosphorous, Ortho 0.035 mg/L
311500020060-02 10/13/1999 Phosphorous, Ortho 0.011 mg/L
311500020060-02 1/11/2000 Phosphorous, Ortho 0.037 mg/L
311500020060-02 4/26/2000 Phosphorous, Ortho 0.016 mg/L
311500020060-02 7/19/2000 Phosphorous, Ortho 0.018 mg/L
311500020060-02 10/1/2002 Phosphorous, Ortho 0.021 mg/L
311500020060-02 12/30/2002 Phosphorous, Ortho 0.038 mg/L
311500020060-02 4/1/2003 Phosphorous, Ortho 0.059 mg/L
311500020060-02 7/1/2003 Phosphorous, Ortho 0.036 mg/L
311500020060-02 9/8/2004 Phosphorous, Ortho 0.068 mg/L
311500020060-02 12/7/2004 Phosphorous, Ortho 0.133 mg/L
311500020060-02 3/8/2005 Phosphorous, Ortho 0.094 mg/L
311500020060-02 6/7/2005 Phosphorous, Ortho 0.026 mg/L
311500020060-02 11/1/2006 Phosphorous, Ortho 0.061 mg/L
311500020060-02 3/19/2007 Phosphorous, Ortho 0.043 mg/L
311500020060-02 5/2/2007 Phosphorous, Ortho 0.037 mg/L
311500020060-02 7/30/2007 Phosphorous, Ortho 0.012 mg/L
311500020060-03 10/13/1999 Phosphorous, Ortho 0.011 mg/L
311500020060-03 1/11/2000 Phosphorous, Ortho 0.025 mg/L
311500020060-03 4/26/2000 Phosphorous, Ortho 0.014 mg/L
311500020060-03 7/19/2000 Phosphorous, Ortho 0.022 mg/L
311500020060-03 10/1/2002 Phosphorous, Ortho 0.017 mg/L
311500020060-03 12/30/2002 Phosphorous, Ortho 0.032 mg/L
311500020060-03 4/1/2003 Phosphorous, Ortho 0.049 mg/L
311500020060-03 7/1/2003 Phosphorous, Ortho 0.036 mg/L
311500020060-03 9/8/2004 Phosphorous, Ortho 0.062 mg/L
311500020060-03 12/7/2004 Phosphorous, Ortho 0.128 mg/L
311500020060-03 3/8/2005 Phosphorous, Ortho 0.081 mg/L
311500020060-03 6/7/2005 Phosphorous, Ortho 0.031 mg/L
311500020060-03 11/1/2006 Phosphorous, Ortho 0.063 mg/L
311500020060-03 3/19/2007 Phosphorous, Ortho 0.039 mg/L
311500020060-03 5/2/2007 Phosphorous, Ortho 0.032 mg/L
311500020060-03 7/30/2007 Phosphorous, Ortho 0.015 mg/L
311500020060-04 10/1/2002 Phosphorous, Ortho 0.018 mg/L
311500020060-04 12/30/2002 Phosphorous, Ortho 0.034 mg/L

Chlorophyll-a TMDLs for Rocky and Tom Steed Lakes Appendix B
Appendix B-10 FINAL
September 2011
WQM Station Date Parameter Value Units
311500020060-04 4/1/2003 Phosphorous, Ortho 0.035 mg/L
311500020060-04 7/1/2003 Phosphorous, Ortho 0.039 mg/L
311500020060-04 9/8/2004 Phosphorous, Ortho 0.058 mg/L
311500020060-04 12/7/2004 Phosphorous, Ortho 0.135 mg/L
311500020060-04 3/8/2005 Phosphorous, Ortho 0.094 mg/L
311500020060-04 6/7/2005 Phosphorous, Ortho 0.033 mg/L
311500020060-04 11/1/2006 Phosphorous, Ortho 0.062 mg/L
311500020060-04 3/19/2007 Phosphorous, Ortho 0.069 mg/L
311500020060-04 5/2/2007 Phosphorous, Ortho 0.039 mg/L
311500020060-04 7/30/2007 Phosphorous, Ortho 0.023 mg/L
311500020060-05 10/1/2002 Phosphorous, Ortho 0.021 mg/L
311500020060-05 12/30/2002 Phosphorous, Ortho 0.022 mg/L
311500020060-05 4/1/2003 Phosphorous, Ortho 0.038 mg/L
311500020060-05 7/1/2003 Phosphorous, Ortho 0.043 mg/L
311500020060-05 9/8/2004 Phosphorous, Ortho 0.066 mg/L
311500020060-05 12/7/2004 Phosphorous, Ortho 0.126 mg/L
311500020060-05 3/8/2005 Phosphorous, Ortho 0.093 mg/L
311500020060-05 6/7/2005 Phosphorous, Ortho 0.034 mg/L
311500020060-05 11/1/2006 Phosphorous, Ortho 0.065 mg/L
311500020060-05 3/19/2007 Phosphorous, Ortho 0.044 mg/L
311500020060-05 5/2/2007 Phosphorous, Ortho 0.032 mg/L
311500020060-05 7/30/2007 Phosphorous, Ortho 0.012 mg/L
311500020060-01B 10/13/1999 Phosphorous, Total 0.119 mg/L
311500020060-01B 4/26/2000 Phosphorous, Total 0.067 mg/L
311500020060-01B 7/19/2000 Phosphorous, Total 0.053 mg/L
311500020060-01B 10/1/2002 Phosphorous, Total 0.05 mg/L
311500020060-01B 12/30/2002 Phosphorous, Total 0.046 mg/L
311500020060-01B 4/1/2003 Phosphorous, Total 0.055 mg/L
311500020060-01B 7/1/2003 Phosphorous, Total 0.078 mg/L
311500020060-01S 10/13/1999 Phosphorous, Total 0.045 mg/L
311500020060-01S 1/11/2000 Phosphorous, Total 0.056 mg/L
311500020060-01S 4/26/2000 Phosphorous, Total 0.059 mg/L
311500020060-01S 7/19/2000 Phosphorous, Total 0.068 mg/L
311500020060-01S 10/1/2002 Phosphorous, Total 0.048 mg/L
311500020060-01S 12/30/2002 Phosphorous, Total 0.047 mg/L
311500020060-01S 4/1/2003 Phosphorous, Total 0.051 mg/L
311500020060-01S 7/1/2003 Phosphorous, Total 0.071 mg/L
311500020060-01S 9/8/2004 Phosphorous, Total 0.09 mg/L
311500020060-01S 12/7/2004 Phosphorous, Total 0.137 mg/L
311500020060-01S 3/8/2005 Phosphorous, Total 0.115 mg/L
311500020060-01S 6/7/2005 Phosphorous, Total 0.065 mg/L
311500020060-01S 11/1/2006 Phosphorous, Total 0.101 mg/L
311500020060-01S 5/2/2007 Phosphorous, Total 0.044 mg/L
311500020060-01S 7/30/2007 Phosphorous, Total 0.07 mg/L
311500020060-02 10/13/1999 Phosphorous, Total 0.031 mg/L
311500020060-02 1/11/2000 Phosphorous, Total 0.061 mg/L
311500020060-02 4/26/2000 Phosphorous, Total 0.067 mg/L
311500020060-02 7/19/2000 Phosphorous, Total 0.047 mg/L
311500020060-02 10/1/2002 Phosphorous, Total 0.062 mg/L
311500020060-02 12/30/2002 Phosphorous, Total 0.054 mg/L
311500020060-02 4/1/2003 Phosphorous, Total 0.082 mg/L
311500020060-02 7/1/2003 Phosphorous, Total 0.085 mg/L

Chlorophyll-a TMDLs for Rocky and Tom Steed Lakes Appendix B
Appendix B-11 FINAL
September 2011
WQM Station Date Parameter Value Units
311500020060-02 9/8/2004 Phosphorous, Total 0.1 mg/L
311500020060-02 12/7/2004 Phosphorous, Total 0.139 mg/L
311500020060-02 3/8/2005 Phosphorous, Total 0.116 mg/L
311500020060-02 6/7/2005 Phosphorous, Total 0.065 mg/L
311500020060-02 11/1/2006 Phosphorous, Total 0.1 mg/L
311500020060-02 3/19/2007 Phosphorous, Total 0.061 mg/L
311500020060-02 5/2/2007 Phosphorous, Total 0.043 mg/L
311500020060-02 7/30/2007 Phosphorous, Total 0.056 mg/L
311500020060-02 11/17/2009 Phosphorous, Total 0.107 mg/L
311500020060-03 10/13/1999 Phosphorous, Total 0.042 mg/L
311500020060-03 1/11/2000 Phosphorous, Total 0.067 mg/L
311500020060-03 4/26/2000 Phosphorous, Total 0.071 mg/L
311500020060-03 7/19/2000 Phosphorous, Total 0.067 mg/L
311500020060-03 10/1/2002 Phosphorous, Total 0.056 mg/L
311500020060-03 12/30/2002 Phosphorous, Total 0.043 mg/L
311500020060-03 4/1/2003 Phosphorous, Total 0.054 mg/L
311500020060-03 7/1/2003 Phosphorous, Total 0.072 mg/L
311500020060-03 9/8/2004 Phosphorous, Total 0.086 mg/L
311500020060-03 12/7/2004 Phosphorous, Total 0.133 mg/L
311500020060-03 3/8/2005 Phosphorous, Total 0.108 mg/L
311500020060-03 6/7/2005 Phosphorous, Total 0.071 mg/L
311500020060-03 11/1/2006 Phosphorous, Total 0.108 mg/L
311500020060-03 3/19/2007 Phosphorous, Total 0.059 mg/L
311500020060-03 5/2/2007 Phosphorous, Total 0.038 mg/L
311500020060-03 7/30/2007 Phosphorous, Total 0.055 mg/L
311500020060-03 11/17/2009 Phosphorous, Total 0.111 mg/L
311500020060-04 10/1/2002 Phosphorous, Total 0.05 mg/L
311500020060-04 12/30/2002 Phosphorous, Total 0.046 mg/L
311500020060-04 4/1/2003 Phosphorous, Total 0.055 mg/L
311500020060-04 7/1/2003 Phosphorous, Total 0.076 mg/L
311500020060-04 9/8/2004 Phosphorous, Total 0.089 mg/L
311500020060-04 12/7/2004 Phosphorous, Total 0.141 mg/L
311500020060-04 3/8/2005 Phosphorous, Total 0.114 mg/L
311500020060-04 6/7/2005 Phosphorous, Total 0.064 mg/L
311500020060-04 11/1/2006 Phosphorous, Total 0.105 mg/L
311500020060-04 3/19/2007 Phosphorous, Total 0.069 mg/L
311500020060-04 5/2/2007 Phosphorous, Total 0.045 mg/L
311500020060-04 7/30/2007 Phosphorous, Total 0.061 mg/L
311500020060-05 10/1/2002 Phosphorous, Total 0.048 mg/L
311500020060-05 12/30/2002 Phosphorous, Total 0.045 mg/L
311500020060-05 4/1/2003 Phosphorous, Total 0.053 mg/L
311500020060-05 7/1/2003 Phosphorous, Total 0.077 mg/L
311500020060-05 9/8/2004 Phosphorous, Total 0.09 mg/L
311500020060-05 12/7/2004 Phosphorous, Total 0.13 mg/L
311500020060-05 3/8/2005 Phosphorous, Total 0.114 mg/L
311500020060-05 6/7/2005 Phosphorous, Total 0.068 mg/L
311500020060-05 11/1/2006 Phosphorous, Total 0.102 mg/L
311500020060-05 3/19/2007 Phosphorous, Total 0.048 mg/L
311500020060-05 5/2/2007 Phosphorous, Total 0.041 mg/L
311500020060-05 7/30/2007 Phosphorous, Total 0.056 mg/L
311500020060-02 9/8/2004 Secchi Depth 34 cm
311500020060-02 12/7/2004 Secchi Depth 25 cm
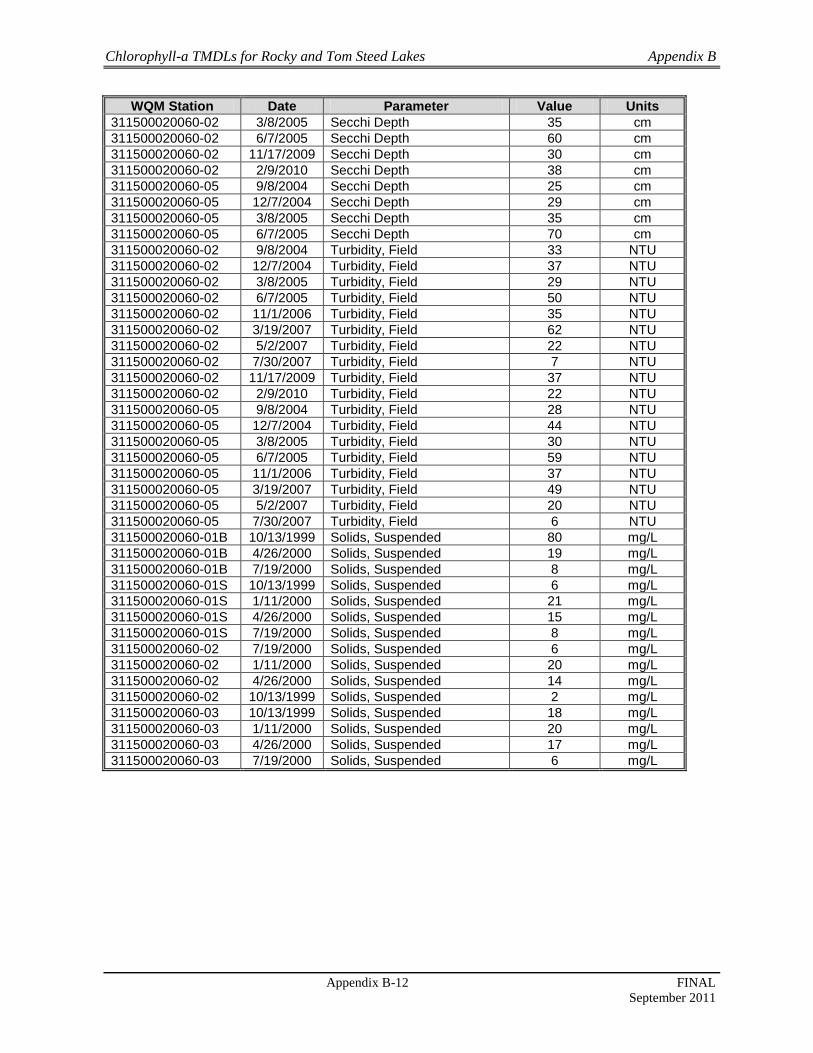
Chlorophyll-a TMDLs for Rocky and Tom Steed Lakes Appendix B
Appendix B-12 FINAL
September 2011
WQM Station Date Parameter Value Units
311500020060-02 3/8/2005 Secchi Depth 35 cm
311500020060-02 6/7/2005 Secchi Depth 60 cm
311500020060-02 11/17/2009 Secchi Depth 30 cm
311500020060-02 2/9/2010 Secchi Depth 38 cm
311500020060-05 9/8/2004 Secchi Depth 25 cm
311500020060-05 12/7/2004 Secchi Depth 29 cm
311500020060-05 3/8/2005 Secchi Depth 35 cm
311500020060-05 6/7/2005 Secchi Depth 70 cm
311500020060-02 9/8/2004 Turbidity, Field 33 NTU
311500020060-02 12/7/2004 Turbidity, Field 37 NTU
311500020060-02 3/8/2005 Turbidity, Field 29 NTU
311500020060-02 6/7/2005 Turbidity, Field 50 NTU
311500020060-02 11/1/2006 Turbidity, Field 35 NTU
311500020060-02 3/19/2007 Turbidity, Field 62 NTU
311500020060-02 5/2/2007 Turbidity, Field 22 NTU
311500020060-02 7/30/2007 Turbidity, Field 7 NTU
311500020060-02 11/17/2009 Turbidity, Field 37 NTU
311500020060-02 2/9/2010 Turbidity, Field 22 NTU
311500020060-05 9/8/2004 Turbidity, Field 28 NTU
311500020060-05 12/7/2004 Turbidity, Field 44 NTU
311500020060-05 3/8/2005 Turbidity, Field 30 NTU
311500020060-05 6/7/2005 Turbidity, Field 59 NTU
311500020060-05 11/1/2006 Turbidity, Field 37 NTU
311500020060-05 3/19/2007 Turbidity, Field 49 NTU
311500020060-05 5/2/2007 Turbidity, Field 20 NTU
311500020060-05 7/30/2007 Turbidity, Field 6 NTU
311500020060-01B 10/13/1999 Solids, Suspended 80 mg/L
311500020060-01B 4/26/2000 Solids, Suspended 19 mg/L
311500020060-01B 7/19/2000 Solids, Suspended 8 mg/L
311500020060-01S 10/13/1999 Solids, Suspended 6 mg/L
311500020060-01S 1/11/2000 Solids, Suspended 21 mg/L
311500020060-01S 4/26/2000 Solids, Suspended 15 mg/L
311500020060-01S 7/19/2000 Solids, Suspended 8 mg/L
311500020060-02 7/19/2000 Solids, Suspended 6 mg/L
311500020060-02 1/11/2000 Solids, Suspended 20 mg/L
311500020060-02 4/26/2000 Solids, Suspended 14 mg/L
311500020060-02 10/13/1999 Solids, Suspended 2 mg/L
311500020060-03 10/13/1999 Solids, Suspended 18 mg/L
311500020060-03 1/11/2000 Solids, Suspended 20 mg/L
311500020060-03 4/26/2000 Solids, Suspended 17 mg/L
311500020060-03 7/19/2000 Solids, Suspended 6 mg/L
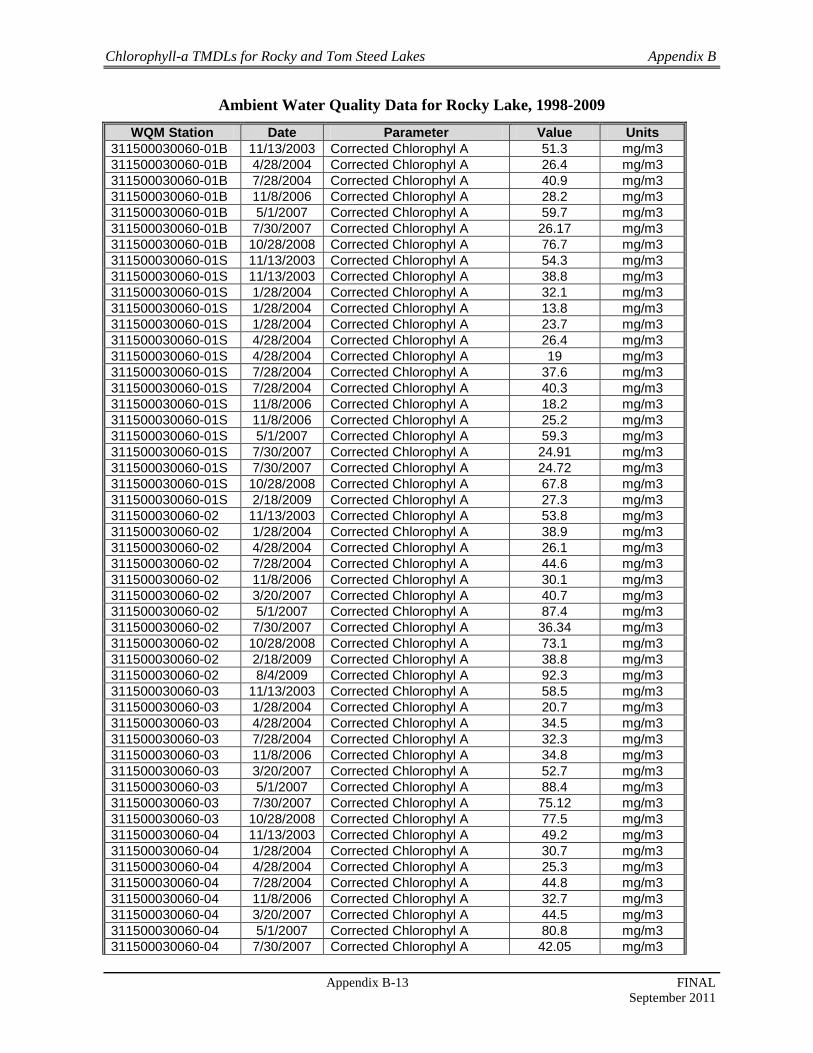
Chlorophyll-a TMDLs for Rocky and Tom Steed Lakes Appendix B
Appendix B-13 FINAL
September 2011
Ambient Water Quality Data for Rocky Lake, 1998-2009
WQM Station Date Parameter Value Units
311500030060-01B 11/13/2003 Corrected Chlorophyl A 51.3 mg/m3
311500030060-01B 4/28/2004 Corrected Chlorophyl A 26.4 mg/m3
311500030060-01B 7/28/2004 Corrected Chlorophyl A 40.9 mg/m3
311500030060-01B 11/8/2006 Corrected Chlorophyl A 28.2 mg/m3
311500030060-01B 5/1/2007 Corrected Chlorophyl A 59.7 mg/m3
311500030060-01B 7/30/2007 Corrected Chlorophyl A 26.17 mg/m3
311500030060-01B 10/28/2008 Corrected Chlorophyl A 76.7 mg/m3
311500030060-01S 11/13/2003 Corrected Chlorophyl A 54.3 mg/m3
311500030060-01S 11/13/2003 Corrected Chlorophyl A 38.8 mg/m3
311500030060-01S 1/28/2004 Corrected Chlorophyl A 32.1 mg/m3
311500030060-01S 1/28/2004 Corrected Chlorophyl A 13.8 mg/m3
311500030060-01S 1/28/2004 Corrected Chlorophyl A 23.7 mg/m3
311500030060-01S 4/28/2004 Corrected Chlorophyl A 26.4 mg/m3
311500030060-01S 4/28/2004 Corrected Chlorophyl A 19 mg/m3
311500030060-01S 7/28/2004 Corrected Chlorophyl A 37.6 mg/m3
311500030060-01S 7/28/2004 Corrected Chlorophyl A 40.3 mg/m3
311500030060-01S 11/8/2006 Corrected Chlorophyl A 18.2 mg/m3
311500030060-01S 11/8/2006 Corrected Chlorophyl A 25.2 mg/m3
311500030060-01S 5/1/2007 Corrected Chlorophyl A 59.3 mg/m3
311500030060-01S 7/30/2007 Corrected Chlorophyl A 24.91 mg/m3
311500030060-01S 7/30/2007 Corrected Chlorophyl A 24.72 mg/m3
311500030060-01S 10/28/2008 Corrected Chlorophyl A 67.8 mg/m3
311500030060-01S 2/18/2009 Corrected Chlorophyl A 27.3 mg/m3
311500030060-02 11/13/2003 Corrected Chlorophyl A 53.8 mg/m3
311500030060-02 1/28/2004 Corrected Chlorophyl A 38.9 mg/m3
311500030060-02 4/28/2004 Corrected Chlorophyl A 26.1 mg/m3
311500030060-02 7/28/2004 Corrected Chlorophyl A 44.6 mg/m3
311500030060-02 11/8/2006 Corrected Chlorophyl A 30.1 mg/m3
311500030060-02 3/20/2007 Corrected Chlorophyl A 40.7 mg/m3
311500030060-02 5/1/2007 Corrected Chlorophyl A 87.4 mg/m3
311500030060-02 7/30/2007 Corrected Chlorophyl A 36.34 mg/m3
311500030060-02 10/28/2008 Corrected Chlorophyl A 73.1 mg/m3
311500030060-02 2/18/2009 Corrected Chlorophyl A 38.8 mg/m3
311500030060-02 8/4/2009 Corrected Chlorophyl A 92.3 mg/m3
311500030060-03 11/13/2003 Corrected Chlorophyl A 58.5 mg/m3
311500030060-03 1/28/2004 Corrected Chlorophyl A 20.7 mg/m3
311500030060-03 4/28/2004 Corrected Chlorophyl A 34.5 mg/m3
311500030060-03 7/28/2004 Corrected Chlorophyl A 32.3 mg/m3
311500030060-03 11/8/2006 Corrected Chlorophyl A 34.8 mg/m3
311500030060-03 3/20/2007 Corrected Chlorophyl A 52.7 mg/m3
311500030060-03 5/1/2007 Corrected Chlorophyl A 88.4 mg/m3
311500030060-03 7/30/2007 Corrected Chlorophyl A 75.12 mg/m3
311500030060-03 10/28/2008 Corrected Chlorophyl A 77.5 mg/m3
311500030060-04 11/13/2003 Corrected Chlorophyl A 49.2 mg/m3
311500030060-04 1/28/2004 Corrected Chlorophyl A 30.7 mg/m3
311500030060-04 4/28/2004 Corrected Chlorophyl A 25.3 mg/m3
311500030060-04 7/28/2004 Corrected Chlorophyl A 44.8 mg/m3
311500030060-04 11/8/2006 Corrected Chlorophyl A 32.7 mg/m3
311500030060-04 3/20/2007 Corrected Chlorophyl A 44.5 mg/m3
311500030060-04 5/1/2007 Corrected Chlorophyl A 80.8 mg/m3
311500030060-04 7/30/2007 Corrected Chlorophyl A 42.05 mg/m3
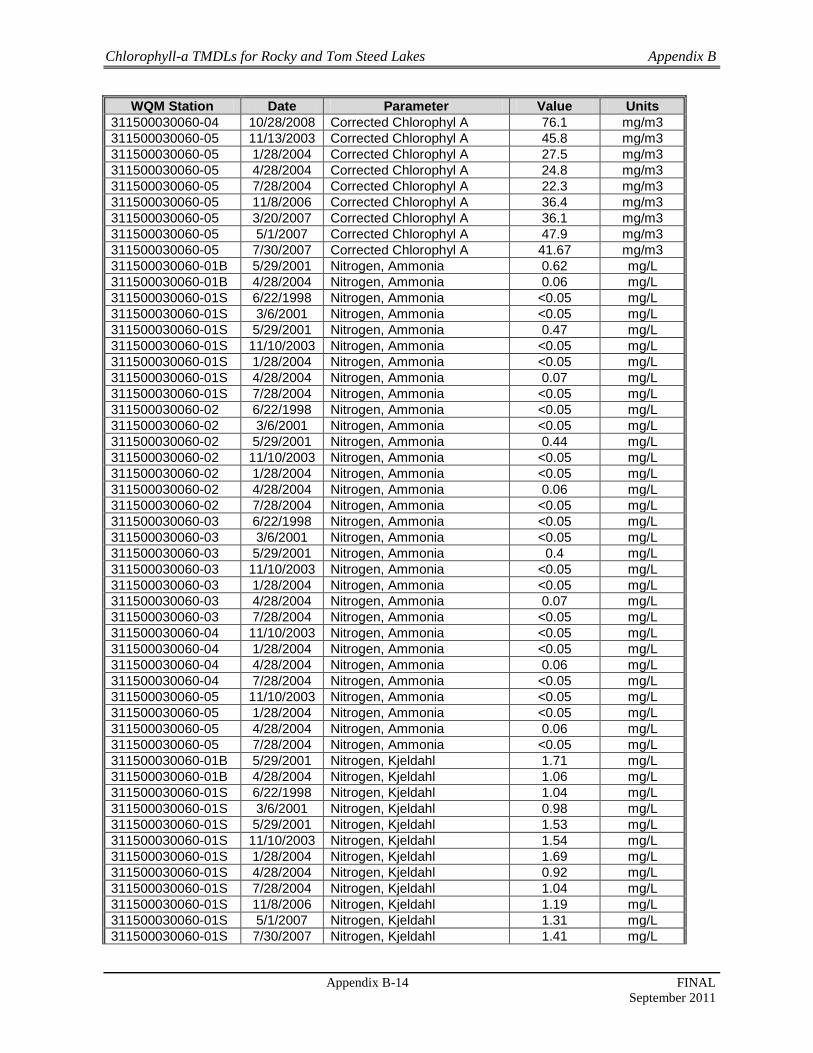
Chlorophyll-a TMDLs for Rocky and Tom Steed Lakes Appendix B
Appendix B-14 FINAL
September 2011
WQM Station Date Parameter Value Units
311500030060-04 10/28/2008 Corrected Chlorophyl A 76.1 mg/m3
311500030060-05 11/13/2003 Corrected Chlorophyl A 45.8 mg/m3
311500030060-05 1/28/2004 Corrected Chlorophyl A 27.5 mg/m3
311500030060-05 4/28/2004 Corrected Chlorophyl A 24.8 mg/m3
311500030060-05 7/28/2004 Corrected Chlorophyl A 22.3 mg/m3
311500030060-05 11/8/2006 Corrected Chlorophyl A 36.4 mg/m3
311500030060-05 3/20/2007 Corrected Chlorophyl A 36.1 mg/m3
311500030060-05 5/1/2007 Corrected Chlorophyl A 47.9 mg/m3
311500030060-05 7/30/2007 Corrected Chlorophyl A 41.67 mg/m3
311500030060-01B 5/29/2001 Nitrogen, Ammonia 0.62 mg/L
311500030060-01B 4/28/2004 Nitrogen, Ammonia 0.06 mg/L
311500030060-01S 6/22/1998 Nitrogen, Ammonia <0.05 mg/L
311500030060-01S 3/6/2001 Nitrogen, Ammonia <0.05 mg/L
311500030060-01S 5/29/2001 Nitrogen, Ammonia 0.47 mg/L
311500030060-01S 11/10/2003 Nitrogen, Ammonia <0.05 mg/L
311500030060-01S 1/28/2004 Nitrogen, Ammonia <0.05 mg/L
311500030060-01S 4/28/2004 Nitrogen, Ammonia 0.07 mg/L
311500030060-01S 7/28/2004 Nitrogen, Ammonia <0.05 mg/L
311500030060-02 6/22/1998 Nitrogen, Ammonia <0.05 mg/L
311500030060-02 3/6/2001 Nitrogen, Ammonia <0.05 mg/L
311500030060-02 5/29/2001 Nitrogen, Ammonia 0.44 mg/L
311500030060-02 11/10/2003 Nitrogen, Ammonia <0.05 mg/L
311500030060-02 1/28/2004 Nitrogen, Ammonia <0.05 mg/L
311500030060-02 4/28/2004 Nitrogen, Ammonia 0.06 mg/L
311500030060-02 7/28/2004 Nitrogen, Ammonia <0.05 mg/L
311500030060-03 6/22/1998 Nitrogen, Ammonia <0.05 mg/L
311500030060-03 3/6/2001 Nitrogen, Ammonia <0.05 mg/L
311500030060-03 5/29/2001 Nitrogen, Ammonia 0.4 mg/L
311500030060-03 11/10/2003 Nitrogen, Ammonia <0.05 mg/L
311500030060-03 1/28/2004 Nitrogen, Ammonia <0.05 mg/L
311500030060-03 4/28/2004 Nitrogen, Ammonia 0.07 mg/L
311500030060-03 7/28/2004 Nitrogen, Ammonia <0.05 mg/L
311500030060-04 11/10/2003 Nitrogen, Ammonia <0.05 mg/L
311500030060-04 1/28/2004 Nitrogen, Ammonia <0.05 mg/L
311500030060-04 4/28/2004 Nitrogen, Ammonia 0.06 mg/L
311500030060-04 7/28/2004 Nitrogen, Ammonia <0.05 mg/L
311500030060-05 11/10/2003 Nitrogen, Ammonia <0.05 mg/L
311500030060-05 1/28/2004 Nitrogen, Ammonia <0.05 mg/L
311500030060-05 4/28/2004 Nitrogen, Ammonia 0.06 mg/L
311500030060-05 7/28/2004 Nitrogen, Ammonia <0.05 mg/L
311500030060-01B 5/29/2001 Nitrogen, Kjeldahl 1.71 mg/L
311500030060-01B 4/28/2004 Nitrogen, Kjeldahl 1.06 mg/L
311500030060-01S 6/22/1998 Nitrogen, Kjeldahl 1.04 mg/L
311500030060-01S 3/6/2001 Nitrogen, Kjeldahl 0.98 mg/L
311500030060-01S 5/29/2001 Nitrogen, Kjeldahl 1.53 mg/L
311500030060-01S 11/10/2003 Nitrogen, Kjeldahl 1.54 mg/L
311500030060-01S 1/28/2004 Nitrogen, Kjeldahl 1.69 mg/L
311500030060-01S 4/28/2004 Nitrogen, Kjeldahl 0.92 mg/L
311500030060-01S 7/28/2004 Nitrogen, Kjeldahl 1.04 mg/L
311500030060-01S 11/8/2006 Nitrogen, Kjeldahl 1.19 mg/L
311500030060-01S 5/1/2007 Nitrogen, Kjeldahl 1.31 mg/L
311500030060-01S 7/30/2007 Nitrogen, Kjeldahl 1.41 mg/L

Chlorophyll-a TMDLs for Rocky and Tom Steed Lakes Appendix B
Appendix B-15 FINAL
September 2011
WQM Station Date Parameter Value Units
311500030060-01S 10/28/2008 Nitrogen, Kjeldahl 1.44 mg/L
311500030060-02 6/22/1998 Nitrogen, Kjeldahl 0.95 mg/L
311500030060-02 3/6/2001 Nitrogen, Kjeldahl 0.93 mg/L
311500030060-02 5/29/2001 Nitrogen, Kjeldahl 1.47 mg/L
311500030060-02 11/10/2003 Nitrogen, Kjeldahl 1.47 mg/L
311500030060-02 1/28/2004 Nitrogen, Kjeldahl 1.71 mg/L
311500030060-02 4/28/2004 Nitrogen, Kjeldahl 0.96 mg/L
311500030060-02 7/28/2004 Nitrogen, Kjeldahl 1.01 mg/L
311500030060-02 11/8/2006 Nitrogen, Kjeldahl 1.19 mg/L
311500030060-02 3/20/2007 Nitrogen, Kjeldahl 1.27 mg/L
311500030060-02 5/1/2007 Nitrogen, Kjeldahl 1.44 mg/L
311500030060-02 7/30/2007 Nitrogen, Kjeldahl 1.07 mg/L
311500030060-02 10/28/2008 Nitrogen, Kjeldahl 1.48 mg/L
311500030060-02 2/18/2009 Nitrogen, Kjeldahl 1.58 mg/L
311500030060-02 5/5/2009 Nitrogen, Kjeldahl 1.63 mg/L
311500030060-03 6/22/1998 Nitrogen, Kjeldahl 1.18 mg/L
311500030060-03 3/6/2001 Nitrogen, Kjeldahl 1.13 mg/L
311500030060-03 5/29/2001 Nitrogen, Kjeldahl 1.5 mg/L
311500030060-03 11/10/2003 Nitrogen, Kjeldahl 1.61 mg/L
311500030060-03 1/28/2004 Nitrogen, Kjeldahl 1.98 mg/L
311500030060-03 4/28/2004 Nitrogen, Kjeldahl 1.32 mg/L
311500030060-03 7/28/2004 Nitrogen, Kjeldahl 1.09 mg/L
311500030060-03 11/8/2006 Nitrogen, Kjeldahl 1.2 mg/L
311500030060-03 3/20/2007 Nitrogen, Kjeldahl 1.47 mg/L
311500030060-03 5/1/2007 Nitrogen, Kjeldahl 1.42 mg/L
311500030060-03 7/30/2007 Nitrogen, Kjeldahl 1.27 mg/L
311500030060-03 10/28/2008 Nitrogen, Kjeldahl 1.51 mg/L
311500030060-03 2/18/2009 Nitrogen, Kjeldahl 1.53 mg/L
311500030060-03 5/5/2009 Nitrogen, Kjeldahl 0.86 mg/L
311500030060-04 11/10/2003 Nitrogen, Kjeldahl 1.59 mg/L
311500030060-04 1/28/2004 Nitrogen, Kjeldahl 1.67 mg/L
311500030060-04 4/28/2004 Nitrogen, Kjeldahl 1.04 mg/L
311500030060-04 7/28/2004 Nitrogen, Kjeldahl 1.09 mg/L
311500030060-04 11/8/2006 Nitrogen, Kjeldahl 1.28 mg/L
311500030060-04 3/20/2007 Nitrogen, Kjeldahl 1.27 mg/L
311500030060-04 5/1/2007 Nitrogen, Kjeldahl 1.5 mg/L
311500030060-04 7/30/2007 Nitrogen, Kjeldahl 1.1 mg/L
311500030060-05 11/10/2003 Nitrogen, Kjeldahl 1.62 mg/L
311500030060-05 1/28/2004 Nitrogen, Kjeldahl 1.75 mg/L
311500030060-05 4/28/2004 Nitrogen, Kjeldahl 0.96 mg/L
311500030060-05 7/28/2004 Nitrogen, Kjeldahl 0.96 mg/L
311500030060-05 11/8/2006 Nitrogen, Kjeldahl 1.32 mg/L
311500030060-05 3/20/2007 Nitrogen, Kjeldahl 1.29 mg/L
311500030060-05 5/1/2007 Nitrogen, Kjeldahl 1.34 mg/L
311500030060-05 7/30/2007 Nitrogen, Kjeldahl 1.17 mg/L
311500030060-01B 5/29/2001 Nitrogen, Nitrate as N 0.1 mg/L
311500030060-01B 4/28/2004 Nitrogen, Nitrate as N <0.05 mg/L
311500030060-01S 6/22/1998 Nitrogen, Nitrate as N <0.05 mg/L
311500030060-01S 3/6/2001 Nitrogen, Nitrate as N 0.34 mg/L
311500030060-01S 5/29/2001 Nitrogen, Nitrate as N 0.15 mg/L
311500030060-01S 11/10/2003 Nitrogen, Nitrate as N <0.05 mg/L
311500030060-01S 1/28/2004 Nitrogen, Nitrate as N 0.15 mg/L
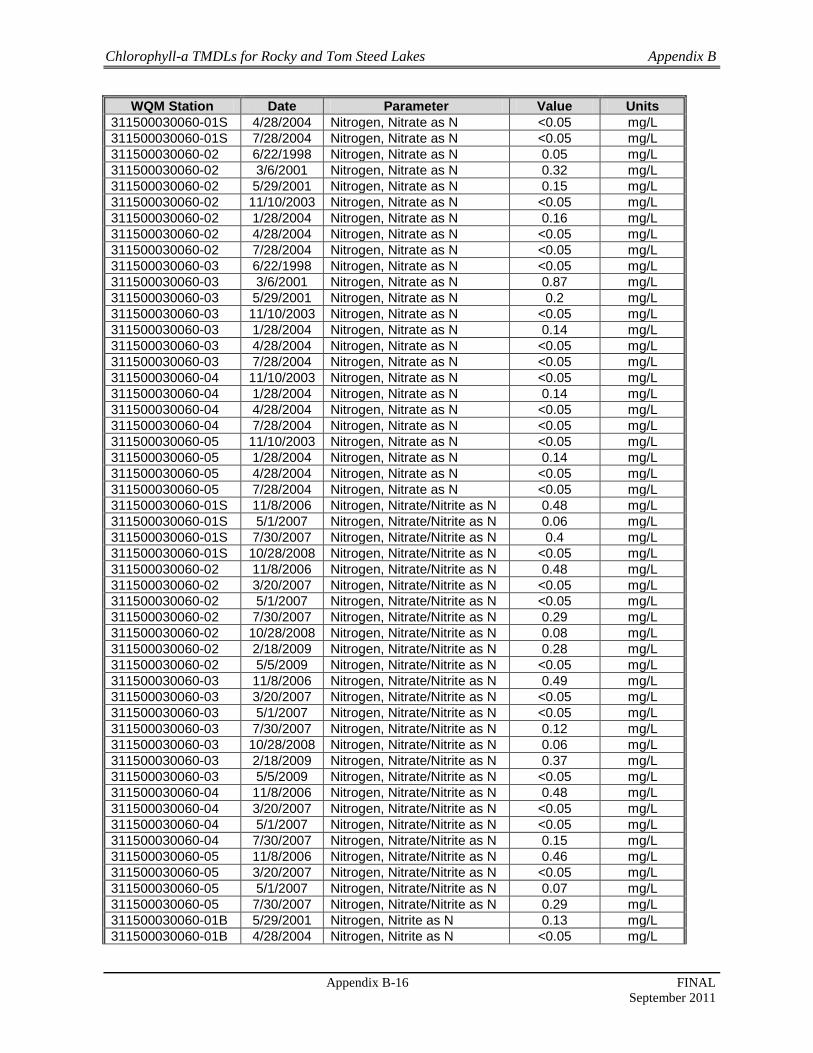
Chlorophyll-a TMDLs for Rocky and Tom Steed Lakes Appendix B
Appendix B-16 FINAL
September 2011
WQM Station Date Parameter Value Units
311500030060-01S 4/28/2004 Nitrogen, Nitrate as N <0.05 mg/L
311500030060-01S 7/28/2004 Nitrogen, Nitrate as N <0.05 mg/L
311500030060-02 6/22/1998 Nitrogen, Nitrate as N 0.05 mg/L
311500030060-02 3/6/2001 Nitrogen, Nitrate as N 0.32 mg/L
311500030060-02 5/29/2001 Nitrogen, Nitrate as N 0.15 mg/L
311500030060-02 11/10/2003 Nitrogen, Nitrate as N <0.05 mg/L
311500030060-02 1/28/2004 Nitrogen, Nitrate as N 0.16 mg/L
311500030060-02 4/28/2004 Nitrogen, Nitrate as N <0.05 mg/L
311500030060-02 7/28/2004 Nitrogen, Nitrate as N <0.05 mg/L
311500030060-03 6/22/1998 Nitrogen, Nitrate as N <0.05 mg/L
311500030060-03 3/6/2001 Nitrogen, Nitrate as N 0.87 mg/L
311500030060-03 5/29/2001 Nitrogen, Nitrate as N 0.2 mg/L
311500030060-03 11/10/2003 Nitrogen, Nitrate as N <0.05 mg/L
311500030060-03 1/28/2004 Nitrogen, Nitrate as N 0.14 mg/L
311500030060-03 4/28/2004 Nitrogen, Nitrate as N <0.05 mg/L
311500030060-03 7/28/2004 Nitrogen, Nitrate as N <0.05 mg/L
311500030060-04 11/10/2003 Nitrogen, Nitrate as N <0.05 mg/L
311500030060-04 1/28/2004 Nitrogen, Nitrate as N 0.14 mg/L
311500030060-04 4/28/2004 Nitrogen, Nitrate as N <0.05 mg/L
311500030060-04 7/28/2004 Nitrogen, Nitrate as N <0.05 mg/L
311500030060-05 11/10/2003 Nitrogen, Nitrate as N <0.05 mg/L
311500030060-05 1/28/2004 Nitrogen, Nitrate as N 0.14 mg/L
311500030060-05 4/28/2004 Nitrogen, Nitrate as N <0.05 mg/L
311500030060-05 7/28/2004 Nitrogen, Nitrate as N <0.05 mg/L
311500030060-01S 11/8/2006 Nitrogen, Nitrate/Nitrite as N 0.48 mg/L
311500030060-01S 5/1/2007 Nitrogen, Nitrate/Nitrite as N 0.06 mg/L
311500030060-01S 7/30/2007 Nitrogen, Nitrate/Nitrite as N 0.4 mg/L
311500030060-01S 10/28/2008 Nitrogen, Nitrate/Nitrite as N <0.05 mg/L
311500030060-02 11/8/2006 Nitrogen, Nitrate/Nitrite as N 0.48 mg/L
311500030060-02 3/20/2007 Nitrogen, Nitrate/Nitrite as N <0.05 mg/L
311500030060-02 5/1/2007 Nitrogen, Nitrate/Nitrite as N <0.05 mg/L
311500030060-02 7/30/2007 Nitrogen, Nitrate/Nitrite as N 0.29 mg/L
311500030060-02 10/28/2008 Nitrogen, Nitrate/Nitrite as N 0.08 mg/L
311500030060-02 2/18/2009 Nitrogen, Nitrate/Nitrite as N 0.28 mg/L
311500030060-02 5/5/2009 Nitrogen, Nitrate/Nitrite as N <0.05 mg/L
311500030060-03 11/8/2006 Nitrogen, Nitrate/Nitrite as N 0.49 mg/L
311500030060-03 3/20/2007 Nitrogen, Nitrate/Nitrite as N <0.05 mg/L
311500030060-03 5/1/2007 Nitrogen, Nitrate/Nitrite as N <0.05 mg/L
311500030060-03 7/30/2007 Nitrogen, Nitrate/Nitrite as N 0.12 mg/L
311500030060-03 10/28/2008 Nitrogen, Nitrate/Nitrite as N 0.06 mg/L
311500030060-03 2/18/2009 Nitrogen, Nitrate/Nitrite as N 0.37 mg/L
311500030060-03 5/5/2009 Nitrogen, Nitrate/Nitrite as N <0.05 mg/L
311500030060-04 11/8/2006 Nitrogen, Nitrate/Nitrite as N 0.48 mg/L
311500030060-04 3/20/2007 Nitrogen, Nitrate/Nitrite as N <0.05 mg/L
311500030060-04 5/1/2007 Nitrogen, Nitrate/Nitrite as N <0.05 mg/L
311500030060-04 7/30/2007 Nitrogen, Nitrate/Nitrite as N 0.15 mg/L
311500030060-05 11/8/2006 Nitrogen, Nitrate/Nitrite as N 0.46 mg/L
311500030060-05 3/20/2007 Nitrogen, Nitrate/Nitrite as N <0.05 mg/L
311500030060-05 5/1/2007 Nitrogen, Nitrate/Nitrite as N 0.07 mg/L
311500030060-05 7/30/2007 Nitrogen, Nitrate/Nitrite as N 0.29 mg/L
311500030060-01B 5/29/2001 Nitrogen, Nitrite as N 0.13 mg/L
311500030060-01B 4/28/2004 Nitrogen, Nitrite as N <0.05 mg/L
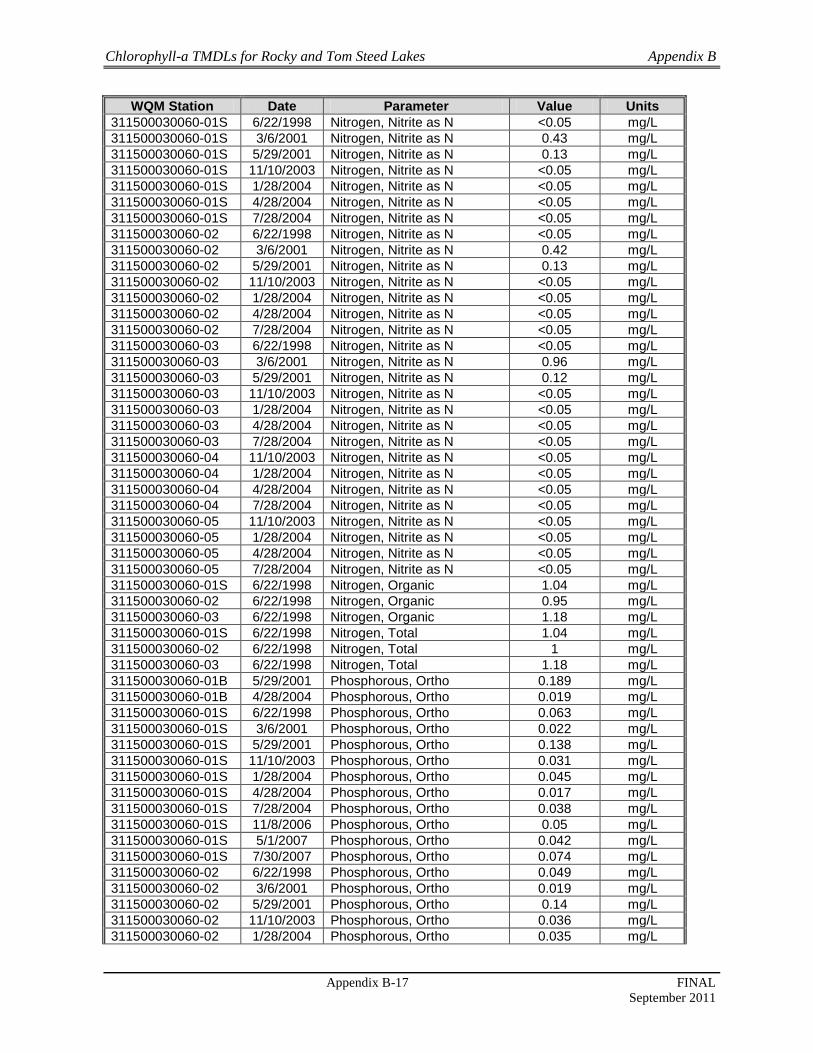
Chlorophyll-a TMDLs for Rocky and Tom Steed Lakes Appendix B
Appendix B-17 FINAL
September 2011
WQM Station Date Parameter Value Units
311500030060-01S 6/22/1998 Nitrogen, Nitrite as N <0.05 mg/L
311500030060-01S 3/6/2001 Nitrogen, Nitrite as N 0.43 mg/L
311500030060-01S 5/29/2001 Nitrogen, Nitrite as N 0.13 mg/L
311500030060-01S 11/10/2003 Nitrogen, Nitrite as N <0.05 mg/L
311500030060-01S 1/28/2004 Nitrogen, Nitrite as N <0.05 mg/L
311500030060-01S 4/28/2004 Nitrogen, Nitrite as N <0.05 mg/L
311500030060-01S 7/28/2004 Nitrogen, Nitrite as N <0.05 mg/L
311500030060-02 6/22/1998 Nitrogen, Nitrite as N <0.05 mg/L
311500030060-02 3/6/2001 Nitrogen, Nitrite as N 0.42 mg/L
311500030060-02 5/29/2001 Nitrogen, Nitrite as N 0.13 mg/L
311500030060-02 11/10/2003 Nitrogen, Nitrite as N <0.05 mg/L
311500030060-02 1/28/2004 Nitrogen, Nitrite as N <0.05 mg/L
311500030060-02 4/28/2004 Nitrogen, Nitrite as N <0.05 mg/L
311500030060-02 7/28/2004 Nitrogen, Nitrite as N <0.05 mg/L
311500030060-03 6/22/1998 Nitrogen, Nitrite as N <0.05 mg/L
311500030060-03 3/6/2001 Nitrogen, Nitrite as N 0.96 mg/L
311500030060-03 5/29/2001 Nitrogen, Nitrite as N 0.12 mg/L
311500030060-03 11/10/2003 Nitrogen, Nitrite as N <0.05 mg/L
311500030060-03 1/28/2004 Nitrogen, Nitrite as N <0.05 mg/L
311500030060-03 4/28/2004 Nitrogen, Nitrite as N <0.05 mg/L
311500030060-03 7/28/2004 Nitrogen, Nitrite as N <0.05 mg/L
311500030060-04 11/10/2003 Nitrogen, Nitrite as N <0.05 mg/L
311500030060-04 1/28/2004 Nitrogen, Nitrite as N <0.05 mg/L
311500030060-04 4/28/2004 Nitrogen, Nitrite as N <0.05 mg/L
311500030060-04 7/28/2004 Nitrogen, Nitrite as N <0.05 mg/L
311500030060-05 11/10/2003 Nitrogen, Nitrite as N <0.05 mg/L
311500030060-05 1/28/2004 Nitrogen, Nitrite as N <0.05 mg/L
311500030060-05 4/28/2004 Nitrogen, Nitrite as N <0.05 mg/L
311500030060-05 7/28/2004 Nitrogen, Nitrite as N <0.05 mg/L
311500030060-01S 6/22/1998 Nitrogen, Organic 1.04 mg/L
311500030060-02 6/22/1998 Nitrogen, Organic 0.95 mg/L
311500030060-03 6/22/1998 Nitrogen, Organic 1.18 mg/L
311500030060-01S 6/22/1998 Nitrogen, Total 1.04 mg/L
311500030060-02 6/22/1998 Nitrogen, Total 1 mg/L
311500030060-03 6/22/1998 Nitrogen, Total 1.18 mg/L
311500030060-01B 5/29/2001 Phosphorous, Ortho 0.189 mg/L
311500030060-01B 4/28/2004 Phosphorous, Ortho 0.019 mg/L
311500030060-01S 6/22/1998 Phosphorous, Ortho 0.063 mg/L
311500030060-01S 3/6/2001 Phosphorous, Ortho 0.022 mg/L
311500030060-01S 5/29/2001 Phosphorous, Ortho 0.138 mg/L
311500030060-01S 11/10/2003 Phosphorous, Ortho 0.031 mg/L
311500030060-01S 1/28/2004 Phosphorous, Ortho 0.045 mg/L
311500030060-01S 4/28/2004 Phosphorous, Ortho 0.017 mg/L
311500030060-01S 7/28/2004 Phosphorous, Ortho 0.038 mg/L
311500030060-01S 11/8/2006 Phosphorous, Ortho 0.05 mg/L
311500030060-01S 5/1/2007 Phosphorous, Ortho 0.042 mg/L
311500030060-01S 7/30/2007 Phosphorous, Ortho 0.074 mg/L
311500030060-02 6/22/1998 Phosphorous, Ortho 0.049 mg/L
311500030060-02 3/6/2001 Phosphorous, Ortho 0.019 mg/L
311500030060-02 5/29/2001 Phosphorous, Ortho 0.14 mg/L
311500030060-02 11/10/2003 Phosphorous, Ortho 0.036 mg/L
311500030060-02 1/28/2004 Phosphorous, Ortho 0.035 mg/L

Chlorophyll-a TMDLs for Rocky and Tom Steed Lakes Appendix B
Appendix B-18 FINAL
September 2011
WQM Station Date Parameter Value Units
311500030060-02 4/28/2004 Phosphorous, Ortho 0.02 mg/L
311500030060-02 7/28/2004 Phosphorous, Ortho 0.032 mg/L
311500030060-02 11/8/2006 Phosphorous, Ortho 0.046 mg/L
311500030060-02 3/20/2007 Phosphorous, Ortho 0.013 mg/L
311500030060-02 5/1/2007 Phosphorous, Ortho 0.033 mg/L
311500030060-02 7/30/2007 Phosphorous, Ortho 0.063 mg/L
311500030060-02 5/5/2009 Phosphorous, Ortho 0 mg/L
311500030060-02 8/4/2009 Phosphorous, Ortho 0 mg/L
311500030060-03 6/22/1998 Phosphorous, Ortho 0.048 mg/L
311500030060-03 3/6/2001 Phosphorous, Ortho 0.054 mg/L
311500030060-03 5/29/2001 Phosphorous, Ortho 0.128 mg/L
311500030060-03 11/10/2003 Phosphorous, Ortho 0.037 mg/L
311500030060-03 1/28/2004 Phosphorous, Ortho 0.032 mg/L
311500030060-03 4/28/2004 Phosphorous, Ortho 0.039 mg/L
311500030060-03 7/28/2004 Phosphorous, Ortho 0.032 mg/L
311500030060-03 11/8/2006 Phosphorous, Ortho 0.04 mg/L
311500030060-03 3/20/2007 Phosphorous, Ortho 0.016 mg/L
311500030060-03 5/1/2007 Phosphorous, Ortho 0.029 mg/L
311500030060-03 7/30/2007 Phosphorous, Ortho 0.033 mg/L
311500030060-03 5/5/2009 Phosphorous, Ortho 0 mg/L
311500030060-03 8/4/2009 Phosphorous, Ortho 0 mg/L
311500030060-04 11/10/2003 Phosphorous, Ortho 0.037 mg/L
311500030060-04 1/28/2004 Phosphorous, Ortho 0.029 mg/L
311500030060-04 4/28/2004 Phosphorous, Ortho 0.022 mg/L
311500030060-04 7/28/2004 Phosphorous, Ortho 0.029 mg/L
311500030060-04 11/8/2006 Phosphorous, Ortho 0.046 mg/L
311500030060-04 3/20/2007 Phosphorous, Ortho 0.01 mg/L
311500030060-04 5/1/2007 Phosphorous, Ortho 0.025 mg/L
311500030060-04 7/30/2007 Phosphorous, Ortho 0.045 mg/L
311500030060-05 11/10/2003 Phosphorous, Ortho 0.033 mg/L
311500030060-05 1/28/2004 Phosphorous, Ortho 0.03 mg/L
311500030060-05 4/28/2004 Phosphorous, Ortho 0.021 mg/L
311500030060-05 7/28/2004 Phosphorous, Ortho 0.029 mg/L
311500030060-05 11/8/2006 Phosphorous, Ortho 0.042 mg/L
311500030060-05 3/20/2007 Phosphorous, Ortho 0.012 mg/L
311500030060-05 5/1/2007 Phosphorous, Ortho 0.063 mg/L
311500030060-05 7/30/2007 Phosphorous, Ortho 0.052 mg/L
311500030060-01B 5/29/2001 Phosphorous, Total 0.318 mg/L
311500030060-01B 4/28/2004 Phosphorous, Total 0.102 mg/L
311500030060-01S 6/22/1998 Phosphorous, Total 0.098 mg/L
311500030060-01S 3/6/2001 Phosphorous, Total 0.06 mg/L
311500030060-01S 5/29/2001 Phosphorous, Total 0.242 mg/L
311500030060-01S 11/10/2003 Phosphorous, Total 0.135 mg/L
311500030060-01S 1/28/2004 Phosphorous, Total 0.126 mg/L
311500030060-01S 4/28/2004 Phosphorous, Total 0.092 mg/L
311500030060-01S 7/28/2004 Phosphorous, Total 0.142 mg/L
311500030060-01S 11/8/2006 Phosphorous, Total 0.155 mg/L
311500030060-01S 5/1/2007 Phosphorous, Total 0.096 mg/L
311500030060-01S 7/30/2007 Phosphorous, Total 0.181 mg/L
311500030060-01S 10/28/2008 Phosphorous, Total 0.126 mg/L
311500030060-02 6/22/1998 Phosphorous, Total 0.132 mg/L
311500030060-02 3/6/2001 Phosphorous, Total 0.06 mg/L

Chlorophyll-a TMDLs for Rocky and Tom Steed Lakes Appendix B
Appendix B-19 FINAL
September 2011
WQM Station Date Parameter Value Units
311500030060-02 5/29/2001 Phosphorous, Total 0.209 mg/L
311500030060-02 11/10/2003 Phosphorous, Total 0.134 mg/L
311500030060-02 1/28/2004 Phosphorous, Total 0.129 mg/L
311500030060-02 4/28/2004 Phosphorous, Total 0.107 mg/L
311500030060-02 7/28/2004 Phosphorous, Total 0.13 mg/L
311500030060-02 11/8/2006 Phosphorous, Total 0.14 mg/L
311500030060-02 3/20/2007 Phosphorous, Total 0.088 mg/L
311500030060-02 5/1/2007 Phosphorous, Total 0.102 mg/L
311500030060-02 7/30/2007 Phosphorous, Total 0.174 mg/L
311500030060-02 10/28/2008 Phosphorous, Total 0.131 mg/L
311500030060-02 2/18/2009 Phosphorous, Total 0.1 mg/L
311500030060-02 5/5/2009 Phosphorous, Total 0.144 mg/L
311500030060-03 6/22/1998 Phosphorous, Total 0.066 mg/L
311500030060-03 3/6/2001 Phosphorous, Total 0.137 mg/L
311500030060-03 5/29/2001 Phosphorous, Total 0.216 mg/L
311500030060-03 11/10/2003 Phosphorous, Total 0.156 mg/L
311500030060-03 1/28/2004 Phosphorous, Total 0.171 mg/L
311500030060-03 4/28/2004 Phosphorous, Total 0.155 mg/L
311500030060-03 7/28/2004 Phosphorous, Total 0.13 mg/L
311500030060-03 11/8/2006 Phosphorous, Total 0.14 mg/L
311500030060-03 3/20/2007 Phosphorous, Total 0.123 mg/L
311500030060-03 5/1/2007 Phosphorous, Total 0.108 mg/L
311500030060-03 7/30/2007 Phosphorous, Total 0.167 mg/L
311500030060-03 10/28/2008 Phosphorous, Total 0.131 mg/L
311500030060-03 2/18/2009 Phosphorous, Total 0.113 mg/L
311500030060-03 5/5/2009 Phosphorous, Total 0.154 mg/L
311500030060-04 11/10/2003 Phosphorous, Total 0.14 mg/L
311500030060-04 1/28/2004 Phosphorous, Total 0.128 mg/L
311500030060-04 4/28/2004 Phosphorous, Total 0.11 mg/L
311500030060-04 7/28/2004 Phosphorous, Total 0.121 mg/L
311500030060-04 11/8/2006 Phosphorous, Total 0.146 mg/L
311500030060-04 3/20/2007 Phosphorous, Total 0.083 mg/L
311500030060-04 5/1/2007 Phosphorous, Total 0.104 mg/L
311500030060-04 7/30/2007 Phosphorous, Total 0.149 mg/L
311500030060-05 11/10/2003 Phosphorous, Total 0.139 mg/L
311500030060-05 1/28/2004 Phosphorous, Total 0.137 mg/L
311500030060-05 4/28/2004 Phosphorous, Total 0.1 mg/L
311500030060-05 7/28/2004 Phosphorous, Total 0.12 mg/L
311500030060-05 11/8/2006 Phosphorous, Total 0.139 mg/L
311500030060-05 3/20/2007 Phosphorous, Total 0.081 mg/L
311500030060-05 5/1/2007 Phosphorous, Total 0.126 mg/L
311500030060-05 7/30/2007 Phosphorous, Total 0.157 mg/L
311500030060-01S 3/6/2001 Secchi Depth 50 cm
311500030060-01S 5/29/2001 Secchi Depth 44 cm
311500030060-01S 8/27/2001 Secchi Depth 26 cm
311500030060-01S 11/10/2003 Secchi Depth 31 cm
311500030060-01S 1/28/2004 Secchi Depth 33 cm
311500030060-01S 4/28/2004 Secchi Depth 48 cm
311500030060-01S 7/28/2004 Secchi Depth 23 cm
311500030060-02 3/6/2001 Secchi Depth 50 cm
311500030060-02 5/29/2001 Secchi Depth 28 cm
311500030060-02 8/27/2001 Secchi Depth 15 cm
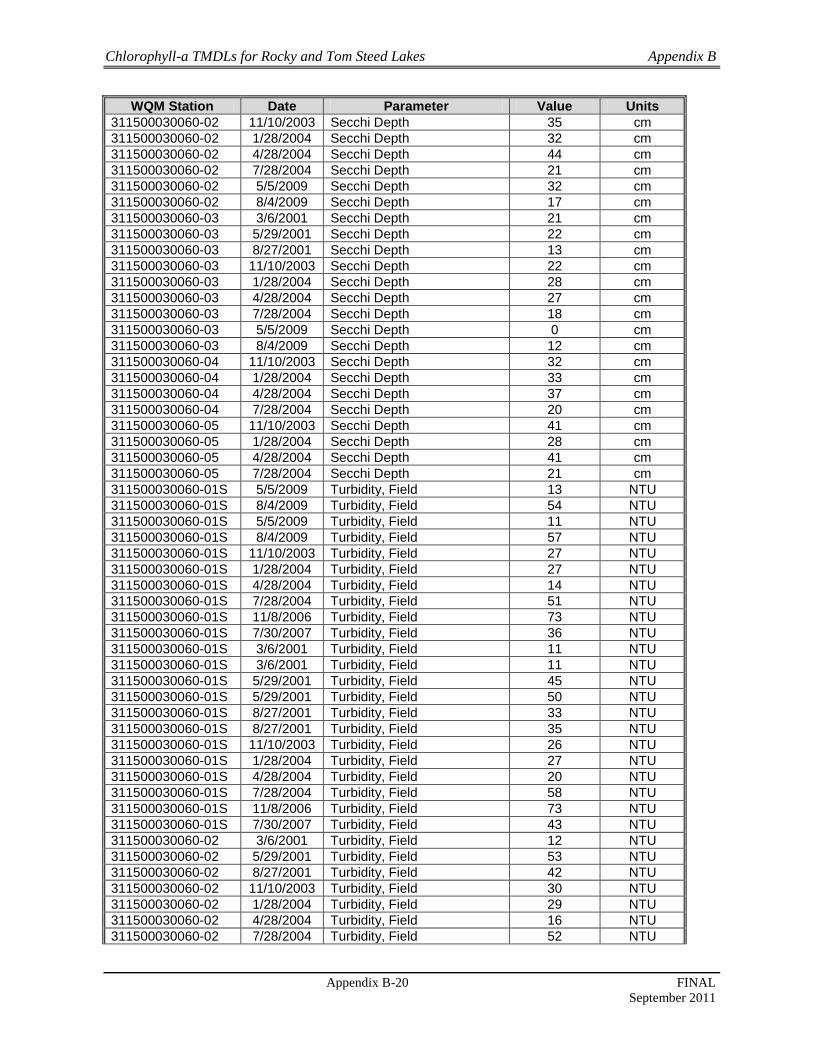
Chlorophyll-a TMDLs for Rocky and Tom Steed Lakes Appendix B
Appendix B-20 FINAL
September 2011
WQM Station Date Parameter Value Units
311500030060-02 11/10/2003 Secchi Depth 35 cm
311500030060-02 1/28/2004 Secchi Depth 32 cm
311500030060-02 4/28/2004 Secchi Depth 44 cm
311500030060-02 7/28/2004 Secchi Depth 21 cm
311500030060-02 5/5/2009 Secchi Depth 32 cm
311500030060-02 8/4/2009 Secchi Depth 17 cm
311500030060-03 3/6/2001 Secchi Depth 21 cm
311500030060-03 5/29/2001 Secchi Depth 22 cm
311500030060-03 8/27/2001 Secchi Depth 13 cm
311500030060-03 11/10/2003 Secchi Depth 22 cm
311500030060-03 1/28/2004 Secchi Depth 28 cm
311500030060-03 4/28/2004 Secchi Depth 27 cm
311500030060-03 7/28/2004 Secchi Depth 18 cm
311500030060-03 5/5/2009 Secchi Depth 0 cm
311500030060-03 8/4/2009 Secchi Depth 12 cm
311500030060-04 11/10/2003 Secchi Depth 32 cm
311500030060-04 1/28/2004 Secchi Depth 33 cm
311500030060-04 4/28/2004 Secchi Depth 37 cm
311500030060-04 7/28/2004 Secchi Depth 20 cm
311500030060-05 11/10/2003 Secchi Depth 41 cm
311500030060-05 1/28/2004 Secchi Depth 28 cm
311500030060-05 4/28/2004 Secchi Depth 41 cm
311500030060-05 7/28/2004 Secchi Depth 21 cm
311500030060-01S 5/5/2009 Turbidity, Field 13 NTU
311500030060-01S 8/4/2009 Turbidity, Field 54 NTU
311500030060-01S 5/5/2009 Turbidity, Field 11 NTU
311500030060-01S 8/4/2009 Turbidity, Field 57 NTU
311500030060-01S 11/10/2003 Turbidity, Field 27 NTU
311500030060-01S 1/28/2004 Turbidity, Field 27 NTU
311500030060-01S 4/28/2004 Turbidity, Field 14 NTU
311500030060-01S 7/28/2004 Turbidity, Field 51 NTU
311500030060-01S 11/8/2006 Turbidity, Field 73 NTU
311500030060-01S 7/30/2007 Turbidity, Field 36 NTU
311500030060-01S 3/6/2001 Turbidity, Field 11 NTU
311500030060-01S 3/6/2001 Turbidity, Field 11 NTU
311500030060-01S 5/29/2001 Turbidity, Field 45 NTU
311500030060-01S 5/29/2001 Turbidity, Field 50 NTU
311500030060-01S 8/27/2001 Turbidity, Field 33 NTU
311500030060-01S 8/27/2001 Turbidity, Field 35 NTU
311500030060-01S 11/10/2003 Turbidity, Field 26 NTU
311500030060-01S 1/28/2004 Turbidity, Field 27 NTU
311500030060-01S 4/28/2004 Turbidity, Field 20 NTU
311500030060-01S 7/28/2004 Turbidity, Field 58 NTU
311500030060-01S 11/8/2006 Turbidity, Field 73 NTU
311500030060-01S 7/30/2007 Turbidity, Field 43 NTU
311500030060-02 3/6/2001 Turbidity, Field 12 NTU
311500030060-02 5/29/2001 Turbidity, Field 53 NTU
311500030060-02 8/27/2001 Turbidity, Field 42 NTU
311500030060-02 11/10/2003 Turbidity, Field 30 NTU
311500030060-02 1/28/2004 Turbidity, Field 29 NTU
311500030060-02 4/28/2004 Turbidity, Field 16 NTU
311500030060-02 7/28/2004 Turbidity, Field 52 NTU

Chlorophyll-a TMDLs for Rocky and Tom Steed Lakes Appendix B
Appendix B-21 FINAL
September 2011
WQM Station Date Parameter Value Units
311500030060-02 11/8/2006 Turbidity, Field 61 NTU
311500030060-02 3/20/2007 Turbidity, Field 31 NTU
311500030060-02 7/30/2007 Turbidity, Field 36 NTU
311500030060-02 5/5/2009 Turbidity, Field 15 NTU
311500030060-02 8/4/2009 Turbidity, Field 66 NTU
311500030060-03 3/6/2001 Turbidity, Field 53 NTU
311500030060-03 5/29/2001 Turbidity, Field 56 NTU
311500030060-03 8/27/2001 Turbidity, Field 50 NTU
311500030060-03 11/10/2003 Turbidity, Field 40 NTU
311500030060-03 1/28/2004 Turbidity, Field 99 NTU
311500030060-03 4/28/2004 Turbidity, Field 73 NTU
311500030060-03 7/28/2004 Turbidity, Field 68 NTU
311500030060-03 11/8/2006 Turbidity, Field 65 NTU
311500030060-03 3/20/2007 Turbidity, Field 83 NTU
311500030060-03 7/30/2007 Turbidity, Field 23 NTU
311500030060-03 5/5/2009 Turbidity, Field 14 NTU
311500030060-03 8/4/2009 Turbidity, Field 95 NTU
311500030060-04 11/10/2003 Turbidity, Field 37 NTU
311500030060-04 1/28/2004 Turbidity, Field 29 NTU
311500030060-04 4/28/2004 Turbidity, Field 18 NTU
311500030060-04 7/28/2004 Turbidity, Field 47 NTU
311500030060-04 11/8/2006 Turbidity, Field 68 NTU
311500030060-04 3/20/2007 Turbidity, Field 44 NTU
311500030060-04 7/30/2007 Turbidity, Field 22 NTU
311500030060-05 11/10/2003 Turbidity, Field 28 NTU
311500030060-05 1/28/2004 Turbidity, Field 31 NTU
311500030060-05 4/28/2004 Turbidity, Field 22 NTU
311500030060-05 7/28/2004 Turbidity, Field 44 NTU
311500030060-05 11/8/2006 Turbidity, Field 56 NTU
311500030060-05 3/20/2007 Turbidity, Field 40 NTU
311500030060-05 7/30/2007 Turbidity, Field 31 NTU
311500030060-01S 6/22/1998 Solids, Suspended 44 mg/L
311500030060-02 6/22/1998 Solids, Suspended 32 mg/L
311500030060-03 6/22/1998 Solids, Suspended 35 mg/L

Chlorophyll-a TMDLs for Rocky and Tom Steed Lakes Appendix C
Appendix C-1 FINAL
September 2011
APPENDIX C
RESPONSE TO COMMENTS

Chlorophyll-a TMDLs for Rocky and Tom Steed Lakes Appendix C
Appendix C-2 FINAL
September 2011
Comment received via e-mail from John D. Marshall of Roosevelt, OK on August 7, 2011.
Comment: I live at cold springs on the north side of lake Tom Steed, our water is pumped
from the lake and supposedly filtered enough for us to drink. I've been here 3 years, I cant
afford to filter the water myself or buy bottled water. I have 2 55 gallon fish tanks and had
planed on raising african chiclids like I did before I moved here. I cant even keep pleco's that
are hard to kill alive in this water. Nothing but native fish like minnows and blusegills will live.
The only other fish that survive are goldfish and ghost shrimp (I found the ghost shrimp in the
lake, they arnt native, probably used as bait, walmart sells them). Now I cant keep a tropical
fish alive in this water and we're expected to pay for it as drinking water?
When they flush the lines I have water blacker than my coffee coming out of my
faucets, there's nothing anyone can say that will convince me that cant hurt our health. 3 people
have ended up with colostomy bags that lived here. The manganese deposits have coated my
fish tanks, have ruined 2 faucets and a shower head that were new 3 years ago. I've got samples
of the deposits and I've had a blood test that said my manganese was slightly high and I've lost
a lung to cancer bout a yr after I moved here. I've also got a sample of the black water, dead
algae that's settled in the lines I guess.
I've got a 13 yr old son who has to drink this "water " and I'm worried what its doing to
him long term, like the interaction with disinfectants.
Response: This statement is about the general drinking water quality of a community by Lake
Tom Steed. It does not concern the pollutants this TMDL is intended to address nor does it
provide comments on the specifics of this TMDL. Nevertheless, Mr. Marshall’s concerns have
been noted and this statement has been referred to ODEQ’s Environmental Complaints and
Local Services for further investigation.