final traffic impact analysis reportmedia.metro.net/.../traffic-impact-analysis/part-2-of-2.pdffinal...
TRANSCRIPT

Final Traffic Impact Assessment Report
4.0—Future Traffic Conditions
W E S T S I D E S U B W A Y E X T E N S I O N Page 4-22 August 18, 2010
Figure 4-4. Year 2035 Alternative 1 Intersection Levels of Service

Final Traffic Impact Assessment Report
4.0—Future Traffic Conditions
W E S T S I D E S U B W A Y E X T E N S I O N August 18, 2010 Page 4-23
Figure 4-4. Year 2035 Alternative 1 Intersection Levels of Service (continued)

Final Traffic Impact Assessment Report
4.0—Future Traffic Conditions
W E S T S I D E S U B W A Y E X T E N S I O N Page 4-24 August 18, 2010
Figure 4-4. Year 2035 Alternative 1 Intersection Levels of Service (continued)

Final Traffic Impact Assessment Report
4.0—Future Traffic Conditions
W E S T S I D E S U B W A Y E X T E N S I O N August 18, 2010 Page 4-25
Figure 4-4. Year 2035 Alternative 1 Intersection Levels of Service (continued)

Final Traffic Impact Assessment Report
4.0—Future Traffic Conditions
W E S T S I D E S U B W A Y E X T E N S I O N Page 4-26 August 18, 2010
Figure 4-4. Year 2035 Alternative 1 Intersection Levels of Service (continued)

Final Traffic Impact Assessment Report
4.0—Future Traffic Conditions
W E S T S I D E S U B W A Y E X T E N S I O N August 18, 2010 Page 4-27
Figure 4-5. Year 2035 MOS 1 Intersection Levels of Service

Final Traffic Impact Assessment Report
4.0—Future Traffic Conditions
W E S T S I D E S U B W A Y E X T E N S I O N Page 4-28 August 18, 2010
Figure 4-5. Year 2035 MOS 1 Intersection Levels of Service (continued)

Final Traffic Impact Assessment Report
4.0—Future Traffic Conditions
W E S T S I D E S U B W A Y E X T E N S I O N August 18, 2010 Page 4-29
Figure 4-5. Year 2035 MOS 1 Intersection Levels of Service (continued)

Final Traffic Impact Assessment Report
4.0—Future Traffic Conditions
W E S T S I D E S U B W A Y E X T E N S I O N Page 4-30 August 18, 2010
Figure 4-5. Year 2035 MOS 1 Intersection Levels of Service (continued)

Final Traffic Impact Assessment Report
4.0—Future Traffic Conditions
W E S T S I D E S U B W A Y E X T E N S I O N August 18, 2010 Page 4-31
Figure 4-5. Year 2035 MOS 1 Intersection Levels of Service (continued)

Final Traffic Impact Assessment Report
4.0—Future Traffic Conditions
W E S T S I D E S U B W A Y E X T E N S I O N Page 4-32 August 18, 2010
Figure 4-6. Year 2035 MOS 2 Intersection Levels of Service

Final Traffic Impact Assessment Report
4.0—Future Traffic Conditions
W E S T S I D E S U B W A Y E X T E N S I O N August 18, 2010 Page 4-33
Figure 4-6. Year 2035 MOS 2 Intersection Levels of Service (continued)

Final Traffic Impact Assessment Report
4.0—Future Traffic Conditions
W E S T S I D E S U B W A Y E X T E N S I O N Page 4-34 August 18, 2010
Figure 4-6. Year 2035 MOS 2 Intersection Levels of Service (continued)
Final Traffic Impact Assessment Report
4.0—Future Traffic Conditions
W E S T S I D E S U B W A Y E X T E N S I O N August 18, 2010 Page 4-35
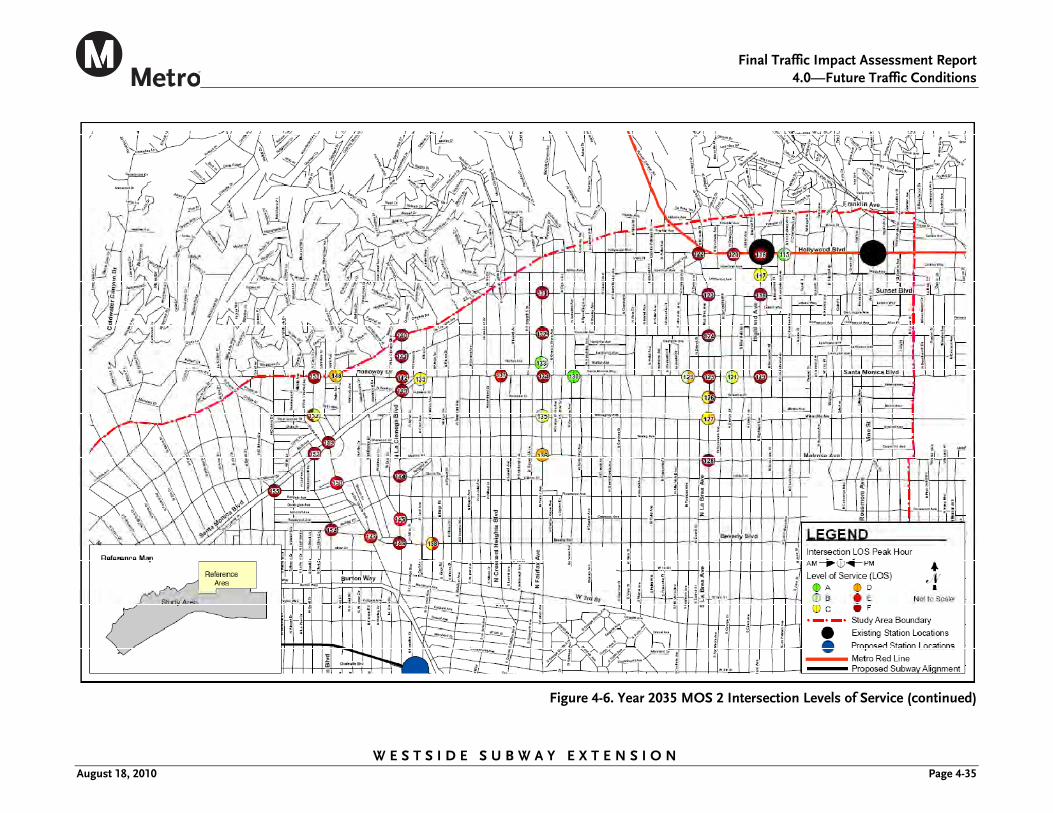
Figure 4-6. Year 2035 MOS 2 Intersection Levels of Service (continued)

Final Traffic Impact Assessment Report
4.0—Future Traffic Conditions
W E S T S I D E S U B W A Y E X T E N S I O N Page 4-36 August 18, 2010
Figure 4-6. Year 2035 MOS 2 Intersection Levels of Service (continued)

Final Traffic Impact Assessment Report
4.0—Future Traffic Conditions
W E S T S I D E S U B W A Y E X T E N S I O N August 18, 2010 Page 4-37
4.2.10.2 Alternative 2 Traffic Forecasts Using the inputs described previously, the weekday peak hour (AM and PM) year 2035 traffic forecasts for Alternative 2 were developed at Study Area intersections.
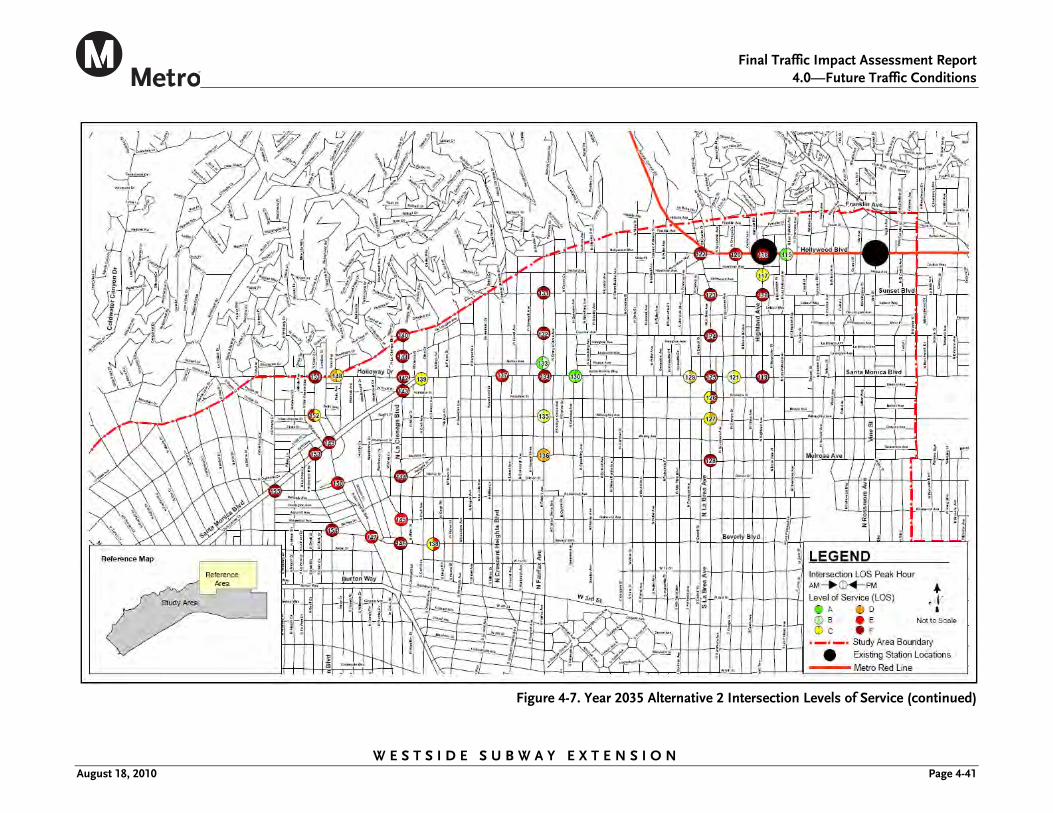
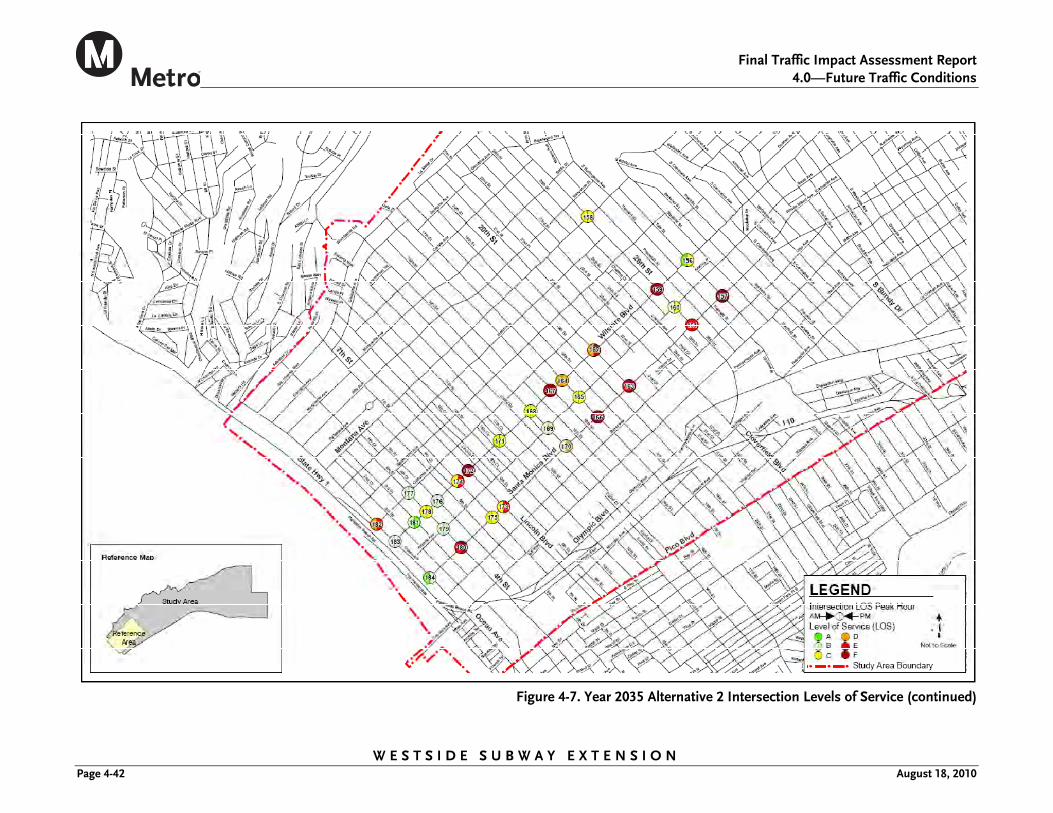
Level of Service Analysis Twenty seven of the 126 analyzed intersections (21 percent) would operate at an acceptable LOS D or better in the morning and afternoon peak hours. The remaining 99 intersections (79 percent) would operate at LOS E or F (deficient LOS) during one or both analyzed peak hours. The LOS results by peak hour are illustrated graphically in Figure 4-7. For any intersections that were not studied under this alternative, the Future Year 2035 No Build level of service is shown.
Alternative 2 would result in a modest, but measurable improvement in traffic operating conditions compared to the Future Year 2035 No Build Scenario. In the AM peak hour, 12 intersections would improve by one level of service and in the PM peak hour, nine intersections would improve by one level of service. Table 4-8 summarizes the improvement of level of service in each peak hour by alternative.
4.2.10.3 Alternative 3 Traffic Forecasts Using the inputs described previously, the weekday peak hour (AM and PM) year 2035 traffic forecasts for Alternative 3 were developed at Study Area intersections.
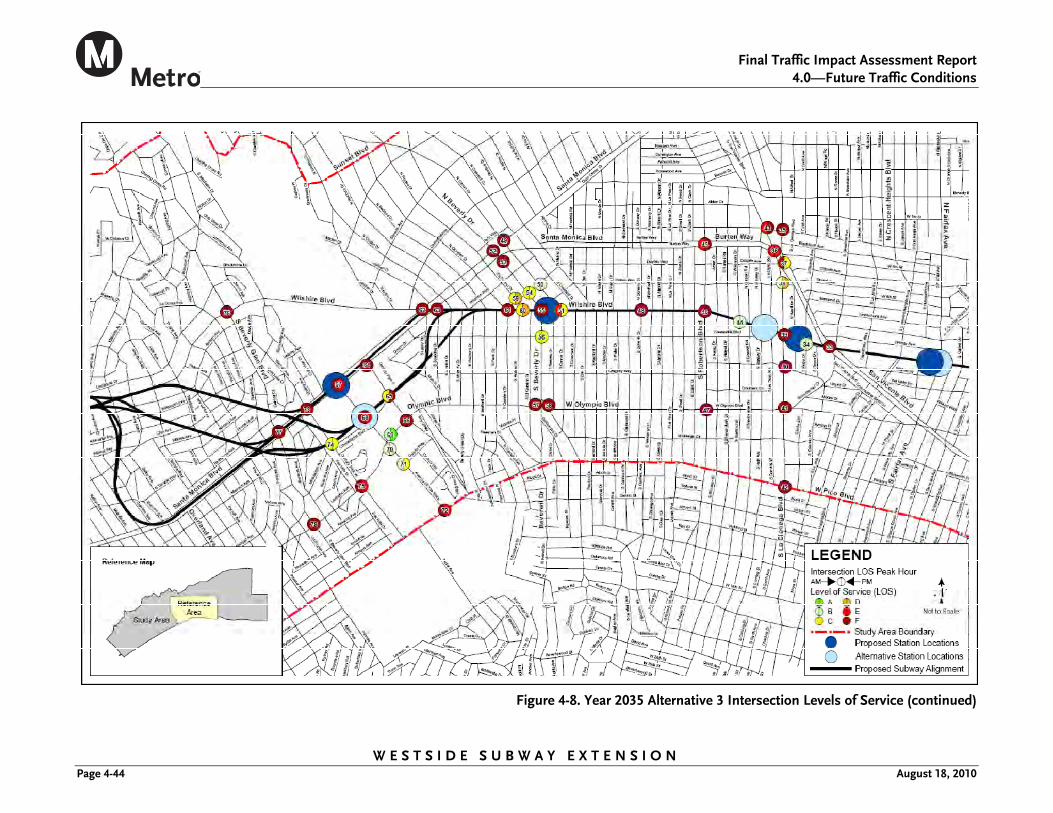
Level of Service Analysis Forty four of the 156 analyzed intersections (28 percent) would operate at an acceptable LOS D or better in the morning and afternoon peak hours. The remaining 112 intersections (72 percent) would operate at LOS E or F (deficient LOS) during one or both analyzed peak hours. The LOS results by peak hour are illustrated graphically in
Figure 4-8. For any intersections that were not studied under this alternative, the Future Year 2035 No Build level of service is shown.
Alternative 3 would result in a modest, but measurable improvement in traffic operating conditions compared to the Future Year 2035 No Build Scenario. In the AM peak hour, 13 intersections would improve by one level of service and in the PM peak hour, nine intersections would improve by one level of service. Table 4-8 summarizes the improvement of level of service in each peak hour by alternative.

Final Traffic Impact Assessment Report
4.0—Future Traffic Conditions
W E S T S I D E S U B W A Y E X T E N S I O N Page 4-38 August 18, 2010
Figure 4-7. Year 2035 Alternative 2 Intersection Levels of Service

Final Traffic Impact Assessment Report
4.0—Future Traffic Conditions
W E S T S I D E S U B W A Y E X T E N S I O N August 18, 2010 Page 4-39
Figure 4-7. Year 2035 Alternative 2 Intersection Levels of Service (continued)

Final Traffic Impact Assessment Report
4.0—Future Traffic Conditions
W E S T S I D E S U B W A Y E X T E N S I O N Page 4-40 August 18, 2010
Figure 4-7. Year 2035 Alternative 2 Intersection Levels of Service (continued)
Final Traffic Impact Assessment Report
4.0—Future Traffic Conditions
W E S T S I D E S U B W A Y E X T E N S I O N August 18, 2010 Page 4-41
Figure 4-7. Year 2035 Alternative 2 Intersection Levels of Service (continued)
Final Traffic Impact Assessment Report
4.0—Future Traffic Conditions
W E S T S I D E S U B W A Y E X T E N S I O N Page 4-42 August 18, 2010
Figure 4-7. Year 2035 Alternative 2 Intersection Levels of Service (continued)

Final Traffic Impact Assessment Report
4.0—Future Traffic Conditions
W E S T S I D E S U B W A Y E X T E N S I O N August 18, 2010 Page 4-43
Figure 4-8. Year 2035 Alternative 3 Intersection Levels of Service
Final Traffic Impact Assessment Report
4.0—Future Traffic Conditions
W E S T S I D E S U B W A Y E X T E N S I O N Page 4-44 August 18, 2010
Figure 4-8. Year 2035 Alternative 3 Intersection Levels of Service (continued)

Final Traffic Impact Assessment Report
4.0—Future Traffic Conditions
W E S T S I D E S U B W A Y E X T E N S I O N August 18, 2010 Page 4-45
Figure 4-8. Year 2035 Alternative 3 Intersection Levels of Service (continued)

Final Traffic Impact Assessment Report
4.0—Future Traffic Conditions
W E S T S I D E S U B W A Y E X T E N S I O N Page 4-46 August 18, 2010
Figure 4-8. Year 2035 Alternative 3 Intersection Levels of Service (continued)

Final Traffic Impact Assessment Report
4.0—Future Traffic Conditions
W E S T S I D E S U B W A Y E X T E N S I O N August 18, 2010 Page 4-47
Figure 4-8. Year 2035 Alternative 3 Intersection Levels of Service (continued)

Final Traffic Impact Assessment Report
4.0—Future Traffic Conditions
W E S T S I D E S U B W A Y E X T E N S I O N Page 4-48 August 18, 2010
4.2.10.4 Alternative 4 Traffic Forecasts Using the inputs described previously, the weekday peak hour (AM and PM) year 2035 traffic forecasts for Alternative 4 were developed at Study Area intersections.
Level of Service Analysis Thirty eight of the 162 analyzed intersections (23 percent) would operate at an acceptable LOS D or better in the morning and afternoon peak hours. The remaining 124 intersections (77 percent) would operate at LOS E or F (deficient LOS) during one or both analyzed peak hours. The LOS results by peak hour are illustrated graphically in Figure 4-9. For any intersections that were not studied under this alternative, the Future Year 2035 No Build level of service is shown.
Alternative 4 would result in a modest, but measurable improvement in traffic operating conditions compared to the Future Year 2035 No Build Scenario. In the AM peak hour, 16 intersections would improve by one level of service and in the PM peak hour, nine intersections would improve by one level of service. Table 4-8 summarizes the improvement of level of service in each peak hour by alternative.
4.2.10.5 Alternative 5 Traffic Forecasts Using the inputs described previously, the weekday peak hour (AM and PM) year 2035 traffic forecasts for Alternative 5 were developed at the Study Area intersections.
Level of Service Analysis Fifty five of the 192 analyzed intersections (29 percent) would operate at an acceptable LOS D or better in the morning and afternoon peak hours. The remaining 137 intersections (71 percent) would operate at LOS E or F (deficient LOS) during one or both analyzed peak hours. The LOS results by peak hour are illustrated graphically in Figure 4-10.
Alternative 5 would result in a modest, but measurable improvement in traffic operating conditions compared to the Future Year 2035 No Build Scenario. In the AM peak hour, 17 intersections would improve by one level of service and in the PM peak hour, nine intersections would improve by one level of service. Table 4-8 summarizes the improvement of level of service in each peak hour by alternative.
4.2.11 Build Alternatives Traffic Forecast Summary
The improvements in level of service that complement the Build Alternatives are a result of a decrease in overall delay experienced by drivers at Study Area intersections as fewer vehicle trips are made due to the convenience and travel time predictability of a fixed-guideway transit system. As ridership on the subway increases, more decreases in delay can be expected along major east-west and north-south corridors in the Westside. The traffic-related improvements in the Study Area increase as the number of stations and area served by the subway increases. This direct correlation is illustrated in Table 4-8.
When the subway is implemented motorists who do not shift modes and continue to drive should experience less congestion and overall delay when they travel in the Study Area. This improvement would be greatest along major east-west corridors. This analysis has shown that a subway investment would have a beneficial impact on traffic conditions in the Study Area.

Final Traffic Impact Assessment Report
4.0—Future Traffic Conditions
W E S T S I D E S U B W A Y E X T E N S I O N August 18, 2010 Page 4-49
Figure 4-9. Year 2035 Alternative 4 Intersection Levels of Service

Final Traffic Impact Assessment Report
4.0—Future Traffic Conditions
W E S T S I D E S U B W A Y E X T E N S I O N Page 4-50 August 18, 2010
Figure 4-9. Year 2035 Alternative 4 Intersection Levels of Service (continued)

Final Traffic Impact Assessment Report
4.0—Future Traffic Conditions
W E S T S I D E S U B W A Y E X T E N S I O N August 18, 2010 Page 4-51
Figure 4-9. Year 2035 Alternative 4 Intersection Levels of Service (continued)

Final Traffic Impact Assessment Report
4.0—Future Traffic Conditions
W E S T S I D E S U B W A Y E X T E N S I O N Page 4-52 August 18, 2010
Figure 4-9. Year 2035 Alternative 4 Intersection Levels of Service (continued)

Final Traffic Impact Assessment Report
4.0—Future Traffic Conditions
W E S T S I D E S U B W A Y E X T E N S I O N August 18, 2010 Page 4-53
Figure 4-9. Year 2035 Alternative 4 Intersection Levels of Service (continued)

Final Traffic Impact Assessment Report
4.0—Future Traffic Conditions
W E S T S I D E S U B W A Y E X T E N S I O N Page 4-54 August 18, 2010
Figure 4-10. Year 2035 Alternative 5 Intersection Levels of Service

Final Traffic Impact Assessment Report
4.0—Future Traffic Conditions
W E S T S I D E S U B W A Y E X T E N S I O N August 18, 2010 Page 4-55
Figure 4-10. Year 2035 Alternative 5 Intersection Levels of Service (continued)

Final Traffic Impact Assessment Report
4.0—Future Traffic Conditions
W E S T S I D E S U B W A Y E X T E N S I O N Page 4-56 August 18, 2010
Figure 4-10. Year 2035 Alternative 5 Intersection Levels of Service (continued)

Final Traffic Impact Assessment Report
4.0—Future Traffic Conditions
W E S T S I D E S U B W A Y E X T E N S I O N August 18, 2010 Page 4-57
Figure 4-10. Year 2035 Alternative 5 Intersection Levels of Service (continued)

Final Traffic Impact Assessment Report
4.0—Future Traffic Conditions
W E S T S I D E S U B W A Y E X T E N S I O N Page 4-58 August 18, 2010
Figure 4-10. Year 2035 Alternative 5 Intersection Levels of Service (continued)

Final Traffic Impact Assessment Report
5.0—Impact Assessment
W E S T S I D E S U B W A Y E X T E N S I O N August 18, 2010 Page 5-1
5.0 IMPACT ASSESSMENT
The projected year 2035 No Build levels of service were analyzed to determine the baseline operating conditions of the study intersections. These levels of service were compared to the TSM and Build Alternatives to identify the potential impacts of the proposed project on the surrounding street system. This section provides a discussion of the impact criteria used to assess the potential for significant/adverse impacts, provides an impact analysis, and summarizes the results.
5.1 Regional Impact Assessment
This subsection considers the potential for the project to generate adverse impacts on the regional transportation system, including the countywide network of freeways and arterials.
5.1.1 No-Build Alternative
By definition, the No-Build Alternative would not result in adverse regional transportation impacts either countywide or in the Study Area.
5.1.2 TSM Alternative
Although minimal, impacts from the TSM Alternative would be beneficial on both a countywide and Study Area level. Countywide, reductions in overall VMT and vehicle trips would occur. Peak vehicle trips would change by less than 1/10 percent in the AM peak and 1/10 percent in the PM peak compared to the Future Year 2035 No Build Alternative. In the Study Area, the TSM alternative generates reductions in daily and peak hour VMT, VHT and vehicle trips compared to the Future Year 2035 No Build Alternative.
5.1.3 Future Build Alternatives (Alternatives 1—5, MOS 1, MOS 2)
The future Build Alternatives would be beneficial on both a countywide and Study Area level. Countywide, reductions in overall VMT and vehicle trips are achieved. VMT reductions improve as more of the alignment is built (Alternative 5 experiences the greatest reduction in VMT). Peak period auto trips are reduced by approximately 11,000 trips under Alternative 1 and by approximately 18,000 trips under Alternative 5 in the Study Area. In the Study Area, the future Build Alternatives result in reductions to daily and peak hour VMT, VHT and vehicle trips compared to the Future Year 2035 No Build Alternative.
5.1.4 CMP Impact Criteria and Assessment
This analysis was conducted in accordance with the transportation impact analysis procedures outlined in 2004 Congestion Management Program for Los Angeles County (Metro, July 2004). The CMP requires that, when an environmental impact report is prepared for a project, traffic impact analysis be conducted for select regional facilities based on the quantity of project traffic expected to use these facilities.

Final Traffic Impact Assessment Report
5.0—Impact Assessment
W E S T S I D E S U B W A Y E X T E N S I O N Page 5-2 August 18, 2010
5.1.4.1 CMP Impact Criteria The CMP guidelines require that the first issue addressed is the determination of the geographic scope of the Study Area. The criteria for determining the Study Area for CMP arterial monitoring intersections and for freeway monitoring locations are:
All CMP arterial monitoring intersections where the proposed project will add 50 or more trips during either the AM or PM weekday peak hours of adjacent street traffic.
All CMP mainline freeway monitoring locations where the proposed project will add 150 or more trips, in either direction, during either the AM or PM weekday peak hours.
5.1.4.2 CMP Impact Assessment The CMP arterial monitoring locations within the Study Area are listed in Section 3.1.3.2. The 15 Study Area intersections would not be impacted during the AM or PM peak hours as a result of project volumes under any Project Alternatives. Therefore, there would be no CMP impacts at these Study Area intersections.
5.2 Intersection Methodology and Impact Criteria
For the traffic impact analysis, the evaluation of significance under the California Environmental Quality Act (CEQA) and the National Environmental Policy Act (NEPA) is defined by comparing the Future Build Alternative scenario to the Future Year 2035 No Build scenario. The net change in delay at study intersections is compared to thresholds of significance for determination of impacts. The criteria used to measure a significant impact are defined in Table 5-1.
Table 5-1. Westside Subway Extension Traffic Impact Criteria
Definition Criteria
The intersection LOS analysis assumes that an intersection would be significantly impacted (CEQA)/adversely affected (NEPA) by traffic volume changes if a project alternative causes an increase in average vehicle delay according to the following thresholds:
Final LOS C—a significant/adverse impact has occurred if the delay is increased by 10 or more seconds
Final LOS D—a significant/adverse impact has occurred if the delay is increased by 7.5 or more seconds
Final LOS E/F—a significant/adverse impact has occurred if the delay is increased by 5 or more seconds
5.3 Impact Determination
Projected morning and afternoon peak period delay, corresponding LOS and impact determination for the following scenarios at each study intersection are contained in Appendices C-3 to C-7. Impacts per alternative have been summarized in Table 5-2.
5.3.1 No Build Impact Determination
The Future Year 2035 No Build Alternative is the future baseline from which Project Alternatives are compared to for assessment of adverse impacts. Therefore, by definition, the No Build Alternative would not result in significant/adverse traffic impacts at any of the 192 study intersections.

Final Traffic Impact Assessment Report
5.0—Impact Assessment
W E S T S I D E S U B W A Y E X T E N S I O N August 18, 2010 Page 5-3
5.3.2 TSM Impact Determination
The TSM Alternative would not generate significant/adverse traffic impacts at any of the 192 study intersections. The addition of transit service along the corridor would result in a small shift in travel mode from automobile to bus. The result is a general improvement in traffic operating conditions at the study intersections as fewer automobile trips are made compared to the Future Year 2035 No Build Alternative. As stated in Section 4.2.9, the effect of the TSM Alternative at individual study intersections would be nominal. Therefore, for the traffic operations LOS analysis, the TSM Alternative is considered to be identical to the No Build Alternative, resulting in no significant/adverse traffic impacts at any of the 192 study intersections.
5.3.3 Alternative 1 + MOS 1. MOS 2 Impact Determination
5.3.3.1 Alternative 1 Using the impact criteria shown in Table 5-1, the traffic impact analysis found that no study intersection exceeded the threshold for a significant/adverse traffic impact as compared to the Future Year 2035 No Build Scenario. Therefore, the proposed project would not result in significant/adverse traffic impacts under Project Alternative 1.
5.3.3.2 MOS 1 Using the impact criteria shown in Table 5-1, the traffic impact analysis found that no study intersection exceeded the threshold for a significant/adverse traffic impact as compared to the Future Year 2035 No Build Scenario. Therefore, the proposed project would not result in significant/adverse traffic impacts under Project MOS 1.
5.3.3.3 MOS 2 Using the impact criteria shown in Table 5-1, the traffic impact analysis found that no study intersection exceeded the threshold for a significant/adverse traffic impact as compared to the Future Year 2035 No Build Scenario. Therefore, the proposed project would not result in significant/adverse traffic impacts under Project MOS 2.
5.3.4 Alternative 2 Impact Determination
Using the impact criteria shown in Table 5-1, the traffic impact analysis found that no study intersection exceeded the threshold for a significant/adverse traffic impact as compared to the Future Year 2035 No Build Scenario. Therefore, the proposed project would not result in significant/adverse traffic impacts under Project Alternative 2.
5.3.5 Alternative 3 Impact Determination
Using the impact criteria shown in Table 5-1, the traffic impact analysis found that the intersection of Wilshire Boulevard and 16th Street (City of Santa Monica) exceeded the threshold for a significant/adverse traffic impact as compared to the Future Year 2035 No Build Scenario. This unsignalized intersection is adjacent to a potential station location under Alternative 3. Projected traffic and pedestrian volumes with the project would be expected to adversely affect the intersection at the northbound and southbound approaches during both the AM and PM peak hours. The LOS would continue to remain at F but further delay would be incurred. Therefore, the proposed project would result in one significant/adverse traffic impact under Project Alternative 3.

Final Traffic Impact Assessment Report
5.0—Impact Assessment
W E S T S I D E S U B W A Y E X T E N S I O N Page 5-4 August 18, 2010
5.3.6 Alternative 4 Impact Determination
Using the impact criteria shown in Table 5-1, the traffic impact analysis found that no study intersection exceeded the threshold for a significant/adverse traffic impact as compared to the Future Year 2035 No Build Scenario. Therefore, the proposed project would not result in significant/adverse traffic impacts under Project Alternative 4.
5.3.7 Alternative 5 Impact Determination
Using the impact criteria shown in Table 5-1, the traffic impact analysis found that the intersection of Wilshire Boulevard and 16th Street (City of Santa Monica) exceeded the threshold for a significant/adverse traffic impact as compared to the Future Year 2035 No Build Scenario. This unsignalized intersection is adjacent to a potential station location under Alternative 5. Projected traffic and pedestrian volumes with the project would be expected to adversely affect the intersection at the northbound and southbound approaches during both the AM and PM peak hours. The LOS would continue to remain at F but further delay would be incurred. Therefore, the proposed project would result in one significant/adverse traffic impact under Project Alternative 5.
Table 5-2. Impact Summary Table
Peak Hour Alternative 1 MOS 1 MOS 2 Alternative 2 Alternative 3 Alternative 4 Alternative 5
AM None None None None Wilshire Boulevard & 16th Street
None Wilshire Boulevard & 16th Street
PM None None None None Wilshire Boulevard & 16th Street
None Wilshire Boulevard & 16th Street

Final Traffic Impact Assessment Report
6.0—Mitigation Measures
W E S T S I D E S U B W A Y E X T E N S I O N August 18, 2010 Page 6-1
6.0 MITIGATION MEASURES
6.1 Alternative 3 Mitigation Measures
Physical mitigation measures to address the significant/adverse traffic impact of Project Alternative 3 were investigated with these results:
T—1 Wilshire Boulevard & 16th Street—Signalization of intersection.
Using FHWA criteria found in Manual of Uniform Traffic Control Devices (FHWA, 2003), the projected peak hour volumes at the intersection were found to warrant signalization. Signalization of the Wilshire Boulevard and 16th Street intersection is projected to provide mitigation measures for the expected project impact. Using the project’s Synchro network to test the proposed mitigation, signalization was found to fully mitigate the impacts of the project. Based on the Synchro network analysis, LOS at the adversely impacted intersection would improve to LOS B under the proposed mitigation measure. The new signal at Wilshire/16th would be synchronized with nearby/adjacent intersections in order to minimize traffic impacts and queuing on Wilshire.
Detailed LOS calculations for the proposed mitigation at Wilshire Boulevard and 16th Street are contained in Appendix C-5.
6.2 Alternative 5 Mitigation Measures
Physical mitigation measures to address the significant/adverse traffic impact of Project Alternative 5 were investigated with these results:
T—1 Wilshire Boulevard & 16th Street—Signalization of intersection.
Using FHWA criteria found in Manual of Uniform Traffic Control Devices (FHWA, 2003), the projected peak hour volumes at the intersection were found to warrant signalization. Signalization of the Wilshire Boulevard and 16th Street intersection is projected to provide mitigation measures for the expected project impact. Using the project’s Synchro network to test the proposed mitigation, signalization was found to fully mitigate the impacts of the project. Based on the Synchro network analysis, LOS at the adversely impacted intersection would improve to LOS B under the proposed mitigation measure. The new signal at Wilshire/16th would be synchronized with nearby/adjacent intersections in order to minimize traffic impacts and queuing on Wilshire.
Detailed LOS calculations for the proposed mitigation at Wilshire Boulevard and 16th Street are contained in Appendix C-7.
6.3 CEQA Determination
This CEQA determination is based on the following thresholds of significance for traffic impacts:
Final LOS C—impact is significant if the delay is increased by 10 or more seconds
Final LOS D—impact is significant if the delay is increased by 7.5 or more seconds
Final LOS E/F—impact is significant if the delay is increased by 5 or more seconds

Final Traffic Impact Assessment Report
6.0—Mitigation Measures
W E S T S I D E S U B W A Y E X T E N S I O N Page 6-2 August 18, 2010
6.3.1 Future Year 2035 No Build Alternative
No significant impacts would be anticipated under the Future Year 2035 No Build Alternative.
6.3.2 TSM Alternative
No significant impacts would be anticipated under the TSM Alternative.
6.3.3 Alternative 1 + MOS 1. MOS 2
No significant impacts would be anticipated under Alternative 1, MOS 1 and MOS 2 Alternatives.
6.3.4 Alternative 2
No significant impacts would be anticipated under Alternative 2.
6.3.5 Alternative 3
Alternative 3 would result in a significant impact at one of the 192 study intersections (Wilshire Boulevard and 16th Street). The impacted intersection under Alternative 3 is the same as for the NEPA impact analysis described in Section 5.3.5. Signalization of this intersection would fully mitigate project impacts, as described in Section 6.1. Based on the Synchro network analysis, LOS at the adversely impacted intersection would improve to LOS B under the proposed mitigation measure.
6.3.6 Alternative 4
No significant impacts would be anticipated under Alternative 2.
6.3.7 Alternative 5
Alternative 5 would result in a significant impact at one of the 192 study intersections (Wilshire Boulevard and 16th Street). The impacted intersection under Alternative 5 is the same as for the NEPA impact analysis described in Section 5.3.7. Signalization of this intersection would fully mitigate project impacts, as described in Section 6.2. Based on the Synchro network analysis, LOS at the adversely impacted intersection would improve to LOS B under the proposed mitigation measure.

Final Traffic Impact Assessment Report
References
W E S T S I D E S U B W A Y E X T E N S I O N August 18, 2010 Page R-1
References Caltrans California Department of Transportation Division of Engineering Services.
July 1983. Energy and transportation systems.
Caltrans 2008 Traffic Volumes on California State Highways
LADOT 2009 traffic count database
Transportation Research Board
Highway Capacity Manual, 2000