finance and market presentation 02.01.2012
TRANSCRIPT

The Moore Group LLCPresentation
of Finance and Market Report
toXXXXXXX
February 1, 2012
1
Private and Confidential
The Moore Group LLC
2
Table of Contents
The Moore Group LLC

Table of ContentsFinancial Modeling Analysis & Summary
Pages 4 -13
PPA Market Trends and Analysis Pages 14 -15
Project Finance Market Overview Pages 16 -18
Senior Debt Market and Overview Pages 19 -22
Tax Equity Market and Overview Pages 23 – 33
Review of Capital Structure Pages 34 - 40
Plan of Execution for Project Financing
Pages 41 -42
Key Decision Items Page 43 - 44
3The Moore Group LLC

Summary of Financial Modeling
4The Moore Group LLC

Summary Results of Financial Modeling
Case AnnualMWH ofProduction
CostPer kWh(AC) Basis
LeverageIRR
NoLeverageIRR
Leverage20 yearNPV @10%
NoLeverageNPV @8%
PV 300 MW (DC) Base Case
666,461 $3,757
31.52%
11.32%
$2,745 $1,336
PV 300 MW (DC) Revised
666,461 $3,102
15.68%
8.85% $781 $232
PV 75 MW (DC) 166,615 $3,182
18.07%
10.28%
$286 $143
XXXXXX 440 MW (AC) 1,196,791
$2,893
19.27%
10.17%
$1,151 $607
XXXXXX 300 MW (AC) 815,994 $2,860
16.42%
9.54% $648 $314
XXXXXX 200 MW (AC) 543,996 $2,833
19.08%
10.16%
$510 $271 5The Moore Group LLC
Financial ModelingSummary Results of Financial Modeling
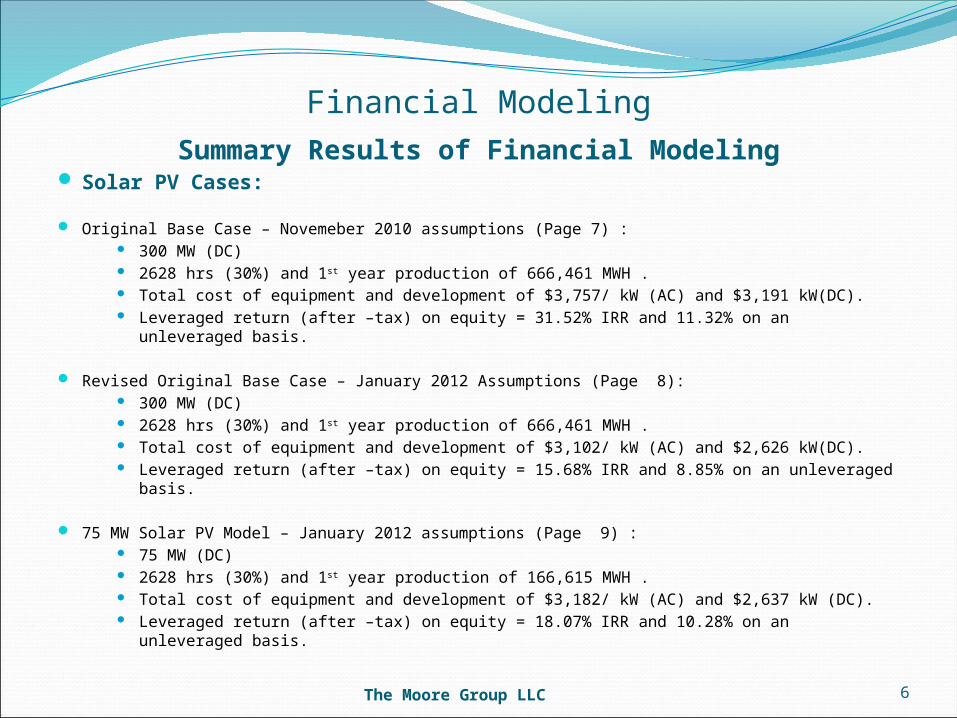
Solar PV Cases:
Original Base Case – Novemeber 2010 assumptions (Page 7) : 300 MW (DC) 2628 hrs (30%) and 1st year production of 666,461 MWH . Total cost of equipment and development of $3,757/ kW (AC) and $3,191 kW(DC). Leveraged return (after –tax) on equity = 31.52% IRR and 11.32% on an unleveraged
basis.
Revised Original Base Case – January 2012 Assumptions (Page 8): 300 MW (DC) 2628 hrs (30%) and 1st year production of 666,461 MWH . Total cost of equipment and development of $3,102/ kW (AC) and $2,626 kW(DC). Leveraged return (after –tax) on equity = 15.68% IRR and 8.85% on an unleveraged basis.
75 MW Solar PV Model – January 2012 assumptions (Page 9) : 75 MW (DC) 2628 hrs (30%) and 1st year production of 166,615 MWH . Total cost of equipment and development of $3,182/ kW (AC) and $2,637 kW (DC). Leveraged return (after –tax) on equity = 18.07% IRR and 10.28% on an unleveraged
basis.
6The Moore Group LLC

Financial ModelingSummary Results of Financial Modeling
Amonix Cases:
440 MW Revised - January 2012 Assumptions (Page 10): 440 MW (AC) 2,720 hrs (31.1%) and 1st year production of 1,196,791 MWH . Total cost of equipment and development of $2,893/ kW (AC) and $2,419 kW(DC). Leveraged return (after –tax) on equity = 19.27% IRR and 10.17% on an unleveraged
basis.
300 MW (AC) Revised – January 2012 Assumptions (Page 11): 300 MW (AC) 2,720 hrs (31.1%) and 1st year production of 815,994 MWH . Total cost of equipment and development of $2,860/ kW (AC) and $2,392 kW(DC). Leveraged return (after –tax) on equity = 16.42% IRR and 9.54% on an unleveraged basis.
200 MW (AC) Revised – January 2012 Assumptions (Page 12): 200 MW (AC) 2,720 hrs (31.1%) and 1st year production of 543,996 MWH . Total cost of equipment and development of $2,833/ kW (AC) and $2,328 kW (DC). Leveraged return (after –tax) on equity = 19.08 % IRR and 10.16% on an unleveraged
basis.
7The Moore Group LLC

Financial Modeling Original Base Case submitted in November 2010, assumptions:
300 MW (DC) of solar PV on dual axis trackers. PPA priced at 11.4 cents/ kWh with TOD equated to 15.6 cents/ kWh 2,628 hrs. of production (30%) and 1st year generation of 666,641 MWH. Utility interconnect cost of $45 million. Equipment and installation costs updated as follows:
Solar modules: $1.10/watt Trackers: $.30/watt Inverters: $.20/watt Balance of System: $.25/watt Installation: $1.00/watt
All in equipment cost, including installation and development expenses equal to $3,757/kW on an AC basis and $3,191/ kW on a DC basis.
Original model assumed 50% leverage against total cost
Sources Uses Percentage Project Dev.: $47,251 Debt: $526,598 50% Equipment: $910,050 Tax Equity: $421,278 40% Soft Costs: $95,895 Equity: $105,320 25% Total $1,053,196 1,053,196 100%
Project investment equity returns (after tax) = 15.68% IRR on a leveraged basis and 8.85% on an unleveraged basis.
8The Moore Group LLC

Financial Modeling• Revised original model with updated cost and PPA assumptions and revised leverage:
300 MW (DC) of solar PV on dual axis trackers. PPA priced at 11.5 cents flat with no escalation. 2,628 hrs. of production (30%) and 1st year generation of 666,641 MWH. Utility interconnect cost of $56 million. Equipment and installation costs updated as follows:
Solar modules:$.90/watt Trackers: $.40/watt Inverters: $.25/watt Balance of System: $.15/watt Installation: $.55/watt
All in equipment cost, including installation and development expenses equal to $3,106/kW on an AC basis and $2,626/kW on a DC basis.
Leverage reduced to 35% due to concerns in tax equity market and reduced PPA pricing
Sources Uses Percentage Project Dev.: $31,750 Debt: $300,109 35% Equipment: $756,050 Tax Equity: $342,982 40% Soft Cost: $69,654 Equity: $214,363 25% Total $857,454 $857,454 100%
Project investment equity returns (after tax) = 15.68% IRR on a leveraged basis and 8.85% on an unleveraged basis.
9The Moore Group LLC

Financial Modeling 75 MW model with updated cost, PPA and leverage assumptions. Model assumes that
XXXXXXX develops three 75MW projects utilizing ½ of the project site.
75 MW (DC) of solar PV on dual axis trackers. 2,628 hrs (30.0%) and 1st year energy production of 166,615 MWH. PPA priced at 11.5 cents flat with no escalation. Utility interconnect cost is 1/3 of $56 million. All in equipment cost, installation and development cost of $3,182 kW on an AC
basis and $2,637/kW on a DC basis. Leverage reduced to 35% of capital cost
Sources Uses Percentage Project Dev.: $6,415 Debt: $73,863 35% Equipment: $194,084Tax Equity: $84,416 40% Soft Cost: $10,540 Equity: $52,760 25% Total $211,039$211,039100%
Project investment equity returns (after tax) = 18.07% IRR on a leveraged basis and 10.28% on an unleveraged basis.
Note that the return on the 75MW model is better than the revised 300 MW due to better utilization of land lease.
10The Moore Group LLC

Financial Modeling XXXXXX 440 MW (AC) Revised Base Model – This model assumes revised PPA pricing
and leverage assumptions .
440 MW (AC) of XXXXXX installed system. 2,720 hrs (31.1%) and 1st year energy production of 1,196,791 MWH. PPA with two off-takers at 11.5 / kWh flat with no escalation. Utility interconnect cost of $91 million combined at XXXXXX and XXXXXX. All in cost of equipment, including interconnect and development cost would
be $1.273 billion or $2,893 per kW (AC) / $2,419 per kW (DC). Leverage is revised from original at 35% of asset cost
Sources Uses Percentage Project Dev.: $39,050 Debt: $488,856 35% Equipment: $1,233,890 Tax Equity: $558,693
40% Soft Cost: $123,793 Equity: $349,183 25% Total $1,396,733 $1,396,733 100%
Project investment equity returns (after tax) = 19.27% IRR on a leveraged basis and 10.17% on an unleveraged basis.
11The Moore Group LLC
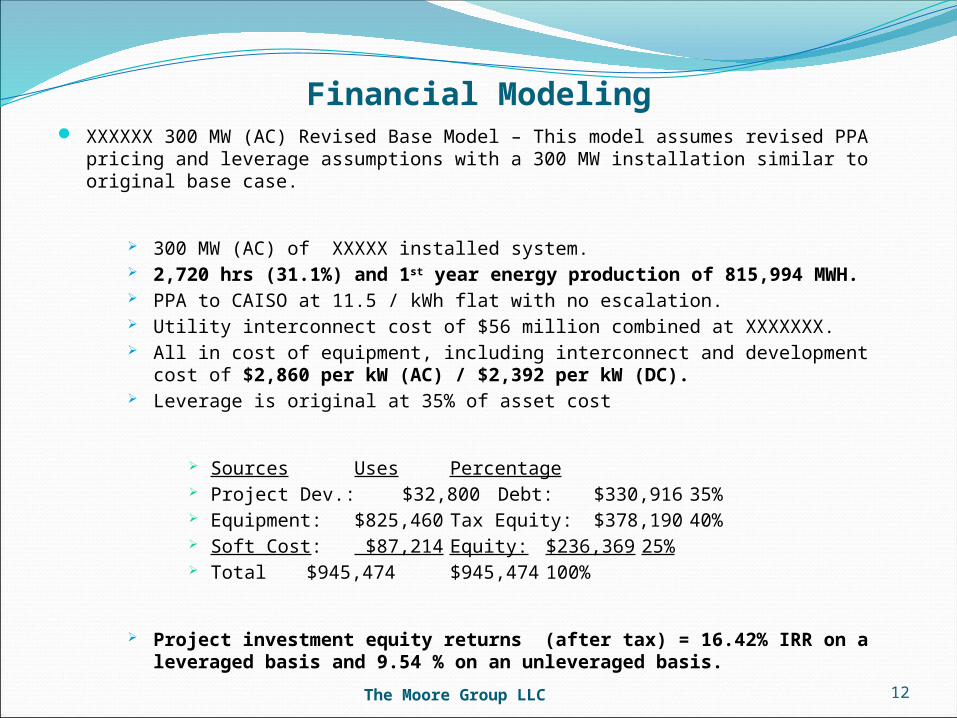
Financial Modeling XXXXXX 300 MW (AC) Revised Base Model – This model assumes revised PPA pricing
and leverage assumptions with a 300 MW installation similar to original base case.
300 MW (AC) of XXXXX installed system. 2,720 hrs (31.1%) and 1st year energy production of 815,994 MWH. PPA to CAISO at 11.5 / kWh flat with no escalation. Utility interconnect cost of $56 million combined at XXXXXXX. All in cost of equipment, including interconnect and development cost of
$2,860 per kW (AC) / $2,392 per kW (DC). Leverage is original at 35% of asset cost
Sources Uses Percentage Project Dev.: $32,800 Debt: $330,916 35% Equipment: $825,460 Tax Equity: $378,190 40% Soft Cost: $87,214 Equity: $236,369 25% Total $945,474 $945,474 100%
Project investment equity returns (after tax) = 16.42% IRR on a leveraged basis and 9.54 % on an unleveraged basis.
12The Moore Group LLC

Financial Modeling XXXXXX 200 MW model – This model assumes that the XXXXXXX site is split in half and
developed on half the site and power sold to XXXXXX/ XXXXX
200 MW (AC) of XXXXXX installed system. 2,720 hrs (31.1%) and 1st year energy production of 543,996 MWH. PPA with XXXXXX for 11.5 cents/ kWh flat with no escalation. Utility interconnect cost of $35 million at XXXXXXX substation. All in equipment cost, including interconnect and development cost equal to $2,833/
kW (AC) / $2,368/ kW (DC). Leverage is original at 35% of asset cost
Sources Uses Percentage Project Dev.: $19,546 Debt: $217,653 35% Equipment: $546,985 Tax Equity: $248,746 40% Soft Cost: $55,335 Equity: $155,466 25% Total $621,866 $621,866 100%
Project investment equity returns (after tax) = 19.08% IRR on a leveraged basis and 10.16 % on an unleveraged basis.
13The Moore Group LLC

Market Trends in PPA Market
14The Moore Group LLC
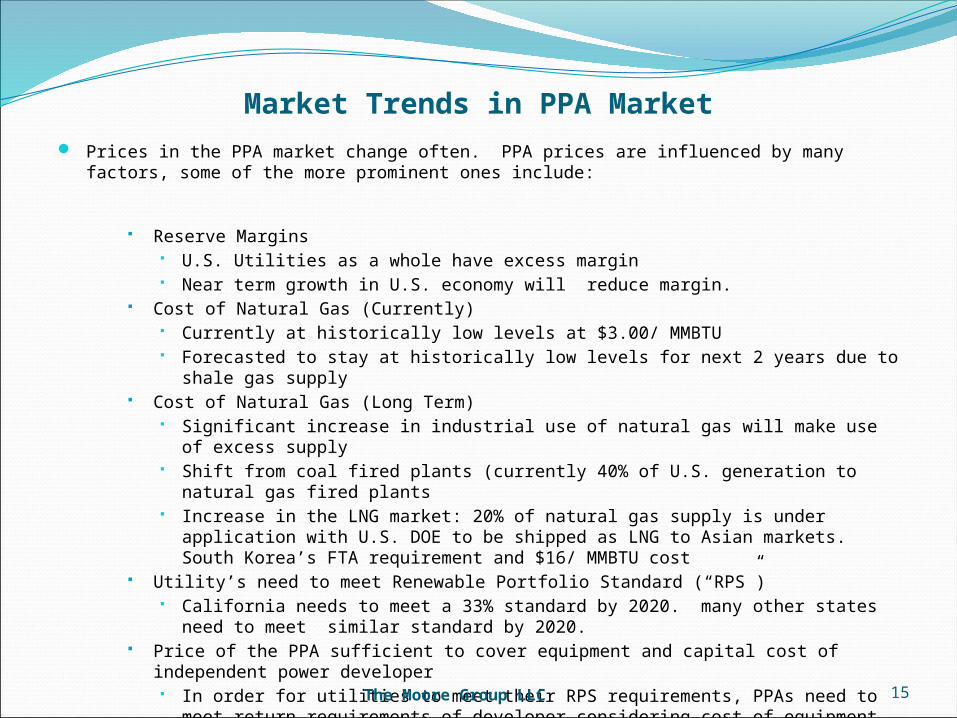
Market Trends in PPA Market Prices in the PPA market change often. PPA prices are influenced by many factors, some of
the more prominent ones include:
Reserve Margins U.S. Utilities as a whole have excess margin Near term growth in U.S. economy will reduce margin.
Cost of Natural Gas (Currently) Currently at historically low levels at $3.00/ MMBTU Forecasted to stay at historically low levels for next 2 years due to shale gas
supply Cost of Natural Gas (Long Term)
Significant increase in industrial use of natural gas will make use of excess supply
Shift from coal fired plants (currently 40% of U.S. generation to natural gas fired plants
Increase in the LNG market: 20% of natural gas supply is under application with U.S. DOE to be shipped as LNG to Asian markets. South Korea’s FTA requirement and $16/ MMBTU cost
Utility’s need to meet Renewable Portfolio Standard (“RPS”) California needs to meet a 33% standard by 2020. many other states need to
meet similar standard by 2020. Price of the PPA sufficient to cover equipment and capital cost of independent power
developer In order for utilities to meet their RPS requirements, PPAs need to meet return
requirements of developer considering cost of equipment, capital structure and cost of capital.
15The Moore Group LLC

Project Finance Market Overview
16The Moore Group LLC

Project Financing Market
Type 2011 2012 2013Other $0.6 Billion $0.8 Billion $1.0 BillionCSP $9.9 Billion $13.4 Billion $16.0 BillionPV $9.5 Billion $12.9 Billion $15.0 BillionWind $11.2 Billion $14.1 Billion $17.0 Billion
17
Renewable Energy Project Finance Demand Estimates 2011 - 2103
The chart above was compiled by a joint research effort of Mintz Levin and GTM Research. These amounts reflect the total capital being sought Including direct equity, tax equity, and senior and subordinated debt
Totals $31.2 Billion $ 41.2 Billion $48.9 Billion
The Moore Group LLC

Project Financing Market
18
The actual amount of project financing that is expected to be secured
Technology 2011 2012 2013
Other $0.5 Billion $0.6 Billion $0.7 Billion
CSP $6.5 Billion $8.0 Billion $9.6 Billion
PV $7.6 Billion $10.3 Billion $12.0 Billion
Wind $10.0 Billion $11.3 Billion $11.9 Billion
Totals $24.6 Billion $30.2 Billion $34.2 Billion
Mintz Levin and GTM Research estimate that given the expiration of the1603 Credit and the difficulties facing commercial banks that there will be a decline inDevelopers securing project financing of approximately 5% per yearThey estimate that $30.2 billion (74% of market) will achieve project financing in2012 and $34.2 billion or (70% of market) will get financing in 2013.
The Moore Group LLC

Senior Debt
19The Moore Group LLC

Senior DebtProminent Project Finance lenders in U.S. market since
2007:
20
2007 2008 2009 2010
Banco Santander Banco Espirito Santo Banco Espirito Santo Banco Santander
Bayern LB Banco Sabadell Banco Santander Bank of Montreal
BBVA BBVA BNP Paribas Barclays
Dexia BTMU BTMU BBVA
Fortis Credit Agricole Credit Agricole BTMU
HSH Nordbank Citibank Co Bank Caja Madrid
JP Morgan Chase Dexia Credit Suisse Credit Agricole
Mizuho HSH Nordbank Dexia Credit Suisse
Natixis ING Helaba Deutsche Bank
Nord LB Lloyds TSB HSH Nordbank Dexia
Prudential Morgan Stanley John Hancock Helaba
RBS Nord LB Key Bank ING
Union Bank Prudential LBBW John Hancock
RBS Lloyds TSB Key Bank
Scotia Bank Nord LB LBBW
UniCredit Prudential Morgan Stanley
Union Bank RBS Natixis
Scotia Bank Prudential
Societe Generale Rabobank
UniCredit RBS
Union Bank Societe Generale
West LB UniCredit
Union Bank
West LB
The Moore Group LLC

Senior DebtTop Project Finance Lead Arrangers in U.S. in
2011
1. Mitsubishi UFJ Financial Group (“BTMU” as shown in previous chart)
2. Bank of Montreal3. Credit Agricole4. ING5. Credit Suisse6. Barclays7. Sumitomo Mitsui8. CIBC9. Royal Bank of Scottland (“RBS”)10. Royal Bank of Canada (“RBC”)
21The Moore Group LLC

Senior Debt Current Terms and Conditions
Amount: From $100 million+100% construction financing is available if equity is committed under guarantee or LOC
Term: 5 year mini perms up to 20 years Pricing: 1.75% to 3.50% over LIBOR
LIBOR will need to be swapped current 20 year swap rate <3.0% Minimum
DSCR: 1.35X Other Conditions:
Committed capital in place at construction finance closing Senior lender will likely want EPC Contractor / Equipment Supplier
and Sponsor to cover elements of construction and performance risk.
Senior Lender will be particularly focused on long term performance of equipment and level of warranties provided and/or maintenance reserve in deal.
Inter-Creditor Agreement- Senior lender will require pledge of all assets, permits and contracts of the project with rights to “Step In”
22The Moore Group LLC
Tax Equity
23The Moore Group LLC

Tax Equity
Tax equity investors are traditionally large investment banks, commercial banks, insurance companies and even large public utilities with a high tax burden.
Tax equity investors receive a return based primarily on federal and state tax benefits generated by the project and secondarily from cash flow from the project.
Tax equity is a passive ownership interest and tax equity investors do not get involved in management of the project.
Renewable energy project developers typically do not have tax liabilities large enough to utilize the full amount of tax credits available for large projects
Project developers can pair with a tax equity partner to better utilize a project’s tax benefits (investment tax credit & MACRS depreciation)
24The Moore Group LLC

Tax Equity
The ITC and MACRS depreciation are tax benefits that will be "sold" together to a tax investor(s) who will receive these tax benefits from the project through their investment into the special purpose company that will be set up to own and operate the project.
Tax equity investor(s) will be passive investors in the special purpose company and will invest with the intention of getting a large percentage of their return from the ITC and the tax losses that the project will produce in the first five years of operation from the MACRS depreciation.
25The Moore Group LLC
Tax Equity
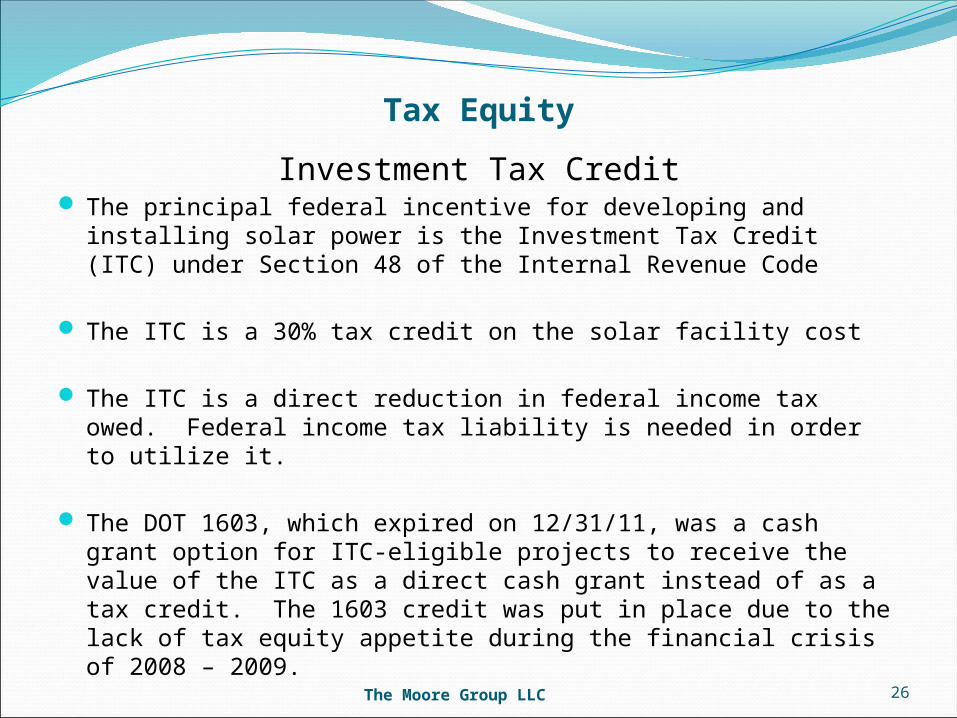
Investment Tax Credit The principal federal incentive for developing and installing solar
power is the Investment Tax Credit (ITC) under Section 48 of the Internal Revenue Code
The ITC is a 30% tax credit on the solar facility cost
The ITC is a direct reduction in federal income tax owed. Federal income tax liability is needed in order to utilize it.
The DOT 1603, which expired on 12/31/11, was a cash grant option for ITC-eligible projects to receive the value of the ITC as a direct cash grant instead of as a tax credit. The 1603 credit was put in place due to the lack of tax equity appetite during the financial crisis of 2008 – 2009.
The ITC remains a 30% tax credit for all projects placed in service before December 31, 2016 when it reverts to 10%. 26The Moore Group LLC
Tax Equity
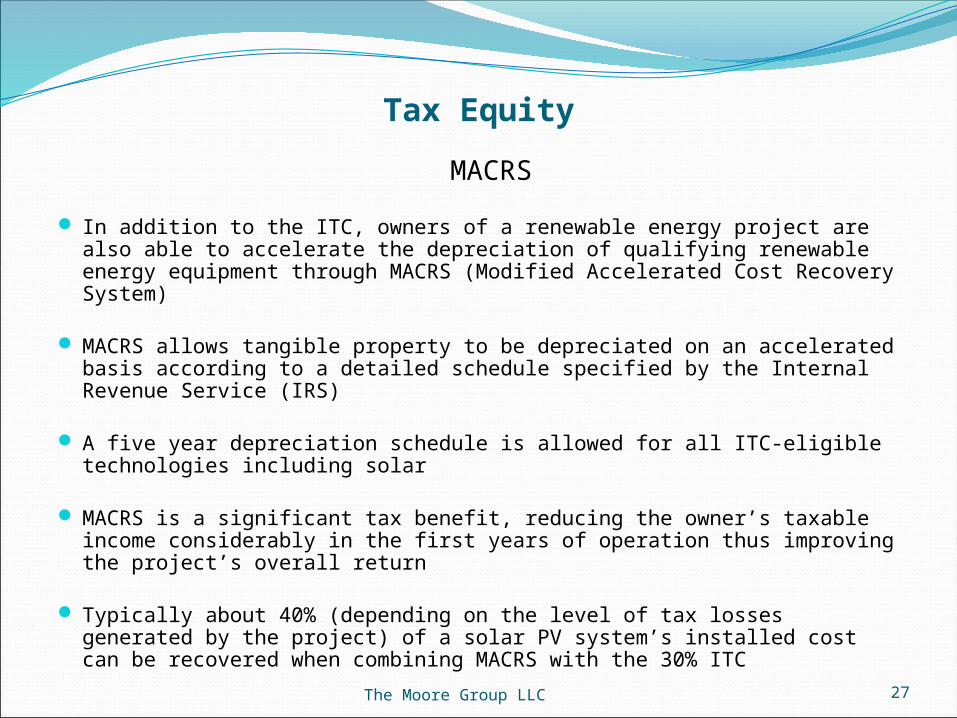
MACRS
In addition to the ITC, owners of a renewable energy project are also able to accelerate the depreciation of qualifying renewable energy equipment through MACRS (Modified Accelerated Cost Recovery System)
MACRS allows tangible property to be depreciated on an accelerated basis according to a detailed schedule specified by the Internal Revenue Service (IRS)
A five year depreciation schedule is allowed for all ITC-eligible technologies including solar
MACRS is a significant tax benefit, reducing the owner’s taxable income considerably in the first years of operation thus improving the project’s overall return
Typically about 40% (depending on the level of tax losses generated by the project) of a solar PV system’s installed cost can be recovered when combining MACRS with the 30% ITC
27The Moore Group LLC

Tax Equity Investors The tax equity market peaked in 2007 with 20 institutional tax equity investors and
$6.1 billion in tax equity investment After a large drop in 2009, there are currently 16 “institutional” tax equity investors
active in renewable energy as of 2011. This list is not inclusive of all of the TEIs in the market just the most prominent ones. There does exist a number of “boutique” investment banking firms that will put together tax equity investments for an assortment of passive investors that can utilize the tax benefits generated by renewable energy projects. These boutique firms may play an increasingly important role in the post 1603 credit era.
28The Moore Group LLC

TEI Market U.S. tax equity supply for renewable energy projects essentially
disappeared in late 2008, but has begun a resurgence and reached $3.7 billion in 2010 and 2011 and expected to be at the same level in 2012.
While this growth trend is a positive, tax equity capacity still remains below pre-crisis levels.
29The Moore Group LLC

TEI - Requirements
Project with:Proven technology and quality equipmentSize greater than USD$100 millionWell structured utility scale project with fixed PPAModest leverage and/or high debt service coverage
ratios (DSCRs) with minimal variability. Investment grade risk characteristics
Developer with:Experience in utility scale renewable energy projects Strong financial capabilitiesSignificant capital at risk (“skin in the game”)
30The Moore Group LLC

TEI Yields Investor yields are correlated with supply & demand (more so than
interest rates) and have remained stable
31The Moore Group LLC

TEI Comments
The range of returns that TEI’s are seeking are typically given in articles or by industry participants at conferences without qualifying the particulars of a deal. The required return that a TEI would seek for a deal with commercial risk (PPAs are with non-investment grade off-takers) will be dramatically different then the return that a TEI would require for a project similar to the Nevada 300 project that has structured away the operating risk and has a long term PPA with a large investment grade utility.
XXXXXX Project is a large scale utility project that has utility type risk . The risk is the that the utility does not pay the XXXXXX Project under its long term contractual agreement (PPA) with the Project.
The current long term (20+ yrs.) debt cost for utilities in the U.S. is in the <5% range (pre-tax). An "institutional investor" looks at investing in the XXXXXX Project as an attractive "risk arbitrage" to investing in one of those long term bonds that they could otherwise invest in.
32The Moore Group LLC

TEI Comments
XXXXXXX still assumes a 9% yield (after tax) for a utility risk profile. The risk of non-performance in the project is structured away through the PPA, the equipment warranties and the minimal variability in solar insolation levels at the XXXXXXX Project site.
An investor cannot justify required returns of >15% (after-tax) for a structured investment that has a risk profile very similar to what they would have by buying a fixed income bond from this same utility with an after tax yield in the 3 - 4% range.
As technology matures and has greater history of operating performance the required yields from all segments of the capital structure will be reduced. As a case in point Solar PV is becoming much prevalent in the market and the differences in the cost of money between PV and Wind is becoming smaller. Some lenders and TEI’s now actually prefer solar PV to wind due to portfolio concentrations. In time expectations are that Solar PV will be below that of wind, since wind can have much greater volatility in its operating performance.
33The Moore Group LLC

Review of Capital Structures
34The Moore Group LLC
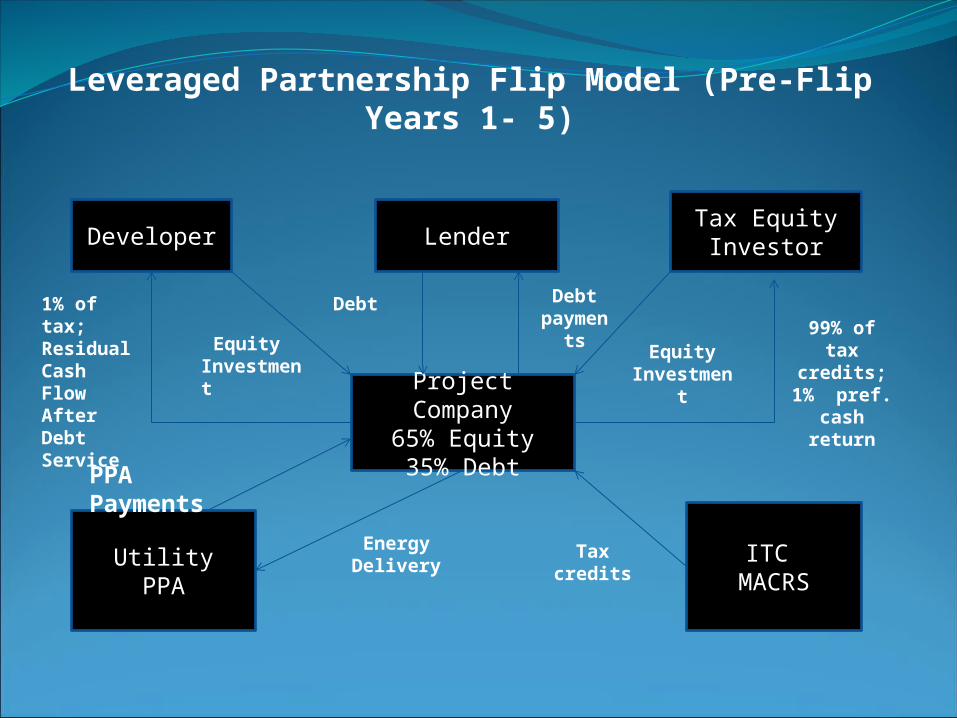
Leveraged Partnership Flip Model (Pre-Flip Years 1- 5)
Developer LenderTax EquityInvestor
Project Company
65% Equity35% Debt
UtilityPPA
ITC MACRS
Debt payments
Equity Investment
99% of tax credits;
1% pref.cash return
Debt
Equity Investment
PPA Payments
1% of tax;Residual Cash FlowAfter DebtService
Energy Delivery
Tax credits
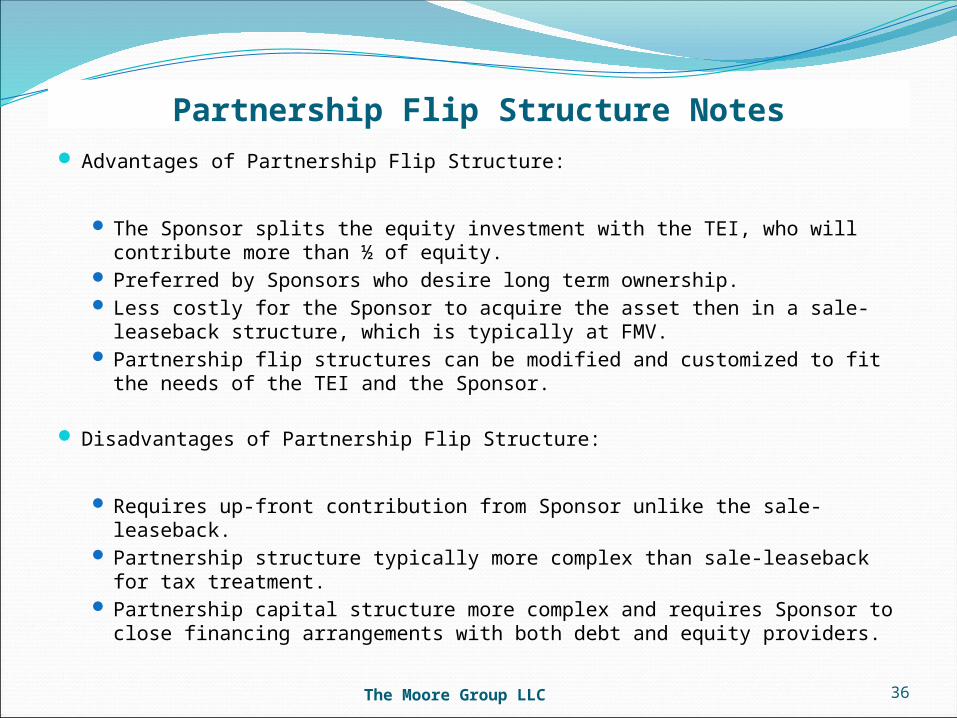
Partnership Flip Structure Notes Advantages of Partnership Flip Structure:
The Sponsor splits the equity investment with the TEI, who will contribute more than ½ of equity.
Preferred by Sponsors who desire long term ownership. Less costly for the Sponsor to acquire the asset then in a sale-leaseback
structure, which is typically at FMV. Partnership flip structures can be modified and customized to fit the
needs of the TEI and the Sponsor.
Disadvantages of Partnership Flip Structure:
Requires up-front contribution from Sponsor unlike the sale-leaseback. Partnership structure typically more complex than sale-leaseback for
tax treatment. Partnership capital structure more complex and requires Sponsor to
close financing arrangements with both debt and equity providers.
36The Moore Group LLC

Leveraged Partnership Flip Model (Post-Flip in Year 6)
Developer LenderTax EquityInvestor
Project Company
65% Equity35% Debt
UtilityPPA
ITC MACRS
Debt payments
Debt
PPA Payments
95% of free cash flow
Energy Delivery Tax credits
0.5% preferred return;5% of remaining cash flows

Sale Leaseback Model (Pre - Sale)
Developer Tax Equity Investor
Project Company
(100 % equity)
100% equityOwner
DevelopsProject
Cash for Project

Sale Leaseback Model (Post - Sale)
Developer Tax Equity Investor
Project Company
(100 % equity)
Lease Payments
100% ofCash flows
UtilityPPA
PPA Payments
Power Delivery ITC MACRS
100 % of tax credits
100% equity
100% tax benefits
OperatingCosts

Sale-Leaseback Notes
Advantages to Sponsor in Sale-Leaseback:
No up-front equity contribution. 100% financing Sponsor receives up-front cash flow in the form of asset sales,
establishes a track record and can undertake new project development opportunities.
Economic benefits are front-end loaded Ideal structure for poorly performing assets.
Disadvantages to Sponsor in Sale-Leaseback:
More costly than a partnership flip structure to buy out Lessor. Limited participation in project upside until early buy-out. Sacrifice of residual interest for up-front current cash flow.
40The Moore Group LLC
Execution Plan for Project Financing
41The Moore Group LLC

Execution Plan for Project Financing Project Financing will require a coordinated effort of approximately 16 months to
raise up to $1 billion.
Need for decisions on equipment and up-dated economic analysis .
Need to solidify PPA. PPA will become the critical path item for the financing this Spring.
Preparation of Information Memorandum (February – June 2012) Send out comprehensive overview of project, its economic profile, planned
equipment to be used, its unique characteristics, Sponsor, detailed summary of its contracts, most importantly the PPA and status on interconnect and all permits and licenses required for the construction and operation of the project.
Execution of Project Financing (July 2012 – April 2013) Negotiate with individual capital providers and decide on optimum capital
structure. Execute term sheets with all of the selected capital providers Execute inter-creditor agreement with all of the selected capital providers Minimize Sponsor’s at-risk capital prior to construction closing. Execute financial closing on the receipt of all necessary permits and licenses
42The Moore Group LLC
Key Decision Items
43The Moore Group LLC
Key Decision Items Given the tight time frame to close financing and break ground in 2nd quarter 2013,
the following items need to be addressed:
Choose a technology partner: Cost Performance Financing Considerations
Development Plan: Need to move forward so we can ”frame a deal”
Hire a PPA Advisor: Given the complexities in the utility PPA market, a seasoned advisor
with high level contacts seems like a good investment
Install a Meteorological Station on the XXXXXX site: Given the measure of error at the nearest meteorological station at
McCarran Airport in Las Vegas, without its own on-site meteorological data, the Project would be faced with a much greater dispersion of performance at various confidence intervals. This will have a material impact on the XXXXXX Project’s ability to raise debt capital. 44The Moore Group LLC