finance class outline-2012
TRANSCRIPT

FINANCE JOHN BEASLEY CONSTRUCTION 1
Finance for real estate and construction: This class teaches how to put together a proper financial package, Pro-forma balance sheets, Pro-forma Income Statements, as well as how to run Monte Carlo risk analysis and Sensitivity analysis on the project, finally packaging, presentation and shopping techniques will be presented. Final project is a (brief) class presentation and defense of the project as they would make it to the bank. outline of finance class Introduction - Reevaluate the learning process
• Myers-Briggs learning styles • Erasing educational shame – Born to Win • Think and Grow Rich – Napoleon Hill • “If you can help enough people get what they want, you can get what you want
in life” – Zig Ziggler. • Newspaper Article .
1: review of a finished presentation - detail the elements of a presentation
• Review of HP-12C – mortgages, NPV, IRR, • Review of statistics
2: review of financial statements
• Review of accounting • building a pro-forma financial statement
4: information gathering - sources of information
• Dunn and Bradstreet – reference library • Property Appraisers Office • Appraisers reports • Internet searches • County property appraisers web-site searches • Building department – building permits • Chamber of Commerce reports • State of Florida reports • Industry publications – Board of Realtors – Home Builders Assoc. • Magazines • Fundamental research – do it yourself
5: reviewing a deal – proving a deal is solid
• Building excel models as economic models • review of sensitivity analysis • review of deterministic risk and stochastic modeling • review of Monte-Carlo risk analysis

2 Brevard Contractor’s School
6: making a project work - "what-if"
• think of a project as a radio that has dials and buttons
• On/Off button is the invest – don’t invest decision • Volume is cost and price of your product • Station tuning is product; type, quality, location
7: learning the market criteria
• Calculating breakeven analysis •
8: putting together a presentation • Elements of a presentation • Supporting evidence • Pie – Proof – Information – examples •
9: techniques for shopping a loan • Always present your package to your best chance last. • Choose 3 lenders that you know do not make these loans and try to convince
them to review your project. convince them your project is that good. Practice your salesmanship, practice presenting the package – see what works – see what they buy into and what they reject. Look the part –your credibility is based on presentation - or they will reject your argument. (bankers with only the power to say no).
10: Letter of intent to finance with specified terms of the loan
• Lock in a rate with a deposit
11: Students should make a 10-minute or less presentation to the class.
• Put together a presentation on a current project you are working on, or one you have worked on previously.
• Present it to the class, and we will try to shoot holes in your project, if time allows you can fix your project and present it again.

FINANCE JOHN BEASLEY CONSTRUCTION 3
The Myers-Briggs is useful because getting financing is about selling yourself, so you have to understand who you are and how people see you.
Myers Briggs For our purposes the Myers Briggs will help you figure out how you learn. How you process information. It is important that we learn how to get this information into your head. Everyone learns differently, some people are visual and they use flash cards and memorize pictures in the front of their brain. Some people are auditory and they remember what they hear. Some people learn by doing, these people are great builders, but they have the headrest time passing the contractors exam. Kersey’s personality profiler can be found on line at www. Or you can borrow the book, Please Understand Me, by David Kersey from most public libraries. This is a quick profile that is 90% accurate. It is quick and easy – if you like, do this test and we can talk about it. If you don't want to see what your personality type is, that is fine too. If you want a professional analysis, most colleges offer the formal exam, or go to the University of Florida web site: www. Here is what I learned about myself. I am an INTP. I am an introverted, intuitive, thinking, perceptive. Only 1:1000 to 1:100 of the people see the world the way I do. I am almost all right brained. I am auditory, so I learn best by listening. I am a top down learner, preferring deductive non-linear logic. The Myers-Briggs type analysis is based on Carl Jung's system that was designed to understand extroversion Vs. introversion, and sensing Vs. intuitive types. This was to explain his differences with his mentor Sigmund Freud. Isabel Myers and her daughter regrouped Jung's findings into four groups SJ's, SP's, NF's, and NT's. This made Jung's system

4 Brevard Contractor’s School
fit into a number of other systems, most notably the classic Hippocratic system from 450 B.C. SJ's = Melancholic SP's = Sanguine NF's = Choleric NT's = Phlegmatic
Myers- Briggs
Left Right Extrovert E 75% Introvert I 25% Sensing S 75% Intuitive N 25% Thinking T 50% Feeling F 50% Judgmental J 60% Perceptive P 40%
Extroverts tend to be efficient, expedient and focused on the empirical external world view. Introverts are inwardly focused and bring intensity to a task. Sensing types tend to be external focused and linear thinkers, and are typically bottom up learners. Intuitive types are global thinkers and tend to favor deductive logic and top down learning styles. Thinking types tend to be logical thinkers. Feeling types tend to be relational and may put logic below harmony. Judgmental types tend to be structured, organized problem solvers. Perceptive types tend to be adaptive and oven ended, solving problems at the last minute.

FINANCE JOHN BEASLEY CONSTRUCTION 5
Oranges SP
Sp's are adaptable, artistic, athletic, do not fight reality, don't get wrought up, are easy going, act with effortless economy, enjoy life, are gifted with tools and machines, are good natured, have no use for theories, notice reality, and are open minded.
Gold SJ
SJ's are dependable, factual, painstaking, routinized, thorough, conservative, consistent, detailed, hard-working, patient persevering, sensible, and stable.
Green NT
The NT is abstract, analytic, complex, curious, efficient, exacting, impersonal, independent, ingenious, intellectual, inventive, logical, scientific, theoretical, research oriented.
Blue
NF The NF is enthusiastic, humane, religious, subjective, sympathetic, insightful, creative, imaginative, a researcher, teacher, preacher, counselor, writer, psychologist, and linguist.
6 Brevard Contractor’s School
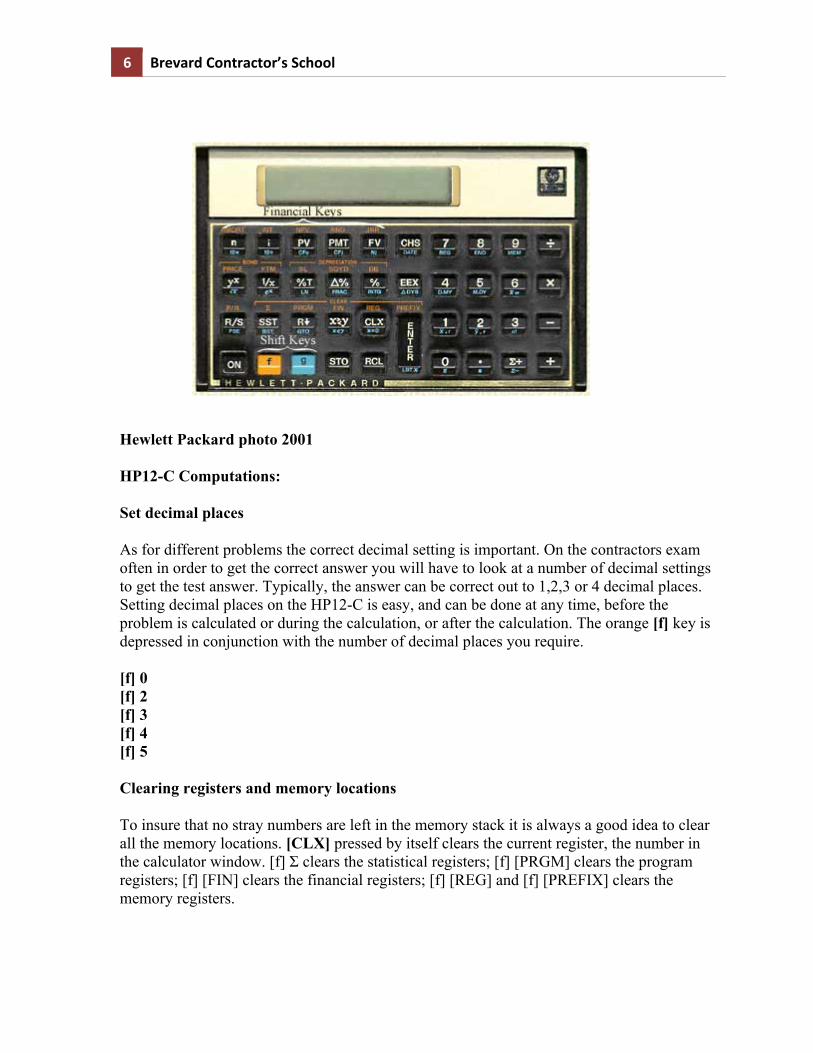
Hewlett Packard photo 2001 HP12-C Computations: Set decimal places As for different problems the correct decimal setting is important. On the contractors exam often in order to get the correct answer you will have to look at a number of decimal settings to get the test answer. Typically, the answer can be correct out to 1,2,3 or 4 decimal places. Setting decimal places on the HP12-C is easy, and can be done at any time, before the problem is calculated or during the calculation, or after the calculation. The orange [f] key is depressed in conjunction with the number of decimal places you require. [f] 0 [f] 2 [f] 3 [f] 4 [f] 5 Clearing registers and memory locations To insure that no stray numbers are left in the memory stack it is always a good idea to clear all the memory locations. [CLX] pressed by itself clears the current register, the number in the calculator window. [f] Σ clears the statistical registers; [f] [PRGM] clears the program registers; [f] [FIN] clears the financial registers; [f] [REG] and [f] [PREFIX] clears the memory registers.

FINANCE JOHN BEASLEY CONSTRUCTION 7
Set the interest periods at the beginning or ending of period Some loans calculate interest from the beginning of the month. The more common practice is to collect interest at the end of the month. The HP12C can be converted to handle interest in either fashion. To use the end period press [g] 8 (END); to use the beginning period press [g][7] (BEG) before solving for a mortgage calculation or annuity. Sign conversion – CHS (change sign) To change from a positive number to a negative, or visa versa press the [CHS] key. Saving answers in memory registers (STO & RCL) To save information in memory locations use the [STO] storage key and the [RCL] recall key in conjunction with the number pad from 1 to 9. Actually you can use 9 memory locations under the white keys, 9 under the orange keys, and 9 under the blue keys. For the most part the 9 memory locations available under the white keys should be sufficient. Calculating points on a mortgage Points are interest that the bank collects at loan origination. When a bank is acting as a broker for another institution such as Fanny May or Freddie Mac the points equate to the banks payment for processing the loan. In other cases it is preferable to pay points in order to buy down a mortgage interest rate. Let us say you are negotiating to build a home, and a home buyer can’t quite qualify for the mortgage. Your options are to build less house, or it might be more profitable for you to buy down loan to bring the payments into line. The important element of calculating points on a mortgage is to understand that 1 point equals 5/8 of 1%. The First thing to do is to calculate your constant 1 ÷ 8 = .125 * 5 = .00625, which means each point costs .625%. Then determine how many points you are being charged on the mortgage. The loan is a 15 year fully amortizing loan. The loan amount is $100,000 at 7% with 6 points due at closing. What are the net proceeds of the loan at closing? What are the payments? Your buyer can only have a 30% debt load for housing, (PITI). If you paid 2 more points what would their payment be? KEY STROKES DISPLAY READS [f] 2 6 [ENTER] 6 .01* 6 100 ÷ .06 [STO] 1 100,000 [ENTER] [RCL] 1 * 6,0000
8 Brevard Contractor’s School
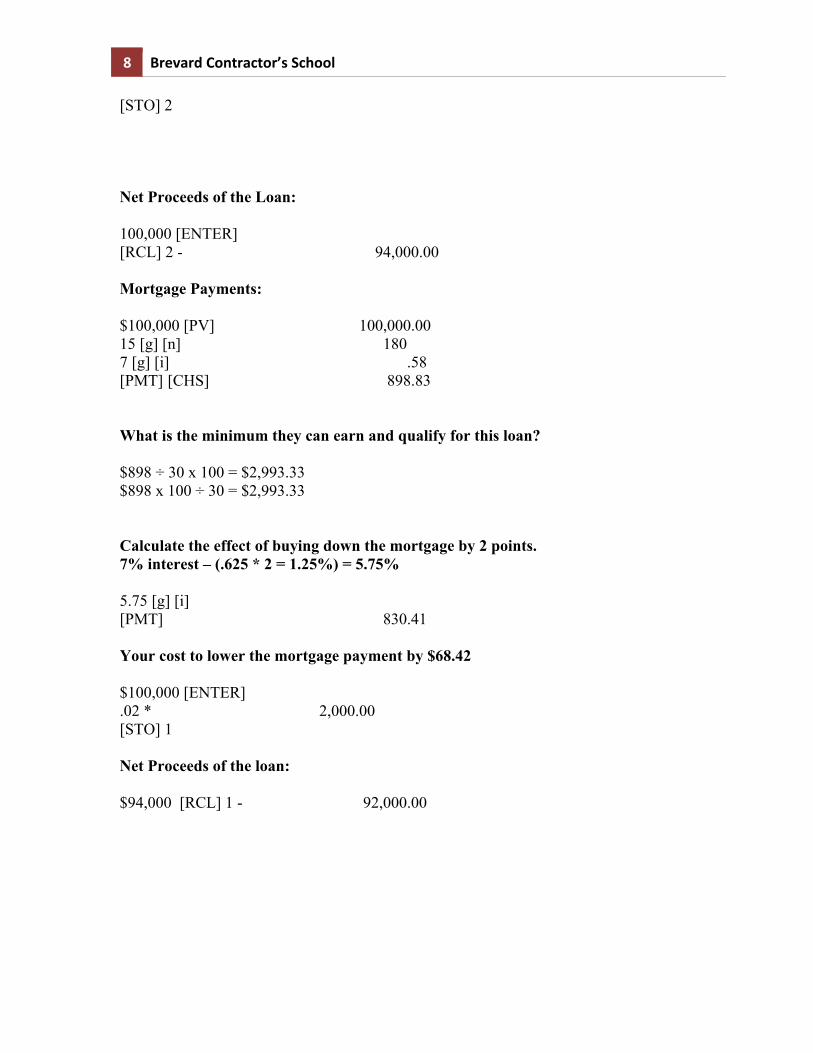
[STO] 2 Net Proceeds of the Loan: 100,000 [ENTER] [RCL] 2 - 94,000.00 Mortgage Payments: $100,000 [PV] 100,000.00 15 [g] [n] 180 7 [g] [i] .58 [PMT] [CHS] 898.83 What is the minimum they can earn and qualify for this loan? $898 ÷ 30 x 100 = $2,993.33 $898 x 100 ÷ 30 = $2,993.33 Calculate the effect of buying down the mortgage by 2 points. 7% interest – (.625 * 2 = 1.25%) = 5.75% 5.75 [g] [i] [PMT] 830.41 Your cost to lower the mortgage payment by $68.42 $100,000 [ENTER] .02 * 2,000.00 [STO] 1 Net Proceeds of the loan: $94,000 [RCL] 1 - 92,000.00

FINANCE JOHN BEASLEY CONSTRUCTION 9
Discounting mortgages You have built a spec house at an out of pocket cost to you of $110,000. You put the house on the market at $205,000 and you have been offered $195,000. A snag happens when the buyers cannot obtain financing. If you will hold the mortgage the buyer will pay 10% down and 10% interest on the loan. You need your money now, but you don’t want to let go of this deal. You contact a few sharks that buy mortgages on the secondary market. You present the following situation: I have a first mortgage on a fee simple title, and the mortgagees have a good credit record. I just need to cash out so I can build more houses. The Mortgage banker looks over your deal and offers you 6 percent for your mortgage. How much profit will you make on this house if you make the deal? KEY STROKES DISPLAY READS 195,000 .10 * 19,500.00 [STO] 1 195,000 [RCL] 1 - 175,500.00 175,500 [PV] 10 [g] [i] .83 25 [g] [n] 300 [PMT] 1,594.77 [n] * 478,430.94 175,500 [ENTER] [STO] 1 .96 * 168,480.00 [STO] 2 [RCL] 1 [RCL] 2 - 7,020.00 168,480.00 [ENTER] 110,000 - 58,480.00 19,500 + 77,980.00 110,000 ÷ .71
10 Brevard Contractor’s School
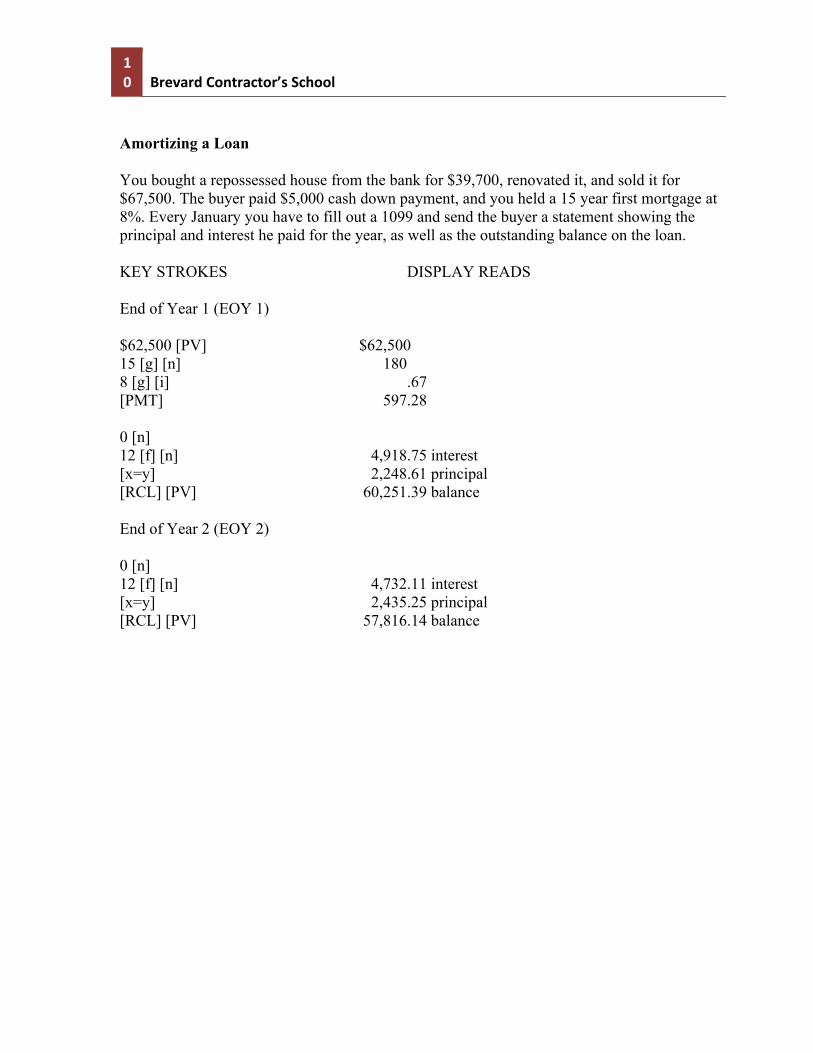
Amortizing a Loan You bought a repossessed house from the bank for $39,700, renovated it, and sold it for $67,500. The buyer paid $5,000 cash down payment, and you held a 15 year first mortgage at 8%. Every January you have to fill out a 1099 and send the buyer a statement showing the principal and interest he paid for the year, as well as the outstanding balance on the loan. KEY STROKES DISPLAY READS End of Year 1 (EOY 1) $62,500 [PV] $62,500 15 [g] [n] 180 8 [g] [i] .67 [PMT] 597.28 0 [n] 12 [f] [n] 4,918.75 interest [x=y] 2,248.61 principal [RCL] [PV] 60,251.39 balance End of Year 2 (EOY 2) 0 [n] 12 [f] [n] 4,732.11 interest [x=y] 2,435.25 principal [RCL] [PV] 57,816.14 balance
FINANCE JOHN BEASLEY CONSTRUCTION
11
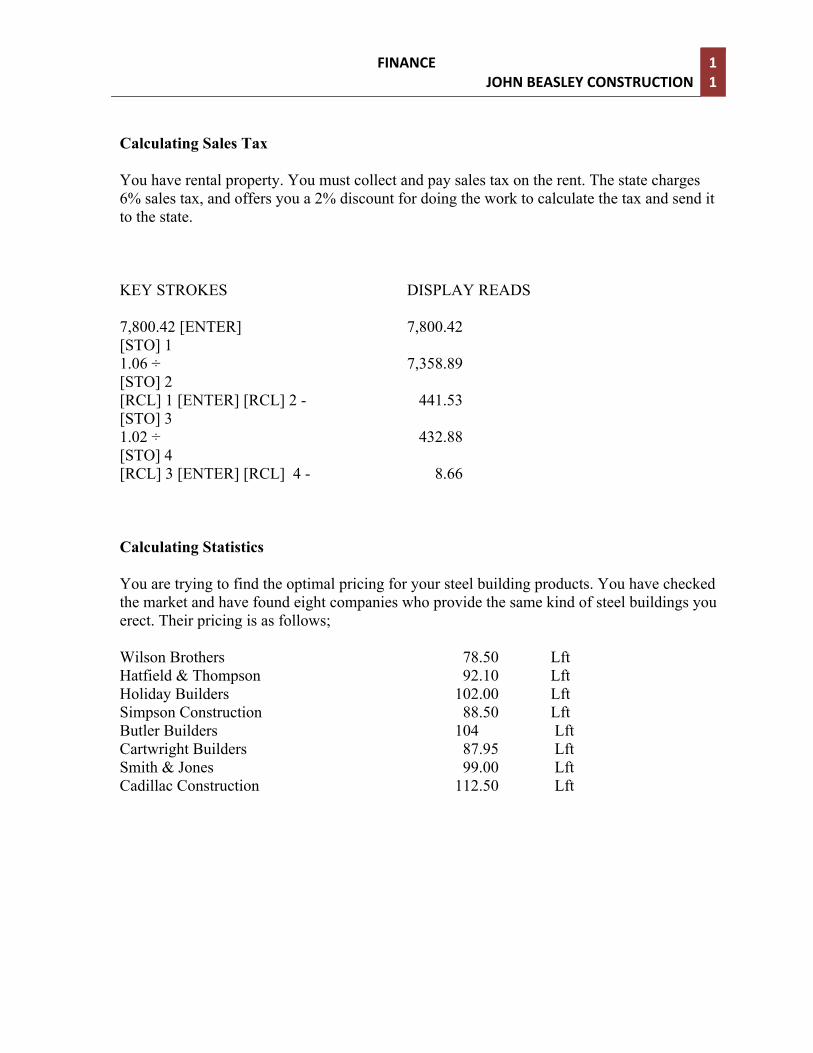
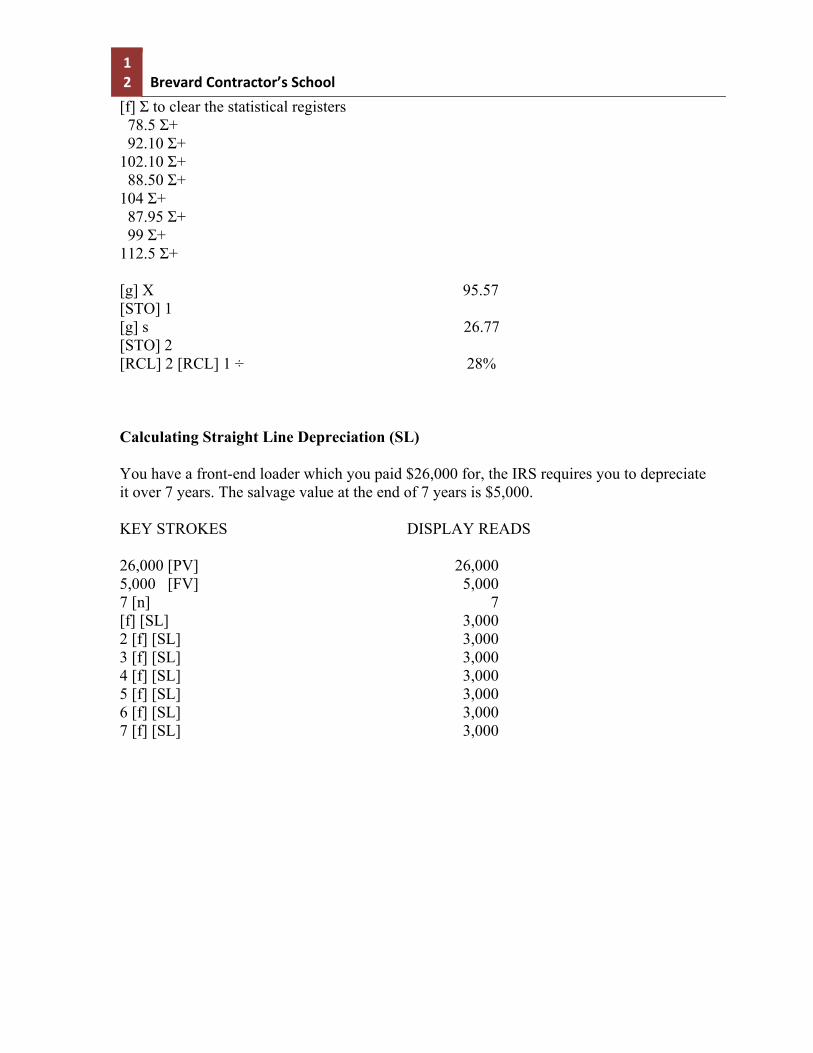
Calculating Sales Tax You have rental property. You must collect and pay sales tax on the rent. The state charges 6% sales tax, and offers you a 2% discount for doing the work to calculate the tax and send it to the state. KEY STROKES DISPLAY READS 7,800.42 [ENTER] 7,800.42 [STO] 1 1.06 ÷ 7,358.89 [STO] 2 [RCL] 1 [ENTER] [RCL] 2 - 441.53 [STO] 3 1.02 ÷ 432.88 [STO] 4 [RCL] 3 [ENTER] [RCL] 4 - 8.66 Calculating Statistics You are trying to find the optimal pricing for your steel building products. You have checked the market and have found eight companies who provide the same kind of steel buildings you erect. Their pricing is as follows; Wilson Brothers 78.50 Lft Hatfield & Thompson 92.10 Lft Holiday Builders 102.00 Lft Simpson Construction 88.50 Lft Butler Builders 104 Lft Cartwright Builders 87.95 Lft Smith & Jones 99.00 Lft Cadillac Construction 112.50 Lft
12 Brevard Contractor’s School
[f] Σ to clear the statistical registers 78.5 Σ+ 92.10 Σ+ 102.10 Σ+ 88.50 Σ+ 104 Σ+ 87.95 Σ+ 99 Σ+ 112.5 Σ+ [g] X 95.57 [STO] 1 [g] s 26.77 [STO] 2 [RCL] 2 [RCL] 1 ÷ 28% Calculating Straight Line Depreciation (SL) You have a front-end loader which you paid $26,000 for, the IRS requires you to depreciate it over 7 years. The salvage value at the end of 7 years is $5,000. KEY STROKES DISPLAY READS 26,000 [PV] 26,000 5,000 [FV] 5,000 7 [n] 7 [f] [SL] 3,000 2 [f] [SL] 3,000 3 [f] [SL] 3,000 4 [f] [SL] 3,000 5 [f] [SL] 3,000 6 [f] [SL] 3,000 7 [f] [SL] 3,000

FINANCE JOHN BEASLEY CONSTRUCTION
13
Calculating Double Declining Balance (DB) KEY STROKES DISPLAY READS 26,000 [PV] 26,000 0 [FV] 0 200 [i] or 150[i] or 125[i] 200 7 [n] 7 1 [f] [DB] 7,429 2 [f] [DB] 5,306 3 [f] [DB] 3,790 4 [f] [DB] 2,707 5 [f] [DB] 1,768 6 [f] [DB] 0 7 [f] [DB] 0 Date Functions You are considering a job that begins on March 1, 2003 and must be completed in 32 days. 03.012003 [ENTER] 32 [g] [DATE] 4, 02,2003 3 (Wednesday) Calculate NPV - Net Present Value of the cash flows [f] CLEAR [REG] [g] [CF0] -49,000 [CHS] [g] [CFj] 6,000 [g] [CFj] 6,000 [g] [CFj] 6,000 [g] [CFj] 6,000 [g] [CFj] 65,000 8 [i] (Investment Hurtle Rate) [f] [NPV] 15,111 Calculate IRR – Internal Rate of Return [f] IRR 15.26%

14 Brevard Contractor’s School
Using Financial and Business Calculators /
Mridu Vashist; George E Pinches
1996 English Book 36 p. ; 24 cm. New York : HarperCollins College Publishers, ISBN: 0673975134 (pbk.) . discusses the basic functions of three calculators, i.e, Hewlett-Packard HP12C and HP10B, and Texas Instruments TIBAII plus"--P. 1./ Appendix to 5th ed. of "Essentials of financial management / George E. Pinches." How to use the HP12C /
Robert E Gallaher
1985 English Book 57 p. : ill. ; 28 cm. Chicago, Ill. : Residential Sales Council of the Realtors National Marketing Institute, ISBN: 091365258X (pbk.) HP-12C Training Guide /
Hewlett-Packard Company.
1982 English Book 1 v. (various pagings) : ill. ; 28 cm. Corvallis, OR : Hewlett-Packard, Investment Securities Program Guide Using the HP-12C /
W Scott Bauman; Jaroslaw Komarynsky; John C Siska Goytre
1987 English Book x, 146 p. : ill. ; 23 cm. [New York, N.Y. : McGraw-Hill], ISBN: 0070041040 (pbk.)

FINANCE JOHN BEASLEY CONSTRUCTION
15
Analyzing Investment Properties /
Andrew W Tompos
1999 English Book ix, 131 p. : ill. ; 28 cm. Upper Saddle River, NJ : Prentice-Hall, The HP-12C Real Estate Solutions Manual : an easy-to-use, step-by-step guide for the real estate professional /
Albert Santi
1990 Rev. ed. English Book viii, 71 p. ; 21 cm. Chicago, Ill. : Probus Pub. Co., ISBN: 1557381224 : Practical Real Estate Financial Analysis : using the HP-12C calculator : a step-by-step approach /
Elbert B Greynolds; Julius S Aronofsky
1983 English Book vi, 233 p. : ill. ; 28 cm. Chicago : Real Estate Education Co., ISBN: 0884623785 (pbk.) : 0884624978 (pbk.) An easy course in using the HP-12C and other HP financial calculators /
Chris Coffin; Ted Wadman
1984 English Book 255 p. : ill. ; 28 cm. Portland, Ore. : Grapevine Publications, HP - 12C owner's handbook and problem - solving guide.
Hewlett-Packard Company.
1987, ©1982 Ed. 1. English Book 246 p. Corvallis, OR, U.S.A. : Hewlett Packard Co.,
16 Brevard Contractor’s School Suggested keystroke routines for practical real estate applications /
Byrl N Boyce
1983 English Book 30, 9 leaves ; 28 cm. Storrs : Center for Real Estate and Urban Economic Studies, School of Business Administration, University of Connecticut, ISBN: 0931176166 Practical Real Estate Applications (HP-38E/C and HP-12C calculators) /
Byrl N Boyce
1983 English Book 68, 9 leaves ; 28 cm. Storrs : Center for Real Estate and Urban Economic Studies, School of Business Administration, University of Connecticut, ISBN: 0931176158 HP-12C training guide /
Hewlett-Packard Company.
1982 English Book 1 v. (various pagings) : ill. ; 28 cm. Corvallis, OR : Hewlett-Packard, HP-12C solutions handbook.
Hewlett-Parkard Company.
1982, ©1981 January 1982. English Book 152 p. : charts ; 17 cm. Corvallis, Or. : Hewlett-Packard, Professional real estate problem solving using the HP 12C : a step by step approach /
John A Tirone
1997 2nd ed. English Book xi, 302 p. ; 28 cm. Harper Woods, MI : John A. Tirone, ISBN: 0962423645

FINANCE JOHN BEASLEY CONSTRUCTION
17
Leasing applications for the HP-12C /
Sudhir P Amembal; Shawn D Halladay; Lynn Leary Meyers
1991 English Book xii, 272 p. : ill. ; 28 cm. Salt Lake City, UT : Amembal, Halladay & Isom, ISBN: 0945988028 HP-12C real estate applications handbook /
Mark H Goldman; Stephen D Messner
1984, ©1982 English Book 101 p. : ill. ; 17 cm. Corvallis, OR : Hewlett-Packard, HP-12C leasing applications handbook /
Terry A Isom; Sudhir P Amembal
1982 English Book 117 p. : ill. ; 17 cm. Corvallis, OR : Hewlett-Packard,

18 Brevard Contractor’s School
ACCOUNTING SUMMARY We will begin with a review of accounting basics before going into designing pro forma financial statements. Let’s review the relationship between assets and liabilities plus net worth in the classic presentation of the Balance Sheet. Assets: Debit Credit Debit Credit Assets Cash xxx Accounts Receivable xxx Bad Debt Reserves xxx Fixed Assets xxx Depreciation Reserve xxx
Liabilities xxx Accounts Payable xxx
Taxes Payable xxx Notes Payable xxx
Net Worth xxx Capital Stock xxx
Retained Earnings xxx Look at the Balance Sheet; it has 3 accounts, Assets on the left side, and Liabilities and Net Worth on the right side of the page. The two sides allow for a debit or credit balance for each account. The left column is called the debit side and the right side column is called the credit side. Assets usually carry a debit balance, which means there is a positive number located on the left side of the equation. Liabilities and Net Worth usually carry a credit balance. The two sides of the balance sheet must always balance or equal each other. The two sides of the account are like a mirror image of each other.
FINANCE JOHN BEASLEY CONSTRUCTION
19
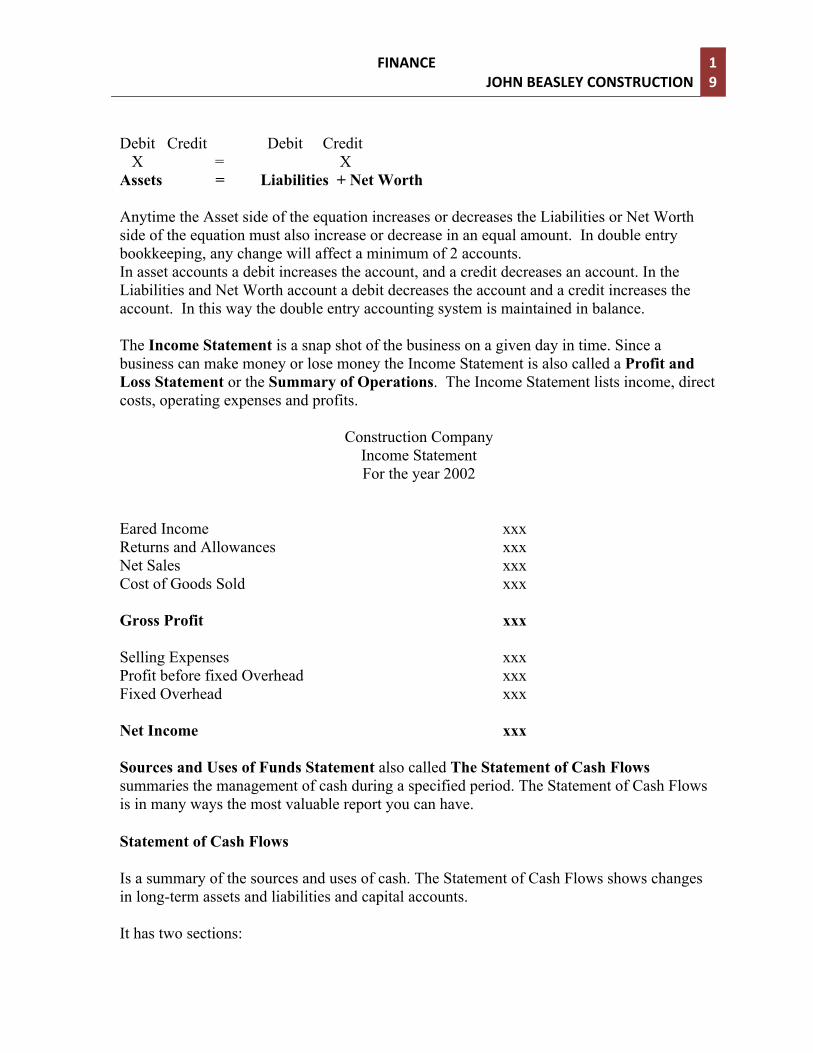
Debit Credit Debit Credit X = X Assets = Liabilities + Net Worth Anytime the Asset side of the equation increases or decreases the Liabilities or Net Worth side of the equation must also increase or decrease in an equal amount. In double entry bookkeeping, any change will affect a minimum of 2 accounts. In asset accounts a debit increases the account, and a credit decreases an account. In the Liabilities and Net Worth account a debit decreases the account and a credit increases the account. In this way the double entry accounting system is maintained in balance. The Income Statement is a snap shot of the business on a given day in time. Since a business can make money or lose money the Income Statement is also called a Profit and Loss Statement or the Summary of Operations. The Income Statement lists income, direct costs, operating expenses and profits.
Construction Company
Income Statement For the year 2002
Eared Income xxx Returns and Allowances xxx Net Sales xxx Cost of Goods Sold xxx Gross Profit xxx Selling Expenses xxx Profit before fixed Overhead xxx Fixed Overhead xxx Net Income xxx Sources and Uses of Funds Statement also called The Statement of Cash Flows summaries the management of cash during a specified period. The Statement of Cash Flows is in many ways the most valuable report you can have. Statement of Cash Flows Is a summary of the sources and uses of cash. The Statement of Cash Flows shows changes in long-term assets and liabilities and capital accounts. It has two sections:

20 Brevard Contractor’s School
• Fixed or long-term provisions of funds. • Change in current assets and liabilities.
Sources of Capital Net profit on a cash basis Funds received from the sale of capital assets Funds received in the form of a loan proceeds Investments of capital by stockholders Increases in long-term liabilities Uses or (applications) of Capital Funds paid for the acquisition of capital assets Reduction in long-term liabilities Dividends paid or payments to stockholders Decreases in long-term liability accounts The net difference between these two accounts, long term assets, and long term liability and capital accounts result in a net increase or decrease in funds for the period.
Funds Flow Analysis Sources of Funds Profit from operations __________________________ Depreciation __________________________ Decrease in cash __________________________ Decrease in receivables __________________________ Decrease in Inventories __________________________ Decrease in other assets __________________________ Increase in payables __________________________ Increase in notes __________________________ Increase in common stock __________________________ Increase in accrued expenses __________________________ Increase in deferred taxes __________________________ Gain form sale of asset __________________________ Other __________________________ TOTAL =======================

FINANCE JOHN BEASLEY CONSTRUCTION
21
Uses of Funds Increase in accounts receivable __________________________ Increase in notes receivable __________________________ Increase in inventory __________________________ Increase in plant and equipment __________________________ Increase in prepaids __________________________ Decrease in notes payable __________________________ Decrease in secured notes __________________________ Dividends __________________________ Decrease in mortgage __________________________ Increase in Cash __________________________ TOTAL ======================= Look again at the Balance Sheet; each of these accounts can be managed. The cash category, called the cash account can and must be monitored to insure that enough cash is available to run the business. It is normal to keep a cash journal to make it easier to do sales tax reports. Charge sales are kept in a separate journal from cash sales so they can be monitored as accounts receivable. Cash flow problems are common to builders because the construction business requires large investments. A cash budget should accomplish the following.
• Make cash available for day-to-day operations. • Plan for the use of excess funds. • Time operations for seasonal business changes. • Provide for levels of inventory. • Prepare for tax liabilities. • Control the purchase of materials and help prevent over or under buying. • Help you maintain a good credit rating.
Ratio Test for Cash The Current Ratio compares current assets (cash, receivables and inventories) to current liabilities (current notes payable, accounts payable, accrued taxes). Current Ratio = Current Assets / Current Liabilities

22 Brevard Contractor’s School
A good current ratio is 2:1 or higher, which means current assets are double current liabilities. A 1:1 ratio is weak. A negative ratio is cause for concern, not only is the company low on cash, but growth potential is negative as well. It is common to try and obtain more cash to increase the ratio, instead try to reduce your current liabilities. The current ratio is the most popular and widely used test for cash position. The Quick Ratio compares current assets (not including inventories) to current liabilities. An acceptable ratio rate is 1:1 or better. This quick ratio is also called the Acid Test because it tests the ability of a company to pay its current debts from its current cash and near cash assets. The acid test is a more consistent test as inventories are variable. Quick Ratio = (Current Assets – Inventories) / Current Liabilities Ratio analysis: Using the Balance Sheet and Income Statement it is possible to do analysis on a business. Ratios are a quick and easy way to understand how well a business is performing. Also, one can obtain a SIC – Standard Industrial Classification for a comparable class of industry and compare this companies ratios with the industry standard. The analysis takes the form of ratio analysis. Certain accounts in the Balance Statement or Income Statement are divided by other accounts to obtain ratios. Balance Sheet Ratios: Current Ratio = current assets / current liabilities. Quick Assets Ratio (acid test) = Current Assets-Inventories / Current Liabilities. Owner's Investment vs. Creditors Investment = Capital / Current Liabilities. Ability to Meet Obligations = Working Capital / Funded Debt. Working Capital = Current Assets – Current Liabilities. Owner Financing vs. Debt Financing = Net Worth / Assets. Income Statement Account Ratios: Percentage of Gross Profit = Gross Profit / Sales. Expense Control Ratio = Operating Expenses / Sales Volume. Margin of Profit = Net Income / Sales. Combined Ratios: Trend in Charge Sales = Sales / Accounts Receivable. Real Turnover = Cost of Sales / Inventory at Cost. Day’s of Inventory Available = Total Working Days Per Year / Turnover. True Investment Yield = Net Income / Net Worth.
FINANCE JOHN BEASLEY CONSTRUCTION
23
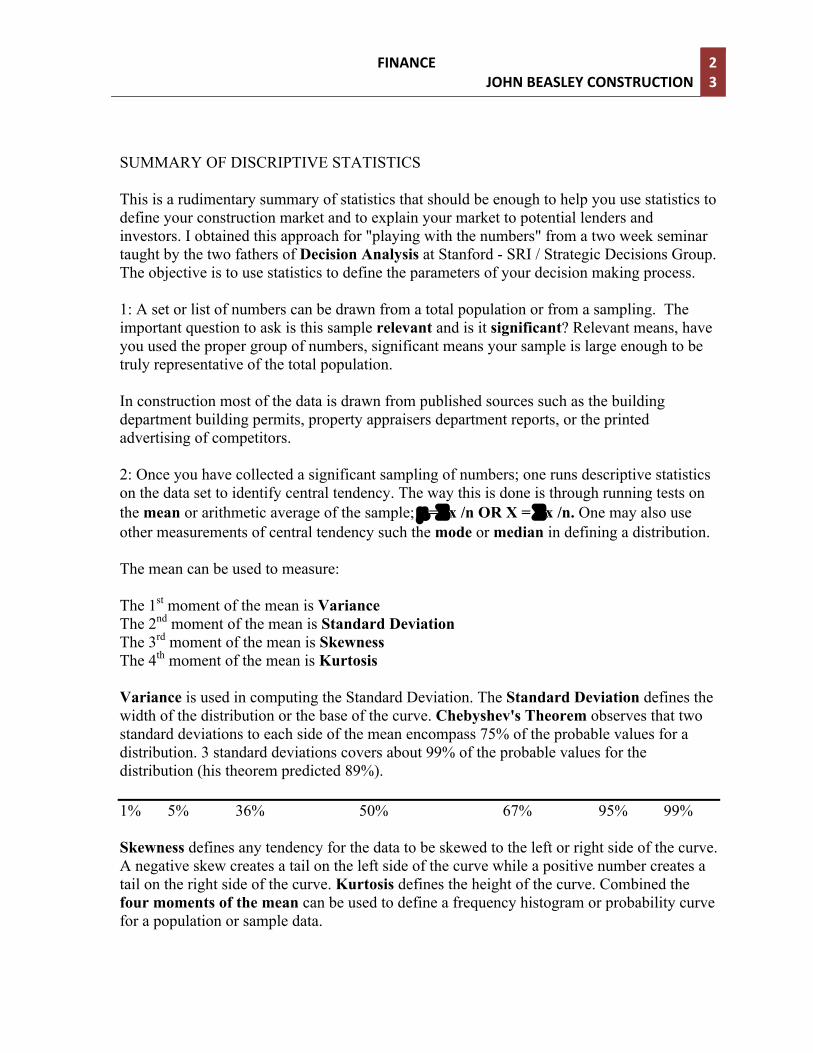
SUMMARY OF DISCRIPTIVE STATISTICS This is a rudimentary summary of statistics that should be enough to help you use statistics to define your construction market and to explain your market to potential lenders and investors. I obtained this approach for "playing with the numbers" from a two week seminar taught by the two fathers of Decision Analysis at Stanford - SRI / Strategic Decisions Group. The objective is to use statistics to define the parameters of your decision making process. 1: A set or list of numbers can be drawn from a total population or from a sampling. The important question to ask is this sample relevant and is it significant? Relevant means, have you used the proper group of numbers, significant means your sample is large enough to be truly representative of the total population. In construction most of the data is drawn from published sources such as the building department building permits, property appraisers department reports, or the printed advertising of competitors. 2: Once you have collected a significant sampling of numbers; one runs descriptive statistics on the data set to identify central tendency. The way this is done is through running tests on the mean or arithmetic average of the sample; µ=Σx /n OR X = Σx /n. One may also use other measurements of central tendency such the mode or median in defining a distribution. The mean can be used to measure: The 1st moment of the mean is Variance The 2nd moment of the mean is Standard Deviation The 3rd moment of the mean is Skewness The 4th moment of the mean is Kurtosis Variance is used in computing the Standard Deviation. The Standard Deviation defines the width of the distribution or the base of the curve. Chebyshev's Theorem observes that two standard deviations to each side of the mean encompass 75% of the probable values for a distribution. 3 standard deviations covers about 99% of the probable values for the distribution (his theorem predicted 89%). 1% 5% 36% 50% 67% 95% 99% Skewness defines any tendency for the data to be skewed to the left or right side of the curve. A negative skew creates a tail on the left side of the curve while a positive number creates a tail on the right side of the curve. Kurtosis defines the height of the curve. Combined the four moments of the mean can be used to define a frequency histogram or probability curve for a population or sample data.

24 Brevard Contractor’s School
These four measurements of central tendency can be used to define the parameters of a curve. The curve can be thought of as a pictorial representation of the distribution of the data. The shape of the curve helps one understand the nature of the data set. Each curve shape defines a different type of distribution. A curve can define a normal distribution, triangular distributions, uniform distribution, binomial distribution, as well as 27 other "common" distributions. The Standard Deviation can be defined as the square root of the variance. S2= Σ(x-µ)2 n-1 The –1 is used to compensate for the under estimate of σ2 by a sample variance S2.
Co-Efficient of Variation: If your standard deviation is greater than 10% of the mean then your data has a great deal of variation. It could indicate that the data set encompassed more than one population. In business it usually indicates that there is a great deal of variation in the industry or market, which means the cash flows from the business venture will be difficult to predict and will therefore carry a greater risk. The contractor or developer should proceed carefully when the Co-Efficient of Variation exceeds 10%. Standard Deviation / Mean = Coefficient of Variation. Example: 23.00 / 82.00 = 28% RISK ATTITUDE In business everyone has a risk attitude, some companies are risk preferring and they usually require a much higher rate of return on investments to offset these risks. Some companies are risk neutral, and they require the level of risk normal for the industry, therefore their rate of return tends to mirror the industry average (as presented in the SIC Standard Industrial Category as published by Dunn & Bradstreet. Some companies are risk adverse; they typically earn a level of return below the industry average. At different times it is natural that a company will assume various risk attitudes. It is important to match the desired risk attitude with a REALISTIC rate of return for that risk attitude. It is highly improbable that one would be risk adverse and at the same time maximize return on investment. How to use Statistics in Real Estate and Construction. 1: Go to the building department and set down with the stack of building permits for the last year for your type of construction. You need to copy down the following information on a note pad: the construction price on the permit and the number of square feet constructed, who the contractor was, and the type of construction (AAA, block with wood joists, or wood frame), the location. Weather you are building commercial, residential, or remodeling the building department will have numbers for your section of the industry.

FINANCE JOHN BEASLEY CONSTRUCTION
25
2: First determine the number of building starts per month and see how much seasonality exists within the market. Determine the average number of building starts per month. You can also note who drew the permit to determine who is your competition, and their share of the market, as well as their pricing structure. 3: Divide the number of your jobs per month by the number of monthly starts from the building department permits and determine your market share. 4: Calculate the mean and standard deviation for all the building starts (per square foot) also calculate the mean and standard deviation for the total number of square feet built per job. Calculate the mean and standard deviation for the total price of construction. 5: Since you have the mean and standard deviation of the prices actually paid per square foot for construction of your type you can build a probability table for the data. Let us use the example that renovation is running on average $82.00 a square foot with a standard deviation of $23 dollars. Odds the price will be lower than stated: 1% 5% 36% 50% 67% 95% 99% $13 $36 $59 $82 $105 $128 $151 Odds you will get the contract if you bid the price above: $13 $36 $59 $82 $105 $128 $151 99% 95% 67% 50% 37% 5% 1% You can determine your pricing structure by how certain you want to be that you will get the job. If you want 1:1 odds of getting the job, bid $82 dollars per square foot. If you want 2:1 odds that you will get the job bid $59 a square foot. You can also use this approach to determine pricing for your construction services. If you are bidding only 10 jobs a month and you need to land 5 to stay in business, then you price your services according to how certain you want to be that you will get that job. In good times, when you are bidding 20 or 30 jobs a month, you only need to land 20% of the contracts to stay in business, so you can bid between one and two standard deviations above the mean. This is a great example of the uses of supply and demand in pricing.

26 Brevard Contractor’s School
Financial Presentation using Descriptive Statistics
In this example, sampling theory and descriptive statistics are used to help
define the foundation for a model that accurately reflects real world inflows and
outflows of cash. The following example shows the application of descriptive
statistics in real estate analysis.
$6 Million Apartment Complex Project
Project Summary
According to the Greater Cocoa Beach area Chamber of Commerce, which
represents (Cocoa, Rockledge, Cape Canaveral, Merritt Island, Cocoa Beach) rental
rates were stated as follows:
2 bedroom Apartment
“$450 per month average up to $600 per month for waterfront.”
3 bedroom Apartment
“$500 per month average up to $650 for waterfront.”
Summary of data: Occupancy rates in the Cocoa Area per sample complexes; Average: 94.0% Standard Deviation: 4.9% The chances of occupancy rates being GREATER than indicated: 90% 84.89% 70% 89.10% 50% (average) 94.00% 10% 103.11% (excess demand)

FINANCE JOHN BEASLEY CONSTRUCTION
27
This project has a high probability of meeting the Freddie Mac occupancy
requirement of 85%. If older units constructed before 1970 are eliminated, and only
like kind developments in the Brevard area are compared, then statistics simulate the
Chamber of Commerce rental rate structure of $450 to $650 per month.
Rental Rates in up-scale apartment complexes in Brevard County:
Average: $448.40 Standard Deviation: $ 51.43 The chances that tenants could find accommodations for LESS than indicated: 10% $352.74 30% $397.00 50% (average) $448.40 90% $544.06* According to the Committee of One Hundred Report, 81% of the people living in
Central Brevard can afford the rent on the Linda Lakes project of $535 per month.
This amount is based on a housing cost not in excess of 38% of gross income.
A potential customer base in Central Brevard for such apartment dwellings as The
Lakes can be extrapolated as follows:
Total population in area 121,448 Percentage qualifying (81%) 98,372 Average % renting 34.8% 34,234 Natural base (10% from above) 3,423* Household size (avg. 2.41) 1,421
This analysis suggests a saturation level of 1,421 dwellings of the up-scale
type units The Lakes proposes to construct in Central Brevard. The Lakes pro-forma

28 Brevard Contractor’s School
goal of achieving 95% occupancy rate is likely, however The Lakes is only likely to
attract 10% of the potential customers looking for rental housing in Central Brevard.
In order to achieve their goals, The Lakes is faced with three options;
Do nothing - do not build the complex.
Pursue a market differentiation strategy by providing amenities which place them
clearly ahead of the competition. The amenities proposed in the project might
include;
• Nature trails or par 3 chip and putt golf course.
• Stocked fishing lakes with fountains.
• Fitness trails.
• Tennis courts, indoor swimming pool, air conditioned racket ball courts,
Jacuzzi (s)
• Outstanding natural landscaping.
• Satellite Dish TV.
• Exceptional designed kitchens to appeal to gourmets.
• Vaulted ceilings.
Unfortunately, the majority of these options are maintenance intensive, unlike
a river view which is available in a number of up-scale rental complexes in the Cocoa
market. By providing amenities to entice buyers, The Lakes may well avoid the
necessity of competing on price. For this project each 1% decrease in price is worth
$34,545 annually to the complex.

FINANCE JOHN BEASLEY CONSTRUCTION
29
Figure 1: Pro-forma Balance Sheet
The Lakes
Pro-forma Balance Sheet End Of Year 1
Current Assets Cash 91,383 Cash Reserve 25,000 Letter of Credit 110,000 Renovation Fund @ 5% 12,600 Total Current Assets 238,983 Long Term Assets Real Estate 6,359,000 Less depreciation <84,463> Long term notes (leases) NA Equipment NA Total Fixed Assets 6,274,537 Current Liabilities Accounts payable 0 Salaries Payable 0 Taxes Payable 10,091 Total Current Liabilities 10,091 Long Term Debt Mortgages 5,490,879 Total Long Term Debts 5,490,879 Net Worth 1,022,641 PROJECT FINANCED BY FREDIE MAC @ 10.25% FIXED RATE -
30 Brevard Contractor’s School
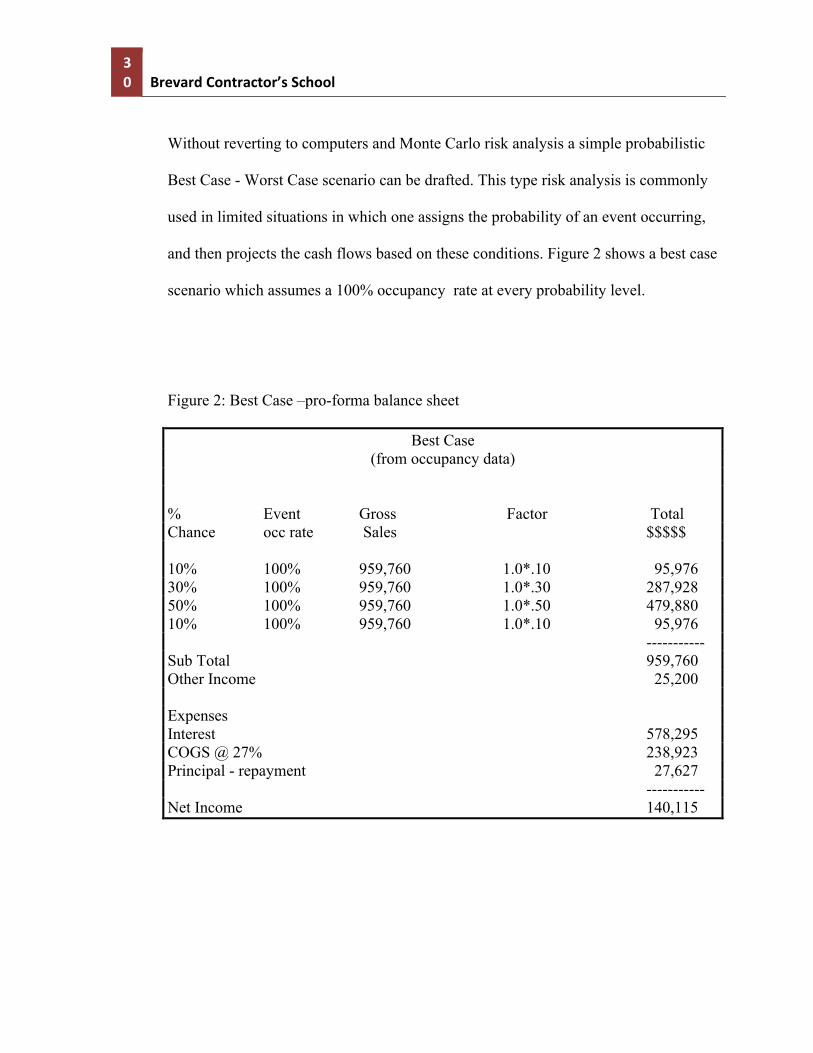
Without reverting to computers and Monte Carlo risk analysis a simple probabilistic
Best Case - Worst Case scenario can be drafted. This type risk analysis is commonly
used in limited situations in which one assigns the probability of an event occurring,
and then projects the cash flows based on these conditions. Figure 2 shows a best case
scenario which assumes a 100% occupancy rate at every probability level.
Figure 2: Best Case –pro-forma balance sheet
Best Case (from occupancy data)
% Event Gross Factor Total Chance occ rate Sales $$$$$ 10% 100% 959,760 1.0*.10 95,976 30% 100% 959,760 1.0*.30 287,928 50% 100% 959,760 1.0*.50 479,880 10% 100% 959,760 1.0*.10 95,976 ----------- Sub Total 959,760 Other Income 25,200 Expenses Interest 578,295 COGS @ 27% 238,923 Principal - repayment 27,627 ----------- Net Income 140,115

FINANCE JOHN BEASLEY CONSTRUCTION
31
The following two figures are Average Case and Worse Case. Average Case varies
the occupancy rate to arrive at an average “probable” occupancy rate. Figure 4 is the Worst Case analysis, it varies not only the occupancy rate across the probability spectrum, but also suggests that the project will not meet their pricing goals (rental rate).
Figure 3: Average Case pro-forma balance sheet
Average Case
% Event Gross Factor Total Chance occ rate Sales $$$$$ 10% 85% 959,760 .85*.10 81,580 30% 89% 959,760 .89*.30 256,256 50% 94% 959,760 .94*.50 451,087 10% 100% 959,760 1.0*.10 95,976 ----------- Sub Total 884,899 Other Income 25,200 Expenses Interest 578,295 COGS @ 27% 238,923 Principal - repayment 27,627 ----------- Net Income 65,254

32 Brevard Contractor’s School
Figure 4: Worst Case pro-forma balance sheet
Worst Case
% Event Event units Factor Total Chance occ rate rent $$$$$ 10% 85% 352 144 .85*.10*(144*352) 51,708 30% 89% 397 144 .89*.30*(144*397) 183,168 50% 94% 448 144 .94*.50*(144*448) 363,852 10% 100% 544 144 1.0*.10*(144*544) 94,008 --------- Sub Total 692,736 Other Income 25,200 Expenses Interest 578,295 COGS @ 27% 238,923 Principal - repayment 27,627 --------- Net Income <27,025>

FINANCE JOHN BEASLEY CONSTRUCTION
33
INFORMATION PACKET
FOR
HARBOR FEDERAL S&L
BEASLEY’S INVESTMENTS 320 N. Atlantic Ave. #2B Cocoa Beach, Fl. 32931 305-783-3789 / 305 725-7106 October, 1987
Presented by: Beasley’s Investment Properties Presented to: Harbor Federal S& L Prepared by: John Beasley's Construction

34 Brevard Contractor’s School
INTRODUCTION
This outline is NOT intended to be a loan request, but rather a presentation of pertinent
information to determine a potential basis for negotiating a long term loan secured by real property.
This packet is intended to exchange information with the lending institution.
• General questions of interest concerning services provided by this bank.
• An introduction to Beasley’s Investment Properties and the principal management of the
company.
• A general concept of the terms and covenants on the loan we are endeavoring to secure.
• An outline of the uses of the proceeds of the loan.
• An overview of company pro-forma cash flows for 1987-1988.
• Break Even / fixed expense pro-forma’s with various debt load calculations.
• Overview of Risk Analysis for the company.
• Background information on the Atlantic Center and related efforts to assess risk.
• Historical lenders and management ratio analysis.

FINANCE JOHN BEASLEY CONSTRUCTION
35
Does or will your bank provide the following services?
YES NO
Generally handle real estate companies or REITS? [ ] [ ]
Does a branch of this bank specialize in Real Estate [ ] [ ]
Preparation of Letters of Credit [ ] [ ]
Lines of Credit (LOC) to $_____________ [ ] [ ]
Loans against Receivables of __________% [ ] [ ]
Credit Reference Checks? Fee Charged $__________ [ ] [ ]
Money Market securities sales and purchases? [ ] [ ]
Provide helpful ideas for cash management? [ ] [ ]
Checking or NOW accounts with competitive terms [ ] [ ]
Does this bank desire quarterly statements? [ ] [ ]
Does this bank prefer annual statements? [ ] [ ]
Does this bank desire quarterly briefings? [ ] [ ]
Does this bank prefer annual briefings? [ ] [ ]
Could the bank provide us with a current 10K report? [ ] [ ]

36 Brevard Contractor’s School
Management
Ballard Beasley (Senior)
In 1942 Ballard Beasley became a golf professional by winning the Chattanooga Open. He served in World Ware II with the Marine Corp. In 1946 he studied agronomy at the University of Tennessee , Knoxville under the GI bill. In 1947 he began designing and building golf courses, as well as serving as general manager to the Great Southern Country Club. During 1957-59 he played on the PGA Tour, where he became friends with many of the “legends of golf,” such as Arnold Palmer, Sam Snead, and Tommy Bolt, as well as movie stars and industrialists. In 1959 he was offered a position by Jack Harkins (one of Bob Hopes partners in the Donald Duck soft drink company). Jack Harkins offered Mr. Beasley the rights to market First Flight (Pro-Golf, Arnold Palmer) golf equipment in Florida and Georgia. This proved to be quite lucrative and by 1962 Mr. Beasley had saved sufficient funds to purchase Ridge Manor Golf and County Club, 30 miles south-west of Tampa, Florida. Between 1962 and 1968 Mr. Beasley designed and built another nine holes on the golf course, developed tracks of land, and purchased the community center, medical center, Ridge Manor Apartment Complex, and Ridge Manor Plaza which housed the post office, commercial office space, and an upscale French restaurant. In 1968 Mr. Beasley sold out to a northern concern and once again went out on the PGA tour for two years. In 1970 Mr. Beasley moved to Titusville Florida, semi-retired and began purchasing commercial real estate. He now owns seven commercial properties. During 1974-76 he helped Roy Cox restructure Royal Oak Country Club by serving as the general manager, golf pro, and greens supervisor. He is presently the golf director at La Cita County Club, Titusville. Mary Beasley Mary and Ballard Beasley have been married since 1946 and jointly shared in the management of their many ventures. Mrs. Beasley was a fine golfer in her own right, winning the Mississippi State Championship, prior to an auto accident which caused a back injury. Mrs. Beasley has handled the accounting, and employee relations, as well as acting as purchasing agent and orchestrating political functions.

FINANCE JOHN BEASLEY CONSTRUCTION
37
John Beasley John Beasley graduated from the University of Central Florida in 1978, and began working in renovation and management of commercial real estate. In 1980 he obtained a realtors license and specialized in commercial real estate management. In 1983 he purchased Aries / Jonathan’s Restaurant in Melbourne. John Beasley, together with his wife Lynn, managed 39 employees and had an operating income of $500,000 annually. In 1985 Melbourne became a test market for franchises and the market became saturated with restaurants, growing in number from 72 to 141 in one years time. This effectively evaporated the traditionally low EBIT of 8% profit margin. Faced with long term capital expenditures, and no guarantee of a return, they decided to close the restaurant. In 1985 John Beasley began the Executive MBA program at Rollins College (Crummer School of Business) and has completed the first year of the program. Between 1985-1987 John Beasley has taken computer programming courses and attended seminars on Interactive Financial Planning, business simulation modeling, Monte Carlo risk analysis, and optimal problem solving (linear programming). Presently, John Beasley owns Marketing Research Solutions. Since 1985 John Beasley has been the manager for Beasley’s Investment Properties and has assisted in shaping financial decision making. He is presently pursuing a mortgage brokers license.

38 Brevard Contractor’s School
DESIRED TERMS OF THE LOAN
Loan Amount: $500,000 Term: 15 year fixed rate mortgage. Interest Rate: 9%
Security on Loan: Atlantic Center office building and adjacent lots facing A-1-A, known as lots 2,3,4,5,6 approximately 360 front feet, with approximately 14,000 square feet of improvements. Value approximately $750,000.
Covenants on the Loan
1: The mortgagor shall look to the assigned properties and no other assets for the security on the loan. 2: The mortgagor shall impose no penalty for prepayment of the loan and the loan shall be assumable, upon agreed terms. 3: The loan shall be made to Ballard and or Mary Beasley, dba Beasley’s Investment Properties.

FINANCE JOHN BEASLEY CONSTRUCTION
39
Pro-Forma Expenses
Atlantic Center renovation 99,000
Atlantic Center debt repayment 90,000
North Parking Lot debt repayment 45,000
Total Atlantic Center uses of funds $234,000
Other Uses of Funds
Purchase of land (Hibiscus, Melbourne) 105,000
Renovation to Hibiscus and new parking 55,000
Total uses of funds for Hibiscus $160,000
Total allocated uses of funds $394,000

40 Brevard Contractor’s School
The following projected cash flows are based on a five percent inflation rate, which will result in cost of living increases incorporated into the leases. Additionally, we anticipate leasing four more units between the forth quarter of 1987 and the first quarter of 1988.
Pro-Forma Cash Flows
1987 1988
Atlantic Center $64,000 $86,000
Hibiscus Restaurant 31,200 32,916
Hibiscus parking lot 0 6,000
Pompano Plaza 64,200 79,800
Hopkins Plaza 21,600 21,600
Harrison Plaza 27,800 33,600
7000 Plaza 21,600 24,000
Duplex 2,400 4,800
Total Income: $232,800 $288,716 ======= =======

FINANCE JOHN BEASLEY CONSTRUCTION
41
The following break-even analysis includes actual fixed expenses, as well as expenses we deem necessary to maintain a healthy business operation.
Break-Even / Fixed Expenses 1987 1988
Debt Service $47,340 $83,506
Property Tax 15,000 18,000
99 year land lease (McNab) 8,000 8,000
Maintenance 64,200 79,800
Insurance 12,300 9,225
Management 50,000 50,000
Total Expenses $232,800 $288,716 ======= =======
1. We project a 12% increase in property taxes due to renovations. 2. Our insurance agent informs us that quality renovations should reduce our rates by
25% 3. McNab Plaza is built on land with a 99 year lease. 73 years remain at a fixed annual
cost of $4,360.00 per year plus property taxes.

42 Brevard Contractor’s School
The following are cash flow projections for 1989-1990, which take into account the completion of all renovation projects, higher rental occupancy rates and cost of living increases on existing leases.
Pro-Forma Cash Flows 1989-1990
Atlantic Center $108,000
Hibiscus Restaurant 32,760
Hibiscus parking lot 6,300
Pompano Plaza 83,800
Hopkins Plaza 28,800
Harrison Plaza 33,600
7000 Plaza 32,400
Duplex 12,000
Total Projected Income: $337,660 =======

FINANCE JOHN BEASLEY CONSTRUCTION
43
The pro-forma statements presented previously may be considered as realistic goals, or as optimistic scenarios. It becomes a question of projecting the perceived risk inherent in a real estate venture at a given time. Perhaps, I should state Beasley’s Investment Properties strategic plan for penetrating this market niche. Previously, Ballard Beasley was primarily interested in equity growth, thus the 5% to 9% debt to equity ratio. We presently perceive that our marketing objectives are to provide tenants with high quality office and store front locations at the market mean rental rate. This policy will place us some thirty three to forty seven percent below the price leaders in the market, while still substantially improving our cash flow position and bottom line profitability. Being the price leader in the market will allow us to maintain higher than average occupancy rates as well as good tenant relations. The down side to this approach to doing business is the under evaluation of the property values in favor of increased occupancy rates. This reveals that our management style is risk adverse. This would only present a detriment to our cash flows if we intended to sell the properties. This point can be demonstrated by showing the percentage rental increase necessary to recoup a six month vacancy on a given location. This problem is solved using capital budgeting techniques.
Risk
We all know that no one can control the business market, therefore a great amount of research has gone into defining the boundaries of risk that are present in a business venture. The following section details some of these approaches as applied to the Atlantic Center and Beasley’s Investment Properties.
The Local Economy
The geographical area of Central Florida itself is a good hedge against risk. The population is slated to double every seven or ten years, which will undoubtedly drive property values up. Furthermore, Disney World attracts record numbers of tourists during economic down turns, to wit, 1978-80 Disney set their highest attendance records to that date. Between 1978-80 we saw the worst recession since 1973, yet the local economy of Brevard flourished. A major factor in the economic stability of Brevard County is the space program. To a large degree Americas’ technology is driven by funding for the space program, thus any down turn in the U.S. economy or loss of technological superiority over other natins must be met with additional funding of the space program. We are fortunate to have businesses and NASA programs which tend to shield the Central Florida area from drastic economic down turns, such as are experienced in other states during recessions.

44 Brevard Contractor’s School
Rental Rates
In late 1985 early 1986 we did a study on the rental rates for office and small retail space along A-1-A, stretching from Cape Canaveral to Indian Harbor Beach, and collected data on 36 locations. The results of the pricing structure for office / small retail space at that time was as follows;
Chances of rental rates being Greater than indicated: 1% $12.00 per sq. ft. 5% $10.50 per sq. ft. 37% $ 9.00 per sq. ft. 50% $ 7.50 per sq. ft. 67% $ 6.00 per sq. ft. 95% $ 4.50 per sq. ft. 99% $ 3.00 per sq. ft. Early in 1986 we determined that it would be financially beneficial to renovate the Atlantic Center. Shortly after that management decision was made the Space Shuttle crashed. Unsure of the impact the Shuttle disaster would have on the economy, we decided to test the assumption that we could achieve higher rental rates and maintain high occupancy rates. To this end, we began using available cash flow to renovate selected units in the building and do rudimentary window dressing to the exterior of the building. To effect on renovated units was as follows; Previous Present Unit 5A $350.00 $400.00 Unit 4B $250.00 $400.00 Unit 6B $250.00 $350.00 This resulted in an increased rental rate between 14% and 60% per unit. This convinced us that remodeling was a viable and profitable option, however, because of certain business and tax considerations, it was not advisable to make long term capital improvements out of cash flows. Therefore, before taking on any additional debt, we found it necessary to weigh the costs and benefits, as well as the risks.

FINANCE JOHN BEASLEY CONSTRUCTION
45
A new office complex, The Galleria, has been built in Cocoa Beach during the past year and is leasing for $14.00 per square foot.
Capital Budgeting
Option 1: Do nothing. Second floor cash flows for ten years: $291,900 Ground floor cash flows for ten years: $543,024 Total cash flows: $834,924 Option 2: Renovate. Second floor cash flows for ten years: $543,024 Ground floor cash flows for ten years: $633,852 Total cash flows: $1,176,876 Less: Renovation Costs: $<85,000> Land allocated to parking: $<60,000> $<145,000> Cash Flows after rehab expenses: $1,031,876 Less Option 1 cash flows: $<834,924> Net improvement over Option 1: $196,952 Based on our present pricing policy and our projected pricing policy after renovations, we conservatively see a $196,952 dollar improvement in cash flows over the “do nothing” option, based on a ten year window. This analysis does not take into consideration the net present value of the cash flows, the possibility that the “do nothing” option might result in lowered occupancy and rental rates, nor does it explore the potential for rental rates doubling or tripling over the next ten years.

46 Brevard Contractor’s School
Current occupancy rate is 89%.
Lenders and Management Ratios
1986
DEBT TO EQUITY RATIO 13.82: 1 WORKING CAPITAL RATIO 2.46: 1 ACID TEST I 4.49: 1 ACID TEST II 6.33: 1 (Cash plus 1 month’s receivables) NET WORTH / TOTAL ASSETS 92% F&CL FIXED ASSETS / NET SALES 21.66%

FINANCE JOHN BEASLEY CONSTRUCTION
47
Descriptive Statistics Methodology
Summary statistical analysis was run on two data sets, rental rates and
occupancy rates. This included calculating χ, i.e. the mean of a sample, standard
deviation, kurtosis, skewness, and coefficient of variation.
• χ is the mean of a sample, rather than the mean of a total population. The mean is
the arithmetic average of two or more observations divided by that number of
observations.
• Standard Deviation : “the standard deviation is the square root of the variance.
The variance is a measure of how widely dispersed the values are in a distribution,
and thus is an indication of the “risk” of the distribution. It is calculated as the
average of the squared deviations about the mean. The variance gives
disproportionate weight to “outliners”, values that are far away from the mean. The
variance is the square of the standard deviation” (@Risk, G-5). The standard
deviation is also called the second moment of the mean.
• Skewness is “a measure of the shape of a distribution. Skewness indicates the
degree of asymmetry in a distribution. Skewed distributions have more values to one
side of the peak or most likely value - one tail is much longer than the other. The
higher the Skewness value, the more skewed the distribution” (@Risk, G-4).
Skewness is also called the third moment of the mean.

48 Brevard Contractor’s School
• Kurtosis is “a measure of the shape of a distribution. Kurtosis indicates how flat
or peaked the distribution is. The higher the kurtosis value, the more peaked the
distribution” (@Risk, G-2). Kurtosis is also referred to as the forth moment of the
mean.
• Coefficient of Variation (CV) “The ratio of the standard deviation to the
mean” (Marshall, vii).
Sensitivity Analysis Methodology
Sensitivity Analysis is a systematic “what if” analysis using probabilities
rather than simple numeric or percentage swings for each variable. This method takes
uncertainty into consideration, both the uncertainty in the project as well as the
uncertainty of the business analyst.
Sensitivity is a three step process;
• Review each variable, or value, to determine three numbers: the lowest you think
it would go (a 10 percent or less change the value would ever be any lower), the
highest you think it could go (a 10 percent or less change it would eve be any higher),
and the value you think is most likely. Optimally, one would obtain the 10th, 50th,
and 90th percentile points in a probability distribution and use these as parameters for
the sensitivity analysis.
• Substitute the three numbers derived in step 1 for each variable in the spreadsheet
and note how these changes modify the final result.
• List in order of magnitude the “swings” in the final result caused by these
changes.
FINANCE JOHN BEASLEY CONSTRUCTION
49
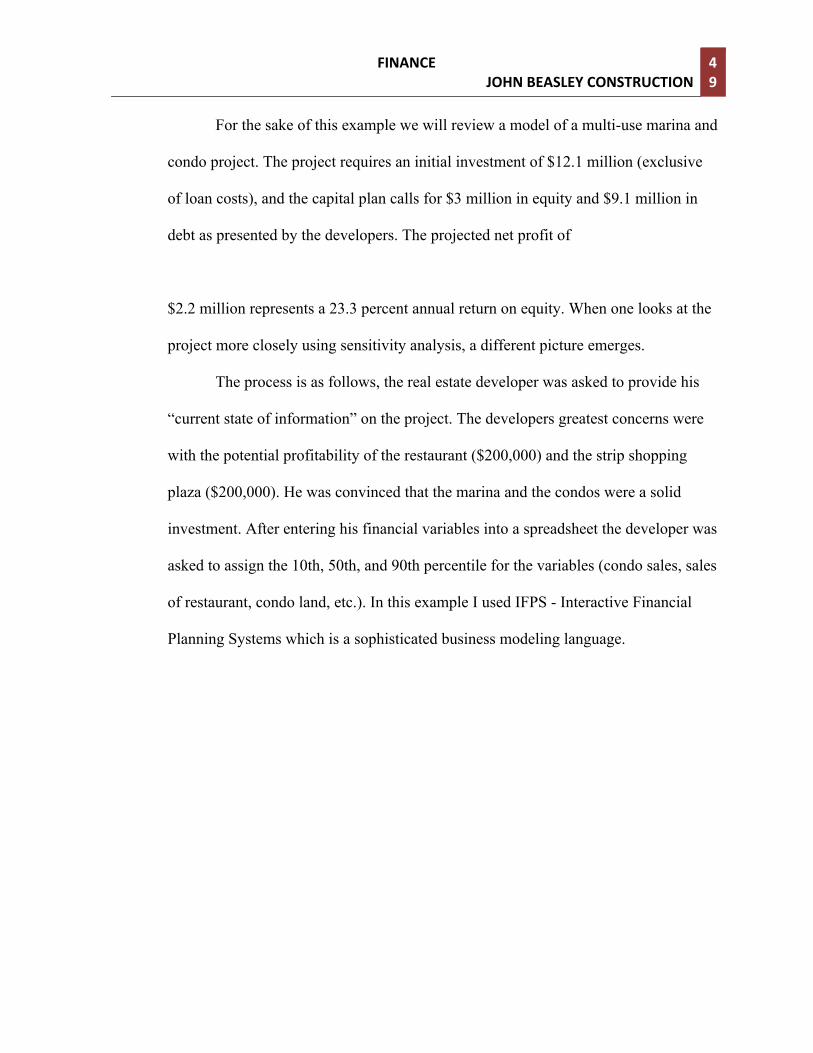
For the sake of this example we will review a model of a multi-use marina and
condo project. The project requires an initial investment of $12.1 million (exclusive
of loan costs), and the capital plan calls for $3 million in equity and $9.1 million in
debt as presented by the developers. The projected net profit of
$2.2 million represents a 23.3 percent annual return on equity. When one looks at the
project more closely using sensitivity analysis, a different picture emerges.
The process is as follows, the real estate developer was asked to provide his
“current state of information” on the project. The developers greatest concerns were
with the potential profitability of the restaurant ($200,000) and the strip shopping
plaza ($200,000). He was convinced that the marina and the condos were a solid
investment. After entering his financial variables into a spreadsheet the developer was
asked to assign the 10th, 50th, and 90th percentile for the variables (condo sales, sales
of restaurant, condo land, etc.). In this example I used IFPS - Interactive Financial
Planning Systems which is a sophisticated business modeling language.

50 Brevard Contractor’s School
Figure 5: Spreadsheet for Sensitivity Analysis
IFPS Model spreadsheet
columns 1 \ \Condo Community With Marina \ \Database Database Site 428,375 Marina 1,721,940 Plant 310,000 Fees 175,000 Contingency 125,000 Restaurant 200,000 Retail 200,000 Condoland 1,600,000 Condoconst 5,264,000 Center 87,500 Marinaconst 2,000,000 Loan Costs 10% 1,011,181 \ Total Expenses = SUM(Site..Loan Costs) 13,122,181 \ \income Database Condosales 14,476,000 Restsale 250,000 Slips_rent 506,400 Fuel 120,000 \ Total Income =Sum(Condosales.fuel) 15,352,400 \ NCF=Total Income - Total Expenses 2,229,403 NPV= NPV (NCF, 8%,3,3000000)

FINANCE JOHN BEASLEY CONSTRUCTION
51
What the program Sensitivity does is analyze the model at the 10th, 50th and
90th percentile and creates a plot or “tornado diagram” and a list of the results. The
“tornado diagram” begins with the variable that causes the greatest
relative change in the NPV of the cash flows and lists in descending order variables
with less effect on variation in net cash flows.
Figure 6: Tornado Diagram of Sensitivity Analysis --------------------------------------------------------------------------------------------------- Plot List Plot Sensitivity Results --------------------------------------------------------------------------------------------------- VARIABLE --------------------------------------------------------------------------------------------------- CONDOSALES ++++++++++++++++++++++++|++++++++++++++++++ MARINA +++++++++++++++++++++++++|++++++ CONDOCONST +++++++++++|+++++++++++++++++ MARCONST ++++++|++ SLIPRENT ++|++ SITE +|+ PLANT +|+ REST_SALE |+ FEES +|+ FUEL +| RESTAURANT | CONTINGENT | RETAIL | CONDOLAND | CENTER | LOANCOST | --------------------------------------------------------------------------------------------------- -985136 -379348 226440 832228 1438016 2043804

52 Brevard Contractor’s School
Figure 7: Plot of Sensitivity results
PLOT LISTPlot Sensitivity reuslts
VARIABLE SEN LOW HIGH LOW HIGH SWINGTYPE VALUE VALUE RESULT RESULT
CONDOSALES V 11844000 14467000 -579196 2043804 2623000MARINA A -344388 1721940 1081192 -985136 2066328CONDOCONST V 4211200 5922000 1789604 78804 1710800MARCONST A -100000 500000 836804 236804 600000SLIPSRENT V 253200 506400 610204 863404 253200SITE A -85675 85675 822479 651129 171350PLANT A -62000 62000 798804 674804 124000RESTSALE V 200000 275000 686804 761804 75000FEES A -35000 35000 771804 701804 70000FUEL V 50000 120000 716804 786804 70000RESTAURANT A -10000 30000 746804 706804 40000CONTINGENCY A -12500 12500 749304 724304 25000RETAIL A -10000 10000 746804 726804 20000CONDOLAND A -5000 5000 741804 731804 10000CENTER A 5000 5000 731804 731804 5000LOANCOST V 1000000 1110000 736804 736804 0
In the 2 hours and forty five minutes it took to interview the real estate
developer, lay out the Sensitivity model, and review the results Sensitivity revealed
that the greatest uncertainty surrounds the top four data points - condo sales, sale of
the marina, marina construction costs, and condo construction costs. These four items
resulted in a swing of $7 million dollars. Statisticians tell us that a sum of the squares
analysis would revel that these four points account for 99 percent of the uncertainty in
the marina model. According to business conventions, 80 to 90 percent of the
uncertainty in a business venture is represented by 10 to 20 percent of the variables,
which is often refereed to as the “80-20 rule”. The most remarkable feature of
sensitivity analysis is that it quickly reveals in a quantitative format, the primary
elements in a business venture which management must control. This was an actual

FINANCE JOHN BEASLEY CONSTRUCTION
53
business venture, and you may recall that the items that were most troubling to the
real estate developer were the $200,000 restaurant and the $200,000 mini-plaza which
ranked 11th and 13th respectively in magnitude as potential threats to the viability of
this project .
Monte Carlo Risk Analysis The next step in the business modeling process is to account for the
uncertainty in a deterministic spreadsheet model. This is commonly done by building
a stochastic model using Stanford method decision analysis (DA), Harvard method
DA being substantially similar, yet significantly more theoretical in its application,
and therefore deemed to be less effective as a practical business tool. A second
approach, and the one more commonly used in identifying the economic effects of
uncertainty is Monte Carlo Risk Analysis.
“Monte Carlo sampling refers to the traditional technique for using random or
pseudo-random numbers to sample from a probability distribution. The term “Monte
Carlo” was introduced during World War II as a code name for simulation of
problems associated with development of the atomic bomb. Today, Monte Carlo
techniques are applied to a wide variety of complex problems involving random
behavior. A wide variety of algorithms are available for generating random Monte
Carlo samples from different types of input probability distributions” (@Risk Owners
Manual, P: F-6).
In building a Monte Carlo model, the first objective is to design a
deterministic spreadsheet that accurately models or “mirrors” the situation under

54 Brevard Contractor’s School
analysis. Each element that directly impacts the income stream should be taken into
account in the model. Figure 8 provides a sample of a deterministic model.

FINANCE JOHN BEASLEY CONSTRUCTION
55
Figure 8: deterministic spreadsheet model
Excel model: Build (without Risk) Cash Flow Analysis Database
(per sq. ft.) (range names)Land costs: 10$ landBuilding costs: 32$ bcost
Totals: 42$ sqtotal
Total Sq Ft Land: 200,000$ Total Sq Ft bldg: 13,000$ sqland
sqbldg
Avg. rental rate: 10$ rateAvg. occ rate: 1$ occDeposits forward: 7,822$ depMisc Income: -$ misinLoan to value ratio: 75% ltvInterest Rate: 10% intrateAmort.in months: 360 period
Percents - calcualted expenses as a ratio of gross income.
Property tax: 4% ptaxInsurance: 1% insMaintenance: 5% maintManagement: 5% manMisc. exp 1% misexp
Build: Model
Income Statement - P& L
Gross Rental Revenue @ Avg. occupancy 93,860$ Misc income -$ Deposits (caried forward) 7,822$
Total Income: 101,682$
Liabilities
Loan expense 46,200$ Property tax 18,480$ Insurance 4,620$ Management 4,693$ Maintenance 4,693$ Misc. exp 469$
Total: 79,155$
Net Cash Flow: 22,527$

56 Brevard Contractor’s School
• Using this deterministic model as the basis for our analysis, we then introduce
probabilities into the equation by trying to determine the amount and characterize the
nature of the variation that could effect each variable. The potential variability can be
characterized by the use of specific data distributions. Distributions may assume any
shape, and include the classic bell shaped curve of the normal distribution, as well as
uniform, triangular, Poisson and 27 other distributions less common to business.
These are some of the most common distributions for business modeling;
• Uniform (minimum,maximum) - Used for a quantity that varies uniformly
between two values, or when only a range is known.
• Triangular (minimum,most likely, maximum) a rough modeling tool for use when
actual data is absent.
• Normal(µ,σ) A Normal distribution has the characteristics of a population (height,
weight); size of quantities that are the sum of other quantities (because of the central
limit theorem).
• Poisson(λ) Number of individual events that occur in a given unit of time, such
as number of customers arriving in a queue, number of accidents on a road, number
of imperfections per yard of carpet .

FINANCE JOHN BEASLEY CONSTRUCTION
57
Figure 9: stochastic spreadsheet model Excel model: Build Cash Flow Analysis Database
(per sq. ft.) (range names)Land costs: =RiskUniform(8,11) landBuilding costs: =RiskTriang(28,34,40) bcost
Totals: 42$ sqtotal
Total Sq Ft Land: 26000Total Sq Ft bldg: 13000 sqland
sqbldgTotal land cost 104,000$ Total bldg cost 884,000$
Total project cost 988,000$
Avg. rental rate: =RiskNormal(8.5,1.5) rateAvg. occ rate: =RiskNormal(0.75,0.11) occDeposits forward: 7,822$ depMisc Income: -$ misinLoan to value ratio: 75% ltvInterest Rate: =RiskUniform(0.05,0.1) intrateAmort.in months: 360 periodMortgage Amt: ($74,100.00)
Depreciation $27,255.17
Percents - calcualted expenses as a ratio of gross income.
Property tax: 4% ptaxInsurance: 1% insMaintenance: 5% maintManagement: 5% manMisc. exp 1% misexp
Build: Model
Income Statement - P& L
Gross Rental Revenue @ Avg. occupancy 82,875$ Misc income -$ Deposits (caried forward) 7,822$
Total Income: 90,697$
IB IT 76,222$
Liabilities
Loan expense $74,100.00Property tax 18,480$ Insurance 4,620$ Management 4,693$ Maintenance 4,693$ Misc. exp 469$
Total: 107,055$
Net Cash Flow: ($16,358)
58 Brevard Contractor’s School
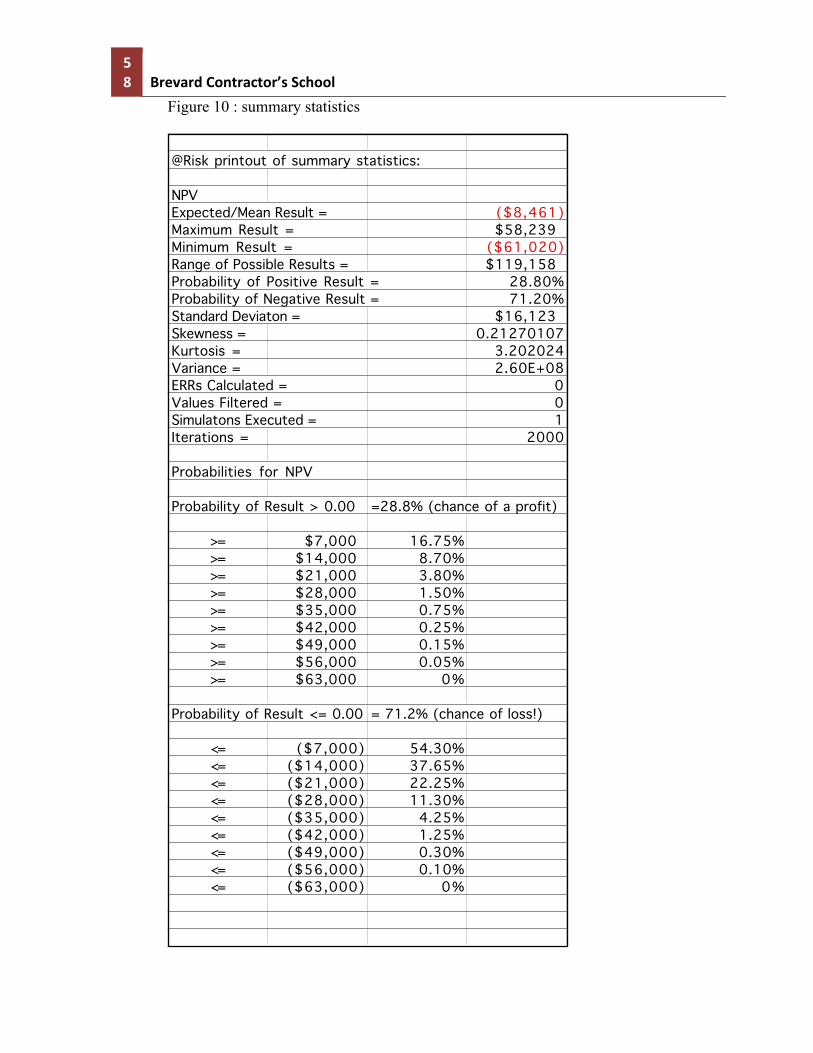
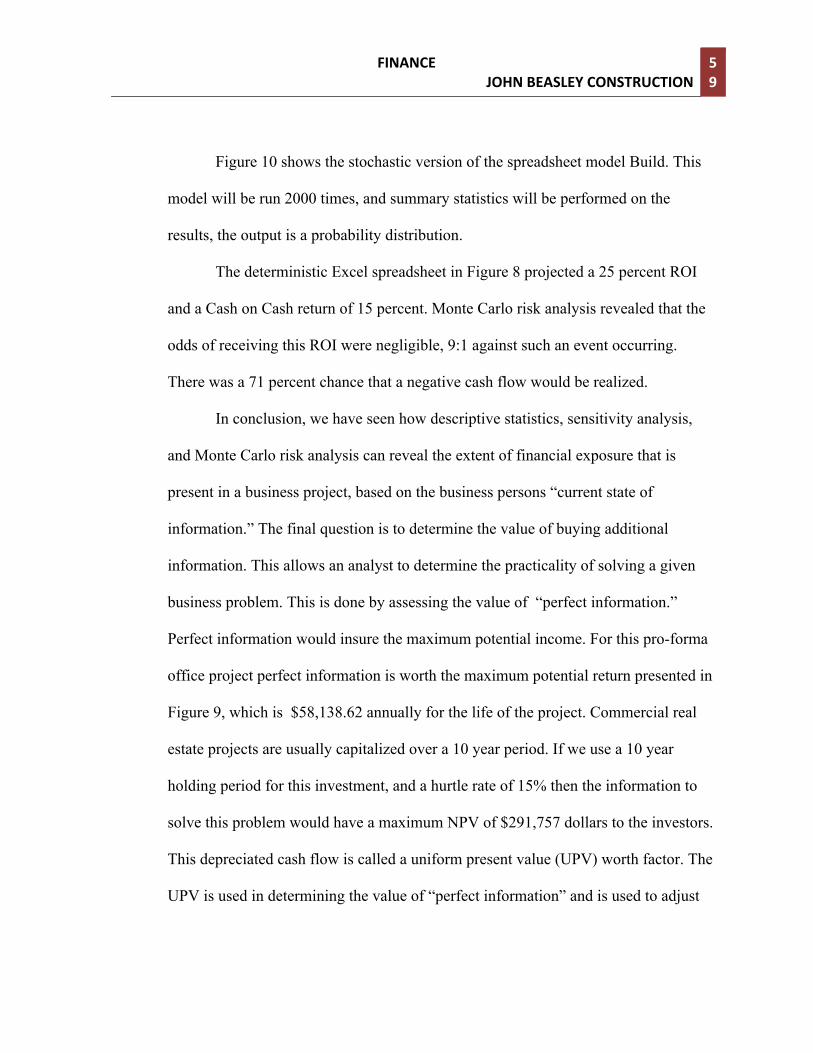
Figure 10 : summary statistics
@Risk printout of summary statistics:
NPV Expected/Mean Result = ($8,461)Maximum Result = $58,239Minimum Result = ($61,020)Range of Possible Results = $119,158Probability of Positive Result = 28.80%Probability of Negative Result = 71.20%Standard Deviaton = $16,123Skewness = 0.21270107Kurtosis = 3.202024Variance = 2.60E+08ERRs Calculated = 0Values Filtered = 0Simulatons Executed = 1Iterations = 2000
Probabilities for NPV
Probability of Result > 0.00 =28.8% (chance of a profit)
>= $7,000 16.75%>= $14,000 8.70%>= $21,000 3.80%>= $28,000 1.50%>= $35,000 0.75%>= $42,000 0.25%>= $49,000 0.15%>= $56,000 0.05%>= $63,000 0%
Probability of Result <= 0.00 = 71.2% (chance of loss!)
<= ($7,000) 54.30%<= ($14,000) 37.65%<= ($21,000) 22.25%<= ($28,000) 11.30%<= ($35,000) 4.25%<= ($42,000) 1.25%<= ($49,000) 0.30%<= ($56,000) 0.10%<= ($63,000) 0%
FINANCE JOHN BEASLEY CONSTRUCTION
59
Figure 10 shows the stochastic version of the spreadsheet model Build. This
model will be run 2000 times, and summary statistics will be performed on the
results, the output is a probability distribution.
The deterministic Excel spreadsheet in Figure 8 projected a 25 percent ROI
and a Cash on Cash return of 15 percent. Monte Carlo risk analysis revealed that the
odds of receiving this ROI were negligible, 9:1 against such an event occurring.
There was a 71 percent chance that a negative cash flow would be realized.
In conclusion, we have seen how descriptive statistics, sensitivity analysis,
and Monte Carlo risk analysis can reveal the extent of financial exposure that is
present in a business project, based on the business persons “current state of
information.” The final question is to determine the value of buying additional
information. This allows an analyst to determine the practicality of solving a given
business problem. This is done by assessing the value of “perfect information.”
Perfect information would insure the maximum potential income. For this pro-forma
office project perfect information is worth the maximum potential return presented in
Figure 9, which is $58,138.62 annually for the life of the project. Commercial real
estate projects are usually capitalized over a 10 year period. If we use a 10 year
holding period for this investment, and a hurtle rate of 15% then the information to
solve this problem would have a maximum NPV of $291,757 dollars to the investors.
This depreciated cash flow is called a uniform present value (UPV) worth factor. The
UPV is used in determining the value of “perfect information” and is used to adjust

60 Brevard Contractor’s School
the cash flows from various competing projects so their value can be compared on an
equal basis.

FINANCE JOHN BEASLEY CONSTRUCTION
61
MBA Marketing Analysis Pad
Critical Issue: Identify / Define the Problem: Objectives: (Profitability – Sales Growth – Market Share – Risk Diversification – Innovation) Company Mission: (Source & Focus for 10 to 20 years) Strategic Plan: (Build – Maintain – Harvest – Divest) Goals: Portfolio Plans: (Vertical – Horizontal – Conglomerate – other) Business Seen As? (? – Star – Cash Cow – Dog) Marketing Strategy: (Develop – Change – New Product) Product: Price: Place: Promotion: Customer: Cost: Financial health: (Survival Mode?) Life Cycle: (Birth – Growth – Maturity – Decline) Success Criteria for This Business? Success Criteria for This Industry? Who are Big Winners or Losers? Why?(Clarify: Fact – Opinion – Industry Data – Generalization)

62 Brevard Contractor’s School
GROWTH SHARE MATRIX
22% 20% 18% 16% 14% 12% 10% 8% 6% 4% 2% 0 10X 1X 0 .1X
STAR ? CASH COW DOGS
FINANCE JOHN BEASLEY CONSTRUCTION
63
COMPETITIVE EVALUATION MATRIX
SBU’S PRODUCT COMPATISION
MARKET SHARE %
DISTRIBUTION METHODS
ADVERTIZING
CUSTOMER
COST
PRICE

64 Brevard Contractor’s School
• What is the revenue – cost structure of the organization – product? Relevant costs and benefits analysis: (linear programming) (critical concept in decision making includes differential benefits) must have two choices:
• Identification of Cost – Benefits that change or differ for any number of competing alternative decisions.
• Costs and Benefits that stay the same across any number of alternatives are irrelevant; thus excluded, from analysis.
• Relevant Costs can be fixed or variable, if for some reason these costs will differ – very for future alternative decisions.
• Net Incremental Benefits = Total IB – IC Liquidity Test: Assets _______________ Liabilities __________________ Current Liabilities ÷ Current Assets = ____________% Acceptable = EQ 2:1 Liquidity Crisis = LE 1:1; Not Utilizing Resources = GE 5:1 Liquidity Ratio or Acid Test: Cash = _____________, Short Term Liabilities = ___________ (Cash + Accounts Receivable ÷ Current Liabilities) = ____________% Acceptable is GE 1:1;Cash Crisis LT 1:1. Working Capital: Current Assets ___________– Current Liabilities _____________= WC Is Value GE inflation? WC __________% I _________% Does growth of WC cover growth of Operation? (Yes / No) WC___________%G_________% Turnover Ratios: (how fast bills are paid and inventory turns over) Accounts Payable ÷ Cost of Goods Sold X 360 = _________ days cash on hand. Accounts Receivable ÷ Net Sales X 360 ____________ customer days to pay. Refer to Industry – Business Norms in D&B Reports – Ratios Cash Ratios: How many days of cash a company has left Cash ___________÷ Net Sales ____________ X 360 = ____________ days till $0.00 cash. Debt To Equity Ratio: GE 5:1 or 20% debt. ___________ Long Term Liabilities ÷ ______________Owners Equity = D/E Ratio _________% Assets To Sales Ratio: (how many assets in dollars needed to generate an extra dollar of sales) Total Assets ÷ Net Sales = $____________ dollars of assets required to produce $1.00 of sales. (Note: high fixed costs, more than 1:1, high variable costs less than 1:1). Dynamic Picture, change of ratio over time. Total Fixed Assets _______________ ÷ Total Assets _____________ = _______________ Net Worth _______________÷ Debt _______________ = ______________ Net Worth ÷ _______________Total Assets = _______________ Total Assets ÷ _______________ Net Sales = _______________ Fixed Assets _______________÷ _______________Net Sales = _______________% Operating Profit ______________÷ _______________Net Worth = _______________%

FINANCE JOHN BEASLEY CONSTRUCTION
65
Net Profit _______________÷ _______________Net Worth = ______________% Return on Investment (ROI) = After Tax Income _______________ ÷ ______________Owners Equity = ____________% Return Payback: (number years required to recoup your investment) Net Investment _______________÷ Net Annual Return = _________Years to Recoup Investment. Net Present Value (NPV) Initial Investment + Cash Flow 1 ÷ (1 + desired yield) Cash Flow 2 ÷ (1+ desired Yield) Cash Flow 2 (calculate NPV with HP 12 C) Not acceptable unless NPV = 0 or positive. Internal Rate of Return (IRR) (use to compare several investment alternatives) (calculate on HP 12C) Investment 1: (e.g. Money Market – Risk Free) $______________ Yield: $_______________ Investment 2: (e.g. Tax Free Bonds) $________________ Yield: $ _______________ Investment 3: (e.g. Principal Consideration) $_______________ Yield $_______________ Risk Factor _______________ Investment 4: (Other _______________) $________________ Yield $_______________ Risk Factor _______________ Investment 5: (Other _______________) $________________ Yield $ _______________ Risk Factor _______________ Drafting Profit & Loss Pro-Forma Analysis:
• Determine past expense loads (% of sales) alternative D&B. • Project expenses at past levels or relative to expected sales. • Determine total expenses, tax rates, after tax profits.
Drafting Balance Sheet Pro-Forma Analysis:
• Estimate sales forecast. • Apply past ratio levels to forecast future needs.
Drafting Cash Flow Pro-Forma Analysis:
• Time period of cash flows WK-MO-YR. • Calculate cash inflows plus cash balance. • Calculate cash outflows. • Determine net cash flows. • Project into future periods if necessary.
Cost – Revenue Analysis:
• Relevant costs equal incremental – differential costs. • Contribution analysis.

66 Brevard Contractor’s School
• Breakeven analysis. Contribution Analysis:
• Total Sales – variable costs equal contribution to fixed costs and profit. Unit Contribution:
• Total contribution divided by total unit output. Breakeven Analysis:
(How many units you must produce – market so total revenue equals costs). BEV = Fixed Cost ÷ Contribution Per Unit BEV = Fixed Cost ÷ (Sales Price – Variable Cost) Variable Costs as a % of Sales: Total Sales = $_______________ - (variable costs) $ _______________% Fixed Cost (%) equals cost per product sold: $_______________% Breakeven Volume: • Compare to Forecasted Sales _______________% $_______________ • Total Market Size _______________% $_______________ • Realistic Share of Market _______________% $_______________ • Available Capacity _______________ Needed _______________ • Breakeven $ _______________ Projected $ _______________ (if forecasted sales are LE 50%?) Breakeven Sales Price (BESP) BESP = Fixed Costs ÷ Units of Capacity (Volume) + Unit Variable Costs. Operating Leverage: (Double Edged) This Case (Positive – Negative) (Ideal usage is for leveraging or increasing resources). Positive: Total profits increase at a faster rate than sales volume once breakeven is reached. (e.g. high fixed cost equal higher leverage and losses increase faster than for a business with low fixed – high variable). Goals: High Fixed: Concentrate on Marketing – sales – high volume. High Variable: Same plus internal review & control. Capacity Analysis: (For manufacturing companies) (Batch – Unit – Continuous Production) Diagram the problem (PERT – CPM – Process Flow – Decision Analysis Tree)

FINANCE JOHN BEASLEY CONSTRUCTION
67
Industry & Market Analysis: (Must relate to a particular company and its problems and opportunities, can be used to analyzed – draft a Mission Statement)
• Reference Point: • Direct Competition: • Potential Competitors: • What is the “relevant” definition of the industry for this company? • Adjust for Time: • Companies in the Market: • What characteristics do they have relative to this company? (Consider: Number – Relative Size – Traditions – Cost Structures – Market Growth) • How many suppliers service this industry – business? 1: 2: 3: 4: 5: 6: • List their characteristics: 1: 2: 3: 4: 5: 6: • Posture toward this company: 1: 2: 3: 4: 5: 6:
68 Brevard Contractor’s School
• How many buyers? (public – wholesalers – suppliers – end users – government – military)
• (List their characteristics: 1: 2: 3: 4: 5: 6: • Their attitude toward this company and why? (Marketing survey) • Who are the end users? • Distributors – any bargaining power available? • Customer Needs – Wants 1: 2: 3: 4: 5: 6: • Customer future needs and wants? 1: 2: 3: 4: 5: 6: Value Added Analysis: (Sales – Raw materials costs) ÷ number of product sold. (Profitability is limited within some range by the amount of value it can add to a product or service). • Forward or backward integration recommended: • (low value added easy entry into business by suppliers – buyers). • Market size growth: _______________% (Annually – Monthly – Other). • Present Size: _______________ EOY 1: EOY 2: EOY 3: EOY 4: EOY 5:

FINANCE JOHN BEASLEY CONSTRUCTION
69
Issuing New Stock: (Effects of) Existing shares of stock _______________ plus new stock issued _______________ Equals _______________ shares: Value of stock (Total) $_______________ divided by total new shares equals _______________ Diluted Value. • Prudent to make this move at this time: • Alternatives: (Borrow Money – Liquidate Assets – Inventory – Other)
Recommendations:
Build – Hold – Harvest – Divest: Business could be? ( ? – Star – Cash Cow – Dog). Options and Alternatives (Objectives and Constraints) 1: 2: 3: 4: 5: 6: Recommended Course or Action:
Actions and Results Expected: