finance contents - dover district...• the most recent revaluation of nondomestic properties in...
TRANSCRIPT

Leadership Support Team, Dover District Council, State of the District 2017 | FINANCE 1
FINANCE CONTENTS
FINANCE ............................................................................................................................................. 1 LOCAL GOVERNMENT FINANCE ...................................................................................................... 2 1. REVENUE SUPPORT GRANT ...................................................................................................... 2 2. BUSINESS RATES ........................................................................................................................ 2
a) Rateable Properties ................................................................................................................ 3 b) Rateable Value ....................................................................................................................... 4 c) Business Floorspace............................................................................................................... 5 d) Empty Hereditaments ............................................................................................................. 5 e) Collection rates ....................................................................................................................... 6 f) Support for Businesses .......................................................................................................... 6
3. COUNCIL TAX IN THE DOVER DISTRICT ................................................................................... 8 a) Average Council Tax Bill 2016/17 ........................................................................................... 8 b) Comparison of Council Tax charges across Kent 2016/17 ...................................................... 8 c) Council Tax for a dwelling occupied by 2 adults by band 2016/17 .......................................... 8 d) Number of chargeable dwellings ............................................................................................. 9 e) Where your Council Tax goes ............................................................................................... 10 f) Town and Parish Councils Precept ....................................................................................... 10
4. NEW HOMES BONUS ................................................................................................................. 12 5. DEVELOPMENT CONTRIBUTIONS ........................................................................................... 12 6. INWARD INVESTMENT .............................................................................................................. 13
a) Promoting the district ............................................................................................................ 14 b) Kearsney Parks for People ................................................................................................... 14
7. LOTTERY FUNDING RECEIVED IN THE DOVER DISTRICT ..................................................... 14
Leadership Support Team, Dover District Council, State of the District 2017 | FINANCE 2
LOCAL GOVERNMENT FINANCE
Overall, local government spending is paid for by three main sources: • Central Government • Business rates • Council tax Councils are facing a tough and complex set of pressures – cuts in funding, rising demand for services and economic growth challenge.
1. REVENUE SUPPORT GRANT
• Revenue Support Grant (RSG) is a central government grant given to local authorities which
can be used to finance revenue expenditure on any service. The amount of RSG to be provided to councils is established through the local government finance settlement.
• RSG received by Dover District Council has been reduced by 30.5% in 2016/17, and is forecast to be (virtually) nil by 2019/20. The reduction in RSG accounts for the bulk of the on-going budget pressures for the council.
2. BUSINESS RATES
• Business rates - the commonly used term for non-domestic rates - are a property tax paid by
occupants of non-domestic premises, including most commercial properties such as shops, offices, pubs, warehouses and factories.
• Apart from properties that are exempt from business rates, such as agricultural land, parks and places of worship, each non-domestic property has a rateable value, which is set by the Valuation Office Agency (VOA), an executive agency of HM Revenue and Customs.
• The basic rates bill of a business property (or ‘hereditament’) is calculated by multiplying its rateable value by the ‘multiplier’. The multiplier is expressed in pence per pound of rateable value and is set by the Government.
• Rateable values are normally assessed on the basis of the annual rental value of a property. They are normally reassessed every five years to ensure changes in property market rent values are taken into account.
• The most recent revaluation of non-domestic properties in England, Scotland and Wales took effect on 1 April 2017, and reflects the rental market as at 1 April 2015 (this revaluation was postponed for two years). It is coming into force alongside a number of other changes in rating practice. The combined effect of which may cause some ratepayers’ bills to change significantly: o The thresholds for small business rate relief are being extended in England. The 2017
changes increase the thresholds for small business rate relief. o The Government is introducing, for England only, a new system for appealing against
rateable values, called ‘Check, Challenge, Appeal’. This system went live on 1 April 2017. o In future, valuation officers will be obliged to give separate valuations to properties that
are physically separate. • The revaluation could have an impact on income level for the council. This is because the
government introduced a Business Rates Retention Scheme (BRRS) from April 2013. Under the BRRS, each English local authority’s core funding is directly linked to its business rate revenue.
• Changes in properties’ values will feed through into changed business rate bills, and, therefore, to the total amount of revenue received by each local authority. Some councils will receive more rate revenue than previously and some will receive less, as a result of the revaluation. Early indications suggest the Dover district will see an increase in rateable value – however, this is mainly due to a significant increase for the Channel Tunnel. Previously, Channel Tunnel have won appeals against their 2005 and 2010 valuations, and they have also re-appealed recently, but the appeal has not yet been heard or settled.

Leadership Support Team, Dover District Council, State of the District 2017 | FINANCE 3
• In the Dover district, recent growth from business development has been eroded by appeals from businesses against the rateable value set by the VOA. Following the revaluation, we are anticipating an increase in the number of appeals from businesses - this adds further downward pressure on the council’s budget. It will expected the VOA will take some time to resolve the business appeals received following the revaluation process, and this adds uncertainty to the levels of business rate income achievable.
• Various reliefs are available from full business rates liability, both mandatory and at the discretion of billing authorities. These include small business rate relief, mandatory relief for charities and Enterprise Zones.
• The government has given local authorities a set amount of money to help local businesses experiencing large increases in their business rates bills following the 2017 revaluation. This money will be phased over the five year revaluation period from 2017-18 to 2021-22, with the amount of money reducing each year. We have put together a scheme to help those in our area with their business rates bills, taking into account the money we have been given. Those ratepayers that receive help under this scheme could have the increase in their business rates bills reduced by up to 70%1.
• Business rates income in the Dover district is heavily concentrated at its largest sites, with 37% of its business rates income from the top 5 sites: Channel Tunnel, Discovery Park, Dover Harbour Board, Tesco’s, Whitfield and Thanet Offshore Wind Farm-Cable Link2.
a) Rateable Properties
• In 2015/16, the VOA estimated there
were 3,910 business properties on the non-domestic rates register in the Dover district. This is up 460 properties (+13.3%) over the past five years.
• These properties can be subdivided into: o Retail sector 900 (23.0%) o Office sector 750 (19.2%) o Industrial sector 820 (21.0%) o Other sector 520 (13.3%) o Excluded sector 920 (23.5%)
• The largest grouping in the Dover district is now the “Excluded Sector”, which has increased by 140 (+17.9%) over the past five years.
• Certain properties are exempt from business rates. They may not be payable on agricultural land and buildings, including fish farms; buildings used for training or welfare of disabled people; buildings registered for public religious worship or church halls. There are strict legal requirements for these exemptions – please see the VOA website for further information.
• Over the past five years, the number of businesses in the ‘retail sector’ has remained the same in the district. The number of businesses in the ‘office sector’ has increased by 220 (+41.5%), the number of businesses in the ‘industrial sector’ has increased by 80 (+10.8%) and number of businesses in the ‘other sector’ has increased by 20 (+4%).
1 Source: dover.gov.uk/Business/Business-Rates/Relief/Local-discretionary-discount.aspx 2 Source: Medium Term Financial Plan 2016/17
0
500
1,000
1,500
2,000
2,500
3,000
3,500
4,000
4,500
2000
-01
2001
-02
2002
-03
2003
-04
2004
-05
2005
-06
2006
-07
2007
-08
2008
-09
2009
-10
2010
-11
2011
-12
2012
-13
2013
-14
2014
-15
2015
-16
Total number of rateable properties in the Dover District,
2000-01 to 2015-16 (count)
Retail Sector Office Sector
Industrial Sector Other Sector
Excluded Sector Total - All Sectors

Leadership Support Team, Dover District Council, State of the District 2017 | FINANCE 4
• At a county level, in 2015/16, the number of business properties ranged from 5,610 in Canterbury to 2,270 in Gravesham.
• Thanet has the largest number of retail sector hereditaments in Kent (1,570) and Tonbridge and Malling the lowest (650).
• Maidstone has the largest number of office sector hereditaments in Kent (1,130) and Gravesham the lowest (300).
• Swale has the largest number of industrial sector hereditaments in Kent (1,290) and Gravesham the lowest (460).
• Canterbury has the largest number of other sector hereditaments in Kent (680) and Dartford the lowest (300).
• In 2015-16, after removing the “Excluded sector” from the figures, there are 2,990 hereditaments (rateable properties) in the district.
• The pie chart opposite shows the breakdown of the included sectors, with the retail sector (30.1%) being the highest proportion of businesses paying non-domestic rates.
b) Rateable Value
• The Valuation Office Agency sets a rateable value (RV) for each business property
(hereditament). This is not the amount of business rates payable. The rates bill (amount payable) for a business property is the product of its rateable value and the relevant national non-domestic rating multiplier.
• In 2015/16, the VOA estimated the total rateable value of business properties in the Dover district was £89,400,000. This is down £1,732,000 (-1.9%) over the past five years. From this total figure, in 2015/16, £39,386,000 (44%) was in the excluded sector.
30.1
25.1
27.4
17.4
Proportion of rateable properties in the Dover district, 2015-16 (percentage)
Retail Sector
Office Sector
Industrial Sector
Other Sector
0
20,000
40,000
60,000
80,000
100,000
Total Rateable Value in the Dover District - All Sectors, 2000-01 to 2015-16 (£thousands)
Retail Sector Office Sector Industrial Sector
Other Sector Excluded Sector Total - All Sectors

Leadership Support Team, Dover District Council, State of the District 2017 | FINANCE 5
c) Business Floorspace
• Based on the 2,990 included properties, there is 777,000 m2 of business floor space in the Dover district. This can be subdivided into:
o Retail 161,000m2 (20.7%) o Office 143,000m2 (18.4%) o Industrial 362,000m2 (46.6%) o Other sector 110,000m2 (14.2%)
• Over the past five years, total business floorspace has decreased by 82,000m2 (-9.5%), with ‘industrial sector’ floorspace falling by 138,000m2 (-27.6%) and ‘retail sector’ floorspace by 2,000m2 (-1.2%). However, ‘office sector’ floorspace has increased by 56,000 m2 (+64.4%) and ‘other sector’ floorspace has increased by 2,000m2 (+1.9%).
• At a county level, the total amount of business floor space varies from district to district, from 1.57 million m2 in Tonbridge and Malling to 734,000 m2 in Gravesham.
d) Empty Hereditaments
• The estimated percentage of
empty hereditaments in the Dover district fell from 13.7% in 2010 to 9.6% in 2016 but has now increased to 10.8% in 2017.
Empty Hereditaments (as at 31 March) Year Number % 2010 468 13.7 2011 456 13.4 2012 428 12.5 2013 441 12.6 2014 458 12.3 2015 392 10.4 2016 374 9.6 2017 399 10.8
Source: DCLG NDR tables (2010-2013) and EK Services (2014-2017)
0
200
400
600
800
1000
Total Floorspace in the Dover District - All Sectors, 2000-01 to 2015-16, (thousand m2)
Retail Sector Office Sector Industrial Sector Other Sector Total
02468
10121416
2010 2011 2012 2013 2014 2015 2016 2017
Empty Hereditaments in the Dover district, 2010 to 2017 (percentage)
Leadership Support Team, Dover District Council, State of the District 2017 | FINANCE 6
e) Collection rates
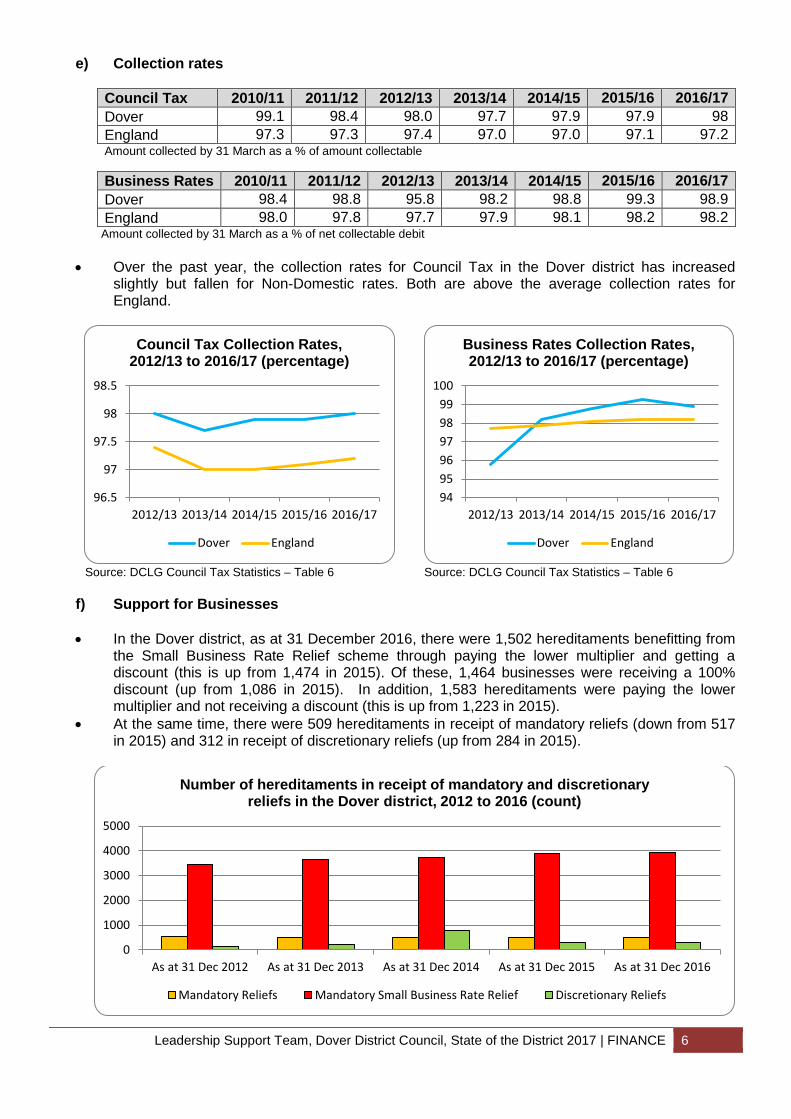
Council Tax 2010/11 2011/12 2012/13 2013/14 2014/15 2015/16 2016/17 Dover 99.1 98.4 98.0 97.7 97.9 97.9 98 England 97.3 97.3 97.4 97.0 97.0 97.1 97.2 Amount collected by 31 March as a % of amount collectable
Business Rates 2010/11 2011/12 2012/13 2013/14 2014/15 2015/16 2016/17 Dover 98.4 98.8 95.8 98.2 98.8 99.3 98.9 England 98.0 97.8 97.7 97.9 98.1 98.2 98.2
Amount collected by 31 March as a % of net collectable debit
• Over the past year, the collection rates for Council Tax in the Dover district has increased slightly but fallen for Non-Domestic rates. Both are above the average collection rates for England.
Source: DCLG Council Tax Statistics – Table 6
Source: DCLG Council Tax Statistics – Table 6
f) Support for Businesses
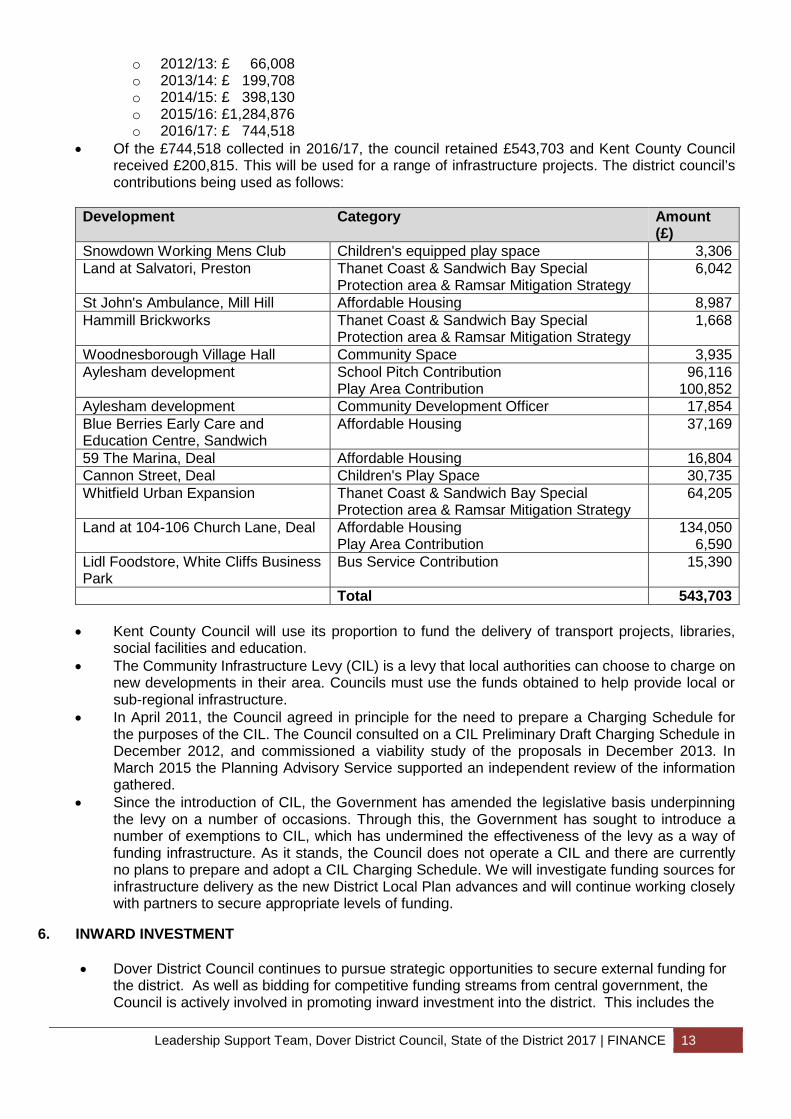
• In the Dover district, as at 31 December 2016, there were 1,502 hereditaments benefitting from
the Small Business Rate Relief scheme through paying the lower multiplier and getting a discount (this is up from 1,474 in 2015). Of these, 1,464 businesses were receiving a 100% discount (up from 1,086 in 2015). In addition, 1,583 hereditaments were paying the lower multiplier and not receiving a discount (this is up from 1,223 in 2015).
• At the same time, there were 509 hereditaments in receipt of mandatory reliefs (down from 517 in 2015) and 312 in receipt of discretionary reliefs (up from 284 in 2015).
96.5
97
97.5
98
98.5
2012/13 2013/14 2014/15 2015/16 2016/17
Council Tax Collection Rates, 2012/13 to 2016/17 (percentage)
Dover England
949596979899
100
2012/13 2013/14 2014/15 2015/16 2016/17
Business Rates Collection Rates, 2012/13 to 2016/17 (percentage)
Dover England
0
1000
2000
3000
4000
5000
As at 31 Dec 2012 As at 31 Dec 2013 As at 31 Dec 2014 As at 31 Dec 2015 As at 31 Dec 2016
Number of hereditaments in receipt of mandatory and discretionary reliefs in the Dover district, 2012 to 2016 (count)
Mandatory Reliefs Mandatory Small Business Rate Relief Discretionary Reliefs

Leadership Support Team, Dover District Council, State of the District 2017 | FINANCE 7
Number of hereditaments in receipt of mandatory and discretionary relief in the Dover district3 As at 31
Dec 2012 As at 31
Dec 2013 As at 31
Dec 2014 As at 31
Dec 2015 As at 31
Dec 2016 Mandatory Reliefs (MR)4 Charity 218 214 229 224 233 Rural village shop 16 17 16 16 14 Partly occupied 0 0 0 0 0 Empty premises 285 266 268 267 253 Community amateur sports clubs
10 10 9 10 9
Mandatory Reliefs Total (Number)
529 507 522 517 509
Mandatory Small Business Rate Relief (SBBR) Paying additional supplement 1177 1,176 1,213 1,190 835 Paying lower multiplier and receiving a discount
1159 1,257 1,377 1,474 1,502
Of which 100% discount 852 921 1,009 1,086 1,464 0%-100% discount on sliding scale
307 336 368 388 38
Paying lower multiplier and not receiving a discount
1130 1,211 1,137 1,223 1,583
SBBR Total (Number) 3466 3,644 3,727 3,887 3,920 Discretionary Reliefs (DR) Charity 112 110 89 97 96 Non-profit making bodies 43 43 23 21 17 Rural village shop 0 0 0 0 0 Other small rural business 0 0 0 0 0 Community amateur sports clubs
0 0 0 0 0
Enterprise Zone discounts 4 48 138 163 199 S47 discounts 0 0 0 0 0 S31 new empty property relief 0 0 0 0 0 S31 long term empty relief 0 0 1 3 0 S31 retail relief 0 0 531 0 0 Discretionary Reliefs Total (Number)
159 201 782 284 312
Source: DCLG National non-domestic rates collected by councils’ collection: National non-domestic rates supplementary tables 2013 to 2014, 2014 to 2015, 2015 to 2016 and 2016 to 2017. • Following the 2017 business rates revaluation, we have put together a scheme to help local
businesses with their business rates bills, taking into account the money given to us by the Government. Those ratepayers that receive help under this scheme could have the increase in their business rates bills reduced by up to 70%5.
3 Some hereditaments may be entitled to more than one relief. Therefore, the total number of reliefs awarded to hereditaments may be greater than the total number of hereditaments in receipt of relief. 4 Excludes Small Business Rate Relief and Transitional Relief 5 Source: dover.gov.uk/Business/Business-Rates/Relief/Local-discretionary-discount.aspx

Leadership Support Team, Dover District Council, State of the District 2017 | FINANCE 8
3. COUNCIL TAX IN THE DOVER DISTRICT
a) Average Council Tax Bill 2016/17
• Council Tax Band D6 is considered to be the average council tax band and, according to Department for Communities and Local Government (DCLG) figures, the average Band D council tax set by local authorities in England for 2016/17 is £1,530 (including parish precepts). This is an increase of £46 or 3.1% on the 2015/16 figure of £1,484. In shire districts ( includings the Dover district) the average charged is £1,547 (+1.4%).
b) Comparison of Council Tax charges across Kent 2016/17
Local authority Average council tax
for the authority excluding parish
precepts (Band D)
Average council tax for the authority including parish
precepts (Band D)
Average council tax for area of billing
authority including parish precepts
(Band D) Ashford 150 3.13 182 4.19 1,540 3.86 Canterbury 194 2.61 208 3.25 1,566 3.74 Dartford 163 0.00 196 -0.07 1,554 3.31 Dover 172 2.96 234 2.42 1,592 3.61 Gravesham 187 2.72 195 3.16 1,553 3.73 Maidstone 241 2.10 266 2.34 1,624 3.57 Sevenoaks 198 2.57 276 3.40 1,634 3.75 Shepway 246 1.99 296 3.78 1,654 3.81 Swale 160 0.00 184 1.23 1,541 3.50 Thanet 215 2.36 243 5.08 1,601 4.01 Tonbridge & Malling 193 2.67 239 3.57 1,597 3.78 Tunbridge Wells 164 3.14 211 3.16 1,569 3.73
Source: DCLG - Council Tax levels set by local authorities in England: 2016/17 (Table 7)
• In 2016/17, the average council tax for the area of the billing authority for a Band ‘D’ property, including parish precepts, across Kent ranges from £1,654 in Shepway to £1,540 in Ashford. This compares to £1,592 in the Dover district.
• The council tax consists of several elements: the County Council, the Local Authority, the Police Authority, the Fire and Rescue Service and the Parish Precept.
• The local authority part (ie the billing authority) of the council tax demands are less than the county council requirement. County Council services are £1,134, the Police Authority £152 and the Fire & Rescue services £72. Shepway District Council set the highest local authority rate in the county for 2016/17 at £246, followed by Maidstone Borough Council (£241) and Thanet District Council (£215). Ashford Borough Council set the lowest local authority rate at £1507.
c) Council Tax for a dwelling occupied by 2 adults by band 2016/17
• There are eight council tax bands ranging from Band A (for dwellings valued at less than
£40,000 on 01 April 1991) to Band H (for dwellings valued at more than £320,000 on that date). Local authority Band A Band B Band C Band D Band E Band F Band G Band H Ashford 1,026 1,197 1,369 1,540 1,882 2,224 2,566 3,079 Canterbury 1,044 1,218 1,392 1,566 1,914 2,262 2,609 3,131 Dartford 1,036 1,209 1,381 1,554 1,899 2,245 2,590 3,108
6 Band D council tax: This is the council tax payable on a Band D dwelling occupied as a main residence by two adults, before
any reductions due to discounts, exemptions or council tax benefit. This definition is widely regarded as a benchmark when comparing council tax levels in different areas or over time.
7 Average council tax (Band D 2 Adult equivalent) council tax (including Adult Social Care precept and excluding local precepts).

Leadership Support Team, Dover District Council, State of the District 2017 | FINANCE 9
Local authority Band A Band B Band C Band D Band E Band F Band G Band H Dover 1,061 1,238 1,415 1,592 1,946 2,300 2,653 3,184 Gravesham 1,035 1,208 1,380 1,553 1,898 2,243 2,588 3,106 Maidstone 1,083 1,263 1,444 1,624 1,985 2,346 2,707 3,248 Sevenoaks 1,089 1,271 1,452 1,634 1,997 2,360 2,723 3,267 Shepway 1,102 1,286 1,470 1,654 2,021 2,389 2,756 3,307 Swale 1,028 1,199 1,370 1,541 1,884 2,226 2,569 3,083 Thanet 1,067 1,245 1,423 1,601 1,957 2,312 2,668 3,202 Tonbridge & Malling 1,065 1,242 1,420 1,597 1,952 2,307 2,662 3,194 Tunbridge Wells 1,046 1,220 1,395 1,569 1,918 2,266 2,615 3,138 Source: DCLG - Council Tax levels set by local authorities in England: 2016/17 (Table 8)
• Dover District Council has
the fifth lowest council tax charge in Kent (£172) and the lowest council tax charge in East Kent.
• Shepway District Council set the highest local authority rate in the county for 2016/17 at £246, followed by Maidstone Borough Council (£241) and Thanet District Council (£215). Ashford Borough Council set the lowest local authority rate at £1508.
Source: DCLG Live tables on Council Tax
• Shepway also has the
highest average council tax charge when precepts are added (£1,654); followed by Sevenoaks (£1,634); and Maidstone (£1,624).
• Ashford has the lowest average council tax charge (£1,540).
d) Number of chargeable dwellings
• Total chargeable dwellings (as at 01 October 2015) in the Dover district stood at 51,111.
8 Average council tax (Band D 2 Adult equivalent) council tax (including Adult Social Care precept and excluding local precepts).
- 50
100 150 200 250 300
Average council tax for the authority excluding parish precepts, 2016/17 (£)
1,450 1,500 1,550 1,600 1,650 1,700
Average council tax for area of billing authority including parish precepts (Band D), 2016-17 (£)

Leadership Support Team, Dover District Council, State of the District 2017 | FINANCE 10
• Of these, a high majority fall within the lower charging Bands A – C, with 36,469 chargeable dwellings within these bands (71.4%). Only 69 properties fall within the highest charging Band H (0.14%).
e) Where your Council Tax goes
• Dover District Council, Kent County Council, The Police and Crime Commissioner for Kent and
The Kent and Medway Fire and Rescue Authority together deliver most of the local services in the district. Town and parish councils also provide some local services.
• The Council Tax you pay is collected by Dover District Council on behalf of all the above authorities. The total amount is then divided between these authorities:
Joint Council Tax breakdown 2016/17 (excluding parish precepts)
Band Kent
County Council
Dover District Council
The Police and Crime Commissioner for
Kent
Kent and Medway Fire and Rescue
Authority
Total Council Tax (excluding
parish precepts)
D £1,133.55 £172.44 £152.15 £72.00 £1,530.14 Source: DCLG Live Tables on Council Tax 2016/17
Council Tax Percentage Breakdown 2016/17
For every £1 collected: o Kent County Council receives
71.2p, o Dover District Council 10.8p, o Police and Crime Commissioner
9.6p, o Kent and Medway Fire and
Rescue 4.5p and o Town and Parish Councils 3.9p.
f) Town and Parish Councils Precept
• All areas within Dover have parish or town councils and they also ask Dover District Council to
collect their “precepts” to provide some local services. • Town and parish council precept figures 2015/16 are available on the DDC website:
Town and Parish Council Charges (Band D) 2016/17 Area £ % Change Area £ % Increase Alkham 24.66 -0.32% Ringwould-with-Kingsdown 33.16 1.19% Ash 60.58 0.00% Ripple 29.17 -0.58% Aylesham 79.77 0.00% River 40.04 3.01% Capel-le-Ferne 34.33 19.99% St Margarets–at–Cliffe 62.84 23.60% Deal 58.01 -2.04% Sandwich 84.32 4.45% Denton-with-Wootton 68.78 1.33% Sheperdswell-with-Coldred 50.52 3.02% Dover 91.55 -1.27% Sholden 50.03 0.00% Eastry 63.55 1.99% Staple 28.96 0.00% Eythorne 46.99 0.00% Stourmouth 54.05 0.00% Goodnestone 38.35 5.94% Sutton–by–Dover 33.19 -2.47% Great Mongeham 33.27 0.00% Temple Ewell 37.22 0.00%
Council Tax Percentage Breakdown in the Dover District, 2016/17
Kent County Council
Dover District Council
Police and CrimeCommissioner for KentKent and Medway Fire andRescue AuthorityTown and parish councils(average)

Leadership Support Team, Dover District Council, State of the District 2017 | FINANCE 11
Guston 104.31 9.26% Tilmanstone 43.73 0.00% Hougham–without 51.92 8.01% Walmer 37.13 -3.78% Langdon 54.8 0.00% Whitfield 55.52 2.89% Lydden 59.45 2.01% Wingham 88.17 3.27% Nonington 30.21 1.07% Woodnesborough 40.61 1.98% Northbourne 36.41 1.39% Worth 42.93 -0.33% Preston 53.37 0.00% TOTAL /Average 61.86 0.95% Source: DDC Council Tax Information 2016/17 Council Tax Charges for Band D properties across the Dover District 2016/17: Town and Parish Councils Band D (£) Town and Parish Councils Band D (£) Alkham 1,554.80 Ringwould-with-Kingsdown 1,563.30 Ash 1,590.72 Ripple 1,559.31 Aylesham 1,609.91 River 1,570.18 Capel-le-Ferne 1,564.47 St Margarets-at-Cliffe 1,592.98 Deal 1,588.15 Sandwich 1,614.46 Denton-with-Wootton 1,598.92 Shepherdswell-with-Coldred 1,580.66 Dover 1,621.69 Sholden 1,580.17 Eastry 1,593.69 Staple 1,559.10 Eythorne 1,577.13 Stourmouth 1,584.19 Goodnestone 1,568.49 Sutton-by-Dover 1,563.33 Great Mongeham 1,563.41 Temple Ewell 1,567.36 Guston 1,634.45 Tilmanstone 1,573.87 Hougham-without 1,582.06 Walmer 1,567.27 Langdon 1,584.94 Whitfield 1,585.66 Lydden 1,589.59 Wingham 1,618.31 Nonington 1,560.35 Woodnesborough 1,570.75 Northbourne 1,566.55 Worth 1,573.07 Preston 1,583.51 Source: DDC Council Tax Information 2016/17
0
20
40
60
80
100
120
Gus
ton
Dove
rW
ingh
amSa
ndw
ich
Ayle
sham
Dent
on-w
ith-W
oott
onEa
stry
St M
arga
rets
–at–
Cliff
e To
tal/a
vera
ge Ash
Lydd
enDe
alW
hitf
ield
Lang
don
Stou
rmou
thPr
esto
nHo
ugha
m–w
ithou
t Sh
ephe
rdsw
ell-w
ith-C
oldr
edSh
olde
nEy
thor
neTi
lman
ston
eW
orth
Woo
dnes
boro
ugh
Rive
rG
oodn
esto
neTe
mpl
e Ew
ell
Wal
mer
Nor
thbo
urne
Cape
l-le-
Fern
eG
reat
Mon
geha
mSu
tton
–by–
Dove
r Ri
ngw
ould
-with
-Kin
gsdo
wn
Non
ingt
onRi
pple
Stap
leAl
kham
Town and Parish Council Charges (Band D), 2016/17 (£)
Leadership Support Team, Dover District Council, State of the District 2017 | FINANCE 12
Source: DDC Council Tax Information 2016/17
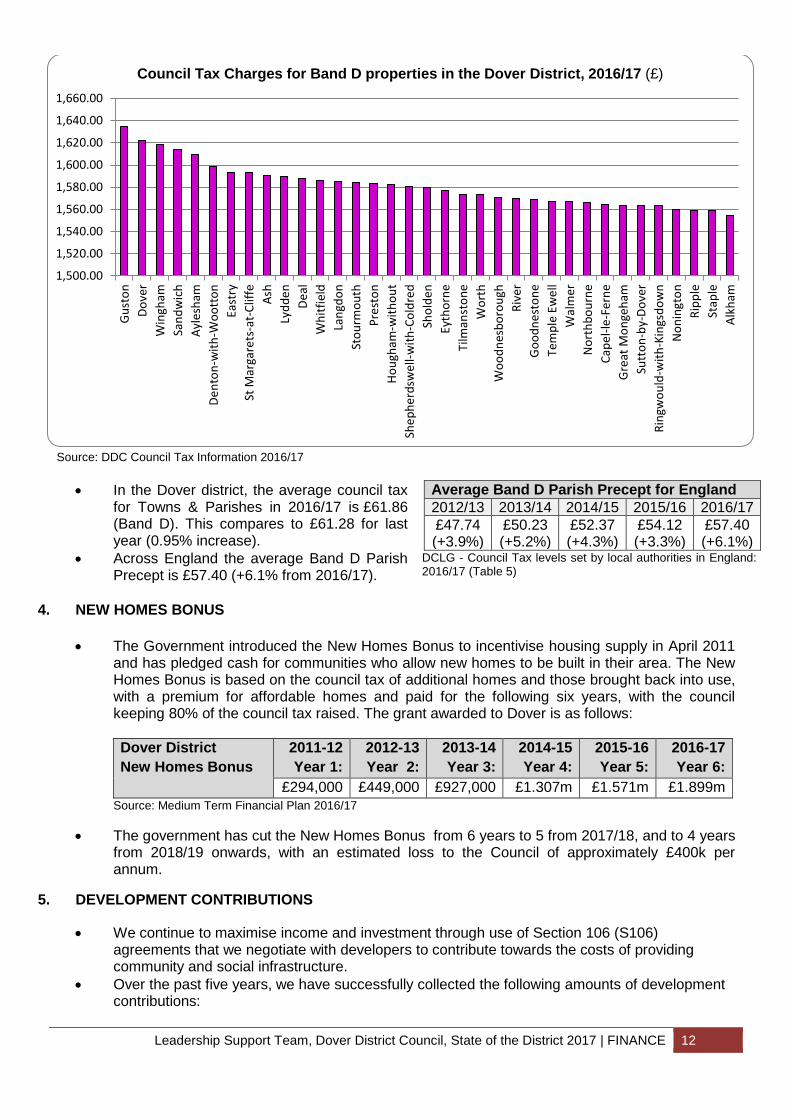
• In the Dover district, the average council tax for Towns & Parishes in 2016/17 is £61.86 (Band D). This compares to £61.28 for last year (0.95% increase).
• Across England the average Band D Parish Precept is £57.40 (+6.1% from 2016/17).
Average Band D Parish Precept for England 2012/13 2013/14 2014/15 2015/16 2016/17 £47.74 (+3.9%)
£50.23 (+5.2%)
£52.37 (+4.3%)
£54.12 (+3.3%)
£57.40 (+6.1%)
DCLG - Council Tax levels set by local authorities in England: 2016/17 (Table 5)
4. NEW HOMES BONUS
• The Government introduced the New Homes Bonus to incentivise housing supply in April 2011
and has pledged cash for communities who allow new homes to be built in their area. The New Homes Bonus is based on the council tax of additional homes and those brought back into use, with a premium for affordable homes and paid for the following six years, with the council keeping 80% of the council tax raised. The grant awarded to Dover is as follows:
Dover District New Homes Bonus
2011-12 Year 1:
2012-13 Year 2:
2013-14 Year 3:
2014-15 Year 4:
2015-16 Year 5:
2016-17 Year 6:
£294,000 £449,000 £927,000 £1.307m £1.571m £1.899m Source: Medium Term Financial Plan 2016/17
• The government has cut the New Homes Bonus from 6 years to 5 from 2017/18, and to 4 years
from 2018/19 onwards, with an estimated loss to the Council of approximately £400k per annum.
5. DEVELOPMENT CONTRIBUTIONS
• We continue to maximise income and investment through use of Section 106 (S106)
agreements that we negotiate with developers to contribute towards the costs of providing community and social infrastructure.
• Over the past five years, we have successfully collected the following amounts of development contributions:
1,500.00
1,520.00
1,540.00
1,560.00
1,580.00
1,600.00
1,620.00
1,640.00
1,660.00
Gus
ton
Dove
rW
ingh
amSa
ndw
ich
Ayle
sham
Dent
on-w
ith-W
oott
onEa
stry
St M
arga
rets
-at-
Cliff
eAs
hLy
dden
Deal
Whi
tfie
ldLa
ngdo
nSt
ourm
outh
Pres
ton
Houg
ham
-with
out
Shep
herd
swel
l-with
-Col
dred
Shol
den
Eyth
orne
Tilm
anst
one
Wor
thW
oodn
esbo
roug
hRi
ver
Goo
dnes
tone
Tem
ple
Ewel
lW
alm
erN
orth
bour
neCa
pel-l
e-Fe
rne
Gre
at M
onge
ham
Sutt
on-b
y-Do
ver
Ring
wou
ld-w
ith-K
ings
dow
nN
onin
gton
Ripp
leSt
aple
Alkh
am
Council Tax Charges for Band D properties in the Dover District, 2016/17 (£)
Leadership Support Team, Dover District Council, State of the District 2017 | FINANCE 13
o 2012/13: £ 66,008 o 2013/14: £ 199,708 o 2014/15: £ 398,130 o 2015/16: £1,284,876 o 2016/17: £ 744,518
• Of the £744,518 collected in 2016/17, the council retained £543,703 and Kent County Council received £200,815. This will be used for a range of infrastructure projects. The district council’s contributions being used as follows:
Development Category Amount
(£) Snowdown Working Mens Club Children's equipped play space 3,306 Land at Salvatori, Preston
Thanet Coast & Sandwich Bay Special Protection area & Ramsar Mitigation Strategy
6,042
St John's Ambulance, Mill Hill Affordable Housing 8,987 Hammill Brickworks
Thanet Coast & Sandwich Bay Special Protection area & Ramsar Mitigation Strategy
1,668
Woodnesborough Village Hall Community Space 3,935 Aylesham development School Pitch Contribution
Play Area Contribution 96,116
100,852 Aylesham development Community Development Officer 17,854 Blue Berries Early Care and Education Centre, Sandwich
Affordable Housing
37,169
59 The Marina, Deal Affordable Housing 16,804 Cannon Street, Deal Children's Play Space 30,735 Whitfield Urban Expansion
Thanet Coast & Sandwich Bay Special Protection area & Ramsar Mitigation Strategy
64,205
Land at 104-106 Church Lane, Deal
Affordable Housing Play Area Contribution
134,050 6,590
Lidl Foodstore, White Cliffs Business Park
Bus Service Contribution 15,390
Total 543,703
• Kent County Council will use its proportion to fund the delivery of transport projects, libraries, social facilities and education.
• The Community Infrastructure Levy (CIL) is a levy that local authorities can choose to charge on new developments in their area. Councils must use the funds obtained to help provide local or sub-regional infrastructure.
• In April 2011, the Council agreed in principle for the need to prepare a Charging Schedule for the purposes of the CIL. The Council consulted on a CIL Preliminary Draft Charging Schedule in December 2012, and commissioned a viability study of the proposals in December 2013. In March 2015 the Planning Advisory Service supported an independent review of the information gathered.
• Since the introduction of CIL, the Government has amended the legislative basis underpinning the levy on a number of occasions. Through this, the Government has sought to introduce a number of exemptions to CIL, which has undermined the effectiveness of the levy as a way of funding infrastructure. As it stands, the Council does not operate a CIL and there are currently no plans to prepare and adopt a CIL Charging Schedule. We will investigate funding sources for infrastructure delivery as the new District Local Plan advances and will continue working closely with partners to secure appropriate levels of funding.
6. INWARD INVESTMENT
• Dover District Council continues to pursue strategic opportunities to secure external funding for
the district. As well as bidding for competitive funding streams from central government, the Council is actively involved in promoting inward investment into the district. This includes the
Leadership Support Team, Dover District Council, State of the District 2017 | FINANCE 14
Invest in Dover website www.investindover.gov.uk, social media, and attendance at the annual MIPIM UK exhibition.
a) Promoting the district
• Dover District Council proactively promotes the ‘Enterprise Coast – Dover, Deal, Sandwich’ as a great place to live, work and play. Our inward investment website www.investindover.co.uk continues to develop as platform for potential investors, and local businesses, to find out more about key locations, financial incentives, and news and information for business. A Twitter feed (@InvestInDover) complements with c.1,100 followers.
• Other council twitter accounts include VisitDover with c.3,800 followers; Kearsney Parks with c.600 followers; Up on the Downs with c.1,250 followers and Dover Museum with c.1,300 followers. Our ‘Keep Me Posted’ email service now has c.60,400 subscribers, keeping residents and businesses far-and-wide up-to-date on topics of interest to them – including regeneration projects, Invest in Dover, Skills 4 Dover, and tourism9.
• Working in partnership, the Council has exhibited at the MIPIM UK exhibition at London Olympia for the past 3-years. This provides an excellent showcase for the district at the most prominent investment and property exhibition in the UK.
b) Kearsney Parks for People
• In 2016 DDC submitted a successful £3.1m bid to the Heritage Lottery Fund/Big Lottery Fund
‘Parks for People’ programme for a major scheme of restoration and improvement works at Russell Gardens and Kearsney Abbey.
• The plans, developed by Dover District Council, include: o Restoring Thomas Mawson’s design for Kearsney Court and picturesque landscape
features in Kearsney Abbey o Recreating Kearsney Abbey’s historic role as a cultural venue, attracting new audiences
to the parks o Celebrating the parks’ unique heritage including mills, ecology, people and landscapes
through new activities and interpretation o Creating a multi-use extension to the grade II listed billiards room in Kearsney Abbey to
facilitate new education, training and volunteering programmes • Our project manager and design team have been reappointed and are working on detailed
designs and we have appointed additional members of staff to extend engagement with park users and the local community. The first phase of clearance work took place in Russell Gardens during the winter of 2016/17, with the main restoration and improvement work starting in autumn 2017. The project is due to end in 2020.
• Please see our Kearsney Parks website for more information.
7. LOTTERY FUNDING RECEIVED IN THE DOVER DISTRICT
• Data from the Department for Culture, Media and Sports (DCMS) shows that, since 1995, there have been 654 lottery grants awarded for the Dover district, totalling £27,939,495.
• In 2016, 30 lottery grants were awarded for the Dover district totalling £2,031,396, broken down in to the following categories:
o Heritage: £1,593,400 o Arts: £146,999 o Health, Education, Environment and Charitable Expenditure: £290,997
9 All twitter followers rounded to the nearest 50

Leadership Support Team, Dover District Council, State of the District 2017 | FINANCE 15
Source: DCMS Lottery Grants Examples of projects receiving funding in 2016 and 2017 include:
Recipient Project Description Amount Date Distributing body
Cinque Ports Community Kitchen CIC
This project will support people to live more healthily and meet new people, in particular those on low incomes or who are unemployed, people with health problems, people with disabilities and carers. It will offer cooking classes on a tight budget, using fresh ingredients and making the most of leftovers. The group will create cookery champions who will receive additional training and support to pass on their skills to the community. There will also be free transport to the project for those who need it.
£172,106 18/02/2016 Big Lottery Fund
Deal Breastfeeding Support Group
The organisation will use the funding to set up and run a sling library for parents. This will enable parents to learn how use a slings safely and improve the emotional health and bond between the parent and child.
£4,150 19/09/2016 Big Lottery Fund
English Heritage Rediscovering Walmer Pleasure Grounds
£1,463,800 13/12/2016 Heritage Lottery Fund
Open Heart Productions
Stepmother Stepfather Production and Premiere
£15,000 31/08/2016 Arts Council England
Sandwich Museum & Archive Toll Bridge Fund
Sandwich History - Refreshed, Revised, Revisited- From Magna Carta to the 21st Century
£99,900 16/08/2016 Heritage Lottery Fund
1,417,186
2,960,940
3,247,730
5,000,132 11,685,756
6,505
3,621,246
Breakdown of total lottery grants received in the Dover District, 1995 to 2016
Arts
Charitable Expenditure
Health, Education, Environment (1999-2007)
Health, Education, Environment and CharitableExpenditureHeritage
Millennium (1995-2005)
Sport

Leadership Support Team, Dover District Council, State of the District 2017 | FINANCE 16
Home-Start Dover District
This project will deliver a specialised disability support service to families in their homes, with a particular focus on children and parents who are experiencing a physical or learning disability.
£337,192 01/02/2017 Big Lottery Fund
Dover Arts Development
Chalk Up: Destination Dover (Revised) £57,050 13/02/2017 Arts Council
England Royal Marines Heritage Trails (Deal and Walmer)
Royal Marines Heritage Trails (Deal and Walmer) 2
£44,900 15/08/2017 Heritage Lottery
Fund