finance & development, september 2012 (mulitmedia … jeremy clift managing editor ... new...
TRANSCRIPT

I N T E R N A T I O N A L M O N E T A R Y F U N DI N T E R N A T I O N A L M O N E T A R Y F U N D
FDFINANCE and DEVELOPMENTSeptember 2012 $8.00
Kemal Dervi on Interconnectedness
Straight Talk by Christine Lagarde
Kawai & Lombardi on Financial Regionalism
Global Village
ş
The

Finance & Development A QUARTERLY PUBLICATION OF THE INTERNATIONAL MONETARY FUND September 2012 • Volume 49 • Number 3
FeaturesGlobal interconnectivity8 The Global Village Has Arrived
Interconnectivity is growing by leaps and boundsKishore Mahbubani
10 World Economy: Convergence, Interdependence, and DivergenceGrowth in emerging market and developing economies is less dependent on advanced economies over the long run, but in the short run they dance togetherKemal DerviŞ
15 Caught in the WebNetwork analysis looks at financial connections in a globalized world and the risks they poseCamelia Minoiu
18 Migration Meets Slow GrowthThe global movement of workers will change as the economic crisis continues in advanced economiesDemetrios G. Papademetriou
23 Financial RegionalismRegional arrangements are reshaping the international financial architecture and helping global financial stabilityMasahiro Kawai and Domenico Lombardi
26 Straight Talk: Fragmentation RisksThe benefits of globalization must be preserved by enhancing the international structures that ensure financial stabilityChristine Lagarde
interconnecteD asia28 Sino-Spending
China must boost household consumption even further to make its growth more inclusiveSteven Barnett, Alla Myrvoda, and Malhar Nabar
32 A Change in FocusChina’s external surplus is dwindling, with repercussions for its Asian trading partnersMalhar Nabar and Olaf Unteroberdoerster
36 The Tiger and the DragonIndia and China can learn a lot from each other as they advance in their development journeysMurtaza Syed and James P. Walsh
40 Back on the MapMyanmar’s reintegration into the global economy promises a better future for its peopleMeral Karasulu and Sergei Dodzin
subscribe online at www.imfbookstore.org/f&d
Finance & Development is published quarterly in English, Arabic, Chinese, French, Russian, and Spanish.English edition ISSN 0015-1947
eDitor-in-cHieFJeremy Clift
manaGinG eDitorMarina Primorac
senior eDitorsCamilla AndersenHyun-Sung KhangNatalie Ramírez-Djumena
online eDitorGlenn Gottselig
assistant eDitorsKhaled Abdel KaderMaureen Burke
print/Web proDuction specialistLijun Li
social meDia manaGerSara Haddad
eDitorial assistantHarris Qureshi
creative DirectorLuisa Menjivar
GrapHic artistSeemeen Hashem
aDvisors to tHe eDitorBas BakkerNicoletta BatiniHelge BergerTim CallenPaul CashinAdrienne CheastyAlfredo CuevasMarcello EstevãoDomenico Fanizza
© 2012 by the International Monetary Fund. All rights reserved. For permission to reproduce any F&D content, submit a request via online form (www.imf.org/external/terms.htm) or by e-mail to [email protected]. Permission for commercial purposes also available from the copyright clearance center (www.copyright.com) for a nominal fee.
Opinions expressed in articles and other materials are those of the authors; they do not necessarily reflect IMF policy.
subscriber services, changes of address, and advertising inquiriesIMF Publication ServicesFinance & DevelopmentPO Box 92780Washington, DC, 20090, USATelephone: (202) 623-7430Fax: (202) 623-7201E-mail: [email protected]
postmaster: send changes of address to Finance & Development, International Monetary Fund, PO Box 92780, Washington, DC, 20090, USA. Periodicals postage is paid at Washington, DC, and at additional mailing offices. The English edition is printed at Dartmouth Printing Company, Hanover, NH.
FD
James GordonThomas HelblingLaura KodresPaolo MauroGian Maria Milesi-FerrettiPaul MillsMartin MuhleisenUma RamakrishnanAbdelhak Senhadji
James L. Rowe, Jr. Simon Willson
Jacqueline DeslauriersLika Gueye
18
10
40
FROM THE eDitor
Finance & Development September 2012 1
FROM THE eDitor
also in tHis issue44 Taxing Finance
Many European policymakers are warming to the idea of broadening taxation of the financial sectorGeoff Gottlieb, Gregorio Impavido, and Anna Ivanova
48 Fueling RiskEnergy subsidies in low- and middle-income countries can take a big toll on their fiscal healthDavid Coady, Valentina Flamini, and Matias Antonio
50 It All Falls into PlacePiecing together “missing links” in a jigsaw puzzle of data sets helps shed light on the global financial crisisAdelheid Burgi-Schmelz and Alfredo M. Leone
Departments2 in brief4 people in economics The Man with the Patience to Cook a Stone
F&D profiles Justin Yifu Lin, first developing country World Bank chief economist
42 picture this Access to Banking Services
New database shows gaps in how people save, borrow, make payments, and manage riskAsli Demirguc-Kunt and Leora Klapper
52 back to basics What Is Money?
Without it, modern economies could not functionIrena Asmundson and Ceyda Oner
54 book reviews Reforming the Unreformable: Lessons from Nigeria,
Ngozi Okonjo-Iweala Russia: A Long View, Yegor Gaidar Double Entry: How the Merchants of Venice Created
Modern Finance, Jane Gleeson-White57 Data spotlight Tracking Use of Fiscal Rules
Numerical limits have emerged as a key response to the fiscal legacy of the crisisNina Budina and Andrea Schaechter
Illustration: Cover and p. 10, Randy Lyhus; p. 44, Seemeen Hashem/IMF.
Photography: p. 2, Radius Images/Corbis, ROM Image Broker/Newscom; p. 3, Strauss/Curtis/Corbis; Kike Calvo/National Geographic Society/Corbis; p. 4, Michael Spilotro/IMF; pp. 8–9, Jose Fuste Raga/Corbis; p. 15, Erich Kuchling/Westend61/Newscom; p. 18, Piotr Malecki/Panos; p. 21, Mike Blake/Reuters/Newscom; p. 23, Imaginechina/Corbis; p. 26, Stephen Jaffe/IMF; p. 28, Mads Nissen/Panos; p. 32, Justin Jin/Panos; p. 36, imago stock&people/Newscom; p. 40, Sergey Maximishin/Panos; p. 43, iStock, iStock, Philippe Lissac/Godong/Corbis; p. 48, Associated Press; p. 52, Eugene Salazar/IMF.
visit F&D ’s Facebook page: www.facebook.com/FinanceandDevelopment
read onl ine at www.imf.org/fandd
WE live in an increasingly globalized and inter-connected world, helping to spread ideas, in-formation, and technology ever more quickly. The globalized economy has created a com-
plex and interlocking network of capital and trade flows that have brought major economic gains, lifting hundreds of mil-lions of people out of poverty around the world.
But, as we have seen from the prolonged global financial crisis, our interconnectedness carries grave risks as well as benefits. With instant communication comes the risk of rapid contagion. There is, thus, a strong public interest in ensuring that global economic integration is supported by a coherent set of coordinated national macroeconomic policies and a harmonized international regulatory regime that addresses the fragilities in our global financial system.
This issue of F&D magazine looks at different aspects of interconnectedness. Kishore Mahbubani, dean of the National University of Singapore’s Lee Kuan Yew School of Public Policy and author of the forthcoming book The Great Convergence: Asia, the West, and the Logic of One World, argues that what he terms the global village increasingly requires global solutions to big emerging problems such as climate change.
Kemal DerviŞ, former head of the United Nations Development Programme who is now a vice president at the
Brookings Institution, looks at three fundamental shifts in the global economy that are leading to major adjustments in the balance between east and west. He argues that the world of the future will be ever more multipolar and interdepen-dent, which calls for emerging and developing countries to play a greater role in international institutions.
In Straight Talk, Christine Lagarde, IMF Managing Director, says the Fund is making progress at mapping global financial risks and the links between the financial sector and the “real” economy, but that arguably the biggest challenge is persuading national policymakers to take a global perspective.
Masahiro Kawai, dean of the Asian Development Bank Institute, and Domenico Lombardi, president of The Oxford Institute for Economic Policy, examine the growing set of regional financial arrangements that help underpin global financial stability.
Also in this issue, we profile Justin Yifu Lin, the World Bank’s first chief economist from an emerging economy, who discusses New Structural Economics as a method for rethinking sustainable development; look at how Myanmar is reintegrating into the global economy; and examine propos-als to broaden taxation of the financial sector in Europe.
Jeremy CliftEditor-in-Chief
multilateralist solutions for a globalized world

2 Finance & Development September 2012
IN BRIEF
Events in 2012September 1–7, Naples, ItalyUnited Nations World Urban Forum
September 8–9, Vladivostok, RussiaAsia-Pacific Economic Cooperation Summit
October 9–14, Tokyo, JapanAnnual Meetings of the IMF and the World Bank
October 16–19, New Delhi, IndiaOECD World Forum on Statistics, Knowledge, and Policies
November 8–9, Washington, D.C. IMF Thirteenth Annual Jacques Polak Research Conference
November 12–14, Dubai, United Arab EmiratesWorld Economic Forum Summit on the Global Agenda 2012
Growing more than GDPStandard measures of economic growth ignore a rapid depletion of natural resources that will seriously harm future generations, according to a new report by the United Nations Environment Programme.
Inclusive Wealth Report 2012 unveils a new indicator—the Inclusive Wealth Index—that looks beyond the traditional yardsticks of GDP and the Human Development Index to include a full range of assets, such as manufactured, human, and natural capital. This index shows govern-ments the true state of their nation’s wealth and the sustainability of its growth, according to the report.
The report looks at changes in inclusive wealth in 20 coun-tries—which together account for almost three-quarters of global GDP—from 1990 to 2008. Over that period, natural resources per capita declined by 33 percent in South Africa, 25 percent in Brazil, 20 percent in the United States, and 17 percent in China. Only Japan did not see a fall in natural capital, due to an increase in forest cover.
Measured by GDP, the economies in China, the United States, Brazil, and South Africa grew by 422 percent, 37 percent, 31 percent, and 24 percent respectively between 1990 and 2008.
However, when their performance is assessed by the new index, the Chinese and Brazilian economies increased by only 45 percent and 18 percent. The U.S. economy grew just 13 percent, while South Africa’s actually decreased by 1 percent.
Trees and bamboo growing in Japan.
Plugging leaksMillions of people in Asia and the Pacific could have access to clean water if leaks were plugged and water utility reforms adopted, says a new study by the Asian Development Bank (ADB).
“While Asia and the Pacific is increasingly facing a major water crisis, we see unaccept-able levels of water being lost through leaks and inefficiencies,” said Bindu Lohani, the ADB’s Vice President for Knowledge Management and Sustainable Development. “By cutting the amount of lost water in half, 150 million people could be supplied with treated water.”
The ADB estimates that 29 billion cubic meters of water—enough to fill more than 11 million Olympic-sized swimming pools—is lost each year in the region, causing Asia’s water utilities to lose more than $9 billion in revenue each year.
Dementia cases set to tripleWorldwide, nearly 35.6 million people live with dementia. This number is expected to double by 2030 to 65.7 million and more than triple by 2050 to 115.4 million according to a new report by the World Health Organization. Dementia affects people in all countries, with more than half (58 percent) living in low- and middle-income countries. By 2050, this is likely to rise to more than 70 percent, predicts Dementia: A Public Health Priority.
Treating and caring for people with dementia cur-rently costs the world more than $604 billion a year. This includes the cost of providing health and social care as well the reduction or loss of income of people with dementia and their caregivers.
Only eight countries worldwide currently have national programs in place to address dementia.

Finance & Development September 2012 3
Ndebele woman with child on mobile phone.
Dismal science?
Listen to our podcastinterviews with top
economic experts and decide: www.imf.org/podcasts
eHealth revolutionA revolution in ehealth—health care practice supported by electronic communi-cation—is taking place in Africa, thanks in large part to the high growth in mobile phone usage there. At 281 million users, Africa is the fastest-growing mobile phone market in the world. Internet use on the continent is still comparatively low, but is set to grow fast.
The growth of ehealth in Africa is cultivating the power of voice, accountability, and good governance in the African health sector, says the African Development Bank. In northern Ghana, for example, the Mobile Midwife Project has been pro-viding women with health information during their pregnancy and encouraging women to seek antenatal care via text or voice messages. The ease of access to this vital information allows women to take control of their own health.
eHealth has become an integral part of the health sector in Africa. Kenya, the birthplace of the revolutionary mobile phone banking system M-PESA, became the first country to develop a national ehealth strategy in 2011.
supporting sustainable transportation
The Inter-American Development Bank—together with the Asian Development Bank, the World Bank, the African Development Bank, and four other organiza-tions—has declared a strong commitment to sustain-able transportation. The eight multilateral development banks pledged in June that they will invest $175 billion to finance more sustainable transportation systems over the next decade, promoting inclusive economic development while also protecting the environment.
Congestion, air pollution, road accidents, and man-aging the effects of climate change on public transport systems can cost 5 percent to 10 percent of GDP a year. The transportation sector is the fastest growing source of greenhouse gases as a result of decades of urban plan-ning that focused on improving mobility for automo-biles at the expense of public transport users, cyclists, and pedestrians. This approach has made life much more difficult for people in cities, especially the urban poor, says the Inter-American Development Bank.
Teenagers on subway in Medellin, Colombia.

4 Finance & Development September 2012
people IN ECONOMICS
the man with the patience to
F&D profiles Justin yifu lin, the first World Bank Chief
Economist from a developing or emerging economy
cook a stone
4 Finance & Development September 2012
AT A RECEPTION earlier this year to mark the end of Justin Yifu Lin’s tenure
as chief economist of the World Bank, as is customary on such occasions,
there was mention of a lifetime of achievements: Justin Lin, the first Chinese of his generation to receive a Ph.D. from the University of Chicago; Justin Lin, the second private citizen to own a car in Beijing; Justin Lin, the first person from a developing country or emerging market to serve as World Bank chief economist.
Alongside these milestones were tributes to his most defining quali-ties: his determination, his flexibil-ity, his pragmatism. Most memo-rably, one of his colleagues said, drawing on an African proverb, Lin had patience that could cook a stone.

Finance & Development September 2012 5
If ever a person qualified for the description of “right man, right place, right time,” Lin is that man. His qualifications include his arrival in mainland China just as—fortuitously for him—the Communist Party was launching a series of his-toric market reforms. Then, a serendipitous pairing of Lin’s English language skills with a visiting Nobel Prize–winning economist in need of a translator ended with Lin’s nomina-tion for a scholarship to pursue a Ph.D. at the University of Chicago. And in June 2008, just before the world headed into the worst recession in over half a century, amid increas-ing clamor for emerging and developing countries to have a greater say in the running of the World Bank, Lin was selected its chief economist—the first person from a devel-oping country to hold the post. The tide of history has been generous to the 60-year-old Lin.
rethinking development Fast-forward four years, and Lin is preparing to return to
China after his sojourn in Washington, D.C., home of the World Bank, of which he was also a senior vice president. This intensely private, bespectacled economist contemplates the latest stage of his eventful career with a sense of quiet sat-isfaction. The Bank gave Lin a global platform to push his framework for rethinking development—or, as he terms it, New Structural Economics (see box).
“I opened the door for people to think, for my colleagues to think, to debate,” he says.
Lin, an expert on China’s economy, views himself as semi-detached from the Western-based policymaking circles that have historically dominated development economics. As World Bank chief economist, Lin followed in the footsteps of luminaries such as former U.S. Treasury Secretary Lawrence Summers and Nobel Prize winner Joseph Stiglitz. But his the-ories are a deliberate and sharp critique of the Washington Consensus, the broad range of “neoliberal” policies previ-ously closely associated with Washington D.C. institutions, including the IMF, the U.S. Treasury, and the World Bank. When asked to confirm whether he was indeed the first World Bank chief economist from a developing country, Lin responds, “Not only the first from a developing country, but also [the first] to have a good understanding of developing countries.”
According to Célestin Monga, Lin’s coauthor and World Bank colleague, Lin is “the one guy in the history of all the chief economists at the World Bank who has actually been part of the lifting out of poverty of 600 million people. Do you need anything else?”
Stiglitz says Lin played a major role in marrying the les-sons of growth in east Asia, the fastest-growing region of the world, with development economics.
model army officerLin’s modest background—he was born one of six chil-
dren into a poor family in Yilan County, northeastern Taiwan Province of China, in 1952—may distinguish him from his predecessors, but undoubtedly he is the only World Bank chief economist with an arrest warrant hanging over his head.
In 1979, the 26-year-old, who then went by the name Lin Zhengyi, a model officer in the Taiwanese army stationed on the politically sensitive island of Kinmen, decided to swim across the 2,000-meter tidal strait to the Communist-controlled mainland to start a new life.
Following his disappearance, the Taiwanese authorities who declared him “missing” compensated his wife with the equivalent of more than $30,000; much later, they charged him with desertion.
Ask Lin about his decision today and the economist bats away further inquiries—the only time during the whole interview his ever-present smile freezes and he betrays a hint of irritation. Lin left behind his three-year-old son and wife, Chen Yunying, who was then pregnant with their daughter. Asked about his wife’s reaction to his defection, Lin says,
“She supported me. As long as I am happy, she is happy.”“So did you tell your wife you were going to leave?”“I implied that.”
transforming chinaWhen he arrived on the mainland, Lin changed his name
to Lin Yifu, meaning “a persistent man.” Unable to contact his family directly, Lin sent a letter to a cousin in Tokyo describ-ing his loneliness and longing for his wife and children. Alongside prosaic domestic details—including a request that his cousin send Christmas presents on his behalf to his family using Lin’s secret nickname—are descriptions of a China at a
What is new structural economics?New Structural Economics is the application of neoclassi-
cal economics to study how economic structures impact the process of development.
Justin Lin argues that a country’s industrial makeup is the product of its intrinsic strengths and advantages determined by its “factor endowments,” including its workforce, natural resources, or human and physical capital. In Lin’s parlance, “the economic structure of an economy is endogenous to its factor endowment structure.”
To best promote development, Lin advises a country to focus on sectors in which it has comparative advantage (that is, what it can do relatively well) based on what it has now (that is, the endowments it owns). This way the country will be most competitive, enjoy the largest returns to invest-ment, save the most, and pave the foundation to upgrade to more capital-intensive industries in the quickest way. Success breeds success, suggests Lin.
In Lin’s framework, as in standard economics, a competi-tive market holds the key role in resource allocation, while the state is tasked with helping firms with the process of industrial upgrading by resolving externality and coordination issues. But the critical twist in Lin’s New Structural Economics is that it also advocates using government’s limited resources strategi-cally by targeting support for specific industries in which they are likely to have comparative advantage. This enables coun-tries to take off economically more quickly.

6 Finance & Development September 2012
critical juncture in its development as it sought to transform itself from a centrally planned to a market economy:
“Now, China is examining the 30 years since the founding of the People’s Republic in a serious and honest manner—and trying to learn from its mistakes—in order to build a mod-ernized China. Ever since the Gang of Four was overthrown, the entire mainland has been advancing by leaps and bounds; people are full of aspiration and confidence. I strongly believe that China’s future is bright; one can be proud to be Chinese, standing in the world with one’s head held high and chest out,” he wrote.
China and other countries—most notably in Asia—that have made the leap from underdevelopment and widespread poverty are core exemplars of Lin’s thesis of development. In his New Structural Economics, Lin argues a prescription for underdeveloped countries that could crudely be summarized as “make the best of what you’ve got.”
A key tenet of his “new framework for development” is the critical role of government in supporting selected industries in order to trigger structural transformation. This practice, often colloquially referred to as “picking winners and losers,” or industrial policy, has had a checkered history, but in the aftermath of the financial crisis has been enjoying something of a revival.
The leading criticism remains that the government’s imperfect judgment and distorted interests displace the cold, clear decisions of the market. For example, Japan’s much-lauded Ministry of Trade and Industry once opposed the plans of domestic car manufacturers to export and tried to prevent Honda expanding from motorbikes into cars because it did not want another company in the industry.
To avoid such mistakes, the secret of success, suggests Lin, is identifying industries appropriate for a given country’s endowment structure and level of development. He points to Chile, for example, which moved from basic industries such as mining, forestry, fishing, and agriculture, to aluminum smelt-ing, salmon farming, and winemaking, with the backing of the government. Lin says, in the past, industrial policy often failed because government tried to impose the development of industries that were ill-suited to the country’s endowment. That is, they “defied” their comparative advantage.
Lin’s choice of New Structural Economics as the appel-lation for his theoretical framework has resonances of Structuralist economics—referred to by Lin as the first wave of development thinking—which emerged in Latin America in the 1940s, with its support for government intervention to
promote development. But the World Bank’s regional chief economist for Africa, Shantayanan Devarajan, believes the intellectual origins of Lin’s New Structural Economics lie closer to home, and in the more recent past.
Earlier this year, at a seminar to mark the launch of Lin’s new book outlining his thesis, Devarajan opened the pro-ceedings with the provocative salvo: “When I saw the title New Structural Economics, I was reminded of what Voltaire said about the Holy Roman Empire. ‘That it was neither Holy, nor Roman, nor an empire.’ So I am going to challenge Justin to convince us that this is new, that this is structural, that it is economic.”
Devarajan is skeptical about the originality of Lin’s thesis, which, he says, is “the quintessential application of neoclas-sical economics to development. Because neoclassical eco-nomics says markets should operate unless there is a market failure, like an externality. If there is an externality, then gov-ernment should intervene to fix that externality.”
Lin acknowledges a debt to neoclassical economics while maintaining that the critical and large role given to gov-ernment makes his theory distinctive. If the Washington Consensus is the second wave of development thinking, he regards his approach as the third, or “Development Thinking 3.0.” His work “challenged economic convention,” said Uri Dadush, a senior associate at the Carnegie Endowment for International Peace.
A new book by Lin, The Quest for Prosperity, explains new structural economics and reflects lessons learned from four years at the World Bank. By following this framework, Lin shows how even the poorest nations can grow rapidly for sev-eral decades, significantly reduce poverty, and become mid-dle- or even high-income countries in the span of one or two generations. “Lin dares to envision the end of world poverty,” says Nobel laureate George Akerlof.
the problem of comparative advantageSome of Lin’s precepts appear deceptively intuitive. It
might seem obvious that countries should play to their strengths. But would Lin, given his directive that countries focus on their underlying comparative advantage, have recommended that Korea create a ship-building industry in the 1970s considering the country’s limited domestic supply of raw materials such as iron, coal, and steel, and the lack of any knowledge of the sector? Some other econ-omists doubt it. And yet that was Korea’s successful recipe for development.
“Given the nature of the process of factor accumulation and technological capability-building, it is simply not possible for a backward economy to accumulate capabilities in new indus-tries without defying comparative advantage and actually entering the industry before it has the ‘right’ factor endow-ments,” says Cambridge University professor Ha-Joon Chang.
The strong imprint of neoclassical economics in Lin’s framework is perhaps unsurprising: he trained at the University of Chicago. His admission to the citadel of free-market thinking was another example of the happy good fortune that has periodically blessed his existence.
Lin played a major role in marrying the lessons of growth in east Asia with development economics, says Stiglitz.

Finance & Development September 2012 7
Within a year of his arrival in China, by dint of his English language skills learned in Taiwan, Lin was recruited as a translator for visiting economist Theodore Schultz. Schultz had, that year, been awarded the Nobel Prize for economics for his pioneering research into the problems faced by developing countries.
So impressed was Schultz with his young interpreter—who was by then studying Marxist economics at Peking University—that on his return to his teaching post at the University of Chicago, Schultz offered to arrange a scholar-ship for the young Lin.
How long did Lin spend with the top economist to have elicited such a generous offer? Just one day, “but I was a very impressive translator,” says Lin. His smile does not waver. Schultz had a reputation for intuitively identifying young talents, having mentored Nobel laureate George Stigler and a former president of the American Economic Association, D. Gale Johnson, for example.
Once enrolled at Chicago, the young Lin embarked on a Ph.D. in economics. He was later joined by his wife, Chen Yunying, and two children. While Lin studied for his Ph.D., and then went on to Yale as a postdoctoral student, his wife earned a Ph.D. at George Washington University.
prolific careerWhen Lin and his family returned to Beijing in 1987,
China was in the throes of an economic revolution, trans-forming itself from a centrally planned to a “socialist market economy.” Against the backdrop of state-owned enterprises being carved into smaller private businesses, the decol-lectivization of agriculture, and the creation of special eco-nomic zones, Lin embarked on a prolific career. Even before he joined the World Bank, he had authored 18 books and numerous papers.
In 1994 Lin helped found the China Center for Economic Research (CCER) at Peking University, set up to attract foreign-educated Chinese brains at a time when the country was thirsting for knowledge about how to harness its eco-nomic potential. The center became increasingly influential in the shaping of Chinese economic policy.
lead economistLin’s chief economist and senior vice president position
at the World Bank—he was selected by the organization’s President Robert Zoellick—meant he was chief economic advisor to the World Bank president, spokesperson for the Bank’s development policies, and head of the Bank’s research, prospects (global monitoring and projections), and data departments. In that role, he led almost 300 economists, stat-isticians and researchers tasked with reducing poverty and promoting global development.
He earned a reputation as a hard worker and canny operator. “He always has his game face on,” said one col-league, Monga, who accompanied Lin on many business trips. He described how Lin, rather than socializing after a day’s work would labor long into the night. “Justin was all about work,” he said.
Inevitably, the experience of serving as chief economist was not without its challenges. Lin encountered internal dissent about his views, often with strong opposing opin-ions coming from within the research department that he supervised. Lin says he listened to disagreement, but some staff at the Bank say he largely sidestepped them. “He didn’t try to shape it or mold it any which way; he just separated himself. And I think that was less productive than it could have been,” said one high-level economist at the Bank.
To ensure that his work on development economics made a mark on the Bank, Lin set up a research team to work on industrialization in Africa, which he sees as ripe for growth. As emerging markets such as China, India, and Brazil move up the industrial ladder and “graduate” from low-skilled manufacturing sectors, he argues, it will open up opportuni-ties for low-income countries in Africa and elsewhere to get into those sectors. “This will free up a gigantic reservoir of employment possibilities that African and other low-income countries can tap into,” Lin said. But African countries need to plan for this handover.
Hassan Taha, an executive director at the Bank who repre-sents 21 African countries, says Lin “encouraged an evolution in thinking” that helped developing countries better tackle the challenge of poverty reduction.
return to beijingLin has now returned to Beijing to resume teaching at the
CCER. While grateful for the opportunities that his posi-tion as chief economist offered him, Lin said he was eager to return to China after getting a bird’s-eye view of global devel-opment from Washington. His personal and professional love of China would preclude any long-term separation.
Perhaps only one place continues to be an elusive attrac-tion. At a seminar organized by the Center for Global Development in Washington just weeks before the end of his stay in the U.S. capital, Lin revealed he still harbored a “dream” to return to Taiwan Province of China to pay trib-ute to his ancestors and meet relatives and friends.
In 2002, following the death of his father, Lin applied to return for the funeral. The authorities approved his applica-tion, but the army issued an order for his arrest for deser-tion—an order that has yet to be lifted. Consequently, Lin was represented by his wife at his father’s funeral—a serious shortcoming for an Asian son.
Lin maintains that the island will eventually be reunited with the mainland.
So far, appeals by his supporters to have his arrest warrant lifted have fallen on deaf ears. Earlier this year, in answer to a parliamentary question, Taiwan’s Defense Minister, Kao Hua-chu, who was Lin’s battalion com-mander and a close friend, told the legislature’s Foreign and National Defense Committee that he would resign in protest if Lin did not face the charge upon returning. In response, Lin said he can wait.
Lin’s legendary patience is set to be tested for a while longer. ■

8 Finance & Development September 2012
the Global village
Kishore Mahbubani
8 Finance & Development September 2012
QUIETLY, without much fanfare, humanity passed a significant milestone. Today, there are more phones than people. This does not mean every human being has a phone. Some have two
or three. In 1990, only 11 million people had cell phones. In 2011, the number of cell phones worldwide was 5.6 billion, while the number of landline phones stood at 1.32 billion—as the global population approached 7 billion. And we can call almost any part of the world at almost no cost through Internet services such as Skype. This level of teledensity means that people have become interconnected at a level never seen before in history.
Technology is generating global convergence. This global explosion of cell phones, and soon of smartphones, will take the Internet, and the information it conveys, to all corners of the globe. A small solar-powered battery and a tiny computer have already done this for remote African and Indian villages. This “big bang” of informa-tion—and education as well—is also improving human lives. As more people learned about vaccinations, the pro-portion of the world’s infants vaccinated against diphthe-ria, pertussis, and tetanus—via the DPT shot—climbed from one-fifth to nearly four-fifths between 1970 and
2006. And other ideas that save lives—such as washing one’s hands, or not defecating in the fields one eats from—have made their way around the world and are increas-ingly accepted (Kenny, 2011). Connectivity saves lives.
Technology also allows people to cross borders in greater numbers. In 1950, barely 25 million people trav-eled internationally; by 2020, that figure is expected to reach 1.6 billion. In short, 1 in 5 inhabitants of Planet Earth will cross an international boundary—a previously unthinkable level of connection.
Yet technology is only one of the forces driving this deep interconnectivity. Over time, we have also created a single global economy. Hence, when the tiny Greek economy threatens to fail, the whole world trembles—this Greek domino can now bring down dominoes as large as the U.S. and Chinese economies. Stock markets around the world rise and fall in unison when a major global event erupts. And global supply chains mean that when one country is hit by a natural disaster, factories across the ocean suffer consequences too. We live in one economic world.
Global warming also drives home the message of a shrinking world. Almost daily we see evidence, such as the Arctic thaw and freak weather patterns, that climate
Finance & Development September 2012 9Finance & Development September 2012 9
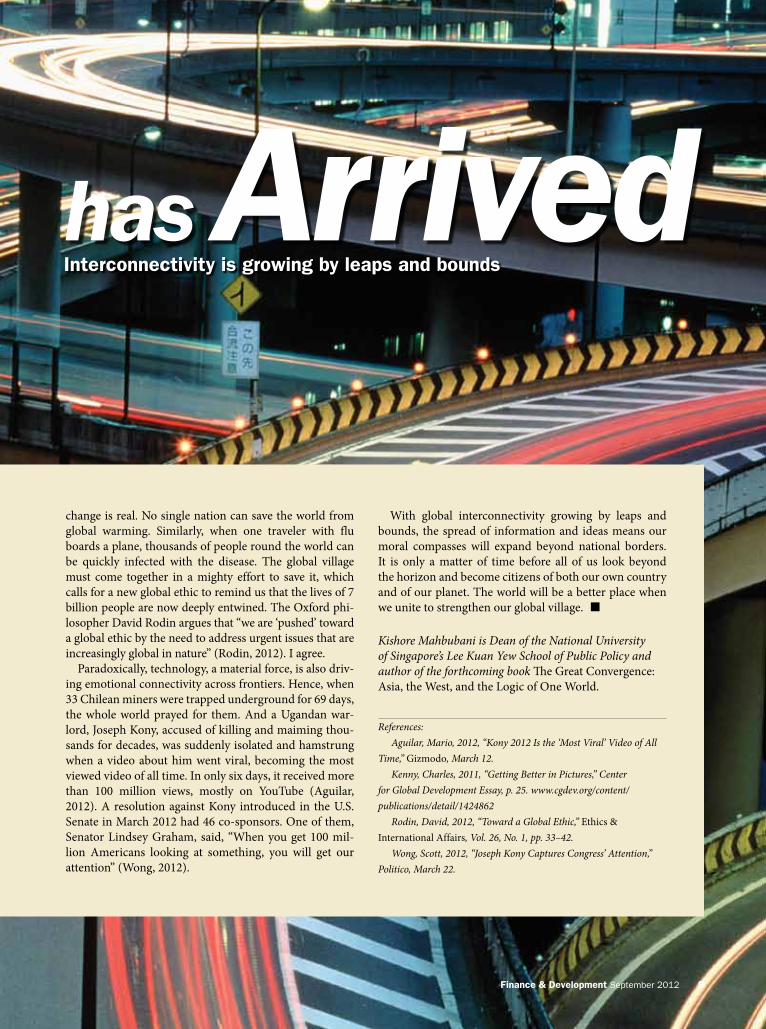
interconnectivity is growing by leaps and bounds
change is real. No single nation can save the world from global warming. Similarly, when one traveler with flu boards a plane, thousands of people round the world can be quickly infected with the disease. The global village must come together in a mighty effort to save it, which calls for a new global ethic to remind us that the lives of 7 billion people are now deeply entwined. The Oxford phi-losopher David Rodin argues that “we are ‘pushed’ toward a global ethic by the need to address urgent issues that are increasingly global in nature” (Rodin, 2012). I agree.
Paradoxically, technology, a material force, is also driv-ing emotional connectivity across frontiers. Hence, when 33 Chilean miners were trapped underground for 69 days, the whole world prayed for them. And a Ugandan war-lord, Joseph Kony, accused of killing and maiming thou-sands for decades, was suddenly isolated and hamstrung when a video about him went viral, becoming the most viewed video of all time. In only six days, it received more than 100 million views, mostly on YouTube (Aguilar, 2012). A resolution against Kony introduced in the U.S. Senate in March 2012 had 46 co-sponsors. One of them, Senator Lindsey Graham, said, “When you get 100 mil-lion Americans looking at something, you will get our attention” (Wong, 2012).
With global interconnectivity growing by leaps and bounds, the spread of information and ideas means our moral compasses will expand beyond national borders. It is only a matter of time before all of us look beyond the horizon and become citizens of both our own country and of our planet. The world will be a better place when we unite to strengthen our global village. ■Kishore Mahbubani is Dean of the National University of Singapore’s Lee Kuan Yew School of Public Policy and author of the forthcoming book The Great Convergence: Asia, the West, and the Logic of One World.
References:Aguilar, Mario, 2012, “Kony 2012 Is the ‘Most Viral’ Video of All
Time,” Gizmodo, March 12. Kenny, Charles, 2011, “Getting Better in Pictures,” Center
for Global Development Essay, p. 25. www.cgdev.org/content/publications/detail/1424862
Rodin, David, 2012, “Toward a Global Ethic,” Ethics & International Affairs, Vol. 26, No. 1, pp. 33–42.
Wong, Scott, 2012, “Joseph Kony Captures Congress’ Attention,” Politico, March 22.
has Arrived

10 Finance & Development September 2012
WORLD ECONOMY
Convergence,
Growth in emerging market and developing economies is less dependent on advanced economies over the long run, but in the short run they dance together
Kemal Dervis
and Divergence
10 Finance & Development September 2012
Interdependence,
MOST feel that we live in an integrated globalized world. But when looking at recent history, what can one really say about the nature of this integration? It seems there are three fundamental trends at work that today characterize the world economy.

Finance & Development September 2012 11
three fundamental trendsThe first trend is a new convergence. In his 1979 Nobel Prize lecture, the late development economist Sir Arthur Lewis said, “For the past hundred years the rate of growth of output in the developing world has depended on the rate of growth of output in the developed world. When the devel-oped world grows fast, the developing world grows fast, when the developed slow down, the developing slow down. Is this linkage inevitable?”
Recent data suggest that while there remains linkage, it is now important to distinguish between long-term trends and cyclical movements. Since roughly 1990 the pace of per cap-ita income growth in emerging and developing economies has accelerated in a sustainable manner and is substantially above that in advanced economies. This represents a major structural shift in the dynamics of the world economy.
A second fundamental feature in the world economy is cyclical interdependence. Although emerging and develop-ing economies’ long-term trend growth rates have delinked—or “decoupled”—from those of advanced economies over the past 20 years, this has not led cyclical movements around the trend to delink.
New convergence and strengthened interdependence coin-cide with a third trend, relating to income distribution. In many countries the distribution of income has become more unequal, and the top earners’ share of income in particular has risen dramatically. In the United States the share of the top 1 percent has close to tripled over the past three decades, now accounting for about 20 percent of total U.S. income (Alvaredo and others, 2012). At the same time, while the new convergence mentioned above has reduced the distance between advanced and developing economies when they are taken as two aggregates, there are still millions of people in some of the poorest countries whose incomes have remained
almost stagnant for more than a century (see “More or Less,” F&D, September 2011). These two facts have resulted in increased divergence between the richest people in the world and the very poorest, despite the broad convergence of average incomes.
new convergenceThe world economy entered a new age of convergence around 1990, when average per capita incomes in emerging market and developing economies taken as a whole began to grow much faster than in advanced economies. The sharp divi-sion between rich and poor countries that characterized the world since the industrial revolution in the early part of the 19th century is now weakening. A key question is whether this new convergence is likely to continue and lead to a fun-damental restructuring of the world economy over the next decade or so.
The industrial revolution and colonialism brought about great divergence (Maddison, 2007). Between the beginning of the 19th century and the middle of the 20th, the average per capita income gap between the richer, more industrial “North” and the less developed “South” rose from a factor of 3 or 4 to a factor of 20 or more (Milanovic, 2012). This diver-gence slowed after World War II, with the end of colonial-ism, but the relative income gap remained stable on average between 1950 and 1990.
For the past two decades, however, per capita income in emerging and developing economies taken as a whole has grown almost three times as fast as in advanced economies, despite the 1997–98 Asian crisis. Growth in emerging markets sped up in the 1990s, followed by an acceleration in the less developed countries around the turn of the century (see Chart 1).
Chart 2 shows the underlying trend growth rates calcu-lated using a statistical technique, the Hodrick-Prescott filter,
Dervis, 7/31/2012
Source: Author’s calculations based on data from the IMF’s April 2012 World Economic Outlook.
1981 83 85 87 89 91 93 95 97 99 2001 03 05 07 09 11 13 15
Emerging
Advanced
Developing
–2
–1
0
1
2
3
4
5
6 Proj.
Chart 2
Sustained differenceEmerging and developing economies are enjoying much faster long-run trend growth than advanced economies, especially since the turn of the century.(per capita trend growth rate, percent)
Dervis, 7/11/12
1981 83 85 87 89 91 93 95 97 99 2001 03 05 07 09 11 13 15
Chart 1
Growth and cyclesAdvanced, emerging, and developing economies have experienced signi�cant growth but also strong cyclical movements over the past three decades.(per capita GDP growth rate, percent)
Source: IMF, World Economic Outlook, April 2012.
Emerging Proj.
Advanced
Developing
–6
–4
–2
0
2
4
6
8
and Divergence

12 Finance & Development September 2012
to separate cyclical movement from the longer-term trend. The delinking of the trend growth rate of emerging market countries from the 1990s onward, and that of developing countries in the past decade, is quite striking.
Three developments explain much of this new convergence. First, globalization—through strengthened trade links and
rising foreign direct investment—facilitates catch-up growth as latecomers import and adapt know-how and technology. It is much easier to adapt technology than to invent it.
Second, the demographic transition of most emerging and many developing economies that accompanied slower popu-lation growth supported greater capital intensity and faster per capita growth. At the same time, many of these countries enjoyed a golden age as the ratio of the economically active to the total population peaked. Meanwhile, the share of the aged increased significantly in the advanced economies, particu-larly in Europe and Japan.
A third significant cause of convergence is the higher proportion of income invested by emerging and developing countries—27.0 percent of GDP over the past decade com-pared with 20.5 percent in advanced economies. Not only does investment increase the productivity of labor by giving it more capital to work with, it can also increase total factor productivity—the joint productivity of capital and labor—by incorporating new knowledge and production techniques and facilitate transition from low-productivity sectors such as agriculture to high-productivity sectors such as manufac-turing, which accelerates catch-up growth. This third factor, higher investment rates, is particularly relevant in Asia—most noticeably, but not only, in China. Asian trend growth rates increased earlier and to a greater extent than those of other emerging economies.
Will this convergence continue? Projections are always risky, and some of the factors that led to convergence in the
past 20 years may soon lose strength. A good part of the catch-up growth in manufacturing has already taken place, and the reallocation of labor from low- to high-productiv-ity sectors has also exhausted some of its potential; in some countries even rapid manufacturing growth has not gener-ated much employment, leading to a greater labor share in low-productivity activities (Rodrik, 2011).
But the convergence we are referring to is the aggregate con-vergence of the emerging and developing world as opposed to an analysis where very small countries get equal weight with China, India, or Indonesia. In the aggregate, at least for the next 10 to 15 years, there is substantial potential for more catch-up growth. Labor reallocation from low- to high-pro-ductivity sectors may slow down, but its reallocation from low- to high-productivity firms within even narrowly defined subsectors is likely to continue at a solid pace. The service, energy, and infrastructure sectors may also have substantial potential for the adaptation of new technology. And with the notable exception of China, demographics will favor emerg-ing and developing economies over the “old” rich countries for more than a decade to come. Finally, the very high debt ratios that most advanced economies have accumulated will constrain their macroeconomic policies and slow investment.
This continued, if perhaps somewhat slower, convergence will profoundly transform the world economy. By 2025–30 many emerging market economies’ per capita incomes will be much closer to those of the advanced economies, reflect-ing both growth differentials and the likely real appreciation of their currencies. The economy of China will no doubt become the largest in the world, and the economies of Brazil and India will be much larger than those of the United Kingdom or France.
The rather stark division of the world into “advanced” and “poor” economies that began with the industrial revolution will end, ceding to a much more differentiated and multipo-lar world economy.
cyclical interdependenceThere was a time, particularly at the beginning of the finan-cial crisis in late 2007 and early 2008, when it seemed the emerging markets and Asia in particular would grow rapidly regardless of what happened in the United States and Europe. Then came the panic of late 2008, after the collapse of the investment banking firm Lehman Brothers. The marked worldwide slowdown, even in China, sparked concern that the crisis that started on Wall Street could lead to a collapse of growth in the emerging and developing world.
There was indeed a worldwide slowdown in 2009, with per capita growth in the emerging markets and developing econ-omies slowing to less than 1 percent and a decline of nearly 4 percent in advanced economies. But the former recovered quickly, with a growth rate of 6 percent in 2010 compared with 2.3 percent for advanced economies. The resilience of the former group during the crisis led to renewed claims of divergent fortunes.
Chart 2 shows the divergence in the trends of growth rates of the two groups: per capita GDP of the former grew two to
Dervis, 7/31/12
1981 84 87 1990 93 96 99 2002 05 08 11 14 projections
Chart 3
Cyclical interdependenceDespite the delinking of long-run growth trends, there remains a strong cyclical link between advanced economies and developing economies.(per capita growth rate, percent)
Source: Author’s calculations based on data from the IMF’s April 2012 World Economic Outlook.
AdvancedAll emerging and developing
–5
–4
–3
–2
–1
0
1
2
3 Proj.

Finance & Development September 2012 13
three times as fast as in advanced economies and will likely continue. Chart 3 shows that there was no such divergence in the cycles around the trend. Particularly since the Asian crisis of 1997–98, there has been cyclical interdependence that, if anything, may have become stronger (Kose and Prasad, 2010; IMF, 2010). Interdependence has also become more com-plex, with stronger linkages among developing economies. Upturns and downturns in large raw material importers such as China have an immediate impact on many developing countries’ raw material exports.
The world economy remains one of interdependence, where countries’ business cycles travel across borders. Emerging and developing economies are growing much faster than advanced economies, mainly thanks to supply-
side factors such as long-term capital accumulation, techno-logical catch-up, and demographics. But cyclical movements around trends, linked more to shorter-term demand-side factors, are likely to be strongly correlated. The recent global growth declines in early 2012, due much more to macro-economic and financial sector management issues than to long-term supply-side factors, vividly reflect this worldwide interdependence.
There appear to be three main channels of cyclical interdependence.
The first is trade. As the share of trade in global economic activity has increased, the changes in demand in one country resulting from macroeconomic developments in another can be expected to increase. The effect of a recession in one country, for example, spreads across borders by reducing the demand for exports from other countries. In theory, if greater specializa-tion in production is encouraged by trade, sector-specific shocks will tend to reduce cyclical interdependence. But in practice the macroeconomic demand effects are much more significant.
The second channel works through increasingly global, huge, and complex financial markets. A new IMF report measures “spillover effects”—the impact of policies in one country on another as a result of the large volume of trade and financial linkages in today’s economy—and documents the importance of the financial channel. Using the euro area as an example, the report concludes that “direct (trade-linked) spillovers from stress in the euro area program coun-tries are manageable, but if the stress were to cast doubt on the soundness of euro area banks, the spillovers to the rest of the world would be large—in many cases as large as after Lehman” (IMF, 2011). The report also finds that under stress-ful financial conditions—for example from an asset price
bubble collapse or overleveraged banks—the correlation with long-term bond yields is much higher, which suggests that the strength of the financial channel depends on the overall situation in world financial markets. And changes in the term structure of interest rates—reflecting similarities in mone-tary policies and financial market conditions—can also influ-ence business cycle comovement through the profitability of financial institutions and credit conditions (Claessens, Kose, and Terrones, 2011).
Finally it appears that there is a third channel of inter-dependence—perhaps closely linked to the second, but less tangible—in the form of worldwide propagation of con-fidence, or “animal spirits,” that significantly influences financial markets and investment decisions. News about the
U.S. subprime crisis seems to have directly affected credit default swap spreads in emerging markets simply through a spread of “sentiment” (Dooley and Hutchinson, 2009).
For all these reasons, the delinking of long-term growth trends and continued correlation in cyclical movements coexist, with global and regional factors weaving the world economy into an interdependent whole.
Divergence in distributionIn addition to broad convergence of per capita incomes and cyclical interdependence in economic activities across bor-ders, higher inequality within countries and a wider gap between the world’s richest and poorest citizens appears to be spawning divergence between top and bottom incomes, an emerging third fundamental trend. Income has become concentrated at the very top in many countries. Added to this within-country evolution of income distribution is the absence of per capita income growth in a group of very poor countries unable to participate in the broad convergence described above.
Certainly, convergence resulting from the rapid catch-up growth affecting a large majority in the emerging and devel-oping countries is giving rise to a rapidly growing global middle class. However, a variety of factors—including the nature of technological change, the increased skill premium, the huge expansion of the global market and the associated winner-take-all characteristics of many markets, the mobil-ity of capital in contrast to the relative immobility of labor, particularly unskilled labor, and a declining influence of unions—have all led to increased income concentration at the very top in many of the largest countries, advanced as well as emerging and developing.
By 2025–30 many emerging market economies’ per capita incomes will be much closer to those of the advanced economies, reflecting both growth differentials and the likely real appreciation of their currencies.

14 Finance & Development September 2012
Meanwhile in some very poor countries, many of them experiencing conflict and government failure, hundreds of millions of people have real incomes that are not much higher than they were 200 years ago (Milanovic, 2012). In that sense, there is a huge new divergence in the world econ-omy, with both global and within-country dimensions. The distance between the extremes of the income distribution of the world as a whole has increased.
Within many countries the dramatic divergence between the top 1 percent and the rest is a new reality. The increased share of the top 1 percent is clear in the United States and in some English-speaking countries and, to a lesser degree, in China and India. But it is not clear from the available data whether this new hyperconcentration at the top is a truly global phe-nomenon. The World Top Incomes Database (Alvaredo and others, 2012) shows that, at least until 2007, continental Europe and Japan did not experience the same shift of incomes to the top of the income distribution. But because the causes of the concentration are largely global and can be counteracted only partially by national policies, it is likely that this top-heavy concentration will only increase. Top executive pay in coun-tries such as Germany and the Netherlands, for example, was already increasing very rapidly during the past decade (Fabbri and Marin, 2012). And the euro area crisis and its accompa-nying austerity policies will likely lead to further inequality in Europe as budget constraints curtail social expenditures while the mobility of capital and the highly skilled make it difficult to effectively increase taxes on the wealthiest.
This new divergence in income distribution may not always imply greater national inequality in all parts of a national distribution. It does, however, represent a concentration of income and, through income, of potential political influence at the very top, which may spur ever greater concentration of income. The factors—technological, fiscal, financial, and polit-ical—that led to this dynamic are still at work.
Cooperation for a more integrated world economyThe future of the world economy will depend largely on the interaction between the rise of many large emerging and developing economies, the increasing interdependence across countries, and the widening gap between the top and bottom tails of the distribution of income, both within coun-tries and for the world population as a whole. These trends have political, social, and geostrategic implications that will shape future policy debate.
For one, the increasing importance of emerging and develop-ing economies must be reflected in the governance of interna-tional institutions, whose legitimacy and effectiveness depend on it. Global interdependence calls for stronger cooperation
within an institutional setup that reflects the growing weight of emerging and developing economies. Second, the world-wide business cycle described above and the spillover effects, documented recently by the IMF, call for coordinated macro-economic policy. Finally, the potentially destabilizing trends in income distribution require similar international policy coordi-nation, without which single-country redistributive policies will be difficult to implement. To some degree at least, tax bases and tax rates must be harmonized, opportunities for tax avoidance minimized, and migration policies managed with both host and source countries’ interests in mind. Finally, assistance to the poorest countries remains an ethical as well as political necessity.
The world of the future will be ever more multipolar and interdependent, with global markets offering the potential for rapid economic progress. Whether this potential can be realized may depend largely on how well international coop-eration improves both the effectiveness of national mac-roeconomic policies, by taking into account their spillover effects, and how much it encourages greater balance and equity in the distribution of the fruits of growth. ■Kemal DerviŞ is Vice President and Director of Global Economy and Development at the Brookings Institution.
References:Alvaredo, Facundo, Tony Atkinson, Thomas Piketty, and Emmanuel
Saez, “The World Top Incomes Database,” accessed June 1, 2012. http://g-mond.parisschoolofeconomics.eu/topincomes
Claessens, Stijn, M. Ayhan Kose, and Marco Terrones, 2011, “How Do Business and Financial Cycles Interact?” IMF Working Paper 11/88 (Washington: International Monetary Fund).
Dooley, Michael, and Michael Hutchinson, 2009, “Transmission of the U.S. Subprime Crisis to Emerging Markets: Evidence on the Decoupling-Recoupling Hypothesis,” paper prepared for the JIMF/Warwick Conference, April 6.
Fabbri, Francesca, and Dalia Marin, 2012, “What Explains the Rise in CEO Pay in Germany?” CESifo Working Paper Series No. 3757 (Munich: CESifo Group).
International Monetary Fund (IMF), 2010, World Economic Outlook (Washington, October).
———, 2011, “Consolidated Spillover Report: Implications from the Analysis of the Systemic-5” (Washington).
Kose, M. Ayhan, and Eswar S. Prasad, 2010, Emerging Markets: Resilience and Growth amid Global Turmoil (Washington: Brookings Institution Press).
Lewis, Arthur, 1979, “The Slowing Down of the Engine of Growth,” Nobel Prize lecture, Stockholm, December 8. www.nobelprize.org/nobel_prizes/economics/laureates/1979/lewis-lecture.html
Maddison, Angus, 2007, Contours of the World Economy, 1–2030AD (Oxford, United Kingdom: Oxford University Press).
Milanovic, Branko, 2012, “Global Inequality: From Class to Location, from Proletarians to Migrants,” Global Policy, Vol. 3, No. 2, pp. 125–34.
Rodrik, Dani, 2011, “The Future of Economic Convergence,” paper prepared for the 2011 Jackson Hole Symposium of the Federal Reserve Bank of Kansas City, August 25–27.
The world of the future will be ever more multipolar and interdependent.

Finance & Development September 2012 15
ANDREW Haldane, Executive Director for Finan-cial Stability of the Bank of England, once com-pared the collapse of the investment banking firm Lehman Brothers in late 2008 to a virus outbreak.
Fear that Lehman’s demise would spread caused wide-spread panic that led to a freeze in borrowing and lending in a number of financial markets—much like the fear of a virus might lead people to avoid contact with one another. The effects of Lehman’s fall were difficult to isolate. In fact, the reach and macroeconomic costs associated with Lehman’s demise were much larger than one could have anticipated based on the size of the initial event alone (Haldane, 2009).
It is not clear what enables relatively small shocks, such as Lehman’s demise, to reverberate through the larger economy and why such shocks are often difficult to isolate. The answer seems to lie with the complexity of the financial connections among agents, institutions, and countries. When unexpected bad events occur (negative shocks, in economic parlance), uncertainty sets in and disrupts economic activity. The fail-ure of Lehman, which many believe sparked the global finan-cial crisis, suggests that some institutions are so central to the financial system that their failure can be catastrophic. Similarly, some countries are so integrated into the global financial system that a negative shock there can reverberate through the entire global economy.
Commentators coined the term “too interconnected to fail” to identify players (financial institutions and countries) that are so caught in the web that they pose a systemic risk—that is, their failure would threaten the stability of the entire financial system. Several years into the crisis, it has become clear that to safeguard financial stability, it is important to understand how interconnectedness can be defined and measured and how it relates to the concept of systemic risk. A methodology that can help do this is network analysis, which is used in epidemiology to investigate the spread of diseases.
Network analysis looks at the financial system as a set of players connected with one another through financial
contracts (see box). For example, the interbank market is a network of banks that lend to each other on a short-term, often overnight, basis. At every point in time, the banks in the network have exposure to each other represented by the total claims or liabilities accumulated through lending and borrowing. There are a number of ways that a bank becomes more important, or central, in the network. It can have bor-rowing and lending relationships with a large number of banks. It can have claims on other important banks. It can
network analysis looks at financial connections in a globalized world and the risks they pose
Camelia Minoiu
aughtC
Chart 1
In the centerFinancial flows are extensive among the 15 advanced economies at the core of the global banking network.
Source: Minoiu and Reyes (2011).Note: The lines represent bank-intermediated flows between individual countries in 2007. The
thin lines represent flows between $1 billion and $5 billion, the medium lines, flows between $5 and $10 billion, and the thick lines, flows in excess of $10 billion. The countries are AUT = Austria, BEL = Belgium, CAN = Canada, CHE = Switzerland, DNK = Denmark, DEU = Germany, FRA = France, GBR = United Kingdom, IRL = Ireland, ITA = Italy, JPN = Japan, LUX = Luxembourg, NLD = the Netherlands, SWE = Sweden, and USA = United States.
in the Web

16 Finance & Development September 2012
account for an outsized share of the total transactions. It can intermediate flows between many banks that are not directly lending to one other.
There is also a global network of countries that are exposed to each other through capital flows, trade, or migration—or all three.
A first step in assessing financial stability using network analysis is to look for patterns in the relationships among players in the financial system. Javier Reyes and I recently mapped banking relationships across countries since the late 1970s through the lens of a network (Minoiu and Reyes, 2011). We asked the following questions: How can the level of financial interconnectedness be assessed globally? Has that interconnectedness changed over time? Was it unusually high before the recent financial crisis? Are there any strik-ing patterns of interconnectedness that may not be visible by simply looking at total flows?
building the networkTo construct a worldwide web of financial connections, which we call the global banking network, we used a unique data set with information on cross-border financial flows intermediated by banking systems in a large sample of coun-tries during 1978–2010. The data set, compiled by the Bank for International Settlements (BIS), is called the BIS loca-tional banking statistics. Financial institutions that report data to the BIS generally include licensed banks and, depend-ing upon the country, large securities firms and offshore banks. They report information on such financial instru-ments as loans, deposits, and debt securities. The data are compiled on the basis of residence of BIS reporting banks, which makes them well suited for analyzing geographical patterns in financial linkages.
We performed the network analysis on two sets of coun-tries: the core of the network, 15 advanced economies that have reported data to the BIS over a long period of time; and the periphery, 169 countries at various levels of development. The periphery countries in our sample either reported data
only in recent years or do not report at all. We restrict the core to the 15 economies that have reported data to the BIS continuously since 1978 so as not to confound changes in the network with changes in the sample of reporting countries.
We constructed two networks. The core-core network cap-tures flows among the 15 advanced economies and resembles Chart 1. The core-periphery network captures flows from the 15 advanced economies to the rest of the world (the flows from the rest of the world to the core are not reported). The global banking network is obtained by superimposing the core-core and core-periphery networks. The relationships (links) between countries represent positive financial flows intermediated by banking systems, in other words, net investments.
connected and clusteredWe focused on two simple and widely used connectedness indicators that capture the density of relationships in the global banking network and focus on the presence of a rela-tionship between two countries rather than the magnitude of the financial flow between them—connectivity and clustering.
Connectivity measures the density of bilateral relationships, that is, the number of links between countries in the network divided by the total number of possible links. Clustering gauges the density of three-way relationships—in which a country’s lenders are also lending to each other. It is roughly defined as the number of triangles that appear in the network divided by the total number of possible triangles. In the core-core network, a triangle occurs when three core economies are lending to one another; in the core-periphery network, a triangle occurs when a periphery country is borrowing from two core economies that are lending to each other.
We began by looking at total flows. There is a remarkable increase in the magnitude of bank-intermediated flows to the countries in our sample. Comparing the 1978–2002 average with the precrisis peak, we find that financial flows trans-ferred by banks from one core economy to another amounted to a positive net $36 billion per year on average and reached $230 billion just before the recent crisis (see Chart 2). Similarly, banking flows from the core to the periphery were on average $1.5 billion in the early period and rose to $6.4 billion before the recent crisis (see Chart 3).
There is not, however, a comparable increase in financial interconnectedness. Like total flows, connectedness rises before financial crises and falls afterward. But connectedness was not unusually high before the recent crisis. In fact, both connectivity and clustering for the core-core network suggest that similar levels of interconnectedness were reached before other financial crises, such as the 1987 stock market crash. The core-periphery network also displays a precrisis increase in connectedness, which likely reflects a secular trend toward higher financial openness in the periphery. Moreover, in either network the increase in the density of relationships among countries before the recent crisis was clearly dwarfed by the unprecedented rise in total flows.
A unique feature of the recent crisis is that in its aftermath, network density fell to the lowest point of the 22-year period.
What is network analysis?The building blocks of a network are nodes (represent-ing agents, financial intermediaries, countries, etc.) and the links (or edges) between them (representing relationships between nodes, for instance, ownership, exposures, or flows). Relationships may be represented in binary form, such that they exist (value 1) if there is a flow or exposure between nodes and do not exist if there is no link (value 0). They can also be represented in weighted form, which would measure the size of the relationship—such as the magnitude of flows between nodes. Network analysis is a set of methods that describes the position of the nodes in the network and assesses the structure of the network as a whole.
Network analysis has been used in fields such as epidemiol-ogy and sociology. In recent years, interest in the role played by interconnectedness during the recent crisis spurred research into network applications to economics and finance.

Finance & Development September 2012 17
Clustering, the prevalence of trilateral relationships, almost disappeared in both the core-core and core-periphery net-works. The crisis appears to have triggered a drop in network density of a magnitude that we had not seen before. But why?
Historically, connectivity and clustering have followed a boom-bust cycle, much like total flows. But this pattern did not hold during the most recent crisis. While network den-sity in 2007 was comparable to the precrisis levels observed earlier, the extent to which it fell in 2008–09 stands out. Although some analysts attributed the severity of the crisis to the level of financial interconnectedness, our findings sug-gest that the precrisis boom in connectivity can only partially explain the depth of the crisis. We suspect that two additional factors played a role. First, before the crisis, the global bank-ing network was intermediating cross-border flows that were much larger than in previous decades. Second, the initial shock to the financial system was in the core of the global banking network, and within the core the affected partici-pants were themselves highly interconnected. Studies have shown that similar shocks can have different consequences for a financial system depending on the particular point in the network structure where the shock hits (Gai and Kapadia, 2010). The location of the shock, combined with the unusu-ally large cross-border flows of financial instruments, are likely to have been the factors that caused this crisis to be sig-nificantly more severe than earlier ones.
a tool for the futureFinancial interconnectedness—the pattern of interactions among institutions and countries in the global financial
system—is often called the main culprit in the sever-ity of the recent crisis. This is because what was initially thought to be a local shock—the bankruptcy of a highly interconnected financial institution—had consequences well beyond that institution’s and its country’s borders. Had network analysis been in the policymakers’ toolkit, they might better have understood the potential conse-quences of permitting the failure of a medium-sized finan-cial institution. Network analysis, which looks at agents not in isolation but in concert, provides tools for analyzing interconnections that can be used to assess systemic risk. By looking at agents and the links between them, network analysis can add valuable insights about the financial sys-tem as a whole, which is a complicated web of interlinked and interdependent players. ■Camelia Minoiu is an Economist in the IMF’s Institute for Capacity Development.
References:Gai, Prasanna, and Sujit Kapadia, 2010, “Contagion in Financial
Networks,” Proceedings of the Royal Society A, Vol. 466, No. 2120, pp. 2401–2423.
Haldane, Andrew G., 2009, “Rethinking the Financial Network,” Speech delivered at the Financial Student Association Conference in Amsterdam, April 28.
Minoiu, Camelia, and Javier A. Reyes, 2011, “A Network Analysis of Global Banking: 1978–2009,” IMF Working Paper 11/74 (Washington: International Monetary Fund).
Minoiu, updated 7/18/12 C
1978 80 82 84 86 88 90 92 94 96 98 2000 02 04 06 08 10
Chart 2
Core �owsBank-intermediated �ows from one core economy to another grew in the runup to the 2008 crisis. But there was no comparable increasein network connectivity and clustering among the advanced economies.(percent) (constant 2009 billion dollars)
Source: Minoiu and Reyes (2011).Note: The core economies are Austria, Belgium, Canada, Denmark, France, Germany, Ireland, Italy,
Japan, Luxembourg, the Netherlands, Sweden, Switzerland, the United Kingdom, and the United States. Connectivity measures the density of bilateral relationships—that is, the number of links between countries in the network divided by the total number of possible links. Clustering gauges the density of three-way relationships in which a country’s lenders also are lending to each other and is calculated by dividing the number of three-way relationships by the total number of possible three-way relationships.
Average �ows per country (right scale)
Network connectivity (left scale)
Network clustering (left scale)
Stock market crash
European �nancial crises
Dotcom bust
Lehman Brothers
bankruptcy
0
50
100
150
200
250100
90
80
70
60
50
40
30
20
10
0
Minoiu, updated 7/18/12 C
1978 80 82 84 86 88 90 92 94 96 98 2000 02 04 06 08 10
Chart 3
Spreading to the peripheryBefore the recession, banking �ows from the core economies to the countries in the periphery rose and interconnectedness—connectivity and clustering—rose slightly as well.(percent) (constant 2009 billion dollars)
Source: Minoiu and Reyes (2011).Note: The core economies are Austria, Belgium, Canada, Denmark, France, Germany, Ireland,
Italy, Japan, Luxembourg, the Netherlands, Sweden, Switzerland, the United Kingdom, and the United States. Connectivity measures the density of bilateral relationships—that is, the number of links between countries in the network divided by the total number of possible links. Clustering gauges the density of three-way relationships in which a country’s lenders also are lending to each other and is calculated by dividing the number of three-way relationships by the total number of possible three-way relationships.
0
1
2
3
4
5
6
7100
90
80
70
60
50
40
30
20
10
0
Latin American debt crisis
Average �ows per country (right scale)Network connectivity (left scale)Network clustering (left scale) East Asian
�nancial crisis

18 Finance & Development September 2012
the global movement of workers will change as the economic crisis continues in advanced economies
THE United States’ long-standing argument with Mexico over illegal migration is on the wane. Net mi-gration from Mexico is near zero
and apprehensions of illegal immigrants (many non-Mexican) at the U.S. southern border are at levels last seen in 1970 (U.S. Border Patrol, n.d.).
Massive U.S. investments in border con-trols, aggressive interior enforcement mea-sures, a Mexican economy that has been growing much faster than the U.S. economy since 2010, and ever-deeper cooperation with the United States on the issue explain a good part of the decline in illegal migra-tion. But even more important is that a sus-tained decline in Mexican fertility means that fewer new Mexican workers are enter-ing the labor force each year at the same time that job opportunities in the United States are much lower as a result of the ongoing economic distress.
The aftermath of the Great Recession has not only affected immigration between the United States and Mexico. Immigrants from lower- and middle-income countries have been particularly vulnerable to the destruc-
tion of jobs in most advanced economies. Migration—which has been both driving force and byproduct of globalization and the ever-increasing interconnectedness it fuels—now comes face to face with the global crisis.
The crisis may have ended a period in which the benefits of openness, including large-scale immigration, were embraced with relatively few questions across advanced economies. In the years ahead, immigration is likely to become more selective, and lower-skilled migrants are likely to be less welcome—at least as pro-spective permanent residents, let alone as fellow citizens.
Job destructionIn the United States, for example, labor market distress has reached levels not seen since the Great Depression. About 23 mil-lion people, roughly 15 percent of the labor force, are unemployed or underemployed—including workers in involuntary part-time situations and those who become margin-ally attached or discouraged (see Chart 1). The share of men who hold a job is at the
Chinese migrant workers sewing clothes at factory in Romania.
GrowthmigrationMeets Slow
Demetrios G. Papademetriou

Finance & Development September 2012 19
lowest level since 1948, when the U.S. Labor Department began collecting these data, while for all workers it is the lowest since 1981. At mid-2012, nearly 42 percent of the unemployed had been jobless for 27 weeks or longer, increasing the prospect that their skills will atrophy and raising the risk that even as large numbers remain unem-ployed, jobs will go begging because of the growing gap between the skills available and the skills employers require (see “The Tragedy of Unemployment,” in the December 2010 issue of F&D). Hardest hit are middle-aged workers (45 to 64 years old), who both remain unemployed longer than any other age group and find it harder to get jobs with wages similar to the ones they lost. Moreover, investments in productivity-enhancing and labor-saving technologies during recessions reduce the post-recession demand for workers (Katz, 2010). Notwithstanding a smaller workforce, the United States has a higher GDP than five years ago.
These troubling figures are not limited to the United States. Five years after the first signs of distress in the U.S. mortgage market that led to the global financial cri-sis and three years after a halting recovery began in most advanced economies, the jobs crisis in Europe as a whole is even worse. In April 2012, 24.7 million persons in the 27 countries of the European Union (EU) were unemployed, 8 percent more than a year earlier (Eurostat, 2012). The situ-ation becomes even more dire when one considers all mea-sures of economic distress; 42.6 million EU workers were unemployed or underemployed in 2011.
Moreover, youth unemployment is extremely high and continues to grow in some EU countries (see Chart 2). The potential consequences of this phenomenon are dis-quieting. They include long-term “economic scarring,” the
risk of a “lost generation” of workers, and the poten-tial for social disorder—the appeal of extreme ideolo-gies is strongest among those with dismal prospects.
While millions of workers have been hurt by the cri-sis, the pain is uneven. Men, young workers—particularly
young immigrants—and members of minority groups have fared the worst. In the United States, Hispanics, blacks, middle-aged workers, and teenagers have been hit harder than other groups. In Europe, immigrant groups that absorbed a disproportionate economic and labor market hit include those from Andean and North African coun-tries in Spain; Bangladeshis, Pakistanis, and Portuguese in the United Kingdom; and most immigrants in Greece.
These groups are consistently vulnerable for a variety of reasons. • Skills. Immigrants typically have lower skill levels or
skills that are more difficult to recognize or translate into the local economy, factors that are compounded by poor language ability. • Experience. Young workers, immigrants, and disad-
vantaged minorities often have less work experience and face more or less formal “last hired/first fired” policies. • Contingent employment. These groups are often in
jobs that are more temporary in nature and expand and contract to reflect demand cycles.
Papademetriou, 7/17/12
Chart 1
Heavy U.S. unemploymentAbout 15 percent of the U.S. workforce today is either unemployed, underemployed, or marginally attached—nearly twice the rate just before the Great Recession.(percent of labor force)
Sources: Bureau of Labor Statistics, Current Population Survey, 1994–May 2012; and Migration Policy Institute analysis.
1994 96 98 2000 02 04 06 08 10 May 12
0
4
8
12
16
20Unemployed, marginally attached, and part-time workers who would like full employmentUnemployed, discouraged, and marginally attached workersUnemployment rateRecession
Papademetriou, 7/3/12
Chart 2
Youth at riskUnemployment among those under 25 is already high in many European countries and continues to grow.(youth unemployment rate, percent)
Source: Eurostat.
1998 2000 02 04 06 08 10 12:Q10
10
20
30
40
50
60Germany IrelandGreeceSpainFranceItaly
PortugalSwedenUnited KingdomUnited StatesAustria
Immigrants typically have lower skill levels or skills that are more difficult to recognize or translate into the local economy.

20 Finance & Development September 2012
• Training. Employers typically have made fewer investments in training these workers, which makes them more expendable. • Employment sector. The sectors in which many of
them worked were hit hardest by the crisis. In the United States and Spain, for example, the bursting of the housing bubble led to the collapse of the construction sector, which was a source of employment for large numbers of immi-grants, many of them illegal residents.
migration suffersIn the past three decades, migration from low- and mid-dle-income countries to higher-income countries grew across all skill and education levels. The United Nations estimated in 2008 that the number of immigrants—autho-rized or unauthorized—to the more developed regions of the world would nearly double, from 5.4 percent in 1980 to 10.5 percent by 2010 (United Nations, 2009).
In several instances, often in countries whose main expe-rience with migration had been as senders, not recipients, of immigrants, immigration grew at rates that were unprec-edented in peaceful times. In Spain, for instance, the num-ber of immigrants grew from a few percentage points to 14 percent of the population in less than 15 years. Remarkably rapid growth also occurred in Finland, Ireland, the United Kingdom, Greece, and Italy (see Chart 3). In all instances, rapid rates of growth gave these countries inadequate time to adjust their legal and institutional frameworks to incor-porate newcomers effectively and prepare their publics for the changes that fast-paced increases in migration entail. This sowed the seeds for the recent reaction to immigra-tion, such as the rise of nationalist parties with strong, if
often selective (typically anti-Muslim), anti-immigration platforms. The economic crisis has simply intensified the negative reaction to immigrants.
Porous borders and a general belief that immigration had positive economic effects allowed vast numbers of migrants to relocate, legally and illegally. Indeed, expanding econo-mies absorbed the additional labor with ease. Consumers enjoyed the reduced costs of goods and services produced by lower-paid immigrants, and many economic policy-makers praised the restraining effect of immigration on wage inflation—a phenomenon that domestic workers who are directly affected understandably loathe.
The Great Recession changed that. To be sure, international migration has continued to
grow. But most of that growth has been in middle-income, and particularly in emerging, economies—such as Brazil, Russia, India, and China, but also South Africa, Mexico, Turkey, Indonesia, and several other Southeast Asian coun-tries. Total immigration to high-income countries has, however, grown very slowly relative to the growth rates of the past three decades, even though English-speaking countries have continued to admit significant numbers of new immigrants (United Nations, 2012).
a new normal?The postcrisis environment will be one of uncertainty. And it spawns a host of questions, many essentially unanswer-able right now. Will high unemployment and slow, uneven employment growth gradually recede, with growth and “tra-ditional” immigration patterns returning to roughly precrisis levels? Or will economic growth and immigration levels in high-income countries settle at more moderate levels? Have Papademetriou, revised 7/17/12
Chart 4
Pressure on workersEver fewer workers will have to support an ever-growing number of retirees.(old-age dependency ratio, percent)
Source: U.N. Population Division.Note: The old-age dependency ratio is the population 65 years and over divided by the
population aged 20 to 64, multiplied by 100.
2005 2010 2015 2020 2025 20300
10
20
30
40
50
60
India
China
Ireland
United States
FranceGermany
Japan Proj.
Papademetriou, revised 7/17/12
Chart 3
Immigrant in�uxThe share of immigrants in the total population grew in Europe and the United States. In several countries, immigration grew dramatically.(migrant share of population, percent)
Sources: For 1995 data, United Nations (2009); for 2010 data, Eurostat (2010) and U.S. Department of Labor, Current Population Survey.
0
2
4
6
8
10
12
14
1619952010
Finlan
d Sp
ainAu
stria
German
y
United
State
s
Franc
e
Swed
en
Netherl
ands
Irelan
d
United
King
dom
Portu
gal
GreeceIta
ly

Finance & Development September 2012 21
advanced economies arrived at an inflection point in their always complex immigration his-tories whereby one can expect a sustained period of lower labor market demand and much more selective migration? How will continuing labor market distress affect behavior among groups often on the margins of the labor force, whose decisions nonetheless determine the overall sup-ply of workers: less-educated workers; discour-aged workers; the urban poor; disadvantaged and otherwise marginalized workers (many of whom are minorities); women now out of the labor force who want to return to it; retirees returning to work or older workers postponing retirement; and those who had shunned certain jobs as too difficult or too socially undesirable? Collectively, the choices these groups make will help determine the number of immigrants that receiving countries will “need” in the coming years—and the economic, labor market, and social welfare decisions of governments, employers, and individuals will help shape these determinations.
Nonetheless, some of the underlying drivers of migra-tion will not change. Baby boomers may retire later than originally projected, but aging will continue to generate demand for immigrant workers both to work and to pay the taxes to support social benefits and care for the aged. The new worker pipelines in countries with long-term low fertility rates will grow smaller, which, together with aging populations, will put increasing pressure on the produc-ing part of the labor force. Old-age dependency ratios—the number of those who are over 65 years old divided by the number of those who are between 20 and 64 years old—will grow ever larger (see Chart 4). Education and training sys-tems in wealthy countries will continue to struggle to meet labor market demand because no country can anticipate the future demand for skills well enough, nor develop competi-tive specialized domestic industries by relying exclusively on homegrown talent. The challenge for policymakers will be offering credible policy responses during a period of extraordinary uncertainty and persistently high unemploy-ment, while being active in the hunt for global talent and maintaining the openness and tolerance that undergirds competitiveness in the long run.
In the meantime, certain forms of migration have contin-ued to grow and will likely grow faster in the years ahead. Most respond to the opportunity differentials between countries, which is the major driver of immigration. Among them are the following.
Emigration from high-income countries due to eco-nomic distress. Some of it will be to former colonies where opportunities have become more plentiful. The flows to watch are those from countries such as Ireland and the Mediterranean member states of the European Union that moved from centuries-old traditions of emi-gration to becoming massive immigration players in little
more than a decade. They now seem to be returning to their historical pattern.
Two-way migration flows among high-income coun-tries and from high-income countries to fast-growing middle-income ones. Migration between high-income countries has been occurring for generations and accounts for about a quarter of all migration (United Nations, 2012). The free movement provisions of the European Union and the de facto openness of most wealthy countries to migration from countries of similar levels of development mean that such movements will continue to grow. North-South migra-tion, which now stands at about 13 million persons, will likely grow robustly, focusing on the fast-growing middle-income countries and turning them into the next migration hubs, especially since they already host substantial numbers of immigrants from neighboring lower-income countries. In fact, their active effort to attract talented immigrants from the North is well under way, focusing on enticing their expa-triates to return by offering such incentives as tax and for-eign exchange concessions and research opportunities. The actions of global firms attracted by similar incentives, by the availability of talent without some of the immigration con-straints of high-income countries, and by the proximity to new and increasingly abundant middle classes eager to buy their products complete the circle.
Attracting skilled immigrants will become more of a policy target. Skills and talent are highly prized in an increasingly competitive world, and the search for them is intensifying. However, high-quality skills—such as degrees in the sciences, technology, engineering, and mathematics (STEM) from leading universities—will not always be as available as they seem to be today—which will have a pro-found effect on the fields of study immigrants choose and on educational institutions across the globe. Recruiting STEM graduates out of school is becoming the “lowest-hanging fruit” of immigration policy in many countries. Competition for these graduates can become heated very quickly.
U.S.-Mexico border crossing into San Ysidro, California.

22 Finance & Development September 2012
The recent growth in international students will con-tinue. More than 3 million students are studying outside their home countries today—nearly twice the number in 2000, and the number could more than double again by 2020 (UNESCO, 2011). The attraction is there for host countries—educating fee-paying foreign students is lucrative—and for students—the value of foreign education is increasing as competition for talent grows.
Finally, other forms of migration will also continue to rise—including investor and retirement migration, “adventure” migration, and migration by children of immigrants seeking
to explore opportunities in their parents’ countries from the safety of citizenship in their parents’ adopted countries.
What may be equally important is that the character of migration is also likely to change. For most of the past 150 years, migration hewed to a well-established pattern in which family unification and citizenship were near-standard end products. But the greatest likelihood is that the new migra-tion will be more temporary and contract based (more in the nature of “mobility” than traditional migration) and will typically not come with citizenship.
inescapable realitiesA closer look at the intersection between the ongoing fiscal and jobs crises and immigration in most of the highly devel-oped world points to several important areas that need atten-tion from policymakers
First, authorities must reexamine some of the assumptions about the nearly unremitting demand for immigrant labor, and particularly the notion that large-scale immigration is essential to economic growth and prosperity. The reality is more nuanced. The future will most likely see much more selective migration and much more active management of the immigration system. Immigration politics, not just good governance, will see to it. Approving employer appli-cations for new immigrants with few or otherwise easily obtainable skills may gradually become a thing of the past. Policymakers will also come to think harder about how and where to invest in the job skills of economically scarred and marginalized workers and those whom globalization has left behind. Once more, politics and responsible leadership will make that necessary. Moreover, the economic restructuring that the crisis has forced on nearly all advanced economies and the resulting investments in increased productiv-ity make arguments for large-scale immigration harder to sustain. Finally, pressure will increase on receiving gov-ernments to enforce laws against illegal immigration and unauthorized employment that they may have been reluc-tant to enforce in the past.
Second, as the crisis continues, increasing numbers of the long-term unemployed will see their skills degrade further.
Policymakers thus face the specter of growing structural unemployment—with which much of Europe has contended for a generation but the United States has mostly avoided. This suggests that governments and employers will have to redouble their efforts to invest in their legal workers regard-less of their origin or prior qualifications and that workers will have to invest in themselves. When economic growth returns, employers and the broader economy will need a better-skilled and better-educated workforce. Those that have one will do well; those that do not will fall further behind—as will the economic sectors that employ workers without investing in them.
Third, the cuts to immigrant integration funds occurring in most advanced economies could spell further, and lon-ger-term, social and economic troubles that will make the recovery more challenging than it need be. For instance, Spain zeroed out its integration budget earlier this year, and integration assistance and public services to immi-grants and other marginalized groups are being cut in most countries. This means that immigrant groups that fared relatively well before the economic crisis are also likely to prosper during the recovery. But those already struggling will be less able to recover and will face huge obstacles to economic well-being that will likely continue into the next generation. The underlying drivers of successful immi-grant integration—such as language ability, education, rel-evant skills and qualifications, credential recognition, local work experience, and professional contacts—are unlikely to have changed. But as employers choose from a large pool of unemployed workers, the importance of these attributes for immigrants will grow and the consequences of lacking them will be more devastating. ■Demetrios G. Papademetriou is President of the Migration Policy Institute.
References:Eurostat, 2010, “Population by Sex, Age Group and Country of
Birth.”———, 2012, “Unemployment Statistics” (April). Katz, Lawrence F., 2010, “Long-Term Unemployment in the Great
Recession,” Testimony for the Joint Economic Committee, U.S. Congress. April 29, Washington.
United Nations, Department of Economic and Social Affairs, Population Division, 2009, “Trends in International Migrant Stock: The 2008 Revision” (United Nations database, POP/DB/MIG/Stock/Rev.2008).
———, 2012, “Migrants by Origin and Destination: The Role of South-South Migration,” Population Facts 2012/3.
United Nations Educational, Scientific and Cultural Organization (UNESCO) Institute for Statistics, 2011, Global Education Digest 2011 (Montreal).
U.S. Border Patrol, n.d., “Nationwide Illegal Alien Apprehensions Fiscal Years 1925–2011.”
U.S. Department of Labor, Bureau of Labor Statistics, January 1994–May 2012, Current Population Survey (Washington).
The future will most likely see much more selective migration.

Finance & Development September 2012 23
REGIONALISM has become an im-portant feature of the global trad-ing system. More than 500 notifi-cations of bilateral and plurilateral
free trade agreements were made between the end of World War II and early 2012, most of them in the past two decades.
Financial regionalism has also increas-ingly gained prominence, albeit only more recently. In June this year, for example, lead-ers of the Group of Twenty advanced and developing economies (G20) meeting in Los Cabos, Mexico, underscored “the impor-tance of effective global and regional [finan-cial] safety nets” and, along the same lines, the main policy committee of the IMF has regularly stated the importance for the IMF “to cooperate . . . with regional financial arrangements.”
While there is a substantial stream of aca-demic contributions on trade regionalism, our understanding of financial regionalism
is quite limited, despite its potentially far-ranging implications in shaping the inter-national financial architecture. This is true in Europe—where the recently proposed European Stability Mechanism is intended to be a currency union lending arrangement to provide direct assistance to sovereigns—and elsewhere.
In Latin America, the Andean countries successfully established the Latin American Reserve Fund (FLAR), which has been very active in providing balance of payments financing to its members for more than three decades. And, of course, in Asia, the Association of Southeast Asian Nations (ASEAN) + 3—that is, the 10 ASEAN coun-tries plus China, Korea, and Japan—created the Chiang Mai Initiative in the aftermath of the 1997–98 Asian financial crisis. The Chiang Mai Initiative was multilateralized by consolidating a network of bilateral swap agreements into a single swap contract in
Masahiro Kawai and Domenico Lombardi
regional arrangements are reshaping the international financial architecture and helping global financial stability
regionalismFinancial

24 Finance & Development September 2012
March 2010, and a regional surveillance unit, called the ASEAN + 3 Macroeconomic Research Office, has been oper-ating in Singapore since 2011.
complementing broader integrationThese regional financial arrangements are somewhat dif-ferent and range from government financing and foreign exchange reserve pooling to currency swap arrangements. What is common to all these initiatives, despite their intrin-sic diversity, is that they were all born of broader efforts to promote regional integration as well as macroeconomic and financial stability.
The most obvious case is Europe where, soon after World War II, the interdependence of that region’s economies led to the establishment of the European Payments Union, a pre-cursor of the more advanced regional framework that culmi-nated with the introduction of the currency union in 1999.
Latin America boasts the oldest, although less well-known, tradition of regional integration efforts among the developing economies, which also date as far back as the 1950s. Aiming to create a regional common market for goods and services, policymakers in Latin America have succeeded in establish-ing clearing arrangements for intraregional payments, two development banks, and FLAR. The latter includes a small,
cozy membership of seven small and medium-sized econo-mies with strong cultural ties and a broad set of common interests. Indeed, FLAR provides a direct testimony to the potential of (sub)regional arrangements to provide greater ownership to those members who would otherwise struggle to be heard in the global, 188-member IMF.
It is exactly this idea of enhanced regional ownership that prompted the ASEAN + 3 countries to establish the Chiang Mai Initiative in May 2000. Disappointed by the response of the international community at the time of the Asian finan-cial crisis, the 13 countries decided to reduce their depen-dence on the IMF.
Established soon after Japan’s proposal to create an Asian monetary fund was opposed by the United States and the IMF, the Chiang Mai Initiative complements a broader range of integration efforts aimed at stepping up trade and financial linkages in east Asia. Such efforts comprise the Asian Bond Markets Initiative and the Asian Bond Fund programs to develop local currency–denominated bond markets, including the launch of the Credit Guarantee and Investment Facility, which is intended to promote the issu-ance of corporate bonds within the region.
A move toward an ASEAN + 3 or ASEAN + 6 (ASEAN + 3 enlarged to include Australia, India, and New Zealand)
free trade agreement to forge a larger market for goods, ser-vices, and investment is another potentially significant move. Along similar lines, the establishment of an Asian Financial Stability Dialogue has been proposed, as well as an Asian currency basket index to gauge the individual movements of currencies in the region relative to a regional average.
managing regional spilloversAs the Chiang Mai Initiative illustrates, the membership of regional financial arrangements is heterogeneous in terms of the size of members. China (including Hong Kong SAR) and Japan account for 64 percent of ASEAN + 3 financial contri-butions, reflecting the large weights of their economies.
While their size makes such countries unlikely bor-rowers, their quota proportion highlights an important function of regional financial arrangements as a device to manage regional spillovers and the impact of problems from outside the region. Disruptions to intraregional trade and investment flows emanating from problems in smaller economies can be managed through a regional arrangement to preserve the overall stability of the region.
Not surprisingly, smaller members of FLAR have benefited considerably from the fund, but it has safeguarded the larger economies as well. Colombia, for instance, has indirectly gained from the repeated support provided by FLAR to Ecuador, because of their important trade relationship.
Indeed, such intraregional externalities can be managed more efficiently by a sovereign financial intermediary with regional scope. For instance, FLAR has a higher rating than any of its individual members, enabling the institution to borrow from financial markets at lower costs and to redi-rect such resources toward regional priorities.
However, reflecting a typical feature of regional finan-cial arrangements, the Chiang Mai Initiative has only limited capacity to formulate and enforce policy condition-ality associated with crisis lending and, thus, is designed to accompany an IMF program. This has been codified in the “IMF link,” whereby any drawing above a certain threshold requires a concurrent IMF program. The threshold, initially set at 10 percent of the maximum borrowing limit, has now been increased to 30 percent and is targeted to rise to 40 percent by 2014. This loosening in the IMF link can miti-gate one of the reasons why the Chiang Mai Initiative has never been activated: its binding IMF link and the reluc-tance of members to borrow from the IMF.
Gaining perspectiveMost likely, any further weakening of the IMF link will depend on the concurrent strengthening of the economic surveillance capabilities supported by the new unit, the ASEAN + 3 Macroeconomic Research Office (AMRO).
AMRO will have to prove that it can distance itself enough from its members to exercise the authoritativeness—not just the authority—to independently appraise the economic poli-cies of its members. This challenge is symptomatic of regional financial arrangements in general and even of the IMF itself.
With systemic or region-wide shocks, regional arrangements and the IMF may have to join forces.

Finance & Development September 2012 25
In the case of the European Stability Mechanism (ESM), this function is performed by the European Commission and European Central Bank, with the IMF also involved. FLAR does not carry out surveillance, nor does it have any peer-review forum in which members’ economic policies are appraised. However, the ASEAN + 3 Economic Review and Policy Dialogue in Asia, which should, in fact, serve as a surveillance vehicle, has so far functioned more as a forum for exchanging information rather than as a peer-review or due diligence framework where policies are assessed and, if needed, amended.
Indeed, lack of distance between such regional bodies and their respective members typically prevents the former from designing policy conditionality in the event of crisis lending and, subsequently, from monitoring compliance with it.
Under the ESM framework, a link with the IMF is strongly encouraged although not necessarily required. FLAR, however, lends without policy conditionality. In so doing, its members have de facto accorded super-senior sta-tus to FLAR, as they have always honored their obligations to the reserve fund, even while defaulting to their commer-cial creditors or falling into arrears with the IMF.
A case in point is Peru in the 1980s, when the country borrowed from both the IMF and FLAR, but went off-track with the IMF-supported program. FLAR provided a financial backstop following a phase of turbulence with the international community. Upon taking office in 1985, the administration of President Alan Garcia announced that Peru would limit its external debt service payments to 10 percent of its foreign receipts. The country started to accumulate arrears with the IMF but kept current on its repayment obligations vis-à-vis FLAR. Finally, when the administration of President Alberto Fujimori took office in 1990, Peru cleared its arrears and normalized its relation-ship with the IMF, after which it secured a series of pro-grams throughout the 1990s.
FLAR can thus provide liquidity support to its members, work to complement IMF support in normal times, as well as substitute for it in more difficult times. For the last to be feasible, however, the adverse shock should be limited to a small enough subregion and the demand for regional financial arrangement funds should occur in sequence and not simultaneously. That said, a lack of conditionality may postpone the policy adjustment needed to secure the sup-port of the broader international community in the form of additional lending and/or debt restructuring.
spelling out who does whatClarifying the respective roles and responsibilities of regional arrangements and the IMF may not be easy, let alone clarifying how experience from one regional financial arrangement may apply to another.
First, a shared understanding of an evolving degree of division of labor is needed. When a small-scale crisis occurs in one or two small countries, a regional financial arrangement tends to be better positioned to provide cri-sis lending, without involving the IMF. However, with sys-
temic or region-wide shocks, regional arrangements and the IMF may have to join forces, given individual regions’ interconnectedness with the global economy and their lim-ited lending firepower.
In their infancy, regional financial arrangements may find it hard to formulate policy conditionality and monitor its implementation by themselves, in which case such roles may have to be assumed by the IMF, with the regional funds providing input for formulating conditionality. However, as the capacity of a regional fund—such as the Chiang Mai Initiative and AMRO in the case of Asia—improves sig-nificantly over time, it may lead crisis management, includ-ing liquidity provision and conditionality formulation and implementation, with more limited support from the IMF.
Second, there has to be a shared understanding of areas where competition between regional arrangements and the IMF may be healthy, even beneficial, and areas where com-petition might be detrimental.
Competition in information provision, forecasts, research, and the formulation, socialization, and dissemination of best practices is certainly beneficial. However, competition in set-ting conditionality is unhealthy, because it can undermine collective stabilization efforts. For instance, if different frame-works for private sector involvement were to be applied con-currently, there could be chaos in international capital markets.
So far cooperation has worked on an ad hoc basis, but this pragmatic approach, while maximizing flexibility, could escalate the risk of coordination failure in the midst of a crisis and of subsequent systemic spillovers into the global financial system. Europe is a prime example.
That said, it is difficult to devise a process similar to that in the international trading system, codified by Article XXIV of the World Trade Organization (WTO). This Article, in theory, empowers the WTO to assess the consis-tency of any bilateral or plurilateral arrangement with the multilateral trade system.
Yet, if one were to conceive of the IMF assuming an anal-ogous role, then its governance structure would have to be reformed significantly to give it the needed legitimacy to discharge this potentially controversial function. The G20 could perhaps do it, having already introduced some basic principles in 2011, but it lacks universality since so many countries are left out of the process; that is, while the EU is a member, only one ASEAN country (Indonesia) belongs to the G20, and not a single member of Latin America’s FLAR does.
We need to deepen our understanding of this new evolving regional dimension to the international financial architecture and of the ways in which it could contribute to financial sta-bility, because financial regionalism, like trade regionalism, is almost surely here to stay. ■Masahiro Kawai is Dean of the Asian Development Bank Institute. Domenico Lombardi is President of The Oxford In-stitute for Economic Policy and Senior Fellow at the Brookings Institution. They are co-editors of the forthcoming book Finan-cial Regionalism and the International Monetary System.

26 Finance & Development September 2012
straiGHt TALK
AFTER the strife of the past five years and the depth and breadth of the crisis—brought about in part through deep global interconnec-
tions of economies and financial markets—it could be easy to lose sight of the benefits of integration. We must not.
There is much to be gained from a more integrated and interconnected global econ-omy. Trade and financial integration over the past few decades have underpinned strong growth and job creation in many places. This globalization has helped poorer economies narrow somewhat the income gap with richer ones. It has also helped to bring societies closer together and make them more open.
But new and unfamiliar risks can also arise. These risks must be kept at bay if we are to reap the rewards of integration.
a risk cascadeAs the crisis has shown repeatedly, risks can cascade through the system very quickly, sometimes in unexpected ways. Small shocks—defaults on mortgages in the United States, uncertainty about Greek government bonds, bank stress in Spain—can become global issues. In today’s interconnected world, crises do not recognize borders.
With fragilities and limited policy buf-fers in the advanced economies that are the “core” of the global financial system, it is no surprise that systemic volatility is high. Risk sentiment switches rapidly between “on” and “off.” Things are unlikely to change soon—working through the fragilities and rebuild-ing buffers may take several years. How can we help preserve and enhance the gains from integration, rather than see them reversed by those who prefer to retreat inward?
In a nutshell, the problem is that the archi-tecture for stability of the international finan-
cial system has not caught up with the rapid pace of integration. Finance is global, but the architecture for ensuring systemic stability has remained predominantly national. That means that the capacity of policymakers to cope with shocks can be easily overwhelmed, and policymakers may find themselves rap-idly running out of policy “bullets.”
a spotlight on cooperationNo part of our interconnected world is immune. The crisis is global, and the way out must also be global. By working together, we can make the whole of our policy actions more than the sum of their parts.
For example, the coordinated fiscal stim-ulus in the immediate wake of the crisis helped avert a far greater economic calam-ity. Recently, the global community pledged more than $450 billion to increase IMF resources and help close potential global financing gaps. But five years into the crisis, we can also see how costly the absence of effective cooperation can be.
IMF research indicates that a coordi-nated strengthening of policies across the Group of 20 (G20) advanced and emerg-ing economies could raise global GDP by 7 percent and boost jobs by 36 million over the medium term. This is especially impor-tant because about 30 million jobs were lost during the crisis. The value of this collective policy action—reflected in the G20’s Mutual Assessment Process—is something the IMF has advocated for some time.
Reform of the financial sector must also be a global endeavor. There has been prog-ress—higher capital ratios and discussion on liquidity ratios, for instance. But a better financial architecture is still under construc-tion. The priorities include:• Better regulation, which is needed to
implement what has been agreed and make
Fragmentation risksthe benefits of globalization must be preserved by enhancing the international structures that ensure financial stability
Christine Lagarde
Christine Lagarde is the IMF’s Managing Director.
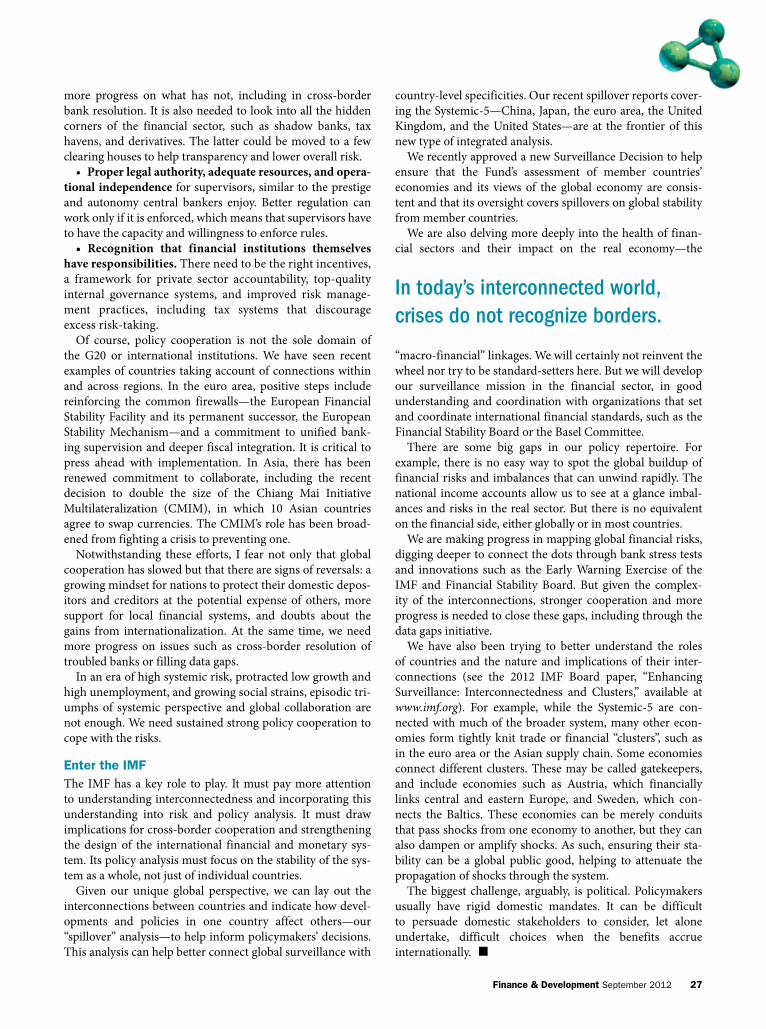
Finance & Development September 2012 27
more progress on what has not, including in cross-border bank resolution. It is also needed to look into all the hidden corners of the financial sector, such as shadow banks, tax havens, and derivatives. The latter could be moved to a few clearing houses to help transparency and lower overall risk. • Proper legal authority, adequate resources, and opera-
tional independence for supervisors, similar to the prestige and autonomy central bankers enjoy. Better regulation can work only if it is enforced, which means that supervisors have to have the capacity and willingness to enforce rules. • Recognition that financial institutions themselves
have responsibilities. There need to be the right incentives, a framework for private sector accountability, top-quality internal governance systems, and improved risk manage-ment practices, including tax systems that discourage excess risk-taking.
Of course, policy cooperation is not the sole domain of the G20 or international institutions. We have seen recent examples of countries taking account of connections within and across regions. In the euro area, positive steps include reinforcing the common firewalls—the European Financial Stability Facility and its permanent successor, the European Stability Mechanism—and a commitment to unified bank-ing supervision and deeper fiscal integration. It is critical to press ahead with implementation. In Asia, there has been renewed commitment to collaborate, including the recent decision to double the size of the Chiang Mai Initiative Multilateralization (CMIM), in which 10 Asian countries agree to swap currencies. The CMIM’s role has been broad-ened from fighting a crisis to preventing one.
Notwithstanding these efforts, I fear not only that global cooperation has slowed but that there are signs of reversals: a growing mindset for nations to protect their domestic depos-itors and creditors at the potential expense of others, more support for local financial systems, and doubts about the gains from internationalization. At the same time, we need more progress on issues such as cross-border resolution of troubled banks or filling data gaps.
In an era of high systemic risk, protracted low growth and high unemployment, and growing social strains, episodic tri-umphs of systemic perspective and global collaboration are not enough. We need sustained strong policy cooperation to cope with the risks.
enter the imFThe IMF has a key role to play. It must pay more attention to understanding interconnectedness and incorporating this understanding into risk and policy analysis. It must draw implications for cross-border cooperation and strengthening the design of the international financial and monetary sys-tem. Its policy analysis must focus on the stability of the sys-tem as a whole, not just of individual countries.
Given our unique global perspective, we can lay out the interconnections between countries and indicate how devel-opments and policies in one country affect others—our “spillover” analysis—to help inform policymakers’ decisions. This analysis can help better connect global surveillance with
country-level specificities. Our recent spillover reports cover-ing the Systemic-5—China, Japan, the euro area, the United Kingdom, and the United States—are at the frontier of this new type of integrated analysis.
We recently approved a new Surveillance Decision to help ensure that the Fund’s assessment of member countries’ economies and its views of the global economy are consis-tent and that its oversight covers spillovers on global stability from member countries.
We are also delving more deeply into the health of finan-cial sectors and their impact on the real economy—the
“macro-financial” linkages. We will certainly not reinvent the wheel nor try to be standard-setters here. But we will develop our surveillance mission in the financial sector, in good understanding and coordination with organizations that set and coordinate international financial standards, such as the Financial Stability Board or the Basel Committee.
There are some big gaps in our policy repertoire. For example, there is no easy way to spot the global buildup of financial risks and imbalances that can unwind rapidly. The national income accounts allow us to see at a glance imbal-ances and risks in the real sector. But there is no equivalent on the financial side, either globally or in most countries.
We are making progress in mapping global financial risks, digging deeper to connect the dots through bank stress tests and innovations such as the Early Warning Exercise of the IMF and Financial Stability Board. But given the complex-ity of the interconnections, stronger cooperation and more progress is needed to close these gaps, including through the data gaps initiative.
We have also been trying to better understand the roles of countries and the nature and implications of their inter-connections (see the 2012 IMF Board paper, “Enhancing Surveillance: Interconnectedness and Clusters,” available at www.imf.org). For example, while the Systemic-5 are con-nected with much of the broader system, many other econ-omies form tightly knit trade or financial “clusters”, such as in the euro area or the Asian supply chain. Some economies connect different clusters. These may be called gatekeepers, and include economies such as Austria, which financially links central and eastern Europe, and Sweden, which con-nects the Baltics. These economies can be merely conduits that pass shocks from one economy to another, but they can also dampen or amplify shocks. As such, ensuring their sta-bility can be a global public good, helping to attenuate the propagation of shocks through the system.
The biggest challenge, arguably, is political. Policymakers usually have rigid domestic mandates. It can be difficult to persuade domestic stakeholders to consider, let alone undertake, difficult choices when the benefits accrue internationally. ■
In today’s interconnected world, crises do not recognize borders.

28 Finance & Development September 2012
TIME for a pop quiz. In 2011, which country con-tributed the most to global consumption growth? Answer: China. Yes, the economy where con-sumption is almost universally considered to be
too low contributed more to global consumption growth last year than the traditional front-runner in this category, the United States (see Chart 1).
This is a stunning development. But is it enough to reassure those who have long stressed that China should increase consumption to make its spectacular growth even more inclusive—which would also put the global economy on a more stable and sustainable path of expansion?
low for longThe short answer is no. The fretters still have a point. Household consumption—the ultimate driver of self-sustaining growth—continues to remain low as a share of China’s GDP (see Chart 2). China’s ratio is well below that of countries at a similar income level and of other Asian economies. It is also low relative to the historical experi-ence of other fast-growing economies, such as Korea and Japan, where consumption fell as a share of GDP during the early part of their miracle years. What’s different about China, though, is that household consumption as a share of the national economy was relatively low to begin with and has continued to decline further (see Chart 3). China’s large contribution to world consumption growth therefore
results from its aggregate economy growing faster than that of other major economies, which are still working off the excesses of the pre–financial crisis binge, and not from an
china must boost household consumption even further to make its growth more inclusive
Steven Barnett, Alla Myrvoda, and Malhar Nabar
Sino-Spending
Barnett 1, revised 7/12/12
Chart 1
Tallest towerLast year, consumption grew more in China than in any other major economy. (household consumption, trillion dollars, 2011)
Sources: IMF, World Economic Outlook database; and IMF staff calculations. Note: Converted into dollar terms using period average exchange rate.
Russia Germany Brazil Japan United States China0
0.1
0.2
0.3
0.4
0.5
0.6
0.7
Toy wholesalers in office cubicles at the Yiwu Small Commodity Market, China.

Finance & Development September 2012 29
increase in China’s household consumption as a share of its own economy.
Much of the drop in China’s consumption-to-GDP ratio can be traced to the decline in household disposable income as a share of GDP (Aziz and Cui, 2007). As the economy has become more capital intensive during the period of rapid growth, corporate earnings have risen and household dis-posable income as a share of GDP has dropped. Importantly, the low consumption ratio is well explained by attributes of China’s economy, including the relatively low level of ser-vice sector development, financial underdevelopment, and low real interest rates compared with other economies (Guo and N’Diaye, 2010).
playing it safeThe consumption decline also reflects a rise in household saving rates. In the mid-1990s, the urban household sav-ing rate was less than 20 percent of disposable income. Last year, it passed 30 percent. The rural household saving rate has risen over this period as well, but to a lesser extent than the urban rate (see Chart 4).
What explains this rise in saving rates? There are several dimensions to it. First, precautionary motives have influ-enced saving decisions (Barnett and Brooks, 2010). Since the 1990s, households have borne a larger burden of edu-cation and health expenditures as the state dismantled the “iron rice bowl” welfare system. As state-owned enterprises were restructured, the public services traditionally pro-vided and financed by these entities were reduced. These profound changes to the delivery of welfare services had a substantial impact on households of all ages. Young house-holds increased their savings to finance education expendi-tures for their children, while older households saved more
to provide a buffer against uncertain health expenditures and lower retirement benefits (Chamon and Prasad, 2010; Chamon, Liu, and Prasad, 2010).
Privatization of the urban housing stock was another important development in the 1990s. Home ownership in urban areas has grown rapidly since the initial trans-fer of the housing stock to private ownership by urban residents. Home purchases are still largely financed by personal savings. As young families aspire to home own-ership, their saving rates have increased (Chamon and Prasad, 2010).
Finally, Chinese households have, in recent years, been making spending and saving decisions in an environment defined by rapid change. Social safety net reforms, changes in job opportunities, and new housing objectives—all have influenced the way households make their decisions. Without adequate access to consumer loans or insur-ance that would help them smooth expenses and protect them from major financial loss, Chinese households have self insured: their savings serve as a buffer against future declines in income or health. A fall in the real return on savings induces households to save even more to build that buffer and reach their saving goals. So the decline in real interest rates on savings in the past decade has pushed up urban household saving rates (Nabar, 2011).
reversing the trendThe fact that China was the largest contributor to global consumption growth in 2011 offers a glimpse of the poten-tial for China’s consumption to act as an important source of global final demand. But for this to happen in a durable, self-sustaining way, China must find ways to accelerate its transformation to consumption-based growth.
Barnett 2 revised 7/12/12
Chart 2
Corner playerChina’s average private consumption is low compared with economies of similar income levels.(average private consumption, percent of GDP, 2007-11)
United StatesGreece
PortugalHungary
Australia
Cambodia
TurkeySerbia
Singapore
Czech Republic
Belgium
Malaysia
China
United Kingdom
Denmark
GDP per capita, thousands of dollars0 10 20 30 40 50 60
30
40
50
60
70
80
90
Mongolia
Taiwan POC
SloveniaKorea
Russia
Netherlands
Source: IMF, World Economic Outlook database; and IMF staff calculations.Note: Five-year averages are used to control for business cycle effects.
Barnett 5 revised 7/12/12
Sources: IMF, World Economic Outlook database; and IMF staff calculations.
1 4 7 10 13 16 19 22 25 28 3130
40
50
60
70
80
90
Korea (1961–95)
Japan (1955–87)
China (1990–2011)
Years in reference period
Chart 3
Low and lowerChina’s consumption is below even that of other fast-growing economies whose consumption also fell as a share of GDP during their miracle growth years. (household consumption, percent of GDP)

30 Finance & Development September 2012
The good news is that consumption is already growing rapidly in China—a crucial but often overlooked fact. Real final consumption expenditure has increased since 1995 at an average annual pace of about 8½ percent (see Chart 5). This is an impressive and enviable record, but it just so happens that real GDP growth averaged an even more striking 10 percent. Consumption is growing fast, just not as fast as GDP. The rapid consumption growth goes hand in hand with China’s success in reducing poverty—by more
than 400 million people since 1992—and boosting living standards.
But more work remains to be done. Moving China deci-sively toward consumption-based growth requires progress on the following fronts:• Boost household income by reducing barriers to entry
to labor-intensive service sector jobs; accelerating financial reform to raise returns on savings; and limiting the incen-tives to pursue capital-intensive growth by raising the cost of capital and reforming energy, water, land, and pollution pricing.• Improve the social safety net and curb precaution-
ary motives by expanding public health insurance to cover chronic and catastrophic illness, and by strengthening the pension system (especially improving portability).
• Reduce the need to accumulate savings by expand-ing social housing, improving access to mortgage financing, and tamping down speculative pressures, all to make hous-ing more affordable.
These reforms are in line with China’s 12th Five-Year Plan. If the reforms are diligently implemented, China could successfully transition into an economy driven by private consumption. This would help secure sustainable and inclusive growth in China and, in turn, contribute to strong and balanced global growth. That, no doubt, is the right answer for China and the global economy. ■Steven Barnett is a Division Chief, Alla Myrvoda is a Re-search Officer, and Malhar Nabar is an Economist, all in the IMF’s Asia and Pacific Department.
References:Aziz, Jahangir, and Li Cui, 2007, “Explaining China’s Low
Consumption: The Neglected Role of Household Income,” IMF Working Paper 07/181 (Washington: International Monetary Fund).
Barnett, Steven, and Ray Brooks, 2010, “China: Does Government Health and Education Spending Boost Consumption?” IMF Working Paper 10/16 (Washington: International Monetary Fund).
Chamon, Marcos, Kai Liu, and Eswar Prasad, 2010, “Income Uncertainty and Household Savings in China,” IMF Working Paper 10/289 (Washington: International Monetary Fund).
Chamon, Marcos, and Eswar Prasad, 2010, “Why Are Saving Rates of Urban Households in China Rising?” American Economic Journal: Macroeconomics, Vol. 2, No. 1, pp. 93–130.
Guo, Kai, and Papa N’Diaye, 2010, “Determinants of China’s Private Consumption: An International Perspective,” IMF Working Paper 10/93 (Washington: International Monetary Fund).
Nabar, Malhar, 2011, “Targets, Interest Rates, and Household Saving in Urban China,” IMF Working Paper 11/223 (Washington: International Monetary Fund).
Barnett 5 revised 7/12/12
Chart 5
Just behindConsumption in China has grown, but not as fast as GDP. (annual growth rate, real terms)
Sources: CEIC Data Co., Ltd.; IMF, World Economic Outlook database; and IMF staff calculations.
1991 93 95 97 99 2001 03 05 07 09 110
2
4
6
8
10
12
14
16
18 Household consumption expenditureFinal consumption expenditureGDP
Barnett 4 revised 7/12/12
1996 98 2000 02 04 06 08 10
Chart 4
Save it Urban and rural households in China have been saving more of their income while their economic prospects have improved rapidly. (percent of disposable income)
Sources: National Bureau of Statistics of China, Urban and Rural Household Income and Expenditure Surveys; and IMF staff calculations.
15
20
25
30
35
Rural household saving rate
Urban household saving rate
The good news is that consumption is already growing rapidly in China—a crucial but often overlooked fact.

Finance & Development September 2012 31
Get Back to Basics atwww.imf.org/basics
UnderstandingEconomics
also avaIlable: a compilation of F&D’s profiles of People in Economics, at www.imf.org/people
back to basics: A useful compilation for students and others seeking clear, straightforward explanations of basic concepts in economics.
Find us on Facebook www.facebook.com/FinanceandDevelopment

32 Finance & Development September 2012
For the past five years, the global economic news has often featured declining numbers: asset prices, down; employment, down; industrial production, down. Add to this list China’s external surplus. The world’s
second-largest economy has seen a key measure of its surplus with trading partners—the current account balance, which nets payments to foreigners and income from abroad—drop from $412 billion, or 9.1 percent of GDP, in 2008 to $202 bil-lion, 2.8 percent of GDP, in 2011 (see Chart 1).
Falling numbers generally reflect troubled economic times. But could the decline in China’s external surplus instead be welcome news and a sign that its economy is rebalancing—away from exports toward stable, domestically driven growth? If that is the case, then the rest of the Asian economies will have to adjust because they have become so closely linked to China.
Declining surplusThe sharp compression in China’s external surplus undoubt-edly reflects weak demand in its largest export destina-tions. Most people think of clothes, footwear, and toys from China feeding the U.S. consumer frenzy during the boom years prior to 2007. But Chinese exporters had made much broader inroads into the U.S. market beyond Wal-Mart and Target. Exports of machinery and equipment to the United States contributed 10 to 15 percent of China’s overall export
growth in the early 2000s. That contribution has declined to about 5 percent during the postcrisis period because U.S. private investment, particularly in the housing market, has been subdued. At the same time, China’s imports of minerals and commodities have risen significantly since the crisis, in part due to increases in spending the government undertook to shore up domestic activity.
But beyond these cyclical forces, there are deeper ele-ments at work.
First, China’s dramatic policy response to the global finan-cial crisis—centered on infrastructure such as highways, high-speed rail, and improvements to ease travel between the inland provinces and the coast—contributed to a steep increase in the level of investment. As a percentage of GDP, investment spending in China rose from 41 percent before the crisis to 48 percent by 2009. once the stimulus program started to wane and infrastructure spending began to slow, strong private sector manufacturing activity and construc-tion of social housing ensured that investment remained close to 50 percent of GDP in 2011.
Second, China’s terms of trade (the average price of its exports relative to imports) have worsened in recent years, starting well before the global financial crisis (see Chart 2). As China has developed, its imports have shifted toward minerals, whose prices have been rising, while its exports have moved toward machinery, where competition has kept
China’s external surplus is dwindling, with repercussions for its Asian trading partners
Malhar Nabar and Olaf Unteroberdoerster
A Change
FOCUSin
Truck transports Russian timber past Chinese Timber Trade Exchange to Manzhouli, China, for processing.

Finance & Development September 2012 33
prices in check. other export-oriented economies, nota-bly Japan and Korea, experienced similar declines in their terms of trade as they developed. In China’s case, the sheer size of its trade flows implies that its external surplus has been highly sensitive to shifts in the prices of its exports and imports. And since 2009, the sustained strength in demand for imported commodities and minerals associated with China’s investment boom has reinforced this underlying dynamic of worsening terms of trade.
Third, reflecting in part the underlying shifts in the domestic economy, the real appreciation of China’s cur-rency, the renminbi, has also contributed to a decline in its trade surplus.
A sustained rebalancing?Do China’s shifting trade patterns represent a sustained rebalancing of its economy away from export dependence? Although policy efforts have achieved much in reorienting the economy toward domestic demand, so far the decline in China’s external surplus has been largely achieved through higher investment. The evidence does not yet indicate that household consumption is rising steadily as a share of GDP (see “Sino-Spending,” in this issue of F&D). It is possible that the growth in capacity from the recent elevated invest-ment could eventually be used for domestic production—in higher final sales to Chinese households. But it could also lead to future increases in exports if Chinese firms instead continue to look outward. Alternatively, if the investment turns out to have been misallocated and demand is not forthcoming (domestic or external), it could show up as excess capacity and result in more bad loans in the banking
system. At this point, it is too early to determine how the new capacity will be used. However, it is fair to say that there is growing concern that domestic imbalances are on the rise even as the external ones retreat.
China’s policymakers are cognizant of these risks. The overall policy direction in China, as laid out in 2010 in the 12th Five-Year Plan, focuses on accelerating the transforma-tion of the economy toward one driven by household con-sumption. Policymakers are motivated equally by the side effects of China’s existing growth model—high capital and energy intensity, relatively low job creation, and a shrink-ing income share for labor—and by the sluggish nature of the global recovery. Achieving such a transformation will require changes that include• Higher household disposable income: The floor on
urban wages was raised across the country last year. To pro-tect low-skilled and entry-level workers with minimal bar-gaining power, future increases in the minimum wage will have to keep pace with the increases in the compensation of more experienced and skilled workers. In addition, lowering the social contribution payroll tax (the combined employer Nabar, Revised 6/14/12
2004 05 06 07 08 09 10 11
Chart 2
Terms-of-trade shiftChina’s import prices have, on balance, risen more than its export prices, contributing to a deterioration in its terms of trade (the price of its exports relative to imports).(index, 2004 = 100)
Sources: CEIC Data Co., Ltd.; IMF, World Economic Outlook database; and IMF staff estimates.
60
80
100
120
140
160
–40
0
40
80
120
160
200
Overall
impo
rts
Machin
ery
Mineral
prod
ucts
Metals
(percent, 2004–11)(percent, 2004–11)
Export price growth Import price growth
Overall
expo
rts
Machin
ery
Textile
s
Chem
ical p
roduc
ts
Import prices
Export prices
Terms of trade
200
160
120
80
40
0
–40
Nabar, Revised 8/13/12
0
3
6
9
12
–3 2005 06 07 08 09 10 11
Chart 1
Shrinking imbalanceThe surplus in China’s current account balance has been shrinking since 2008.(current account balance, percent of GDP)
Sources: CEIC Data Co., Ltd.; IMF, World Economic Outlook database; and IMF staff estimates.Note: The current account balance adds together the balance of trade (income from exports
minus payments for imports) and services, income (earnings on foreign investments minus payments to foreign investors), and net cash transfers.
Income balance
Net transfersGoods balance
Services balance
Current account balance

34 Finance & Development September 2012
and worker rate can exceed 40 percent of wages in some cases) would lift the share of remuneration captured by households and induce them to consume more. At the same time, a stron-ger renminbi would make imports cheaper and raise house-hold purchasing power over imported consumer goods. • A stronger social safety net, which would reduce
household precautionary saving and increase consumption: Access to health care must continue to improve—through the recently expanded government health insurance programs, better training of personnel, and adequate incentives for skilled medical staff to relocate to rural areas. The complex-ity of regulations covering pen-sion programs could be further simplified to encourage greater participation in pension plans. Also, more comprehensive education subsidies would ease the impulse to save, particu-larly among young households. • Increases in input costs
and improved corporate gov-ernance: Government subsidies and directives on the cost of production inputs (such as land, energy, and capital) have steadily tilted the economy further toward capital-intensive production. Incentives for excessive investment would be reduced if input costs were raised closer to levels in comparable economies and if the cost of capital were aligned with its high return. The effect of these mea-sures would be greater if they were combined with corporate governance reforms requiring large state-owned enterprises to make more substantial dividend payments rather than hoard profits. • Financial sector reform: The existing system of bank-
based financial intermediation—in which the authorities guide interest rates and the allocation of credit—tends to favor large corporations at the expense of households and smaller firms. A greater reliance on market forces to determine inter-est rates and improved access to a wider range of saving and financing options would improve the efficiency of investment, lift household capital income, and boost consumption.
If these structural reforms were put in place, household income and consumption would rise faster, investment would decline as a share of the national economy, and China would successfully move to a consumption-driven growth model with structurally lower external surpluses. Such an outcome would be the most beneficial for China and its trading partners, many of which, particularly within Asia, are already significantly affected by the changes in China’s trade patterns.
China’s Asian trading partnersTo examine the effect of the shifts in China’s trade on Asian trading partners it is useful to distinguish among China’s roles as a source of regional demand, an export-processing hub, and a competitor.
Asian economies have clearly benefited from China’s strong domestic demand since the recent global recession, in par-ticular for commodities and capital goods. While the rapid growth of Asian exports to China has been fueled by its role as the center of an Asian supply chain that culminates in exports to advanced economies, economic activity within China has become more important as a source of demand in recent years. IMF estimates suggest that, when Japan is excluded, about 60 to 70 percent of the recovery in Asia’s exports to China above precrisis trends can be attributed to China’s domestic demand.
overall, China’s demand for investment goods has risen more sharply than its demand for consumer goods. As a result, based on value added, the typical Asian trading part-ner exports roughly 30 percent more capital goods to China than consumer goods, a rever-sal from the ratio of capital to consumer goods exports 10 years ago. For Asia’s leading capital goods exporters—Japan
and Korea—China accounts for 20 to 25 percent of such exports, a fourfold increase from a decade earlier.
Exports to China from commodity producers such as Australia and Indonesia have also risen sharply. China accounts for about two-thirds of the world’s iron ore imports, half of its soybean imports, and about one-third of metals imports. As a result, Chinese demand has an impact beyond Asia. In Africa, for example, Chinese firms have become major investors in the mining and infrastructure sectors. In Latin America, the economic cycle depends in no small measure on economic activity in China. According Nabar, Revised 7/9/12
1996 97 98 99 2000 01 02 03 04 05 06 07 08 09
Chart 3
Shifting focusChina’s neighbors are exporting a growing amount of intermedi-ate goods to the world’s second–largest economy, while reducing their consumer goods exports to the United States and Europe.(percent of total exports by Asia, excluding China)
Source: United Nations Comtrade database.
Intermediate goods exports to China
0
4
8
12
16
20
Consumer goods exports to the United States and Europe
Incentives for excessive investment would be reduced if input costs were raised closer to levels in comparable economies and if the cost of capital were aligned with its high return.

Finance & Development September 2012 35
to recent IMF estimates (2012), should production in China abruptly slow (a hard landing, as economists say), commod-ity prices would fall by about 20 to 30 percent and severely affect economic activity, fiscal revenue, and debt levels in Latin America. That would be an impact similar in magni-tude to what the region experienced after the collapse of the U.S. investment banking firm Lehman Brothers in 2008.
However, regional trading partners would have to adapt to rebalancing in China that shifts from investment-led to consumption-led growth. To begin with, despite rapid growth, China’s role as an importer of consumer goods is still small. The world’s second-largest economy accounts for only 2 percent of the world’s consumer goods imports. In addition, Chinese consumers have increasingly turned toward domestically produced goods—China’s share in global consumer goods imports has fallen behind its share in global consumption. This may reflect a number of factors, including the inability of foreign producers to overcome implicit barriers—for example, by setting up large retail and distribution networks—increased competitiveness from domestic producers, or a shift by foreign firms to produce locally to adjust to Chinese consumer preferences and to be closer to the customer. Whatever the reasons for the relative decline in Chinese imports of consumer goods, a shift in the share of global consumer demand toward China would not automatically imply a proportional increase in global con-sumer goods imports. Nevertheless, suppliers in Asia and elsewhere could still benefit, if only indirectly, from a shift toward consumption-led growth in China by integrating themselves into the supply chain of Chinese firms that cater to the domestic market.
At the hubAsian trading partners have also benefited from growing export links with China, which is the center of the Asian supply chain hub. China today accounts for more than 50 percent of all imports of intermediate goods (those used as part of the production process) within the region—twice its share in the mid-1990s. For Asia excluding China, the share of intermediate goods exports to China in total exports has doubled over the past decade. That is in con-trast to the share of direct consumer goods exports to the United States and the euro area, which has steadily declined (see Chart 3). As a result of being part of the supply chain, Asian economies’ exports to China have increasingly been driven by the success of China’s exports in world markets. This means, however, that if the rapid growth of Chinese exports slows, Asian trading partners will also face sig-nificant headwinds. We estimate that a 1 percentage point drop in Chinese export growth would lower the growth of exports of other Asian economies to China by about ⅓ per-centage point. Moreover, for most Asian economies—which export mainly manufactured goods, not commodities—Chinese exports rather than Chinese domestic demand appear to be the dominant factor in determining their exports to China. The link with China’s export performance appears to be relatively stronger for capital goods exporters
such as Japan and Korea and for some smaller highly open economies in Southeast Asia.
on the other hand, because Asian economies are linked through supply chains, China’s role as a competitor has been less important. In fact, measuring the increase in China’s share of gross exports to leading markets overstates its importance. China’s dominance shrinks when its share is measured on a value-added basis—which nets out direct and indirect inputs from other Asian economies. In the case of the United States for example, China’s direct share of gross imports of final goods from Asia was 62 percent in 2010, whereas, on a value-added basis, its share was less than 50 percent. The implication for more advanced economies in Asia is that any potential increase in competition with China as its exports shift increasingly toward high-tech goods will also depend on China’s ability to capture a larger share of the value chain. While the imported content in Chinese exports gradually increased through the mid-2000s, it began to fall in recent years—a trend that could be reinforced by China’s rapid buildup in physical and human capital, which could allow it to capture large parts of the technology-intensive value chain. In addition, rising fuel and transportation costs could lead to a partial reversal of so-called vertical trade integration by reducing the number of locations in a pro-duction chain. However, more outsourcing and relocation of industries could result from rising wages in China, which may help low-income economies in the region, given their abundance of cheap labor.
HeadwindsFor now, the recent sharp decline in China’s external sur-plus appears to be the product of a secular worsening of China’s terms of trade, robust import growth fueled by very high investment demand, and cyclically weak external demand. At the same time that China’s external imbalances are shrinking, there is concern that new domestic imbal-ances may be emerging. As a result, Asian trading partners that have benefited from China’s investment-led growth may face growing headwinds to their exports in the event that the domestic imbalances eventually disrupt growth in China. Given the importance of vertical supply chain links with China, they would also be hurt if China’s exports were to slow. By contrast, the net benefits for Asian trading partners from rebalancing in China would be larger and more lasting, if they are able to increase their direct and indirect access to Chinese consumers. ■Malhar Nabar is an Economist and Olaf Unteroberdoerster is a Deputy Division Chief, both in the IMF’s Asia and Pacific Department.
This article is based on a recent IMF Working Paper (12/100), “An End to China’s Imbalances?” and Chapter 4 of the IMF’s April 2012 regional Economic outlook: Asia and Pacific, “Is China Rebalancing? Implications for Asia.”
Reference:International Monetary Fund (IMF), 2012, regional Economic
outlook: Western Hemisphere (Washington, April).

36 Finance & Development September 2012
India and China can learn a lot from each other as they advance in their development journeys
Murtaza Syed and James P. Walsh
Tiger
DragonThe and the
Chinese technician speaks with Indian worker about concrete machinery in Pune, India.
CHINA and India are the giants of the emerging world. With more than a third of the world’s population between them, these two countries would have an im-
mense effect on global trends even if they were not growing rapidly. But over the past 10 years, China and India have also been among the fastest growing economies in the world. Since 1995, average income in China has increased almost tenfold, while in India it has nearly quadrupled. Despite very different po-litical and economic systems, both countries have lifted millions from poverty, while income inequal-ity and environmental degradation have worsened. Given the scale of these changes, the emergence of India and China has had profound implications for the rest of the world.
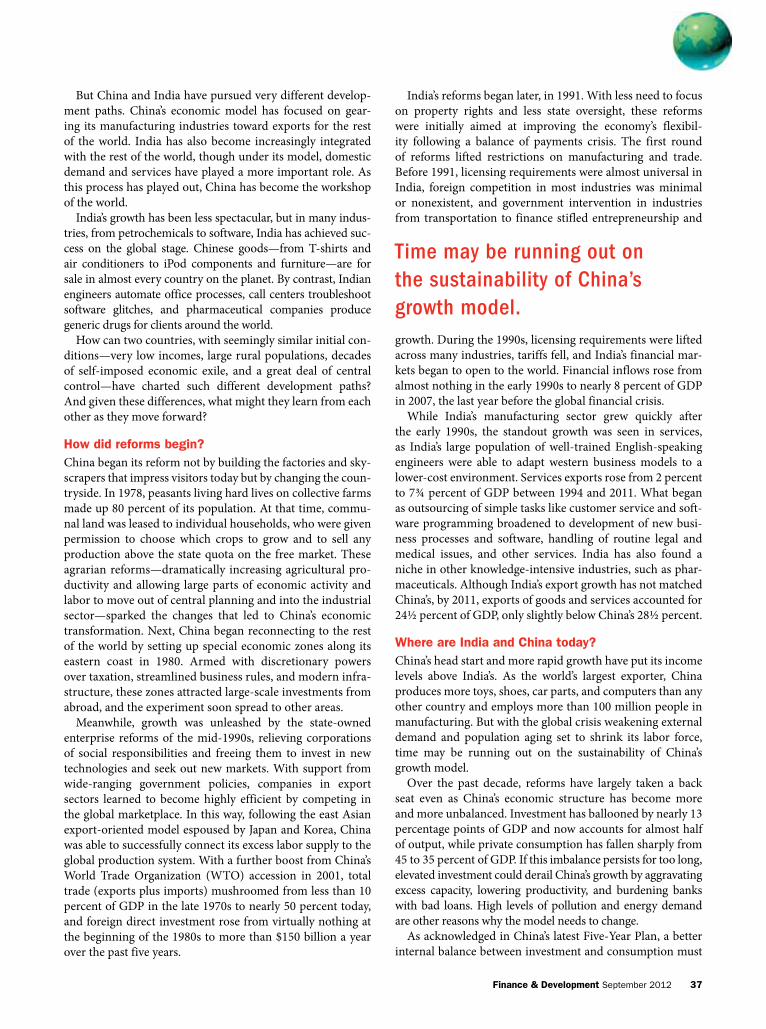
Finance & Development September 2012 37
But China and India have pursued very different develop-ment paths. China’s economic model has focused on gear-ing its manufacturing industries toward exports for the rest of the world. India has also become increasingly integrated with the rest of the world, though under its model, domestic demand and services have played a more important role. As this process has played out, China has become the workshop of the world.
India’s growth has been less spectacular, but in many indus-tries, from petrochemicals to software, India has achieved suc-cess on the global stage. Chinese goods—from T-shirts and air conditioners to iPod components and furniture—are for sale in almost every country on the planet. By contrast, Indian engineers automate office processes, call centers troubleshoot software glitches, and pharmaceutical companies produce generic drugs for clients around the world.
How can two countries, with seemingly similar initial con-ditions—very low incomes, large rural populations, decades of self-imposed economic exile, and a great deal of central control—have charted such different development paths? And given these differences, what might they learn from each other as they move forward?
How did reforms begin?China began its reform not by building the factories and sky-scrapers that impress visitors today but by changing the coun-tryside. In 1978, peasants living hard lives on collective farms made up 80 percent of its population. At that time, commu-nal land was leased to individual households, who were given permission to choose which crops to grow and to sell any production above the state quota on the free market. These agrarian reforms—dramatically increasing agricultural pro-ductivity and allowing large parts of economic activity and labor to move out of central planning and into the industrial sector—sparked the changes that led to China’s economic transformation. Next, China began reconnecting to the rest of the world by setting up special economic zones along its eastern coast in 1980. Armed with discretionary powers over taxation, streamlined business rules, and modern infra-structure, these zones attracted large-scale investments from abroad, and the experiment soon spread to other areas.
Meanwhile, growth was unleashed by the state-owned enterprise reforms of the mid-1990s, relieving corporations of social responsibilities and freeing them to invest in new technologies and seek out new markets. With support from wide-ranging government policies, companies in export sectors learned to become highly efficient by competing in the global marketplace. In this way, following the east Asian export-oriented model espoused by Japan and Korea, China was able to successfully connect its excess labor supply to the global production system. With a further boost from China’s World Trade organization (WTo) accession in 2001, total trade (exports plus imports) mushroomed from less than 10 percent of GDP in the late 1970s to nearly 50 percent today, and foreign direct investment rose from virtually nothing at the beginning of the 1980s to more than $150 billion a year over the past five years.
India’s reforms began later, in 1991. With less need to focus on property rights and less state oversight, these reforms were initially aimed at improving the economy’s flexibil-ity following a balance of payments crisis. The first round of reforms lifted restrictions on manufacturing and trade. Before 1991, licensing requirements were almost universal in India, foreign competition in most industries was minimal or nonexistent, and government intervention in industries from transportation to finance stifled entrepreneurship and
growth. During the 1990s, licensing requirements were lifted across many industries, tariffs fell, and India’s financial mar-kets began to open to the world. Financial inflows rose from almost nothing in the early 1990s to nearly 8 percent of GDP in 2007, the last year before the global financial crisis.
While India’s manufacturing sector grew quickly after the early 1990s, the standout growth was seen in services, as India’s large population of well-trained English-speaking engineers were able to adapt western business models to a lower-cost environment. Services exports rose from 2 percent to 7¾ percent of GDP between 1994 and 2011. What began as outsourcing of simple tasks like customer service and soft-ware programming broadened to development of new busi-ness processes and software, handling of routine legal and medical issues, and other services. India has also found a niche in other knowledge-intensive industries, such as phar-maceuticals. Although India’s export growth has not matched China’s, by 2011, exports of goods and services accounted for 24½ percent of GDP, only slightly below China’s 28½ percent.
Where are India and China today?China’s head start and more rapid growth have put its income levels above India’s. As the world’s largest exporter, China produces more toys, shoes, car parts, and computers than any other country and employs more than 100 million people in manufacturing. But with the global crisis weakening external demand and population aging set to shrink its labor force, time may be running out on the sustainability of China’s growth model.
over the past decade, reforms have largely taken a back seat even as China’s economic structure has become more and more unbalanced. Investment has ballooned by nearly 13 percentage points of GDP and now accounts for almost half of output, while private consumption has fallen sharply from 45 to 35 percent of GDP. If this imbalance persists for too long, elevated investment could derail China’s growth by aggravating excess capacity, lowering productivity, and burdening banks with bad loans. High levels of pollution and energy demand are other reasons why the model needs to change.
As acknowledged in China’s latest Five-Year Plan, a better internal balance between investment and consumption must
Time may be running out on the sustainability of China’s growth model.

38 Finance & Development September 2012
be found to sustain growth in the coming years. To achieve it, the artificially low cost of investment needs to be redressed by increasing the price of capital, further raising the price of other key inputs (such as land, energy, and water) in line with international levels, and better protecting the environ-ment (see “A Change in Focus,” in this issue of F&D). And consumption needs to be spurred both by boosting house-hold income—through an expansion of the labor-intensive service sector and increased employment in higher value–added and more human capital–intensive activities—and by lowering household and corporate savings—through a stronger social safety net and financial reform that remu-nerates households more fairly and allocates capital more efficiently. It is encouraging that most of these reforms are on the radar screen of the Chinese government, but timely implementation will be key.
In India, a vibrant services sector has given the country something highly unusual among emerging market econo-mies: many world-beating private companies in high value–added areas. Companies like Infosys, Wipro, and TCS compete at the top rank of information technology services around the world. But information technology employ-ment in India is estimated to cover only 2½ million people, or less than half a percent of the working-age population. And with average income only around $1,500 a year, wages remain low for most.
As India’s working-age population grows rapidly over the coming decades, more people than ever will enter the labor force. Providing them with good job opportunities will require a host of reforms. Education and health care will have to be improved, and regulation of labor-inten-sive industries, especially in manufacturing, will have to be overhauled. Constraints on growth—from inadequate port capacity and overcrowded roads to clumsy allocation of mining rights and electrical blackouts—will have to be addressed. Improving the business climate by simplifying rules, removing red tape, and lowering barriers to foreign trade is also crucial. And the financial system will have to be improved so more people have the ability to save and borrow, and so corporations can more easily undertake long-term investments.
Without sustained reforms, job creation could stall. And all this will have to be done while the government and reserve Bank of India keep a lid on both inflation, which in recent years has risen to high levels, and the budget deficit, which has stubbornly refused to fall since the global finan-cial crisis and might be crowding out investment and ham-pering capital market development.
Sharing common challenges India and China also face some common challenges. In particular, growth needs to be made more inclusive in both countries. China and India’s records in poverty reduction are without historical precedent. In India, between 1993 and 2009, the number of people living below the poverty line fell from 36 to 22 percent of the population. Since reforms began in China, more than 400 million people have
been lifted out of poverty. Impressive as these numbers are, many have been left behind. In India, 250 million people remain poor, and the quality of public education and health services for many, particularly in rural areas, remains very low. In China, rural productivity has stagnated in recent years, and public services must adapt to meet the aspira-tions of a rising middle class for better-quality education and health care.
In addition, inequality has risen rapidly in both coun-tries. Wages for educated groups, particularly in urban areas, have risen far faster than wages for the poor, espe-cially in the countryside. The difference between the lives of middle-class urbanites, whose living conditions increas-ingly approximate those of people in developed countries, and the large numbers of still-poor people in the country-side and in regions that have not benefited fully from rapid growth, has bred social tensions in both countries.
Learning from each otherTo sustain their impressive growth performance, both China and India need to move toward an economic structure that better balances domestic and external demand, as well as manufacturing and services. In achieving this balance, the two countries—which so far have relied on very different development strategies—would do well to take a leaf or two out of each other’s books.
First, given China’s head start, what can India learn from its neighbor’s longer record? one area that is often overlooked is the role that agrarian and rural reforms played in spurring China’s initial development. Growth in agricultural produc-tivity both freed up labor to work in the industrial sector and released pent-up demand for a variety of industrial products. While India underwent its own Green revolution in the 1960s and 1970s, broader issues of pricing and public investment remain unresolved. To capitalize on its ongoing reforms, India must look to create greater synergies between agriculture and industry, as China was able to do at the beginning of its take-off period. After all, half of India’s workers and one-sixth of its output are dependent on agriculture.
Another area where China has been more conspicuously successful is international trade and drawing in foreign invest-ment, in turn leading to job creation. China has become the world’s most central trader by allowing imports and foreign direct investment access to the economy, though admittedly often with strings attached, while creating the conditions for domestic companies to adjust to strong foreign competition.
The policies that have supported this success included the establishment of flexible special economic zones and a liberal foreign investment regime, a business climate and regulatory environment supportive of export industries, stable macro-economic policies, and reform of state-owned enterprises. Although no country’s experience is perfect, India could learn something from China on how to open domestic markets to competition and how government policies can help develop manufacturing and facilitate employment.
In addition, the factor that has been a roadblock for India has become a driver of Chinese growth: China has long been

Finance & Development September 2012 39
the world’s largest investor in infrastructure, building roads sometimes even before the towns that they will eventually serve exist. China’s focus on exports has led the country to invest heavily in freight and now passenger rail, port facilities, airports, and even highways. Urban infrastructure in China’s large cities has developed rapidly, with subways in Shanghai and Beijing now among the world’s most extensive. China’s investment in energy—traditionally in coal but now encom-passing all varieties of renewable energy sources as well—is also the world’s largest.
In India, conversely, infrastructure has been a stumbling block. Investment in railroads is complicated by direct gov-ernment ownership. Some airport privatizations have been successful, but investment in port facilities has been lagging,
and energy generation and transmission have been hurt by poor pricing models and regulations that greatly add to the costs of investment. This leaves plenty of room to improve how India implements infrastructure plans to support develop-ment, improve connectivity, and lower the cost of exporting. The rapid pace of China’s infrastructure development may not be fully or easily replicated in other countries, but it certainly presents lessons for tying infrastructure investment to devel-opment goals.
on the other hand, what lessons could India offer to China? one key area is India’s relatively more advanced and market-based financial sector. In particular, despite its rela-tively low level of income, India has a highly sophisticated and transparent stock market. Its openness to foreign inves-tors means that listed companies have effectively open access to the investment capital of foreigners. This has not only been an important source of finance for Indian companies that might otherwise have been unable to gain access to for-eign capital, but has also introduced transparency and open-ness in the corporate culture. Listing a company on India’s equity markets requires a similar level of disclosure to that in developed economies. This has improved market discipline and faith in large corporations.
And while both countries’ financial systems remain state dominated and opportunities for foreign investors remain lim-ited, India’s is more market oriented. Deposit rates at banks are fully liberalized, improving the returns that savers can receive. Both public and private banks compete for the business of large companies, encouraging efficiency and a better allocation of resources. By contrast, China’s stock market is significantly more closed to foreign investors and relatively nontransparent. Improving oversight of the stock market and opening it up to foreigners would increase the information available to inves-tors, improving market discipline and the allocation of capital. Companies that have little prospect of engaging in joint for-
eign direct ventures with foreign companies would also be able to raise capital more easily. A more competitive banking sys-tem would have similar beneficial effects, as well as increasing household financial income.
In addition, as China’s economy rebalances, it could also pick up some tricks from how India has managed to develop services. India’s more market-driven financial sys-tem, though far from perfect, allocates capital to companies with less government interference and fewer distortions. Similarly, with concerns rising about the ability of its man-ufacturing industries to innovate, China might learn from India’s “invisible human infrastructure.” Through support for vocational education as well as export-oriented technol-ogy parks that have fostered the growth of clusters, India’s
government has been able to develop and sustain advantages in the kinds of industries that China will need to develop to avoid the middle-income trap. In all these areas, India’s strong protection for intellectual property has also been crucial.
With the right policies, the importance of China and India to the global economy will only increase as they sustain their brisk growth and their populations become even more inter-connected with the rest of the world. Both countries have come a long way since opening their economies a generation ago. From countries with very large but poor populations with minimal linkages to the rest of the world, China and India have become the world’s second- and third-largest economies in purchasing-power-parity terms. Their differing economic models demonstrate that there is no single way for countries to develop, and present varied challenges for sustaining their growth over the medium term.
Nevertheless, in both countries many people remain behind, with poor access to high-quality public services and few prospects for economic improvement. In India, improving infrastructure and opening the manufacturing economy to competitive forces would help accelerate growth and make it more inclusive. China knows a thing or two about these areas. In China, weaning the economy away from manufacturing and exports toward services and consumption and making the financial system more market oriented would help sustain growth and broaden its benefits. In these areas, India has had successes.
While China and India have come a long way down very different roads, they have plenty to learn from each other as they chart the next phase of their remarkable development. ■
Murtaza Syed is the IMF’s Deputy Resident Representative in China. James P. Walsh is a Senior Economist in the IMF’s Asia and Pacific Department.
With the right policies, the importance of China and India to the global economy will only increase.

40 Finance & Development September 2012
IN a startling turnaround, Myanmar is emerging from decades of seclusion from the rest of the world. The
new government of Thein Sein has initiated historic political and economic reforms that are reintegrating Myanmar into the glob-al community and jump-starting its economic development.
But paving the way for a better future for Myanmar will require firm resolve by its policymakers to sustain the momentum of reform and translate it into concrete gains for the people. And other countries can help Myanmar benefit from their experience through much-needed technical and development assistance.
Inching toward reformMyanmar has taken a series of steps toward political recon-ciliation and democratization. Political reforms since March 2011 include the release of political prisoners, relaxation of media censorship, a new labor law that allows for labor unions, and several cease-fire agreements with ethnic minor-ities. A more visible sign of this political process is the most famous new member of parliament, opposition leader Aung San Suu Kyi, who until late 2011 was under house arrest.
These steps have triggered a positive response from the international community. Following the April by-elections that carried Suu Kyi and her National League for Democracy party to Parliament, the United States, the European Union, Canada, and Australia agreed to suspend most of their eco-nomic sanctions against Myanmar, although U.S. markets remain closed to Myanmar’s exports.
Myanmar is rich in natural resources, including natural gas, gems, minerals, and forestry products, and it has a young labor force. Its membership in the Association of Southeast Asian Nations (ASEAN), which Myanmar will chair in 2014, and its proximity to India and China make it a strategic bridge in one of the most dynamic regions in the world.
With the new political openness, hotels in Yangon are already full of foreign businessmen exploring entrepreneurial possibili-ties. They are immediately recognizable—meeting in lobbies and traveling around the city in their business suits, braving the Myanmar heat. Many large foreign companies, including Coca-Cola, Chevron, and General Electric, have announced plans to invest in Myanmar.
The air is filled with optimism for economic growth and improved living standards, but so far there has been little tangi-ble change on the ground. Daily electricity cuts are routine not only in the commercial center, Yangon, where use of generators is widespread, but also in the new capital Nay Pyi Taw, despite a nearby hydroelectric dam. roads are poor, financial services are rudimentary, and living standards remain among the lowest in the region. The lack of skills in younger generations points to the erosion of human capital caused by the poor education policies over the past few decades. And sectarian and ethnic conflicts continue to flare up in some regions, underscoring risks to the reform process.
Notwithstanding these challenges, the new government has begun a series of economic reforms. Myanmar’s currency, the kyat, has been officially pegged at an artificially low rate since 1977. This artificial rate, combined with restrictions on interna-tional payments and transfers, led to the rapid growth of infor-
Nay Pyi Taw
YangonBay ofBengal
Gulf ofThailand
CHINA
CHINA
INDIA
THAILAND
VIETNAM
BHUTAN
LAO P.D.R.
BANGLADESH
CAM
BODI
A
MYANMAR
IBRD 39470AUGUST 2012
MAPBackon the
Myanmar’s reintegration into the global economy promises a better future for its people
Peop
le o
n gr
ound
s of
Shw
edag
on P
agod
a, M
yanm
ar.
Meral Karasulu and Sergei Dodzin

Finance & Development September 2012 41
mal currency markets with several different exchange rates and discouraged trade and investment. The current plan is to reform the exchange rate system to facilitate interaction with the outside world. The central bank replaced the fixed official exchange rate on April 1 with a market-based exchange rate, bringing it closer to the widely used informal market rates. There is still some way to go to unify all informal market rates, primarily by eliminat-ing the remaining restrictions on international payments and transfers. The government is preparing the legal framework and the market infrastructure to accomplish this important step by 2013, in order to welcome the 27th South Asian Games to Myanmar with a modern foreign exchange market.
The new government’s budget was discussed in Parliament in February, a historic first step toward fiscal transparency. The budget aims to double spending on health and education compared with the previous year, with the support of higher gas revenues, which are now recorded at the market exchange rate. But improving human capital will take sustained efforts over many years.
Cognizant of these challenges, the government is drafting a national economic plan to reduce the number of people living below the poverty line from 26 percent (as reported in a recent national survey) to 16 percent by 2015.
A new foreign investment law will allow foreign investors to lease land and set up businesses without local partners. It will also provide tax incentives to encourage technology transfer and job creation through foreign direct investment, which is currently low compared with Myanmar’s neighbors and has strong potential for growth. Three new special economic zones are planned, with high-quality roads, deep-sea ports, electric-ity, and other infrastructure to attract foreign investment into light manufacturing destined for exports. A land reform will give land titles to farmers to help raise agricultural productivity.
Promising futureThe country’s economic prospects have improved as a result of these efforts. The IMF projects real GDP growth to increase to
6¼ percent for fiscal year 2012/13, against an average of about 5 percent in the past five years. Inflation is projected to decline to about 6 percent, much lower than the double-digit inflation experienced in the past decade. This is mainly due to recent appreciation of the kyat in the widely used parallel markets and to less printing of money to finance government expenditures. The new Shwe and Zawtika gas fields, discovered in late 2000s, will significantly increase gas reserves and boost export reve-nues starting in 2013.
However, Myanmar’s economy still depends largely on agri-culture and energy and remains relatively closed to the rest of the world (see chart). Diversifying this economic base is essential to broaden the benefits from global integration and reduce risks to macroeconomic stability. For instance, reliance
on exports of natural resources could make the economy more vulnerable to commodity price fluctuations. At the same time, large inflows into the resource sector could lead to sustained currency appreciation, thereby undermining the limited com-petitiveness of other exports. Part of these risks can be managed with appropriate macroeconomic policies—for example, a fis-cal framework that saves windfalls when commodity prices are high and uses these savings during “rainy days” when prices are low could help limit boom and bust cycles.
Sustainable, broad-based growth beyond agriculture and energy requires nurturing the domestic private sector with a better business climate. Less red tape; more consistent and transparent policies to reduce high costs of doing business in Myanmar; and better infrastructure such as electricity, roads, railways, ports, and information technology would help the domestic private sector compete and grow.
The financial system has a large role to play in facilitating this process by improving access to finance for the millions of Myanmar citizens who have never had a bank account. Some steps have been taken since 2010 to liberalize the banking sys-tem, but with credit to the economy at 8½ percent of GDP—among the lowest in the region—there is room to expedite banking modernization efforts. It will be essential to further lib-eralize branch expansions, allow banks to set their own deposit and lending interest rates and offer financial products to fit the needs of a growing economy, and modernize the payment sys-tem. These steps should go hand in hand with strengthening supervision and regulation to maintain financial stability. Plans to allow joint ventures with foreign banks are one step in the right direction, and would help to prepare the financial sector for ASEAN financial integration in 2015.
Myanmar has a long way to go to fully integrate with the rest of the world and bring the benefits of this integration to its citi-zens, but it has begun the journey toward a brighter future. ■Meral Karasulu is a Deputy Division Chief and Sergei Dodzin is a Senior Economist, both in the IMF’s Asia and Pacific Department.
Karasulu, 7/23/2012
Sri La
nka
Mongo
lia
Papu
a New
Guinea
Vietna
m
Lao P
.D.R.
Cambo
dia
Bang
lades
hNep
al
Myanm
ar
Open upMyanmar’s economy remains relatively closed to the rest of the world compared with other Asian economies.(trade openness, percent of GDP, 2011)
Sources: Country authorities; and IMF staff estimates.Note: Trade openness is the sum of exports of goods and services and imports of goods and
services as a percent of GDP.
020
40
60
80
100
120
140
160
180
Myanmar is emerging from decades of seclusion from the rest of the world.

42 Finance & Development September 2012
New database shows gaps in how people save, borrow, make payments, and manage risk
PICTURE THIS
Access toBANKING Services
FIFTY percent of adults worldwide do not have an account in a formal financial institu-tion—a bank, credit union, cooperative, post office, or microfinance institution. These 2.5 billion “unbanked” adults lack a safe place to save and are likely to have only limited access to credit. And without an account in a financial institution, it is more difficult
for people to receive wages, remittances, and government payments. Until now, however, indicators on the banking practices of the poor, women, and young
people were lacking for most economies. To address this gap, the World Bank and Gallup carried out a survey in 148 economies during 2011 to find out how adults save, borrow, make payments, and manage risk both inside and outside the formal financial sector.
Huge differencesAs expected, the data reveal sharp disparities across regions, countries, and individual characteristics (such as gender, education, and age). According to the World Bank’s Global Findex database, 89 percent of adults in advanced econo-mies have a bank account, compared with 41 percent of adults in developing countries. Among the poorest, 23 per-cent of adults living on less than $2 a day have accounts. Worldwide, 55 percent of men have a bank account, com-pared with 47 percent of women.
The most common reasons for not having a bank account are not having enough money to use one (cited by 65 per-cent), banks or accounts that are too expensive or too far away (cited by 25 and 20 percent, respectively), and not having the necessary documentation (18 percent). These reasons suggest that removing physical, bureaucratic, and financial barriers could expand the use of bank accounts and the financial advantages that accompany them.
PT, 7/11/2012
Half of adults in the world do not have a bank account.(adults with an account at a formal �nancial institution, percent)
Global average (50 percent)
0
20
40
60
80
100
South
Asia
Sub-S
ahara
n Afric
a
Middle
East
and
North A
frica
Latin
Ameri
ca
and C
aribb
ean
Europ
e and
centr
al As
iaEa
st As
ia
and P
aci�c
Advan
ced
econ
omies
55% 47%OF WOMENOF MEN
HAVE A BANK ACCOUNT

Finance & Development September 2012 43
Mobile revolutionThere is a bright spot in the expansion of financial services in the developing world: the recent introduc-tion of “mobile money.” Although many are familiar with the money transfer system M-PESA in Kenya, the data show the success of mobile money through-out sub-Saharan Africa, where 16 percent of adults report having used a mobile phone to pay bills or send or receive money in the past 12 months. About half of these adults are otherwise unbanked. However, the global average for mobile money use in developing countries is only 5 percent, suggesting there are still regulatory and other barriers to the introduction of mobile money in other regions. ■
Mobile banking takes off in Africa.(adults using a mobile phone in the past year to pay bills or send or receive money, percent)
31-6061+No data
0-1011-30
Woman at Chamroeun microfinance branch office in Pochentong, Cambodia.
Street scene in Nairobi, Kenya.Commuters in Tokyo, Japan.
Prepared by Asli Demirguc-Kunt and Leora Klapper of the Financial and Private Sector Development Network of the World Bank. The data are from the Global Findex database, which is derived from more than 150,000 interviews in 148 economies and available at www.worldbank.org/globalfindex
9%41%OF PEOPLE IN DEVELOPING COUNTRIES89%
OF PEOPLE IN ADVANCED ECONOMIES
OF ADULTS HAVE BORROWED FROM A BANK IN THE PAST YEAR
PT, 7/11/2012
Most people do not use banks to borrow money.(adults borrowing from source in the past year, percent)
Advanced economies
Note: Borrowing may be from more than one source.
Developing countries0
5
10
15
20
25Informal lenderBank, credit union, or micro�nance institutionRetail store (store credit)Friends or family
Saving clubs and friendsGlobally, 36 percent of adults said they have saved some money in the past 12 months, but only 22 per-cent of adults report having saved at a bank or other formal financial institution. About 9 percent of adults around the world have borrowed from a bank in the past 12 months, compared with 23 percent who bor-rowed from friends or family. In developing countries, community-based saving clubs are another common alternative (or complement) to saving at a bank. Such a club—known as a susu in West Africa and a pandero in Peru—generally operates by pooling the weekly deposits of its members and disbursing the entire amount to a different member each week.
HAVE A BANK ACCOUNT

44 Finance & Development September 2012
A DEEP and well-functioning finan-cial sector—which includes banks, investment firms, pension funds, and insurance companies—can
offer great advantages to society. Firms have better access to the capital they need for in-vestment. Individuals can better smooth their spending over time—saving in good times to prepare for bad times and retirement. By connecting those with too much savings and those with too little, a strong financial sector can raise long-term growth.
But, as the 2008–09 global economic crisis showed, the financial sector can also impose significant costs on the broader economy. Among other factors, the combination of excessive risk taking, high leverage, and heavy reliance on short-term wholesale finance triggered heavy losses for many important
financial institutions in advanced econo-mies. Governments feared that if
major institutions went bank-rupt, the effect on production
and employment would be enormous. To stave off a
systemwide financial col-lapse, governments in North America and Europe spent an aver-age of 3 to 5 percent of GDP to support
the financial sector directly. Governments also issued guarantees and other commit-ments that totaled about 17 percent of GDP on average. Even though the authorities kept the financial system from imploding, the crisis still triggered a global recession that resulted in a cumulative loss of output of about 25 per-cent of GDP (IMF, 2012).
Many European governments have recently introduced taxes on the financial sector to recover the fiscal cost of the bailouts. But discus-sions continue in Europe on the role that finan-cial sector taxation could play in safeguarding the financial system. To that end, the European Commission has proposed a coordinated finan-cial transactions tax for all 27 member states.
Taxation of the financial sector can be seen in two ways. First, when applied to risky behavior, taxes can be a corrective tool that reduces the probability of future crises. And second, financial sector taxes can also pro-vide a means of adding to government cof-fers the resources necessary to cover costs of past and any future crises.
Taxation could supplement regulation of financial institutions because it can be focused on risks to the overall financial sys-tem rather than just on individual financial institutions (Keen, 2011). While regulations like minimum capital requirements cre-ate buffers that help individual institutions absorb losses, taxation can provide the
resources governments need to inter-vene systemwide. Furthermore,
over time, taxation allows for more efficient distribution of losses—by collecting from
the current generation to pay for the losses its actions might
impose on future generations.
Many European policymakers are warming to the idea of broadening taxation of the financial sector
Geoff Gottlieb, Gregorio Impavido, and Anna Ivanova
TAXING Finance
44 Finance & Development September 2012

Finance & Development September 2012 45
Eliminating distortionsFinancial sector taxes could be used to eliminate distortions in the tax system that may have contributed to the recent financial crisis. For example, the fact that a value-added tax (VAT) is not applied to financial services may help explain the disproportionate growth of the financial sector in recent years. Similarly, the ability of financial—as well as nonfi-nancial—firms to deduct interest payments from their taxes may have encouraged excessive reliance on debt rather than equity financing.
But proponents of financial sector taxation want to do more than reduce existing distortions. They want to design a tax that can make the financial sector bear the social cost of risky behavior. The recent crisis demonstrated that the con-sequences of a financial sector crisis are not limited to those directly involved in the underlying financial transactions,
but can extend to society at large. The underlying rationale for such a tax would be similar to the justifications for taxes on pollution: the polluter is forced to pay for the costs it imposes on society.
There are at least two difficulties in implementing such taxes. First, there is the question of whether the systemic risk posed by the financial sector can be defined and measured. Second, regulators must identify the market activity or charac-teristic that poses this systemic risk.
Experts have yet to define “systemic risk” in a way that can be of operational use. However, there has been progress in identifying some of the possible sources of systemic risk:• Size and interconnectedness: An institution that is consid-
ered too big to fail or has too many relationships with other financial institutions (too interconnected to fail) benefits from artificially low funding costs because investors presume it will be bailed out by the state if it faces insolvency. This implicit sub-sidy encourages firms to become large. A tax that would help offset this subsidy—particularly with a progressive rate structure (in which that rate increases as the taxable amount increases)—would reduce the incentive to become systemically important. • Asymmetric treatment of benefits and costs: Some
financial institutions are protected from bearing downside risks because they are too big to fail and/or because they have limited legal liability. Such protection creates incen-tives for excessive risk taking in all corporate entities, but they are particularly acute in highly leveraged banks. To tackle those issues, higher taxes can be imposed on prof-its that exceed a certain benchmark. Because some excess returns may be paid out as wages (including bonuses), taxing wages above a certain threshold could serve the same purpose.
• Funding structure: At different times during the recent crisis, banks’ excessive reliance on relatively volatile whole-sale funding (raising money through borrowing, often short term, from other banks and financial institutions) and on foreign funding has been blamed for destabilizing the broader financial sector and economy. A tax on such volatile sources of funding could encourage banks to move to more reliable funding sources, like deposits or longer-term local financing. • Trading frequency: Some analysts claim that high-
frequency trading of securities by financial institutions con-tributes to excessive volatility or bubbles in asset prices. others believe that high-frequency trading is of doubtful social value. These experts favor directly taxing such trading.
reducing the likelihood of a financial crisis by changing behavior is only one of the goals of financial sector taxation. As
noted, governments also want to help cover the costs of future crises. Designing a proper financial sector tax to raise revenues is difficult. Levies could be set to accumulate a buffer equivalent to 2 to 3 percent of GDP—roughly the magnitude of the average country’s direct cost from the most recent crisis—over a period of time. But there is a high degree of uncertainty about the size and cost of future crises. Moreover, some costs may not occur until after the crisis is over. What is critical is that the additional revenue raised by such taxes be used to improve government finances rather than merely to support higher spending.
Tax instrumentsAt present, four main types of taxes are under consideration:• A financial stability contribution is a simple levy on a finan-
cial institution’s balance sheet (and some off-balance-sheet items) with the goal of ensuring that the industry pays a rea-sonable share of direct costs associated with resolution of ailing institutions—which might involve their sale, transfer, or liqui-dation. In addition to raising revenue, the tax also has behav-ioral effects because it generally includes some combination of a progressive rate structure and a base that exempts equity and deposits. Such an approach implicitly penalizes wholesale debt funding. To change underlying market behavior, such a financial stability contribution would have to be permanent. • A financial transaction tax (FTT) is levied on the value of
specific financial transactions, such as equity trading. It is gen-erally promoted as an instrument to raise revenue while simul-taneously reducing financial transactions deemed socially undesirable, such as high-frequency trading. However, like other transactions taxes, an FTT cascades through the sup-ply chain in unpredictable ways, raising the cost of capital for some businesses more than others and potentially encouraging
Proponents of financial sector taxation want to do more than reduce existing distortions. They want to design a tax that can make the financial sector bear the social cost of risky behavior.

46 Finance & Development September 2012
financial disintermediation by reducing the volume of finan-cial transactions (Matheson, 2011). • A financial activity tax is applied to the sum of an institu-
tion’s profits and remuneration. A financial activity tax is essen-tially the financial sector equivalent of a value-added tax, from which the financial sector is typically exempt. It would reduce the differential tax treatment between the financial sector and other sectors in the economy. A financial activity tax can be fur-ther refined to have behavioral effects, such as reducing exces-sive risk-taking incentives by taxing high returns more heavily.• A reform of the corporate income tax could help reduce
excess leverage in the financial sector. In most countries, the tax system allows companies (including financial sector firms) to deduct from taxable income interest payments to lenders, but not dividend payments to investors. This introduces a tax distortion in favor of debt financing, which compounds the incentives for financial firms to incur excessive risk (Keen and de Mooij, 2012). This distortion can be reduced or eliminated in various ways: a thin capitalization rule would limit interest deductibility below a certain threshold (which could be based on a maximum debt-to-equity ratio), a comprehensive business income tax would not allow for any interest deductibility, and an allowance for corporate equity would provide deductibility for both interest and a notional return on equity.
Design details are keyThe ultimate impact of these taxes is heavily influenced by the details of their design. Design guidelines differ depending on the type of tax, but a few broad principles should guide the implementation of most taxes.
The tax should be levied as widely as possible, excluding few, if any, institutions. Everyone benefits from financial stability, and exempting certain institutions could encour-age tax arbitrage in which firms change their classification to take advantage of better tax treatment. That would defeat the purpose of the tax. More broadly, taxing only offend-ing institutions could have perverse consequences—such as implicitly revealing those institutions that pose a systemic
risk, which could signal to the markets that these institu-tions will be bailed out.
The appropriate base of any tax depends on its objectives. Taxing a particular component of the balance sheet (say, whole-sale funding), of the income statement (profits and remunera-tion), or a transaction (short-term trading) would be appropriate if the authorities were seeking to correct behavior. As a general matter, however, the overall impact of the various taxes and reg-ulatory requirements on banks should be considered.
The appropriate rate will depend on the type of tax. For a financial stability contribution to have a behavioral impact, the rate must be higher for riskier institutions. For a general finan-cial activity tax, the prevalent VAT rate levied on goods and services should be taken into consideration. But if the goal is a financial activity tax that discourages excessive risk taking, the rate would have to be set relatively high. The rate for an FTT would have to be low to minimize distortions. Even so, the cascading nature of an FTT makes it difficult to avoid a high effective burden.
The IMF, in a report for the Group of 20 advanced and emerging economies, said that financial sector taxes should ensure that the sector would cover the direct fiscal cost of any future government support, make failures less likely and less damaging, be fairly easy to implement, and address existing tax distortions that may exacerbate financial stability concerns. In this context, the report recommended a financial stability contribution that is linked to a credible and effective resolution mechanism for weak financial institutions. If additional reve-nue is desired, the financial stability contribution could be sup-plemented with a financial activity tax levied on the sum of the profits and remuneration of financial institutions (IMF, 2010).
State of playMany countries in Europe introduced financial sector levies immediately after the crisis. roughly a dozen have taxes simi-lar to financial stability contributions with the primary goal of raising revenue. In about half of the countries, financial stability contributions were meant, at least initially, to be temporary. The rates of the financial stability contributions are relatively low and unlikely to have a substantial behavioral impact. In general, the revenue-raising power of these taxes averages around 0.2 percent of GDP, suggesting that it would take 15 to 25 years to generate resources equivalent to the direct costs of the recent crisis (see chart). It is also unclear whether, or how, tax evasion could affect this over time. To date, the FTT and financial activity tax are far less common in Europe. However, many countries have long had “mini” FTTs—such as a stamp duty on locally registered shares in the United Kingdom—but taxes on stock transactions have been falling into disfavor over the past several decades (Matheson, 2011). In September 2011, the European Commission proposed a coordinated FTT in its 27 member states. The proposed tax, intended to go into effect in 2014, would ensure that the finan-cial sector helps reduce fiscal deficits and government debt accu-mulation, while seeking to discourage transactions that do not enhance the efficiency of financial markets.
The base of the tax proposed by the European Commission would include all transactions between financial institutions
Gottlie 7/18/12
Tax receiptsFinancial sector levies put in place in western Europe immediately after the recent crisis raise an average of about 0.2 percent of GDP a year.(expected revenue, �nancial sector taxes, percent of GDP)
Source: IMF staff calculations.
0
0.2
0.4
0.6
0.8
Latvi
a
German
y
Portu
gal
Slovak
ia
Swed
en
Moldova
United
King
dom
Austr
ia
Belgi
um
Denmark
Cypru
sFra
nce
Icelan
d
Hunga
ry
Average

Finance & Development September 2012 47
where at least one party to the transaction is located in the European Union (EU). Such a base would cover about 85 percent of all financial sector transactions. House mortgages, bank loans, insurance contracts, and other financial activities carried out by individuals and small businesses would be exempted.
There would be different rates for different types of trans-actions. For those that involve buying and selling stocks and bonds, for example, the tax rate would be 10 basis points (a basis point is one one-hundredth of a percentage point), while transactions involving derivative contracts would be charged 1 basis point. The effective tax rates would actually be doubled, however, because both parties in the transaction would have to pay the tax. For repurchase (repo) agreements—in which one party raises funds by selling a security and agrees to buy the security back on a specific date—the effective rate would be quadrupled. Each repo agreement involves four taxable transactions. The annual expected revenue from this tax—estimated to be about 0.5 percent of GDP—would be shared between the EU and the member states.
So far, the FTT proposal has not received broad interna-tional backing nor have most of the countries in the European Union explicitly supported it. Four EU countries have expressed significant concerns, while nine have expressed support. France unilaterally introduced a temporary FTT on August 1, 2012. The rate is 0.2 percent for French-listed shares, regardless of whether the transaction is executed inside or out-side of France. For activities carried out in France only, FTTs at the rate of 0.01 percent will also be levied on high-frequency
trading operations and credit default swaps on EU sovereign bonds that are not acquired for hedging purposes.
Although Europe has not reached a consensus on the FTT, the issue is likely to remain on the EU agenda as the continent looks into the future of the monetary union while trying to resolve the problems introduced by the financial and sovereign debt crises. Notably, the European Parliament has decided to endorse a proposal for the introduction of an EU-wide FTT despite opposition by many member states. At its June 2012 summit, the euro area’s four biggest countries committed to introduction of an FTT. ■Geoff Gottlieb is an Economist and Gregorio Impavido and Anna Ivanova are Senior Economists in the IMF’s European Department.
References:International Monetary Fund (IMF), 2010, “A Fair and Substantial
Contribution by the Financial Sector,” Final Report for the G20 (Washington, June).
———, 2012, Fiscal Monitor: Balancing Fiscal Policy risks (Washington, April).
Keen, Michael, 2011, “Rethinking the Taxation of the Financial Sector,” CESifo Economic Studies, Vol. 57, No. 1, pp. 1–24.
———, and Ruud de Mooij, 2012, “Debt, Taxes, and Banks,” IMF Working Paper 12/48 (Washington: International Monetary Fund).
Matheson, Thornton, 2011, “Taxing Financial Transactions: Issues and Evidence,” IMF Working Paper 11/54 (Washington: International Monetary Fund).

48 Finance & Development September 2012
The sharp rebound in international petroleum prices since the end of 2008 has again exposed the fiscal risk to many low- and middle-income coun-tries that subsidize fuel prices. Two years ago, an
article in F&D projected an escalation of fuel price subsidies if countries continued to restrict the pass-through of interna-tional price increases to domestic consumers (see “Oil subsi-dies: Costly and rising,” in the June 2010 issue of F&D).
Those risks are now a reality.after peaking in mid-2008, international prices plum-
meted over the following six months. But much of that decline has now been reversed. sustained price increases over the past three years left international prices at the end of 2011 at about 80 percent of their mid-2008 peak. since the second quarter of 2012, prices have moved up and down.
as during the sharp international price increases up to mid-2008, many low- and middle-income countries have struggled to pass recent price increases through to domestic consumers, with most of them allowing less than 70 percent pass-through over the past three years (see Chart 1). pass-through levels were especially low in oil-exporting countries,
half of which—many in the Middle east and central asia—passed through less than 55 percent of international price increases. By contrast, advanced and emerging european countries passed through much more of the increases.
Large fiscal costsThe cost of incomplete pass-through is a sizable fiscal risk for many countries (see Chart 2). For example, in half the coun-tries in the Middle east and central asia, the cost exceeded 2.3 percent of GDp at the end of 2011, while half the coun-tries in sub-saharan africa had costs exceeding 1.3 percent of GDp.
a key difference with the low pass-through during the most recent price increase is that it was partly attributable to the relatively high fuel tax levels in many countries at the end of 2008. as prices began to fall in the second half of 2008, many countries passed through very little of the decline to consumers in an attempt to recoup past revenue losses—over this period, pass-through fell below 30 percent in most low- and middle-income countries. as prices rebounded, coun-tries with tax levels above historical norms lowered them to prevent sharp increases in domestic prices.
For many countries with low pass-through over the past three years, tax levels are still sizable and can be maintained as long as future international price changes are fully passed through to domestic consumers. This is especially true in many countries in sub-saharan africa, where current tax levels are substantially higher than in many other low- and middle-income countries. however, many other countries with diminished pass-through levels have already reached low tax levels, and further mitigation of the price increases would require lower taxes. Other countries are already subsidizing fuel consumers.
Falling tax levels and rising subsidies are particularly worri-some in parts of sub-saharan africa where revenues from fuel taxes are a significant source of finance for public expenditures that are important for both poverty reduction and growth (such as education, health, and physical infrastructure). about half of Middle eastern and central asian countries have traditionally subsidized consumers and continue to do so. a large number of countries in other regions are also subsidizing consumers.
The existence of subsidies among some members of the Group of 20 advanced and emerging economies is contrary
Coady 1, 7/11/12
Advancedeconomies
Emerging Europe
Asia and Paci�c
Latin America and Caribbean
Sub-Saharan Africa
Middle East and central
Asia
Chart 1
Absorbing increasesMany low- and middle-income countries have not fully passed recent fuel price increases through to domestic consumers. (pass-through, percent)
Source: IMF staff calculations.Note: Pass-through is calculated as the increase in domestic prices divided by the increase in
international prices (both denominated in domestic currency).
0
30
60
90
120
150
180End-2003 to mid-2008
End-2008 to end-2010
End-2008 to end-2011
Mid-2008 to end-2008
Energy subsidies in low- and middle-income countries can take a big toll on their fiscal health
David Coady, Valentina Flamini, and Matias Antonio
FUELING Risk

Finance & Development September 2012 49
to the commitment set out in the September 2009 Pittsburgh communiqué, which called for a phase-out of “inefficient fossil fuel subsidies.” renewed efforts to abolish subsidies in these countries can help promote similar reforms elsewhere.
Politically sensitiveremoval of subsidies can deliver substantial economic and social gains. Price subsidies encourage higher fuel consump-tion and waste—for instance, many oil-producing countries have some of the world’s lowest retail prices, resulting in fuel consumption (as well as associated congestion and pollution) levels well above those of higher-income countries. As well as diluting incentives for improving energy efficiency, subsidies can result in cross-border smuggling and domestic shortages. Their high fiscal cost crowds out high-priority public expen-ditures and private investment, and most benefits from subsi-dies are captured by higher-income groups.
But subsidies persist, in part because of two factors: the lack of reform credibility and the adverse impact of price increases on the most vulnerable. People often do not believe that govern-ments will use budget savings to benefit the broader population.
In oil-exporting countries, the public often sees cheap energy as the primary route to sharing in oil wealth. Also, although higher-income groups capture most of the benefits from lower fuel prices, subsidy reform can still result in a sizable increase in the cost of living for low-income households, and higher poverty.
Past experiences with subsidy reforms provide important lessons. A public information campaign that highlights the shortcomings of fuel subsidies and directly links subsidy reform to increases in priority public expenditures (such as education, health, and physical infrastructure) can help increase public support for reform.
Transparently recording the magnitude of subsidies is a key component of this process. This reform strategy has been used in a number of countries that have successfully reduced fuel subsidies, including Ghana, Indonesia, and Jordan. More recently, Iran has started to gradually increase its domestic fuel prices, which were among the lowest in the world, has introduced a near-universal cash transfer program to miti-gate the adverse impact on the population, and has initiated support for energy-intensive sectors to finance investments in energy-efficient technologies.
Where an effective social safety net exists, expanding the budget for these programs can address poverty concerns while containing fiscal cost. For countries with less effective safety nets, a more gradual reform approach may be desirable if fiscal conditions allow, while social safety nets are strengthened.
Guarding against recurrenceTo prevent the recurrence of subsidies, fuel prices should be fully liberalized. But in the interim, countries could adopt an automatic fuel-pricing mechanism that ensures full pass-through of international price changes to domes-tic consumers. Such mechanisms have worked well in countries such as Botswana, Chile, Liberia, South Africa, Turkey, and Zimbabwe.
However, adoption of an automatic mechanism is not a panacea. Many countries have adopted such mechanisms only to abandon them when international prices increase sharply. The fragility of automatic mech-anisms in part reflects the reluctance of governments to fully pass through large price increases that they believe may be temporary and could cause a social and political backlash. These concerns can be addressed by incorporating price-smooth-ing rules (such as a cap on the magnitude of domestic price changes) into automatic mechanisms, thus avoiding large increases in domestic prices while ensuring full pass-through of international price move-ments over the medium term. ■David Coady is a Deputy Division Chief, Valentina Flamini is an Economist, and Matias Antonio is a Research Assistant, all in the IMF’s Fiscal Affairs Department.
Chart 2
Big budget hitThe �scal cost to countries that moderate fuel price increases can be quite high. Generally, a government absorbs price increases by reducing fuel taxes.(�scal cost, percent of GDP, end-2008 to end-2011)
Less than 0
0 to 11 to 3More than 3
Source: IMF staff calculations.Note: Fiscal cost is calculated by comparing the annual net revenue that would be collected at initial end-2008 tax levels if
applied for one year with net revenue at end-2011 tax levels.
Employee adjusts prices at gas station in Chongqing, China.

50 Finance & Development September 2012
ACCESS to the right data is critical when analyzing economic trends and events. Without it, forecasting what direction the economy is likely to take in the future, or why past economic events played out the
way they did, is a bit like putting together a jigsaw puzzle when some pieces are missing so the picture is incomplete. The Data Gaps Initiative will help bridge some of the gaps and improve the quality of data used by economists across the world.
This initiative, spearheaded by the Group of 20 (G20) advanced and emerging market economies, focuses on filling data gaps by enhancing data collections, including economic and financial sector data that are the IMF’s responsibility. In doing so, it helps shed light on the global economic and financial crisis, its driving forces, and the measures taken to address it.
The Data Gaps Initiative also catalyzes joint efforts among international agencies on a broad range of economic and financial statistics by leveraging the relative strengths of each member, and thereby eliminating many blind spots in the global statistical landscape. This strengthened cooperation and coordination across international institutions has already improved data sharing, raised efficiency by avoiding duplica-tion of efforts, and reduced the reporting burden on countries.
Interlocking crisis responseAfter almost four years of work, plans to implement enhance-ments to existing data sets are in place, and implementation of some of the enhancements has already taken place in some G20 economies. (See “Data to the rescue” and “Finding New Data,” F&D, March 2009 and September 2010, respectively.) Substantive work is under way in other areas, including sec-toral accounts that account for households, financial and non-financial corporations, and government; securities statistics on international debt instruments, international equities, and domestic securities; and real estate prices. Work on systemi-cally important financial institutions is now in the develop-mental phase.
Within just weeks of the Data Gap Initiative’s launch, the Inter-Agency Group on Economic and Financial Statistics (IAG) was established and launched the Principal Global Indicators website, www.principalglobalindicators.org. The web-site draws on data from the members of the IAG—the Bank for International Settlements, the European Central Bank, Eurostat, the IMF (which serves as chair), the organization for Economic Cooperation and Development, the United Nations, and the World Bank—and disseminates almost instanta-
neously. The Data Gaps Initiative continues to introduce new or expanded data sets to this website, such as the recent addi-tion of quarterly and annual G20 growth rate aggregates.
More data make a differenceBy enhancing existing statistical frameworks—including by improving country coverage and information granularity—and fostering the development of new ones, the Data Gaps Initiative aims to fill data gaps to facilitate the analysis of risk buildup in financial systems emerging from domestic and cross-border interconnections.
Countries and sectors are now so interconnected that it has become difficult to track the connections and determine who will be affected by economic events (see chart). For example, almost half of financial exposure remains hidden because the share of financial activities that goes through banks is much smaller than a decade ago. Traditionally, exposure meant mainly bank exposures. But exposures through the so-called
Piecing together “missing links” in a jigsaw puzzle of data sets helps shed light on the global financial crisis
Adelheid Burgi-Schmelz and Alfredo M. Leone
United States
Liechtenstein
Luxembourg
Italy
Germany
Spain
JapanIreland
Switzerland
France
Netherlands
United Kingdom
An interconnected worldThe financial links between the United States, the United Kingdom, and Luxembourg are especially strong.(countries with largest number of connections with other countries)
Sources: Lipper (Thomson Reuters); and IMF staff calculations (2010).Note: Thicker lines signify greater exposure among countries.
It All Falls into Place

Finance & Development September 2012 51
“shadow banking system” could be larger and/or different. There is a growing urgency to supplement banking statistics by having better information on nonbank financial institutions and on nonfinancial corporations. Their importance is grow-ing sharply, but the implications for the stability of the finan-cial system are not yet well understood.
Another aim of the Data Gaps Initiative is to effectively cap-ture what is happening across various sectors. This can pro-vide not only a wealth of information for policy analysis, but also an excellent organizing umbrella for statistical work on an economy. Such a framework makes it possible to interlink dif-ferent data sets that cover areas such as securities, government finance, and countries’ international investment positions. For government finance statistics, a standard template for data collection by all international organizations was developed through the Data Gaps Initiative that will make it easier for countries to report the data, as well as improve the comparabil-ity of the data across various countries.
Using the dataSerious data gaps revealed by the ongoing financial crisis rein-forced the need for high-quality statistics in the design, imple-mentation, and monitoring of appropriate macroeconomic and financial policies to ensure international financial stability. So it is only natural that new data sets are being proposed for inclusion in the data to be provided to the IMF when it con-
ducts its regular monitoring and analysis of countries’ econo-mies and their financial sectors.
Consistent with this aim, in 2010 the IMF approved enhance-ments to its data standards, drawing on the Data Gaps Initiative. As of 2010, financial soundness indicators became an encour-aged item, and by 2014 the dissemination of quarterly interna-tional investment positions will be mandatory under the Special Data Dissemination Standard (SDDS)—a global benchmark established by the IMF for disseminating economic and finan-cial data to the public. on top of these incremental steps, the IMF took a major step earlier this year when it supported a new, top tier data dissemination standard—the SDDS Plus, which adds data categories that have proven essential in the work on the Data Gaps Initiative (see table). For countries signing on to SDDS Plus, the new categories will become mandatory by 2019.
Collaboration is keyThe Data Gaps Initiative has achieved tremendous progress in how international organizations and statistical agencies col-laborate on economic and financial statistics. IAG quarterly meetings or videoconferences have been invaluable in mov-ing forward, and annual conferences attended by country se-nior officials in recent years provided important input to the annual reports of the IMF and Financial Stability Board to the G20 on the Data Gaps Initiative.
In 2010–11, IMF staff visited G20 countries to discuss their economic and financial data collections and submis-sions across international organizations. In 2012, four regional conferences in Mexico, Turkey, France, and China focused on how countries have achieved progress in their efforts to plug gaps identified by the Data Gaps Initiative. As a conference participant noted, “the Data Gaps Initiative is beneficial in synchronizing the coordination among all the relevant agen-cies producing and using macroeconomic statistics.” In other words, we are pulling together. This is a small revolution. But as with all revolutions, the key question is how to keep it going and guide it into the next productive phase.
Taking shapeThe achievements the Data Gaps Initiative has made so far serve as a sound basis to address the remaining challenges. These include implementing enhancements in sectoral accounts; improving understanding of, and data on, shadow banking and cross-border positions and flows of financial and nonfinancial corporations; and completing developmen-tal work on key measures of financial system risks, including tail risks, aggregate leverage, and maturity mismatches. Also, much work remains on data sharing among relevant official institutions on systemically important financial institutions.
Even more effort will be needed going forward, so there is no time to rest. In fact, the IMF is strengthening its technical assis-tance and training efforts to assist its member countries to con-solidate the benefits of the Data Gaps Initiative in all member countries. This way, it will all fall into place at the global level. ■Adelheid Burgi-Schmelz is Director and Alfredo M. Leone is Deputy Director in the IMF’s Statistics Department.
Beefing it upSDDS Plus supplements SDDS with nine new data categories.
Data categories SDDS SDDS PlusGross domestic product: nominal, real, and
associated pricesX X
Production indices X XSectoral balance sheets XLabor market X XPrice indices X XGeneral government operations XGeneral government gross debt XCentral government operations X XCentral government debt X XDepository corporations survey X XCentral bank survey X XOther financial corporations survey XInterest rates X XFinancial soundness indicators XDebt securities XStock market X XParticipation in the currency composition of
foreign exchange reserves survey X
Balance of payments X XOfficial reserve assets X XTemplate on international reserves and foreign
currency liquidityX X
Merchandise trade X XInternational investment position X XParticipation in the coordinated portfolio
investment survey X
Participation in the coordinated direct investment survey
X
External debt X XExchange rates X XAddendum: Population X X
Source: IMF.

52 Finance & Development September 2012
What Is Money?Without it, modern economies could not function
Irena Asmundson and Ceyda Oner
BACK TO BASICS
MoNEY may make the world go around, as the song says. And most people in the world prob-ably have handled money, many of them on a daily basis. But despite its familiarity, probably
few people could tell you exactly what money is, or how it works. In short, money can be anything that can serve as a• store of value, which means people can save it and use it
later—smoothing their purchases over time; • unit of account, that is, provide a common base for
prices; or • medium of exchange, something that people can use to
buy and sell from one another.Perhaps the easiest way to think about the role of money is to
consider what would change if we did not have it. If there were no money, we would be reduced to a barter
economy. Every item someone wanted to purchase would have to be exchanged for something that person could provide. For example, a person who specialized in fixing cars and needed to trade for food would have to find a farmer with a broken car. But what if the farmer did not have anything that needed to be fixed? or what if a farmer could only give the mechanic more eggs than the mechanic could reasonably use? Having to find specific people to trade with makes it very difficult to special-ize. People might starve before they were able to find the right person with whom to barter.
But with money, you don’t need to find a particular person. You just need a market in which to sell your goods or services. In that market, you don’t barter for individual goods. Instead you exchange your goods or services for a common medium of
exchange—that is, money. You can then use that money to buy what you need from others who also accept the same medium of exchange. As people become more specialized, it is easier to produce more, which leads to more demand for transactions and, hence, more demand for money.
Many moniesTo put it a different way, money is something that holds its value over time, can be easily translated into prices, and is widely accepted. Many different things have been used as money over the years—among them, cowry shells, barley, peppercorns, gold, and silver.
At first, the value of money was anchored by its alterna-tive uses, and the fact that there were replacement costs. For example, you could eat barley or use peppercorns to flavor food. The value you place on such consumption provides a floor for the value. Anyone could grow more, but it does take time, so if the barley is eaten the supply of money declines. on the other hand, many people may want strawberries and be happy to trade for them, but they make poor money because they are perishable. They are difficult to save for use next month, let alone next year, and almost impossible to use in trade with people far away. There is also the problem of divisibility—not everything of value is easily divided, and standardizing each unit is also tricky; for example, the value of a basket of strawberries measured against different items is not easy to establish and keep constant. Not only do straw-berries make for bad money, most things do.
But precious metals seemed to serve all three needs: a sta-ble unit of account, a durable store of value, and a convenient medium of exchange. They are hard to obtain. There is a finite supply of them in the world. They stand up to time well. They are easily divisible into standardized coins and do not lose value when made into smaller units. In short, their durability, limited supply, high replacement cost, and portability made precious metals more attractive as money than other goods.
Until relatively recently, gold and silver were the main cur-rency people used. Gold and silver are heavy, though, and over time, instead of carrying the actual metal around and exchang-ing it for goods, people found it more convenient to deposit pre-cious metals at banks and buy and sell using a note that claimed ownership of the gold or silver deposits. Anyone who wanted to could go to the bank and get the precious metal that backs the note. Eventually, the paper claim on the precious metal was delinked from the metal. When that link was broken, fiat money was born. Fiat money is materially worthless, but has value sim-ply because a nation collectively agrees to ascribe a value to it.
52 Finance & Development September 2012

Finance & Development September 2012 53
In short, money works because people believe that it will. As the means of exchange evolved, so did its source—from individuals in barter, to some sort of collective acceptance when money was barley or shells, to governments in more recent times.
Even though using standardized coins or paper bills made it easier to determine prices of goods and services, the amount of money in the system also played an important role in setting prices. For example, a wheat farmer would have at least two reasons for holding money: to use in transactions (cash in advance) and as a buffer against future needs (pre-cautionary saving). Suppose winter is coming and the farmer wants to add to his store of money in anticipation of future expenses. If the farmer has a hard time finding people with
money who want to buy wheat, he may have to accept fewer coins or bills in exchange for the grain. The result is that the price of wheat goes down because the supply of money is too tight. one reason might be that there just isn’t enough gold to mint new money. When prices as a whole go down, it is called deflation. on the other hand, if there is more money in circulation but the same level of demand for goods, the value of the money will drop. This is inflation—when it takes more money to get the same amount of goods and services (see “What Is Inflation?” in the March 2010 issue of F&D).
Keeping the demand for and supply of money balanced can be tricky.
Manufacturing moneyFiat money is more efficient to use than precious metals. Adjustments to its supply do not depend on the amount of precious metal around. But that adds its own complication: Precisely because there is a finite amount of precious metals, there is a limit on the amount of notes that can be issued. If there is no gold or silver to back money, how do governments know how much to print? That gets into the dilemmas gov-ernments face. on the one hand, the authorities will always be tempted to issue money, because governments can buy more with it, hire more people, pay more wages, and increase their popularity. on the other hand, printing too much money starts to push up prices. If people start expecting that prices will continue to rise, they may increase their own prices even faster. Unless the government acts to rein in expecta-tions, trust in money will be eroded, and it may eventually become worthless. That is what happens during hyperinfla-tion. To remove this temptation to print money willy-nilly, most countries today have delegated the task of deciding how much money to print to independent central banks, which are charged with making the call based on their assessment of the economy’s needs and do not transfer funds to the government to finance its spending (see “What Is Monetary Policy?” in the September 2009 issue of F&D). The term “printing money” is something of a misnomer in itself. Most money today is in the form of bank deposits rather than paper currency (see box).
Belief can fadeCountries that have been down the path of high inflation expe-rienced firsthand how the value of money essentially depends on people believing in it. In the 1980s, people in some Latin American countries, such as Argentina and Brazil, gradually lost confidence in the currency, because inflation was eroding its value so rapidly. They started using a more stable one, the U.S. dollar, as the de facto currency. This phenomenon is called unofficial, or de facto, dollarization. The government loses its monopoly on issuing money—and dollarization can be very difficult to reverse.
Some policies governments have used to restore confidence in a currency nicely highlight the “faith” part of money functioning. In Turkey, for example, the government rebased the currency, the lira, eliminating six zeros in 2005. overnight, 1,000,000 liras became 1 lira. Brazil, on the other hand, introduced a new cur-rency in 1994, the real. In both countries, citizens went along, demonstrating that as long as everyone accepts that a different denomination or a new currency is the norm, it simply will be. Just like fiat money. If it is accepted as money, it is money. ■Irena Asmundson and Ceyda Oner are Economists in the IMF’s Strategy, Policy, and Review Department.
Reference:International Monetary Fund (IMF), 2000, Monetary and Financial
Statistics Manual (Washington).
In short, money works because people believe that it will.
Finance & Development September 2012 53
How money is measuredIn official statistics, the amount of money in an economy is generally measured through what is called broad money, which encompasses everything that provides a store of value and liquidity. Liquidity refers to the extent to which finan-cial assets can be sold at close to full market value at short notice. That is, they can easily be converted into another form of money, such as cash. Although currency and trans-ferable deposits (narrow money) are included by all coun-tries in broad money, there are other components that may also provide sufficient store of value and liquidity to count as broad money. Among the things the IMF (2000) says can be counted as broad money are the following:
National currencies (generally issued by the central gov-ernment).
Transferable deposits, which include demand deposits (transferable by check or money order); bank checks (if used as a medium of exchange); traveler’s checks (if used for transac-tions with residents); and deposits otherwise commonly used to make payments (such as some foreign-currency deposits).
Other deposits, such as nontransferable savings depos-its, term deposits (funds left on deposit for a fixed period of time), or repurchase agreements (in which one party sells a security and agrees to buy it back at a fixed price).
Securities other than shares of stock, such as tradable certificates of deposit and commercial paper (which is essen-tially a corporate IoU).

BOOK REVIEWS
54 Finance & Development September 2012
Ngozi Okonjo-Iweala
Reforming the Unreformable
Lessons from NigeriaMIT Press, Cambridge, Massachusetts, 2012, 202 pp., $24.95 (cloth).
Ngozi okonjo-Iweala’s story of Nigeria’s claw-back from eco-nomic volatility, infrastruc-
tural and institutional disrepair, and rampant poverty to greater stability is exceptional. It could only have been written by a Nigerian in the trenches during the process of economic re-structuring and governance reform.
This story is told in satisfying detail. It provides key economic insights in readable language and frank descriptions of the challenges faced by the economic team she headed as minister of finance from 2003 to 2006. She assesses the posi-tive as well as ambiguous results of macroeconomic reforms imple-mented during President olusegun obasanjo’s two terms. She tells the story dispassionately, credits obasanjo with foresight, identifies her own strengths and errors during the process, and is gracious as she describes how some tried to engineer her failure or throw roadblocks into the process.
The popular critique held that Nigeria could not come out of its eco-nomic slump because of the “curse” of oil wealth, militarism, state involve-ment in the economy, and corruption at state and local levels. But okonjo-
Iweala demonstrates this to be untrue. By 2007, Nigeria was able to stabilize the macroeconomy, reduce inflation, double economic growth to 6–7 percent, and start rebuilding the education and health systems. She shows that bold national leader-ship, paired with concern for citizen wellbeing, can be a powerful force in changing an economy.
Among the lessons from the Nigerian experience okonjo-Iweala outlines for reformers are the need for a playbook that an economic team can follow, for effective com-munication, and for a results-oriented focus that enlists civil society and the public. The political will of the domestic leadership was important, she says. But Nigeria’s turnabout was Janus-faced: it also required strategic assistance and partnerships with the international community.
Brazilian businessman Amaury Bier, for example, told her to assemble “an Economic Team of like-minded people who can stick together and to fight tough battles,” while U.K. Prime Minister Tony Blair and World Bank President James Wolfensohn advised her that a macroeconomic reform strategy could open the door to suc-cessful discussions on debt relief down the road.
okonjo-Iweala stresses the relevance of African history in designing strategies for economic reform. Nigeria’s oil-induced eco-nomic nightmare and recovery were affected by the history of ancient ethnic and cultural/religious com-munities, divide-and-conquer colonialism, and the 1967–70 Nigeria-Biafra war followed by 25 years of military rule and agricul-tural and social decimation. But she believes governance always makes the difference.
Top successes included reducing leakages in the budget process, imple-menting an oil price–based fiscal rule that enabled more transparent budgets, reaching macroeconomic stability by 2006, increasing foreign reserves, reducing inflation and lend-ing rates, and achieving 7 percent growth. In 2003, the obasanjo gov-
ernment began privatization, deregu-lation, and liberalization.
The greatest challenges were reform-ing the civil service to improve service delivery and rationalize pensions and eliminating the corruption surround-ing trade, tariffs, and customs. Poorly educated civil servants bolstered their meager salaries by permitting the elite to divert revenues of government agencies and use those revenues to bolster their status as regional bene-factors. Word is that okonjo-Iweala’s sudden transfer in 2006 from minis-ter of finance to minister of foreign affairs was due to her unwillingness to condone abuses by politicians in rice importation who used those revenues to cultivate party loyalties.
The story takes Nigeria watch-ers backstage and shows us the complexity of initiating macro-economic reforms in an African society whose diverse political classes have benefited from resource mismanagement, financial liquidity, agricultural collapse, educational decimation, and citizen impoverish-ment. okonjo-Iweala shows how daunting it was to break the hold of politicians over oil revenues and push Nigeria toward stable, diversi-fied, market-driven, and socially responsible economic governance.
okonjo-Iweala, who after four years at the World Bank returned in 2011 as finance minister under President Goodluck Jonathan, ends by looking forward, recognizing that Nigeria’s success can help transform Africa. She asks whether the reforms will be sustained and lead to Nigeria’s continued growth and, if they are, whether they can be a role model for the rest of Africa. She returns to the importance of support and monitor-ing by the global community, as well as Nigeria’s continued commitment to fighting corruption, strengthening the macroeconomic framework, and advancing financial sector reform.
We are left to ask, “Will this last?”
Gwendolyn MikellProfessor of Anthropology
and Foreign ServiceGeorgetown University
A Janus-Faced Turnabout
BOOK REVIEWS
Finance & Development September 2012 55
Yegor Gaidar
Russia
A Long ViewMIT Press, Cambridge, Massachusetts, 2012, 525 pp., $39.95 (cloth).
Yegor Gaidar, chief architect of the economic reforms of the early 1990s that led to the cre-
ation of a market economy in russia, was also a fine writer and scholar—qualities amply displayed in this book.
The russian version, published in 2005, focused on the nature of economic growth and contributed significantly to the debate in russia about the need to modernize the economy. The English version omits some details about policies in russia and adds a brief epilogue written in 2009, shortly before Gaidar’s death, so only a third of this book is in fact about russia.
Gaidar first offers a broad over-view of world history starting with the Neolithic era, moving through roman and Greek city-states, then static agrarian and nomadic societies, to the origins of modern economic development in Europe.
There is an interesting chapter on Marxist ideas about economic change and another on the underlying deter-minants of economic growth and associated societal adjustments. The chapters on the economic history of russia and the Soviet Union are thor-ough and balanced.
The last part of the book focuses on problems of the “post-industrial world”—mainly Western economies. These include those caused by aging and declining populations, the size of government, the disincentives of welfare systems, the high cost of state pensions, the quality of public education, financing health care as costs rise, corruption, and the poli-tics of economic reform. As he ana-lyzes these problems, Gaidar draws lessons for russia.
The result is broad brush, if rather sketchy. (Indeed, the subtitle of the russian version is Sketches in Economic History.) But it is firmly grounded in Gaidar’s remarkably wide reading, as demonstrated by the extensive endnotes. Although an economist, Gaidar goes well beyond economic analysis and writes more in the spirit of Schumpeter, Marx, or Kuznets than modern econometric historians.
However, he also makes skillful use of statistical evidence—for example, comparing russia with western coun-tries in past years when they were
at a similar level of gross domestic product per capita. Whether dealing with statistics, political philosophy, or historical controversies, Gaidar’s writ-ing is always clear and lively, as befits a former journalist.
only a glimpse of Gaidar’s conclu-sions can be given here. He believes that as countries develop, their insti-tutions change, in accordance with Marx’s view that technology deter-mines social and political relations. (Gaidar may have emphasized this point to give the stamp of Marxian authority to the view, unpopular in russia, that russia can learn from Western countries.) Traditional agrar-ian societies did not grow much until elites who extracted the surplus from the masses and spent it on consump-tion or warfare were weakened and others were able to keep the returns from their investments. Modern
economic growth started in Europe with the merchants of the city-states, the geographic discoveries, embryo financial systems, and more secure property rights. Cultural factors are important in growth: for example, the importance of family ties in some cultures may delay the development of arm’s-length business relations and lead to crony capitalism.
The Soviet economy collapsed because it discouraged innovation and international competitiveness, squeezed agriculture, and became dependent on oil and gas exports to finance its inefficiencies. The fall in oil prices in the 1980s created a crisis. The transformational recession in russia after the breakup of the Soviet Union in 1991 and the start of eco-nomic reforms in 1992 was inevitable and not the result of the particular reforms adopted, Gaidar argues.
Here are some of the lessons Gaidar extracts for russia. It must encourage immigration to compen-sate for a declining natural popu-lation, raise retirement ages, and encourage private pensions. He says
there is little room to increase the size of the government. The state should finance a basic level of health care beyond which costs should be covered by insurance, and encour-age market mechanisms in education and health care. russia must replace its current managed-democracy sys-tem—in which vested interests stifle reforms and corruption thrives—with an active democracy that encourages reforms.
In general, Gaidar’s recommenda-tions reflect a somewhat conserva-tive view about the respective roles of government and the market, and he argues his case with skill and erudition.
John Odling-SmeeFormer Director
IMF European II Department (covering former Soviet Union)
The Big Picture
Russia can learn from Western countries.

BOOK REVIEWS
56 Finance & Development September 2012
Jane Gleeson-White
Double Entry
How the Merchants of Venice Created Modern FinanceW. W. Norton & Company, New York, 2012, 304 pp., $26.95 (cloth).
In this surprisingly readable book, Jane Gleeson-White paints a color-ful description of the birth and
development of double-entry book-keeping. After establishing the genesis of modern accounting, Gleeson-White heads in a more speculative direction, postulating that double entry made the wealth and rise of the renaissance possible, fueled the development of capitalism, and was a pivotal precursor to the system of national accounting theorized by Keynes. With all this historical might, double entry now has the ability to “make or break the planet” in the 21st century.
The first half of the book, cover-ing the life and career of the founder of double-entry bookkeeping, Luca Pacioli (1445–1517), makes for a fascinating story. Pacioli’s brilliant mind was used to good effect in his roles as mathematician, magician, and Franciscan monk. Taking advantage of the invention of the Gutenberg press, he published several books, including the first mathematical encyclopedia of the renaissance, which contained a bookkeeping treatise that extolled the virtues of Venetian double-entry bookkeeping and has become Pacioli’s main legacy.
Pacioli broke with tradition to write his double-entry treatise in the
vernacular, which made it accessible to all, thereby promoting its use, and he was instrumental in the gradual replacement in Italy of roman by Hindu-Arabic numerals.
Fast-forward a few centuries and the legacy of double entry is appar-ent: the financial statements of a joint stock company reflect Pacioli’s intent of knowing “whether his busi-ness goes well or not.” The develop-ment of accounting standards and principles have also surely been shaped by double-entry bookkeeping. Unfortunately, in later chapters, the book tends to sensationalize (or at least overstate) the impact and influences of double-entry bookkeeping. Like the commonly expounded “butterfly effect”—whereby a hurricane is traced back to the initial movement of a but-terfly’s wings—double entry is deemed to be behind all the imperfections of modern day decisions based on accounting data. Even the Ford Pinto affair (when the auto company used an accounting-driven cost-benefit analysis to decide against fitting a safety device to the Pinto car in 1977) is blamed on double-entry bookkeeping hav-ing “morphed into an exacting global calculus and created a culture that makes possible reasoning which gener-ates ruthless decisions.” Accounting is surely but one tool of the human con-ditions of greed and ruthlessness.
rather jarringly, the book also wades quite unapologetically into controversial debates about the nature of accounting as a social phenom-enon. Chapter 7’s title “Double entry and capitalism—chicken and egg?” prepares the reader for an objective debate about whether double entry enabled capitalism to flourish or vice versa. Within a couple of paragraphs, however, it is clear where the author’s sympathies lie: German economist Werner Sombart’s 1924 thesis that double-entry bookkeeping was such a powerful tool that it led to the devel-opment of a new social and economic system that we call capitalism is “bal-anced” by only a passing reference to South African economist Basil Yamey’s opposing arguments. The bibliography and citations are similarly lopsided
against more conventional views that accounting is the result of social orga-nization and associated pressures.
Eyebrows may also be raised, espe-cially among accountants accustomed to balance sheets and accrual account-ing, over the notion that the system of national accounts owes its origin to double-entry bookkeeping. Keynes’s General Theory that aggregate output is determined by consumption plus investment is essentially an equation that must balance by definition, rather
than a ledger that has codified, classi-fied, and summarized the assets, lia-bilities, income, expenses, and capital of the economy (via matched debits and credits).
Leaving aside these quibbles, the book is a good read for the accountant and nonaccountant alike. Gleeson-White sets a brisk pace and has a knack in her character portrayals for balanc-ing detail and generalization. Digging out some fascinating nuggets brings Pacioli to life. one can only imagine, for example, the behind-the-scenes maneuvering by Pacioli when the friars of his monastery asked in late 1509 that he be deprived of his papal favors and all administrative duties due to concerns about his lifestyle. Just a few months later, Pacioli had been appointed head of the monastery!
How can accounting “make or break the planet”? For Gleeson-White, the answer lies in understanding better how the measurement (and nonmeasure-ment) of the value of resources shapes the global economy. A worthwhile endeavor, and almost certainly a chal-lenge that Pacioli would have relished.
Christopher HemusDeputy Director
IMF Finance Department
Debits and Credits
Accounting is surely but one tool of the human conditions of greed and ruthlessness.

Finance & Development September 2012 57
DATA SPOTLIGHT
MANY countries have adopted long-lasting con-straints on key budgetary aggregates through numerical limits on deficits, debt, expen-ditures, or revenue, a new IMF study finds.
These limits, called fiscal rules, can help contain pressures to overspend and thereby ensure fiscal responsibility and public debt sustainability. With public finances in distress in many economies, adopting fiscal rules can help bridge the transi-tion to lower deficits while enhancing the credibility of debt and deficit reduction plans. As of end-March 2012, more than
75 countries were operating under national rules or suprana-tional fiscal rules, compared with only five in 1990.
As part of the response to the global financial crisis, next-generation fiscal rules are being put in place. These rules are designed to strike a better balance between sustainability and flexibility goals because they often account for fluctuations in the business cycle, that is, the ups and downs of economic growth. Moreover, they are often complemented by other institutional arrangements, such as fiscal councils entrusted with monitoring fiscal policies and raising public awareness of their impact. The IMF study has also devised a fiscal rule index that summarizes the number of fiscal rules and the comprehensiveness of their design. The index for national fiscal rules shows that emerging economies have caught up to advanced economies and that, since the crisis, both country groups have launched new rules and strengthened character-istics of existing ones.
However, the next generation rules tend to be more com-plex, which could create new challenges for implementation, communication, and monitoring. Also, the index measures the institutional setup of rules and not the actual compliance. Nevertheless, the data set provides a basis that will allow researchers to tackle this issue in the future.
Tracking Use of Fiscal Rules
Numerical limits have emerged as a key response to the fiscal legacy of the crisis
About the databaseThe IMF’s newly compiled data set takes stock of national and supranational numerical fiscal rules in 81 countries from 1985 to end-March 2012. It allows for at-a-glance reviews of trends in the types and number of rules and their main characteristics, such as the legal basis, enforcement, coverage, escape clauses, and provisions for cyclical adjust-ments. The data set also covers supporting features, includ-ing independent monitoring bodies and fiscal responsibility laws, as well as detailed country-by-country descriptions of the rules in place. The data are accessible through an easy-to-operate visualization tool—allowing simple coun-try comparisons—as well as in Excel and Stata files that facilitate the work of researchers. The data set, which will be updated annually, and the study itself can be found at www.imf.org/external/datamapper/FiscalRules/map/map.htm
Data Spotlight, 7/24/2012
1990 92 94 96 98 2000 02 04 06 08 10 March 12
Looking at national rules, over the past decade emerging economies have closed the gap with advanced economies.(�scal rule index, 0–5)
Sources: National authorities; and IMF staff assessment.Note: The �scal rule index captures the number of �scal rules and their institutional setup. A
higher index indicates a higher number of rules and more comprehensive design features.
1.00
1.25
1.50
1.75
2.00
2.25
2.50
Low-income economiesEmerging economiesAdvanced economies
Data Spotlight, 7/23/2012
1990 92 94 96 98 2000 02 04 06 08 10 March 12
Since 1990, the number of countries turning to fiscal rules has increased dramatically.(number of countries with �scal rules)
Sources: National authorities; and IMF staff assessment.Note: Based on �scal rules in effect by end-March 2012.
0
10
20
30
40
50
60
70
80
All rulesNational rulesSupranational rules
Prepared by Nina Budina of the IMF’s European Department and Andrea Schaechter of the IMF’s Fiscal Affairs Department.

PROGRAM OF SEMINARS
Global ChallenGes Global solutions O C T O B E R 1 0 - 1 3 , 2 0 1 2 , T O k y O , J a p a n
The 2012 Program of Seminars brings together financial leaders, policymakers, and top thinkers to discuss the economic and development challenges facing the world today—with a special emphasis on the global economy, jobs and competitiveness, the euro area, growth in Asia, global health, low-income country issues, inclusive and sustainable growth, and sovereign risk.
PANELISTS INCLUDE Nisha Agrawal, Jun Azumi, Sharan Burrow, Gunilla Carlsson, Miguel Castilla, Margaret Chan, Paul Collier, Kwabena Duffuor, Kōichirō Gemba, Yoshihiro Inoue, Ellen Johnson Sirleaf, Chanda Kochhar, Christine Lagarde, Daokui Li, David Lipton, Christian Noyer, Peter Orszag, Li Qi, Nemat Shafik, Naoyuki Shinohara, Masaaki Shirakawa, Clare Short, Admassu Tadesse, Akihiko Tanaka, Gao Xiqing, Janet Yellen, Min Zhu.
For more information visit www.worldbank.org/pos
I n t e r n a t I o n a l M o n e t a r y F u n d ■ t H e W o r l d B a n k G r o u p