finance indicators (june 2011) - national audit office · 3 is the finance function proactively...
TRANSCRIPT
1
Finance Indicators
Finance value for money indicators guidance 1) Introduction This document sets out the indicators to be collected for the Finance Function. The guidance below starts by defining the scope of the function and goes onto identify key questions which reflect the requirements of a modern, value for money finance function that the indicators are aiming to help organisations achieve. The scope and key questions are included as background information as well as the primary and secondary indicators. 2) Scope The following activities are within our definition of this function for the purposes of this project: BUSINESS DECISION SUPPORT
Financial analysis and operational support (including finance input to strategic planning, projects, programmes and plans)
Cash management
Investing and financing
Risk management (re: exposure strategy, analysis, loss provisions)
Financial planning, budgeting and forecasting REPORTING AND CONTROL
General accounting
Financial reporting
Management reporting
Tax compliance and reporting (for example VAT)
Fixed assets and capital accounting
Cost and inventory accounting (where applicable)
Contract accounting (where applicable) TRANSACTION PROCESSING Debtors (accounts receivable)
Sales Order processing (where applicable)
2
Accounts Receivable
Customer invoicing (excluding customer services)
Credit and bad debt collection Creditors (accounts payable)
Accounts payable
Travel expense re-imbursement and reporting (but not if processed through payroll)
Purchasing card administration Note: the costs of the purchasing function are included in the definition of the procurement function Payroll Payroll and employee benefits processing (this is included under the Finance Function although we recognise that in some organisations this falls under the HR Function). The following activities are outside our definition for this function:
Council Tax and NNDR administration
Benefits administration (for example housing benefit, council tax benefit)
Rent collection and accounting
Cashiering (i.e. the operation of dedicated counters for face-to-face transactions)
Pensions administration
Audit – internal and external
Human Resources
Insurance and risk management 3) Key questions In order to help derive our VFM indicators for the Finance function, we have identified some key questions that reflect a modern, value for money Finance function which we hope the indicators will help to explore:
Is the Finance Function cost-effective?
Has the Finance Function achieved an appropriate balance in deploying staff resources between 1) processing financial transactions, 2) achieving compliance and 3) providing interpretation and advice regarding the financial results?
3
Is the Finance Function proactively supporting the needs of decision makers across the organisation?
Are transactional financial processes operated efficiently and effectively?
Is appropriate use made of technology to support the Finance Function in achieving efficient and effective delivery, particularly for transactional financial processes?
Does the Finance Function provide relevant, accurate and timely management information to support robust financial planning and management?
Are internal customers satisfied with the services provided by Finance? 4) Summary list of indicators
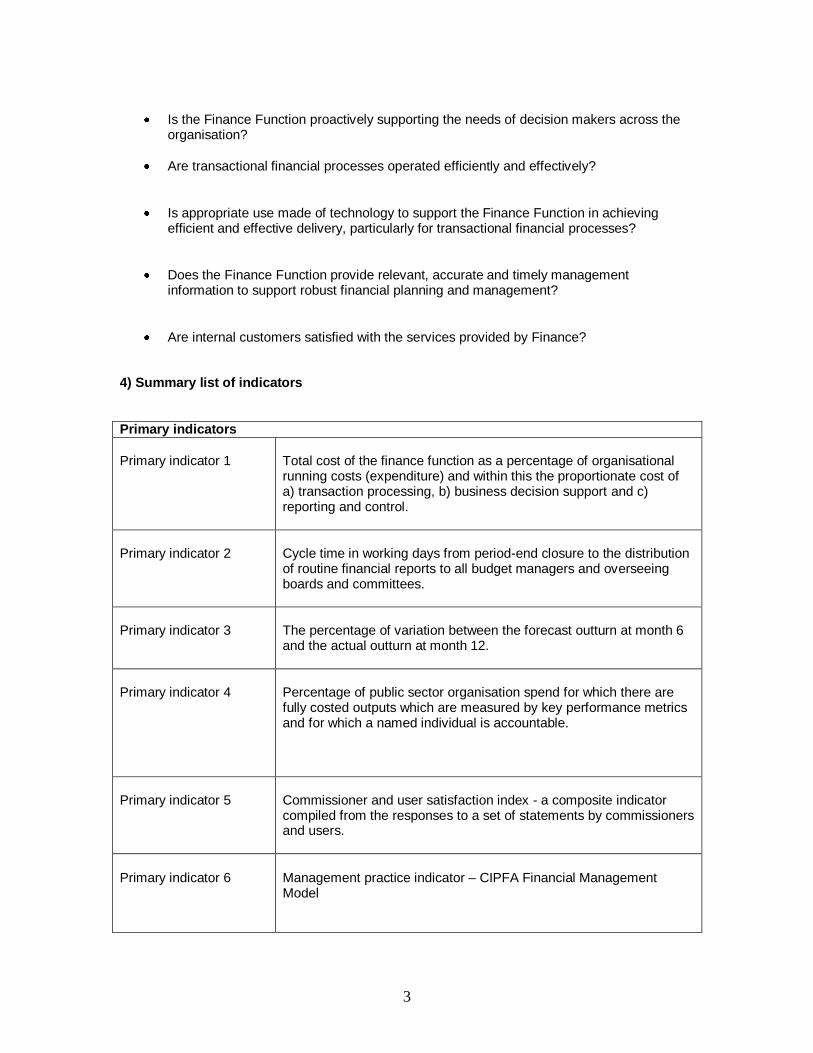
Primary indicators
Primary indicator 1
Total cost of the finance function as a percentage of organisational running costs (expenditure) and within this the proportionate cost of a) transaction processing, b) business decision support and c) reporting and control.
Primary indicator 2
Cycle time in working days from period-end closure to the distribution of routine financial reports to all budget managers and overseeing boards and committees.
Primary indicator 3
The percentage of variation between the forecast outturn at month 6 and the actual outturn at month 12.
Primary indicator 4
Percentage of public sector organisation spend for which there are fully costed outputs which are measured by key performance metrics and for which a named individual is accountable.
Primary indicator 5
Commissioner and user satisfaction index - a composite indicator compiled from the responses to a set of statements by commissioners and users.
Primary indicator 6 Management practice indicator – CIPFA Financial Management Model
4
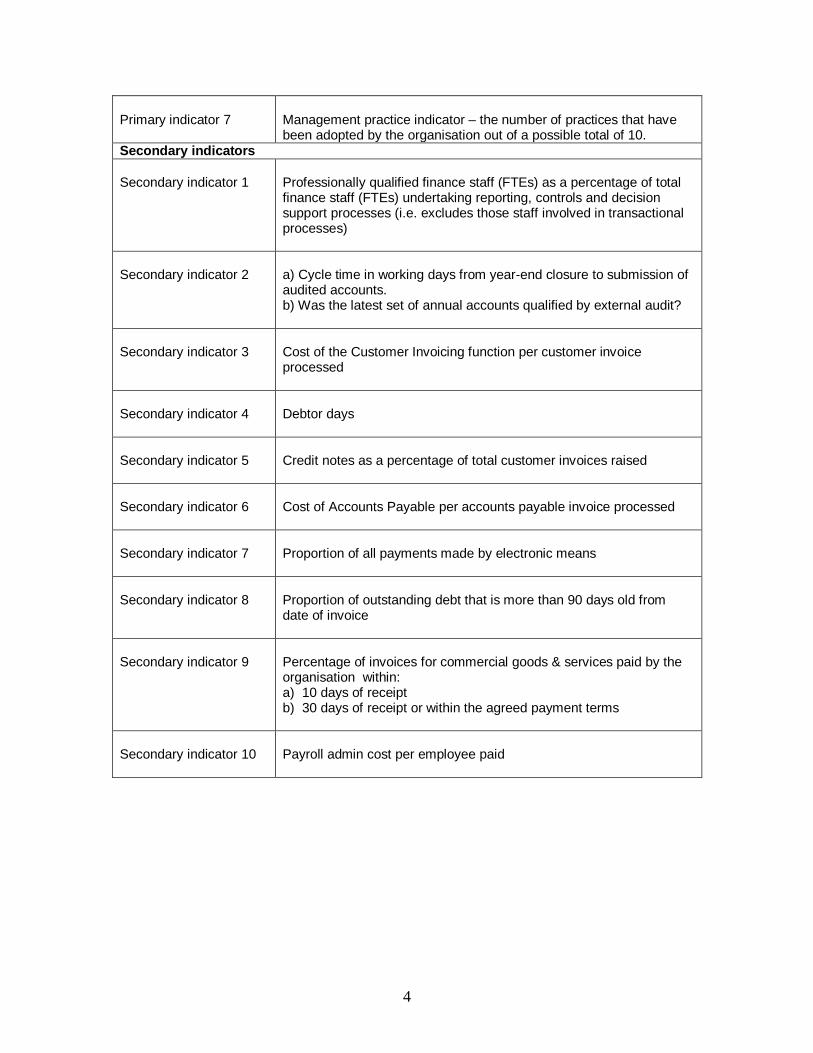
Primary indicator 7 Management practice indicator – the number of practices that have been adopted by the organisation out of a possible total of 10.
Secondary indicators
Secondary indicator 1
Professionally qualified finance staff (FTEs) as a percentage of total finance staff (FTEs) undertaking reporting, controls and decision support processes (i.e. excludes those staff involved in transactional processes)
Secondary indicator 2
a) Cycle time in working days from year-end closure to submission of audited accounts. b) Was the latest set of annual accounts qualified by external audit?
Secondary indicator 3
Cost of the Customer Invoicing function per customer invoice processed
Secondary indicator 4
Debtor days
Secondary indicator 5
Credit notes as a percentage of total customer invoices raised
Secondary indicator 6
Cost of Accounts Payable per accounts payable invoice processed
Secondary indicator 7
Proportion of all payments made by electronic means
Secondary indicator 8
Proportion of outstanding debt that is more than 90 days old from date of invoice
Secondary indicator 9
Percentage of invoices for commercial goods & services paid by the organisation within: a) 10 days of receipt b) 30 days of receipt or within the agreed payment terms
Secondary indicator 10
Payroll admin cost per employee paid
5
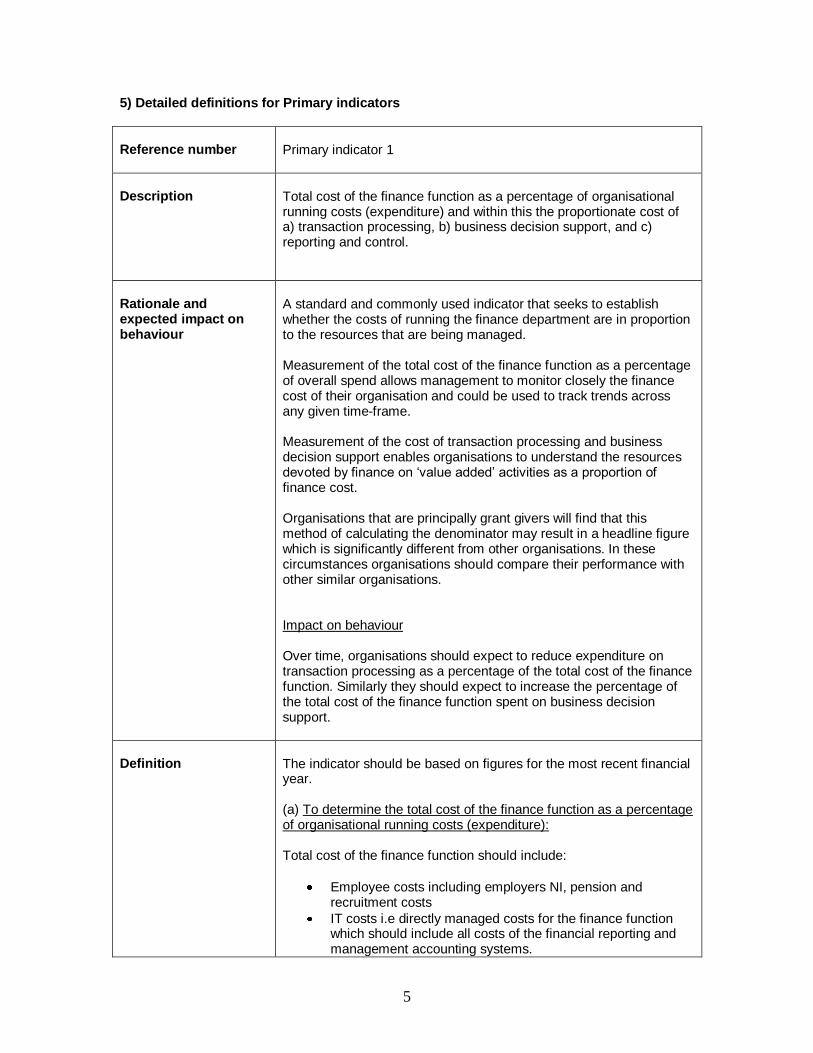
5) Detailed definitions for Primary indicators
Reference number
Primary indicator 1
Description
Total cost of the finance function as a percentage of organisational running costs (expenditure) and within this the proportionate cost of a) transaction processing, b) business decision support, and c) reporting and control.
Rationale and expected impact on behaviour
A standard and commonly used indicator that seeks to establish whether the costs of running the finance department are in proportion to the resources that are being managed. Measurement of the total cost of the finance function as a percentage of overall spend allows management to monitor closely the finance cost of their organisation and could be used to track trends across any given time-frame. Measurement of the cost of transaction processing and business decision support enables organisations to understand the resources devoted by finance on ‗value added‘ activities as a proportion of finance cost. Organisations that are principally grant givers will find that this method of calculating the denominator may result in a headline figure which is significantly different from other organisations. In these circumstances organisations should compare their performance with other similar organisations. Impact on behaviour Over time, organisations should expect to reduce expenditure on transaction processing as a percentage of the total cost of the finance function. Similarly they should expect to increase the percentage of the total cost of the finance function spent on business decision support.
Definition
The indicator should be based on figures for the most recent financial year. (a) To determine the total cost of the finance function as a percentage of organisational running costs (expenditure): Total cost of the finance function should include:
Employee costs including employers NI, pension and recruitment costs
IT costs i.e directly managed costs for the finance function which should include all costs of the financial reporting and management accounting systems.
6
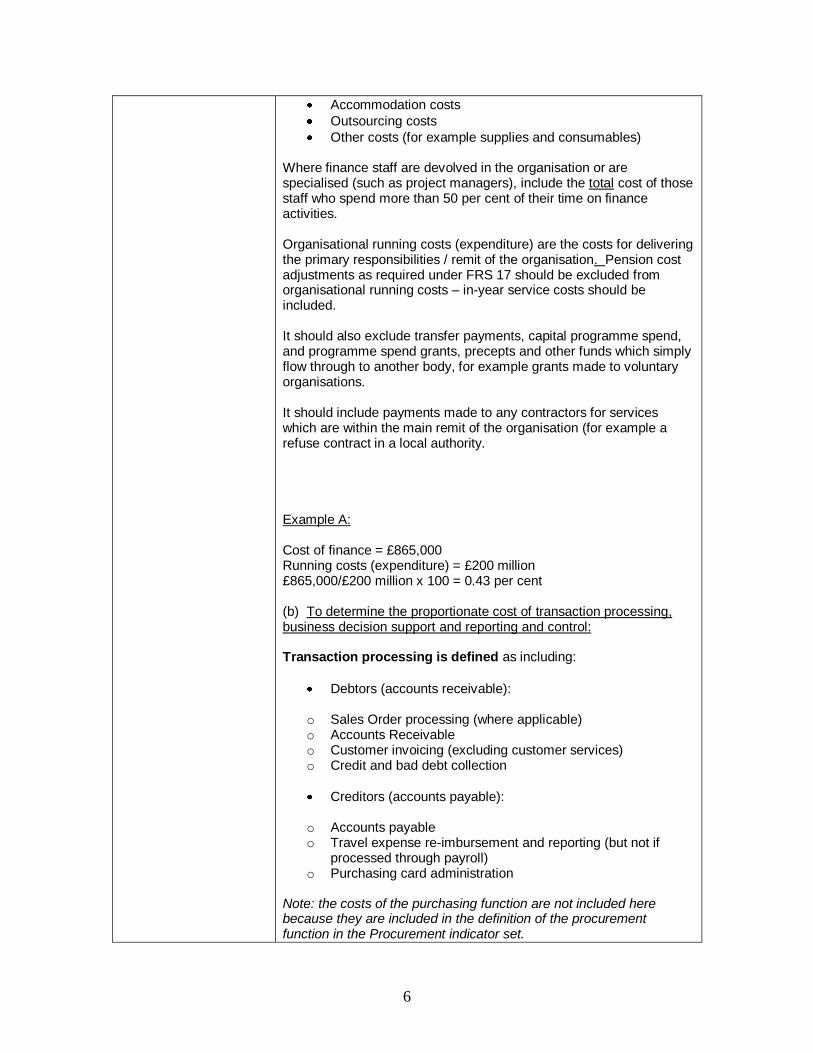
Accommodation costs
Outsourcing costs
Other costs (for example supplies and consumables) Where finance staff are devolved in the organisation or are specialised (such as project managers), include the total cost of those staff who spend more than 50 per cent of their time on finance activities. Organisational running costs (expenditure) are the costs for delivering the primary responsibilities / remit of the organisation. Pension cost adjustments as required under FRS 17 should be excluded from organisational running costs – in-year service costs should be included. It should also exclude transfer payments, capital programme spend, and programme spend grants, precepts and other funds which simply flow through to another body, for example grants made to voluntary organisations. It should include payments made to any contractors for services which are within the main remit of the organisation (for example a refuse contract in a local authority. Example A: Cost of finance = £865,000 Running costs (expenditure) = £200 million £865,000/£200 million x 100 = 0.43 per cent (b) To determine the proportionate cost of transaction processing, business decision support and reporting and control: Transaction processing is defined as including:
Debtors (accounts receivable):
o Sales Order processing (where applicable) o Accounts Receivable o Customer invoicing (excluding customer services) o Credit and bad debt collection
Creditors (accounts payable):
o Accounts payable o Travel expense re-imbursement and reporting (but not if
processed through payroll) o Purchasing card administration
Note: the costs of the purchasing function are not included here because they are included in the definition of the procurement function in the Procurement indicator set.

7
Payroll:
o Payroll and employee benefits processing (this is covered under the Finance Function although we recognise that in some organisations this falls under the HR Function).
The following activities are outside our definition:
Council Tax and NNDR administration
Benefits administration (for example housing benefit, council tax benefit)
Rent collection and accounting
Cashiering (the operation of dedicated counters for face-to-face transactions)
Pensions administration
Audit - internal and external
Human Resources
Insurance and risk management Business decision support is defined as:
Financial analysis and operational support
Cash management
Investing and financing
Risk management (for example regarding exposure strategy, analysis, loss provisions)
Financial planning, budgeting and forecasting Need the following if reporting and control are included (c) Reporting and Control is defined as
General accounting
Financial reporting
Management reporting
Tax compliance and reporting (for example VAT)
Fixed assets and capital accounting
Cost and inventory accounting (where applicable)
Contract accounting (where applicable) (More generally, it is recognised that some degree of estimation may be necessary to calculate this indicator unless a detailed time analysis has been undertaken).

8
Example B: Cost of business decision support = £160,000 Overall cost of finance function = £865,000 Proportion of cost of finance function spent on business decision support is (£160,000/£865,000 x 100 per cent) = 18.4 per cent
9
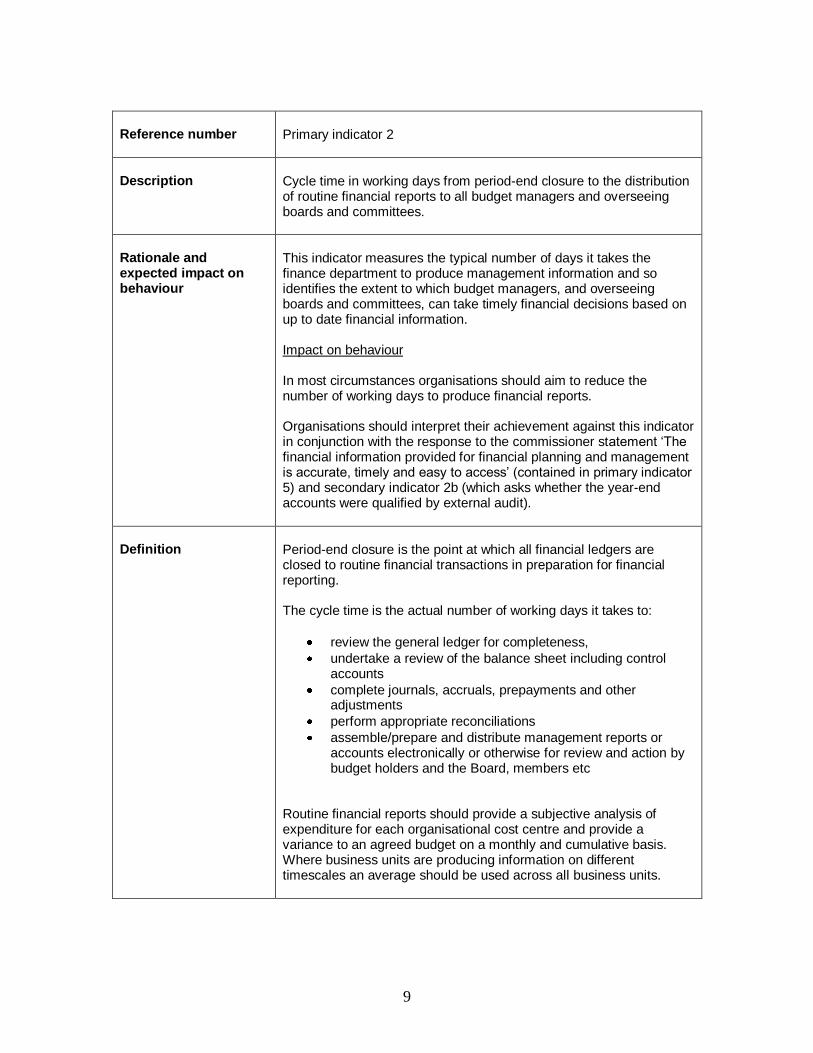
Reference number
Primary indicator 2
Description
Cycle time in working days from period-end closure to the distribution of routine financial reports to all budget managers and overseeing boards and committees.
Rationale and expected impact on behaviour
This indicator measures the typical number of days it takes the finance department to produce management information and so identifies the extent to which budget managers, and overseeing boards and committees, can take timely financial decisions based on up to date financial information. Impact on behaviour In most circumstances organisations should aim to reduce the number of working days to produce financial reports. Organisations should interpret their achievement against this indicator in conjunction with the response to the commissioner statement ‗The financial information provided for financial planning and management is accurate, timely and easy to access‘ (contained in primary indicator 5) and secondary indicator 2b (which asks whether the year-end accounts were qualified by external audit).
Definition
Period-end closure is the point at which all financial ledgers are closed to routine financial transactions in preparation for financial reporting. The cycle time is the actual number of working days it takes to:
review the general ledger for completeness,
undertake a review of the balance sheet including control accounts
complete journals, accruals, prepayments and other adjustments
perform appropriate reconciliations
assemble/prepare and distribute management reports or accounts electronically or otherwise for review and action by budget holders and the Board, members etc
Routine financial reports should provide a subjective analysis of expenditure for each organisational cost centre and provide a variance to an agreed budget on a monthly and cumulative basis. Where business units are producing information on different timescales an average should be used across all business units.
10
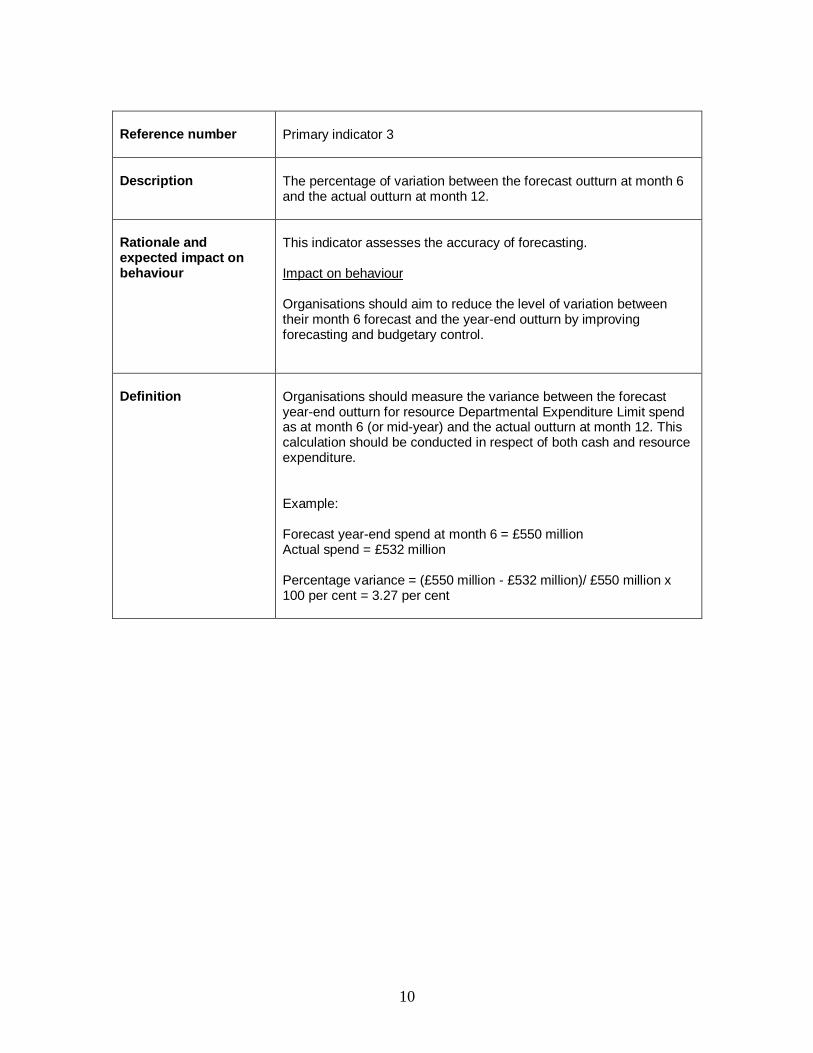
Reference number
Primary indicator 3
Description
The percentage of variation between the forecast outturn at month 6 and the actual outturn at month 12.
Rationale and expected impact on behaviour
This indicator assesses the accuracy of forecasting. Impact on behaviour Organisations should aim to reduce the level of variation between their month 6 forecast and the year-end outturn by improving forecasting and budgetary control.
Definition
Organisations should measure the variance between the forecast year-end outturn for resource Departmental Expenditure Limit spend as at month 6 (or mid-year) and the actual outturn at month 12. This calculation should be conducted in respect of both cash and resource expenditure. Example: Forecast year-end spend at month 6 = £550 million Actual spend = £532 million Percentage variance = (£550 million - £532 million)/ £550 million x 100 per cent = 3.27 per cent
11
Reference number
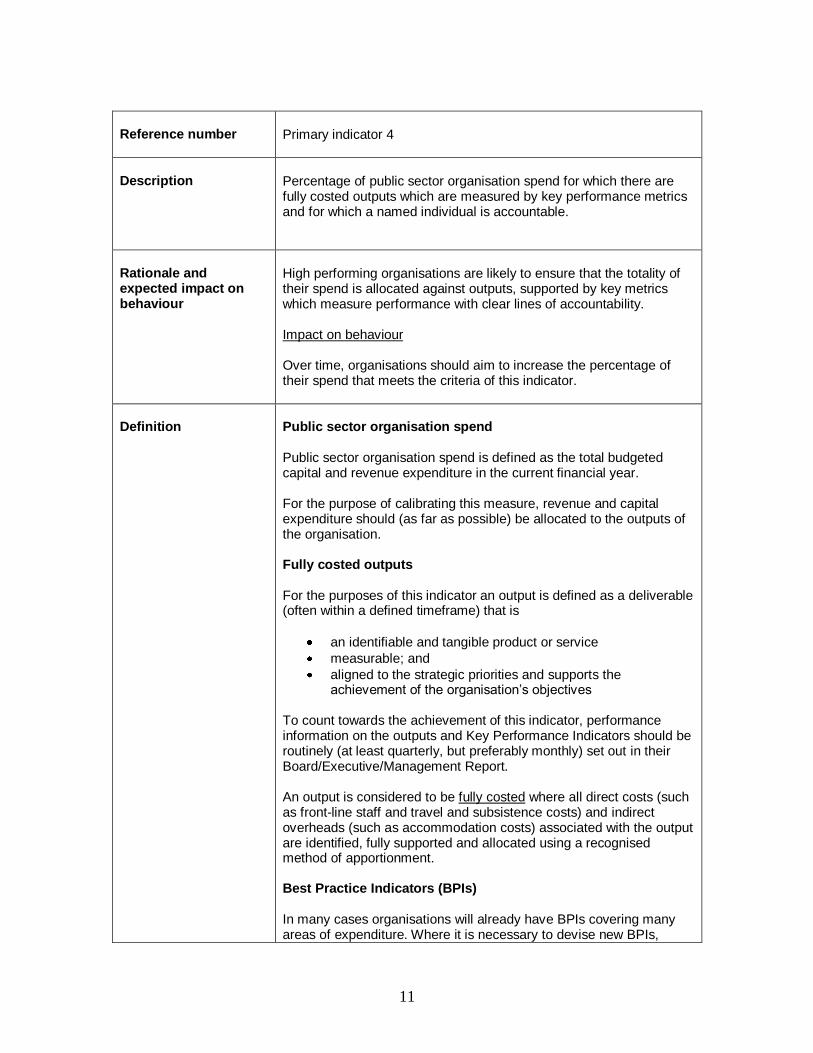
Primary indicator 4
Description
Percentage of public sector organisation spend for which there are fully costed outputs which are measured by key performance metrics and for which a named individual is accountable.
Rationale and expected impact on behaviour
High performing organisations are likely to ensure that the totality of their spend is allocated against outputs, supported by key metrics which measure performance with clear lines of accountability. Impact on behaviour Over time, organisations should aim to increase the percentage of their spend that meets the criteria of this indicator.
Definition
Public sector organisation spend Public sector organisation spend is defined as the total budgeted capital and revenue expenditure in the current financial year. For the purpose of calibrating this measure, revenue and capital expenditure should (as far as possible) be allocated to the outputs of the organisation. Fully costed outputs For the purposes of this indicator an output is defined as a deliverable (often within a defined timeframe) that is
an identifiable and tangible product or service
measurable; and
aligned to the strategic priorities and supports the achievement of the organisation‘s objectives
To count towards the achievement of this indicator, performance information on the outputs and Key Performance Indicators should be routinely (at least quarterly, but preferably monthly) set out in their Board/Executive/Management Report. An output is considered to be fully costed where all direct costs (such as front-line staff and travel and subsistence costs) and indirect overheads (such as accommodation costs) associated with the output are identified, fully supported and allocated using a recognised method of apportionment. Best Practice Indicators (BPIs) In many cases organisations will already have BPIs covering many areas of expenditure. Where it is necessary to devise new BPIs,
12
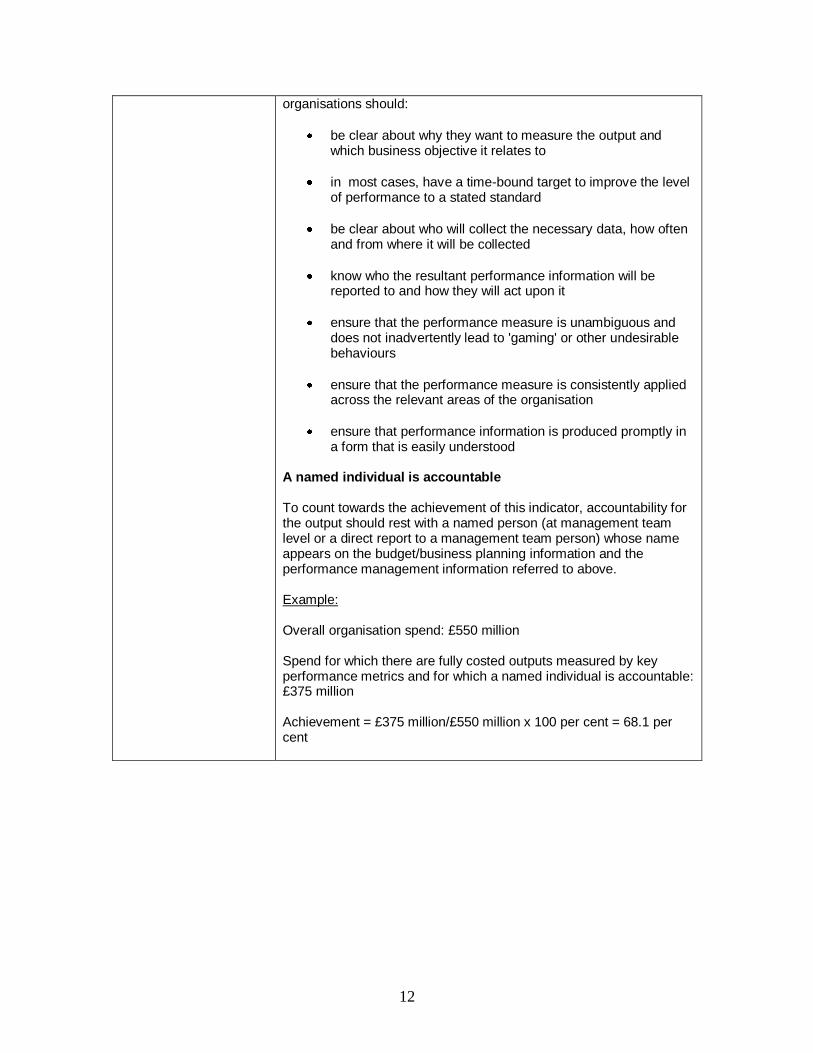
organisations should:
be clear about why they want to measure the output and which business objective it relates to
in most cases, have a time-bound target to improve the level of performance to a stated standard
be clear about who will collect the necessary data, how often and from where it will be collected
know who the resultant performance information will be reported to and how they will act upon it
ensure that the performance measure is unambiguous and does not inadvertently lead to 'gaming' or other undesirable behaviours
ensure that the performance measure is consistently applied across the relevant areas of the organisation
ensure that performance information is produced promptly in a form that is easily understood
A named individual is accountable To count towards the achievement of this indicator, accountability for the output should rest with a named person (at management team level or a direct report to a management team person) whose name appears on the budget/business planning information and the performance management information referred to above. Example: Overall organisation spend: £550 million Spend for which there are fully costed outputs measured by key performance metrics and for which a named individual is accountable: £375 million Achievement = £375 million/£550 million x 100 per cent = 68.1 per cent
13
Reference number
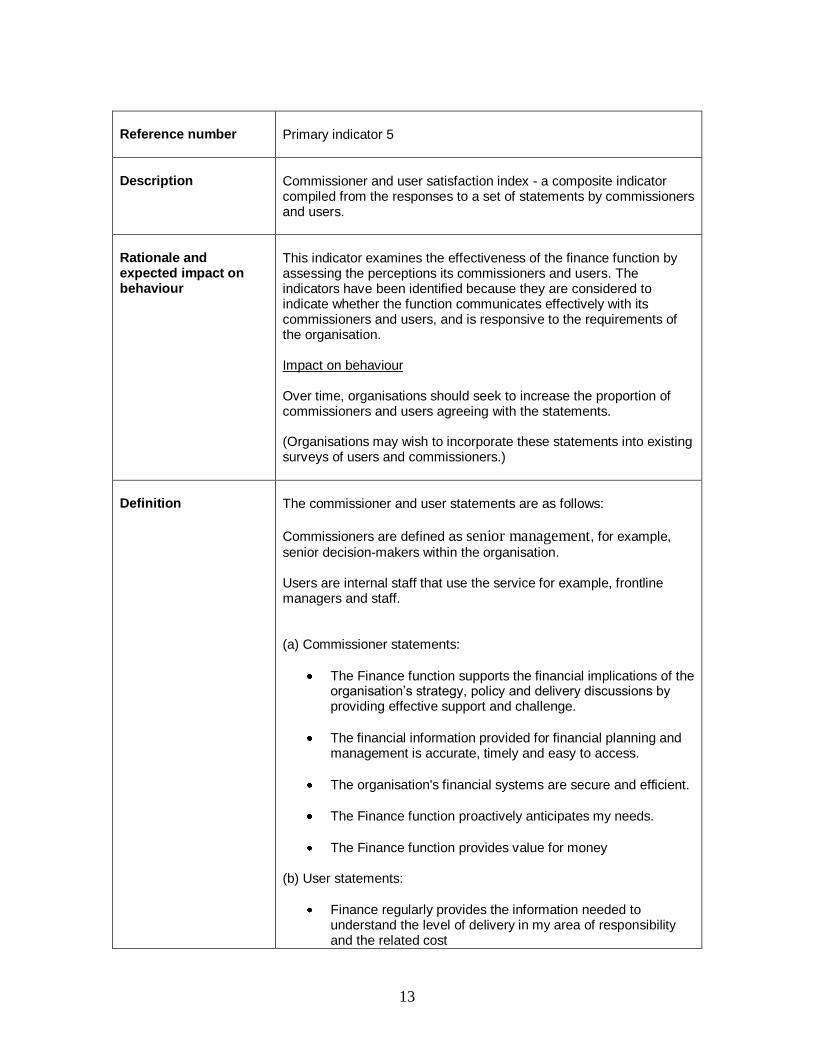
Primary indicator 5
Description
Commissioner and user satisfaction index - a composite indicator compiled from the responses to a set of statements by commissioners and users.
Rationale and expected impact on behaviour
This indicator examines the effectiveness of the finance function by assessing the perceptions its commissioners and users. The indicators have been identified because they are considered to indicate whether the function communicates effectively with its commissioners and users, and is responsive to the requirements of the organisation. Impact on behaviour Over time, organisations should seek to increase the proportion of commissioners and users agreeing with the statements. (Organisations may wish to incorporate these statements into existing surveys of users and commissioners.)
Definition
The commissioner and user statements are as follows:
Commissioners are defined as senior management, for example,
senior decision-makers within the organisation. Users are internal staff that use the service for example, frontline managers and staff. (a) Commissioner statements:
The Finance function supports the financial implications of the organisation‘s strategy, policy and delivery discussions by providing effective support and challenge.
The financial information provided for financial planning and management is accurate, timely and easy to access.
The organisation's financial systems are secure and efficient.
The Finance function proactively anticipates my needs.
The Finance function provides value for money (b) User statements:
Finance regularly provides the information needed to understand the level of delivery in my area of responsibility and the related cost

14
Finance policies and procedures are clear and understandable
The organisation has clear and easy to use financial systems
Appropriate financial management training for non-finance staff is provided
I know who to contact if I have a query regarding finance.
15
Reference number
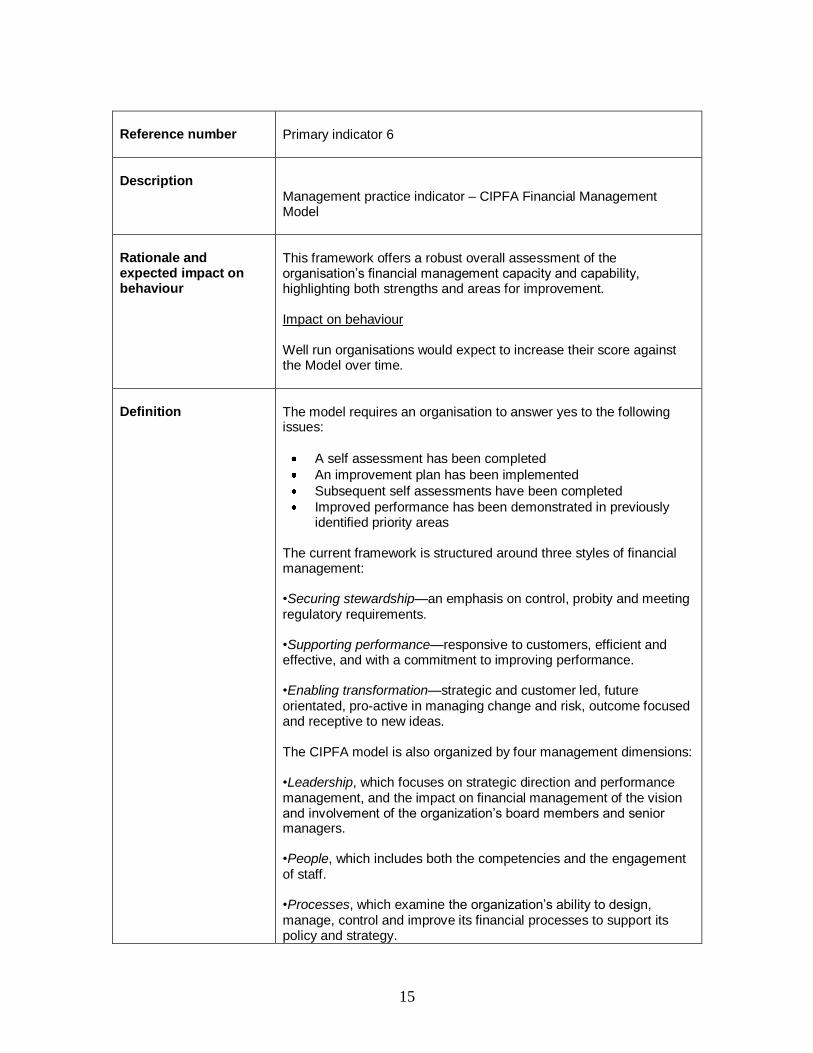
Primary indicator 6
Description
Management practice indicator – CIPFA Financial Management Model
Rationale and expected impact on behaviour
This framework offers a robust overall assessment of the organisation‘s financial management capacity and capability, highlighting both strengths and areas for improvement. Impact on behaviour Well run organisations would expect to increase their score against the Model over time.
Definition
The model requires an organisation to answer yes to the following issues:
A self assessment has been completed
An improvement plan has been implemented
Subsequent self assessments have been completed
Improved performance has been demonstrated in previously identified priority areas
The current framework is structured around three styles of financial management: •Securing stewardship—an emphasis on control, probity and meeting regulatory requirements. •Supporting performance—responsive to customers, efficient and effective, and with a commitment to improving performance. •Enabling transformation—strategic and customer led, future orientated, pro-active in managing change and risk, outcome focused and receptive to new ideas. The CIPFA model is also organized by four management dimensions: •Leadership, which focuses on strategic direction and performance management, and the impact on financial management of the vision and involvement of the organization‘s board members and senior managers. •People, which includes both the competencies and the engagement of staff. •Processes, which examine the organization‘s ability to design, manage, control and improve its financial processes to support its policy and strategy.

16
•Stakeholders, which deals with the relationships between the organization and those with an interest in its financial health, whether government, inspectors, taxpayers, suppliers, customers or partners. It also deals with customer relationships inside the organization, between finance services and their internal users. The Model enables organisations to score themselves against a matrix comprising each of the five management dimensions applied to each of the three financial management styles. They should complete the Model and then prepare an action plan to be implemented to address the key areas of weakness.
17
Reference number
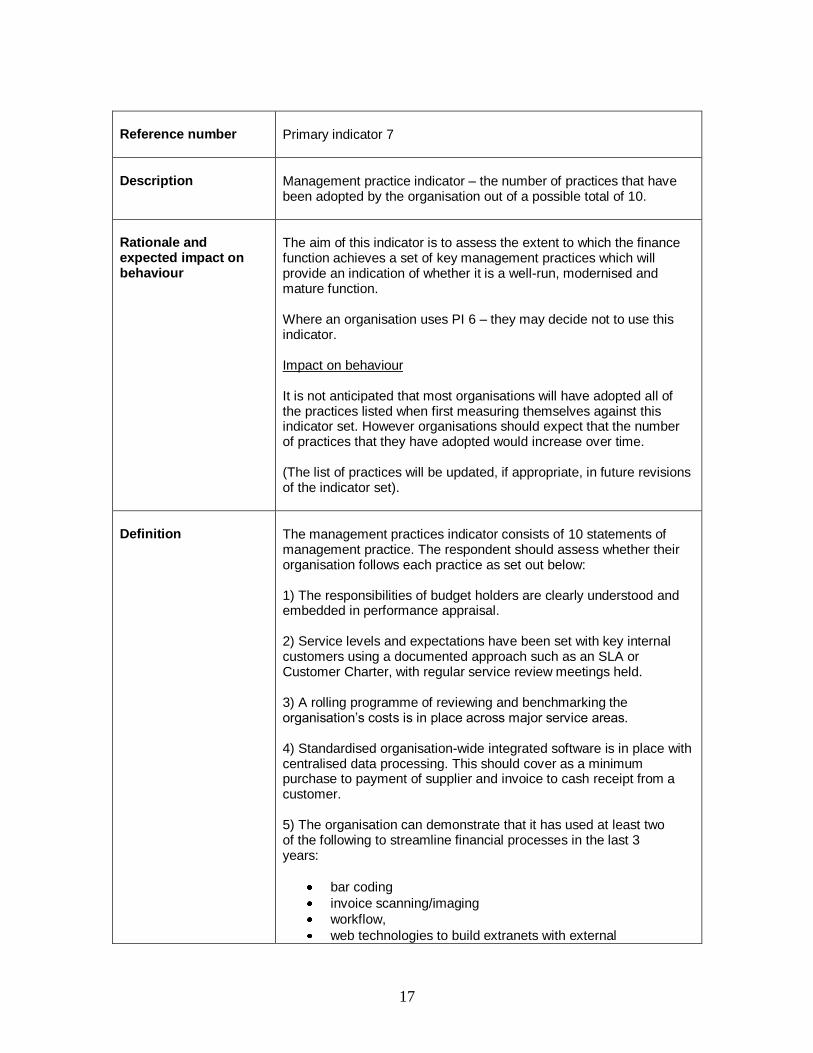
Primary indicator 7
Description
Management practice indicator – the number of practices that have been adopted by the organisation out of a possible total of 10.
Rationale and expected impact on behaviour
The aim of this indicator is to assess the extent to which the finance function achieves a set of key management practices which will provide an indication of whether it is a well-run, modernised and mature function. Where an organisation uses PI 6 – they may decide not to use this indicator. Impact on behaviour It is not anticipated that most organisations will have adopted all of the practices listed when first measuring themselves against this indicator set. However organisations should expect that the number of practices that they have adopted would increase over time. (The list of practices will be updated, if appropriate, in future revisions of the indicator set).
Definition
The management practices indicator consists of 10 statements of management practice. The respondent should assess whether their organisation follows each practice as set out below: 1) The responsibilities of budget holders are clearly understood and embedded in performance appraisal. 2) Service levels and expectations have been set with key internal customers using a documented approach such as an SLA or Customer Charter, with regular service review meetings held. 3) A rolling programme of reviewing and benchmarking the organisation‘s costs is in place across major service areas. 4) Standardised organisation-wide integrated software is in place with centralised data processing. This should cover as a minimum purchase to payment of supplier and invoice to cash receipt from a customer. 5) The organisation can demonstrate that it has used at least two of the following to streamline financial processes in the last 3 years:
bar coding
invoice scanning/imaging
workflow,
web technologies to build extranets with external
18
stakeholders
intranet to build self service capabilities for staff to check status and run reports
on-line travel and expense system used by claimants that is fully integrated with the accounting system.
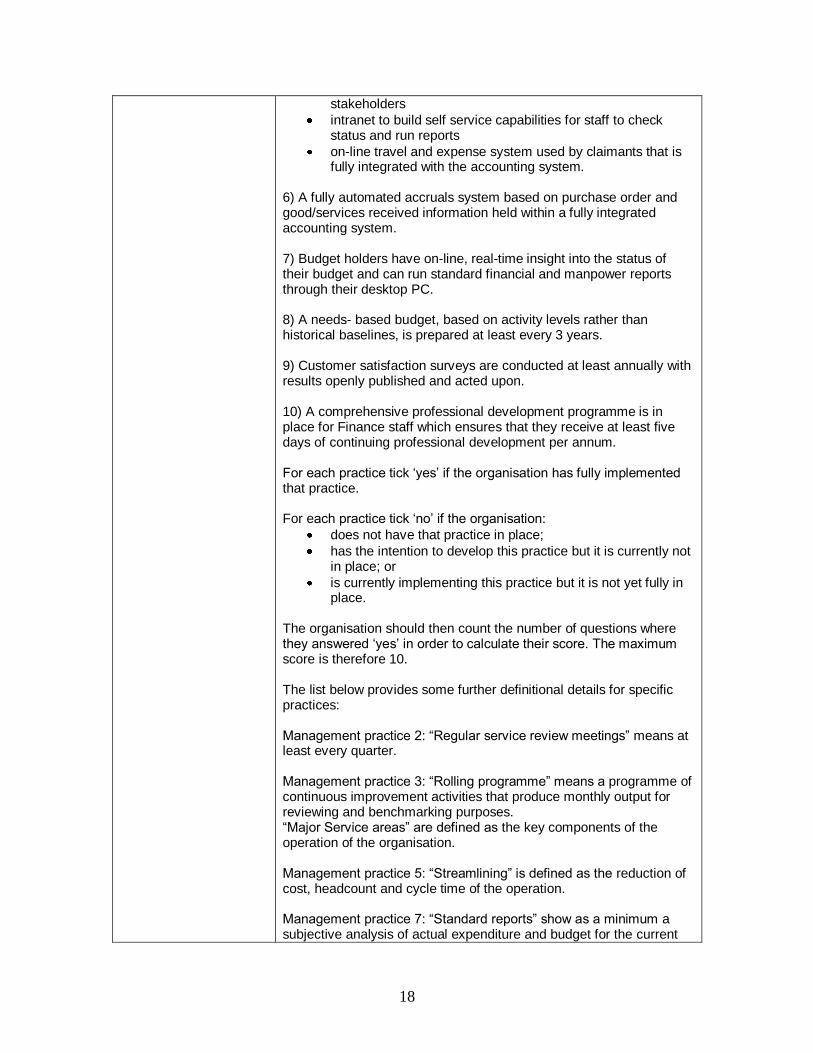
6) A fully automated accruals system based on purchase order and good/services received information held within a fully integrated accounting system. 7) Budget holders have on-line, real-time insight into the status of their budget and can run standard financial and manpower reports through their desktop PC. 8) A needs- based budget, based on activity levels rather than historical baselines, is prepared at least every 3 years. 9) Customer satisfaction surveys are conducted at least annually with results openly published and acted upon. 10) A comprehensive professional development programme is in place for Finance staff which ensures that they receive at least five days of continuing professional development per annum. For each practice tick ‗yes‘ if the organisation has fully implemented that practice. For each practice tick ‗no‘ if the organisation:
does not have that practice in place;
has the intention to develop this practice but it is currently not in place; or
is currently implementing this practice but it is not yet fully in place.
The organisation should then count the number of questions where they answered ‗yes‘ in order to calculate their score. The maximum score is therefore 10. The list below provides some further definitional details for specific practices: Management practice 2: ―Regular service review meetings‖ means at least every quarter. Management practice 3: ―Rolling programme‖ means a programme of continuous improvement activities that produce monthly output for reviewing and benchmarking purposes. ―Major Service areas‖ are defined as the key components of the operation of the organisation. Management practice 5: ―Streamlining‖ is defined as the reduction of cost, headcount and cycle time of the operation. Management practice 7: ―Standard reports‖ show as a minimum a subjective analysis of actual expenditure and budget for the current

19
period, and on a cumulative basis for specific cost centres (with associated variances). There should be the ability to drill down into the underlying transactions. Management practice 8: A ‗‘needs-based budget‖ takes into account the underlying volume/activity and price associated with the budget heading, as opposed to building a budget that is based on a previous period's funding with adjustment for inflation etc. Management practice 9: Customer satisfaction surveys will be distributed across all finance customers as opposed to a selection of customers.
20
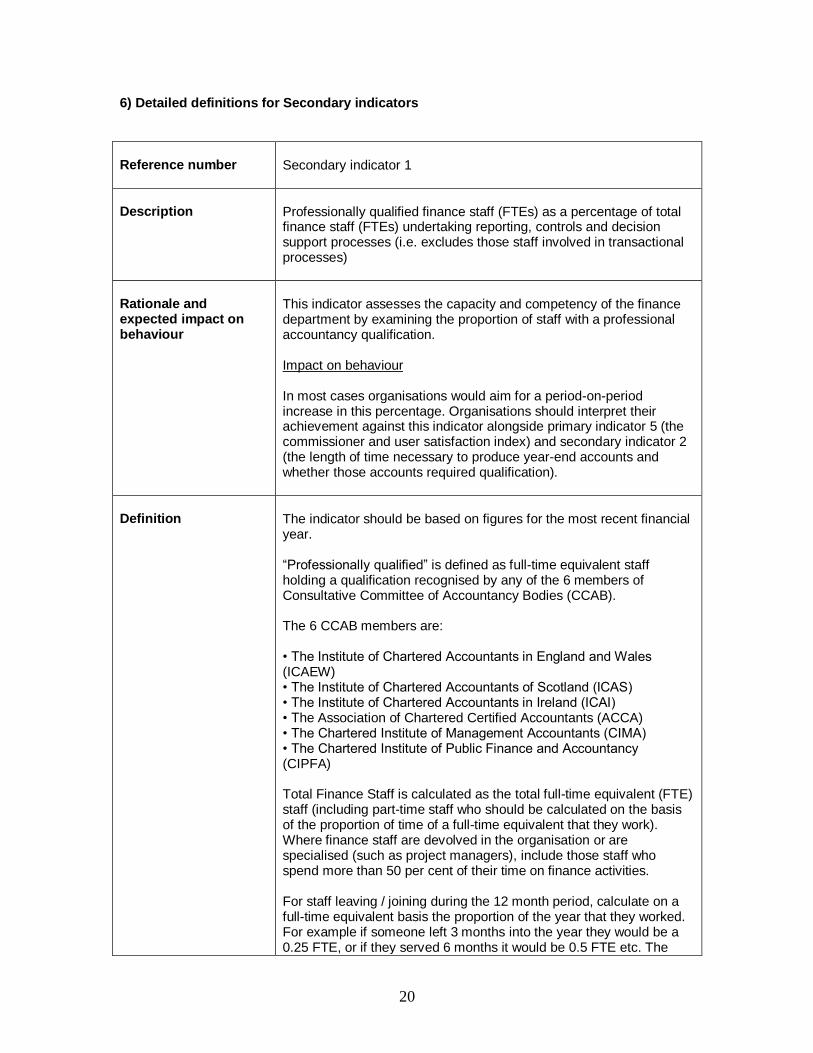
6) Detailed definitions for Secondary indicators Reference number
Secondary indicator 1
Description
Professionally qualified finance staff (FTEs) as a percentage of total finance staff (FTEs) undertaking reporting, controls and decision support processes (i.e. excludes those staff involved in transactional processes)
Rationale and expected impact on behaviour
This indicator assesses the capacity and competency of the finance department by examining the proportion of staff with a professional accountancy qualification. Impact on behaviour In most cases organisations would aim for a period-on-period increase in this percentage. Organisations should interpret their achievement against this indicator alongside primary indicator 5 (the commissioner and user satisfaction index) and secondary indicator 2 (the length of time necessary to produce year-end accounts and whether those accounts required qualification).
Definition
The indicator should be based on figures for the most recent financial year. ―Professionally qualified‖ is defined as full-time equivalent staff holding a qualification recognised by any of the 6 members of Consultative Committee of Accountancy Bodies (CCAB). The 6 CCAB members are: • The Institute of Chartered Accountants in England and Wales (ICAEW) • The Institute of Chartered Accountants of Scotland (ICAS) • The Institute of Chartered Accountants in Ireland (ICAI) • The Association of Chartered Certified Accountants (ACCA) • The Chartered Institute of Management Accountants (CIMA) • The Chartered Institute of Public Finance and Accountancy (CIPFA) Total Finance Staff is calculated as the total full-time equivalent (FTE) staff (including part-time staff who should be calculated on the basis of the proportion of time of a full-time equivalent that they work). Where finance staff are devolved in the organisation or are specialised (such as project managers), include those staff who spend more than 50 per cent of their time on finance activities. For staff leaving / joining during the 12 month period, calculate on a full-time equivalent basis the proportion of the year that they worked. For example if someone left 3 months into the year they would be a 0.25 FTE, or if they served 6 months it would be 0.5 FTE etc. The
21
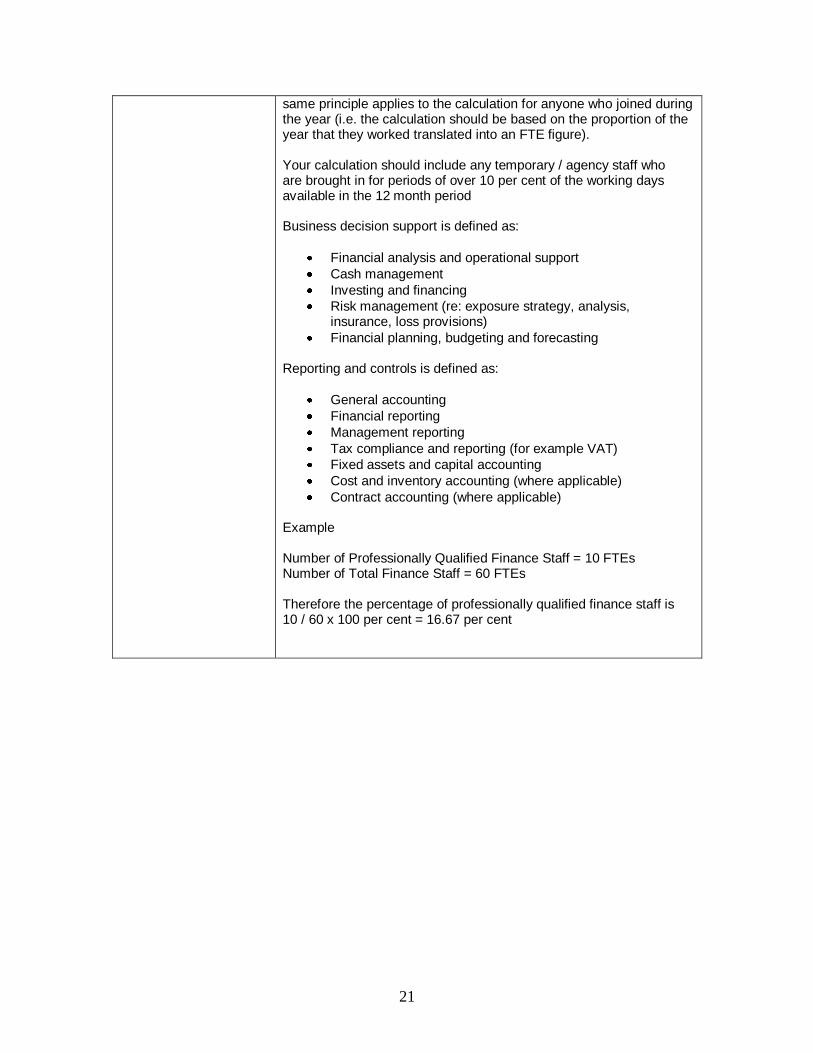
same principle applies to the calculation for anyone who joined during the year (i.e. the calculation should be based on the proportion of the year that they worked translated into an FTE figure). Your calculation should include any temporary / agency staff who are brought in for periods of over 10 per cent of the working days available in the 12 month period Business decision support is defined as:
Financial analysis and operational support
Cash management
Investing and financing
Risk management (re: exposure strategy, analysis, insurance, loss provisions)
Financial planning, budgeting and forecasting Reporting and controls is defined as:
General accounting
Financial reporting
Management reporting
Tax compliance and reporting (for example VAT)
Fixed assets and capital accounting
Cost and inventory accounting (where applicable)
Contract accounting (where applicable) Example Number of Professionally Qualified Finance Staff = 10 FTEs Number of Total Finance Staff = 60 FTEs Therefore the percentage of professionally qualified finance staff is 10 / 60 x 100 per cent = 16.67 per cent
22
Reference number
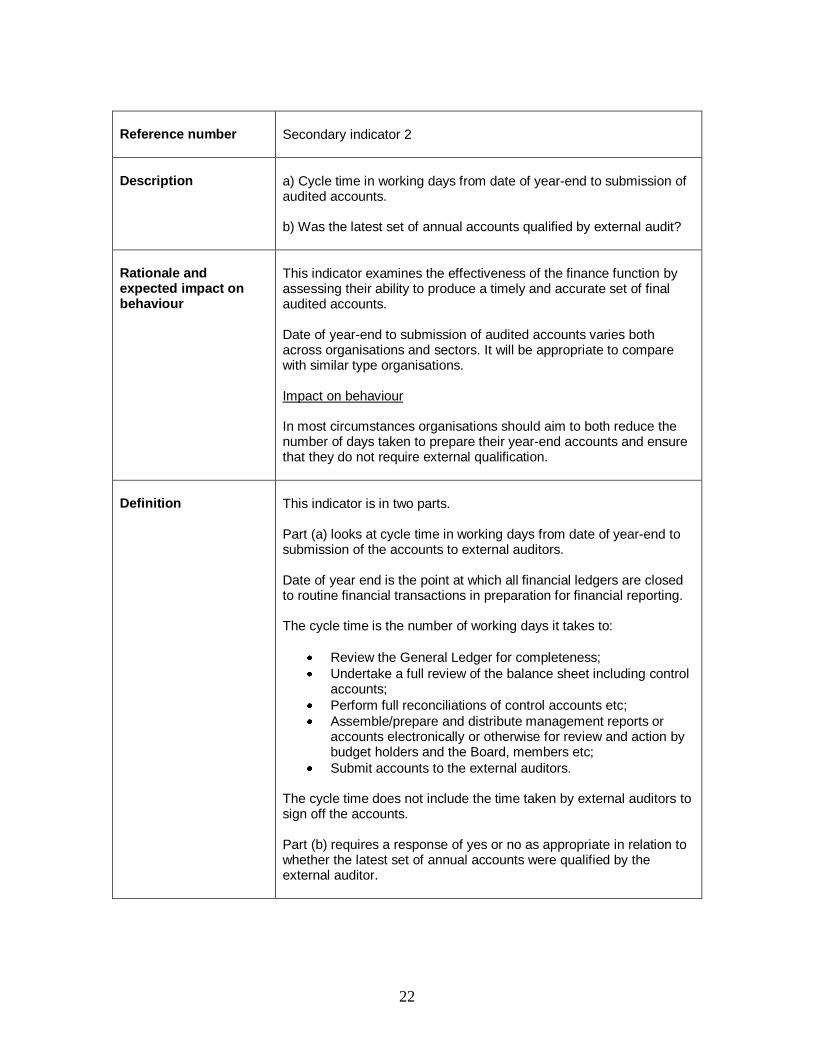
Secondary indicator 2
Description
a) Cycle time in working days from date of year-end to submission of audited accounts. b) Was the latest set of annual accounts qualified by external audit?
Rationale and expected impact on behaviour
This indicator examines the effectiveness of the finance function by assessing their ability to produce a timely and accurate set of final audited accounts. Date of year-end to submission of audited accounts varies both across organisations and sectors. It will be appropriate to compare with similar type organisations. Impact on behaviour In most circumstances organisations should aim to both reduce the number of days taken to prepare their year-end accounts and ensure that they do not require external qualification.
Definition
This indicator is in two parts. Part (a) looks at cycle time in working days from date of year-end to submission of the accounts to external auditors. Date of year end is the point at which all financial ledgers are closed to routine financial transactions in preparation for financial reporting. The cycle time is the number of working days it takes to:
Review the General Ledger for completeness;
Undertake a full review of the balance sheet including control accounts;
Perform full reconciliations of control accounts etc;
Assemble/prepare and distribute management reports or accounts electronically or otherwise for review and action by budget holders and the Board, members etc;
Submit accounts to the external auditors. The cycle time does not include the time taken by external auditors to sign off the accounts. Part (b) requires a response of yes or no as appropriate in relation to whether the latest set of annual accounts were qualified by the external auditor.
23
Reference number
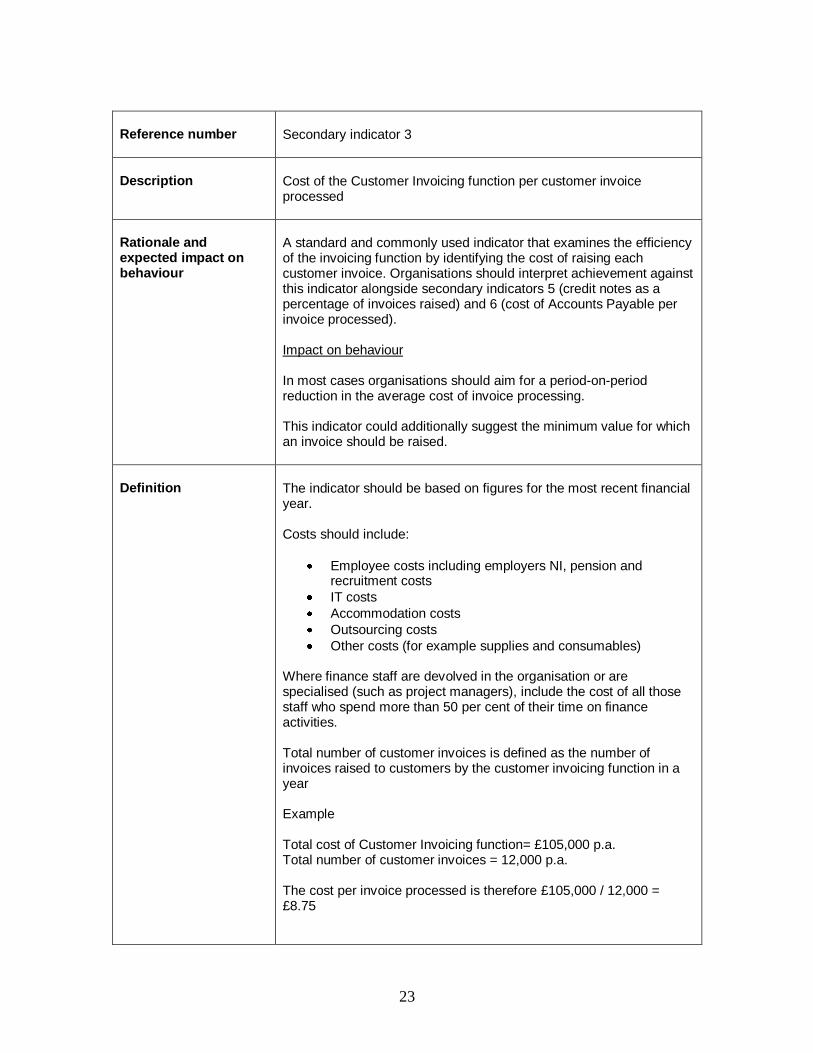
Secondary indicator 3
Description
Cost of the Customer Invoicing function per customer invoice processed
Rationale and expected impact on behaviour
A standard and commonly used indicator that examines the efficiency of the invoicing function by identifying the cost of raising each customer invoice. Organisations should interpret achievement against this indicator alongside secondary indicators 5 (credit notes as a percentage of invoices raised) and 6 (cost of Accounts Payable per invoice processed). Impact on behaviour In most cases organisations should aim for a period-on-period reduction in the average cost of invoice processing. This indicator could additionally suggest the minimum value for which an invoice should be raised.
Definition
The indicator should be based on figures for the most recent financial year. Costs should include:
Employee costs including employers NI, pension and recruitment costs
IT costs
Accommodation costs
Outsourcing costs
Other costs (for example supplies and consumables) Where finance staff are devolved in the organisation or are specialised (such as project managers), include the cost of all those staff who spend more than 50 per cent of their time on finance activities. Total number of customer invoices is defined as the number of invoices raised to customers by the customer invoicing function in a year Example Total cost of Customer Invoicing function= £105,000 p.a. Total number of customer invoices = 12,000 p.a. The cost per invoice processed is therefore £105,000 / 12,000 = £8.75
24
Reference number
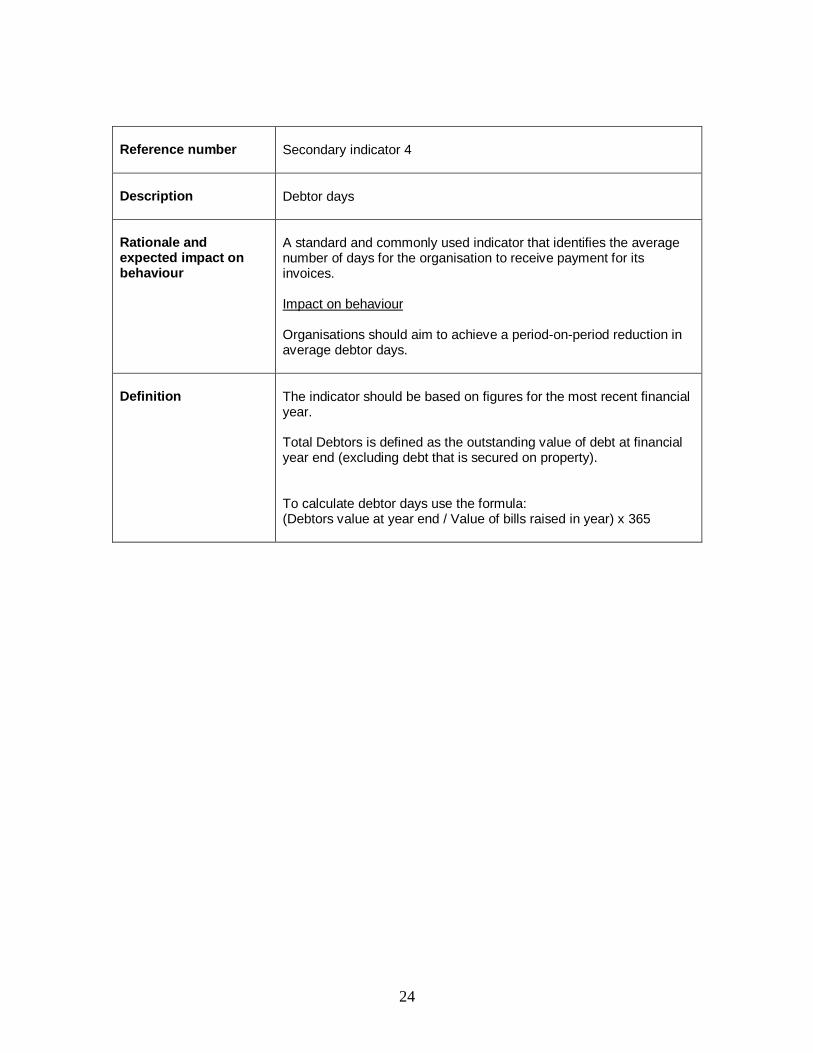
Secondary indicator 4
Description
Debtor days
Rationale and expected impact on behaviour
A standard and commonly used indicator that identifies the average number of days for the organisation to receive payment for its invoices. Impact on behaviour Organisations should aim to achieve a period-on-period reduction in average debtor days.
Definition
The indicator should be based on figures for the most recent financial year. Total Debtors is defined as the outstanding value of debt at financial year end (excluding debt that is secured on property). To calculate debtor days use the formula: (Debtors value at year end / Value of bills raised in year) x 365
25
Reference number
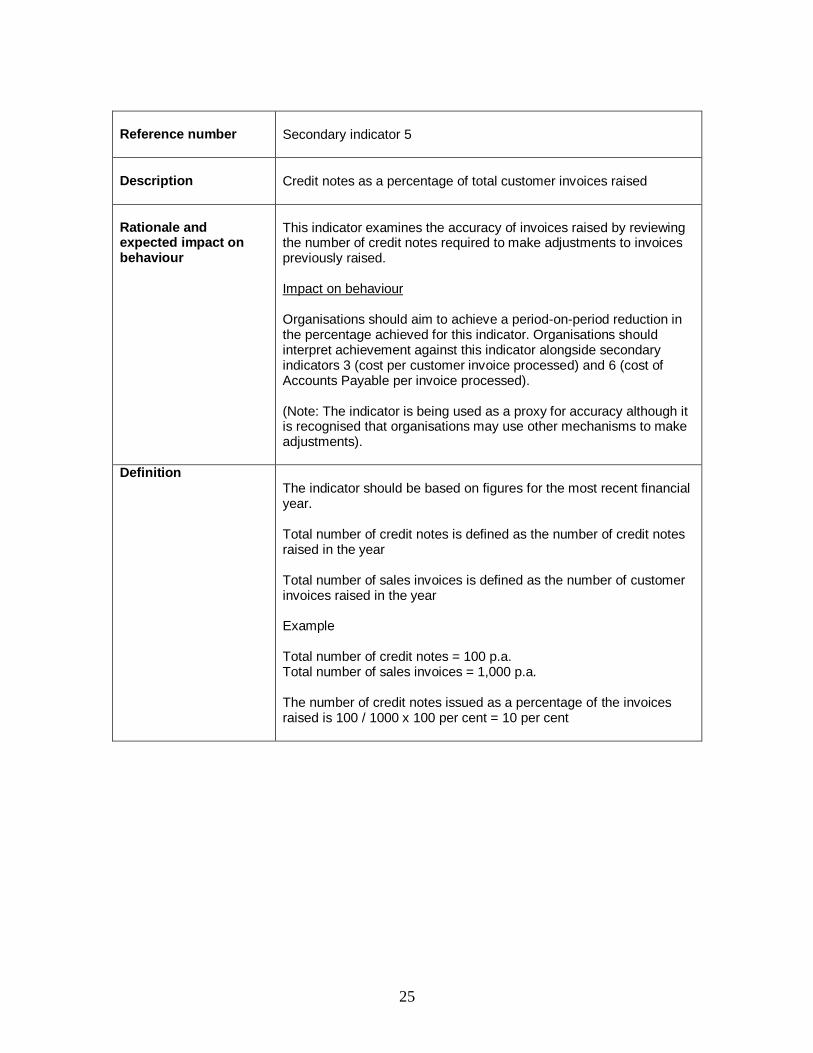
Secondary indicator 5
Description
Credit notes as a percentage of total customer invoices raised
Rationale and expected impact on behaviour
This indicator examines the accuracy of invoices raised by reviewing the number of credit notes required to make adjustments to invoices previously raised. Impact on behaviour Organisations should aim to achieve a period-on-period reduction in the percentage achieved for this indicator. Organisations should interpret achievement against this indicator alongside secondary indicators 3 (cost per customer invoice processed) and 6 (cost of Accounts Payable per invoice processed). (Note: The indicator is being used as a proxy for accuracy although it is recognised that organisations may use other mechanisms to make adjustments).
Definition The indicator should be based on figures for the most recent financial year. Total number of credit notes is defined as the number of credit notes raised in the year Total number of sales invoices is defined as the number of customer invoices raised in the year Example Total number of credit notes = 100 p.a. Total number of sales invoices = 1,000 p.a. The number of credit notes issued as a percentage of the invoices raised is 100 / 1000 x 100 per cent = 10 per cent
26
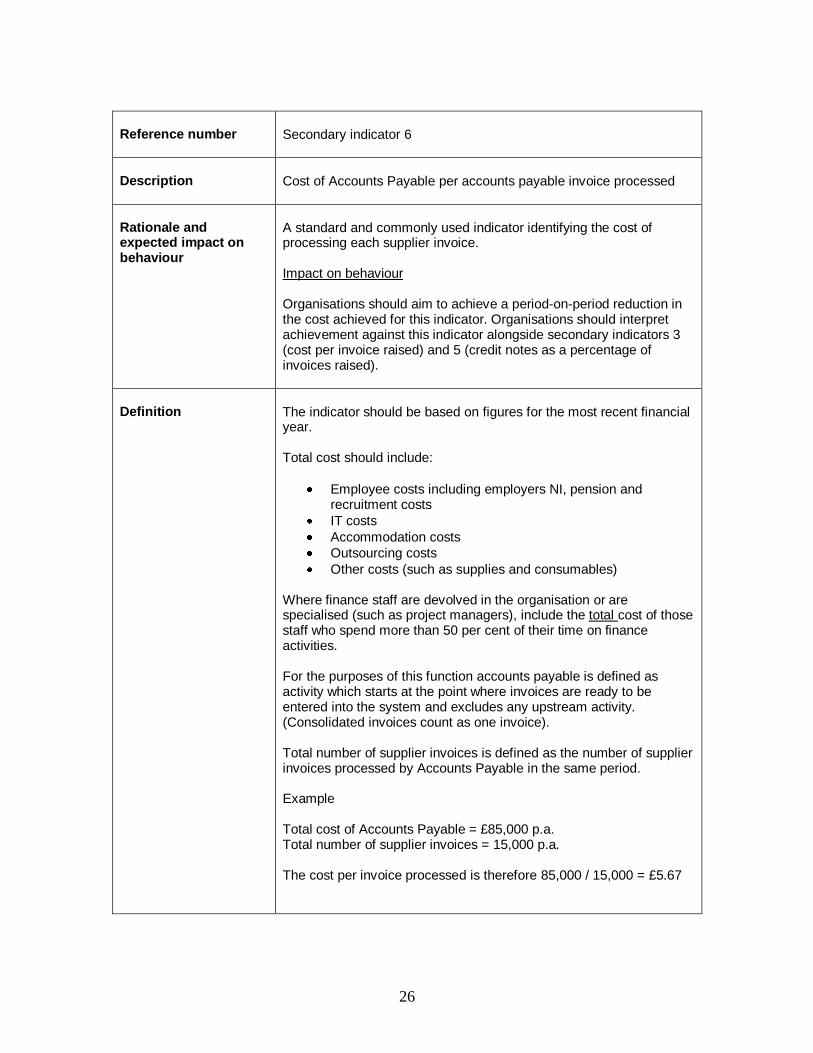
Reference number
Secondary indicator 6
Description
Cost of Accounts Payable per accounts payable invoice processed
Rationale and expected impact on behaviour
A standard and commonly used indicator identifying the cost of processing each supplier invoice. Impact on behaviour Organisations should aim to achieve a period-on-period reduction in the cost achieved for this indicator. Organisations should interpret achievement against this indicator alongside secondary indicators 3 (cost per invoice raised) and 5 (credit notes as a percentage of invoices raised).
Definition
The indicator should be based on figures for the most recent financial year. Total cost should include:
Employee costs including employers NI, pension and recruitment costs
IT costs
Accommodation costs
Outsourcing costs
Other costs (such as supplies and consumables) Where finance staff are devolved in the organisation or are specialised (such as project managers), include the total cost of those staff who spend more than 50 per cent of their time on finance activities. For the purposes of this function accounts payable is defined as activity which starts at the point where invoices are ready to be entered into the system and excludes any upstream activity. (Consolidated invoices count as one invoice). Total number of supplier invoices is defined as the number of supplier invoices processed by Accounts Payable in the same period. Example Total cost of Accounts Payable = £85,000 p.a. Total number of supplier invoices = 15,000 p.a. The cost per invoice processed is therefore 85,000 / 15,000 = £5.67
27
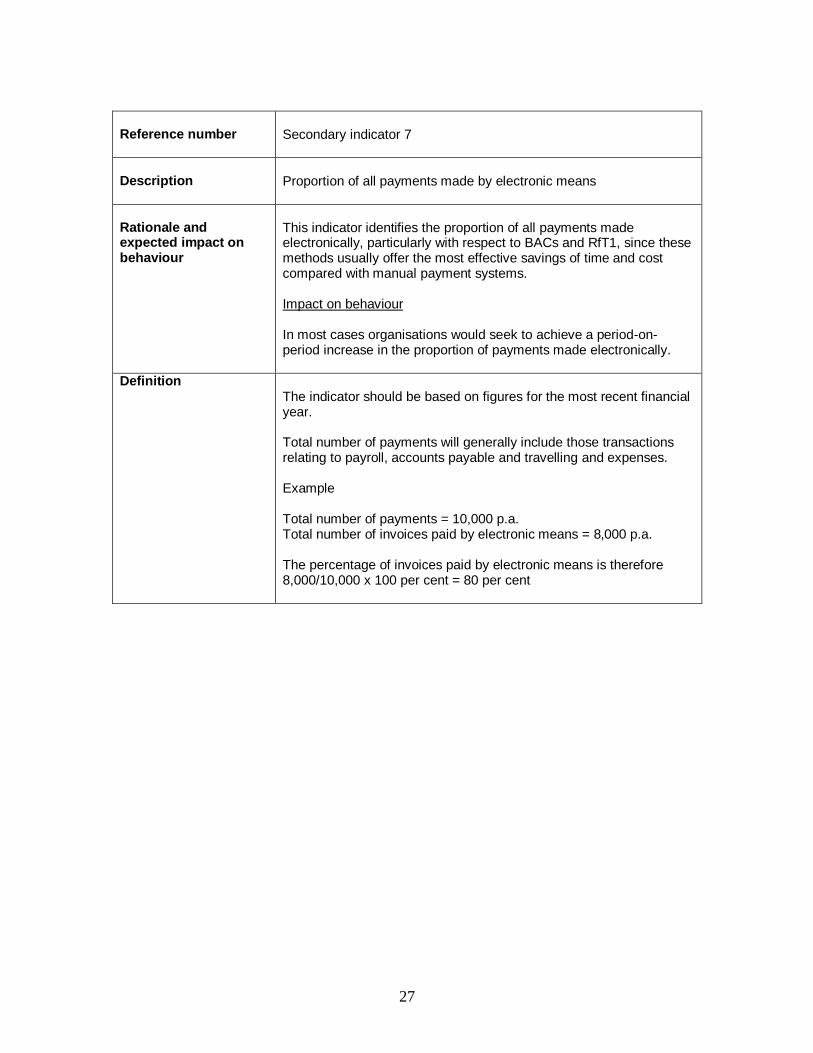
Reference number
Secondary indicator 7
Description
Proportion of all payments made by electronic means
Rationale and expected impact on behaviour
This indicator identifies the proportion of all payments made electronically, particularly with respect to BACs and RfT1, since these methods usually offer the most effective savings of time and cost compared with manual payment systems. Impact on behaviour In most cases organisations would seek to achieve a period-on-period increase in the proportion of payments made electronically.
Definition The indicator should be based on figures for the most recent financial year. Total number of payments will generally include those transactions relating to payroll, accounts payable and travelling and expenses. Example Total number of payments = 10,000 p.a. Total number of invoices paid by electronic means = 8,000 p.a. The percentage of invoices paid by electronic means is therefore 8,000/10,000 x 100 per cent = 80 per cent
28
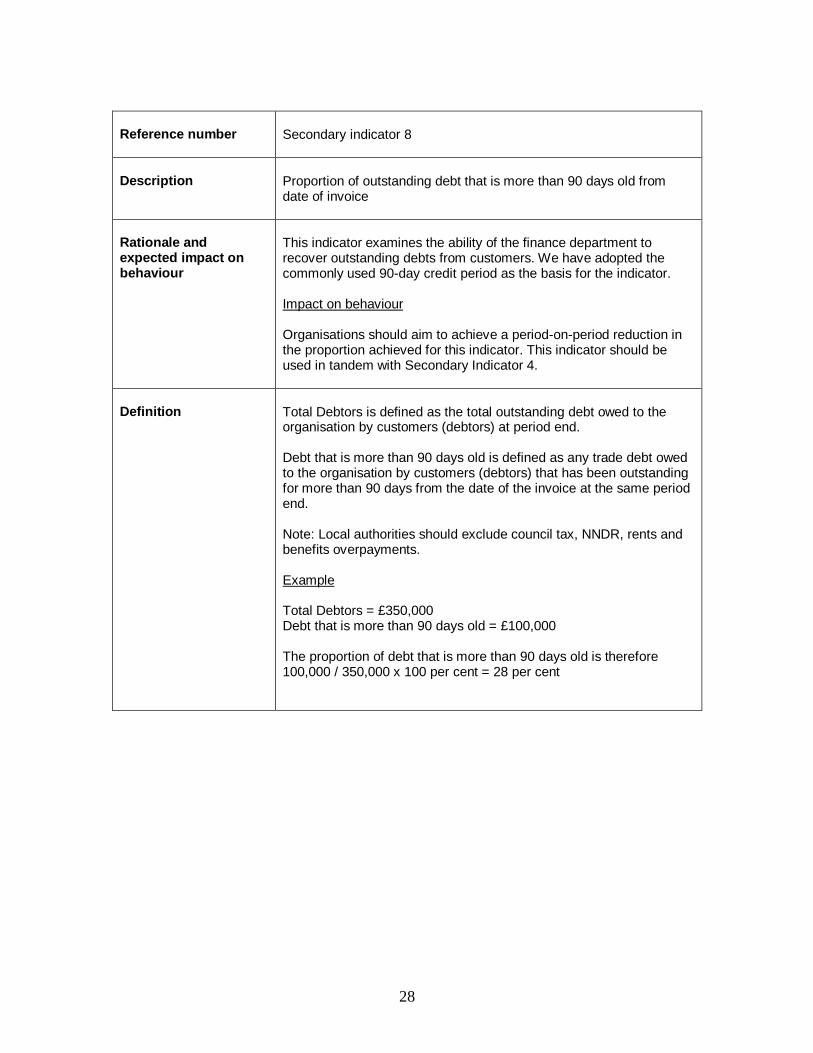
Reference number
Secondary indicator 8
Description
Proportion of outstanding debt that is more than 90 days old from date of invoice
Rationale and expected impact on behaviour
This indicator examines the ability of the finance department to recover outstanding debts from customers. We have adopted the commonly used 90-day credit period as the basis for the indicator. Impact on behaviour Organisations should aim to achieve a period-on-period reduction in the proportion achieved for this indicator. This indicator should be used in tandem with Secondary Indicator 4.
Definition
Total Debtors is defined as the total outstanding debt owed to the organisation by customers (debtors) at period end. Debt that is more than 90 days old is defined as any trade debt owed to the organisation by customers (debtors) that has been outstanding for more than 90 days from the date of the invoice at the same period end. Note: Local authorities should exclude council tax, NNDR, rents and benefits overpayments. Example Total Debtors = £350,000 Debt that is more than 90 days old = £100,000 The proportion of debt that is more than 90 days old is therefore 100,000 / 350,000 x 100 per cent = 28 per cent
29
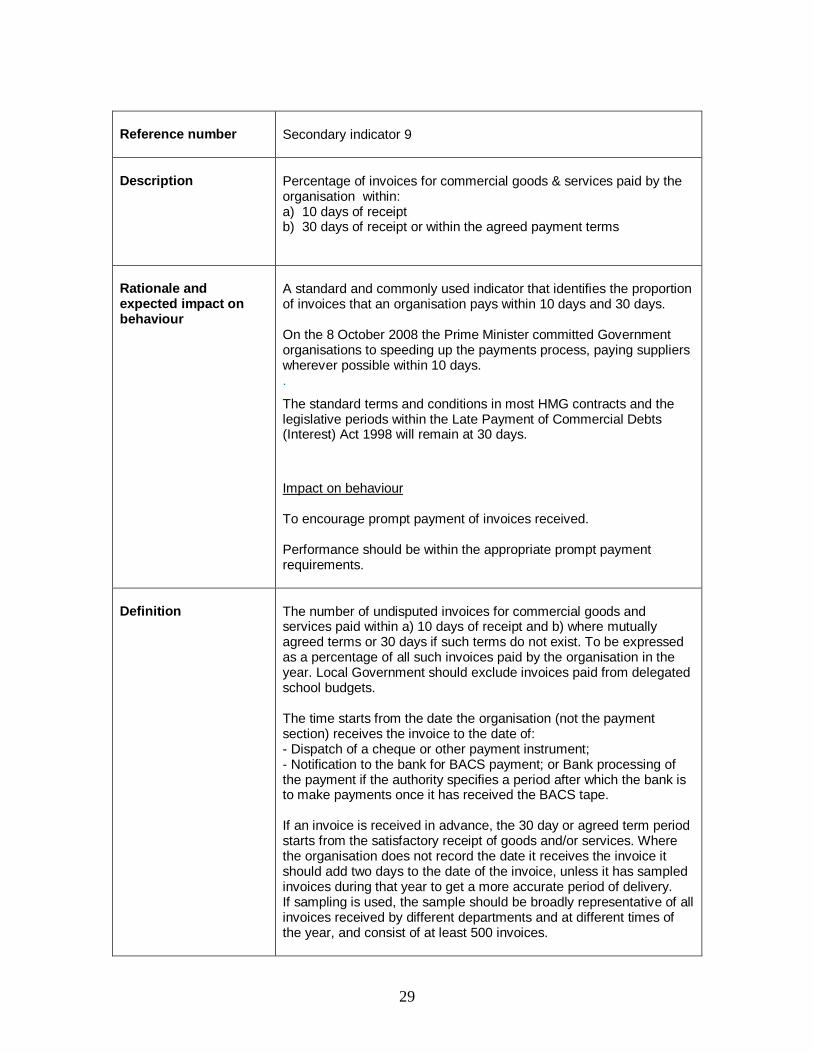
Reference number
Secondary indicator 9
Description
Percentage of invoices for commercial goods & services paid by the organisation within: a) 10 days of receipt b) 30 days of receipt or within the agreed payment terms
Rationale and expected impact on behaviour
A standard and commonly used indicator that identifies the proportion of invoices that an organisation pays within 10 days and 30 days. On the 8 October 2008 the Prime Minister committed Government organisations to speeding up the payments process, paying suppliers wherever possible within 10 days. .
The standard terms and conditions in most HMG contracts and the legislative periods within the Late Payment of Commercial Debts (Interest) Act 1998 will remain at 30 days.
Impact on behaviour To encourage prompt payment of invoices received. Performance should be within the appropriate prompt payment requirements.
Definition
The number of undisputed invoices for commercial goods and services paid within a) 10 days of receipt and b) where mutually agreed terms or 30 days if such terms do not exist. To be expressed as a percentage of all such invoices paid by the organisation in the year. Local Government should exclude invoices paid from delegated school budgets. The time starts from the date the organisation (not the payment section) receives the invoice to the date of: - Dispatch of a cheque or other payment instrument; - Notification to the bank for BACS payment; or Bank processing of the payment if the authority specifies a period after which the bank is to make payments once it has received the BACS tape. If an invoice is received in advance, the 30 day or agreed term period starts from the satisfactory receipt of goods and/or services. Where the organisation does not record the date it receives the invoice it should add two days to the date of the invoice, unless it has sampled invoices during that year to get a more accurate period of delivery. If sampling is used, the sample should be broadly representative of all invoices received by different departments and at different times of the year, and consist of at least 500 invoices.

30
‗Mutually agreed terms‘ means terms that have been specifically agreed to by the organisation and supplier rather than those a supplier puts on the end of an invoice as a matter of course. If the organisation has agreed terms they take precedence over the thirty-day period. Organisations may include invoices which fall within the scope of VAT (Remembering that zero rated and exempt items still fall within the scope of VAT) and exclude those that should be omitted from box 7 of the VAT return. All direct debit items count as a success and each payment by a procurement card bill counts as an 'invoice' rather than the number of items on the bill. Invoices paid by ALMOs should not be counted in this indicator.
31
Reference number
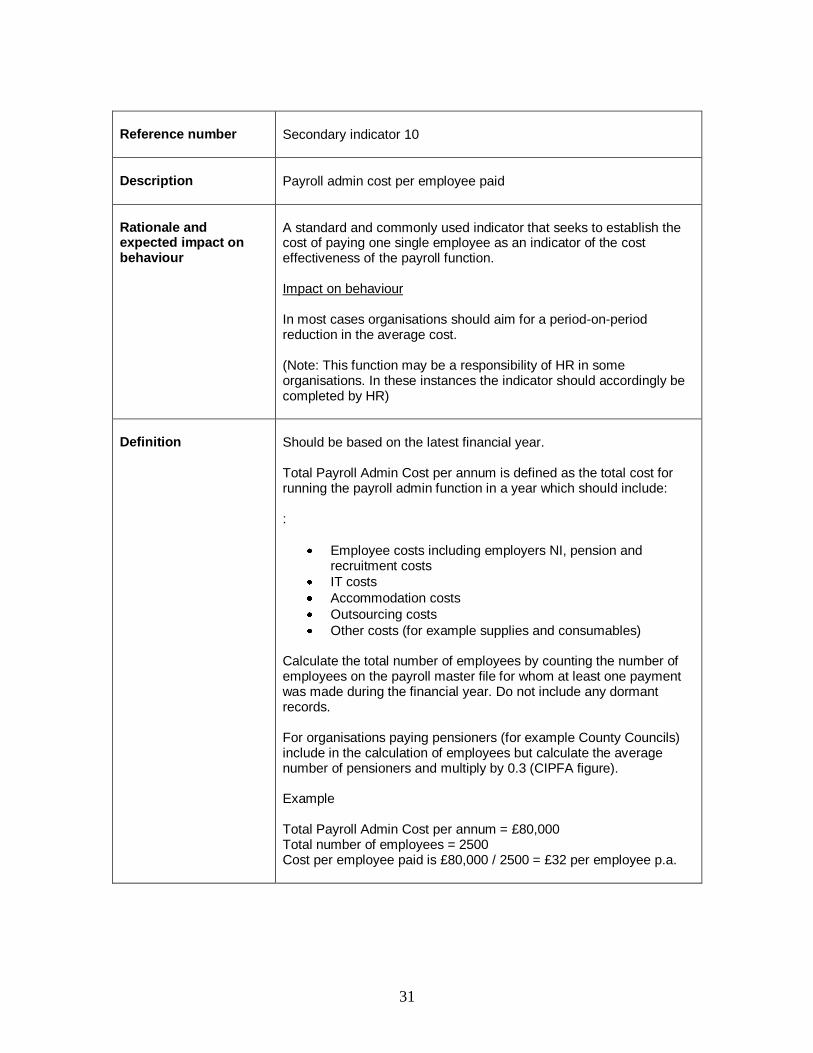
Secondary indicator 10
Description
Payroll admin cost per employee paid
Rationale and expected impact on behaviour
A standard and commonly used indicator that seeks to establish the cost of paying one single employee as an indicator of the cost effectiveness of the payroll function. Impact on behaviour In most cases organisations should aim for a period-on-period reduction in the average cost. (Note: This function may be a responsibility of HR in some organisations. In these instances the indicator should accordingly be completed by HR)
Definition
Should be based on the latest financial year. Total Payroll Admin Cost per annum is defined as the total cost for running the payroll admin function in a year which should include: :
Employee costs including employers NI, pension and recruitment costs
IT costs
Accommodation costs
Outsourcing costs
Other costs (for example supplies and consumables) Calculate the total number of employees by counting the number of employees on the payroll master file for whom at least one payment was made during the financial year. Do not include any dormant records. For organisations paying pensioners (for example County Councils) include in the calculation of employees but calculate the average number of pensioners and multiply by 0.3 (CIPFA figure). Example Total Payroll Admin Cost per annum = £80,000 Total number of employees = 2500 Cost per employee paid is £80,000 / 2500 = £32 per employee p.a.