finance shared services benchmark highlights - … · leveraged apqc’s benchmarking methodology...
TRANSCRIPT
Copyright © 2015 ScottMadden, Inc. All rights reserved. Report _2015
Finance Shared Services Benchmark
Highlights
2015 ScottMadden Finance Shared Services Benchmarking
Study
January 2016
Copyright © 2015 by ScottMadden, Inc. All rights reserved.
About the Survey
Survey Project and Timeline
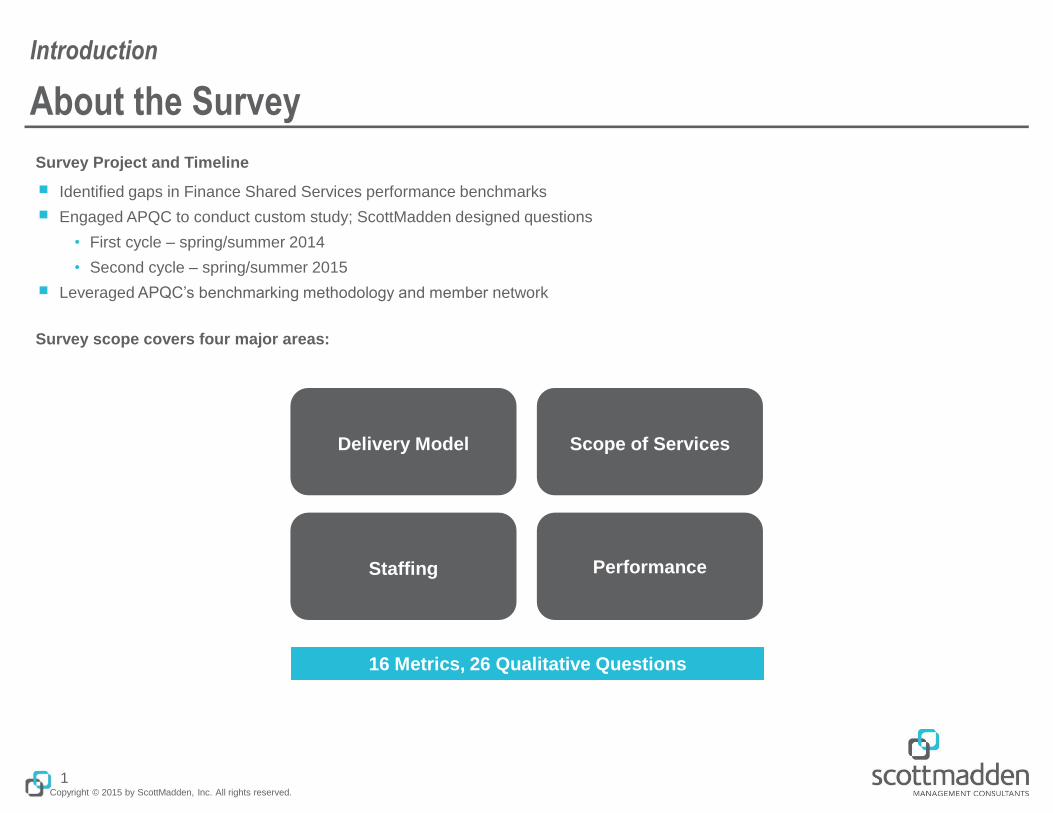
■ Identified gaps in Finance Shared Services performance benchmarks
■ Engaged APQC to conduct custom study; ScottMadden designed questions
• First cycle – spring/summer 2014
• Second cycle – spring/summer 2015
■ Leveraged APQC’s benchmarking methodology and member network
Survey scope covers four major areas:
Introduction
1
Scope of Services
Performance
Delivery Model
Staffing
16 Metrics, 26 Qualitative Questions
Copyright © 2015 by ScottMadden, Inc. All rights reserved.
Participant Demographics
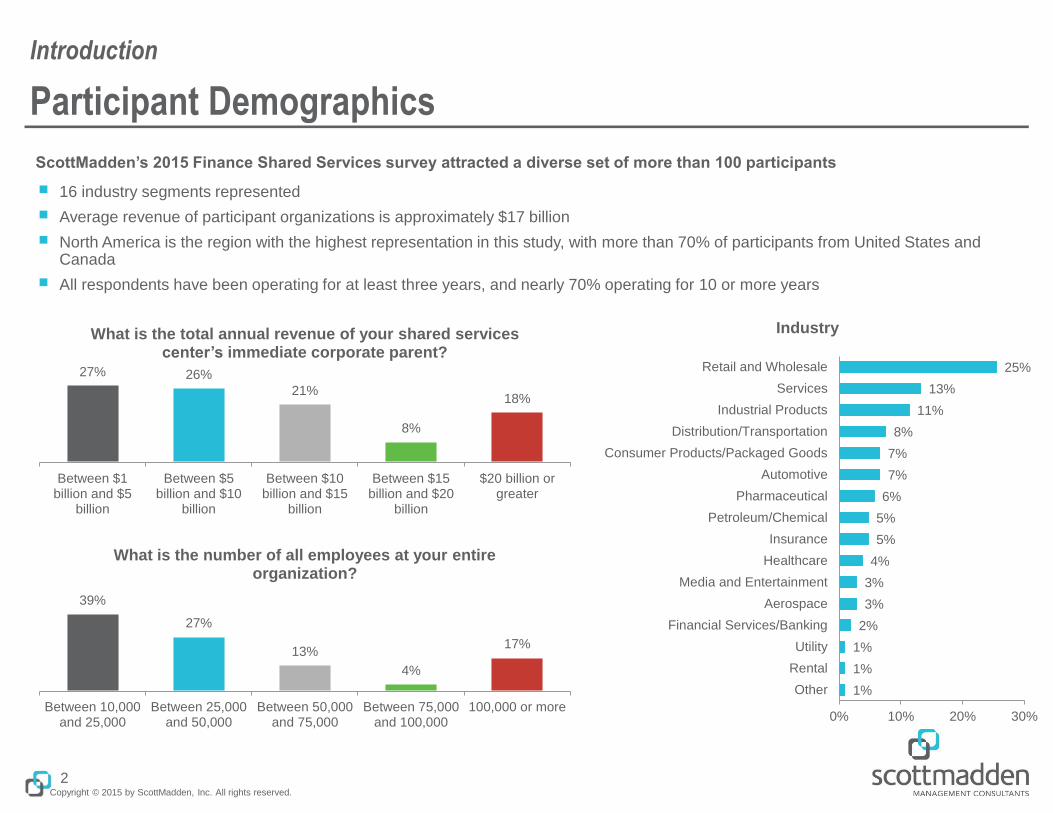
ScottMadden’s 2015 Finance Shared Services survey attracted a diverse set of more than 100 participants
■ 16 industry segments represented
■ Average revenue of participant organizations is approximately $17 billion
■ North America is the region with the highest representation in this study, with more than 70% of participants from United States and Canada
■ All respondents have been operating for at least three years, and nearly 70% operating for 10 or more years
Introduction
2
1%
1%
1%
2%
3%
3%
4%
5%
5%
6%
7%
7%
8%
11%
13%
25%
0% 10% 20% 30%
Other
Rental
Utility
Financial Services/Banking
Aerospace
Media and Entertainment
Healthcare
Insurance
Petroleum/Chemical
Pharmaceutical
Automotive
Consumer Products/Packaged Goods
Distribution/Transportation
Industrial Products
Services
Retail and Wholesale
Industry
27% 26%
21%
8%
18%
Between $1billion and $5
billion
Between $5billion and $10
billion
Between $10billion and $15
billion
Between $15billion and $20
billion
$20 billion orgreater
What is the total annual revenue of your shared services center’s immediate corporate parent?
39%
27%
13%
4%
17%
Between 10,000and 25,000
Between 25,000and 50,000
Between 50,000and 75,000
Between 75,000and 100,000
100,000 or more
What is the number of all employees at your entire organization?
Copyright © 2015 by ScottMadden, Inc. All rights reserved.
Multi-Center, Multi-Country Models are Common
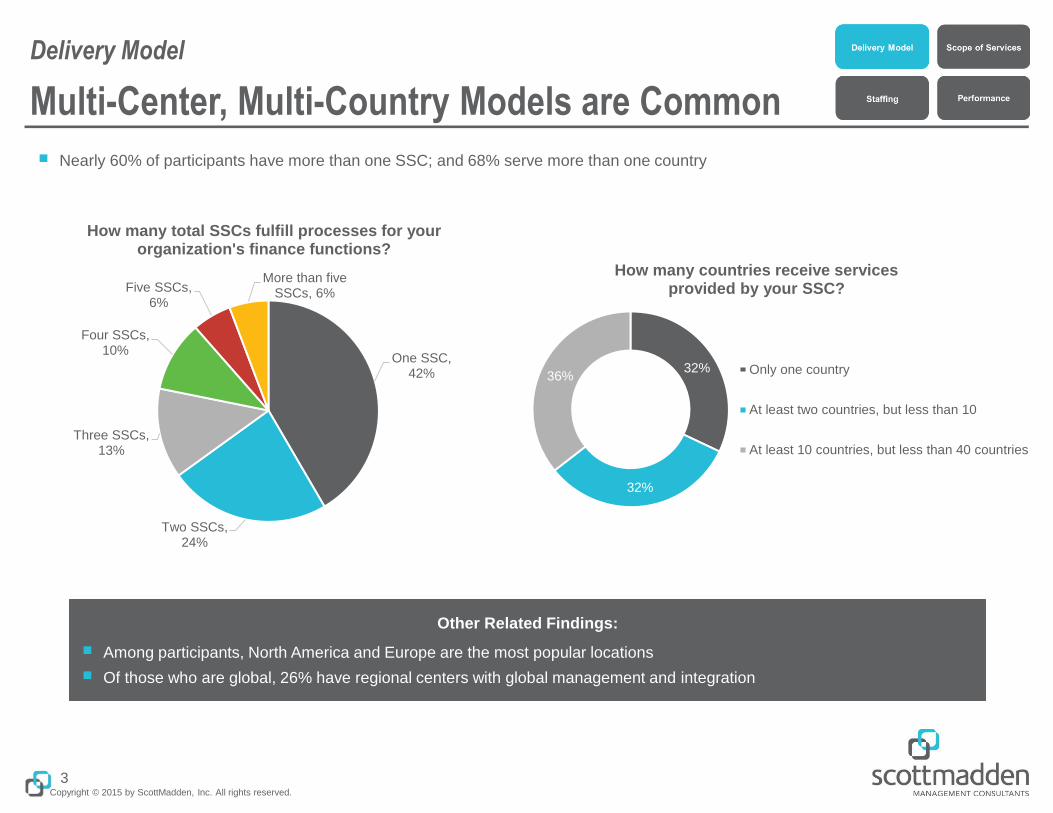
■ Nearly 60% of participants have more than one SSC; and 68% serve more than one country
Delivery Model
3
One SSC, 42%
Two SSCs, 24%
Three SSCs, 13%
Four SSCs, 10%
Five SSCs, 6%
More than five SSCs, 6%
How many total SSCs fulfill processes for your organization's finance functions?
32%
32%
36%
How many countries receive services provided by your SSC?
Only one country
At least two countries, but less than 10
At least 10 countries, but less than 40 countries
Other Related Findings:
■ Among participants, North America and Europe are the most popular locations
■ Of those who are global, 26% have regional centers with global management and integration
Copyright © 2015 by ScottMadden, Inc. All rights reserved.
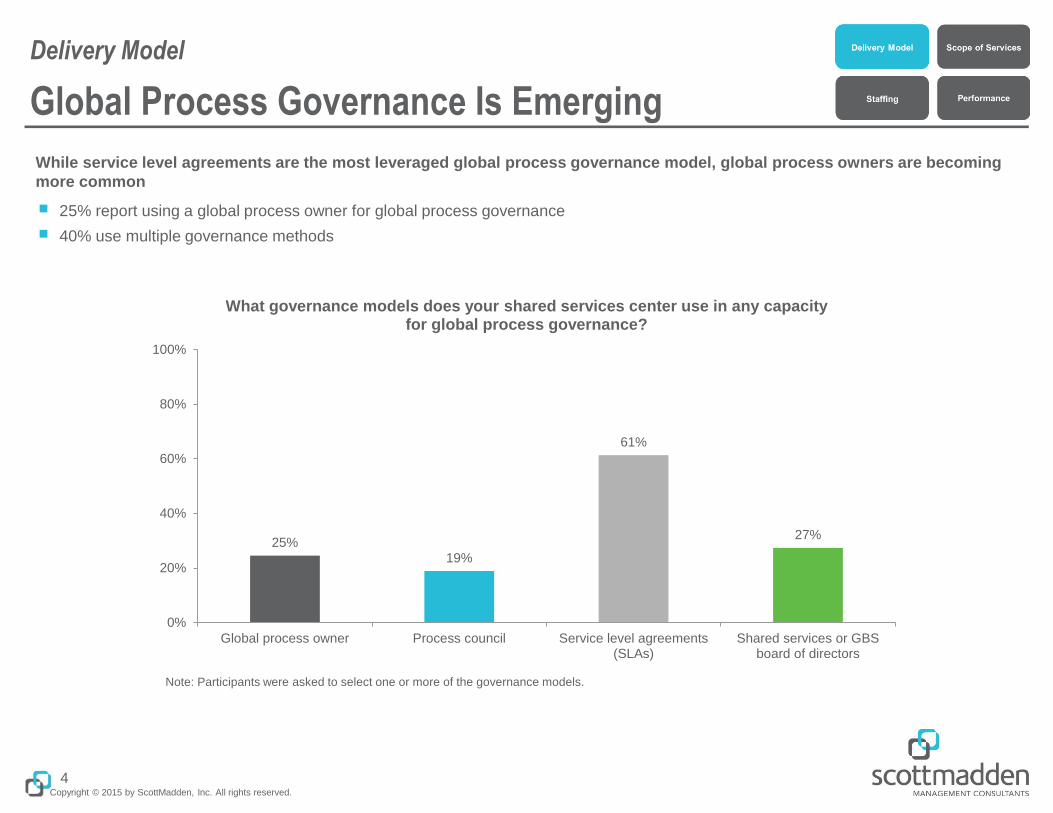
Global Process Governance Is Emerging
While service level agreements are the most leveraged global process governance model, global process owners are becoming
more common
■ 25% report using a global process owner for global process governance
■ 40% use multiple governance methods
Delivery Model
4
25% 19%
61%
27%
0%
20%
40%
60%
80%
100%
Global process owner Process council Service level agreements(SLAs)
Shared services or GBSboard of directors
What governance models does your shared services center use in any capacity for global process governance?
Note: Participants were asked to select one or more of the governance models.
Copyright © 2015 by ScottMadden, Inc. All rights reserved.
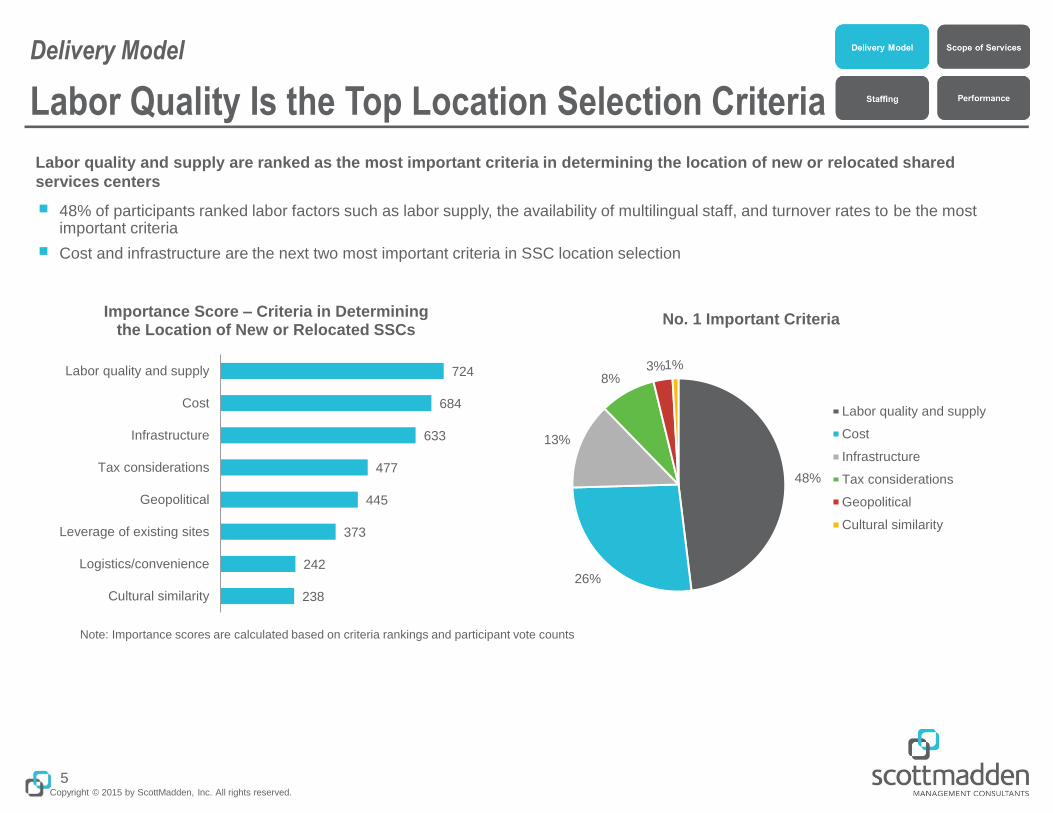
Labor quality and supply are ranked as the most important criteria in determining the location of new or relocated shared
services centers
■ 48% of participants ranked labor factors such as labor supply, the availability of multilingual staff, and turnover rates to be the most important criteria
■ Cost and infrastructure are the next two most important criteria in SSC location selection
Labor Quality Is the Top Location Selection Criteria
Delivery Model
5
Note: Importance scores are calculated based on criteria rankings and participant vote counts
238
242
373
445
477
633
684
724
Cultural similarity
Logistics/convenience
Leverage of existing sites
Geopolitical
Tax considerations
Infrastructure
Cost
Labor quality and supply
Importance Score – Criteria in Determining the Location of New or Relocated SSCs
48%
26%
13%
8% 3% 1%
No. 1 Important Criteria
Labor quality and supply
Cost
Infrastructure
Tax considerations
Geopolitical
Cultural similarity
Copyright © 2015 by ScottMadden, Inc. All rights reserved.
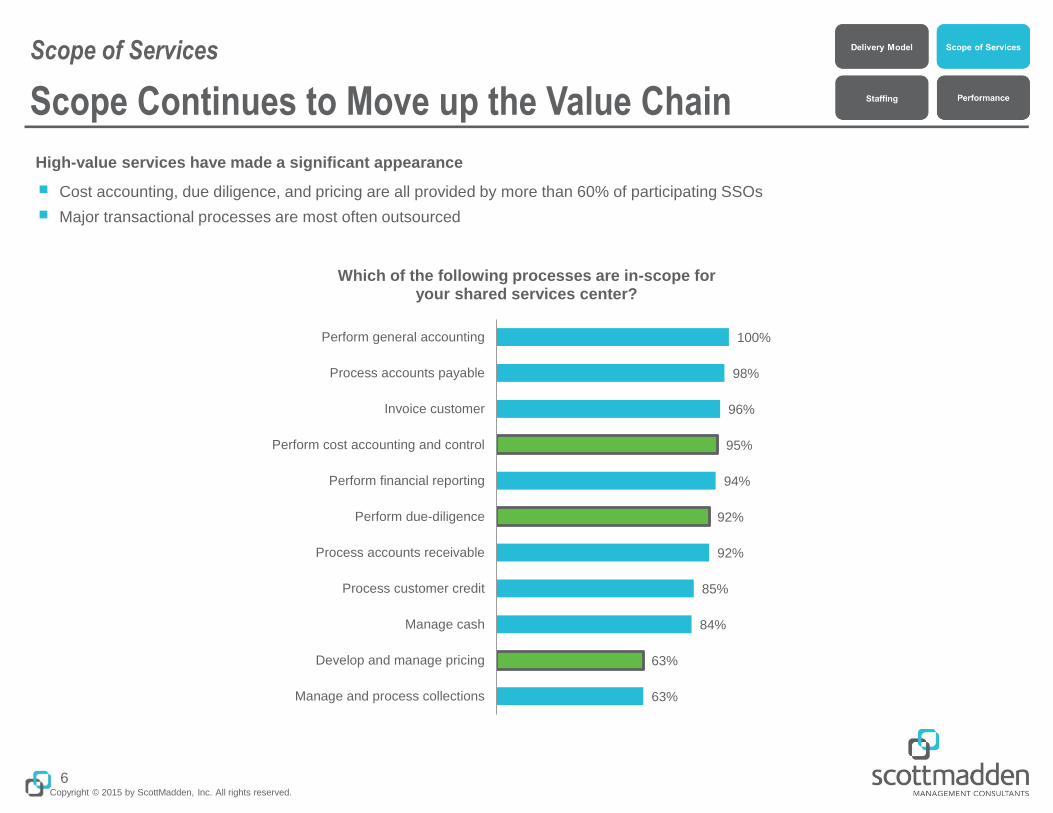
63%
63%
84%
85%
92%
92%
94%
95%
96%
98%
100%
Manage and process collections
Develop and manage pricing
Manage cash
Process customer credit
Process accounts receivable
Perform due-diligence
Perform financial reporting
Perform cost accounting and control
Invoice customer
Process accounts payable
Perform general accounting
Which of the following processes are in-scope for your shared services center?
Scope Continues to Move up the Value Chain
High-value services have made a significant appearance
■ Cost accounting, due diligence, and pricing are all provided by more than 60% of participating SSOs
■ Major transactional processes are most often outsourced
Scope of Services
6
Copyright © 2015 by ScottMadden, Inc. All rights reserved.
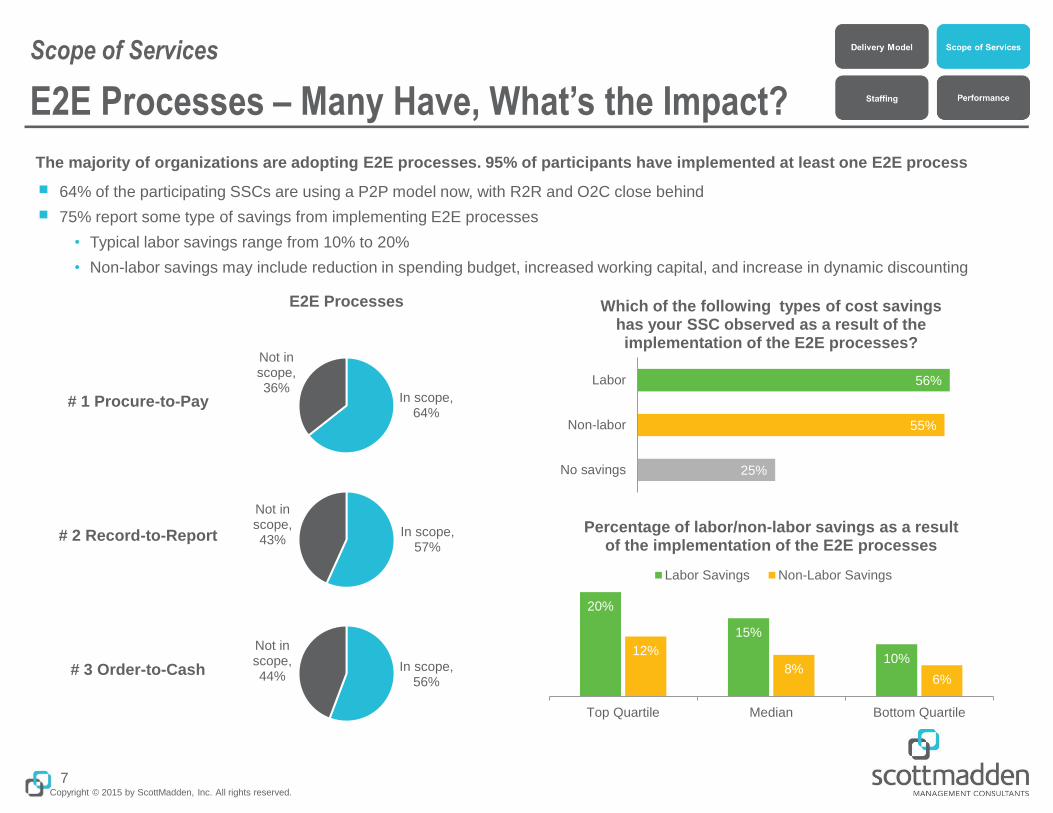
E2E Processes – Many Have, What’s the Impact?
The majority of organizations are adopting E2E processes. 95% of participants have implemented at least one E2E process
■ 64% of the participating SSCs are using a P2P model now, with R2R and O2C close behind
■ 75% report some type of savings from implementing E2E processes
• Typical labor savings range from 10% to 20%
• Non-labor savings may include reduction in spending budget, increased working capital, and increase in dynamic discounting
Scope of Services
7
In scope, 64%
Not in scope, 36%
In scope, 57%
Not in scope, 43%
In scope, 56%
Not in scope, 44%
# 1 Procure-to-Pay
# 2 Record-to-Report
# 3 Order-to-Cash
E2E Processes
25%
55%
56%
No savings
Non-labor
Labor
Which of the following types of cost savings has your SSC observed as a result of the implementation of the E2E processes?
20%
15%
10% 12%
8% 6%
Top Quartile Median Bottom Quartile
Percentage of labor/non-labor savings as a result of the implementation of the E2E processes
Labor Savings Non-Labor Savings
Copyright © 2015 by ScottMadden, Inc. All rights reserved.
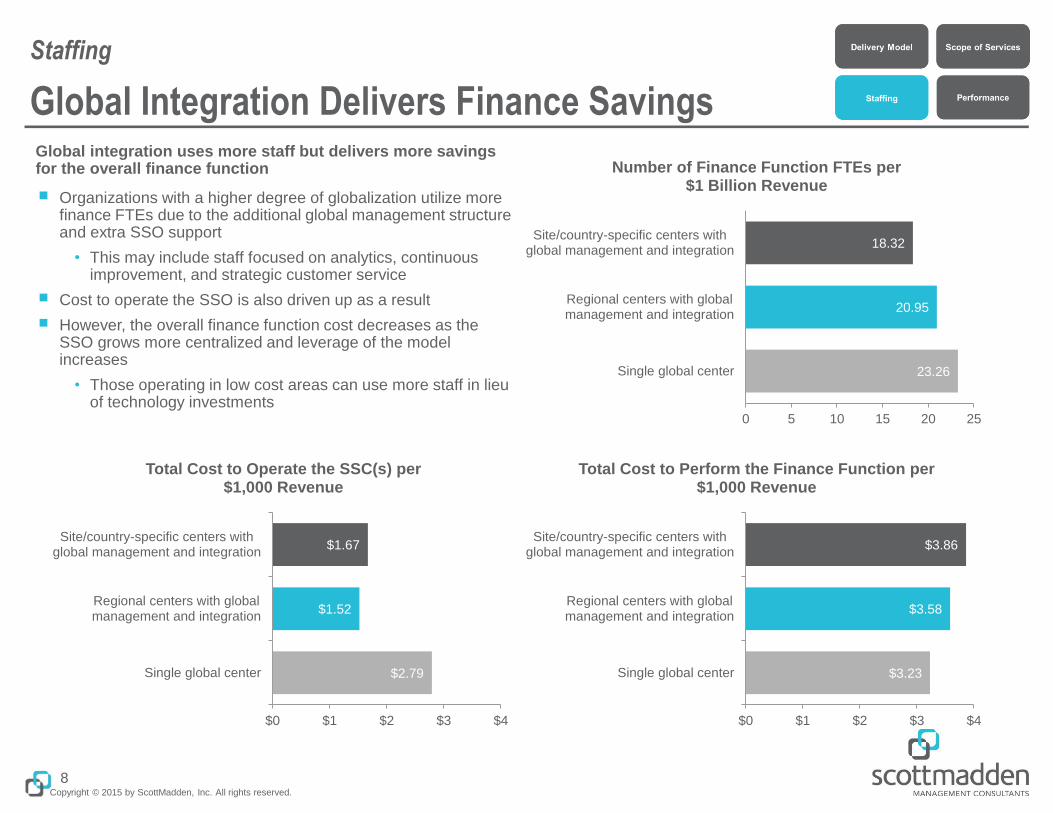
Global Integration Delivers Finance Savings Global integration uses more staff but delivers more savings for the overall finance function
■ Organizations with a higher degree of globalization utilize more finance FTEs due to the additional global management structure and extra SSO support
• This may include staff focused on analytics, continuous improvement, and strategic customer service
■ Cost to operate the SSO is also driven up as a result
■ However, the overall finance function cost decreases as the SSO grows more centralized and leverage of the model increases
• Those operating in low cost areas can use more staff in lieu of technology investments
Staffing
8
18.32
20.95
23.26
0 5 10 15 20 25
Site/country-specific centers withglobal management and integration
Regional centers with globalmanagement and integration
Single global center
Number of Finance Function FTEs per $1 Billion Revenue
$1.67
$1.52
$2.79
$0 $1 $2 $3 $4
Site/country-specific centers withglobal management and integration
Regional centers with globalmanagement and integration
Single global center
Total Cost to Operate the SSC(s) per $1,000 Revenue
$3.86
$3.58
$3.23
$0 $1 $2 $3 $4
Site/country-specific centers withglobal management and integration
Regional centers with globalmanagement and integration
Single global center
Total Cost to Perform the Finance Function per $1,000 Revenue
Copyright © 2015 by ScottMadden, Inc. All rights reserved.
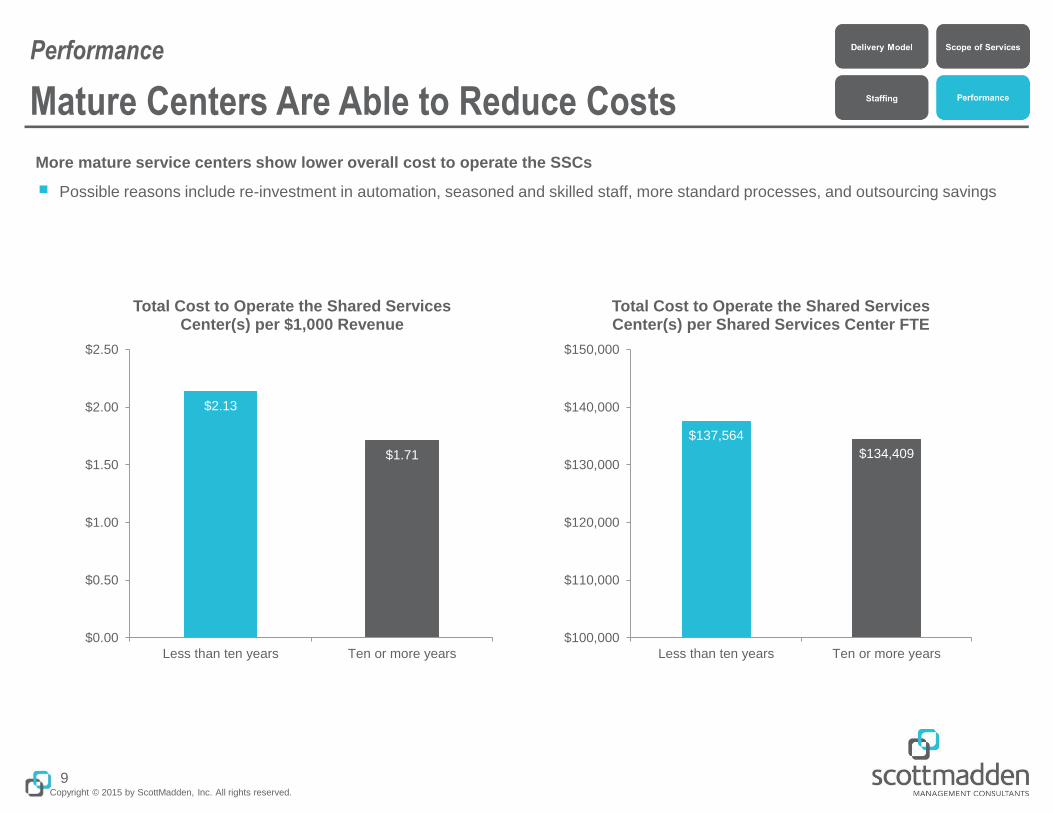
Mature Centers Are Able to Reduce Costs
More mature service centers show lower overall cost to operate the SSCs
■ Possible reasons include re-investment in automation, seasoned and skilled staff, more standard processes, and outsourcing savings
Performance
9
$2.13
$1.71
$0.00
$0.50
$1.00
$1.50
$2.00
$2.50
Less than ten years Ten or more years
Total Cost to Operate the Shared Services Center(s) per $1,000 Revenue
$137,564
$134,409
$100,000
$110,000
$120,000
$130,000
$140,000
$150,000
Less than ten years Ten or more years
Total Cost to Operate the Shared Services Center(s) per Shared Services Center FTE
Copyright © 2015 by ScottMadden, Inc. All rights reserved.
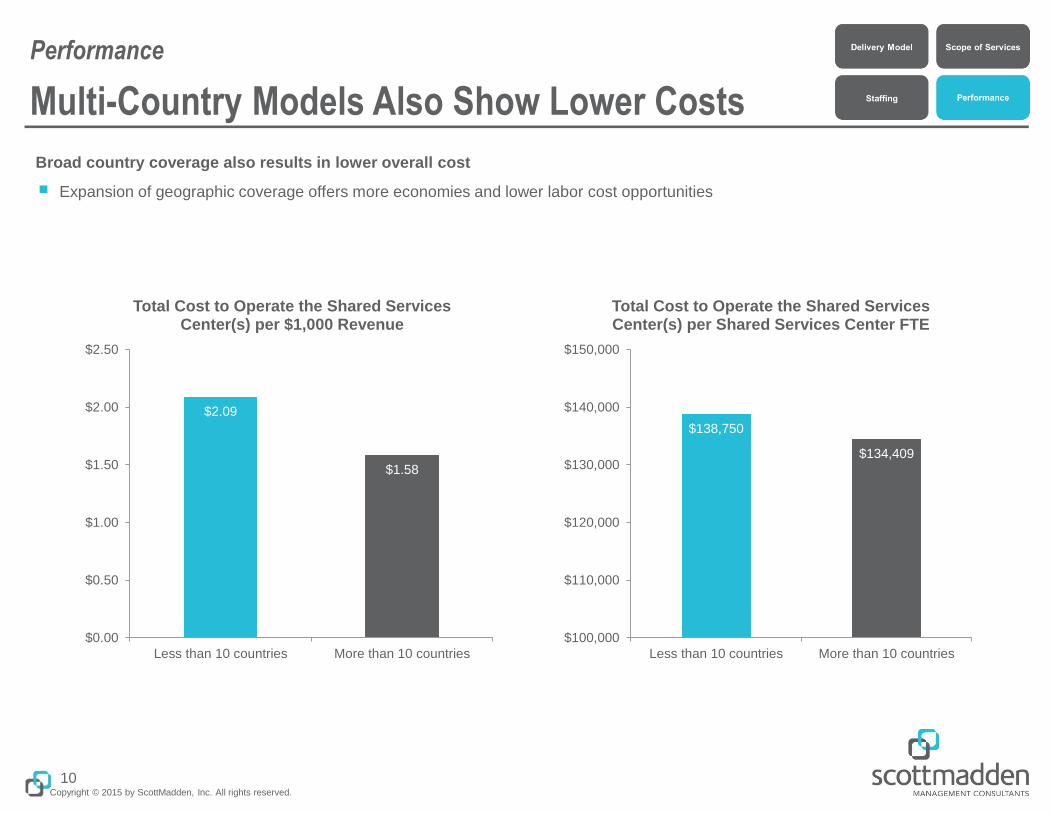
Multi-Country Models Also Show Lower Costs
Broad country coverage also results in lower overall cost
■ Expansion of geographic coverage offers more economies and lower labor cost opportunities
Performance
10
$2.09
$1.58
$0.00
$0.50
$1.00
$1.50
$2.00
$2.50
Less than 10 countries More than 10 countries
Total Cost to Operate the Shared Services Center(s) per $1,000 Revenue
$138,750
$134,409
$100,000
$110,000
$120,000
$130,000
$140,000
$150,000
Less than 10 countries More than 10 countries
Total Cost to Operate the Shared Services Center(s) per Shared Services Center FTE
Copyright © 2015 by ScottMadden, Inc. All rights reserved.
Key Takeaways
■ Global models are prevalent among participating SSOs with 68% providing services to more than one country
• 26% report regional models with global management and integration
■ Transactional finance services remain among the most common in-scope processes for shared services centers; however, there is increasing evidence that many have integrated advanced analytical, consultative, and advisory services in their SSOs
• Newer services such as pricing and due diligence are on the rise
■ E2E process adoption is high with 95% reporting they have implemented at least one E2E process
• 75% of those participants have realized cost savings from the change
• Labor savings for most ranges from 10% to 20%
■ Global process governance is emerging with 40% reporting use of multiple governance approaches
■ However, moving to GBS is not without challenges as half of participants cite regulatory and control issues as the biggest obstacle to overcome when implementing GBS
■ Global integration requires more finance FTEs and higher SSO cost but delivers more savings for the overall finance function
■ Mature centers and those with broad country coverage are able to operate at a lower cost
• Possible explanations include reinvestment in automation, increased standardization of processes, leverage of seasoned staff, and economies of scale gained from expanded geographic coverage and lower labor cost
11
Copyright © 2015 by ScottMadden, Inc. All rights reserved.
Contact Information
12
Trey Robinson
Partner
Finance & Accounting
and GBS
Office: 919-781-4191
Mobile: 919-522-1740
Brad DeMent
Partner
Finance & Accounting and GBS
Practice Lead
Office: 404-814-0020
Mobile: 678-524-2496