financial adviser pocket guide - mentor - mentor education · pdf filetaxationtaxation mentor...
TRANSCRIPT

FinancialAdviserPocket Guide
FinancialAdviserPocket Guide2016 - 20172016 - 2017
Mentor Education 2
Financial Adviser Pocket Guide 2016 - 2017
TaxationTax Rates 3Other Tax Rates 5Tax Offsets 6
SuperannuationContributions 8Taxation of Superannuation 12Superannuation Income Streams 15Employment Termination Payments 18
Social SecurityAge Pension 20Life Tables, Australia, 2010 – 2012 24
Online Resources
3 ..
8 ..
20 ..
27 ..

TaxationTaxation
Mentor Education 3
Financial Adviser Pocket Guide 2016 - 2017
Tax RatesResident personal tax rates (2016/2017)
Taxable Income
$0 – $18,200
$18,201 – $37,000
$37,001 – $80,000
$80,001 – $180,000
$180,001 & over
Nil
19c for each $1 over $18,200
$ 3,572 plus 32.5c for each $1 over $ 37,000
$17,547 plus 37.0c for each $1 over $ 80,000
$54,547 plus 47.0c for each $1 over $180,000
Nil
19.0%
32.5%
37%
47.0%**
*The above rates exclude Medicare levy of 2.0% on taxable income for residents.
**Includes the 2.0% Temporary Budget Repair Levy from 1 July 2014 to 30 June 2017 (for all individuals)
Note: The 2016-17 Federal Budget contains a proposal to raise the 32.5% bracket from $80,000 to $87,000.
Marginal Rate* Tax Payable
Medicare levy (2015/2016)
Single
Couple
Single
Couple
$26,668 & over
$45,002 & over
$42,172 & over
$58,708 & over
$0 – $21,335
$0 – $36,001
$0 – $33,738
$0 – $46,966
*Note: Reduced Medicare levy is 10c (shade in rate) for every dollar over the ‘lower threshold. The full
2.0% is applicable where taxable income is over the ‘upper threshold’ for the reduced Medicare levy.
No levy
$21,336 – $26,667
$36,002 – $45,001
$33,739 – $42,171
$46,967 – $58,707
Reduced levy* Full 2.0%
All other taxpayers other than those eligible for SAPTO (2015/2016)
Eligible for SAPTO (2015/2016)**
Add $3,306 to the ‘lower threshold’ for each dependent child or student.
Add $44,133 to the upper threshold for each dependent child or student.

Mentor Education 4
Financial Adviser Pocket Guide 2016 - 2017
Non-resident personal tax rates (2016/2017)
Taxable Income
$0 – $80,000
$80,001 – $180,000
$180,001 & over
32.5c for each $1
$26,000 plus 37.0c for each $1 over $ 80,000
$63,000 plus 47.0c for each $1 over $180,000
32.5%
37.0%
47.0%**
*Medicare levy does not apply to non-residents.
**Includes the 2.0% Temporary Budget Repair Levy from 1 July 2014 to 30 June 2017 (for all individuals).
Marginal Rate* Tax Payable
Tax rate for Minors – unearned income (2016/2017 )
Eligible Income
$0 – $416
$417 – $1,307
$1,307 & over
Nil
66.0%** of each $1 over $416
47.0%** of the entire income
Note: ‘Earned income’ is taxed at adult marginal rates. LITO is not available for ‘unearned income’ of
minors.
**Includes the 2.0% Temporary Budget Repair Levy from 1 July 2014 to 30 June 2017.
Marginal rate
Medicare levy surcharge (2016/2017)
Tier 1
Tier 2
Tier 3
1.00%
1.25%
1.50%
$ 90,001 – $105,000
$105,001 – $140,000
$140,001 & over
*Note: *The threshold includes taxable income, reportable fringe benefits, reportable super contribu-
tions and total net investment loss, and is increased by $1,500 per child after the first. Single parents and
couples (including de facto couples) are subject to family tiers. Medicare levy surcharge only applies if not
covered by private health insurance. The annual indexation of the Medicare levy surcharger income
levels is frozen for three years from 2015/16 to 30 June 2018.
Single
$180,001 – $210,000
$210,001 – $280,000
$280,001 & over
Family Surcharge

Other Tax Rates
$0 – $416
Superannuation fund:
Complying
Non-complying
Insurance and Friendly Society Bonds
30%
15%
47%**
30%
**Includes the 2.0% Temporary Budget Repair Levy from 1 July 2014 to 30 June 2017.
Tax Rate
Fringe benefit tax rate (1 April 2016 to 31 March 2017)
Mentor Education 5
Financial Adviser Pocket Guide 2016 - 2017
After 30/06/2000 which have been eligible
to an input tax credit under GST regime
FBT rate is 49.0%** and calculated on the tax-inclusive
value of the fringe benefit provided in the year.
2.1463
Does not attract an input tax credit 1.9608
**includes the 2.0% Medicare Levy and the 2.0% Temporary Budget Repair Levy.
Gross-up rateFringe benefit provided
Capital gains tax
Capital gains tax exempt
For assets held for more than 12 months, taxpayers can choose to either:
Pay capital gains tax on 50% of the difference between the original cost base and the
disposal price) OR
Pay capital gains tax on the difference between the indexed cost base and the disposal
price. The indexed cost base is the original cost base multiply by the frozen CPI index
(68.7) as at September 1999 divide by the CPI index for quarter of acquisition.
For assets held for less than 12 months, capital gains tax is payable on the whole gain.
The assessable capital gain is included in the individual’s taxable income and is taxed at marginal tax rate.
Asset bought before 20 September 1985
Asset bought between 20 September 1985 and 20 September 1999

Tax OffsetsTax offsets, previously known as rebates, reduce the tax payable by an individual.
*Reduces by 1.5c for each $1 of taxable income over $37,000. LITO makes the tax free threshold
effectively $20,542, but $21,335 is where no Medicare Levy is applicable.
Low income tax offset (LITO) 2016/2017
Senior and Pensioners tax offset (SAPTO) 2015/2016
Single
Couple (each)
Couple separated due to illness (each)
$50,119
$41,790
$47,599
$2,230
$1,602
$2,040
*The maximum offset reduces by 12.5c for every dollar of rebate income over the shade-out threshold
and erodes entirely at the cut-out threshold. Rebate income includes taxable income, adjusted fringe
benefits, reportable super contributions and total net investment loss.
Max. offset*
$32,279
$28,974
$31,279
Shade-out threshold
Cut-out thresholdLow income aged person
Mentor Education 6
Financial Adviser Pocket Guide 2016 - 2017
For assets held for more than 12 months, taxpayer pay capital gains tax on 50% of the
difference between the cost base and the disposal price. Only the 50% discount applies. No
indexation is available. For assets held for less than 12 months, capital gains tax is payable on
the whole gain.
Assets bought on or after 21 September 1999
Low income earner $66,667$445
Max. Offset*
$37,000
Shade-out threshold Cut-out threshold

*Note: *The threshold includes taxable income, reportable fringe benefits, reportable super contributions
and total net investment loss, and is increased by $1,500 per child after the first. Single parents and
couples (including de facto couples) are subject to family tiers. The annual indexation of the health
insurance rebates income levels is frozen for three years from 2015/16 to 30 June 2018.
The Net Medical Expenses Offset (NMETO) is being phased out over the period 1 July to 30 June
2018. Transitional arrangements allow claims for disability aids, attendant care or age care expens-
es to be made until 30 June 2019.
For singles and couples or families with adjusted taxable income up to and including $90,000 and
$180,000 respectively, an offset is 20% of whatever is left (or ‘the excess’) of net medical expenses
over $2,265 that were paid in a financial year may be claimed. Net medical expenses are the total
amount spent on medical expenses (on behalf of the taxpayer and their dependants) minus any
reimbursement paid by private health insurance or Medicare. There is no upper limit on the
amount that can be claimed.
Note:
Singles and couples or families with adjusted taxable income above the thresholds can only claim
an offset of 10% of net medical expenses over $5,343 (all thresholds are indexed annually).
Private health insurance (PHI) Rebate (2016/2017)
Net medical expenses tax offset NMETO (2015/2016)
Tier 1
Tier 3
$180,000 or less
$180,001 – $210,000
$280,001 & over
Family
26.791%
17.861%
Tier 2 $210,001 – $280,000 8.930%
nil
<65
31.256%
22.326%
13.395%
nil
65-69
35.722%
26.791%
17.861%
nil
70+
Tier 1
Tier 3
$ 90,000 or less
$ 90,001 – $105,000
$140,001 & over
Single
26.791%
17.861%
Tier 2 $105,001 – $140,000 8.930%
nil
<65
31.256%
22.326%
13.395%
nil
65-69
35.722%
26.791%
17.861%
nil
70+
Mentor Education 7
Financial Adviser Pocket Guide 2016 - 2017

Contributions
Concessional contributions are sometimes known as ‘before-tax’ contributions and include:
Contributions made by an employer for an employee, including SG contributions, contributions
made under a salary sacrifice arrangement; and
Personal contributions that are claimed as a tax deduction (where the person is eligible to
claim).
Acceptance of contributions
Concessional Contributions
Mentor Education 8
Financial Adviser Pocket Guide 2016 - 2017
SuperannuationSuperannuation
Age of member
Under age 65
Age 65 to 69
Age 75 & over
Made by or on behalf of member at any time.
Mandated contributions; or
Made by or on behalf of the member provided the
member meets the work test*.
Age 70 to 74 Mandated contributions; or
Made by the member or voluntary employer
contributions (including salary sacrifice) provided the
member meets the work test* and the contributions
are received within 28 days of the end of the month in
which the member reaches age 75.
Mandated contributions under an industrial Award or
workplace agreement.
*Work test – member has been gainfully employed for a minimum of 40 hours
over 30 consecutive days during the financial year in which the contributions
are made.
Fund may accept contributions that are:

Non-concessional contributions are sometimes known as ‘after-tax’ contributions and include:
Personal contributions that an income tax deduction has not been claimed for, such as
contributions made from take-home pay;
Contributions made by a contributing spouse to a receiving spouse’s super fund (but not a
contribution as an employer); and
Transfers from foreign super fund (but are not assessable income to the fund).
Non-Concessional Contributions
Mentor Education 9
Financial Adviser Pocket Guide 2016 - 2017
Contributions Cap (2016/2017)
Excess Concessional Contributions
Contribution
Concessional contribution < age 49
Concessional contribution > age 49
Non-concessional contribution - No
work test if < age 65 and no ‘bring
forward if > age 65.
See full explanation below**
See full explanation below**
See full explanation below**
$ 30,000 pa
$ 35,000 pa
$180,000 pa
$540,000 (3 year limit)
**Excess concessional contributions also count towards the non-concessional contributions cap.
Note: Contributions made by employers or the self-employed are fully tax deductible up to age 75.
Individuals who exceed their concessional contributions cap will have the excess amount included in
their assessable income, and taxed at their marginal tax rate. They will also have to pay the excess
concessional contributions (ECC) charge on the increase in tax liability. This charge is applied to recognise
that the tax on excess concessional contributions is collected later than normal income tax. To reduce
the tax liability, the ATO will apply a 15 tax offset to account for the contributions tax that has already
been paid by the super fund. The individual may elect to withdraw up to 85% of the excess concessional
contributions from their super fund to help pay their income tax assessment. Any excess concessional
contributions withdrawn from their fund will not count towards their non-concessional contributions
cap.
Example: - Excess Concessional Contributions
During 2014-15, Mary (age 45) salary sacrificed to super, her total concessional contributions were
$40,000. Because Mary’s concessional cap was $30,000, her excess concessional contributions was
$10,000. Mary has taxable income of $70,000. The ATO includes the $10,000 and increases Mary’s taxable
income to $80,000. She will be assessed at her effective marginal tax rate of 34.5% (including 2.0%
Medicare levy).
Cap Excess Contribution Tax (ECT)
The additional tax payable as a result of the excess concessional contributions is $3,450. Mary is entitled
to a tax offset equal to 15% of her excess concessional contributions, decreasing her tax liability by
$1,500. With the inclusion of the excess concessional contributions (ECC), Mary’s tax liability has
increased by $1,950 ($3,450 - $1,500), and the ECC charge will be applied to this amount.
The daily ECC charge rate is based on the monthly average yield of 90-day Bank Accepted Bills plus an
uplift factor of 3%. For January to March 2015 it was 5.75% and for April to June 2015 it is 5.36%. The ECC
charge period is calculated from the start of the income year in which the ECC were made and ends the
day before the tax is due to be paid under the first income tax assessment for the year that includes the
ECC.

Excess Non-Concessional Contributions
Excess non-concessional contributions tax of 47% (including Medicare levy) is payable on excess
non-concessional contributions.
Contributions Tax
The regular contributions tax on concessional contributions is a flat rate of 15%, but for individuals with
incomes over $300,000 (including concessional contributions) some or all of their concessional
contributions may be taxed 30%. The extra 15% tax is known as the ‘Division 293 tax’. If an individual has
an income of $280,000 and concessional contributions of $25,000, the total of the two amounts comes to
$305,000. The amount over $300,000 is $5,000, which means $5,000 of the concessional contributions
will be taxed at 30% and $20,000 of the concessional contribution will be taxed of 15%. However, if the
individual’s income is over $300,000 (without concessional contributions), all of the concessional
contributions will be taxed at 30%.
Example: - Excess Concessional Contributions
During 2014-15, Mary (age 45) salary sacrificed to super, her total concessional contributions were
$40,000. Because Mary’s concessional cap was $30,000, her excess concessional contributions was
$10,000. Mary has taxable income of $70,000. The ATO includes the $10,000 and increases Mary’s taxable
income to $80,000. She will be assessed at her effective marginal tax rate of 34.5% (including 2.0%
Medicare levy).
Mentor Education 10
Financial Adviser Pocket Guide 2016 - 2017
The additional tax payable as a result of the excess concessional contributions is $3,450. Mary is entitled
to a tax offset equal to 15% of her excess concessional contributions, decreasing her tax liability by
$1,500. With the inclusion of the excess concessional contributions (ECC), Mary’s tax liability has
increased by $1,950 ($3,450 - $1,500), and the ECC charge will be applied to this amount.
The daily ECC charge rate is based on the monthly average yield of 90-day Bank Accepted Bills plus an
uplift factor of 3%. For January to March 2015 it was 5.75% and for April to June 2015 it is 5.36%. The ECC
charge period is calculated from the start of the income year in which the ECC were made and ends the
day before the tax is due to be paid under the first income tax assessment for the year that includes the
ECC.
The minimum SG contribution rate is 9.5% of an eligible employee’s ordinary time earnings (OTE).
The SG rate will remain at 9.5% until 30 June 2021. The maximum contribution earnings base
requiring SG support in 2016/2017 is $51,620 per quarter (i.e. $206,480 pa., maximum SG of
$19,615.60). The minimum earnings base that requires SG contributions to be paid is $450 per
month.
No SG is payable where:
Earnings of less than $450 a month
Part-time employees under 18 years, working under 30 hours per week
Superannuation Guarantee (SG) Contribution (2015/2016)

Must make a personal super contribution and earn 10% or more of total income from carrying on a
business, eligible employment, or combination of both to be eligible.
Spouse super contribution offset (2016/2017)
Spouse assessable income (SAI)
$0 – $10,800
$10,801 – $13,799
$13,800
MC or actual contribution
MC or actual contribution
Nil
$3,000
$3,000 – (SAI – $A10,800)
Nil
An offset of 18% is available on spouse super contributions up to $3,000. The maximum offset of
$540 is available when the spouse’s total income (assessable income, reportable fringe benefits and
reportable employer super contributions) is $10,800 or less. The offset cuts out at $13,800.
Max. contribution (MC) Max. offset (18% of the lesser of)
Contribution equal to 15% of concessional contribution up to maximum of $500 (minimum
payable is $20)
Paid to superannuation fund or retirement savings account (RSA)
Adjusted taxable income must be less than $37,000
Must earn 10% or more of total income from carrying on a business, employment or
combination of both
The Coalition government has extended it until 2016/2017.
Low income superannuation contribution (LISC) was proposed to be abolished from 1 July 2013
Mentor Education 11
Financial Adviser Pocket Guide 2016 - 2017
Government Co-Contribution (2016/2017)
Adjusted Taxable Income (ATI)
$0 – $36,021
$36,022 – $51,021
$500 (50% of $1,000 non-concessional contribution)
$500 – [(ATI – $36,021) x 0.03333]
$51,021+ Nil
Maximum Government Co-Contribution

Lifetime CGT retirement exemption limit – $500,000.
Must satisfy basic conditions applying to all CGT small business concessions. The amount chosen
to be exempt must not exceed remaining CGT retirement exemption limit and:
If under 55 exempt amount must be contributed into a complying superannuation fund or
retirement savings account (RSA); or
If 55 or over don’t have to pay any amount into a complying superannuation fund or RSA.
Small business CGT retirement exemption
Preservation Age
Date of Birth
Before 1 July 1960
1 July 1960 – 30 June 1961
55
56
1 July 1961 – 30 June 1962 57
On or after 1 July 1964 60
1 July 1962 – 30 June 1963 58
1 July 1963 – 30 June 1964 59
Preservation Age
Not required to make contributions.
Contributions which are made can be claimed as a tax deduction where less than 10% of
assessable income (which includes reportable fringe benefits plus reportable super contribu-
tions and net investment loss) is received from employment as an employee (i.e., eligible
employment).
Self Employed
Mentor Education 12
Financial Adviser Pocket Guide 2016 - 2017
Taxation of Superannuation
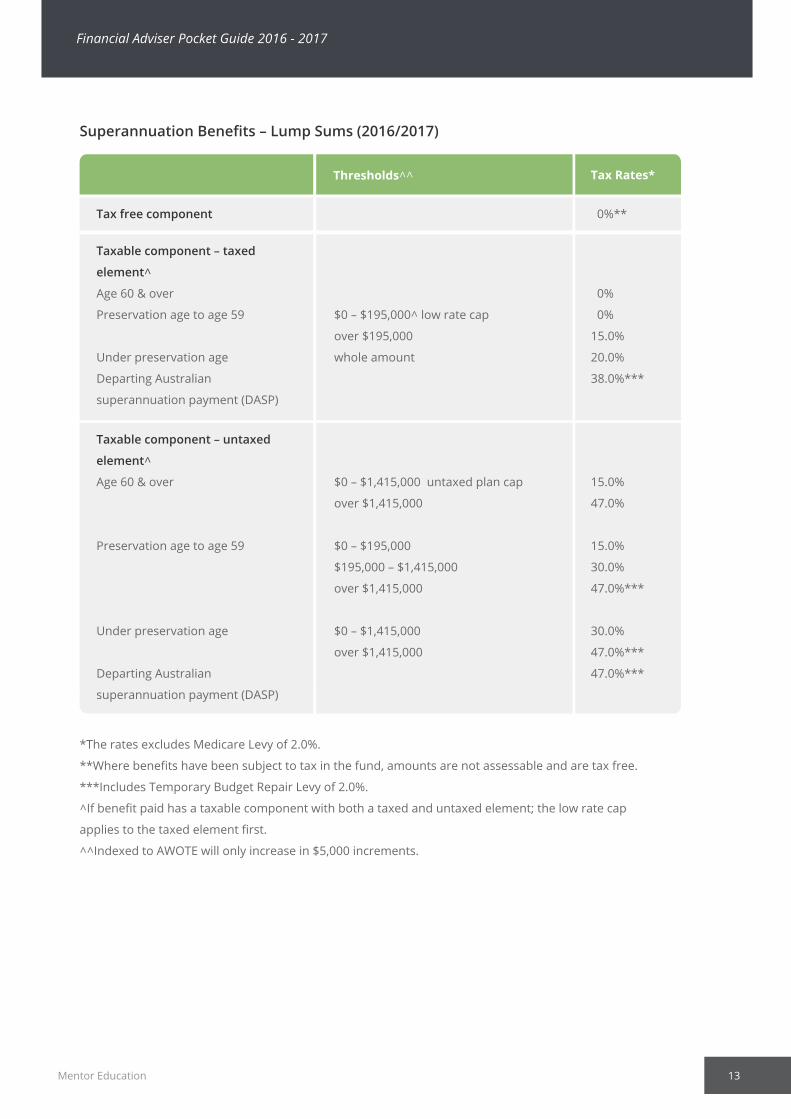
*The rates excludes Medicare Levy of 2.0%.
**Where benefits have been subject to tax in the fund, amounts are not assessable and are tax free.
***Includes Temporary Budget Repair Levy of 2.0%.
^If benefit paid has a taxable component with both a taxed and untaxed element; the low rate cap
applies to the taxed element first.
^^Indexed to AWOTE will only increase in $5,000 increments.
Tax free component 0%**
Taxable component – taxed
element^
Age 60 & over
Preservation age to age 59
Under preservation age
Departing Australian
superannuation payment (DASP)
0%
0%
15.0%
20.0%
38.0%***
$0 – $195,000^ low rate cap
over $195,000
whole amount
Taxable component – untaxed
element^
Age 60 & over
Preservation age to age 59
Under preservation age
Departing Australian
superannuation payment (DASP)
15.0%
47.0%
15.0%
30.0%
47.0%***
30.0%
47.0%***
47.0%***
$0 – $1,415,000 untaxed plan cap
over $1,415,000
$0 – $195,000
$195,000 – $1,415,000
over $1,415,000
$0 – $1,415,000
over $1,415,000
Thresholds^^ Tax Rates*
Superannuation Benefits – Lump Sums (2016/2017)
Mentor Education 13
Financial Adviser Pocket Guide 2016 - 2017

**Where benefits have been subject to tax in the fund, amounts are not assessable, not exempt income.
Medicare levy (2.0%) will apply to assessable amounts.
Tax free component
Taxable component – taxed element^
Age 60 & over
Preservation age to age 59
Under preservation age
0%**
Marginal tax rate with 15% tax offset
Marginal tax rate with no tax offset
Taxable component – untaxed element^
Age 60 & over
Age 59 & under
Under preservation age
Marginal tax rate with 10% tax offset
Marginal tax rate with no tax offset
Marginal tax rate with no tax offset
Thresholds^^
Superannuation Benefit – Income Streams (2016/2017)
Medicare levy (2.0%) will apply to assessable amounts.
LUMP SUM – paid to dependent
LUMP SUM – paid to non-dependent
Tax free component
Taxable component:
Taxed element
Untaxed element
0%
15.0%
30.0%
0%
PENSION – deceased/primary
beneficiary over 60
0%
PENSION – Primary beneficiary under 60
Tax free component
Taxable component
0%
Marginal tax rate with 15% tax offset for
individuals between preservation age
and age 60
Maximum tax rates
Superannuation Death Benefit Payments (2016/2017)
Mentor Education 14
Financial Adviser Pocket Guide 2016 - 2017

Superannuation Income Streams
The following percentage factors are used to calculate the minimum pension payments for
account-based income streams commenced on or after 20 September 2007.
ACCOUNT-BASED PENSION
Minimum income stream percentage factors*
Minimum income stream standard
Mentor Education 15
Financial Adviser Pocket Guide 2016 - 2017
Age
Under 65
2016/2017 year
4.00%
65 – 74 5.00%
*Amount calculated on 1 July each year, unless first year of
account-based income stream, then pro-rated from
commencement day. Minimum amount rounded to nearest
$10.
Must make minimum payment at least annually. No payment required in first
year if person commenced between 1 June and 30 June.
Maximum 10% pa for ‘transition to retirement’ pension.
75 – 79 6.00%
80 – 84 7.00%
85 – 89 9.00%
90 – 94 11.00%
95 and over 14.00%
Preservation Age
Account based income stream payments
Maximum payment
Minimum payment Account balance x percentage factor
No limit*

Mentor Education 15
Financial Adviser Pocket Guide 2016 - 2017
Must be paid annually. Minimum payment must ensure withdrawal value is equal to no
more than 100% of the purchase price of the pension, or be a lifetime pension and
have no residual capital and the first year pension equal to or more than the purchase
price of the pension multiplied by respective percentage factor.
Existing income streams are deemed to satisfy the minimum income stream
requirements.
Non-account based income streams (from 20/9/07)
Minimum payment
Age Min
50
51
52
53
54
55
56
57
58
59
60
61
21.5
21.2
20.9
20.5
20.1
19.8
19.4
19.0
18.6
18.2
17.8
17.4
Max
9.9
9.9
9.8
9.7
9.7
9.6
9.5
9.4
9.3
9.1
9.0
8.9
Age Min
62
63
64
65
66
67
68
69
70
71
72
73
17.0
16.6
16.2
15.7
15.3
14.9
14.4
14.0
13.5
13.1
12.6
12.2
Max
8.7
8.5
8.3
8.1
7.9
7.6
7.3
7.0
6.6
6.2
5.8
5.4
Age Min
74
75
76
77
78
79
80
81
82
83
84
85
11.7
11.3
10.8
10.4
10.0
9.5
9.1
8.7
8.3
7.9
7.5
7.1
Max
4.8
4.3
3.7
3.0
2.2
1.4
1.0
1.0
1.0
1.0
1.0
1.0
Purchase price of income stream x percentage factor
For pensions and annuities that commenced prior to 1 January 2006, providers can choose the
percentage factors for the minimum income stream percentage factors or the pension valuation
factors (PVF).
ALLOCATED PENSIONS AND ANNUITIES
Minimum and Maximum Pension Valuation Factors (PVF)

Mentor Education 16
Financial Adviser Pocket Guide 2016 - 2017
Age Min
50
51
52
53
54
55
56
57
58
59
60
61
22.8
22.5
22.2
21.8
21.5
21.1
20.8
20.4
20.1
19.7
19.3
18.9
Max
12.0
11.9
11.8
11.8
11.7
11.5
11.4
11.3
11.2
11.0
10.9
10.7
Age Min
62
63
64
65
66
67
68
69
70
71
72
73
18.5
18.1
17.7
17.3
16.8
16.8
16.0
15.5
15.1
14.6
14.2
13.7
Max
10.5
10.3
10.1
9.9
9.6
9.3
9.1
8.7
8.4
8.0
7.6
7.2
Age Min
74
75
76
77
78
79
80
81
82
83
84
85
13.3
12.8
12.3
11.9
11.4
10.9
10.5
10.0
9.6
9.1
8.7
8.3
Max
6.7
6.2
5.7
5.1
4.5
3.8
3.1
2.3
1.4
1.0
1.0
1.0
For pensions and annuities that commenced from 1 January 2006 to 20 September 2007, providers
can choose the percentage factors for the minimum income stream percentage factors or the
pension valuation factors (PVF).
ALLOCATED PENSIONS AND ANNUITIES
Minimum and Maximum Pension Valuation Factors (PVF)

Mentor Education 17
Financial Adviser Pocket Guide 2016 - 2017
TermRemaining
(years) Min
45
44
43
42
41
40
39
38
37
36
35
31
34
33
32
22.50
22.28
22.06
21.83
21.60
21.36
21.10
20.84
20.57
20.29
20.00
18.74
19.70
19.39
19.07
PaymentFactor
TermRemaining
(years)
15
14
13
12
11
10
9
8
7
6
5
1 or less
4
3
2
11.52
10.92
10.30
9.66
9.00
8.32
7.61
6.87
6.11
5.33
4.52
1.00
3.67
2.80
1.90
PaymentFactor
TermRemaining
(years)
30
29
28
27
26
25
24
23
22
21
20
16
19
18
17
18.39
18.04
17.67
17.29
16.89
16.48
16.06
15.62
15.17
14.70
14.21
12.09
13.71
13.19
12.65
PaymentFactor
TERM ALLOCATED PENSIONS (TAP) AND ANNUITIES
Payment Factors

Employment Termination PaymentsAn employment termination payment (ETP) is a payment made in consequence of the termination of
employment. It can include:
*The rates excludes Medicare Levy of 2.0%
**Includes Temporary Budget Repair Levy of 2.0%
^Indexed to AWOTE and will only increase in $5,000 increments.
*The rates excludes Medicare Levy of 2.0%
**Includes Temporary Budget Repair Levy of 2.0%
^Indexed to AWOTE and will only increase in $5,000 increments.
Tax free component
Taxable component
Under preservation age
Preservation age or over
$0 – $195,000^
Balance
$0 – $195,000^
Balance
30.0%
47.0%**
15.0%
47.0%**
0%
Thresholds^^ Maximum tax rate*
Life benefit employment termination payments (2016/2017)
Dependent
Tax free component
Taxable component $0 – $195,000^
Balance
0%
0%
47.0%**
Non-dependent
Tax free component
Taxable component $0 – $195,000^
Balance
0%
30.0%
47.0%**
Thresholds^^ Maximum tax rate*
Death benefit employment termination payments (2016/2017)
Bona fide redundancy Tax-Free Amount (2016/2017)
Mentor Education 18
Financial Adviser Pocket Guide 2016 - 2017
$9,936 (base amount) plus $4,969 (service amount) for each completed year of service. This is
non-ETP and cannot be rolled over to a super fund.
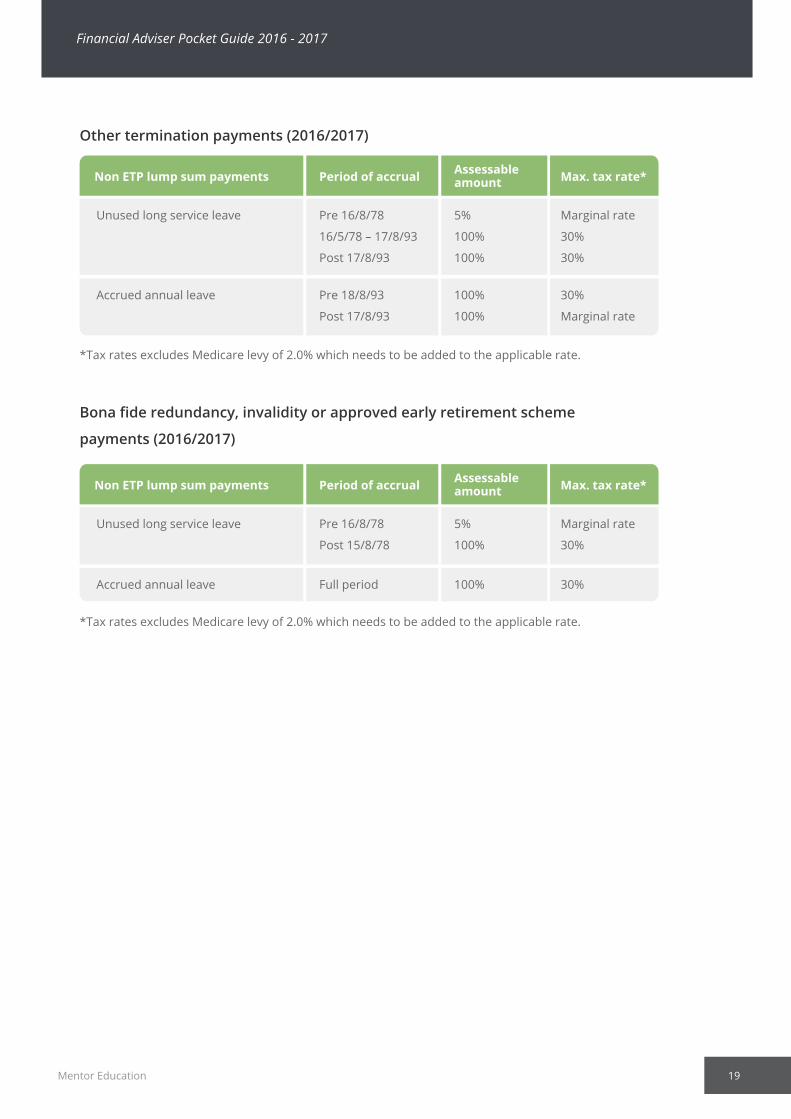
*Tax rates excludes Medicare levy of 2.0% which needs to be added to the applicable rate.
Unused long service leave Pre 16/8/78
16/5/78 – 17/8/93
Post 17/8/93
Marginal rate
30%
30%
Period of accrual
5%
100%
100%
Assessable amountNon ETP lump sum payments Max. tax rate*
Other termination payments (2016/2017)
Mentor Education 19
Financial Adviser Pocket Guide 2016 - 2017
Accrued annual leave Pre 18/8/93
Post 17/8/93
30%
Marginal rate
100%
100%
*Tax rates excludes Medicare levy of 2.0% which needs to be added to the applicable rate.
Unused long service leave Pre 16/8/78
Post 15/8/78
Marginal rate
30%
Period of accrual
5%
100%
Assessable amountNon ETP lump sum payments Max. tax rate*
Bona fide redundancy, invalidity or approved early retirement scheme
payments (2016/2017)
Accrued annual leave Full period 30%100%

Age PensionAcceptance of contributions
Basic Pension Rates (effective from 20 March to 19 September 2016)
Mentor Education 20
Financial Adviser Pocket Guide 2016 - 2017
Social SecuritySocial Security
Date of Birth
Men and Women
1 July 1952 – 31 December 1953
1 January 1954 – 30 June 1955
1 July 1955 – 31 December 1956
1 January 1957 – 30 June 1958
1 July 1958 – 31 December 1959
1 January 1960 – 30 June 1961
1 July 1961 – 31 December 1962
1 January 1963 – 30 June 1964
1 July 1964 – 31 December 1965
1 January 1966 and later
65.5
66.0
66.5
67.0
68.0
68.5
69.0
69.0
69.5
70.0
Eligible for Age Pension at Age
Family Situation
$873.90 $22,721.40
Couple (each)
Single
$658.70 $17,126.20
Maximum Benefit*(per fortnight)
Maximum Benefit*(per annum)
*These amounts do not include the Supplement amount of $65.00 a fortnight for singles and $49.00 a
fortnight for couples (each) or Clean Energy Supplement amount of $14.10 a fortnight for singles and
$10.60 a fortnight for couples (each). The ‘Pension Rates’ are adjusted twice yearly – in March and
September in line with increase in the cost of living. This includes the higher of the increase in the
Consumer Price Index (CPI) and the increase in the Pensioner and Beneficiary Living Cost Index (PBLCI).

Allowance Rates (effective from 20 March to 19 September 2016)
Mentor Education 21
Financial Adviser Pocket Guide 2016 - 2017
Family Situation
$527.60 $13,717.60
Single, 22 or over, with dependent children
Single, 22 or over, no children
$570.80 $14,840.80
$570.80 $14,840.80
Couple (each)
Single, 60 or over after 9 months
Single principal carer of a dependent child
(granted an exemption for foster
caring/home schooling/distance
education/large family)
$476.40 $12,386.40
$737.10 $19,164.60
Maximum Benefit*(per fortnight)
Maximum Benefit*(per annum)
Income Test for Pensions (effective from 1July to 19 September 2016)
Family Situation
$164 $1,911.80
Couple (combined)
Single
$292 $2,926.80
Couple separated due to illness (combined) $288 $3,787.60
Income Threshold*(per fortnight)
Income cut-out(per fortnight)
*These amounts include a Supplement amount for recipients under Age Pension age. Excludes
Pharmaceutical Allowance (PhA). PhA may be paid in certain circumstances. Payment may be deferred
where liquid assets equal or exceed $5,500 for singles or $11,000 for couples and those with depen-
dent children, Partner and Special Benefits.
*Income over these amounts reduces the rate of pension by 50 cents in the dollar (single), or 25 cents
in the dollar each (for couples). The lower threshold is normally adjusted in line with the Consumer
Price Index (CPI) on 1 July of each year. The upper threshold is adjusted on 1 July of each year, and
also adjusted on 20 March and 20 September of each year.

Income Test for Allowances (effective from 1 July to 19 September 2016)
Mentor Education 22
Financial Adviser Pocket Guide 2016 - 2017
Family Situation
$104 $1,023.00
Single, 22 or over, with dependent children
Single, 22 or over, no children
$104 $1,096.17
$104 $1,106.50
Couple (each)
Single, 60 or over after 9 months
Single principal carer of a dependent child
(granted an exemption for foster
caring/home schooling/distance
education/large family)
$104 $ 936.17
$104 $1,976.75
Income Threshold*(per fortnight)
Income cut-out(per fortnight)
*Fortnightly income between $104 and $254 reduces fortnightly allowance by 50 cents in the dollar.
For income above $250.00 per fortnight reduces fortnightly allowance by $75 plus 60 cents for each
dollar over $254. Partner income which exceeds cut-out point reduces fortnightly allowance by 60
cents in the dollar. This point is where the allowance would not be payable.
Deeming Rates (effective from 1 July t0 19 September 2016)
Family Situation
$0 – $49,200
Balance
1.75%
3.25%
Single
(Pension or Allowance)
$0 – $81,600
Balance
1.75%
3.25%
Couple – combined
(Pensioner)
Couple – for each allowee
(Neither is pensioner)
$0 – $40,800
Balance
1.75%
3.25%
FinancialInvestment Deeming Rate
Note: Deeming rates are set by agreement between the Ministers for the Department of Families,
Housing, Community Services and Indigenous Affairs (FaHCSIA) and the Department of Education,
Employment and Workplace Relations (DEEWR).

Assets Test Limits for Allowances and Parenting Paymt Single (effective from I Jul to 31 Dec 2016)
Family Situation
$202,000 $348,500
Couple (combined)
Single
$286,500 $433,000
One partner eligible (combined assets) $286,500 $433,000
Homeowner Non-Homeowner
Income Test for Allowances (effective from 1 July to 31 December 2016)
Mentor Education 23
Financial Adviser Pocket Guide 2016 - 2017
Family Situation
1 Jul 2016 to 31 Dec 2016 1 Jul 2016 to 31 Dec 2016
Single
Home owner
$209,000 $ 791,750
$296,500 $1,175,000
Couple separated due to illness (combined)
Couple (combined)
$296,500 $1,462,000
One partner eligible (combined assets) $296,500 $1,175,000
Single
Non-home owner
$360,500 $ 943,250
$448,000 $1,326,500
Couple separated due to illness (combined)
Couple (combined)
$448,000 $1,613,500
One partner eligible (combined assets) $448,000 $1,326,500
Lower Threshold* Upper Threshold
Assets over these amounts reduces the rate of pension by $1.50 per fortnight for every $1,000 above
the amount (single and couple combined). The lower threshold is normally adjusted in line with the
Consumer Price Index (CPI) on 1 July of each year. The upper threshold is adjusted on 1 July of each
year, and also adjusted on 20 March and 20 September of each year. From 1 January 2017 the assets
test free area and the assets taper rate will increase to $3 for every $1,000 above the new assets test
free areas:-
$250,000 for a single homeowner
$375,000 for a homeowner couple
$450,000 for a single non-homeowner
$575,000 for a non-homeowner couple.

Life expectancy for people at each age
Mentor Education 24
Financial Adviser Pocket Guide 2016 - 2017
Age
Male Female
32.2050 35.67
31.2951 34.74
30.3852 33.80
29.4953 32.87
28.5954 31.95
27.7155 31.12
26.8356 30.10
25.9557 29.19
25.0958 28.28
24.2259 27.37
23.3760 26.47
22.5261 25.57
21.6862 24.68
20.8563 23.80
20.0364 22.92
19.2265 22.05
18.4166 21.18
17.6267 20.33
16.8468 19.48
16.0769 18.64
15.3170 17.80
14.5671 16.98
13.8372 16.18
13.1173 15.38
12.4074 14.60
11.7275 13.83
Life Expectancy (yrs) Age
Male Female
11.0576 13.08
10.4177 12.33
9.7878 11.61
9.1879 10.90
8.6080 10.21
8.0481 9.55
7.5182 8.90
7.0083 8.29
6.5284 7.70
6.0685 7.14
5.6486 6.61
5.2487 6.11
4.8788 5.65
4.5289 5.22
4.2190 4.82
3.9291 4.45
3.6692 4.12
3.4493 3.82
3.2494 3.55
3.0695 3.32
2.9196 3.11
2.7897 2.93
2.6798 2.77
2.5799 2.62
2.46100 2.50
2.46100+ 2.50
Life Expectancy (yrs)
The life tables depict the mortality experience of a hypothetical group of newborn babies throughout
their entire lifetime. It is based on the assumption that this group is subject to the age-specific
mortality rates of the referenced period.
Life Tables, Australia, 2010 – 2012

Consumer Price Index (CPI)
Mentor Education 25
Financial Adviser Pocket Guide 2016 - 2017
2015 106.8
Mar 31 Jun 30 Sep 30
2016 108.2
2014 105.4 105.9 106.4 106.6
107.5 108.0 108.4
2013 102.4 102.8 104.0 104.8
2012 99.9 100.4 101.8 102.0
2011 98.3 99.2 99.8 99.8
2010 95.2 95.8 96.5 96.9
2009 92.5 92.9 93.8 94.3
2008 90.3 91.6 92.7 92.4
2007 86.6 87.7 88.3 89.1
2006 84.5 85.9 86.7 86.6
2005 82.1 82.6 83.4 83.8
2004 80.2 80.6 80.9 81.5
2003 78.6 78.6 79.1 79.5
2002 76.1 76.6 77.1 77.6
2001 73.9 74.5
74.7 75.4
2000 69.7 70.2 72.9 73.1
1999 67.8 68.1 68.7 69.1
1998 67.0 67.4 67.5 67.8
1997 67.1 66.9 66.6 66.8
1996 66.2 66.7 66.9 67.0
1995 63.8 64.7 65.5 66.0
1994 61.5 61.9 62.3 62.8
1993 60.6 60.8 61.1 61.2
1992 59.9 59.7 59.8 60.1
1991 58.9 59.0 59.3 59.9
Dec 31
Continue nex page

Average Weekly Ordinary Time Earnings (AWOTE)
2007 $1,073.80
Mar 31 Jun 30 Sep 30
2008 $1,124.80 $1,131.10 $1,151.40 $1,165.30
$1,090.00 $1,105.10 $1,108.50
2009 $1,183.40 $1,195.60 $1,204.20 $1,226.80
2010 $1,243.90 $1,250.10 $1,258.80 $1,275.20
2011 $1,291.30 $1,304.70 $1,324.90 $1,330.10
2012 $1,348.10 $1,349.20 n.a.** $1,396.00
2013 n.a.** $1,420.90 n.a.** $1,437.00
2014 n.a.** $1,454.10 n.a.** $1,477.00
2015 n.a.** $1,483.10 n.a.** $1,500.50
2016 n.a.**
Dec 31
Note: The ABS changed the index reference base in September 2012 from 1989-90 to
2011-12. As a result all CPI rates have been rest and the previous rates no longer apply
and can no longer be used for tax and superannuation purposes.
**Changed to biannual, not quarterly.
Mentor Education 26
Financial Adviser Pocket Guide 2016 - 2017
1990 56.2 57.1 57.5 59.0
1989 51.7 53.0 54.2 55.2
1988 48.4 49.3 50.2 51.2
1987 45.3 46.0 46.8 47.6
1986 41.4 42.1 43.2 44.4
1985 37.9 38.8 39.7 40.5

Mentor Education 27
Financial Adviser Pocket Guide 2016 - 2017
Online ResourcesOnline Resources
Organisation Web Link Services
Mentor Education Group Financial services training for
industry professionals.
www.mentor.edu.au
Department of Education,
Employment and Workplace
Relations
Info on HECS – HELP and higher
education.
www.goingtouni.gov.au
My Aged Care Info on Government and
non-Government services for
Australians over 50.
http://www.myagedcare.gov.au/
Australian Taxation Office Info on individual taxation,
superannuation, business
taxation.
www.ato.gov.au
Australian Securities and
Investments Commission
Regulatory guidelines and
compliance information for
financial services industry
professionals.
Australian Securities and
Investments Commission
Consumer information on
money tips, financial calculators
and general financial literacy
education.
Australian Securities Exchange Info on stock quotes, market
data, share prices, tools and
resources as well as investment
information.
www.asic.gov.au
www.fido.asic.gov.au
www.asx.com.au
Centrelink Info on Govt allowances and
pensions, family tax and child
care benefits, health care cards,
study and training benefits,
carers, illness and disability
payments.
www.centrelink.gov.au

DISCLAIMER
Webwww.mentor.edu.au
PhoneAust: 1300 306 146
Int: +61 3 8317 2900
Our friendly student support
The financial information provided is believed to be accurate as at 8 August 2016. However, all financial
information is subject to regular rate changes and legislation amendments. Therefore, the information is
intended as a guide only and should be used in conjunction with the latest Government information.