financial analysis cs sample reports - template.net...introduction the financial analysis cs™...
TRANSCRIPT

FINANCIAL ANALYSIS CS™
Sample Reports version 2008.x.x

TL 19887 (10/14/2008) Copyright Information Text copyright 2004 - 2008 by Thomson Reuters/Tax & Accounting. All rights reserved. Video display images copyright 2004- 2008 by Thomson Reuters/Tax & Accounting. All rights reserved. Thomson Reuters hereby grants licensees of CS Professional Suite® software the right to reprint this document solely for their internal use. Trademark Information The trademarks used herein are trademarks and registered trademarks used under license. All other brand and product names mentioned in this guide are trademarks or registered trademarks of their respective holders. .

Financial Analysis CS: Sample Reports iii
Contents Introduction ................................................................................................................................................. 1
Quick Analysis Financial Reports ............................................................................................................. 3 Liberty Medical Group, 2010 (title page) ................................................................................................................... 5
Firm Statement ..................................................................................................................................................... 5
Two-Year Comparison Reports ................................................................................................................................. 7 Balance Sheet – Two-Year Comparison .............................................................................................................. 7 Statement of Income – Two-Year Comparison ..................................................................................................... 8 Ratio Analysis – Two-Year Comparison ............................................................................................................... 9 Detailed Ratio Analysis – Two-Year Comparison ............................................................................................... 11
Industry Comparison Reports .................................................................................................................................. 27 Balance Sheet – Industry Comparison ............................................................................................................... 27 Statement of Income – Industry Comparison ...................................................................................................... 28 Ratio Analysis – Industry Comparison ................................................................................................................ 29 Detailed Ratio Analysis – Industry Comparison .................................................................................................. 31
Group Comparison Reports .................................................................................................................................... 41 Balance Sheet – Group Comparison .................................................................................................................. 41 Statement of Income – Group Comparison ........................................................................................................ 42 Ratio Analysis – Group Comparison ................................................................................................................... 43 Detailed Ratio Analysis – Group Comparison ..................................................................................................... 45
Five-Year Trend Analysis Reports...........................................................................................................................61 Balance Sheet – Five-Year Trend Analysis ........................................................................................................61 Statement of Income – Five-Year Trend Analysis ..............................................................................................63 Ratio Analysis – Five-Year Trend Analysis .........................................................................................................64
Ratio Formulas ........................................................................................................................................................65
Definitions of Categories .........................................................................................................................................67 Balance Sheet ....................................................................................................................................................67 Statement of Income ..........................................................................................................................................69

Contents
iv Financial Analysis CS: Sample Reports

Introduction The Financial Analysis CS™ module within the Creative Solutions Accounting® (CSA) software includes many pre-defined financial reports that you can use and customize in the Financial Analysis CS Report Designer to meet your clients’ financial reporting needs. You can generate sample reports included here from the File / Quick Analysis dialog in Financial Analysis CS. They include two-year and five-year comparisons, industry and group comparisons, and detailed ratio analysis reports for all standard ratios or for selected ratio types. The detailed ratio analysis reports include charts depicting several key ratios that are available to incorporate into your client reports or to customize to fit your client's specific needs.
Note: You can use the programs Report Designer to copy and modify any of the standard reports or to create new ones from scratch.
Financial Analysis CS: Sample Reports 1

Introduction
2 Financial Analysis CS: Sample Reports

Quick Analysis Financial Reports The collection of reports included in this document is based on the sample client data that has been transferred from CSA for the FACS01 Sample Client, with FACS02 and FACS03 set up as industry peers, as outlined in the Financial Analysis CS Getting Started guide. The provided reports include two-year comparison reports, five-year trend analysis reports, industry and group comparison reports, definitions, of categories, and ratio formulas.
Financial Analysis CS: Sample Reports 3
Quick Analysis Financial Reports
4 Financial Analysis CS: Sample Reports
Prepared by:
Parnes, Velano, Martinez7322 Newman BlvdDexter, MI 48130
800-968-0600
Financial Analysis CS: Sample Reports 5

We at Parnes, Velano, Martinez have compiled the enclosed report for Liberty Medical Group based on financial data compiled through December 31, 2008.
Each report has been customized for your business to give you the information you need to compare your annual business performance to comparable businesses within the Offices of Physicians (except Mental Health Specialists) industry (NAICS: 621111). This information can help you to determine if your business strategy is competitive within your industry and to pinpoint your company's strengths and weaknesses. It will also enable you to benchmark your firms performance over time, allowing you to chart the progress of your business, to analyze your business performance more effectively, and to make more informed decisions about your company's direction.
Please review each report carefully as it is important that you fully understand the data presented here. Please be aware that the analysis presented is based on historical figures. It is not a prediction of the future but rather a tool for monitoring the progress of your business over time. This information should factor into your decision making, but it should certainly not be the only factor in your business decisions. Be sure to consult all appropriate resources and professionals before making any decisions that may affect the financial health of your company.
If you have any questions, please contact our office at 800-968-0600 at your earliest convenience. It is a privilege to provide you with services and tools to help you manage your business successfully.
Your commitment to Parnes, Velano, Martinez is greatly appreciated!
6 Financial Analysis CS: Sample Reports

Liberty Medical GroupBalance Sheet - Two-Year Comparison
Assets
Cash & EquivalentsTrade Accounts ReceivableInventoryOther Current AssetsTotal Current Assets
Long-Term InvestmentsNet Fixed AssetsIntangible AssetsOther Non-Current Assets
Total Assets
Liabilities
Accounts PayableNotes PayableAccrued LiabilitiesIncome Taxes PayableCurrent Portion of Long-Term DebtTotal Current Liabilities
Long-Term DebtOther Long-Term Liabilities
Total Long-Term Liabilities
Total Liabilities
Retained EarningsTotal Equity
Total Liabilities and Equity
2008
$336,818$134,569$12,985$98,323
$582,695
$81,197$412,458$61,874$78,390
$1,216,614
$42,787$88,247
$532,506$10,014
$111,238$784,792
$281,809$55,000
$336,809
$1,121,601
$95,013$95,013
$1,216,614
2007
$319,978$127,841$13,657$94,325
$555,801
$77,137$383,750$58,780$74,471
$1,149,939
$32,658$83,835
$530,190$9,115
$115,676$771,474
$263,352$36,000
$299,352
$1,070,826
$79,113$79,113
$1,149,939
$ Variance
$16,840$6,728-$672
$3,998
$26,894
$4,060$28,708$3,094$3,919
$66,675
$10,129$4,412$2,316
$899-$4,438$13,318
$18,457$19,000
$37,457
$50,775
$15,900$15,900
$66,675
% Variance
5.3%5.3%
-4.9%4.2%
4.8%
5.3%7.5%5.3%5.3%
5.8%
31.0%5.3%0.4%9.9%
-3.8%1.7%
7.0%52.8%
12.5%
4.7%
20.1%20.1%
5.8%
Financial Analysis CS: Sample Reports 7

Liberty Medical GroupStatement of Income - Two-Year Comparison
SalesCost of SalesGross Profit
Operating ExpensesOperating Profit
Other IncomeOther ExpensesEarnings Before Interest and Taxes
Interest ExpenseEarnings Before Taxes
Provision for Income Taxes
Net Income
Additional InformationOwners' CompensationDepreciation ExpenseSelling Expenses
2008
$8,079,445$0
$8,079,445
$7,945,326
$134,119
$0$16,360
$117,759
$72,301
$45,458
$21,877
$23,581
$2,853,654$122,001
$0
2007
$7,756,268$0
$7,756,268
$7,620,193
$136,075
$0$15,542
$120,533
$68,439
$52,094
$21,070
$31,024
$2,796,581$115,901
$0
$ Variance
$323,177$0
$323,177
$325,133
-$1,956
$0$818
-$2,774
$3,862
-$6,636
$807
-$7,443
$57,073$6,100
$0
%
4.2%0.0%
4.2%
4.3%
-1.4%
0.0%5.3%
-2.3%
5.6%
-12.7%
3.8%
-24.0%
2.0%5.3%0.0%
8 Financial Analysis CS: Sample Reports

Liberty Medical GroupRatio Analysis - Two-Year Comparison
Liquidity Ratios
Current RatioQuick RatioDefensive Interval DaysAccounts Receivable to Working CapitalInventory to Working CapitalLong-Term Liabilities to Working CapitalSales to Working Capital
Activity Ratios
Accounts Receivable TurnoverDays Sales in ReceivablesInventory TurnoverDays Cost of Sales in InventoryAccounts Payable TurnoverDays Cost of Sales in PayablesOperating Cycle DaysSales to AssetsSales to Net Fixed AssetsPercent Depreciation Expense to Fixed AssetsPercent Accumulated Depreciation to Fixed AssetsNet Fixed Assets to Equity
Profitability Ratios
Percent Gross ProfitPercent Profit Margin on SalesPercent Rate of Return on AssetsPercent Rate of Return on EquityPrice Earnings RatioEarnings Per Share
Coverage Ratios
Debt to Total AssetsPercent Owners' EquityEquity MultiplierDebt to EquityCash Flow to Current Maturities Long-Term DebtTimes Interest EarnedBook Value Per Share
Expense to Sales Ratios
Percent Depreciation to SalesPercent Owners' Compensation to Sales
2008
0.70.6
22.3-0.7-0.1-1.7
-40.0
60.06.10.00.00.00.06.16.6
19.625.214.84.3
100.00.63.7
47.80.00.0
0.97.8
12.811.81.31.60.0
1.535.3
2007
0.70.6
22.1-0.6-0.1-1.4
-36.0
60.76.00.00.00.00.06.06.7
20.225.814.74.9
100.00.74.5
65.80.00.0
0.96.9
14.513.51.31.80.0
1.536.1
% Variance
0.0%0.0%0.9%
16.7%0.0%
21.4%11.1%
-1.2%1.7%0.0%0.0%0.0%0.0%1.7%
-1.5%-3.0%-2.3%0.7%
-12.2%
0.0%-14.3%-17.8%-27.4%
0.0%0.0%
0.0%13.0%
-11.7%-12.6%
0.0%-11.1%
0.0%
0.0%-2.2%
Financial Analysis CS: Sample Reports 9
Quick Analysis Financial Reports
10 Financial Analysis CS: Sample Reports

Liberty Medical GroupDetailed Ratio Analysis - Two-Year Comparison
Liquidity ratios measure a company’s ability to meet its maturing short-term obligations. In other words, can a company quickly convert its assets to cash without a loss in value if necessary to meet its short-term obligations? Favorable liquidity ratios are critical to a company and its creditors within a business or industry that does not provide a steady and predictable cash flow. They are also a key predictor of a company’s ability to make timely payments to creditors and to continue to meet obligations to lenders when faced with an unforeseen event.
Current RatioCurrent Assets / Current Liabilities
This ratio reflects the number of times short-term assets cover short-term liabilities and is a fairly accurate indication of a company's ability to service its current obligations. A higher number is preferred because it indicates a strong ability to service short-term obligations. The composition of current assets is a key factor in the evaluation of this ratio. Depending on the type of business or industry, current assets may include slow-moving inventories that could potentially affect analysis of a company's liquidity how long could it potentially take to convert raw materials and inventory into finished products? (For this reason, the quick ratio may be preferable to the current ratio because it eliminates inventory and prepaid expenses from this ratio for a more accurate gauge of a company's liquidity and ability to meet short-term obligations.)
The current ratio for Liberty Medical Group is 0.74, which compared to the baseline of 0.72 indicates the company's ability to service short-term obligations is satisfactory. However the value of the quick ratio will provide a clearer indication of the company's success in this area.
Quick Ratio(Cash + Marketable Securities + Trade Accounts Receivable) / Current Liabilities
This ratio, also known as the acid test ratio, measures immediate liquidity - the number of times cash, accounts receivable, and marketable securities cover short-term obligations. A higher number is preferred because it suggests a company has a strong ability to service short-term obligations. This ratio is a more reliable variation of the Current ratio because inventory, prepaid expenses, and other less liquid current assets are removed from the calculation.
Financial Analysis CS: Sample Reports 11

Liberty Medical GroupDetailed Ratio Analysis - Two-Year Comparison
The quick ratio for Liberty Medical Group is 0.60, which compared to the baseline of 0.58 indicates the company's ability to service short-term obligations is favorable.
Defensive Interval Days(Cash + Marketable Securities + Trade Accounts Receivable) / ((Operating Expenses - Other Expenses - Interest Expense - Provision for Income Taxes - Depreciation Expense) / Days)
This ratio gauges the threat of insolvency for investors by calculating the number of days a company can operate without any cash returns while meeting its basic operational costs. In general, this number should be between 30 to 90 days.
Defensive interval days for Liberty Medical Group is 22.31 days that indicates that the company's degree of protection against insolvency may not be ideal.
Altman Z score Retail(((Current Assets - Current Liabilities) / Total Assets) * 6.6) + ((Total Equity / Total Assets) * 3.3) + ((Earnings before Interest and Taxes / Total Assets) * 6.7) + ((Total Equity / Total Liabilities) * 1.0)
This ratio represents a numerical ranking that predicts the potential for bankruptcy of a retail company. In general, the lower the score, the higher the odds of bankruptcy. Companies with Z-Scores above 3 are considered to be healthy and therefore, unlikely to enter bankruptcy.
12 Financial Analysis CS: Sample Reports

Liberty Medical GroupDetailed Ratio Analysis - Two-Year Comparison
The Altman Z score for Liberty Medical Group is -0.11 that indicates the company may have a relatively low degree of protection against bankruptcy.
Altman Z score Manufacturing(((Current Assets - Current Liabilities) / Total Assets) * 0.717) + ((Total Equity / Total Assets) * 0.847) + ((Earnings before Interest and Taxes / Total Assets) * 3.107) + ((Total Equity / Total Liabilities) * 0.42) + ((Sales / Total Assets) * 0.998)
This ratio represents a numerical ranking that predicts the potential for bankruptcy of a manufacturing company. In general, the lower the score, the higher the odds of bankruptcy. Companies with Z-Scores above 3 are considered to be healthy and therefore unlikely to enter bankruptcy.
The Altman Z score for Liberty Medical Group is 6.91 that indicates the company has a relatively high degree of protection against bankruptcy.
Accounts Receivable to Working CapitalTrade Accounts Receivable / (Current Assets - Current Liabilities)
This ratio measures the dependency of working capital on the collection of receivables. A lower number for this ratio is preferred, indicating that a company has a satisfactory level of working capital and accounts receivable makes up an appropriate portion of current assets.
Financial Analysis CS: Sample Reports 13

Liberty Medical GroupDetailed Ratio Analysis - Two-Year Comparison
The accounts receivable to working capital ratio for Liberty Medical Group is -0.67, which compared to the baseline of -0.59 indicates that the company's performance is sufficient in this area.
Inventory to Working CapitalInventory / (Current Assets - Current Liabilities)
This ratio measures the dependency of working capital on inventory. A lower number for this ratio is preferred indicating that a company has a satisfactory level of working capital and inventory makes up a reasonable portion of current assets.
The inventory to working capital ratio for Liberty Medical Group is -0.06, which compared to the baseline of -0.06 indicates this ratio is in line with company goals.
Long Term Liabilities to Working CapitalLong Term Liabilities / (Current Assets - Current Liabilities)
This ratio measures the degree to which a company's long-term debt has been used to replenish working capital versus fixed asset acquisition.
The long-term liabilities to working capital ratio for Liberty Medical Group is -1.67, which compared to the baseline of -1.39 indicates the value of this ratio is meeting the company's expectations.
14 Financial Analysis CS: Sample Reports

Liberty Medical GroupDetailed Ratio Analysis - Two-Year Comparison
Sales to Working CapitalSales / (Current Assets - Current Liabilities)
This ratio measures a company's ability to finance current operations. Working capital (current assets - current liabilities) is another measure of liquidity and the ability to cover short-term obligations. This ratio relates the ability of a company to generate sales using its working capital to determine how efficiently working capital is being used. In general, a lower number is preferred because it indicates a company has a satisfactory level of working capital. However, an exceptionally low number may indicate inadequate sales levels are being generated.
The sales to working capital ratio for Liberty Medical Group is -39.98, which compared to the baseline of -35.96 reveals that the company's level of working capital is strong. The company may want to make an effort to generate additional sales using the available working capital.
The following list includes several suggestions Liberty Medical Group should consider to improve the liquidity ratios:
Reduce days in accounts receivable to improve current assets by evaluating accounts receivable on amore frequent basis and take a more assertive stance in the collection of accounts receivable anddelinquent accounts.
Prepare thorough cash forecasts and evaluate the company's ability to meet goals on a regular basis.Consider paying off short-term obligations if the cash position of the company is favorable.Consider converting short-term debt to long-term debt.Reduce levels of non-moving inventory.
Financial Analysis CS: Sample Reports 15

Liberty Medical GroupDetailed Ratio Analysis - Two-Year Comparison
Activity ratios provide a useful gauge of a company's operations by determining, for example, the average number of days it takes to collect on customer accounts and the average number of days to pay vendors. A key point to keep in mind when evaluating these ratios is that seasonal fluctuations are not necessarily reflected in the numbers that are derived from these calculations based on an account balance on one single day.
Accounts Receivable TurnoverSales / Trade Accounts Receivable
This ratio measures the number of times receivables turn over in a year and reveals how successful a company is in collecting its outstanding receivables. A higher number is preferred because it indicates a shorter time between sales and cash collection.
The accounts receivable turnover for Liberty Medical Group is 60.04, which compared to the baseline of 60.67 suggests this ratio may not be on target with company objectives.
Days Sales in ReceivablesTrade Accounts Receivable / (Sales / Days)
This ratio measures the average number of days a company's receivables are outstanding. A lower number of days is desired. An increase in the number of days receivables are outstanding indicates an increased possibility of late payment by customers. Companies should attempt to reduce the number of days sales in receivables in order to increase cash flow. The general rule used is that the time allowed for payment by the selling terms should not be exceeded by more than 10 or 15 days.
The days sales in receivables for Liberty Medical Group is 6.08 days that indicates the company is effective in collecting outstanding receivables.
Operating Cycle Days(Inventory / (Cost of Sales / Days)) + (Trade Accounts Receivable / (Sales / Days))
16 Financial Analysis CS: Sample Reports
Liberty Medical GroupDetailed Ratio Analysis - Two-Year Comparison
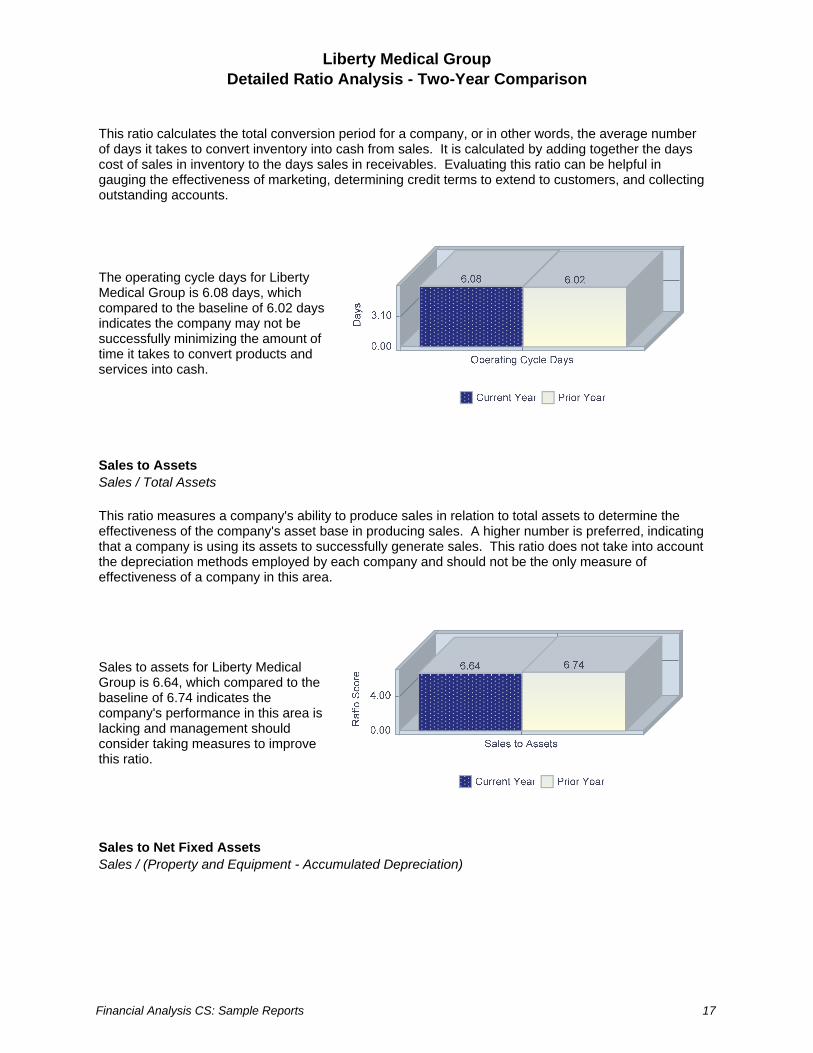
This ratio calculates the total conversion period for a company, or in other words, the average number of days it takes to convert inventory into cash from sales. It is calculated by adding together the days cost of sales in inventory to the days sales in receivables. Evaluating this ratio can be helpful in gauging the effectiveness of marketing, determining credit terms to extend to customers, and collecting outstanding accounts.
The operating cycle days for Liberty Medical Group is 6.08 days, which compared to the baseline of 6.02 days indicates the company may not be successfully minimizing the amount of time it takes to convert products and services into cash.
Sales to AssetsSales / Total Assets
This ratio measures a company's ability to produce sales in relation to total assets to determine the effectiveness of the company's asset base in producing sales. A higher number is preferred, indicating that a company is using its assets to successfully generate sales. This ratio does not take into account the depreciation methods employed by each company and should not be the only measure of effectiveness of a company in this area.
Sales to assets for Liberty Medical Group is 6.64, which compared to the baseline of 6.74 indicates the company's performance in this area is lacking and management should consider taking measures to improve this ratio.
Sales to Net Fixed AssetsSales / (Property and Equipment - Accumulated Depreciation)
Financial Analysis CS: Sample Reports 17

Liberty Medical GroupDetailed Ratio Analysis - Two-Year Comparison
This ratio measures a company's ability to effectively utilize its fixed assets to generate sales. This ratio is similar to the sales to assets ratio, but it excludes current assets, long-term investments, intangible assets, and other non-current assets. A higher number is desired, indicating that a company productively uses its fixed assets to produce sales. This ratio does not take into account the depreciation methods employed by each company and should not be the only measure of effectiveness of a company in this area. In addition, fixed assets that are almost fully depreciated, and labor-intensive operations may interfere with the interpretation of this ratio.
Sales to net fixed assets for Liberty Medical Group is 19.59, which compared to the baseline of 20.21 indicates the company is not making use of its fixed assets to effectively generate sales.
Percent Depreciation Expense to Fixed AssetsDepreciation Expense / Property and Equipment * 100
This ratio measures the reasonableness and consistency of a company's depreciation expense over time.
The percent depreciation expense to fixed assets for Liberty Medical Group is 25.20%, which compared to the baseline of 25.76% indicates the value of this ratio is meeting the company's expectations.
Percent Accumulated Depreciation to Fixed AssetsAccumulated Depreciation / Property and Equipment * 100
This ratio measures the cumulative percentage of productive asset costs a company has allocated to operations.
18 Financial Analysis CS: Sample Reports

Liberty Medical GroupDetailed Ratio Analysis - Two-Year Comparison
The percent accumulated depreciation to fixed assets for Liberty Medical Group is 14.80%, which compared to the baseline of 14.70% indicates this ratio may not be on target with company objectives.
Net Fixed Assets to Equity(Property and Equipment - Accumulated Depreciation) / Total Equity
This ratio measures the extent to which investors' capital was used to finance productive assets. A lower ratio indicates a proportionally smaller investment in fixed assets in relation to net worth, which is desired by creditors in case of liquidation. Note that this ratio could appear deceptively low if a significant number of a company's fixed assets are leased.
Net fixed assets to equity for Liberty Medical Group is 4.34, which compared to the baseline of 4.85 indicates the company's performance is adequate in this area.
Financial Analysis CS: Sample Reports 19

Liberty Medical GroupDetailed Ratio Analysis - Two-Year Comparison
Profitability ratios measure a company’s ability to use its capital or assets to generate profits. Improving profitability is a constant challenge for all companies and their management. Evaluating profitability ratios is a key component in determining the success of a company. It is important to note that all profitability ratio calculations are based on earnings before taxes.
Percent Gross Profit((Sales - Cost of Sales) / Sales) * 100
This ratio measures the gross profit earned on sales and reports how much of each sales dollar is available to cover operating expenses and contribute to profits.
The percent gross profit for Liberty Medical Group is 100.00%, which compared to the baseline of 100.00% is a good indication of financial health for the company.
Percent Profit Margin on SalesEarnings before Taxes / Sales * 100
This ratio measures how much profit a company makes on each sales dollar received and how well a company could potentially deal with higher costs or lower sales in the future.
The percent profit margin on sales for Liberty Medical Group is 0.56%, which compared to the baseline of 0.67% indicates sales may not be contributing enough to the company's bottom line.
Percent Rate of Return on AssetsEarnings before Taxes / Total Assets * 100
This ratio measures how effectively a company's assets are being used to generate profits. It is one of the most important ratios when evaluating the success of a business. A higher number reflects a well managed company with a healthy return on assets. Heavily depreciated assets, a large number of intangible assets, or any unusual income or expenses can easily distort this calculation.
20 Financial Analysis CS: Sample Reports

Liberty Medical GroupDetailed Ratio Analysis - Two-Year Comparison
The percent rate of return on assets for Liberty Medical Group is 3.74%, which compared to the baseline of 4.53% indicates there is a need for improvement in this area to ensure the company can remain competitive and continue to operate successfully.
Percent Rate of Return on EquityEarnings before Taxes / Total Equity * 100
This ratio expresses the rate of return on equity capital employed and measures the ability of a company's management to realize an adequate return on the capital invested by the owners in a company. A higher number is preferred for this commonly analyzed ratio.
The percent rate of return on equity for Liberty Medical Group is 47.84%, which compared to the baseline of 65.85% indicates management may not be effectively managing the profits earned based on the owners investment in the company.
Financial Analysis CS: Sample Reports 21

Liberty Medical GroupDetailed Ratio Analysis - Two-Year Comparison
Coverage ratios assess a company’s ability to meet its long-term obligations, remain solvent, and avoid bankruptcy. It measures how well a company’s cash flow covers its short-term financial obligations. Lenders evaluate coverage ratios to determine the degree to which a company could become vulnerable when faced with economic downturns. A company with a high level of debt poses a higher risk to long-term creditors and investors.
Debt to Total AssetsTotal Liabilities / Total Assets
This ratio measures what proportion of debt a company is carrying relative to its assets. A ratio value greater than one indicates a company has more debt than assets. Naturally, companies and creditors prefer a lower number.
The debt to total assets ratio for Liberty Medical Group is 0.92, which compared to the baseline of 0.93 indicates the company should be able to withstand losses without harming creditor interests or could obtain additional financing if desired.
Percent Owners EquityTotal Equity / Total Assets * 100
This ratio measures what proportion of total assets was provided by the owners equity. The higher the number the more total capital has been contributed by owners and the less by creditors.
The percent owners' equity ratio for Liberty Medical Group is 7.81%, which compared to the baseline of 6.88% indicates the company owns an adequate portion of its asset base.
Equity MultiplierTotal Assets / Total Equity
This ratio measures the extent to which a company uses debt to finance its assets. The higher the number is, the more a company is relying on debt to finance its assets.
22 Financial Analysis CS: Sample Reports
Liberty Medical GroupDetailed Ratio Analysis - Two-Year Comparison
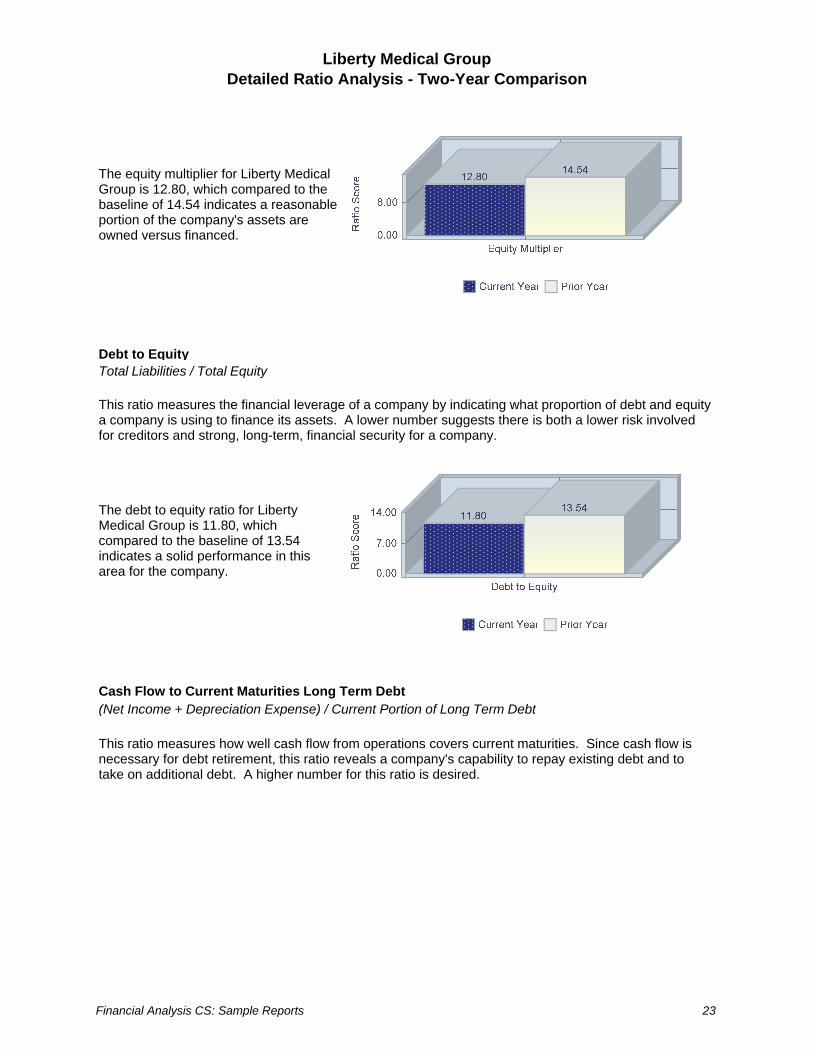
The equity multiplier for Liberty Medical Group is 12.80, which compared to the baseline of 14.54 indicates a reasonable portion of the company's assets are owned versus financed.
Debt to EquityTotal Liabilities / Total Equity
This ratio measures the financial leverage of a company by indicating what proportion of debt and equity a company is using to finance its assets. A lower number suggests there is both a lower risk involved for creditors and strong, long-term, financial security for a company.
The debt to equity ratio for Liberty Medical Group is 11.80, which compared to the baseline of 13.54 indicates a solid performance in this area for the company.
Cash Flow to Current Maturities Long Term Debt(Net Income + Depreciation Expense) / Current Portion of Long Term Debt
This ratio measures how well cash flow from operations covers current maturities. Since cash flow is necessary for debt retirement, this ratio reveals a company's capability to repay existing debt and to take on additional debt. A higher number for this ratio is desired.
Financial Analysis CS: Sample Reports 23

Liberty Medical GroupDetailed Ratio Analysis - Two-Year Comparison
The cash flow to current maturities long-term debt ratio for Liberty Medical Group is 1.31, which compared to the baseline of 1.27 indicates the company is in a strong position to meet its current obligations on long-term debt based on its current cash flow.
Times Interest EarnedEarnings before Interest and Taxes / Interest Expense
This ratio measures a company's ability to meet interest payments. A higher number is preferred, suggesting a company can easily meet interest obligations and can potentially take on additional debt. Note that this particular ratio uses earnings before interest and taxes because this is the income amount available to cover interest.
The times interest earned ratio for Liberty Medical Group is 1.63, which compared to the baseline of 1.76 indicates the company's interest coverage may not be sufficient.
The following list includes several suggestions Liberty Medical Group should consider to improve the coverage ratios:
Examine the company’s debt to uncover areas needing improvement and create a long range actionplan to address these areas and pay down debt.
Increase equity by increasing earnings.Minimize the overall amount of debt to decrease interest expenses.Reduce interest payments by evaluating financing alternatives and possibly refinancing existing debt.
24 Financial Analysis CS: Sample Reports

Liberty Medical GroupDetailed Ratio Analysis - Two-Year Comparison
Expense to sales ratios express specific expense items as a percentage of net sales. Comparisons of expenses are more meaningful because net sales is used as a constant. Extreme variations in these ratios are most pronounced between capital- and labor-intensive industries.
Percent Depreciation to SalesDepreciation Expense / Sales * 100
This ratio measures depreciation expense as a percentage of sales and is based on a company's fixed assets and how quickly they are being depreciated or amortized, relative to sales. Any depletion expenses should be included in this ratio as well. Note that depreciation methods should also be considered when evaluating this ratio.
The percent depreciation to sales for Liberty Medical Group is 1.51%, which compared to the baseline of 1.49% indicates the company should consider taking measures to improve this ratio.
Percent Owners Compensation to SalesOwners Compensation / Sales * 100
This ratio measures owners' compensation (which includes salaries, bonuses, commissions, drawings of partners, etc.) as a percentage of sales. The desired percentage may vary between companies depending on their individual goals.
The percent owners' compensation to sales for Liberty Medical Group is 35.32%, which compared to the baseline of 36.06% indicates the company is performing as desired in this area.
Financial Analysis CS: Sample Reports 25

Quick Analysis Financial Reports
26 Financial Analysis CS: Sample Reports

Liberty Medical GroupBalance Sheet - Industry Comparison
621111 - Offices of Physicians (except Mental Health Specialists)
Assets
Cash & EquivalentsTrade Accounts ReceivableInventoryOther Current AssetsTotal Current Assets
Long-Term InvestmentsNet Fixed AssetsIntangible AssetsOther Non-Current Assets
Total Assets
Liabilities
Accounts PayableNotes PayableAccrued LiabilitiesIncome Taxes PayableCurrent Portion of Long-Term DebtOther Current LiabilitiesTotal Current Liabilities
Long-Term DebtDeferred Income TaxesOther Long-Term Liabilities
Total Long-Term Liabilities
Total Liabilities
Retained EarningsTotal Equity
Total Liabilities and Equity
2008
$336,818$134,569$12,985$98,323
$582,695
$81,197$412,458$61,874$78,390
$1,216,614
$42,787$88,247
$532,506$10,014
$111,238$0
$784,792
$281,809$0
$55,000
$336,809
$1,121,601
$95,013$95,013
$1,216,614
% Assets
27.7%11.1%1.1%8.1%
47.9%
6.7%33.9%5.1%6.4%
100.0%
3.5%7.3%
43.8%0.8%9.1%0.0%
64.5%
23.2%0.0%4.5%
27.7%
92.2%
7.8%7.8%
100.0%
Industry
27.7%13.0%1.5%3.5%
45.7%
N/A40.8%2.9%
10.6%
100.0%
3.4%14.4%
N/A0.2%8.6%
31.9%
58.3%
29.6%0.3%4.1%
34.0%
92.3%
N/A7.6%
99.9%
Variance
0.0%-1.9%-0.4%4.6%
2.2%
6.7%-6.9%2.2%
-4.2%
0.0%
0.1%-7.1%43.8%0.6%0.5%
-31.9%
6.2%
-6.4%-0.3%0.4%
-6.3%
-0.1%
7.8%0.2%
0.1%
Financial Analysis CS: Sample Reports 27

Liberty Medical GroupStatement of Income - Industry Comparison
621111 - Offices of Physicians (except Mental Health Specialists)
SalesCost of SalesGross Profit
Operating ExpensesOperating Profit
Other Expenses
Earnings Before Taxes
2008
$8,079,445$0
$8,079,445
$7,945,326
$134,119
$16,360
$45,458
% Sales
100.0%0.0%
100.0%
98.3%
1.7%
0.2%
0.6%
Industry
100.0%N/A
100.0%
91.2%
8.8%
0.8%
7.9%
Variance
0.0%0.0%
0.0%
7.1%
-7.1%
-0.6%
-7.3%
28 Financial Analysis CS: Sample Reports

Liberty Medical GroupRatio Analysis - Industry Comparison
Liquidity Ratios
Current RatioQuick RatioSales to Working Capital
Activity Ratios
Accounts Receivable TurnoverDays Sales in ReceivablesInventory TurnoverDays Cost of Sales in InventoryAccounts Payable TurnoverDays Cost of Sales in PayablesSales to AssetsSales to Net Fixed AssetsNet Fixed Assets to Equity
Profitability Ratios
Percent Rate of Return on AssetsPercent Rate of Return on Equity
Coverage Ratios
Debt to EquityCash Flow to Current Maturities Long-Term DebtTimes Interest Earned
Expense to Sales Ratios
Percent Depreciation to SalesPercent Owners' Compensation to Sales
Liberty MedicalGroup
0.70.6
-40.0
60.06.10.00.00.00.06.6
19.64.3
3.747.8
11.81.31.6
1.535.3
Industry
0.90.8
-253.1
999.90.00.00.00.00.08.5
25.13.9
11.148.2
10.41.44.6
1.730.4
% Variance
-22.2%-25.0%-84.2%
-94.0%0.0%0.0%0.0%0.0%0.0%
-22.4%-21.9%10.3%
-66.7%-0.8%
13.5%-7.1%
-65.2%
-11.8%16.1%
Financial Analysis CS: Sample Reports 29

Quick Analysis Financial Reports
30 Financial Analysis CS: Sample Reports

Liberty Medical GroupDetailed Ratio Analysis - Industry Comparison
Liquidity ratios measure a company’s ability to meet its maturing short-term obligations. In other words, can a company quickly convert its assets to cash without a loss in value if necessary to meet its short-term obligations? Favorable liquidity ratios are critical to a company and its creditors within a business or industry that does not provide a steady and predictable cash flow. They are also a key predictor of a company’s ability to make timely payments to creditors and to continue to meet obligations to lenders when faced with an unforeseen event.
Current RatioCurrent Assets / Current Liabilities
This ratio reflects the number of times short-term assets cover short-term liabilities and is a fairly accurate indication of a company's ability to service its current obligations. A higher number is preferred because it indicates a strong ability to service short-term obligations. The composition of current assets is a key factor in the evaluation of this ratio. Depending on the type of business or industry, current assets may include slow-moving inventories that could potentially affect analysis of a company's liquidity how long could it potentially take to convert raw materials and inventory into finished products? (For this reason, the quick ratio may be preferable to the current ratio because it eliminates inventory and prepaid expenses from this ratio for a more accurate gauge of a company's liquidity and ability to meet short-term obligations.)
The current ratio for Liberty Medical Group is 0.74, which compared to the baseline of 0.90 indicates the company's ability to service short-term obligations is not satisfactory.
Quick Ratio(Cash + Marketable Securities + Trade Accounts Receivable) / Current Liabilities
This ratio, also known as the acid test ratio, measures immediate liquidity - the number of times cash, accounts receivable, and marketable securities cover short-term obligations. A higher number is preferred because it suggests a company has a strong ability to service short-term obligations. This ratio is a more reliable variation of the Current ratio because inventory, prepaid expenses, and other less liquid current assets are removed from the calculation.
Financial Analysis CS: Sample Reports 31

Liberty Medical GroupDetailed Ratio Analysis - Industry Comparison
The quick ratio for Liberty Medical Group is 0.60, which compared to the baseline of 0.80 indicates the company's ability to service short-term obligations is unfavorable.
Sales to Working CapitalSales / (Current Assets - Current Liabilities)
This ratio measures a company's ability to finance current operations. Working capital (current assets - current liabilities) is another measure of liquidity and the ability to cover short-term obligations. This ratio relates the ability of a company to generate sales using its working capital to determine how efficiently working capital is being used. In general, a lower number is preferred because it indicates a company has a satisfactory level of working capital. However, an exceptionally low number may indicate inadequate sales levels are being generated.
The sales to working capital ratio for Liberty Medical Group is -39.98, which compared to the baseline of -253.10 reveals that the company may want to make an effort to improve its working capital position.
The following list includes several suggestions Liberty Medical Group should consider to improve the liquidity ratios:
Reduce days in accounts receivable to improve current assets by evaluating accounts receivable on amore frequent basis and take a more assertive stance in the collection of accounts receivable anddelinquent accounts.
Prepare thorough cash forecasts and evaluate the company's ability to meet goals on a regular basis.Consider paying off short-term obligations if the cash position of the company is favorable.Consider converting short-term debt to long-term debt.Reduce levels of non-moving inventory.
32 Financial Analysis CS: Sample Reports

Liberty Medical GroupDetailed Ratio Analysis - Industry Comparison
Activity ratios provide a useful gauge of a company's operations by determining, for example, the average number of days it takes to collect on customer accounts and the average number of days to pay vendors. A key point to keep in mind when evaluating these ratios is that seasonal fluctuations are not necessarily reflected in the numbers that are derived from these calculations based on an account balance on one single day.
The following list includes several suggestions Liberty Medical Group should consider to improve the accounts receivable turnover and days sales in receivables ratios:
Prepare aging schedules to determine how long receivables have been outstanding. The companyshould review these on a regular basis to look for patterns in delinquent accounts. Communicate withcustomers and apply increasing pressure to pay as the number of days outstanding increases.
Develop a strategy to deal with problem customers and delinquent accounts.Invoice customers in a timely manner.Enforce credit policies to require credit references of new customers; to evaluate the credit currently
extended to each customer, and to update credit terms for your valuable and problem customer accordingly.
Implement customer incentives to encourage prompt payment such as discounts and additionalproducts.
Sales to AssetsSales / Total Assets
This ratio measures a company's ability to produce sales in relation to total assets to determine the effectiveness of the company's asset base in producing sales. A higher number is preferred, indicating that a company is using its assets to successfully generate sales. This ratio does not take into account the depreciation methods employed by each company and should not be the only measure of effectiveness of a company in this area.
Sales to assets for Liberty Medical Group is 6.64, which compared to the baseline of 8.50 indicates the company's performance in this area is lacking and management should consider taking measures to improve this ratio.
Sales to Net Fixed AssetsSales / (Property and Equipment - Accumulated Depreciation)
Financial Analysis CS: Sample Reports 33

Liberty Medical GroupDetailed Ratio Analysis - Industry Comparison
This ratio measures a company's ability to effectively utilize its fixed assets to generate sales. This ratio is similar to the sales to assets ratio, but it excludes current assets, long-term investments, intangible assets, and other non-current assets. A higher number is desired, indicating that a company productively uses its fixed assets to produce sales. This ratio does not take into account the depreciation methods employed by each company and should not be the only measure of effectiveness of a company in this area. In addition, fixed assets that are almost fully depreciated, and labor-intensive operations may interfere with the interpretation of this ratio.
Sales to net fixed assets for Liberty Medical Group is 19.59, which compared to the baseline of 25.10 indicates the company is not making use of its fixed assets to effectively generate sales.
The following list includes several suggestions Liberty Medical Group should consider to improve the sales to assets and sales to fixed assets ratios:
Consider leasing rather than purchasing assets, or consider purchasing used equipment.Carefully evaluate all asset purchases to determine how the asset will directly and indirectly affect
sales. Be sure to consider maintenance costs, warranties, salvage values, and the impact of changingtechnology in relation to the purchase of new equipment.
Consider liquidating under-utilized assets or developing alternative uses to generate revenue fromunder-utilized assets.
Maintain detailed records for all assets the company currently owns or leases.Ensure all equipment is properly maintained and evaluate its overall condition and effectiveness
within operations at least once a year.Eliminate any unnecessary, extravagant assets. Assets should have a direct or indirect impact on
sales.Set monthly or quarterly sales goals and provide incentives to salespeople.Create customer promotions, offer discounts and expand product lines to encourage sales.
Net Fixed Assets to Equity(Property and Equipment - Accumulated Depreciation) / Total Equity
This ratio measures the extent to which investors' capital was used to finance productive assets. A lower ratio indicates a proportionally smaller investment in fixed assets in relation to net worth, which is desired by creditors in case of liquidation. Note that this ratio could appear deceptively low if a significant number of a company's fixed assets are leased.
34 Financial Analysis CS: Sample Reports

Liberty Medical GroupDetailed Ratio Analysis - Industry Comparison
Net fixed assets to equity for Liberty Medical Group is 4.34, which compared to the baseline of 3.90 indicates the company's performance may be insufficient in this area.
Financial Analysis CS: Sample Reports 35

Liberty Medical GroupDetailed Ratio Analysis - Industry Comparison
Profitability ratios measure a company’s ability to use its capital or assets to generate profits. Improving profitability is a constant challenge for all companies and their management. Evaluating profitability ratios is a key component in determining the success of a company. It is important to note that all profitability ratio calculations are based on earnings before taxes.
Percent Rate of Return on AssetsEarnings before Taxes / Total Assets * 100
This ratio measures how effectively a company's assets are being used to generate profits. It is one of the most important ratios when evaluating the success of a business. A higher number reflects a well managed company with a healthy return on assets. Heavily depreciated assets, a large number of intangible assets, or any unusual income or expenses can easily distort this calculation.
The percent rate of return on assets for Liberty Medical Group is 3.74%, which compared to the baseline of 11.10% indicates there is a need for improvement in this area to ensure the company can remain competitive and continue to operate successfully.
Percent Rate of Return on EquityEarnings before Taxes / Total Equity * 100
This ratio expresses the rate of return on equity capital employed and measures the ability of a company's management to realize an adequate return on the capital invested by the owners in a company. A higher number is preferred for this commonly analyzed ratio.
The percent rate of return on equity for Liberty Medical Group is 47.84%, which compared to the baseline of 48.20% indicates management may not be effectively managing the profits earned based on the owners investment in the company.
The following list includes several suggestions Liberty Medical Group should consider to improve the profitability ratios:
Require management to utilize budgets to track expenses on a regular basis, and identify those thatare out of line. Assign specific individuals or departments to be responsible for different cost centers.
36 Financial Analysis CS: Sample Reports
Liberty Medical GroupDetailed Ratio Analysis - Industry Comparison
Reduce operating costs. In general, one dollar saved in expense is worth at least three or four extrasales dollars generated.
Negotiate with vendors to lower costs and have companies submit bids for large capital expenditures.Consider leasing instead of purchasing assets or consider purchasing used equipment.Consider liquidating under-utilized assets or creating alternative uses to generate revenue from under
-utilized assets.Coverage ratios assess a company’s ability to meet its long-term obligations, remain solvent, and avoid bankruptcy. It measures how well a company’s cash flow covers its short-term financial obligations. Lenders evaluate coverage ratios to determine the degree to which a company could become vulnerable when faced with economic downturns. A company with a high level of debt poses a higher risk to long-term creditors and investors.
Debt to EquityTotal Liabilities / Total Equity
This ratio measures the financial leverage of a company by indicating what proportion of debt and equity a company is using to finance its assets. A lower number suggests there is both a lower risk involved for creditors and strong, long-term, financial security for a company.
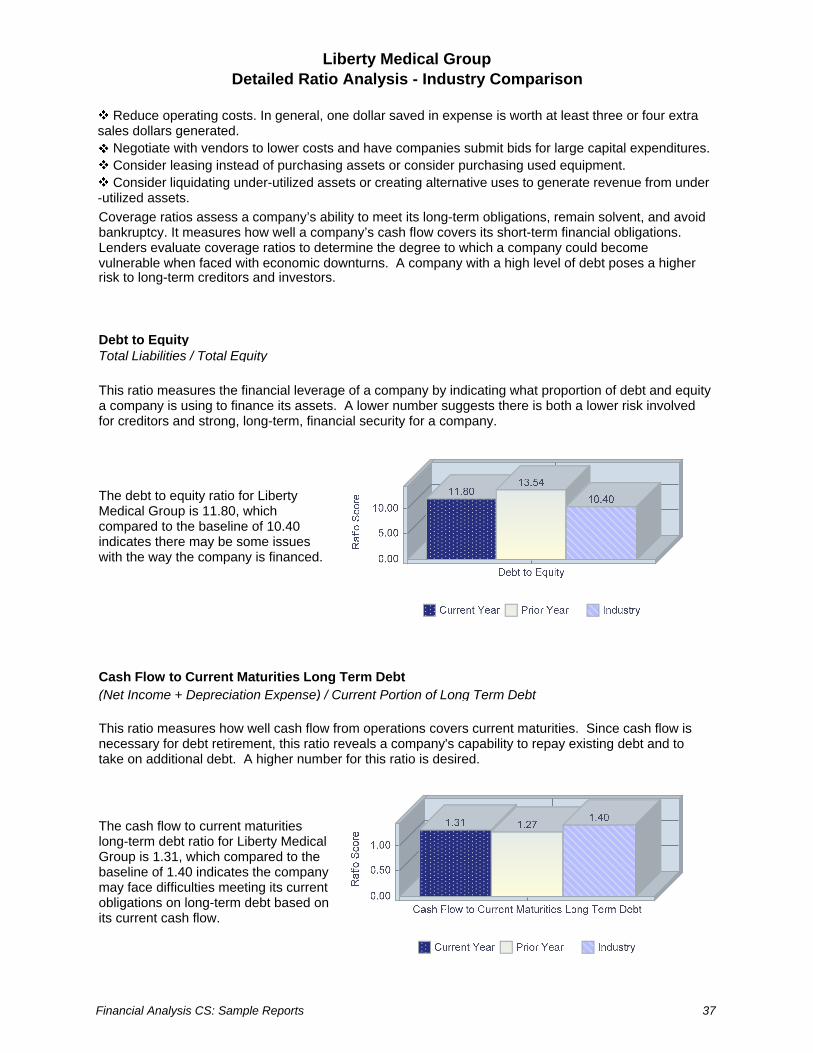
The debt to equity ratio for Liberty Medical Group is 11.80, which compared to the baseline of 10.40 indicates there may be some issues with the way the company is financed.
Cash Flow to Current Maturities Long Term Debt(Net Income + Depreciation Expense) / Current Portion of Long Term Debt
This ratio measures how well cash flow from operations covers current maturities. Since cash flow is necessary for debt retirement, this ratio reveals a company's capability to repay existing debt and to take on additional debt. A higher number for this ratio is desired.
The cash flow to current maturities long-term debt ratio for Liberty Medical Group is 1.31, which compared to the baseline of 1.40 indicates the company may face difficulties meeting its current obligations on long-term debt based on its current cash flow.
Financial Analysis CS: Sample Reports 37
Liberty Medical GroupDetailed Ratio Analysis - Industry Comparison
Times Interest EarnedEarnings before Interest and Taxes / Interest Expense
This ratio measures a company's ability to meet interest payments. A higher number is preferred, suggesting a company can easily meet interest obligations and can potentially take on additional debt. Note that this particular ratio uses earnings before interest and taxes because this is the income amount available to cover interest.
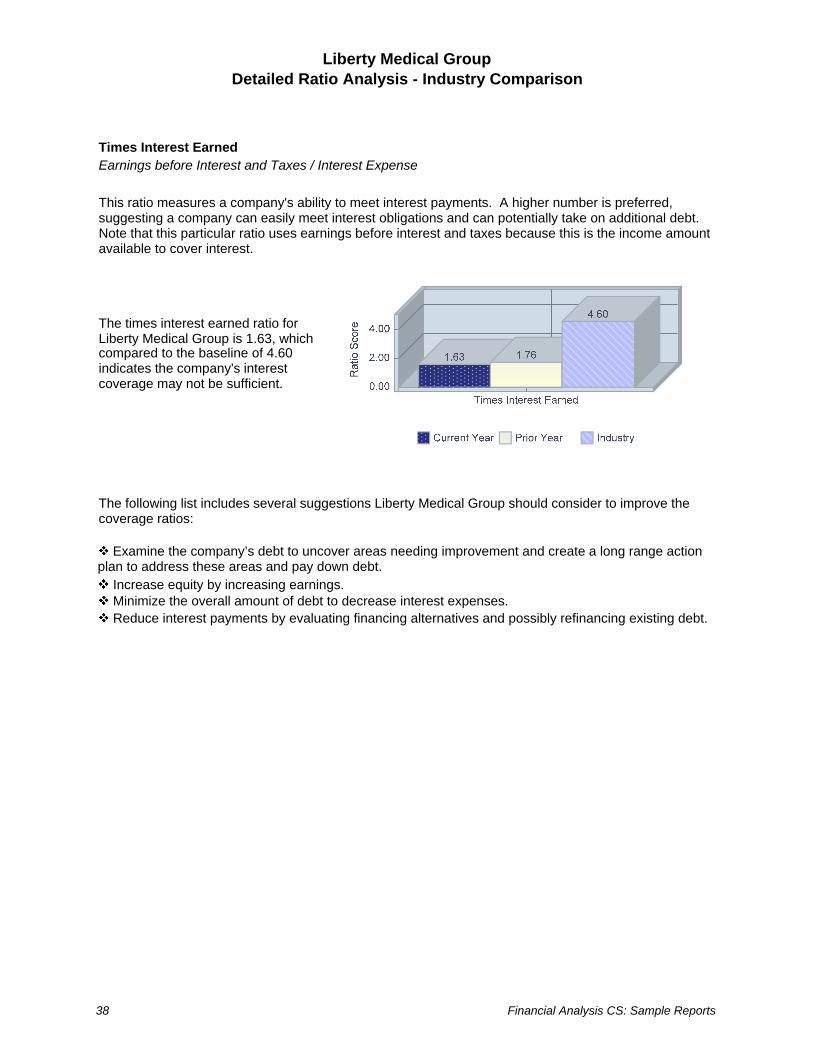
The times interest earned ratio for Liberty Medical Group is 1.63, which compared to the baseline of 4.60 indicates the company's interest coverage may not be sufficient.
The following list includes several suggestions Liberty Medical Group should consider to improve the coverage ratios:
Examine the company’s debt to uncover areas needing improvement and create a long range actionplan to address these areas and pay down debt.
Increase equity by increasing earnings.Minimize the overall amount of debt to decrease interest expenses.Reduce interest payments by evaluating financing alternatives and possibly refinancing existing debt.
38 Financial Analysis CS: Sample Reports

Liberty Medical GroupDetailed Ratio Analysis - Industry Comparison
Expense to sales ratios express specific expense items as a percentage of net sales. Comparisons of expenses are more meaningful because net sales is used as a constant. Extreme variations in these ratios are most pronounced between capital- and labor-intensive industries.
Percent Depreciation to SalesDepreciation Expense / Sales * 100
This ratio measures depreciation expense as a percentage of sales and is based on a company's fixed assets and how quickly they are being depreciated or amortized, relative to sales. Any depletion expenses should be included in this ratio as well. Note that depreciation methods should also be considered when evaluating this ratio.
The percent depreciation to sales for Liberty Medical Group is 1.51%, which compared to the baseline of 1.70% indicates the company is performing well in this area.
Percent Owners Compensation to SalesOwners Compensation / Sales * 100
This ratio measures owners' compensation (which includes salaries, bonuses, commissions, drawings of partners, etc.) as a percentage of sales. The desired percentage may vary between companies depending on their individual goals.
The percent owners' compensation to sales for Liberty Medical Group is 35.32%, which compared to the baseline of 30.40% indicates the company may not be performing as desired in this area.
Financial Analysis CS: Sample Reports 39

Quick Analysis Financial Reports
40 Financial Analysis CS: Sample Reports

Liberty Medical GroupBalance Sheet - Group Comparison
621111 - Offices of Physicians (except Mental Health Specialists)
Assets
Cash & EquivalentsTrade Accounts ReceivableInventoryOther Current AssetsTotal Current Assets
Long-Term InvestmentsNet Fixed AssetsIntangible AssetsOther Non-Current Assets
Total Assets
Liabilities
Accounts PayableNotes PayableAccrued LiabilitiesIncome Taxes PayableCurrent Portion of Long-Term DebtTotal Current Liabilities
Long-Term DebtOther Long-Term Liabilities
Total Long-Term Liabilities
Total Liabilities
Retained EarningsTotal Equity
Total Liabilities and Equity
2008
$336,818$134,569$12,985$98,323
$582,695
$81,197$412,458$61,874$78,390
$1,216,614
$42,787$88,247
$532,506$10,014
$111,238$784,792
$281,809$55,000
$336,809
$1,121,601
$95,013$95,013
$1,216,614
% Assets
27.7%11.1%1.1%8.1%
47.9%
6.7%33.9%5.1%6.4%
100.0%
3.5%7.3%
43.8%0.8%9.1%
64.5%
23.2%4.5%
27.7%
92.2%
7.8%7.8%
100.0%
Peer Group
27.4%11.4%1.1%8.0%
47.9%
6.9%33.9%4.9%6.4%
100.0%
3.5%7.1%
43.8%0.8%9.2%
64.5%
23.0%4.5%
27.5%
92.0%
8.0%8.0%
100.0%
Variance
0.3%-0.3%0.0%0.1%
0.0%
-0.2%0.0%0.2%0.0%
0.0%
0.0%0.2%0.0%0.0%
-0.1%0.0%
0.2%0.0%
0.2%
0.2%
-0.2%-0.2%
0.0%
Financial Analysis CS: Sample Reports 41

Liberty Medical GroupStatement of Income - Group Comparison
621111 - Offices of Physicians (except Mental Health Specialists)
SalesCost of SalesGross Profit
Operating ExpensesOperating Profit
Other IncomeOther ExpensesEarnings Before Interest and Taxes
Interest ExpenseEarnings Before Taxes
Provision for Income Taxes
Net Income
Additional InformationOwners CompensationDepreciation ExpenseSelling Expenses
2008
$8,079,445$0
$8,079,445
$7,945,326
$134,119
$0$16,360
$117,759
$72,301
$45,458
$21,877
$23,581
$2,853,654$122,001
$0
% Sales
100.0%0.0%
100.0%
98.3%
1.7%
0.0%0.2%
1.5%
0.9%
0.6%
0.3%
0.3%
35.3%1.5%0.0%
Peer Group
100.0%0.0%
100.0%
98.4%
1.6%
0.0%0.2%
1.4%
0.9%
0.5%
0.3%
0.2%
35.3%1.5%0.0%
Variance
0.0%0.0%
0.0%
-0.1%
0.1%
0.0%0.0%
0.1%
0.0%
0.1%
0.0%
0.1%
0.0%0.0%0.0%
42 Financial Analysis CS: Sample Reports

Liberty Medical GroupRatio Analysis - Group Comparison
Liquidity Ratios
Current RatioQuick RatioDefensive Interval DaysAccounts Receivable to Working CapitalInventory to Working CapitalLong-Term Liabilities to Working CapitalSales to Working Capital
Activity Ratios
Accounts Receivable TurnoverDays Sales in ReceivablesInventory TurnoverDays Cost of Sales in InventoryAccounts Payable TurnoverDays Cost of Sales in PayablesOperating Cycle DaysSales to AssetsSales to Net Fixed AssetsPercent Depreciation Expense to Fixed AssetsPercent Accumulated Depreciation to Fixed AssetsNet Fixed Assets to Equity
Profitability Ratios
Percent Gross ProfitPercent Profit Margin on SalesPercent Rate of Return on AssetsPercent Rate of Return on EquityPrice Earnings RatioEarnings Per Share
Coverage Ratios
Debt to Total AssetsPercent Owners' EquityEquity MultiplierDebt to EquityCash Flow to Current Maturities Long-Term DebtTimes Interest EarnedBook Value Per Share
Expense to Sales Ratios
Percent Depreciation to SalesPercent Owners' Compensation to Sales
Liberty MedicalGroup
0.70.6
22.3-0.7-0.1-1.7
-40.0
60.06.10.00.00.00.06.16.6
19.625.214.84.3
100.00.63.7
47.80.00.0
0.97.8
12.811.81.31.60.0
1.535.3
Peer Group
0.70.6
22.8-0.7-0.1-1.7
-39.2
57.26.40.00.00.00.06.46.5
19.124.614.84.3
100.00.53.3
40.90.00.0
0.98.0
12.611.61.21.60.0
1.535.3
% Variance
0.0%0.0%
-2.2%0.0%0.0%0.0%2.0%
4.9%-4.7%0.0%0.0%0.0%0.0%
-4.7%1.5%2.6%2.4%0.0%0.0%
0.0%20.0%12.1%16.9%0.0%0.0%
0.0%-2.5%1.6%1.7%8.3%0.0%0.0%
0.0%0.0%
Financial Analysis CS: Sample Reports 43

Quick Analysis Financial Reports
44 Financial Analysis CS: Sample Reports
Liberty Medical GroupDetailed Ratio Analysis - Group Comparison
Liquidity ratios measure a company’s ability to meet its maturing short-term obligations. In other words, can a company quickly convert its assets to cash without a loss in value if necessary to meet its short-term obligations? Favorable liquidity ratios are critical to a company and its creditors within a business or industry that does not provide a steady and predictable cash flow. They are also a key predictor of a company’s ability to make timely payments to creditors and to continue to meet obligations to lenders when faced with an unforeseen event.
Current RatioCurrent Assets / Current Liabilities
This ratio reflects the number of times short-term assets cover short-term liabilities and is a fairly accurate indication of a company's ability to service its current obligations. A higher number is preferred because it indicates a strong ability to service short-term obligations. The composition of current assets is a key factor in the evaluation of this ratio. Depending on the type of business or industry, current assets may include slow-moving inventories that could potentially affect analysis of a company's liquidity how long could it potentially take to convert raw materials and inventory into finished products? (For this reason, the quick ratio may be preferable to the current ratio because it eliminates inventory and prepaid expenses from this ratio for a more accurate gauge of a company's liquidity and ability to meet short-term obligations.)
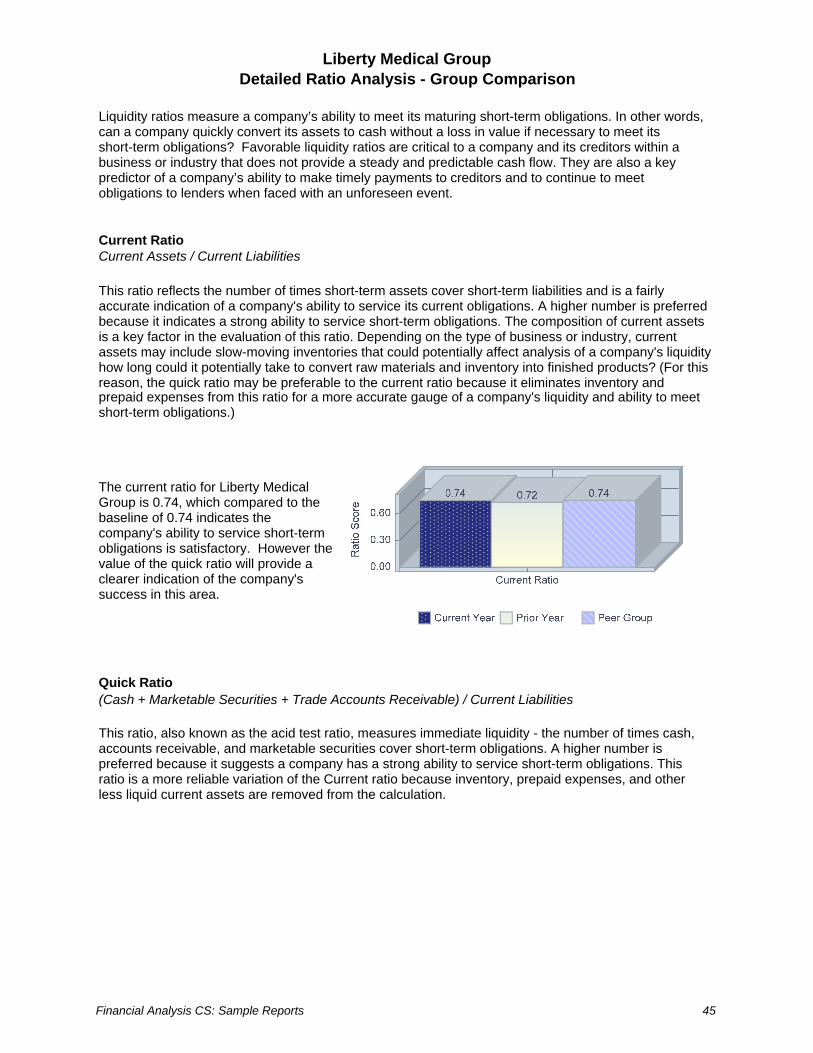
The current ratio for Liberty Medical Group is 0.74, which compared to the baseline of 0.74 indicates the company's ability to service short-term obligations is satisfactory. However the value of the quick ratio will provide a clearer indication of the company's success in this area.
Quick Ratio(Cash + Marketable Securities + Trade Accounts Receivable) / Current Liabilities
This ratio, also known as the acid test ratio, measures immediate liquidity - the number of times cash, accounts receivable, and marketable securities cover short-term obligations. A higher number is preferred because it suggests a company has a strong ability to service short-term obligations. This ratio is a more reliable variation of the Current ratio because inventory, prepaid expenses, and other less liquid current assets are removed from the calculation.
Financial Analysis CS: Sample Reports 45

Liberty Medical GroupDetailed Ratio Analysis - Group Comparison
The quick ratio for Liberty Medical Group is 0.60, which compared to the baseline of 0.60 indicates the company's ability to service short-term obligations is favorable.
Defensive Interval Days(Cash + Marketable Securities + Trade Accounts Receivable) / ((Operating Expenses - Other Expenses - Interest Expense - Provision for Income Taxes - Depreciation Expense) / Days)
This ratio gauges the threat of insolvency for investors by calculating the number of days a company can operate without any cash returns while meeting its basic operational costs. In general, this number should be between 30 to 90 days.
Defensive interval days for Liberty Medical Group is 22.31 days that indicates that the company's degree of protection against insolvency may not be ideal.
Altman Z score Retail(((Current Assets - Current Liabilities) / Total Assets) * 6.6) + ((Total Equity / Total Assets) * 3.3) + ((Earnings before Interest and Taxes / Total Assets) * 6.7) + ((Total Equity / Total Liabilities) * 1.0)
This ratio represents a numerical ranking that predicts the potential for bankruptcy of a retail company. In general, the lower the score, the higher the odds of bankruptcy. Companies with Z-Scores above 3 are considered to be healthy and therefore, unlikely to enter bankruptcy.
46 Financial Analysis CS: Sample Reports

Liberty Medical GroupDetailed Ratio Analysis - Group Comparison
The Altman Z score for Liberty Medical Group is -0.11 that indicates the company may have a relatively low degree of protection against bankruptcy.
Altman Z score Manufacturing(((Current Assets - Current Liabilities) / Total Assets) * 0.717) + ((Total Equity / Total Assets) * 0.847) + ((Earnings before Interest and Taxes / Total Assets) * 3.107) + ((Total Equity / Total Liabilities) * 0.42) + ((Sales / Total Assets) * 0.998)
This ratio represents a numerical ranking that predicts the potential for bankruptcy of a manufacturing company. In general, the lower the score, the higher the odds of bankruptcy. Companies with Z-Scores above 3 are considered to be healthy and therefore unlikely to enter bankruptcy.
The Altman Z score for Liberty Medical Group is 6.91 that indicates the company has a relatively high degree of protection against bankruptcy.
Accounts Receivable to Working CapitalTrade Accounts Receivable / (Current Assets - Current Liabilities)
This ratio measures the dependency of working capital on the collection of receivables. A lower number for this ratio is preferred, indicating that a company has a satisfactory level of working capital and accounts receivable makes up an appropriate portion of current assets.
Financial Analysis CS: Sample Reports 47

Liberty Medical GroupDetailed Ratio Analysis - Group Comparison
The accounts receivable to working capital ratio for Liberty Medical Group is -0.67, which compared to the baseline of -0.69 indicates the company's performance may be insufficient in this area.
Inventory to Working CapitalInventory / (Current Assets - Current Liabilities)
This ratio measures the dependency of working capital on inventory. A lower number for this ratio is preferred indicating that a company has a satisfactory level of working capital and inventory makes up a reasonable portion of current assets.
The inventory to working capital ratio for Liberty Medical Group is -0.06, which compared to the baseline of -0.07 indicates this ratio may not be in line with company goals.
Long Term Liabilities to Working CapitalLong Term Liabilities / (Current Assets - Current Liabilities)
This ratio measures the degree to which a company's long-term debt has been used to replenish working capital versus fixed asset acquisition.
The long-term liabilities to working capital ratio for Liberty Medical Group is -1.67, which compared to the baseline of -1.67 indicates the value of this ratio is meeting the company's expectations.
48 Financial Analysis CS: Sample Reports

Liberty Medical GroupDetailed Ratio Analysis - Group Comparison
Sales to Working CapitalSales / (Current Assets - Current Liabilities)
This ratio measures a company's ability to finance current operations. Working capital (current assets - current liabilities) is another measure of liquidity and the ability to cover short-term obligations. This ratio relates the ability of a company to generate sales using its working capital to determine how efficiently working capital is being used. In general, a lower number is preferred because it indicates a company has a satisfactory level of working capital. However, an exceptionally low number may indicate inadequate sales levels are being generated.
The sales to working capital ratio for Liberty Medical Group is -39.98, which compared to the baseline of -39.22 reveals that the company's level of working capital is strong. The company may want to make an effort to generate additional sales using the available working capital.
The following list includes several suggestions Liberty Medical Group should consider to improve the liquidity ratios:
Reduce days in accounts receivable to improve current assets by evaluating accounts receivable on amore frequent basis and take a more assertive stance in the collection of accounts receivable anddelinquent accounts.
Prepare thorough cash forecasts and evaluate the company's ability to meet goals on a regular basis.Consider paying off short-term obligations if the cash position of the company is favorable.Consider converting short-term debt to long-term debt.Reduce levels of non-moving inventory.
Financial Analysis CS: Sample Reports 49

Liberty Medical GroupDetailed Ratio Analysis - Group Comparison
Activity ratios provide a useful gauge of a company's operations by determining, for example, the average number of days it takes to collect on customer accounts and the average number of days to pay vendors. A key point to keep in mind when evaluating these ratios is that seasonal fluctuations are not necessarily reflected in the numbers that are derived from these calculations based on an account balance on one single day.
Accounts Receivable TurnoverSales / Trade Accounts Receivable
This ratio measures the number of times receivables turn over in a year and reveals how successful a company is in collecting its outstanding receivables. A higher number is preferred because it indicates a shorter time between sales and cash collection.
The accounts receivable turnover for Liberty Medical Group is 60.04, which compared to the baseline of 57.17 indicates this ratio is on target with company objectives.
Days Sales in ReceivablesTrade Accounts Receivable / (Sales / Days)
This ratio measures the average number of days a company's receivables are outstanding. A lower number of days is desired. An increase in the number of days receivables are outstanding indicates an increased possibility of late payment by customers. Companies should attempt to reduce the number of days sales in receivables in order to increase cash flow. The general rule used is that the time allowed for payment by the selling terms should not be exceeded by more than 10 or 15 days.
The days sales in receivables for Liberty Medical Group is 6.08 days that indicates the company is effective in collecting outstanding receivables.
Operating Cycle Days(Inventory / (Cost of Sales / Days)) + (Trade Accounts Receivable / (Sales / Days))
50 Financial Analysis CS: Sample Reports

Liberty Medical GroupDetailed Ratio Analysis - Group Comparison
This ratio calculates the total conversion period for a company, or in other words, the average number of days it takes to convert inventory into cash from sales. It is calculated by adding together the days cost of sales in inventory to the days sales in receivables. Evaluating this ratio can be helpful in gauging the effectiveness of marketing, determining credit terms to extend to customers, and collecting outstanding accounts.
The operating cycle days for Liberty Medical Group is 6.08 days, which compared to the baseline of 6.40 days indicates the company is successfully minimizing the amount of time it takes to convert products and services into cash.
Sales to AssetsSales / Total Assets
This ratio measures a company's ability to produce sales in relation to total assets to determine the effectiveness of the company's asset base in producing sales. A higher number is preferred, indicating that a company is using its assets to successfully generate sales. This ratio does not take into account the depreciation methods employed by each company and should not be the only measure of effectiveness of a company in this area.
Sales to assets for Liberty Medical Group is 6.64, which compared to the baseline of 6.48 indicates the company is performing well in this area.
Sales to Net Fixed AssetsSales / (Property and Equipment - Accumulated Depreciation)
Financial Analysis CS: Sample Reports 51

Liberty Medical GroupDetailed Ratio Analysis - Group Comparison
This ratio measures a company's ability to effectively utilize its fixed assets to generate sales. This ratio is similar to the sales to assets ratio, but it excludes current assets, long-term investments, intangible assets, and other non-current assets. A higher number is desired, indicating that a company productively uses its fixed assets to produce sales. This ratio does not take into account the depreciation methods employed by each company and should not be the only measure of effectiveness of a company in this area. In addition, fixed assets that are almost fully depreciated, and labor-intensive operations may interfere with the interpretation of this ratio.
Sales to net fixed assets for Liberty Medical Group is 19.59, which compared to the baseline of 19.13 indicates the company is making effective use of its fixed assets to generate sales.
Percent Depreciation Expense to Fixed AssetsDepreciation Expense / Property and Equipment * 100
This ratio measures the reasonableness and consistency of a company's depreciation expense over time.
The percent depreciation expense to fixed assets for Liberty Medical Group is 25.20%, which compared to the baseline of 24.60% indicates the value of this ratio may not be meeting the company's expectations.
Percent Accumulated Depreciation to Fixed AssetsAccumulated Depreciation / Property and Equipment * 100
This ratio measures the cumulative percentage of productive asset costs a company has allocated to operations.
52 Financial Analysis CS: Sample Reports
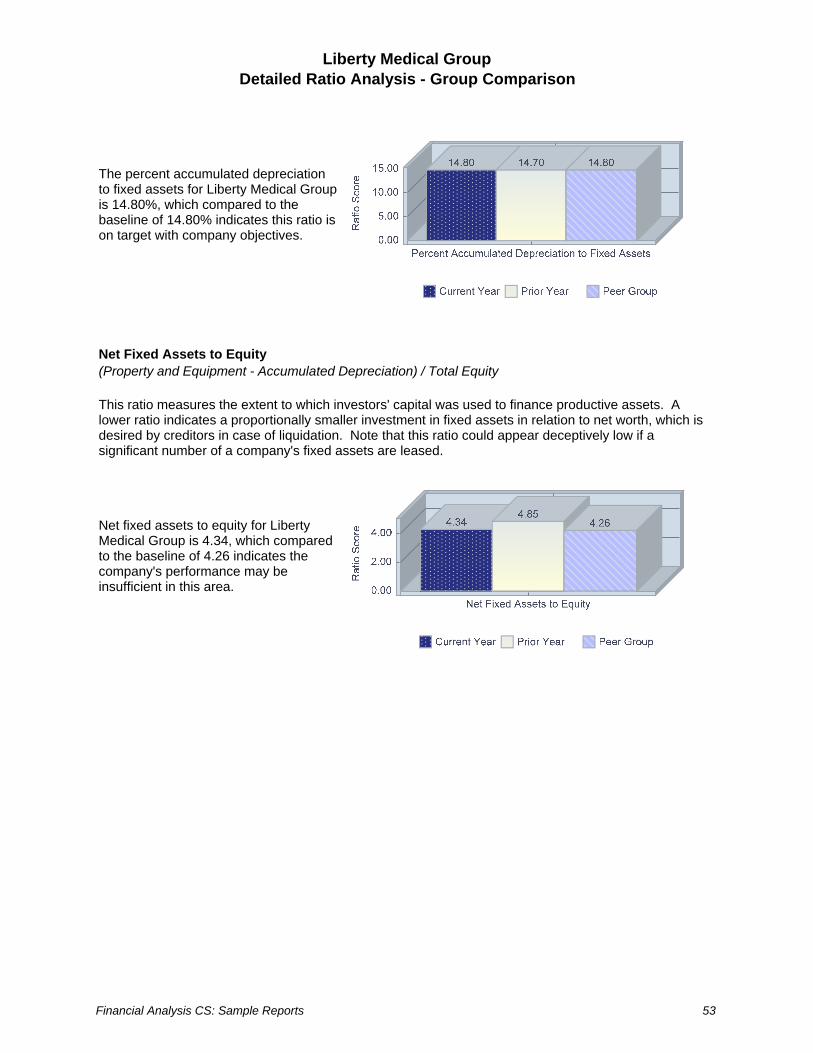
Liberty Medical GroupDetailed Ratio Analysis - Group Comparison
The percent accumulated depreciation to fixed assets for Liberty Medical Group is 14.80%, which compared to the baseline of 14.80% indicates this ratio is on target with company objectives.
Net Fixed Assets to Equity(Property and Equipment - Accumulated Depreciation) / Total Equity
This ratio measures the extent to which investors' capital was used to finance productive assets. A lower ratio indicates a proportionally smaller investment in fixed assets in relation to net worth, which is desired by creditors in case of liquidation. Note that this ratio could appear deceptively low if a significant number of a company's fixed assets are leased.
Net fixed assets to equity for Liberty Medical Group is 4.34, which compared to the baseline of 4.26 indicates the company's performance may be insufficient in this area.
Financial Analysis CS: Sample Reports 53

Liberty Medical GroupDetailed Ratio Analysis - Group Comparison
Profitability ratios measure a company’s ability to use its capital or assets to generate profits. Improving profitability is a constant challenge for all companies and their management. Evaluating profitability ratios is a key component in determining the success of a company. It is important to note that all profitability ratio calculations are based on earnings before taxes.
Percent Gross Profit((Sales - Cost of Sales) / Sales) * 100
This ratio measures the gross profit earned on sales and reports how much of each sales dollar is available to cover operating expenses and contribute to profits.
The percent gross profit for Liberty Medical Group is 100.00%, which compared to the baseline of 100.00% is a good indication of financial health for the company.
Percent Profit Margin on SalesEarnings before Taxes / Sales * 100
This ratio measures how much profit a company makes on each sales dollar received and how well a company could potentially deal with higher costs or lower sales in the future.
The percent profit margin on sales for Liberty Medical Group is 0.56%, which compared to the baseline of 0.51% indicates sales are significantly contributing to the company's bottom line.
Percent Rate of Return on AssetsEarnings before Taxes / Total Assets * 100
This ratio measures how effectively a company's assets are being used to generate profits. It is one of the most important ratios when evaluating the success of a business. A higher number reflects a well managed company with a healthy return on assets. Heavily depreciated assets, a large number of intangible assets, or any unusual income or expenses can easily distort this calculation.
54 Financial Analysis CS: Sample Reports

Liberty Medical GroupDetailed Ratio Analysis - Group Comparison
The percent rate of return on assets for Liberty Medical Group is 3.74%, which compared to the baseline of 3.28% indicates the company successfully utilizes its asset base to generate profits.
Percent Rate of Return on EquityEarnings before Taxes / Total Equity * 100
This ratio expresses the rate of return on equity capital employed and measures the ability of a company's management to realize an adequate return on the capital invested by the owners in a company. A higher number is preferred for this commonly analyzed ratio.
The percent rate of return on equity for Liberty Medical Group is 47.84%, which compared to the baseline of 40.92% indicates the company's management is performing effectively in this area.
Financial Analysis CS: Sample Reports 55

Liberty Medical GroupDetailed Ratio Analysis - Group Comparison
Coverage ratios assess a company’s ability to meet its long-term obligations, remain solvent, and avoid bankruptcy. It measures how well a company’s cash flow covers its short-term financial obligations. Lenders evaluate coverage ratios to determine the degree to which a company could become vulnerable when faced with economic downturns. A company with a high level of debt poses a higher risk to long-term creditors and investors.
Debt to Total AssetsTotal Liabilities / Total Assets
This ratio measures what proportion of debt a company is carrying relative to its assets. A ratio value greater than one indicates a company has more debt than assets. Naturally, companies and creditors prefer a lower number.
The debt to total assets ratio for Liberty Medical Group is 0.92, which compared to the baseline of 0.92 indicates the company should be able to withstand losses without harming creditor interests or could obtain additional financing if desired.
Percent Owners EquityTotal Equity / Total Assets * 100
This ratio measures what proportion of total assets was provided by the owners equity. The higher the number the more total capital has been contributed by owners and the less by creditors.
The percent owners' equity ratio for Liberty Medical Group is 7.81%, which compared to the baseline of 8.01% indicates the company may not own an adequate or large enough portion of its asset base.
Equity MultiplierTotal Assets / Total Equity
This ratio measures the extent to which a company uses debt to finance its assets. The higher the number is, the more a company is relying on debt to finance its assets.
56 Financial Analysis CS: Sample Reports

Liberty Medical GroupDetailed Ratio Analysis - Group Comparison
The equity multiplier for Liberty Medical Group is 12.80, which compared to the baseline of 12.56 indicates the company's assets are highly leveraged and the company could be considered a risk by creditors.
Debt to EquityTotal Liabilities / Total Equity
This ratio measures the financial leverage of a company by indicating what proportion of debt and equity a company is using to finance its assets. A lower number suggests there is both a lower risk involved for creditors and strong, long-term, financial security for a company.
The debt to equity ratio for Liberty Medical Group is 11.80, which compared to the baseline of 11.56 indicates there may be some issues with the way the company is financed.
Cash Flow to Current Maturities Long Term Debt(Net Income + Depreciation Expense) / Current Portion of Long Term Debt
This ratio measures how well cash flow from operations covers current maturities. Since cash flow is necessary for debt retirement, this ratio reveals a company's capability to repay existing debt and to take on additional debt. A higher number for this ratio is desired.
Financial Analysis CS: Sample Reports 57

Liberty Medical GroupDetailed Ratio Analysis - Group Comparison
The cash flow to current maturities long-term debt ratio for Liberty Medical Group is 1.31, which compared to the baseline of 1.24 indicates the company is in a strong position to meet its current obligations on long-term debt based on its current cash flow.
Times Interest EarnedEarnings before Interest and Taxes / Interest Expense
This ratio measures a company's ability to meet interest payments. A higher number is preferred, suggesting a company can easily meet interest obligations and can potentially take on additional debt. Note that this particular ratio uses earnings before interest and taxes because this is the income amount available to cover interest.
The times interest earned ratio for Liberty Medical Group is 1.63, which compared to the baseline of 1.57 indicates the company's interest coverage is sufficient.
The following list includes several suggestions Liberty Medical Group should consider to improve the coverage ratios:
Examine the company’s debt to uncover areas needing improvement and create a long range actionplan to address these areas and pay down debt.
Increase equity by increasing earnings.Minimize the overall amount of debt to decrease interest expenses.Reduce interest payments by evaluating financing alternatives and possibly refinancing existing debt.
58 Financial Analysis CS: Sample Reports

Liberty Medical GroupDetailed Ratio Analysis - Group Comparison
Expense to sales ratios express specific expense items as a percentage of net sales. Comparisons of expenses are more meaningful because net sales is used as a constant. Extreme variations in these ratios are most pronounced between capital- and labor-intensive industries.
Percent Depreciation to SalesDepreciation Expense / Sales * 100
This ratio measures depreciation expense as a percentage of sales and is based on a company's fixed assets and how quickly they are being depreciated or amortized, relative to sales. Any depletion expenses should be included in this ratio as well. Note that depreciation methods should also be considered when evaluating this ratio.
The percent depreciation to sales for Liberty Medical Group is 1.51%, which compared to the baseline of 1.51% indicates the company is performing well in this area.
Percent Owners Compensation to SalesOwners Compensation / Sales * 100
This ratio measures owners' compensation (which includes salaries, bonuses, commissions, drawings of partners, etc.) as a percentage of sales. The desired percentage may vary between companies depending on their individual goals.
The percent owners' compensation to sales for Liberty Medical Group is 35.32%, which compared to the baseline of 35.32% indicates the company is performing as desired in this area.
Financial Analysis CS: Sample Reports 59

Quick Analysis Financial Reports
60 Financial Analysis CS: Sample Reports

Liberty Medical GroupBalance Sheet - Five-Year Trend Analysis
Assets
Cash & EquivalentsTrade Accounts ReceivableInventoryOther Current AssetsTotal Current Assets
Long-Term InvestmentsNet Fixed AssetsIntangible AssetsOther Non-Current Assets
Total Assets
Liabilities
Accounts PayableNotes PayableAccrued LiabilitiesIncome Taxes PayableCurrent Portion of Long-Term DebtTotal Current Liabilities
Long-Term DebtOther Long-Term Liabilities
Total Long-Term Liabilities
Total Liabilities
Retained EarningsTotal Equity
Total Liabilities and Equity
2008
$336,818$134,569$12,985$98,323
$582,695
$81,197$412,458$61,874$78,390
$1,216,614
$42,787$88,247
$532,506$10,014
$111,238$784,792
$281,809$55,000
$336,809
$1,121,601
$95,013$95,013
$1,216,614
2007
$319,978$127,841$13,657$94,325
$555,801
$77,137$383,750$58,780$74,471
$1,149,939
$32,658$83,835
$530,190$9,115
$115,676$771,474
$263,352$36,000
$299,352
$1,070,826
$79,113$79,113
$1,149,939
2006
$313,578$125,284$13,384$92,439
$544,685
$75,594$366,088$57,605$72,981
$1,116,953
$36,777$88,142
$484,929$8,905
$117,995$736,748
$266,740$37,000
$303,740
$1,040,488
$76,465$76,465
$1,116,953
2005
$310,378$124,005$13,247$91,495
$539,125
$74,823$373,140$57,017$72,236
$1,116,341
$37,730$85,498
$470,382$8,638
$120,687$722,935
$270,240$38,000
$308,240
$1,031,175
$85,166$85,166
$1,116,341
2004
$303,978$121,449$12,974$89,609
$528,010
$73,280$379,580$55,841$70,747
$1,107,458
$39,383$81,223
$446,861$8,206
$124,596$700,269
$275,560$39,000
$314,560
$1,014,829
$92,629$92,629
$1,107,458
Financial Analysis CS: Sample Reports 61

Liberty Medical GroupStatement of Income - Five-Year Trend Analysis
SalesCost of SalesGross Profit
Operating ExpensesOperating Profit
Other IncomeOther ExpensesEarnings Before Interest and Taxes
Interest ExpenseEarnings Before Taxes
Provision for Income Taxes
Net Income
Additional InformationOwners CompensationDepreciation ExpenseSelling Expenses
2008
$8,079,445$0
$8,079,445
$7,945,326
$134,119
$0$16,360
$117,759
$72,301
$45,458
$21,877
$23,581
$2,853,654$122,001
$0
2007
$7,756,268$0
$7,756,268
$7,620,193
$136,075
$0$15,542
$120,533
$68,439
$52,094
$21,070
$31,024
$2,796,581$115,901
$0
2006
$7,601,142$0
$7,601,142
$7,453,119
$148,023
$0$15,231
$132,792
$67,071
$65,721
$20,649
$45,072
$2,810,564$113,583
$0
2005
$7,523,579$0
$7,523,579
$7,369,162
$154,417
$0$15,076
$139,341
$66,386
$72,955
$20,438
$52,517
$2,768,615$112,424
$0
2004
$7,445,102$0
$7,445,102
$7,295,736
$149,366
$0$14,749
$134,617
$64,949
$69,668
$19,995
$49,673
$2,712,683$115,437
$0
62 Financial Analysis CS: Sample Reports

Liberty Medical GroupRatio Analysis - Five-Year Trend Analysis
Liquidity Ratios
Current RatioQuick RatioDefensive Interval DaysAccounts Receivable to Working CapitalInventory to Working CapitalLong-Term Liabilities to Working CapitalSales to Working Capital
Activity Ratios
Accounts Receivable TurnoverDays Sales in ReceivablesInventory TurnoverDays Cost of Sales in InventoryAccounts Payable TurnoverDays Cost of Sales in PayablesOperating Cycle DaysSales to AssetsSales to Net Fixed AssetsPercent Depreciation Expense to Fixed AssetsPercent Accumulated Depreciation to Fixed AssetsNet Fixed Assets to Equity
Profitability Ratios
Percent Gross ProfitPercent Profit Margin on SalesPercent Rate of Return on AssetsPercent Rate of Return on EquityPrice Earnings RatioEarnings Per Share
Coverage Ratios
Debt to Total AssetsPercent Owners' EquityEquity MultiplierDebt to EquityCash Flow to Current Maturities Long Term DebtTimes Interest EarnedBook Value Per Share
Expense to Sales Ratios
Percent Depreciation to SalesPercent Owners' Compensation to Sales
2008
0.70.6
22.3-0.7-0.1-1.7
-40.0
60.06.10.00.00.00.06.16.6
19.625.214.84.3
100.00.63.7
47.80.00.0
0.97.8
12.811.81.31.60.0
1.535.3
2007
0.70.6
22.1-0.6-0.1-1.4
-36.0
60.76.00.00.00.00.06.06.7
20.225.814.74.9
100.00.74.5
65.80.00.0
0.96.9
14.513.51.31.80.0
1.536.1
2006
0.70.6
22.1-0.7-0.1-1.6
-39.6
60.76.00.00.00.00.06.06.8
20.826.514.74.8
100.00.95.9
85.90.00.0
0.96.8
14.613.61.32.00.0
1.537.0
2005
0.70.6
22.2-0.7-0.1-1.7
-40.9
60.76.00.00.00.00.06.06.7
20.226.312.94.4
100.01.06.5
85.70.00.0
0.97.6
13.112.11.42.10.0
1.536.8
2004
0.80.6
21.9-0.7-0.1-1.8
-43.2
61.36.00.00.00.00.06.06.7
19.627.111.04.1
100.00.96.3
75.20.00.0
0.98.4
12.011.01.32.10.0
1.636.4
Financial Analysis CS: Sample Reports 63

Quick Analysis Financial Reports
64 Financial Analysis CS: Sample Reports

Ratios
Liquidity Ratios
Current Ratio
Quick Ratio
Defensive Interval Days
Altman Z score - Retail
Altman Z score - Manufacturing
Accounts Receivable to Working Capital
Inventory to Working Capital
Long-Term Liabilities to Working Capital
Sales to Working Capital
Activity Ratios
Accounts Receivable Turnover
Days Sales in Receivables
Inventory Turnover
Days Cost of Sales in Inventory
Accounts Payable Turnover
Days Cost of Sales in Payables
Operating Cycle Days
Sales to Assets
Sales to Net Fixed Assets
Current Assets / Current Liabilities
(Cash + Marketable Securities + Trade Accounts Receivable) / Current Liabilities
(Cash + Marketable Securities + Trade Accounts Receivable) / ((Operating Expenses - Other Expenses - Interest Expense - Provision for Income Taxes - Depreciation Expense) / Days)
(((Current Assets - Current Liabilities) / Total Assets) * 6.6) + ((Total Equity / Total Assets) * 3.3) + ((Earnings before Interest and Taxes / Total Assets) * 6.7) + ((Total Equity / Total Liabilities) * 1.0)
(((Current Assets - Current Liabilities) / Total Assets) * 0.717) + ((Total Equity / Total Assets) * 0.847) + ((Earnings before Interest and Taxes / Total Assets) * 3.107) + ((Total Equity / Total Liabilities) * 0.42) + ((Sales / Total Assets) * 0.998)
Trade Accounts Receivable / (Current Assets - Current Liabilities)
Inventory / (Current Assets - Current Liabilities)
Long Term Liabilities / (Current Assets - Current Liabilities)
Sales / (Current Assets - Current Liabilities)
Sales / Trade Accounts Receivable
Trade Accounts Receivable / (Sales / Days)
Cost of Sales / Inventory
Inventory / (Cost of Sales / Days)
Cost of Sales / Trade Accounts Payable
Trade Accounts Payable / (Cost of Sales / Days)
(Inventory / (Cost of Sales / Days)) + (Trade Accounts Receivable / (Sales / Days))
Sales / Total Assets
Sales / (Property and Equipment - Accumulated Depreciation)
Financial Analysis CS: Sample Reports 65

Ratios
Activity Ratios (cont.)
Percent Depreciation Expense to Fixed Assets
Percent Accumulated Depreciation to Fixed Assets
Net Fixed Assets to Equity
Profitability Ratios
Percent Gross Profit
Percent Profit Margin on Sales
Percent Rate of Return on Assets
Percent Rate of Return on
Price Earnings Ratio
Earnings Per Share
Coverage Ratios
Debt to Total Assets
Percent Owners' Equity
Equity Multiplier
Debt to Equity
Cash Flow to Current Maturities Long-Term Debt
Times Interest Earned
Book Value Per Share
Expenses to Sales Ratios
Percent Depreciation to Sales
Percent Owners' Compensation to Sales
Depreciation Expense / Property and Equipment * 100
Accumulated Depreciation / Property and Equipment * 100
(Property and Equipment - Accumulated Depreciation) / Total Equity
((Sales - Cost of Sales) / Sales) * 100
Earnings before Taxes / Sales * 100
Earnings before Taxes / Total Assets * 100
Earnings before Taxes / Total Equity * 100
Stock Price / (Net Income / Outstanding Shares)
Net Income / Outstanding Shares
Total Liabilities / Total Assets
Total Equity / Total Assets * 100
Total Assets / Total Equity
Total Liabilities / Total Equity
(Net Income + Depreciation Expense) / Current Portion of Long Term Debt
Earnings before Interest and Taxes / Interest Expense
Total Equity / Outstanding Shares
Depreciation Expense / Sales * 100
Owners Compensation / Sales * 100
66 Financial Analysis CS: Sample Reports

Categories
Balance Sheet
CashIncludes cash and short term investments with an original maturity less than one year, including restricted cashMarketable SecuritiesIncludes debt and equity financial instruments including trading securities, securities held to maturity, and securities available for sale which are intended to be sold in the short termTrade Accounts ReceivableIncludes total accounts receivable, less allowancesInventoryIncludes total inventory, net of any allowancePrepaid ExpensesIncludes cash paid in advance for services or suppliesCurrent AssetsSum of all current assets - those assets that are reasonably expected to be realized in cash or sold or consumed within a year or within the normal operating cycle of the companyLong-Term InvestmentsIncludes investments, not including marketable securitiesProperty and Equipment Tangible assets held by a company for use in the production or supply of goods and services, for rental to others, or for administrative purposes that are expected to provide economic benefit for more than one yearAccumulated DepreciationThe cumulative amount of depreciation and amortization that has been recognized in the income statement, generally shown as a deduction from the historical cost of fixed assetsNet Property and EquipmentProperty and equipment less accumulated depreciationIntangible AssetsAssets, excluding financial assets, that lack physical substance, net of accumulated amortizationOther Non-Current AssetsIncludes non-current assets not otherwise definedNon-Current AssetsSum of all noncurrent assets - those assets that are not reasonably expected to be realized in cash or sold or consumed within a year or within the normal operating cycle of the companyNotes PayableIncludes written promises to pay, the portions of which are due one year or less in the futureTrade Accounts PayableRecurring obligations of a business that arise from the acquisition of merchandise, materials, supplies and services used in the production and/or sale of goods and servicesCompensationIncludes unpaid obilgations of regular compensation received by employees as a condition of employmentOther Accrued LiabilitiesIncludes obligations for expenses that have been incurred, but not yet paidIncome Taxes PayableIncludes unpaid obligation of all income taxesCurrent Portion of Long-Term DebtThe sum of all debt which is due within one year or lessOther Current LiabilitiesIncludes current liablities not otherwise defined
Financial Analysis CS: Sample Reports 67

Categories
Balance Sheet (cont.)
Current LiabilitiesTotal obligations incurred as part of normal operations that are expected to be repayed during the following yearLong-Term DebtIncludes notes and obligations that provide for repayment over a term longer than one yearDeferred IncomeTaxesIncludes the long-term effect on income taxes attributable to taxable temporary differencesOther Long-Term LiabilitiesIncludes long-term liabilities not otherwise definedLong-Term LiabilitiesTotal obligations incurred as part of normal operations that are expected to be repayed beyond one year or one business cycleCapital StockIncludes securities representing an ownership interest in a companyAdditional Paid-In CapitalIncludes amounts received at issuance in excess of the par or stated value of capital stock and amounts received from other transactions involving the company's stock or stockholdersRetained EarningsIncludes the undistributed earnings of a companyTreasury StockIncludes shares of a company that have been repurchased by a companyOther EquityIncludes equity not otherwise defined
68 Financial Analysis CS: Sample Reports

Categories
Statement of Income
Sales Includes revenues arising from the sale of goods and/or rendering of services in the normal course of business, reduced by sales adjustments, sales returns and allowances, and sales discountsCost of SalesIncludes costs incurred to produce goods for sale and/or to deliver services and may include direct materials, direct labor, overhead and depreciation Gross ProfitSales less cost of goods and/or services soldOwners CompensationExpenditures for salaries of officers Depreciation ExpenseIncludes the amount of expense charged against earnings by a company to write off the cost of property or equipment over its useful lifeSelling ExpensesIncludes expenses directly related to the selling of products or servicesOther Operating ExpensesIncludes operating expenses not otherwise definedOperating ExpensesGenerally recurring costs associated with normal operations and currently chargeable against revenue except for the portion of said expenses which can be clearly related to productionOperating Profit Gross profit less operating expensesOther IncomeIncludes revenue from non-operating activityOther ExpensesIncludes expenses from non-operating activityEarnings before Interest and TaxesSum of operating profit and non-operating income and expensesInterest ExpenseIncludes interest expense on deposits, long-term debt and all other borrowingsEarnings before TaxesSum of operating profit and non-operating income and expenses, including interest expensesProvision for Income TaxesProvision for all current and deferred income taxesNet IncomeAll income less all expenses
Financial Analysis CS: Sample Reports 69

Quick Analysis Financial Reports
70 Financial Analysis CS: Sample Reports