financial and legal constraints to growth:...
TRANSCRIPT

FINANCIAL AND LEGAL CONSTRAINTS TO GROWTH: DOES FIRM SIZE MATTER?
THORSTEN BECK, ASLI DEMIRGÜÇ-KUNT AND VOJISLAV MAKSIMOVIC
ABSTRACT
Using a unique firm-level survey database covering 54 countries, we investigate the effect of financial, legal, and corruption problems on firms’ growth rates. Whether these factors constrain growth depends on firm size. It is consistently the smallest firms that are most constrained. Financial and institutional development weakens the constraining effects of financial, legal, and corruption obstacles and it is again the small firms that benefit the most. There is only a weak relation between firms’ perception of the quality of the courts in their country and firm growth. We also provide evidence that the corruption of bank officials constrains firm growth. Beck and Demirgüç-Kunt are at the World Bank; Maksimovic is at the Robert H. Smith School of Business at the University of Maryland. This paper’s findings, interpretations, and conclusions are entirely those of the authors and do not necessarily represent the views of the World Bank, its executive directors, or the countries they represent. We would like to thank Jerry Caprio, George Clarke, Simeon Djankov, Jack Glen, Richard Green, the editor, Luc Laeven, Florencio Lopez-de- Silanez, Inessa Love, Maria Soledad Martinez Peria, Raghuram Rajan, and seminar participants at the World Bank, American University, Case Western Reserve, Georgetown University, Oxford University, the University of Minnesota and Yale University, and an anonymous referee for helpful comments.

2
Corporate finance theory suggests that market imperfections, such as those caused by
underdeveloped financial and legal systems, constrain firms’ ability to fund investment
projects. Using firm-level data, Demirgüç-Kunt and Maksimovic (1998) show that firms
in countries with developed financial institutions and efficient legal systems obtain more
external financing than firms in countries with less-developed institutions. Although
these findings show a strong effect of financial institutions and the legal system on firm
growth, their conclusions are based on a sample of the largest firms in each of the
economies they study. Their study relies on inferring firms’ demand for external
financing from a financial model of the firm.
In this paper, we use a size-stratified survey of over 4,000 firms in 54 countries to
assess (i) whether financial, legal, and corruption obstacles affect firms’ growth; (ii)
whether this effect varies across firms of different sizes, (iii) whether small, medium-
sized, and large firms are constrained differently in countries with different levels of
financial and institutional development; (iv) the specific characteristics of the legal
system that facilitate firm growth, and (v) the importance of corruption in financial
intermediaries to firm growth.
There is considerable evidence that firm size is related to a firm’s productivity,
survival, and profitability. As a result, understanding how financial, legal, and corruption
obstacles affect firms of different sizes has policy implications. Significant resources are
channeled into the promotion of small and medium-sized enterprises (SMEs). The World
Bank alone has approved more than $10 billion in SME support programs in the past five
years, $1.5 billion of it in the last year alone (World Bank Group Review of Small
Business Activities (2002)).

3
A priori, it is not clear whether weak financial and legal institutions create greater
obstacles to the growth of large or small firms. Large firms internalize many of the
capital allocation functions carried out by financial markets and financial intermediaries.
Thus, the development of financial markets and institutions should disproportionately
benefit small firms. On the other hand, large firms are most likely to tax the resources of
an underdeveloped financial or legal system, since they are more likely than small firms
to depend on long-term financing and on larger loans. It is possible that financial
development can disproportionately reduce the effect of institutional obstacles on the
largest firms.
Our paper provides evidence relevant to reforming legal systems in developing
countries. Although recent studies in international corporate finance predict a positive
relation between the quality of the legal system and access to external financing, we
actually know very little about how firms’ perceptions conform to the conventional
notions of what makes a legal system efficient (such as the impartiality of courts and
whether court decisions are enforced). Moreover, we do not know whether these
conventional notions help predict the effect of the legal system on firm growth. In this
paper, we address both of these issues.
Our paper also provides evidence about the potential costs of monitoring by
financial intermediaries. Several influential theoretical models and public policy
prescriptions rely on monitoring by financial intermediaries to reduce misallocation of
investment in economies with underdeveloped financial markets. Although the reduction
of agency costs caused by firms’ insiders is a major motivation for this monitoring, the
models on which the policies are based typically do not consider the possibility of agency

4
costs within banks. We examine evidence indicating that corrupt officials in financial
intermediaries retard the efficient allocation of capital to smaller firms by relating firms’
reports of bank corruption to the firms’ growth rates.
Our paper builds on earlier studies, starting with LaPorta et al. (1998), who argue that
differences in legal and financial systems can explain much of the variation across countries in
firms’ financial policies and performance. Recent empirical evidence supports the view that the
development of a country’s financial system affects firm growth and financing. In addition to
Demirgüç-Kunt and Maksimovic’s (1998) firm-level results, Rajan and Zingales (1998a) show
that industries that are dependent on external finance grow faster in countries with better
developed financial systems.1 Wurgler (2000) shows that the rate at which resources are
allocated to productive industries depends on the development of the financial system. Love
(2001) shows that the sensitivity of investment to cash flow depends negatively on financial
development. 2
The richness of the survey’s database allows us to go beyond earlier papers that infer the
presence of institutional failures from past growth performance.3 The firms that were surveyed
reported whether specific features of the financial and legal systems in their countries and the
corruption they faced were obstacles to their growth. Thus, we are able to analyze how firms in
different financial and legal systems perceive obstacles to growth, and whether in fact there is a
relation between these perceptions and firm growth. Our paper differs from earlier work in that
we also examine the effect of corruption on firm growth. 4
Second, the literature has less to say about how the state of a country’s financial and legal
institutions affects firms of different sizes.5 We know that in developing economies, there are
advantages in belonging to a business group (see Khanna and Krishna’s (2000) study of India

5
and Rajan and Zingales’ (1998b) review of evidence on Asian capitalism). This finding contrasts
with the prevailing view in the U.S. that the ability to escape market monitoring by recourse to
internal capital markets makes large diversified firms inefficient (Scharfstein and Stein (2000)
and Rajan, Servaes, and Zingales (2000)).6 However, studies of business groups in the emerging
economies are limited to firms that choose to belong to such groups, and the extent to which
these results generalize to other firms and to other institutional settings is unclear. Cross-country
studies of financing choices have found different financing patterns for small and large firms, in
the use of long-term financing and trade credit (Demirgüç-Kunt and Maksimovic (1999 and
2001)). However, these studies rely on commercial databases of listed firms, so that even the
“small” firms are relatively large.
The paper is organized as follows. Section I presents the data and summary
statistics. Section II presents our main results. Section III presents conclusions and
policy implications.
I. Data and Summary Statistics
Our dataset consists of firm survey responses from over 4,000 firms in 54
countries.7 The main purpose of the survey is to identify obstacles to firm performance
and growth around the world. Thus, the survey includes many questions on the nature of
financing and legal obstacles to growth, as well as questons on corruption issues. General
information on firms is more limited, but the survey includes data on numbers of
employees, sales, industry, growth, and number of competitors. The survey also gives
information on ownership, whether the firm is an exporter, and if it has been receiving
subsidies from national or local authorities.

6
In addition to the detail on the obstacles, one of the greatest values of this survey
is its wide coverage of SMEs. The survey covers three groups of firms. It defines small
firms as those with 5 to 50 employees. Medium-sized firms are those that employ 51 to
500 employees, and large firms are those that employ more than 500 employees. Forty
percent of our observations are from small firms, another 40% are from medium firms,
and the remaining 20% are from large firms. Table A1 in the Appendix reports the
number of firms for each country in the sample. For each of the countries, we also use
data on GDP per capita, GDP in U.S. dollars, growth rate of GDP, and inflation. We also
use information on financial system development, legal development, and corruption.
Country- level variables are 1995 to 1999 averages. To compile these averages we follow
Beck, Demirgüç-Kunt, and Levine (2000).
In Table I we summarize relevant facts about the level of economic development,
firm growth, and firm-level obstacles in the sample countries. We provide details on our
sources in the Appendix. The countries in the sample show considerable variation in per-
capita income. They range from Haiti, with an average GDP per-capita income of $369,
to the U.S. and Germany, with per-capita incomes of around $30,000. We also provide
the average annual growth rate of per-capita GDP as a control variable. If investment
opportunities in an economy are correlated, there should be a relation between the growth
rate of individual firms and the growth rate of the economy. The average inflation rate
also provides an important control, since it is an indicator of whether local currency
provides a stable measure of value in contracts between firms. The countries also vary
significantly in their rates of inflation, from a low of 0 in Sweden and Argentina to 86%
in Bulgaria.

7
Insert Table I about here
In Table I, the column titled Firm Growth reports firm growth rates, which are
sales growth rates for individual firms averaged over all sampled firms in each country.
Firm growth rates also show a wide dispersion, from negative rates of –19% for Armenia
and Azerbaijan to a positive 34% for Poland.
Table I also shows firm-level financing, legal, and corruption obstacles reported
by firms averaged over all firms in each country. The World Business Environment
Survey (WBES) asked enterprise managers to rate the extent to which financing, legal,
and corruption problems presented obstacles to the operation and growth of their
businesses. A rating of 1 denotes no obstacle; 2, a minor obstacle; 3, a moderate obstacle;
and 4, a major obstacle. These ratings provide a summary measure of the extent to which
financing, legal systems, and corruption create obstacles to growth, and we refer to them
below as “summary” obstacles.
Table I shows that in the large majority of countries, firms report that the
financing obstacle is the most important summary obstacle to growth. 8 Also, in general,
the reported obstacles tend to be lower in developed countries such as the U.K. and the
U.S. compared to those in developing countries.
Table II contains the sample statistics of our variables. In addition to the financial,
legal, and corruption summary obstacles described above, and in order to understand the
nature of these obstacles to growth better, the survey asked firms more specific questions.
We also investigate responses to these questions.
Insert Table II about here

8
Table II reports unaudited self-reports by firms. In self-reporting it is possible that
unsuccessful firms may blame institutional obstacles for their poor performance. This
possibility must be balanced by the likelihood that alternative data sources used in cross-
country firm-level research, such as accounting data, are also subject to distortion. With
accounting data, the auditing process provides a measure of quality control. However, the
quality of the audit may vary systematically across countries and firm size.9 Moreover,
the incentives to distort data are likely to be much higher in financial statements than in
survey responses, since financial statements affect operational and financing decisions.
Although the possibility of data bias due to unaudited self-reporting can never be
totally eliminated, we believe that it is unlikely to be a significant source of bias in this
study. The stated purpose of the WBES survey is to evaluate the business environment,
not firm performance. Firms were asked few specific questions about their performance
and such questions were asked only at the end of the interview. This sequencing reduces
the respondents’ need to justify their own performance when answering the earlier
questions about the bus iness environment. Respondents were asked about a large range of
business conditions and government policies. Thus, to the extent that firms need to shift
blame for poor performance to outside forces, an unsuccessful firm that is not financially
constrained is likely to find other, more immediate excuses for its internal failures.
To assess the importance of financing obstacles, the firms were asked to rate,
again on a scale of 1 to 4, how problematic specific financing issues are for the operation
and growth of their business. These are (i) collateral requirements of banks and financial
institutions; (ii) bank paperwork and bureaucracy; (iii) high interest rates; (iv) need for
special connections with banks and financial institutions; (v) banks lacking money to

9
lend; (vi) access to foreign banks; (vii) access to non-bank equity; (viii) access to export
finance; (ix) access to financing for leasing equipment; (x) inadequate credit and financial
information on customers; and (xi) access to long-term loans.
Among the specific financial obstacles to growth, high interest rates stand out
with a value of 3.24, which should be a constraint for all firms in all countries. Access to
long-term loans, and bank collateral and paperwork requirements, also appear to be
among the greater of the reported obstacles to growth.
The survey also included specific questions on the legal system. Businesses were
asked if (i) information on laws and regulations was available; (ii) if the interpretation of
laws and regulations was consistent; and (iii) if they were confident that the legal system
upheld their contract and property rights in business disputes three years ago, and
continues to do so now. These answers were rated between 1, fully agree, to 6, fully
disagree.
The survey also asked businesses to evaluate whether their country’s courts are (i)
fair and impartial, (ii) quick, (iii) affordable, (iv) consistent, and (v) enforced decisions.
These are rated thus: 1 equals always, 2 equals usually, 3 equals frequently, 4 equals
sometimes, 5 equals seldom, and 6 equals never. Finally, businesses were asked to rate
the overall quality and efficiency of courts between 1, very good, to 6, very bad.
Looking at these legal obstacles to growth, speed of courts, which has a value of
4.77, seems to be one of the important perceived obstacles. Other important obstacles
include the consistency and affordability of the courts. Below we examine whether in fact
growth is related to the firms’ perceptions of these obstacles.

10
The final set of questions we investigate relate to the level of corruption that firms
must deal with. The questions are (i) whether corruption of bank officials creates a
problem (rated from 1 to 4 as described above); (ii) if firms have to make “additional
payments” to get things done; (iii) if firms generally know what the amount of these
“additional payments” are; (iv) if services are delivered when the “additional payments”
are made as required; and (v) if it is possible to find honest agents to circumvent corrupt
ones without recourse to unofficial payments. Other questions include (vi) the proportion
of revenues paid as bribes (increasing in payment ranked from 1 to 7)10; (vii) the
proportion of contract value that must be paid as “unofficial payments” to secure
government contracts (increasing in payment ranked from 1 to 6)11; and (viii) the
proportion of management’s time in dealing with government officials about the
application and interpretation of laws and regulations (increasing in time from 1 to 6).
Unless specified, answers are ranked from 1 (always) to 6 (never).
Of the specific corruption obstacles reported, the need to make additional
payments is the highest at 4.36. The second highest rated obstacle is firms’ inability to
have recourse to honest officials at 3.58.
One potential problem with using survey data is that enterprise managers may
identify several operational problems, only some of which are constraining, while others
can be circumvented. For this reason, we examine the extent to which the reported
obstacles affect the growth rates of firms. To do this, we obtain benchmark growth rates
by controlling for firm and country characteristics. We then assess whether the level of a
reported obstacle affects growth relative to this benchmark. However, note that since
many firms in our sample are not publicly traded, we do not have firm-level measures of

11
investment opportunities, such as Tobin’s Q. We use indicators of firm ownership,
industry, market structure, and size as firm-level controls. Since the sample includes
firms from manufacturing, services, construction, agriculture, and other industries, we
control for industry effects by including industry dummy variables.
We also include dummy variables that identify firms as government- owned or
foreign-controlled. Government-owned firms might grow at different rates because their
objectives or their exposure to obstacles might differ from those of other firms. For
example, they can have advantages in dealing with the regulatory system, and they could
be less subject to crime or corruption by financial intermediaries and more exposed to
political influences. The growth rate of foreign institutions can also be different, because
foreign entities might find it more difficult to deal with local jud iciary or corruption.
However, foreign institutions might be less affected by financing obstacles, since they
could have easier access to the international financial system.
The growth rate of firms can also depend on the market structure in which they
operate. Therefore, we also include dummy variables to capture whether the firm is an
exporting firm, whether it receives subsidies from local and national governments, and
the number of competitors it faces in its market.
Firm size can be a very important factor in how firm growth is constrained by
different factors. Small firms are likely to face tougher obstacles in obtaining finance,
accessing legal systems, or dealing with corruption (see, e.g., Schiffer and Weder
(2001)). Here, size is a dummy variable that takes the value of 1 for small firms, 2 for
medium firms, and 3 for large firms.

12
Panel B of Table II shows the correlation matrix for the variables in our study.
Foreign firms, larger firms, and exporters have higher growth rates. Government-owned
firms have significantly lower rates of growth. Also, firms in richer, larger, and faster-
growing countries have significantly higher growth rates. As expected, higher financing,
legal, and corruption obstacles correlate with lower firm growth rates.
Correlations also show that government-owned firms are subject to higher
financing obstacles, but are subject to lower corruption. On the other hand, foreign-
controlled firms and exporters face lower financing and corruption obstacles. Financing
obstacles seem to be higher for manufacturing firms. Firms in service industries are less
affected by all obstacles. To the extent that firms have a greater number of competitors,
they seem to face greater financing obstacles and corruption.
All obstacles are significantly lower in richer, larger, and faster-growing
countries, but are significantly higher in countries with higher inflation. Firms are also
significantly larger in richer, larger, and faster-growing countries. Firm size itself is not
correla ted with firm growth. However, size is likely to have an indirect effect on firm
growth, because larger firms face significantly lower financing, legal, and corruption
obstacles. All three obstacles are highly correlated with each other. Thus, firms that suffer
from one are also likely to suffer from others.
We compute but do not report here the correlations of specific obstacles with
summary financing, legal, and corruption obstacles, respectively. Overall, specific
obstacles are highly correlated with the summary obstacles and with each other. The
correlation between the summary corruption obstacle and the corruption of bank officials
is significant and particularly high at 43%.

13
We next explore the relation between the financing, legal, and corruption
obstacles and firm size, controlling for country- level institutional development. To
capture institutional development, we use independently computed country- level
measures of the size of the financial sector, development of the legal sector, and the level
of corruption. Earlier work has shown that the level of financial development affects firm
growth (see Demirgüç-Kunt and Maksimovic (1998)). As a measure of financial
development, we use Priv, which is given by the ratio of domestic banking credit to the
private sector divided by GDP. The index Laworder serves as our proxy for legal
development and is an index of the efficiency of the legal system. It is rated between 1
and 6, with higher values indicating better legal development. Corruption is captured by
Corrupt. This measure is an indicator of the existence of corruption, rated between 1 and
6, with higher values indicating less corruption.
In Table III, we regress the firm-level survey responses on size dummies and the
country- level variables. The three size dummy variables are small, medium, and large.
These variables take the value of 1 if the firm is small or medium or large, respectively,
and 0 otherwise. We also report specifications in which we interact country- level
variables with firm size.
Insert Table III about here
Table III indicates that on average, the firms’ perception of the financing and
corruption obstacles they face relates to firm size, with smaller firms reporting
significantly higher obstacles than large firms. In contrast, smaller firms report lower
legal obstacles than do larger firms, but these differences are not significant.

14
Table III also shows that in countries with more developed financial systems and
with less country- level corruption, firms report lower financing obstacles. These effects
are more significant and the coefficients are greater in absolute value for the largest
firms, particularly for financial development. The indicator of the quality of the legal
system does not appear to explain the magnitude of the firm-level financing obstacles.
The firm-level legal obstacles are significant and negatively related to the quality of the
country’s legal system. The corruption obstacles reported by firms in our sample are
higher in countries with less-developed financia l and legal systems and in countries that
are rated as more corrupt. Lack of corruption at the country level is associated with a
significant reduction in the level of corruption obstacles reported by larger firms. In
contrast, financial development is significantly correlated with lower corruption obstacles
reported by the smaller firms.
Table III shows that even after we control for the quality of a country’s
institutions, firm size is an important determinant of the level of financial and corruption
obstacles. However, to determine if firm size really has an impact, we need to investigate
both the level of the reported obstacles and how firm growth is affected by these
obstacles.
II. Firm Growth and Reported Obstacles
The regressions reported in Table III indicate that firm size and a country’s
institutional development predict the obstacles that firms report. However, it does not
follow that they also predict the effect of these obstacles on firm growth. A firm’s report
that an existing economy-wide institutional obstacle constrains its growth might be

15
accurate, but may not take into account the possibility that the obstacle may also benefit it
by also affecting its rivals. Obstacles might affect large and small firms differently. Table
II also indicates that there is a high degree of correlation between variables of interest and
other firm- and country- level controls that affect growth. Thus, we clarify the relation
between firm-level characteristics and firm growth using multivariate regression.
We regress firms’ growth rates on the obstacles they report. We initially
introduce financial, legal, and corruption summary obstacles one at a time, and finally all
together. In subsequent regressions, we substitute specific obstacles for these summary
obstacles and introduce interaction terms. All regressions are estimated using firm-level
data across 54 countries and country random effects. The regressions are estimated with
controls for country and firm-specific variables discussed in Section II. The country
controls are GDP per capita, GDP, country growth, and the inflation rate. Firm-specific
controls are the logarithm of the number of competitors the firm has, and indicator
variables for ownership of the firm (separate indicators for government- and foreign-
owned firms), industry classification (separate indicators for manufacturing and service
industries), and indicators for whether the firm is an exporter and whether it receives
government subsidies. Specifically, the regression equations we estimate take the form:
Firm Growth = α + β1 Government + β2 Foreign + β3 Exporter + β4Subsidized +
β5 No. of Competitors + β6 Manufacturing + β7 Services + β8 Inflation + β9 GDP per
capita + β10 GDP+ β11 Growth + β12 Obstacle+ ε. (1)
To test the hypothesis that an obstacle is related to firm growth, we test whether
its coefficient β12 is significantly different from zero. We also obtain an estimate of the
economic impact of the obstacle at the sample mean by multiplying its coefficient β12 by
16
the sample mean of the obstacle. This impact variable measures the total effect of the
obstacle on growth, taking into account both the level of the mean reported obstacle and
the estimated relation between the reported obstacle and observed growth.
Table IV shows how firm growth is related to the financing, legal, and corruption
obstacles reported by firms. When entered individually, all reported obstacles have a
negative and significant effect on firm growth, as expected. The impact of the obstacles
on firm growth evaluated at the sample mean is negative, and in all cases, substantial.
Insert Table IV about here
Column 4 shows that financing and legal obstacles are both significant and
negative, but corruption loses its significance in the presence of these two variables. This
suggests that the impact of corruption on firm growth is captured by the financial and
legal obstacles. This is reasonable, because corruption in the legal and financial systems
can be expected to degrade firms’ performance.
When we look at the control variables, we see that the growth rates of
government-owned firms are lower, and the growth rates of exporters are higher. Foreign
firms also appear to grow faster, although this result is only significant at 10% in two
specifications. We do not observe significant differences in the growth rates of firms in
different industries. The coefficient of inflation is significant and positive in two of the
four specifications. A significant inflation effect most likely reflects the fact that firm
sales growth is given in nominal terms. The GDP growth rate and firm growth are
significant and positively correlated, indicating that firms grow faster in an economy with
greater growth opportunities. Most of the explanatory power of the model comes from
between-country differences as indicated by the between-R2 s of 25 to 28%.

17
In Table V, we look at how specific financial, legal, and corruption obstacles affect firm
growth. We enter each of the specific obstacles in turn into equation (1). Although our
regressions include the control variables, for the sake of brevity we do not report these
coefficients.
Insert Table V about here
Panel A shows that collateral requirements, bank paperwork and bureaucracy,
high interest rates, the need to have special connections with banks, lack of money in the
banking system, and access to financing for leasing equipment all have significant
constraining effects on firm growth.
We note that although firms in the WBES survey rate the lack of access to long-
term loans as an important obstacle, it is not significantly correlated with firm growth,
suggesting that firms might be able to substitute short-term financing that is rolled over at
regular intervals for long-term loans. Also, because we expect interest rates to constrain
all firms, it is reassuring to see that those firms that perceive high interest rates as an
important obstacle actually grow more slowly. We also note that some of these factors
are likely to be correlated with lack of development of the financial system. Other
potential constraints, such as access to foreign banks, access to non-bank equity, access to
export finance, or inadequate information on customers are not significantly correlated
with firm growth. Tests of the economic impact of the obstacles at the sample means
indicate that the estimated coefficients, when significant, are sufficiently large to impact
growth rates materially.
Panel B shows a significant and negative relation between the summary legal
obstacle and firm growth. None of the specific legal obstacles has a significant

18
coefficient. It appears that firms are able to work around these specific legal obstacles,
although they find them annoying. Nevertheless, regressing the summary legal obstacle
on the quality of the courts (i.e., their fairness, honesty, quickness, affordability,
consistency, enforcement capacity, and confidence in the legal system), we find that these
factors can explain 46% of the cross-country variation in the legal obstacle.12
To further examine the importance of the specific legal obstacles taken together, we
compute the predicted summary legal obstacle from this regression and introduce it as an
independent variable in the firm growth equation in place of the actual summary legal
obstacle. The coefficient of the predicted summary legal obstacle is positive yet
insignificant, suggesting that the specific obstacles are at most weakly related to firm
growth. This is also true if we run the regressions only for the sample of small firms. If
we split the sample based on legal origin, the explanatory power of the specific
descriptors is not significantly different in the common law countries compared to the
civil law countries.13
Thus, although specific obstacles relate to the summary obstacle, they play a
minor role in affecting growth. This finding suggests that the usual intuitive descriptors
of how a good legal system operates predict survey responses well, but do not capture the
effect of the legal system on firm growth.
Panel C of Table V shows that in addition to the summary corruption obstacle, the
proportion of revenues paid as bribes has a negative and highly significant coefficient,
indicating that it is a good indicator of corruption. Corruption of bank officials and the
percentage of senior management’s time spent with government officials also reduce firm
growth significantly, but only at the 10% level. Again, the need to make payments or the

19
absence of recourse to honest officials are not significant in regressions, despite their high
levels as obstacles.
To investigate the relation between growth and reported obstacles for different-
size firms, we next introduce firm size as an explanatory variable and interact the size
dummies with individual obstacles. This specification posits that a firm might be affected
by an obstacle, such as corruption, at three different levels: (i) At the country level, in
that the general level of corruption may affect all the firms in the country; (ii) at the “firm
category” level, in that some firms (in our case different sized firms) might be affected
differently; and (iii) at the firm-specific level, in that firms have idiosyncratic exposures
to corruption, depending on their business or financing needs. The equations are also
estimated using random effects. Thus, the influence of the general level of corruption in
each country on firm growth is captured by the country random effects. The size variable
picks up any systematic effects of exposure to corruption by firms of different sizes. The
effect of firm-specific exposure to corruption is picked up by the interacting the obstacles
reported by each firm with a size dummy.
More generally, for each reported obstacle of interest, we regress firm growth on
the control variables, firm size, the reported obstacle, and the interaction of the reported
obstacle with three size dummies. These three variables, Small, Medium, and Large, take
on the value 1 when the firm is small, medium-sized, and large, respectively, and 0
otherwise. The coefficients of interactions of the size dummies with an obstacle may
differ because the impact of an obstacle can depend on firm size.
We also compute an economic impact variable for each firm size by multiplying
the coefficients of the interacted variables by the mean level of reported obstacle for the
20
subsample of firms of the corresponding firm size. To determine whether an obstacle
affects the growth of large and small firms differently, we report and test the significance
of the difference in the economic impacts of the obstacle for large and small firms. Thus,
our reported impact variable, Impact(L-S), measures the difference between the total
effect of the obstacle on large and small firms at their respective population means.
Our impact measure, Impact(L-S), also controls to a certain extent for a potential
bias that could arise if some firms misestimate the effect of the obstacles on their growth,
and if this misestimate is related to firm size. For example, if small firms systematically
do not appreciate the real cost of the reported obstacles, they may, on average,
underreport (relative to large firms) the magnitude of the obstacle. In that case, small
firms might report, on average, λ times the true obstacle, where λ < 1. This in turn would
bias upward the estimate of the interaction between Small and Obstacle. However, since
the impact measure is defined as the difference of the products of the estimated
coefficients and sample means of reported obstacles for large and small firms, it would
therefore also not be affected by such scaling.14
In Table VI, we investigate whether financial, legal, and corruption obstacles
affect firms differently based on their size. Panel A shows that financial obstacles affect
firms differently, based on their size. The column titled Financial Obstacle shows that the
financing obstacle constrains the smallest firms the most and the largest ones the least.
Multiplying the coefficients with the mean level of the summary financial obstacle for
each respective subsample shows that the hypothesis that the economic impact of
financing obstacles is the same for large and small firms can be rejected at the 10% level.
Insert Table VI about here

21
These differences become even clearer when we look at specific financing
obstacles: The largest firms are barely affected. The only obstacle that affects these firms
is that caused by high interest rates, which is different from 0 at the 5% significance
level. Largest firms are completely unaffected by collateral requirements, bank
bureaucracies, the need for special connections (probably because they already have
them), banks’ lack of money, or any of the access issues. In contrast, medium-sized
firms, and particularly small firms, are significantly and negatively affected by collateral
requirements, bank paperwork and bureaucracy, high interest rates, the need for special
connections with banks, banks’ lack of money to lend, and access to financing for leasing
equipment. The smallest firms are also negatively affected by obstacles to access to
export finance. The tests for the difference in the economic impact of specific financing
obstacles on the largest and smallest firms confirm significant differences for most of the
obstacles that significantly affect the growth of small firms. These results provide
evidence that financial obstacles have a much greater impact on the operation and growth
of small firms than on that of large firms.15
Panel B of Table VI shows that the summary legal obstacle leaves large firm
growth unaffected, but has a significant, negative impact on the growth rates of medium-
sized and especially small firms. The effect on the growth rate of rate of large firms is
insignificant, despite the fact that large firms report a higher level of the legal obstacle
(Table III).
To evaluate the economic impact of each obstacle for each subsample of firms by
size, we multiply the estimated coefficient by the mean reported level of the obstacle. At
the subsample means, the predicted effect of the summary legal obstacle on annual firm

22
growth is 2.8% for large firms, whereas it is 5.7% for medium firms and 8.5% for small
firms. The difference between the predicted effects on large and small firms is
statistically significant.16 These results indicate that large firms are able to adjust to the
inefficiencies of the legal system. However, the same does not seem to be the case for
small and medium enterprises, which end up paying for the legal systems’ shortcomings
in terms of slower growth. Even looking at specific obstacles, which do not capture
relevant differences as well as the summary obstacles, there is an indication that large
firms may be using legal inefficiencies to their advantage, because poor enforcement of
court decisions appears to contribute to large firm growth rates. However, looking at the
other specific obstacles, we do not see such an effect. For small firms, the affordability of
the court system emerges as an obstacle, although the coefficient is significant only at
10%. The coefficients of the other more specific legal obstacles are not significantly
different from 0. When we investigate whether this finding might be explained by the
nonlinear coding of the responses to the questions on specific features of the legal system
by rescaling the responses, the results are unchanged.
Panel C shows that again, it is the small and medium-sized firms that are
negatively affected by corruption. The mean effects on firm growth are 1.6, 4.1, and 7.5%
for large, medium-sized, and small firms, respectively. The difference between the
economic impact of corruption for large and small firms at the subsample mean is
statistically significant at the 5% level. None of the corruption obstacles is significant for
large firms. The corruption obstacle is negative but significant at 10% for medium-sized
firms and negative and highly significant for small firms.
23
When we look at specific obstacles, we again see that it is the small and medium
enterprises that are affected by bribes. Both coefficients are highly significant, although
the impact on small firm growth is larger in magnitude. The percentage of a senior
manager’s time spent with officials to understand regulations reduces the growth rates of
both small and medium-sized enterprises, but only at a 10% level of significance. In
addition, small firms are significantly and negatively affected by variables that capture
the corruption of bank officials and uncertainty that services will be delivered even after
bribes are paid. We do not find a significant relation between firms’ growth rates and the
need to make bribe payments or the absence of recourse to honest officials, despite these
variables’ high reported ratings as obstacles. The tests of economic impact at the
subsample means support the hypothesis that there is a more adverse effect of corruption
on small firms than on large firms.
Next, we address the issue of whether obstacles affect firms similarly in all
countries, or if their impact depends on the country’s level of financial and legal
development and corruption. To examine this issue, we focus on our three summary
obstacles and introduce into our regressions a term for the interaction of the summary
obstacle with a variable proxying for institutional development. The institutional variable
is Priv when financial obstacles are being analyzed, Laworder when the legal obstacle is
entered, and Corrupt when the corruption obstacle is entered. The coefficient of the
interaction term measures whether the financial development of the economy has an
effect on the relation between reported financial obstacles and firm growth. Thus, our
specification is

24
Firm Growth = α + β1 Government + β2 Foreign + β3 Exporter + β4 Subsidized + β5 No.
of Competitors+ β6 Manufacturing + β7 Services + β8 Inflation + β9 GDP per capita +
β10 GDP+ β11 Growth+ β12Institution+ β13Obstacle + β14 Obstacle*Institution+ ε. (2)
Table VII presents estimates of equation (2) for the summary financing, legal, and
corruption obstacles. The results indicate that firms in financially and legally developed
countries with lower levels of corruption are less affected by firm-level obstacles. In all
three cases, the coefficient of the obstacle remains negative and significant, and the
coefficient of the obstacle interacted with the relevant development variable is positive
and significantly different from zero.17 Evaluating the coefficients at different leve ls of
institutional development shows that in developed countries with Priv levels of 95% or
higher, Laworder values of 6 and Corrupt values of 4 or higher, the impact of financial,
legal, or corruption obstacles on firm growth is not significantly different from 0. In
unreported regressions, we estimate equation (2) with each specific obstacle in turn. In
separate regressions, we find positive and significant coefficients for the interaction
between the level of development and the lack of money in the banking system, a
consistent interpretation of laws, the amount of bribes to be paid, and the fraction of the
contract value that must be paid to a government to secure the contract. These results
also support the hypothesis that in countries where there is less corruption and better-
developed financial and legal systems, firm growth is less constrained by the factors we
examine.
Insert Table VII about here
We next investigate whether the effect of financial and institutional development
on growth varies with firm size. For each summary obstacle, we augment our regression

25
equations by interacting the summary obstacle with a measure of institutional
development and with the firm-size dummies, Small, Medium and Large. This gives us
three triple interaction coefficients corresponding to the three triple interactions,
Obstacle*Small*Institution, Obstacle*Medium*Institution, and
Obstacle*Large*Institution.
Significance tests of the coefficient of the triple interactions show whether a marginal
change in institutional development affects the relation between the summary obstacles
and growth for small, medium, and large firms, respectively. We also test whether the
marginal effect of a change in the country’s financial system affects the sensitivity of the
firm’s growth to the financing obstacle equally for large and small firms. This difference
in impact, Impact(L-S), is computed as the coefficient of the triple interaction term for
large firms evaluated at the mean level of Obstacle for the subsample of large firms
minus the coefficient of the triple interaction term for small firms evaluated at the mean
level of Obstacle for small firms.
Taking into account firm sizes reinforces the results reported in Table VII. Table
VIII shows that the relation between financ ing, legal, and corruption obstacles and the
growth of firms of different sizes depends on the institutional setting.
Insert Table VIII about here
The first column of Table VIII shows that small firms are again the most severely
affected by financing obstacles. However, the interaction term of the financing obstacle
with Priv and the small firm dummy variable has a positive sign and is significant,
suggesting that a marginal development in a country’s financial system relaxes the
financial constraints on small firms.
26
In column 2 of the table, we see that marginal improvements in legal efficiency
translate into a relaxing of legal constraints for small and medium-sized firms (albeit
significant at the 10% level). The corruption results reported in column 3 indicate that as
countries manage to reduce corruption, the constraining effect of corruption on the
growth of small and medium-sized firms diminishes. The differential effect of the
interaction of Priv and of the level of corruption on the growth of la rge and of small firms
is statistically significant, indicating a material difference in the economic impact of these
variables on the growth of large and small firms.
To address two possible sources of bias, we perform robustness checks of our
specifications. Our estimates will be biased if firms that are not growing because of
internal problems systematically shift blame to the legal and financial institutions and
report high obstacles. This type of reverse causality problem, if it exists, is likely to be
most severe in the case of the summary obstacles.18 To examine this possibility, we re-
estimate the specifications in Table IV by using Priv, Laworder and Corrupt as the
instrumental variables. The coefficients of interest are reported in Panel A of Table IX.
The coefficients show that the same variables remain significant at roughly comparable
levels of significance.
Insert Table IX about here
In Panel B, we estimate the size splits for the three summary indicators using
Priv, Laworder, and Corrupt interacted with the three size dummies as instrumental
variables. Although the results for financing and corruption obstacles do not change
significantly, those for the legal obstacle lose significance.

27
In Panel C, rather than looking at the differences between the three size groups,
we interact the obstacles by firm size given by the logarithm of firm sales. Even when
we use this continuous definition of firm size, we see that larger firms are less affected by
the three obstacles.
Panel D shows the relation between the obstacles and firms’ real growth. In this
specification, we drop the rate of inflation variable from the right-hand side. Inspection of
Panel D shows that adjusting the dependent variable for inflation does not alter the
results.
In Panel E we examine the robustness of our findings when we average the
variables by country for different firm sizes. This procedure provides an alternative and
more stringent test of the relation between firm growth and obstacles, because it ignores
the firm-level heterogeneity across firms in the same country belonging to the same size
classification. Because this aggregation procedure reduces the degrees of freedom, in
Panel D we also reduce the number of independent variables and focus on the differences
between SMEs and large firms. The results reported in Panel E are consistent with the
firm-level results reported in earlier tables. There exist significant differences in the
impact of financial, legal, and corruption obstacles on SMEs and large firms.
III. Conclusions
In this paper we investigate whether the financial, legal, and corruption obstacles
that firms report actually affect their growth rates. By making use of a unique survey
database, we investigate a rich set of obstacles reported by firms and directly test whether
any of these reported obstacles are significantly correlated with firm growth rates. The
database also allows us to focus on differences in firm size, since it has good coverage of

28
small and medium-sized enterprises in 54 countries. We investigate if the extent to
which the firms are constrained by different obstacles depends on the level of
development of the financial and legal systems. We are particularly interested in
investigating the previously unexamined national level of corruption and its impact on
firm growth.
Our results indicate that the extent to which financial and legal underdevelopment
and corruption constrain a firm’s growth depends very much on a firm’s size. We show
that it is the smallest firms that are consistently the most adversely affected by all
obstacles.
Taking into account national differences between financial and legal development
and corruption, we see that firms that operate in underdeveloped systems with higher
levels of corruption are affected by all obstacles to a greater extent than firms operating
in countries with less corruption. We also see that a marginal development in the
financial and legal system and a reduction in corruption helps relax the constraints for the
small and medium-sized firms, which are the most constrained.
All three obstacles – financial, legal, and corruption – do affect firm growth rates
adversely. But not all specific obstacles are equally important, and the ones that affect
firm growth are not necessarily the ones rated highest by the firms themselves. When we
look at individual financing obstacles, we see that difficulties in dealing with banks, such
as bank paperwork and bureaucracies, and the need to have special connections with
banks, do constrain firm growth. Collateral requirements and certain access issues –such
as financing for leasing equipment -- also turn out to be significantly constraining.
Macroeconomic issues captured by high interest rates and lack of money in the banking

29
system also significantly reduce firm growth rates. Further, these effects remain
significant even after we control for the level of financial development. We are
interested to find that another obstacle that is rated very highly by firms, access to long-
term loans, does not affect their growth rates significantly. Perhaps firms find it is
possible to substitute short-term funding for long-term loans.
Legal and corruption obstacles, particularly the amount of bribes paid, the
percentage of senior management’s time spent with regulators, and corruption of bank
officials, also represent significant constraints on firm growth. However, other obstacles,
such as the speed with which the courts work, or the need to make additional payments,
both of which are rated very highly by firms as important obstacles, do not affect firm
growth significantly. These results suggest that the surveys elicit all kinds of complaints
that may appear equally important. However, our methodology allows us to distinguish
between obstacles that are merely annoying from those that truly constrain firm
performance.
There are two particularly interesting findings. First, corruption of bank officials
does indeed affect firm growth, particularly for small firms. This finding provides
evidence for the existence of institutional failure, which must be taken into account when
modeling the monitoring role of financial institutions in overcoming market failures due
to informational asymmetries. Second, while the intuitive descriptors of an efficient legal
system are related to the summary obstacle, they are not related to firm growth. This
finding suggests that the mechanism by which the legal systems affects firm performance
is not yet well understood.

30
There are several policy implications in our results. Development institutions
devote a large amount of their resources to SMEs because they believe the development
of the SME sector is crucial for economic growth and poverty alleviation and that small
entrepreneurs face greater constraints. While this paper does not address the issue of
SME impact on economic development, it does provide evidence confirming that indeed,
small and medium-sized firms face greater financial, legal, and corruption obstacles
compared to large firms, and that the constraining impact of obstacles on firm growth is
inversely related to firm size. Our paper also shows that it is the small firms that stand to
benefit the most from improvements in financial development and a reduction in
corruption.

31
REFERENCES
Ball, Ray, S.P. Kothari, and Ashok Robin, 2000, The effect of international institutional
factors on properties of accounting earnings, Journal of Accounting and
Economics 29, 1-51.
Beck, Thorsten, Ross Levine, and Norman Loayza, 2000, Finance and the sources of
growth, Journal of Financial Economics 58, 261-300.
Beck, Thorsten, Asli Demirgüç-Kunt, and Ross Levine, 2000, A new database on the
structure and development of the financial sector, World Bank Economic Review
14, 597-605.
Beck, Thorsten, Asli Demirgüç-Kunt, and Ross Levine, 2002a, Law, Endowments and
Finance, Journal of Financial Economics, forthcoming.
Beck, Thorsten, Asli Demirgüç-Kunt, and Ross Levine, 2002b, Law and Finance: Why
Does Legal Origin Matter?, Journal of Comparative Economics, forthcoming.
Beck, Thorsten, Asli Demirgüç-Kunt, and Vojislav Maksimovic, 2001a, Financing
patterns and constraints: the role of institutions, World Bank mimeo.
Beck, Thorsten, Asli Demirgüç-Kunt, and Vojislav Maksimovic, 2001b, Financial and
legal institutions and firm size, World Bank mimeo.
Carlin, Wendy, and Colin Mayer, 1999, Finance, investment and growth, Working paper,
University College, London.
Clarke, George, Robert Cull, and Maria Soledad Martinez Peria, 2001, Does foreign bank
penetration reduce access to credit in developing countries? Evidence from asking
borrowers, World Bank mimeo.

32
Demirgüç-Kunt, Asli, and Vojislav Maksimovic, 1998, Law, finance, and firm growth,
Journal of Finance 53, 2107-2137.
Demirgüç-Kunt, Asli, and Vojislav Maksimovic, 1999, Institutions, financial markets and
firm debt maturity, Journal of Financial Economics 54, 295-336.
Demirgüç-Kunt, Asli, and Vojislav Maksimovic, 2001, Firms as financial intermediaries:
evidence from trade credit data, World Bank Working paper.
Hung, Mingyi, 2001, Accounting standards and value relevance of financial statements:
an international analysis, Journal of Accounting and Economics 30, 401-420.
Khanna, Tarun, and Krishna Palepu, 2000, Is group affiliation profitable in emerging
markets? An analysis of diversified Indian business groups, Journal of Finance
King, Robert G., and Ross Levine, 1993, Finance and growth: Schumpeter might be
right, Quarterly Journal of Economics 108, 717-38.
La Porta, Rafael, Florencio Lopez-de-Silanes, Andrei Shleifer, and Robert W. Vishny,
1998, Law and Finance, Journal of Political Economy 106, 1113-1155.
Levine, Ross, and Sara Zervos, 1998, Stock markets, banks, and economic growth,
American Economic Review 88, 537-558.
Love, Inessa, 2001, Financial development and financing constraints: international
evidence from the structural investment model, World Bank Working paper No.
2694.
Maksimovic, Vojislav, and Gordon Phillips, 2002, Do conglomerate firms allocate
resources inefficiently? Evidence from plant- level data, Journal of Finance 57,
721-767
33
Mauro, Paul, 1996, The effects of corruption on growth, investment and government
expenditure, IMF Working paper 96/98.
Rajan, Raghuram G., Henri Servaes, and Luigi Zingales, 2000, The cost of diversity: the
diversification discount and inefficient investment, Journal of Finance 55, 35-80.
Rajan, Raghuram G., and Luigi Zingales, 1998a, Financial dependence and growth, American
Economic Review 88, 559-587.
Rajan, Raghuram G., and Luigi Zingales, 1998b, Which capitalism? Lessons from the
East Asian crisis, Journal of Applied Corporate Finance 11, 40-48.
Scharfstein, David S., and Jeremy C. Stein, 2000, The dark side of internal capital markets:
Divisional rent-seeking and inefficient investment, Journal of Finance 55, 2537–
2564.
Schiffer, Mirjam, and Beatrice Weder, 2001, Firm size and the business environment:
worldwide survey results, IFC Discussion Paper number 43.
Wurgler, Jeffrey, 2000, Financial markets and the allocation of capital, Journal of
Financial Economics 58, 187-214.

34
1 In addition, Carlin and Mayer (1999) also argue that there exists a relation between a
country’s financial system and the characteristics of industries that that prosper in the
country. Demirgüç-Kunt and Maksimovic (1999) show that the origin and efficiency of a
legal system facilitates firms’ access to external finance, particularly long-term finance.
At the country level, King and Levine (1993), Levine and Zervos (1998), and Beck,
Levine, and Loayza (2000) show that financial development promotes growth and that
differences in legal origins explain differences in financial development.
2 Rajan and Zingales (1998a) use the external financing by U.S. firms as a benchmark,
under the assumption that firms in the same industries in other countries depend on
similar amounts of external financing. Demirgüç-Kunt and Maksimovic (1998) rely on a
financial planning model to ident ify firms that have access to long-term external
financing.
3 Exceptions are Schiffer and Weder (2001) who investigate different obstacles using
WBES data and Clarke, Cull and Peria (2001) who assess the impact of foreign bank
entry on these obstacles.
4 Empirical evidence based on cross-country comparisons does suggest that corruption
has a major adverse effect on private investment and economic growth (Mauro (1996)).
We look at whether corruption also has a significant impact in constraining firm growth.
5 Except to study determinants of firm size by looking at the largest firms around the
world (see Beck, Demirgüç-Kunt, and Maksimovic (2001b)).
6 For evidence that large diversified firms in the U.S. economy do allocate resources
efficiently, see Maksimovic and Phillips (2002).

35
7 The WBES covers 80 economies. However, the sample is reduced because most firm-
level or country- level variables are missing for 26 countries.
8 This is consistent with other studies that use the WBES (see Schiffer and Weder
(2001)).
9 Financial data used in previous studies are also subject to potential biases because
country institutional factors can affect the properties of accounting data (see Ball,
Kothari, and Robin (2000) and Hung (2001)).
10 On the scale 1 equals 0%, 2 equals less than 1%, 3 equals 1% to 1.9%, 4 equals 2% to
9.99%, 5 equals 10% to 12%, 6 equals 13% to 25%, and 7 equals more than 25%.
11 On the scale, 1 equals 0%, 2 equals less than 5%, 3 equals 6% to 10%, 4 equals 11% to
15%, 5 equals 16% to 20%, 6 equals more than 20%.
12 If we use firm-level data and include random country effects, the between R2 is 41%.
13 We are only able to do this using firm-level observations, since there are not enough
degrees of freedom at the country level.
14 As shown in the tables below, for almost all the regressions reported below, the
conclusions we draw by testing for the differences of the economic impact variables
match those drawn by simply testing for the differences in the coefficients.
15 Firm size itself never has a significant coefficient in the regressions, consistent with
simple correlations reported in Table II.
16 It is interesting to note that the estimates of the difference in the economic impact of
specific legal obstacles on large and small firms are generally statistically significant,
even in cases where the coefficients of the specific obstacle are not statistically different

36
from zero. That can occur if the coefficients for large and small firms are of different sign
or if the subsample means of the obstacle for large and small firms differ sufficiently.
17 The variables Priv and Laworder are not significant when entered together with
financing and legal obstacles. On the other hand, corruption enters positively and
significantly in some specifications, even when entered together with firm-level
corruption obstacles. This result indicates that lack of corruption is associated with higher
firm growth.
18 We are grateful to the referee for pointing this out.
37
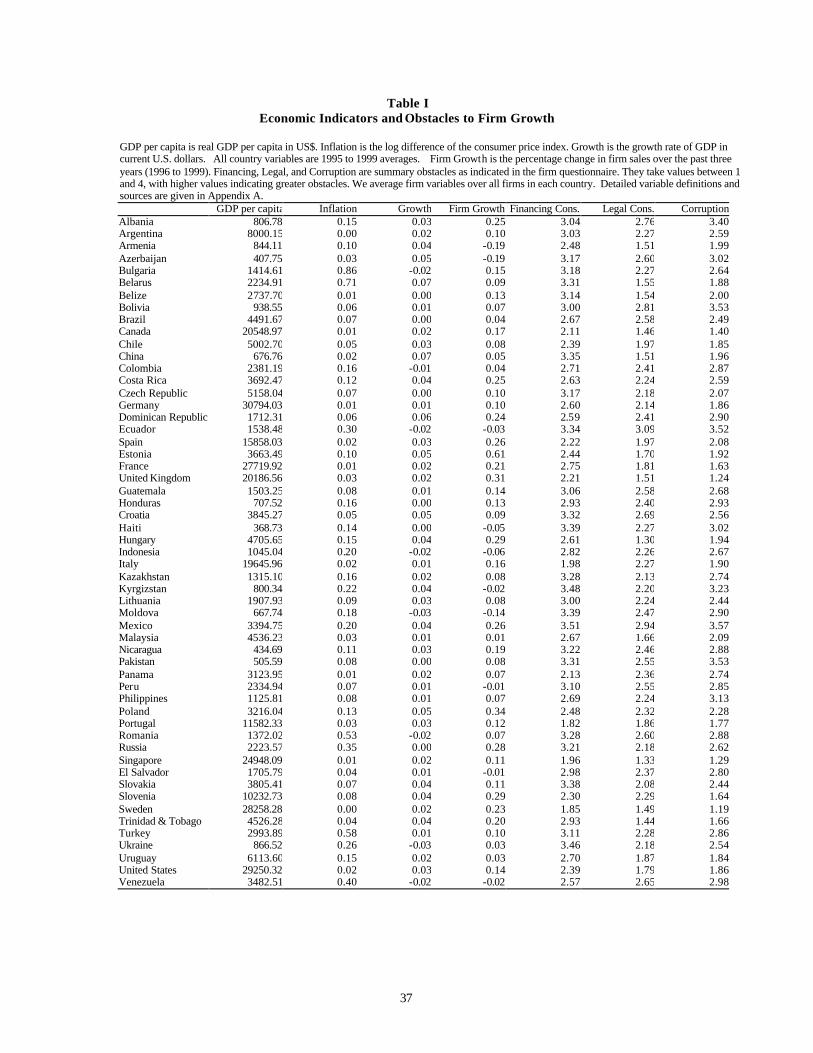
Table I Economic Indicators and Obstacles to Firm Growth
GDP per capita is real GDP per capita in US$. Inflation is the log difference of the consumer price index. Growth is the growth rate of GDP in current U.S. dollars. All country variables are 1995 to 1999 averages. Firm Growth is the percentage change in firm sales over the past three years (1996 to 1999). Financing, Legal, and Corruption are summary obstacles as indicated in the firm questionnaire. They take values between 1 and 4, with higher values indicating greater obstacles. We average firm variables over all firms in each country. Detailed variable definitions and sources are given in Appendix A. GDP per capita Inflation Growth Firm Growth Financing Cons. Legal Cons. CorruptionAlbania 806.78 0.15 0.03 0.25 3.04 2.76 3.40Argentina 8000.15 0.00 0.02 0.10 3.03 2.27 2.59Armenia 844.11 0.10 0.04 -0.19 2.48 1.51 1.99Azerbaijan 407.75 0.03 0.05 -0.19 3.17 2.60 3.02Bulgaria 1414.61 0.86 -0.02 0.15 3.18 2.27 2.64Belarus 2234.91 0.71 0.07 0.09 3.31 1.55 1.88Belize 2737.70 0.01 0.00 0.13 3.14 1.54 2.00Bolivia 938.55 0.06 0.01 0.07 3.00 2.81 3.53Brazil 4491.67 0.07 0.00 0.04 2.67 2.58 2.49Canada 20548.97 0.01 0.02 0.17 2.11 1.46 1.40Chile 5002.70 0.05 0.03 0.08 2.39 1.97 1.85China 676.76 0.02 0.07 0.05 3.35 1.51 1.96Colombia 2381.19 0.16 -0.01 0.04 2.71 2.41 2.87Costa Rica 3692.47 0.12 0.04 0.25 2.63 2.24 2.59Czech Republic 5158.04 0.07 0.00 0.10 3.17 2.18 2.07Germany 30794.03 0.01 0.01 0.10 2.60 2.14 1.86Dominican Republic 1712.31 0.06 0.06 0.24 2.59 2.41 2.90Ecuador 1538.48 0.30 -0.02 -0.03 3.34 3.09 3.52Spain 15858.03 0.02 0.03 0.26 2.22 1.97 2.08Estonia 3663.49 0.10 0.05 0.61 2.44 1.70 1.92France 27719.92 0.01 0.02 0.21 2.75 1.81 1.63United Kingdom 20186.56 0.03 0.02 0.31 2.21 1.51 1.24Guatemala 1503.25 0.08 0.01 0.14 3.06 2.58 2.68Honduras 707.52 0.16 0.00 0.13 2.93 2.40 2.93Croatia 3845.27 0.05 0.05 0.09 3.32 2.69 2.56Haiti 368.73 0.14 0.00 -0.05 3.39 2.27 3.02Hungary 4705.65 0.15 0.04 0.29 2.61 1.30 1.94Indonesia 1045.04 0.20 -0.02 -0.06 2.82 2.26 2.67Italy 19645.96 0.02 0.01 0.16 1.98 2.27 1.90Kazakhstan 1315.10 0.16 0.02 0.08 3.28 2.13 2.74Kyrgizstan 800.34 0.22 0.04 -0.02 3.48 2.20 3.23Lithuania 1907.93 0.09 0.03 0.08 3.00 2.24 2.44Moldova 667.74 0.18 -0.03 -0.14 3.39 2.47 2.90Mexico 3394.75 0.20 0.04 0.26 3.51 2.94 3.57Malaysia 4536.23 0.03 0.01 0.01 2.67 1.66 2.09Nicaragua 434.69 0.11 0.03 0.19 3.22 2.46 2.88Pakistan 505.59 0.08 0.00 0.08 3.31 2.55 3.53Panama 3123.95 0.01 0.02 0.07 2.13 2.36 2.74Peru 2334.94 0.07 0.01 -0.01 3.10 2.55 2.85Philippines 1125.81 0.08 0.01 0.07 2.69 2.24 3.13Poland 3216.04 0.13 0.05 0.34 2.48 2.32 2.28Portugal 11582.33 0.03 0.03 0.12 1.82 1.86 1.77Romania 1372.02 0.53 -0.02 0.07 3.28 2.60 2.88Russia 2223.57 0.35 0.00 0.28 3.21 2.18 2.62Singapore 24948.09 0.01 0.02 0.11 1.96 1.33 1.29El Salvador 1705.79 0.04 0.01 -0.01 2.98 2.37 2.80Slovakia 3805.41 0.07 0.04 0.11 3.38 2.08 2.44Slovenia 10232.73 0.08 0.04 0.29 2.30 2.29 1.64Sweden 28258.28 0.00 0.02 0.23 1.85 1.49 1.19Trinidad & Tobago 4526.28 0.04 0.04 0.20 2.93 1.44 1.66Turkey 2993.89 0.58 0.01 0.10 3.11 2.28 2.86Ukraine 866.52 0.26 -0.03 0.03 3.46 2.18 2.54Uruguay 6113.60 0.15 0.02 0.03 2.70 1.87 1.84United States 29250.32 0.02 0.03 0.14 2.39 1.79 1.86Venezuela 3482.51 0.40 -0.02 -0.02 2.57 2.65 2.98

38
Table II Summary Statistics and Correlations
Panel A presents summary statistics and Panel B presents correlations. N refers to firm-level observations for 54 countries. Firm Growth is given by the percentage change in firm sales. Government and Foreign are dummy variables that take the value of one if the firm has government or foreign ownership and zero if not. Exporter is a dummy variable that indicates if the firm is an exporting firm. Subsidized is also a dummy variable that indicates if the firm receives subsidies from the national or local authorities. Manufacturing and Services are industry dummies. No. of Competitors is the logarithm of the number of competitors the firm has. Size is a variable that takes the value of 1 if firm is small, 2 if it is medium-sized, and 3 if it is large. Small firms employ 5 to 50 employees, medium-size firms employ 51 to 500 employees, and large firms employ more than 500 employees. Inflation is the log difference of the consumer price index. GDP per capita is real GDP per capita in U.S. dollars, GDP is the logarithm of GDP in millions of U.S. dollars. Growth is the growth rate of GDP. All country variables are 1995 to 1999 averages. The different financing, legal, and corruption issues are survey responses as specified in the firm questionnaire. Higher numbers indicate greater obstacles, with the exception of “Firms must make ‘additional payments’ to get things done” and “Firms know the amount of ‘additional payments’ in advance.” Detailed variable definitions and sources are given in Appendix A.
Panel A: Summary Statistics N Mean Std. Dev. Min Max Firm Growth 4,255 0.13 0.59 -1 2Government 4,255 0.13 0.34 0 1Foreign 4,255 0.17 0.37 0 1Exporter 4,255 0.35 0.48 0 1Subsidized 4,255 0.10 0.35 0 1Manufacturing 4,255 0.37 0.48 0 1Services 4,255 0.47 0.50 0 1No. of Competitors 4,255 0.80 0.33 0 1.39Size 4,254 1.78 0.72 1 3 Inflation 54 17.41 19.30 0.11 86.05GDP per capita 54 560 772 369 30,794GDP (million $) 54 24.72 1.96 20.30 29.74Growth 54 0.02 0.03 -0.03 0.07 Financing 4,213 2.87 1.13 1 4Legal 3,976 2.17 1.05 1 4Corruption 4,000 2.43 1.17 1 4 Collateral requirements 3,954 2.54 1.17 1 4Bank paperwork/bureaucracy 4,078 2.54 1.10 1 4High interest rates 4,112 3.24 1.03 1 4Need special connections with banks 3,958 2.19 1.09 1 4Banks lack money to lend 3,861 2.10 1.22 1 4Access to foreign banks 3,489 1.99 1.17 1 4Access to non-bank equit y 3,470 2.06 1.16 1 4Access to export finance 3,017 1.99 1.19 1 4Access to financing for leasing equipment 3,532 2.02 1.14 1 4Inadequate credit/financial information on customers 3,712 2.21 1.13 1 4Access to long term loans 3,937 2.63 1.27 1 4 Availability of information on laws and regulations 4,211 2.92 1.42 1 6Interpretation of laws and regulations are consistent 4,225 3.42 1.37 1 6Overall quality and efficiency of courts 3,521 3.73 1.31 1 6Courts are fair and impartial 3,933 3.75 1.39 1 6Courts are quick 3,991 4.77 1.22 1 6Courts are affordable 3,910 3.92 1.45 1 6Courts are consistent 3,918 4.04 1.36 1 6Court decisions are enforced 3,905 3.67 1.48 1 6Confidence in legal system to enforce contract & prop. rights 4,206 3.35 1.38 1 6Confidence in legal system – 3 years ago 3,935 3.46 1.40 1 6 Corruption of bank officials 3,574 1.72 1.05 1 4Firms have to make “additional payments” to get things done 3,924 4.36 1.62 1 6Firms know the amount of “additional payments” in advance 2,310 3.38 1.59 1 6If “additional payments” are made, services are delivered 2,269 3.01 1.53 1 6It is possible to find honest agents to replace corrupt ones 3,602 3.58 1.75 1 6Proportion of revenues paid as bribes 2,831 2.35 1.47 1 7Prop. of contract value that must be paid for govt. contracts 1,733 2.51 1.73 1 6Mgmt’s time (%) spent with officials to understand laws & regs 3,990 2.24 1.39 1 6

39
Panel B: Correlation Matrix of Variables Firm Growth Govt Foreign Exporter Subsidized Manuf. Services No. of comp. Size Inflation GDP/capita GDP($) Growth Financing Legal Govt. -0.0245* Foreign 0.0390** -0.0258* Exporter 0.0844*** 0.1001*** 0.2368*** Subsidized -0.0049 0.1472*** 0.0006 0.081*** Manuf. -0.0180 0.0855*** 0.1165*** 0.3448*** 0.0219 Services 0.0210 -0.0846*** -0.0312** -0.2465*** -0.0759*** -0.7302*** No. of co. 0.0148 -0.0057 -0.1788*** -0.1211*** -0.0285* -0.117*** 0.0334** Size 0.0224 -0.0245* 0.0390*** 0.0844*** 0.0049 -0.0180 0.0210 0.0148 Inflation 0.0010 0.1335*** -0.1231*** -0.1024*** 0.0049 0.0280* -0.1262*** 0.2640*** 0.0010 GDP/cap 0.0489*** -0.0808*** 0.1262*** 0.1223*** 0.0675*** -0.0460*** 0.0739*** -0.2228*** 0.0489*** -0.3655*** GDP($) 0.0551*** -0.0960*** 0.0799*** 0.0058 0.0625*** -0.0391*** 0.0559*** -0.1178*** 0.0551*** -0.0789*** 0.5666*** Growth 0.0751*** 0.0673*** 0.0237 0.1275*** 0.0404*** 0.0000 0.021 0.0281* 0.0751*** -0.3608*** 0.1308*** -0.1007*** Fin. obst. -0.0821*** 0.0723*** -0.1732*** -0.052*** 0.0231 0.0426*** -0.1317*** 0.1039*** -0.0821*** 0.1784*** -0.2518*** -0.1114*** -0.1226*** Leg obst. -0.0676*** -0.0084 -0.0158 -0.0095 -0.0303** 0.0198 -0.0378** 0.0167 -0.0676*** 0.0531*** -0.1737*** -0.0682*** -0.1411*** 0.1901*** Corruption-0.0695*** -0.0713*** -0.0733*** -0.1025*** -0.0759*** -0.001 -0.0338** 0.0479*** -0.0695*** 0.1314*** -0.3322*** -0.1635*** -0.1815*** 0.2809*** 0.5754*** *, **, *** indicate significance levels of 10, 5, and 1 %, respectively.

40
Table III Firm Level Obstacles and Institutional Development
The regression estimated is:
Firm Level Obstacle = = α + β1 Priv*Small + β2 Priv*Medium + β3 Priv*Large + β4 Laworder*Small + β5
Laworder*Medium + β6 Laworder*Large + β7 Corrupt*Small + β8 Corrupt*Medium + β9 Corrupt*Large + β10 Small+ β11
Medium + å Firm Level Obstacles --Financing, Legal, or Corruption --are summary obstacles as indicated in the firm questionnaire. They take values of 1 to 4, where 1 indicates no obstacle and 4 indicates a major obstacle. Priv is domestic bank credit to the private sector divided by GDP. Laworder is a national indicator (values between 1 and 6) that takes higher values for legal systems that are more developed. Corrupt is a corruption indicator (values between 1 and 6) at the national level that takes higher values in countries where corruption is lower. Small, Medium, and Large are dummy variables that take the value one if a firm is small (or medium or large) and zero otherwise. Small firms employ 5 to 50 employees, medium-size firms employ 51 to 500 employees, and large firms employ more than 500 employees. These size dummies are interacted with Priv, Laworder and Corrupt. We estimate all regressions using country random effects. At the foot of the table we report whether the coefficients are significantly different for large and small firms. We obtain firm level variables from the WBES. Detailed variable definitions and sources are given in Appendix A.
Financing Obstacle
Legal Obstacle
Corruption Obstacle
Priv
-0.531*** (0.190)
-0.316* (0.194)
-0.461** (0.235)
Priv*Small -0.167 (0.208)
-0.262 (0.206)
-0.624** (0.249)
Priv*Medium -0.746*** (0.205)
-0.369* (0.203)
-0.451* (0.247)
Priv*Large -0.864*** (0.242)
-0.340 (0.233)
-0.191 (0.276)
Laworder
-0.032 (0.053)
-0.137*** (0.054)
-0.245*** (0.065)
Laworder*Small -0.048 (0.059)
-0.146*** (0.059)
-0.225*** (0.071)
Laworder*Medium -0.036 (0.056)
-0.127** (0.056)
-0.257*** (0.068)
Laworder*Large 0.008 (0.063)
-0.135** (0.062)
-0.250*** (0.074)
Corrupt
-0.160*** (0.052)
-0.059 (0.053)
-0.129** (0.065)
Corrupt*Small -0.135*** (0.057)
-0.053 (0.057)
-0.082 (0.069)
Corrupt*Medium -0.153*** (0.056)
-0.045 (0.055)
-0.143** (0.067)
Corrupt*Large -0.221*** (0.063)
-0.097* (0.061)
-0.172** (0.074)
Small 0.294*** (0.052)
-0.004 (0.202)
-0.036 (0.048)
-0.163 (0.187)
0.240*** (0.051)
-0.034 (0.198)
Medium
0.229*** (0.050)
0.134 (0.187)
0.015 (0.046)
-0.184 (0.171)
0.147*** (0.049)
0.172 (0.183)
R2- within 0.01 0.02 0.00 0.00 0.01 0.01 R2- between 0.44 0.45 0.37 0.37 0.55 0.54 R2 - overall 0.08 0.08 0.06 0.06 0.13 0.13 Priv(Large-Small) -0.700*** -0.080 0.438** Laworder(Large –Small) 0.055 0.014 -0.024 Corrupt(Large-Small)
-0.085* -0.046 -0.091*
No of firms 3549 3549 3400 3400 3406 3406 No of countries 49 49 49 49 49 49 *, **, *** indicate significance levels of 10, 5, and 1 %, respectively.

41
Table IV
Firm Growth: the Impact of Obstacles The regression estimated is:
Firm Growth = α + β1 Government + β2 Foreign + β3 Exporter + β4Subsidized + β5 No. of Competitors + β6
Manufacturing + β7 Services + β8 Inflation + β9 GDP per capita + β10 GDP+ β11 Growth + β12 Financing + β13 Legal + β14 Corruption+ ε.
Firm Growth is the percentage change in firm sales over the past three years. Government and Foreign are dummy variables that take the value of one if the firm has government or foreign ownership and zero if not. Exporter is a dummy variable that indicates if the firm is an exporting firm. Subsidized is also a dummy variable that indicates if the firm receives subsidies from the national or local authorities. No. of Competitors is the logarithm of the firm’s number of competitors. Manufacturing and Services are industry dummies. Inflation is the log difference of the consumer price index. GDP per capita is real GDP per capita in U.S. dollars. GDP is the logarithm of GDP in millions of U.S. dollars. Growth is the growth rate of GDP. Financing, Legal, and Corruption are summary obstacles as indicated in the firm questionnaire. They take values between 1 and 4, where 1 indicates no obstacle and 4 indicates major obstacle. We estimate all regressions using country random effects. We obtain firm level variables from the WBES. Detailed variable definitions and sources are given in Appendix A. (1) (2) (3) (4) Government -0.070***
(0.028) -0.083***
(0.029) -0.074***
(0.029) -0.070** (0.030)
Foreign 0.034 (0.025)
0.045* (0.025)
0.045* (0.026)
0.037 (0.026)
Exporter 0.103*** (0.021)
0.104*** (0.022)
0.107*** (0.022)
0.105*** (0.022)
Subsidized 0.001 (0.026)
0.002 (0.027)
0.007 (0.027)
0.007 (0.027)
No. of Competitors -0.011 (0.031)
-0.016 (0.032)
-0.001 (0.032)
-0.005 (0.033)
Manufacturing -0.032 (0.028)
-0.023 (0.029)
-0.032 (0.030)
-0.035 (0.030)
Services 0.027 (0.027)
0.052* (0.028)
0.037 (0.028)
0.036 (0.028)
Inflation 0.002** (0.001)
0.002* (0.001)
0.002 (0.001)
0.002 (0.001)
GDP per capita 0.002 (0.003)
0.001 (0.003)
0.001 (0.003)
0.000 (0.003)
GDP ($) 0.007 (0.011)
0.012 (0.011)
0.010 (0.011)
0.013 (0.012)
Growth
0.021*** (0.007)
0.021*** (0.007)
0.020*** (0.008)
0.019*** (0.008)
Obstacles: Financing -0.031***
(0.009) -0.023***
(0.009) Legal -0.029***
(0.009) -0.023**
(0.011) Corruption -0.021***
(0.009) -0.007 (0.011)
Impact on Growth Evaluated at Sample Mean
-0.087*** -0.063*** -0.052*** -0.134***
R2- within 0.01 0.01 0.01 0.02 R2- between 0.28 0.27 0.25 0.26 R2 - overall 0.02 0.03 0.02 0.03 No of firms 4204 3968 3991 3800 No of countries 54 54 54 54 *, **, *** indicate significance levels of 10, 5, and 1 %, respectively.


43
Table V Firm Growth: The Impact of Obstacles
The regression estimated is: Firm Growth = α + β1 Government + β2 Foreign + β3 Exporter + β4 Subsidized + β5 No. of Competitors+ β6 Manufacturing + β7 Services + β8 Inflation + β9 GDP per capita + β10 GDP+ β11 Growth+ β12 Obstacle + ε.
Firm Growth is the percentage change in firm sales over the past three years. Government and Foreign are dummy variables that take the value of one if the firm has government or foreign ownership and zero if not. Exporter is a dummy variable that indicates if the firm is an exporting firm. Subsidized is also a dummy variable that indicates if the firm receives subsidies from the national or local authorities. No. of Competitors is the logarithm of the firm’s number of competitors. Manufacturing and Services are industry dummies. Inflation is the log difference of the consumer price index. GPP per capita is real GDP per capita in U.S. dollars. GDP is the logarithm of GDP in millions of U.S. dollars. Growth is the growth rate of GDP. Obstacles are Financing obstacles in Panel A, Legal obstacles in Panel B, and Corruption obstacles in Panel C. Financing obstacles range between 1and 4. Legal obstacles range between 1 and 6 (1 and 4 in the case of the summary obstacle). The range of the corruption indicators is indicated in parentheses after the variable name, with the first number indicating the least constraint. Unless otherwise noted, obstacles take higher values for higher obstacles and they are entered one at a time. We estimate all regressions using country random effects. We obtain firm level variables from the WBES. Detailed variable definitions and sources are given in Appendix A
Panel A: Financing Obstacles Financing
obstacle Collateral requirements
Bank paperwork/ bureaucracy
High interest Rates
Need special connections with banks
Banks lack money to lend
Access to foreign banks
Access to non-bank equity
Access to export finance
Access to financing for leasing equipment
Inadequate credit/financial information on customers
Access to long term loans
-0.031*** (0.009)
-0.027*** (0.008)
-0.028*** (0.008)
-0.032*** (0.010)
-0.023*** (0.009)
-0.029*** (0.008)
-0.009 (0.008)
0.007 (0.009)
-0.009 (0.009)
-0.022** (0.009)
0.001 (0.008)
-0.010 (0.008)
R2- with. 0.01 0.01 0.01 0.01 0.01 0.01 0.01 0.01 0.01 0.01 0.01 0.01 R2- bet. 0.28 0.25 0.26 0.26 0.26 0.26 0.24 0.25 0.29 0.26 0.27 0.25 R2 - all 0.02 0.02
0.02 0.02 0.02 0.02 0.02 0.02 0.02 0.02 0.02 0.02
Impact -0.087*** -0.070*** -0.070*** -0.104*** -0.051*** -0.062*** -0.002 0.001 -0.018 -0.045*** 0.001 -0.027 N (firms) 4204 3945 4069 4103 3949 3853 3482 3464 3007 3524 3703 3928 N(country) 54 54 54 54 54 54 54 54 54 54 54 54 *, **, *** indicate significance levels of 10, 5, and 1 %, respectively.

44
Panel B: Legal Obstacles Legal
constraint Availability of info. on laws and regulations
Interpretation of laws and regulations are consistent
Overall quality and efficiency of courts
Courts are fair and impartial
Courts are quick
Courts are affordable
Courts are consistent
Court decisions are enforced
Confidence in legal system to enforce contract and property rights
Confidence in legal system – 3 years ago
-0.029*** (0.009)
0.002 (0.006)
-0.003 (0.007)
-0.003 (0.008)
-0.004 (0.007)
0.005 (0.008)
-0.009 (0.007)
0.002 (0.007)
0.011 (0.007)
-0.005 (0.007)
0.004 (0.007)
R2- with. 0.01 0. 01 0.01 0.01 0.01 0.01 0.01 0.01 0.01 0.01 0.01 R2- bet. 0.27 0.27 0.26 0.27 0.27 0.28 0.30 0.27 0.31 0.28 0.32 R2 - all 0.03 0.02
0.02 0.02 0.02 0.02 0.02 0.02 0.03 0.02 0.02
Impact -0.063*** 0.006 -0.011 -0.014 -0.013 0.026 -0.035 0.007 0.039 -0.015 0.014 N (firms) 3968 4202 4216 3513 3924 3982 3901 3909 3896 4197 3926 N(country) 54 54 54 54 54 54 54 54 54 54 54
Panel C: Corruption Obstacles
Corruption obstacle (1-4)
Corruption of bank officials (1-4)
Firms have to make “additional payments” to get things done (6-1)
Firms know in advance the amount of “additional payments” (6-1)
If “additional payments” are made, services are delivered as agreed (1-6)
If one agent asks for payments it is possible to find others to get the correct treatment without payment (1-6)
Proportion of revenues paid as bribes – annual figure for each firm (1-7)
Proportion of contract value that must be paid as “payment” to do business with the government (1-6)
Percentage of senior management’s time spent with government officials to understand laws and regulations (1-6)
-0.021*** (0.009)
-0.017* (0.010)
-0.003 (0.006)
-0.002 (0.008)
-0.012 (0.009)
-0.002 (0.006)
-0.037*** (0.008)
0.004 (0.007)
-0.012* (0.007)
R2- with. 0.01 0.01 0.01 0.01 0.02 0.01 0.03 0.02 0.01 R2- bet. 0.25 0.26 0.28 0.19 0.20 0.28 0.16 0.21 0.24 R2 - all 0.02 0.02
0.02 0.02 0.02 0.02 0.03 0.04 0.02
Impact -0.052*** -0.030* -0.014 -0.007 0.035 -0.006 0.087*** 0.011 -0.027* N (firms) 3991 3566 3916 2306 2266 3595 2824 1734 3981 N(country) 54 54 54 53 53 53 53 52 54 *, **, *** indicate significance levels of 10, 5, and 1 %, respectively.

45
Table VI Firm Growth and Individual Obstacles: Large Compared to Small Firms
The regression estimated is:
Firm Growth = α + β1 Government + β2 Foreign + β3 Exporter + β4 Subsidized + β5 No. of Competitors + β6 Manufacturing + β7 Services + β8 Inflation + β9 GDP per capita + β10 GDP+ β11 Growth+ β12 LSize+ β13 Obstacle*Small + β14 Obstacle*Medium + β15 Obstacle*Large+ ε.
Firm Growth is the percentage change in firm sales over the past three years. Government and Foreign are dummy variables that take the value of one if the firm has government or foreign ownership and zero if not. Exporter is a dummy variable that indicates if the firm is an exporting firm. Subsidized is also a dummy variable that indicates if the firm receives subsidies from the national or local authorities. No. of Competitors is the logarithm of the number of the firm’s competitors. Manufacturing and Services are industry dummies. Inflation is the log difference of the consumer price index. GDP per capita is real GDP per capita in U.S. dollars. GDP is the logarithm of GDP in millions of U.S. dollars. Growth is given by the growth rate of GDP. LSize is given by logarithm of firm sales. Obstacles are Financing obstacles in Panel A, Legal obstacles in Panel B, and Corruption obstacles in Panel C. Financing obstacles range between 1 and 4. Legal obstacles range between 1 and 6 (1 and 4 in the case of the summary obstacle). The range of the corruption indicators is indicated in parentheses after the variable name, with the first number indicating the least constraint. Unless otherwise noted, obstacles take higher values for higher obstacles and they are entered one at a time. Obstacles are multiplied by a vector of size dummy variables, Small, Medium, and Large. They take the value of one if a firm is small (or medium or large) and zero otherwise. Small firms employ 5 to 50 employees, medium-size firms employ 51 to 500 employees, and large firms employ more than 500 employees. For brevity only these coefficients (β13- β15) are reported below. Impact (L-S) gives the coefficient for large firms multiplied by the mean value of the obstacle for large firms minus the coefficient for small firms multiplied by the mean value of the obstacle for small firms. Its significance is based on a Chi-square test of these differences. We estimate all regressions using country random effects. Detailed variable definitions and sources are given in Appendix A.
Panel A: Financial Obstacles Financing
obstacle Collateral requirements
Bank paperwork/ bureaucracy
High interest Rates
Need special connections with banks
Banks lack money to lend
Access to foreign banks
Access to non-bank equity
Access to export finance
Access to financing for leasing equipment
Inadequate credit/financial information on customers
Access to long term loans
Large -0.023** (0.012)
-0.019 (0.012)
-0.012 (0.012)
-0.024** (0.012)
-0.007 (0.013)
-0.020 (0.013)
-0.002 (0.013)
-0.004 (0.014)
0.005 (0.014)
-0.006 (0.014)
0.012 (0.013)
0.000 (0.011)
Medium
-0.031*** (0.009)
-0.025*** (0.009)
-0.027*** (0.009)
-0.031*** (0.010)
-0.021** (0.010)
-0.029*** (0.009)
0.000 (0.010)
0.002 (0.010)
-0.006 (0.010)
-0.023** (0.010)
-0.001 (0.010)
-0.012 (0.009)
Small
-0.034*** (0.009)
-0.031*** (0.009)
-0.031*** (0.009)
-0.037*** (0.010)
-0.028*** (0.010)
-0.034*** (0.010)
-0.002 (0.010)
0.000 (0.011)
-0.019* (0.011)
-0.027*** (0.011)
-0.001 (0.010)
-0.012 (0.009)
R2- with. 0.01 0.01 0.01 0.01 0.01 0.01 0.01 0.01 0.01 0.01 0.01 0.01 R2- bet. 0.29 0.25 0.26 0.27 0.27 0.28 0.26 0.28 0.30 0.30 0.28 0.27 R2 - all 0.03 0.03 0.03 0.03 0.02 0.03 0.02 0.02 0.03 0.03 0.02 0.02 Impact (L-S) 0.040* 0.038 0.050** 0.043* 0.051** 0.032 0.002 -0.007 0.047* 0.050*** 0.028 0.033 N (firms) 4182 3926 4048 4083 3928 3832 3463 3444 2990 3504 3682 3907 N(country) 54 54 54 54 54 54 54 54 54 54 54 54 *, **, *** indicate significance levels of 10, 5, and 1 %, respectively.

46
Panel B: Legal Obstacles Legal
obstacle Availability of info. on laws and regulations
Interpretation of laws and regulations are consistent
Overall quality and efficiency of courts
Courts are fair and impartial
Courts are quick
Courts are affordable
Courts are consistent
Court decisions are enforced
Confidence in legal system to enforce contract and property rights
Confidence in legal system – 3 years ago
Large -0.013 (0.013)
0.016 (0.010)
0.006 (0.009)
0.012 (0.010)
0.011 (0.010)
0.013 (0.009)
-0.003 (0.009)
0.014 (0.009)
0.024*** (0.009)
0.010 (0.010)
0.017* (0.009)
Medium
-0.026*** (0.010)
0.002 (0.007)
-0.005 (0.007)
-0.002 (0.008)
-0.001 (0.008)
0.006 (0.008)
-0.007 (0.007)
0.003 (0.007)
0.010 (0.007)
-0.003 (0.008)
0.006 (0.008)
Small
-0.040*** (0.011)
-0.002 (0.007)
-0.005 (0.008)
-0.091 (0.008)
-0.010 (0.008)
0.002 (0.008)
-0.013* (0.007)
-0.004 (0.008)
0.007 (0.007)
-0.010 (0.008)
-0.003 (0.008)
R2- with. 0.02 0. 01 0.01 0.01 0.01 0.01 0.01 0.01 0.01 0.01 0.01 R2- bet. 0.26 0.28 0.27 0.26 0.27 0.29 0.30 0.27 0.31 0.28 0.32 R2 – all 0.03 0.02 0.02 0.02 0.02 0.02 0.02 0.02 0.03 0.02 0.03 Impact (L-S) 0.057** 0.049** 0.038 0.095*** 0.078*** 0.059** 0.041 0.073*** 0.061** 0.063** 0.065** N (firms) 3946 4180 4295 3496 3902 3960 3880 3888 3874 4175 3905 N(country) 54 54 54 54 54 54 54 54 54 54 54
Panel C: Corruption Obstacles
Corruption Obstacle (1-4)
Corruption of bank Officials (1-4)
Firms have to make “additional payments” to get things done (6-1)
Firms know in advance the amount of “additional payments” (6-1)
If “additional payments” are made, services are delivered as agreed (1-6)
If one agent asks for payments it is possible to find others to get the correct treatment without payment (1-6)
Proportion of revenues paid as bribes – annual figure for each firm (1-7)
Proportion of contract value that must be paid as “payment” to do business with the government (1-6)
Percentage of senior management’s time spent with government officials to understand laws and regulations (1-6)
Large -0.007 (0.012)
-0.007 (0.016)
0.017 (0.011)
0.018 (0.014)
0.004 (0.014)
0.011 (0.009)
-0.013 (0.015)
0.020 (0.014)
-0.003 (0.011)
Medium
-0.017* (0.010)
-0.012 (0.012)
-0.001 (0.007)
-0.002 (0.009)
-0.005 (0.011)
-0.001 (0.007)
-0.033*** (0.010)
0.006 (0.009)
-0.014* (0.008)
Small
-0.030*** (0.010)
-0.024** (0.011)
-0.011 (0.007)
-0.009 (0.009)
-0.018* (0.011)
-0.009 (0.007)
-0.053*** (0.009)
-0.001 (0.009)
-0.017* (0.009)
R2- with. 0.01 0.01 0.01 0.02 0.02 0.01 0.03 0.02 0.01 R2- bet. 0.25 0.28 0.28 0.20 0.21 0.29 0.23 0.21 0.26 R2 – all 0.03 0.03 0.03 0.03 0.03 0.03 0.04 0.05 0.02 Impact (L-S) 0.060** 0.034 0.128*** 0.084** 0.067* 0.052** 0.117*** 0.047 0.029 N (firms) 3969 3545 3896 2293 2255 3581 2805 1712 3963 N(country) 54 54 53 53 53 53 53 52 54 *, **, *** indicate significance levels of 10, 5, and 1 %, respectively.
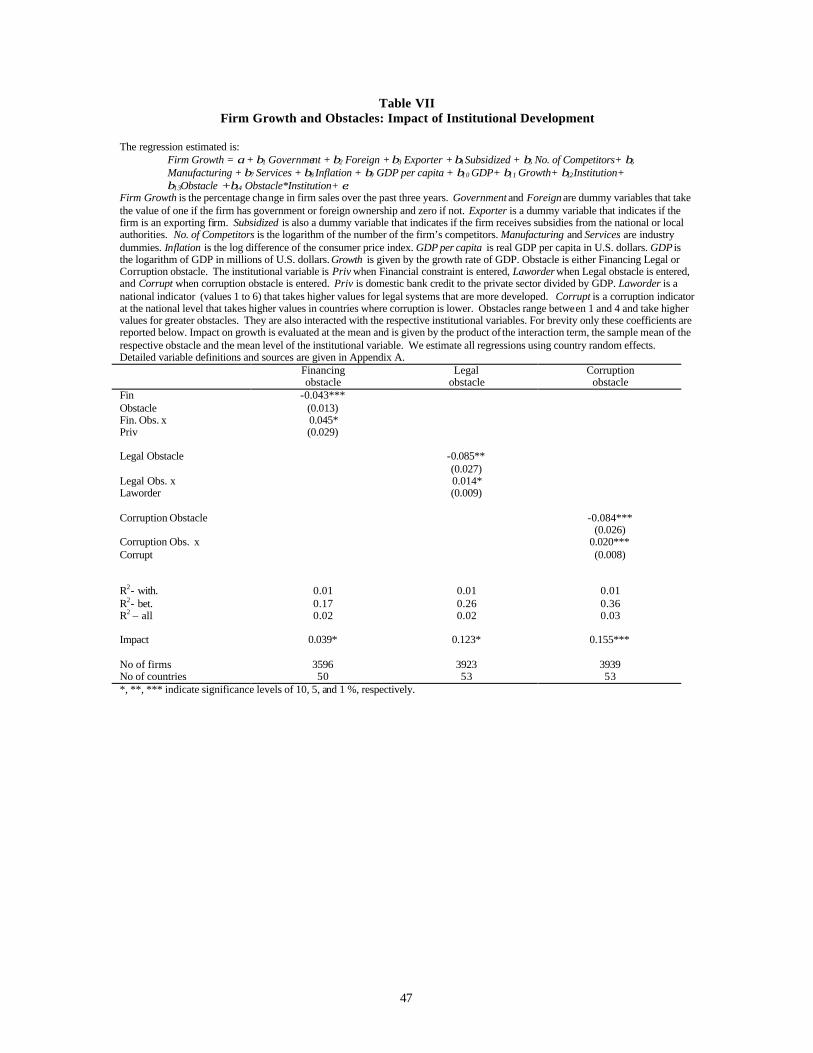
47
Table VII Firm Growth and Obstacles: Impact of Institutional Development
The regression estimated is:
Firm Growth = α + β1 Government + β2 Foreign + β3 Exporter + β4 Subsidized + β5 No. of Competitors+ β6
Manufacturing + β7 Services + β8 Inflation + β9 GDP per capita + β10 GDP+ β11 Growth+ β12Institution+ β13Obstacle + β14 Obstacle*Institution+ ε.
Firm Growth is the percentage change in firm sales over the past three years. Government and Foreign are dummy variables that take the value of one if the firm has government or foreign ownership and zero if not. Exporter is a dummy variable that indicates if the firm is an exporting firm. Subsidized is also a dummy variable that indicates if the firm receives subsidies from the national or local authorities. No. of Competitors is the logarithm of the number of the firm’s competitors. Manufacturing and Services are industry dummies. Inflation is the log difference of the consumer price index. GDP per capita is real GDP per capita in U.S. dollars. GDP is the logarithm of GDP in millions of U.S. dollars. Growth is given by the growth rate of GDP. Obstacle is either Financing Legal or Corruption obstacle. The institutional variable is Priv when Financial constraint is entered, Laworder when Legal obstacle is entered, and Corrupt when corruption obstacle is entered. Priv is domestic bank credit to the private sector divided by GDP. Laworder is a national indicator (values 1 to 6) that takes higher values for legal systems that are more developed. Corrupt is a corruption indicator at the national level that takes higher values in countries where corruption is lower. Obstacles range between 1 and 4 and take higher values for greater obstacles. They are also interacted with the respective institutional variables. For brevity only these coefficients are reported below. Impact on growth is evaluated at the mean and is given by the product of the interaction term, the sample mean of the respective obstacle and the mean level of the institutional variable. We estimate all regressions using country random effects. Detailed variable definitions and sources are given in Appendix A. Financing
obstacle Legal
obstacle Corruption
obstacle Fin Obstacle
-0.043*** (0.013)
Fin. Obs. x Priv
0.045* (0.029)
Legal Obstacle -0.085** (0.027)
Legal Obs. x Laworder
0.014* (0.009)
Corruption Obstacle -0.084*** (0.026)
Corruption Obs. x Corrupt
0.020*** (0.008)
R2- with. 0.01 0.01 0.01 R2- bet. 0.17 0.26 0.36 R2 – all 0.02 0.02 0.03 Impact 0.039* 0.123* 0.155*** No of firms 3596 3923 3939 No of countries 50 53 53 *, **, *** indicate significance levels of 10, 5, and 1 %, respectively.

48
Table VIII Firm Growth and the Impact of Obstacles: Firm Size and National Differences
The regression estimated is: Firm Growth = α + β1 Government + β2 Foreign +β3 Exporter +β4Subsidized + β5No. of Comp.+ β6Manuf. + β7 Services + β8 Inflation + β9 Gdp/cap + β10 GDP+ β11 Growth + β12 Institution*Small + β13 Institution*Medium+ β14 Institution*Large+ β15 LSize+β16Obstacle*Small +β17Obstacle*Medium + β18Obstacle*Large+β19 Obstacle*Small*Institution + β20Obstacle*Medium*Institution + β21 Obstacle*Large*Institution+ ε. Firm Growth is the percentage change in firm sales over the past three years. Government and Foreign are dummy variables that take the value one if the firm has government or foreign ownership and zero if not. Exporter is a dummy variable that indicates if the firm is an exporting firm. Subsidized is also a dummy variable that indicates if the firm receives subsidies from the national or local authorities. No. of Competitors is the logarithm of the number of the firm’s competitors. Manufacturing and Services are industry dummies. LSize is given by logarithm of firm sales. Inflation is the log difference of the consumer price index. GDP per capita is real GDP per capita in U.S. dollars. GDP is the logarithm of GDP in millions of U.S. dollars. Growth is the growth rate of GDP. Institution is either Priv, Laworder, or Corrupt. Priv is domestic bank credit to the private sector divided by GDP. Laworder is a national indicator (values between 1 and 6) that takes higher values for legal systems that are more developed. Corrupt is a corruption indicator (values between 1 and 6) at the national level that takes higher values in countries where corruption is lower. Obstacle is either Financing, Legal, or Corruption. These are summary firm-level obstacles as indicated in the firm questionnaire. They take values between 1 and 4, where 1 indicates no obstacle and 4 indicates a major obstacle. Small, Medium , and Large are dummy variables. They take the value one if a firm is small (or medium or large) and zero otherwise. Small firms employ 5 to 50 employees, medium size firms employ 51 to 500 employees, and large firms employ more than 500 employees. Financing obstacles are interacted with Priv, legal obstacles are interacted with Laworder, and corruption obstacles are interacted with Corrupt. These are also interacted with size dummies. Only these interaction terms are reported for brevity. Impact (L-S) is β21 evaluated at mean level of the institutional variable and mean obstacle for large firms minus β19 evaluated at mean level of the institutional variable and mean obstacle for small firms. Its significance is based on a Chi-square test of these differences. We estimate all regressions using country random effects. We obtain firm level variables obtained from the WBES. Detailed variable definitions and sources are given in Appendix A. (1) (2) (3) Financing obstacle: Large -0.023
(0.016)
Medium -0.031** (0.014)
Small -0.058*** (0.014)
Large x Priv -0.039 (0.051)
Medium x Priv 0.021 (0.038)
Small x Priv 0.097*** (0.039)
Legal obstacle: Large -0.060
(0.046)
Medium -0.092** (0.040)
Small -0.104*** (0.044)
Large x Laworder
0.009 (0.013)
Medium x Laworder
0.018* (0.010)
Small x Laworder
0.015* (0.010)
Corruption obstacle : Large
-0.020 (0.037)
Medium -0.067** (0.028)
Small
-0.117*** (0.029)
Large x Corrupt
0.002 (0.013)
Medium x Corrupt
0.018** (0.009)
Small x Corrupt
0.026*** (0.009)
R2- within 0.02 0.02 0.02 R2- between 0.34 0.26 0.43 R2 - overall 0.04 0.03 0.04 Impact(L-S) -0.126*** -0.040 -0.197*** No of firms 3579 3906 3922 No of countries 50 53 53 *, **, *** indicate significance levels of 10, 5, and 1 %, respectively.

49
Table IX Sensitivity Test : IV Estimation and Using Real Firm Growth
The IV regression estimated is:
Firm Growth = α + β1 Government + β2 Foreign + β3 Exporter + β4Subsidized + β5 No. of Competitors + β6
Manufacturing + β7 Services + β8 Inflation + β9 GDP per capita + β10 GDP+ β11 Growth +β12 Financing + β13 Legal + β14Corruption+ε.
Firm Growth is the percentage change in firm sales over the past three years. Government and Foreign are dummy variables that take the value of one if the firm has government or foreign ownership and zero if not. Exporter is a dummy variable that indicates if the firm is an exporting firm. Subsidized is also a dummy variable that indicates if the firm receives subsidies from the national or local authorities. No. of Competitors is the logarithm of the number of the firm’s competitors. Manufacturing and Services are industry dummies. Inflation is the log difference of the consumer price index. GDP per capita is real GDP per capita values in U.S. dollars. GDP is the logarithm of GDP in millions of U.S. dollars. Growth is the growth rate of GDP. Financing, Legal, and Corruption are summary obstacles as indicated in the firm questionnaire. They take values between 1 and 4, where 1 indicates no obstacle and 4 indicates major obstacle. In Panel A, we estimate all regressions using instrumental variables, where the firm level obstacles are instrumented by country level institutional variables (Priv, Laworder and Corrupt). In Panel B, obstacles are interacted with size dummies — small, medium, and large — and are instrumented by the three country level institutional variables interacted by the three size dummies. In this specification we also control for Size in the regressio n. In Panel C, instead of interacting the obstacles with the three size dummies, we interact them with firm size. In Panel D, the dependent variable, Firm Growth , is replaced by real firm growth constructed using GDP deflator. Inflation is dropped from t he specification. In Panel E, firm growth and obstacles are averaged for different size groups in each country. The averaged firm growth is regressed on averaged obstacles and all macro variables plus an interaction term of the averaged obstacle with a dummy variable that takes the value one if the firm is a small or medium firm and zero otherwise. Each panel also reports Impact - the relevant coefficient evaluated at the mean level of the obstacle, or Impact (L-S), the differential impact on large versus small firms evaluated at the mean level of the obstacle for large and small firms. For brevity we report only the coefficients of the obstacles. Robust standard errors are reported in parentheses. We obtain firm level variables from the WBES. Detailed variable definitions and sources are given in Appendix A. Panel A: (1) (2) (3) Financing -0.575***
(0.125)
Legal -0.029*** (0.009)
Corruption -0.021*** (0.009)
Impact -1.637*** -0.063*** -0.051*** No of firms 3539 3390 3396 Panel B: Financing * large -0.341***
(0.111)
Financing *medium -0.448*** (0.111)
Financing *small -0.790*** (0.186)
Legal * large 0.073 (0.065)
Legal *medium 0.023 (0.081)
Legal *small -0.104 (0.076)
Corruption * large -0.156** (0.081)
Corruption *medium -0.207*** (0.087)
Corruption*small -0.272*** (0.084)
Impact (L-S) 1.431*** 0.382*** 0.314*** No of firms 3538 3389 3395 *, **, *** indicate significance levels of 10, 5, and 1 %, respectively.

50
Panel C Financing -0.046***
(0.013)
Financing*size 0.002* (0.001)
Legal -0.049*** (0.013)
Legal*size 0.003** (0.001)
Corruption -0.036*** (0.012)
Corruption*size 0.002* (0.001)
R2- within 0.01 0.01 0.01 R2- between 0.31 0.28 0.27 R2 – overall 0.03 0.03 0.03 Impact (at mean size) -0.032*** -0.029*** -0.021*** No of firms 4183 3947 3970 Panel D Financing -0.030***
(0.009)
Legal -0.030*** (0.009)
Corruption -0.021*** (0.009)
R2- within 0.01 0.01 0.01 R2- between 0.28 0.28 0.27 R2 – overall 0.15 0.16 0.14 Impact -0.085*** -0.065*** -0.051*** No of firms 4204 3968 3991 No of countries 54 54 54
Panel E Financing 0.015
(0.0364)
Financing*SME -0.021** (0.011)
Legal 0.043 (0.038)
Legal*SME -0.027** (0.014)
Corruption -0.003 (0.032)
Corruption*SME -0.024** (0.012)
R2 0.12 0.12 0.12 Impact (L-SME) 0.060*** 0.059*** 0.058*** No of observations 162 162 162 No of countries 54 54 54 *, **, *** indicate significance levels of 10, 5, and 1 %, respectively.
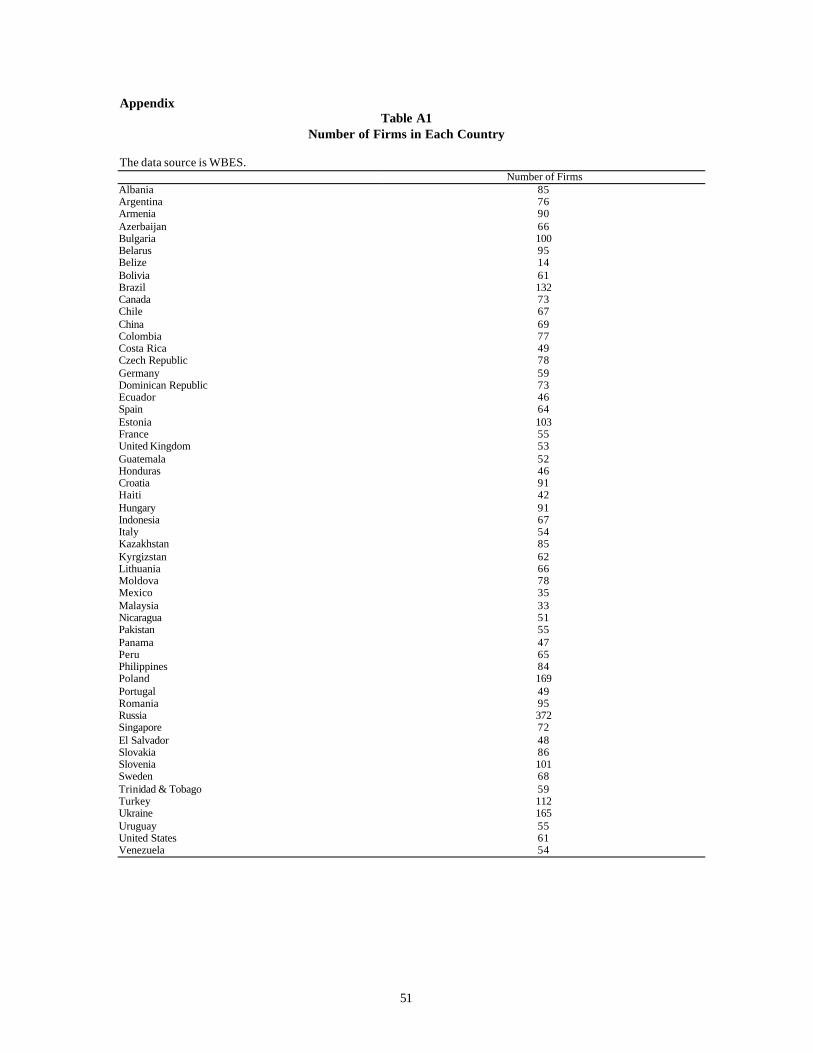
51
Appendix Table A1
Number of Firms in Each Country The data source is WBES. Number of Firms Albania 85 Argentina 76 Armenia 90 Azerbaijan 66 Bulgaria 100 Belarus 95 Belize 14 Bolivia 61 Brazil 132 Canada 73 Chile 67 China 69 Colombia 77 Costa Rica 49 Czech Republic 78 Germany 59 Dominican Republic 73 Ecuador 46 Spain 64 Estonia 103 France 55 United Kingdom 53 Guatemala 52 Honduras 46 Croatia 91 Haiti 42 Hungary 91 Indonesia 67 Italy 54 Kazakhstan 85 Kyrgizstan 62 Lithuania 66 Moldova 78 Mexico 35 Malaysia 33 Nicaragua 51 Pakistan 55 Panama 47 Peru 65 Philippines 84 Poland 169 Portugal 49 Romania 95 Russia 372 Singapore 72 El Salvador 48 Slovakia 86 Slovenia 101 Sweden 68 Trinidad & Tobago 59 Turkey 112 Ukraine 165 Uruguay 55 United States 61 Venezuela 54

52
Appendix : Variables and Sources Sources of data: WDI = World Development Indicators IFS = International Financial Statistics ICRG = International Country Risk Guide WBES = World Business Environment Survey
Variable Definition Original Source GDP GDP in current U.S. dollars, average 1995-99 WDI
GDP per capita Real per capita GDP, average 1995-99 WDI
Growth Growth rate of GDP, average 1995-99 WDI
Inflation rate Log difference of Consumer Price Index IFS, line 64
Priv {(0.5)*[F(t)/P_e(t) + F(t -1)/P_e(t-1)]}/[GDP(t)/P_a(t)], where F is credit by deposit money banks to the private sector (lines 22d ), GDP is line 99b, P_e is end-of period CPI (line 64) and P_a is the average CPI for the year.
IFS
Laworder Measure of the law and order tradition of a country. It is an average over 1995-97. It ranges from 6, strong law and order tradition, to 1, weak law and order tradition.
ICRG
Corrupt Measure of corruption in government. It ranges from 1 to 6 and is an average over 1995-97. Lower scores indicate that "high government officials are likely to demand special payments" and "illegal payments are generally expected throughout lower levels of government" in the form of "bribes connected with import and export licenses, exchange controls, tax assessment, policy protection, or loans.”
ICRG
Firm Growth Estimate of the firm's sales growth over the past three years. WBES
Government Dummy variable that takes on the value one if any government agency or state body has a financial stake in the ownership of the firm, zero otherwise.
WBES
Foreign Dummy variable that takes on the value one if any foreign company or individual has a financial stake in the ownership of the firm, zero otherwise.
WBES
Exporter Dummy variable that takes on the value one if firm exports, zero otherwise.
WBES
Subsidized Dummy variable that takes on value one if firm receives subsidies (including tolerance of tax arrears) from local or national government.
WBES
Manufacturing Dummy variable that takes on the value one if firm is in the manufacturing industry, zero otherwise.
WBES
Services Dummy variable that takes on the value one if firm is in the service industry, zero otherwise.
WBES

53
No. of Competitors Regarding your firm's major product line, how many competitors do you face in your market?
WBES
Firm size dummies A firm is defined as small if it has between 5 and 50 employees, medium-sized if it has between 51 and 500 employees, and large if it has more than 500 employees.
WBES
Size Logarithm of firm sales WBES
Financing Obstacle How problematic is financing for the operation and growth of your business: no obstacle (1), a minor obstacle (2), a moderate obstacle (3) or a major obstacle (4)?
WBES
Legal Obstacle How problematic is functioning of the judiciary for the operation and growth of your business: no obstacle (1), a minor obstacle (2), a moderate obstacle (3) or a major obstacle (4)?
WBES
Corruption Obstacle How problematic is corruption for the operation and growth of your business: no obstacle (1), a minor obstacle (2), a moderate obstacle (3) or a major obstacle (4)?
WBES
Collateral requirements Are collateral requirements of banks/financial institutions no obstacle (1), a minor obstacle (2), a moderate obstacle (3) or a major obstacle (4)?
WBES
Bank paperwork/ bureaucracy
Is bank paperwork/bureaucracy no obstacle (1), a minor obstacle (2), a moderate obstacle (3) or a major obstacle (4)?
WBES
High interest rates Are high interest rates no obstacle (1), a minor obstacle (2), a moderate obstacle (3) or a major obstacle (4)?
WBES
Need special connections with banks
Is the need of of special connections with banks/financial institutions no obstacle (1), a minor obstacle (2), a moderate obstacle (3) or a major obstacle (4)?
WBES
Banks lack money to lend
Is banks' lack of money to lend no obstacle (1), a minor obstacle (2), a moderate obstacle (3) or a major obstacle (4)?
WBES
Access to foreign banks
Is the access to foreign banks no obstacle (1), a minor obstacle (2), a moderate obstacle (3) or a major obstacle (4)?
WBES
Access to non-bank equity
Is the access to non-bank equity/investors/partners no obstacle (1), a minor obstacle (2), a moderate obstacle (3) or a major obstacle (4)?
WBES
Access to export finance
Is the access to specialized export finance no obstacle (1), a minor obstacle (2), a moderate obstacle (3) or a major obstacle (4)?
WBES
Access to financing for leasing equipment
Is the access to lease finance for equipment no obstacle (1), a minor obstacle (2), a moderate obstacle (3) or a major obstacle (4)?
WBES
Inadequate credit/financial information on costumers
Is inadequate credit/financial information on custumers no obstacle (1), a minor obstacle (2), a moderate obstacle (3) or a major obstacle (4)?
WBES

54
Access to long-term loans
Is the access to long-term finance no obstacle (1), a minor obstacle (2), a moderate obstacle (3) or a major obstacle (4)?
WBES
Availability of information on laws and regulations
In general, information on the laws and regulations affecting my firm is easy to obtain: (1) fully agree, (2) agree in most cases, (3) tend to agree, (4) tend to disagree, (5) disagree in most cases, (6) fully disagree.
WBES
Interpretation of laws and regulations are consistent
In general, interpretation of regulations affecting my firm are consistent and predictable: (1) fully agree, (2) agree in most cases, (3) tend to agree, (4) tend to disagree, (5) disagree in most cases, (6) fully disagree.
WBES
Overall quality and efficiency of courts
Overall quality and efficiency of the judiciary/courts: (1) very good, (2) good, (3) slightly good, (4) slightly bad, (5) bad, (6) very bad.
WBES
Courts are fair and impartial
In resolving business disputes, do you believe your country's courts to be fair and impartial: (1) always, (2) usually, (3) frequently, (4) sometimes, (5) seldom, (6) never.
WBES
Courts are quick In resolving business disputes, do you believe your country's courts to be quick: (1) always, (2) usually, (3) frequently, (4) sometimes, (5) seldom, (6) never.
WBES
Courts are affordable In resolving business disputes, do you believe your country's courts to be affordable: (1) always, (2) usually, (3) frequently, (4) sometimes, (5) seldom, (6) never.
WBES
Courts are consistent In resolving business disputes, do you believe your country's courts to be consistent: (1) always, (2) usually, (3) frequently, (4) sometimes, (5) seldom, (6) never.
WBES
Court decisions are enforced
In resolving business disputes, do you believe your country's courts to enforce decisions: (1) always, (2) usually, (3) frequently, (4) sometimes, (5) seldom, (6) never.
WBES
Confidence in legal system to enforce contract and property rights
I am confident that the legal system will uphold my contract and property rights in business disputes: (1) fully agree, (2) agree in most cases, (3) tend to agree, (4) tend to disagree, (5) disagree in most cases, (6) fully disagree.
WBES
Confidence in legal system - 3 years ago
I am confident that the legal system will uphold my contract and property rights in business disputes: three years ago - (1) fully agree, (2) agree in most cases, (3) tend to agree, (4) tend to disagree, (5) disagree in most cases, (6) fully disagree.
WBES
Corruption of bank officials
Is the corruption of bank officials no obstacle (1), a minor obstacle (2), a moderate obstacle (3) or a major obstacle (4)?
WBES
Firms have to make "additional payments" in advance
It is common for firms in my line of business to have to pay some irregular "additional payments" to get things done: (1) always, (2) mostly, (3) frequently, (4) sometimes, (5) seldom, (6) never.
WBES

55
Firms know the amount of "additional payments" in advance
Firms in my line of business usually know in advance about how much this "additional payment" is: (1) always, (2) mostly, (3) frequently, (4) sometimes, (5) seldom, (6) never.
WBES
If "additional payments" are made, services are delivered
If a firm pay the required "additional payments", the service is usually also delivered as agreed: (1) always, (2) mostly, (3) frequently, (4) sometimes, (5) seldom, (6) never.
WBES
It is possible to find honest agents to replace corrupt ones
If a government agent acts against the rules, I can usually go to another official or to his superior and get the correct treatment without recourse to unofficial payments: (1) always, (2) mostly, (3) frequently, (4) sometimes, (5) seldom, (6) never.
WBES
Proportion of revenues paid as bribes
On average, what percentage of revenues do firms like your typically pay per year in unofficial payments to public officials: (1) 0%, (1) less than 1%, (3) 1% to 1.99%, (4) 2% to 9.99%, (5) 10% to 12%, (6) 13% to 25%, (7) over 25%.
WBES
Proportion of contract value that must be paid for government contracts
When firms in your industry do business with the government, how much of the contract value must they offer in additional or unofficial payments to secure the contract: (1) 0 %, (1) up to 5%, (3) 6% to 10%, (4) 11% to 15%, (5) 16% to 20%, (6) over 20 %.
WBES
Management's time (%) spent with officials to understand laws and regulations
What percentage of senior management's time per year is spent in dealing with government officials about the application and interpretation of laws and regulations?
WBES
.

56