financial anxiety and stress among u.s. households: new
TRANSCRIPT

Title of Report | 1www.gflec.org
April 2021
Authors
Andrea Hasler Global Financial Literacy Excellence Center The George Washington University School of Business Annamaria Lusardi Global Financial Literacy Excellence Center The George Washington University School of Business
Olivia Valdes FINRA Investor Education Foundation
Financial Anxiety and Stress among U.S. Households: New Evidence from the National
Financial Capability Study and Focus Groups
Report
This work was conducted with financial support from the FINRA Investor Education Foundation (FINRA Foundation) and is based on data from the National Financial Capability Study (NFCS). The NFCS is a project of the FINRA Foundation.

Financial Anxiety and Stress among U.S. Households: New Evidence from the National Financial Capability Study and Focus Groups
Andrea Hasler, Annamaria Lusardi, and Olivia Valdes
April 28, 2021
ABSTRACT
The economic impact of the COVID-19 crisis has brought to light the deeply rooted financial struggles that many Americans face. This paper shows that even before the pandemic, a substantial share of households was already anxious and stressed about their personal finances. The greatest levels of anxiety and stress were expressed by women, young adults, those with lower income, those with more financially dependent children, those who are not married, and those who are unemployed. In this paper, we analyze factors likely contributing to high levels of financial anxiety and stress. The empirical analysis is based on the FINRA Foundation’s 2018 National Financial Capability Study (NFCS) and complemented by findings from focus groups that were conducted in 2020. We find that lack of assets, high debt, and money management challenges are major contributing factors to high levels of financial anxiety and stress. We also find that financial anxiety and stress can have long-term consequences: those who are financially anxious and stressed are less likely to plan for retirement. Financial literacy seems to matter. Those who could correctly answer three questions designed to measure basic financial literacy are significantly less likely to feel financially anxious or stressed. Finally, focus group findings reveal that individuals who experience financial anxiety and stress engage in daily monitoring of their finances and make decisions that are informed by their financial worries.
INTRODUCTION
The economic impact of the current pandemic has brought to light the deeply rooted financial insecurity that many Americans face. Our research shows that even before the pandemic, a substantial share of households was stressed about their personal finances and could not face a mid-sized shock, let alone the loss of income and unexpected expenses many have faced during the ongoing crisis. In 2018, the FINRA Foundation’s National Financial Capability Study (NFCS) added questions on financial anxiety and stress and found that over half of respondents (53%) said that thinking about their finances makes them anxious and 44% said that discussing their finances is stressful. The greatest anxiety about personal

Financial Anxiety and Stress 4/28/2021
Page 2
finances was expressed by single women and young adults, demographic groups that have been hit particularly hard by the current crisis. Over the past year, their financial struggles have likely been further exacerbated and their anxiety and stress levels worsened. This paper will analyze responses to the NFCS’s financial stress and anxiety questions in more detail and shed light on the factors likely contributing to high levels of financial anxiety and stress.
Various other indicators reinforce the picture of Americans’ ill-preparedness to face financial shocks. Again in 2018, well before the pandemic hit and at a time when the economy was in expansion, many were already struggling with their personal finances. At that time, around one in four adults reported not being at all satisfied with their personal financial condition, including their assets, debts, and savings, and more than one in three reported just getting by financially.1 Many U.S. adults were also unable to cope with a mid-sized financial shock and felt financially distressed. Around 31% responded that they could probably not or certainly not come up with $2,000 if an emergency were to arise within the next month, an indicator of financial fragility.2 Further, almost half (47%) of U.S. adults indicated that they had not set aside an emergency fund that would cover three months’ worth of expenses. Saving is the way to build up emergency funds and ultimately financial resilience, yet survey findings show that in 2018 only about 41% of Americans had accumulated savings over the past year; 36% had spent all of their earnings, and almost 20% had accumulated debt. These statistics from the 2018 NFCS indicate how ill-prepared U.S. adults were to face any shock, large or small, and this lack of preparedness likely contributed to high financial anxiety and stress levels. These are troubling findings and show the importance of understanding the factors underlying financial stress and anxiety.
In this project, we analyze those factors, examining the extent to which feeling stressed and anxious over personal finances is determined by high levels of indebtedness, poor money management, and other factors. For a comprehensive understanding of financial stress and
1 Exact question wording for the “satisfaction” question is “Overall, thinking of your assets, debts and savings, how satisfied are you with your current personal financial condition?” On a scale from 1 (not at all satisfied) to 10 (extremely satisfied), “low satisfaction” is indicated by answers 1, 2, or 3; “moderate satisfaction” is indicated by answers 4, 5, 6, or 7; and “high satisfaction” is indicated by answers 8, 9, or 10. Fewer than one in three adults reported high satisfaction with their current personal financial condition and around 40% indicated being neither satisfied nor unsatisfied. The exact question wording for the “getting by” question is “How well does this statement describe you or your situation: I am just getting by financially?” On a scale from 1 (does not describe me at all) to 5 (describes me completely), “just getting by financially” is indicated by answers 4 or 5. 2 This is a self-assessed measure of the capacity to deal with a mid-sized shock via whatever coping method is available to the respondent: using personal assets, borrowing (including from family or friends), selling possessions, or something else.

Financial Anxiety and Stress 4/28/2021
Page 3
anxiety, we investigate not only households’ assets and lack thereof but also their debt and payment obligations, financial literacy, and demographic characteristics. In terms of demographics, we analyze how the drivers of financial stress and anxiety differ among subpopulations, paying particular attention to the young, women, and different racial/ethnic groups. We also do an in-depth analysis of the link between financial stress and retirement planning, which helps us determine the effect of stress on financial security in the long-run. Further, we analyze the role of financial literacy and financial education.
The empirical analysis is based on the 2018 NFCS and complemented by focus group findings. Small focus groups allowed for in-depth discussions of the factors and circumstances driving financial stress and anxiety. The benefit of the qualitative analysis is twofold: (1) it adds specificity to the understanding of drivers of financial anxiety and decision making that cannot be derived from the survey data, and (2) it sheds more light on the effect that financial stress and anxiety have on individuals’ lives, including their financial planning, career choices, and coping strategies in the event of a shock. Overall, anxiety and stress are personal experiences that manifest differently and have a variety of effects on individuals and their decision making. These differences are largely hidden in aggregated statistics. Thus, the focus groups enabled us to add depth and individual stories to the empirical analysis.
DATA AND METHODOLOGY
This section describes the FINRA Foundation’s National Financial Capability Study (NFCS) and how financial anxiety and stress were measured in the most recent survey. The preliminary findings for the anxiety and stress questions discussed here were crucial for deciding on the sample to be analyzed and the design of the focus groups. The last subsection covers the setup of the focus groups.
National Financial Capability Study (NFCS)
The empirical analysis is based on the 2018 NFCS, a project of the FINRA Investor Education Foundation. The NFCS is a triennial survey designed to establish a baseline measure of financial capability of American adults. First conducted in 2009, the survey provides insights into key indicators of Americans’ financial capability, making it possible to evaluate how these indicators vary given underlying demographic, behavioral, attitudinal, and financial literacy characteristics. Data from the NFCS cover a broad array of aspects of personal finance and money management practices. The 2018 wave included, for the first time, two questions about financial anxiety and stress. The NFCS is nationally representative and has a large number of observations (27,091 American adults in 2018), allowing researchers to
Financial Anxiety and Stress 4/28/2021
Page 4
study population subgroups. For this project specifically, we look into different demographic subpopulations and their financial stress levels.
Financial Anxiety and Stress Measures
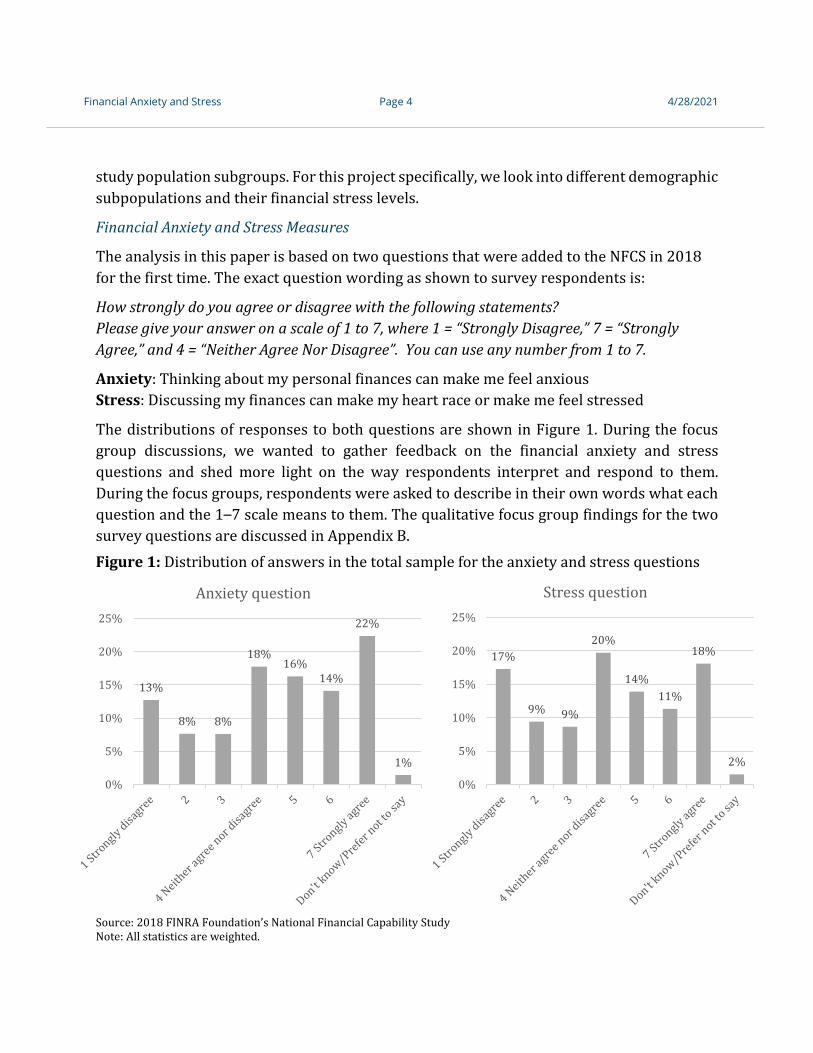
The analysis in this paper is based on two questions that were added to the NFCS in 2018 for the first time. The exact question wording as shown to survey respondents is:
How strongly do you agree or disagree with the following statements? Please give your answer on a scale of 1 to 7, where 1 = “Strongly Disagree,” 7 = “Strongly Agree,” and 4 = “Neither Agree Nor Disagree”. You can use any number from 1 to 7.
Anxiety: Thinking about my personal finances can make me feel anxious Stress: Discussing my finances can make my heart race or make me feel stressed
The distributions of responses to both questions are shown in Figure 1. During the focus group discussions, we wanted to gather feedback on the financial anxiety and stress questions and shed more light on the way respondents interpret and respond to them. During the focus groups, respondents were asked to describe in their own words what each question and the 1–7 scale means to them. The qualitative focus group findings for the two survey questions are discussed in Appendix B. Figure 1: Distribution of answers in the total sample for the anxiety and stress questions
Source: 2018 FINRA Foundation’s National Financial Capability Study Note: All statistics are weighted.
13%
8% 8%
18%16%
14%
22%
1%
0%
5%
10%
15%
20%
25%
Anxiety question
17%
9% 9%
20%
14%11%
18%
2%
0%
5%
10%
15%
20%
25%
Stress question

Financial Anxiety and Stress 4/28/2021
Page 5
Responses 1, 2, and 3 were classified as not anxious/not stressed and responses 5, 6, and 7 as anxious/stressed. All respondents who chose “don’t know” or “prefer not to say” (collectively abbreviated as DNK) have been excluded, as there is not sufficient information to determine whether they are financially anxious or stressed. DNK responses make up for about 1.44% (390 observations) of the full sample of 27,091 observations for the anxiety question and 1.55% (421 observations) for the stress question. Because of an overlap between the two questions, we lose only 541 observations by dropping all DNK responses.
In 2018, 53% of U.S. adults indicated that thinking about their finances makes them anxious and 44% indicated that discussing their finances is stressful (Table 1 Panel A). The correlation between the anxiety and stress questions is 0.7192, and around 41% of U.S. adults reported feeling both anxiety and stress when thinking about or discussing their personal finances. Table 1: Percentage of anxious and stressed adults in the total sample and age-restricted subsample
Anxious (5–7)
Not anxious (1–3)
Stressed (5–7)
Not stressed
(1–3)
Both anxious
and stressed
Total observations
Panel A
Total sample 53% 28% 44% 35% 41%
# of observations 14,209 7,558 11,683 9,548 10,796 26,550
Panel B
Sample of 21 to 62 year-olds 60% 23% 50% 30% 46%
# of observations 11,506 4,360 9,643 5,764 8,965 19,108
Source: 2018 FINRA Foundation’s National Financial Capability Study. Note: DNK responses to the anxiety and stress questions are excluded. The percentage of respondents answering 4 (neither agree nor disagree with the statements) was excluded from the table but can be calculated by determining the figure needed to sum to 100%. All statistics are weighted.
In this paper, we restrict our sample to respondents between the ages of 21 and 62. The age distribution in Figure A1 of Appendix A shows that the percentage of anxious and stressed respondents is lower at younger and older ages. Younger and older respondents have characteristics, financial behavior, and needs that can be very different from the rest of the population: people under 21 are likely to be students with no labor income who rely on

Financial Anxiety and Stress 4/28/2021
Page 6
parents’ financial support, while those over 62 may be retired and receiving Social Security benefits. The 21- to 62-year-old population can thus comprise a more homogenous sample.
This age adjustment results in a total of 19,108 respondents, among which 60% are classified as financially anxious and 50% as financially stressed (Table 1 Panel B). Important to note throughout the paper is that the two questions are treated as separate variables. However, they are not mutually exclusive but rather include a large overlap, i.e., 46% of respondents are classified as both financially anxious and financially stressed.
Focus Groups
The empirical analysis is complemented with qualitative focus group findings. The small group setting allowed for in-depth discussions of the drivers of financial stress and anxiety and to relate them to financial decision making. Together with SVC Research, we conducted six focus groups with six participants each. The focus groups were held online and represented racial/ethnic diversity and a mix of geographic locations throughout the United States. All participants indicated that they experience financial anxiety (answered 5, 6, or 7 to the anxiety question).3 As the purpose of the focus groups was to gain a more in-depth, qualitative understanding of the key drivers and consequences of financial anxiety and stress, we limited the sample to no more than three respondents per group who indicated that the COVID-19 pandemic had a substantial, negative impact on their personal finances. The focus group discussions took place online in December 2020.
We split the focus groups into young (ages 21–34), middle-aged (ages 35–49), and old (ages 50–62) subgroups, each representing a life stage, and we then split each subgroup by gender. The empirical analysis showed significant differences in financial stress and anxiety by age and gender, so the two-dimensional cut was done with the expectation that more homogeneous groups would spark discussions around similar topics, thus providing the depth we were looking for. Table 2: Focus group split
Age Group
Gender Female 21–34 Female 35–49 Female 50–62 Male 21–34 Male 35–49 Male 50–62
3 Among respondents who were financially anxious, 92% were also financially stressed, so we decided to use the anxiety question as the primary screener question for the focus groups.

Financial Anxiety and Stress 4/28/2021
Page 7
FINDINGS
In this section, we seek to build a more comprehensive profile of financially anxious and stressed individuals and discuss factors likely contributing to high levels of financial anxiety and stress. We begin by examining the main demographic characteristics of financially anxious and stressed respondents. We then analyze contributing factors related to their financial situation and money management practices, as well as factors related to social influences and family situations. The last section provides an in-depth analysis of the link between financial anxiety and retirement planning, which helps us determine the effect of financial anxiety on long-term financial security.
Demographic Characteristics
In 2018, 60% of U.S. adults (between the ages of 21 and 62) indicated feeling anxious when thinking about their personal finances, another 18% neither agreed nor disagreed that they felt anxious, and only 23% did not feel anxious (Table 3). Noteworthy is that this was measured during a time of economic expansion and record-low unemployment rates.
These averages, however, hide large differences in the population. Looking at demographic subgroups, Table 3 shows that 65% of women reported being anxious about their personal finances compared to 54% of men. The percentage of financially anxious individuals is also highest among the young, those with lower income, those with more financially dependent children, those who are not married, and those who are unemployed. Still, it is important to note that financial anxiety is widespread in the population. Even among respondents with higher than median income ($50–99K), close to 60% reported feeling financial anxiety when thinking about their personal finances. Thus, financial anxiety can occur at any income level, indicating that it is not just a matter of lack of assets. Focus group participants confirm this finding, as they ranged from being unemployed with an annual income of less than $15K to being employed full time with an annual income of more than $150K).
“I worry about money all the time… I have friends who have less income than we do and are much freer with the spending of it. We’re not poor, but I operate like I’m poor, so it’s not good.” (Female, ages 50–62)
Financial anxiety is significantly higher among Hispanic adults than among White (3 percentage points) and Black (5 percentage points) adults.4 These are univariate findings;
4 The percentage of anxious Black adults is slightly lower (2 percentage points) than the percentage of anxious Whites, but the difference is statistically significant only at the 10% level.

Financial Anxiety and Stress 4/28/2021
Page 8
regression results that allow us to control for a variety of socio-demographic variables provide a different conclusion, which is discussed in the next subsection.
Finally, financial literacy seems to matter. Among the financially literate subgroup, identified as those who can answer all of the Big 3 financial literacy questions correctly, 51% reported feeling anxious when thinking about their personal finances, which is significantly lower than the percentage of respondents who were not deemed financially literate and reported feeling anxious about their personal finances (63%). The Big 3 financial literacy questions are widely used and assess respondents’ basic understanding of interest rates, inflation, and risk diversification. Table 3: Demographics of anxiety question
Anxious (5–7)
Neutral (4)
Not anxious (1–3)
Total sample 60% 18% 23% Household income
Less than $25K 67 18 15 $25–49K 64 18 18 $50–74K 59 19 22 $75–99K 58 16 26
$100K+ 46 17 37 Age
Young (21–34 years) 66 16 17 Middle (35–49 years) 60 17 22
Old (50–62 years) 51 19 30 Highest degree obtained
High school or less 58 21 20 Some college 63 17 20
Bachelor’s degree 58 15 26 Post-graduate degree 52 14 34
Gender
Male 54 19 27 Female 65 17 19
Race/Ethnicity
White, non-Hispanic 59 17 23 Black, non-Hispanic 57 19 24
Hispanic 62 17 21 Asian, non-Hispanic 56 20 24

Financial Anxiety and Stress 4/28/2021
Page 9
Other, non-Hispanic 62 17 21 Marital status
Married 56 18 26 Single/ Not married 63 17 19 Divorced/Separated 63 17 20
Widowed 59 17 25 Financially dependent children
0 56 19 25 1–2 63 16 21
3+ 66 15 19 Work status
Employed 59 17 24 Unemployed 69 16 14
Not in labor force 63 19 18 Retired 37 23 40
Financial literacy Not financially literate 63 18 19
Financially literate (Big 3 correct) 51 15 34 Total Observations 11,506 3,242 4,360
Source: 2018 FINRA Foundation’s National Financial Capability Study. Note: DNK responses to the anxiety question are excluded. Sample restricted to respondents ages 21–62. The variable household income includes the total amount of a household’s annual income, including wages, tips, investment income, public assistance, and income from retirement plans. The education variable highest degree obtained includes the categories High school or less, indicating that the highest degree received is a high school diploma; some college, indicating that respondents have attended a post-secondary institution and earned, at most, a two-year degree (i.e., an associate’s degree); bachelor’s degree, indicating that respondents have earned a four-year degree, post-graduate degree, indicating that respondents have a degree beyond a bachelor’s degree. The variable financially dependent children is based on the question “How many children do you have who are financially dependent on you or your spouse/partner? Please include children not living at home, and step-children as well.” An individual’s work status is defined by four categories: Employed for those who either have a full- or a part-time occupation; unemployed for those with no occupation at the time of the survey; not in labor force for those who are full-time students, full-time homemakers, or permanently sick, disabled, or unable to work; and retired for those who classify themselves as being retired. The proportion of financially literate represents respondents who correctly answered the three basic financial literacy questions (Big 3), which assess understanding of interest rate, inflation, and risk diversification. Statistics read as “65% of women in the NFCS are anxious.” All statistics are weighted.
Table 4 shows similar findings for the stress question. Half of the U.S. adult population between ages 21 and 62 reported feeling stressed when discussing their finances. We see the highest percentage of financial stress among the young, those with lower income, women, the unmarried, the unemployed, and those with children. Again, women feel much more stressed about their personal finances than men. More than half of the women surveyed reported feeling stressed when discussing their finances compared to 44% of men. The

Financial Anxiety and Stress 4/28/2021
Page 10
percentage of stressed adults is again highest among Hispanics with a statistically significant five percentage point difference between Hispanics and both White and Black adults.
The difference between the financially literate and illiterate is of particular significance. About one in three financially literate respondents (38%) feel stressed when talking about their finances compared to more than one in two (55%) among those who are not financially literate.
Table 4: Demographics of stress question
Stressed (5–7)
Neutral (4)
Not stressed (1–3)
Total sample 50% 20% 30% Household income
Less than $25K 58 21 20 $25–49K 54 20 25 $50–74K 48 21 30 $75–99K 50 17 33
$100K+ 36 18 45 Age
Young (21–34 years) 57 18 25 Middle (35–49 years) 51 20 29
Old (50–62 years) 41 22 37 Highest degree obtained
High school or less 51 23 27 Some college 53 20 27
Bachelor’s degree 47 18 35 Post-graduate degree 43 16 41
Gender Male 44 21 35
Female 56 19 25 Race/Ethnicity
White, non-Hispanic 49 20 31 Black, non-Hispanic 49 19 31
Hispanic 54 21 25 Asian, non-Hispanic 49 22 29 Other, non-Hispanic 53 19 28

Financial Anxiety and Stress 4/28/2021
Page 11
Marital status Married 47 20 33
Single/Not married 53 20 27 Divorced/Separated 54 19 26
Widowed 49 24 27 Financially dependent children
0 46 21 33 1–2 55 19 27
3+ 56 18 26 Work status
Employed 50 19 31 Unemployed 58 20 22
Not in labor force 55 21 23 Retired 29 22 49
Financial literacy Not financially literate 55 21 25
Financially literate (Big 3 correct) 38 17 45 Total Observations 9,643 3,701 5,764
Source: 2018 FINRA Foundation’s National Financial Capability Study. Note: DNK responses to the stress question are excluded. Sample restricted to respondents ages 21–62. The variable household income includes the total amount of a household’s annual income, including wages, tips, investment income, public assistance, and income from retirement plans. The education variable highest degree obtained includes the categories High school or less, indicating that the highest degree received is a high school diploma; some college, indicating that respondents have attended a post-secondary institution and earned, at most, a two-year degree (i.e., an associate’s degree); bachelor’s degree, indicating that respondents have earned a four-year degree, post-graduate degree, indicating that respondents have a degree beyond a bachelor’s degree. The variable financially dependent children is based on the question “How many children do you have who are financially dependent on you or your spouse/partner? Please include children not living at home, and step-children as well.” An individual’s work status is defined by four categories: Employed for those who either have a full- or a part-time occupation; unemployed for those with no occupation at the time of the survey; not in labor force for those who are full-time students, full-time homemakers, or permanently sick, disabled, or unable to work; and retired for those who classify themselves as being retired. The proportion of financially literate represents respondents who correctly answered the three basic financial literacy questions (Big 3), which assess understanding of interest rate, inflation, and risk diversification. Statistics read as “56% of women in the NFCS are stressed.” All statistics are weighted.
For comparison purposes, a table showing the demographic distribution for anxious and stressed individuals as well as the general population is shown in Table A1 of Appendix A. This table allows for the comparison of anxious and stressed individuals’ demographic characteristics to the general population.
Regression Results
Regression analyses complement the descriptive findings discussed in the previous section by allowing us to examine links between a specific demographic characteristic and the likelihood of being financially anxious or stressed, while holding all other characteristics

Financial Anxiety and Stress 4/28/2021
Page 12
constant. Our dependent variables are dummy variables that take the value of 1 when respondents report being financially anxious or stressed. Table 5 presents regression results for both questions; the first column reports findings that use being financially anxious (a 5, 6, or 7 response to the financial anxiety question) as the dependent variable, and the second column presents the findings that use being financially stressed (a 5, 6, or 7 response to the financial stress question) as the dependent variable.
The regression results support the descriptive observations: The young (ages 21–34) are more likely to feel financially anxious or stressed than respondents between the ages of 34 and 49 and 50 to 62. However, focus group discussions that focused on financially anxious respondents only (those responding 5, 6, or 7 on the 7-point scale), revealed that older participants were visibly more emotional and communicative when sharing their financial worries than younger respondents and tended to. There were noticeable differences by age in how financial anxiety and stress were expressed during the focus groups, though the numerical answers on the 7-point scale were equivalent. Thus, while older respondents are less likely to state in the survey that they are financially anxious, among those who are anxious, older respondents tend to express their anxiety and stress more vividly than did the younger cohorts.
“We don’t have any savings. Our car just broke down, so I’m walking everywhere I’m going. We’re taking the bus. Me and her both started donating plasma this week so we can get some extra cash coming. We’re just making it. I do have two teenagers at the house, too. A 15- and a 16-year-old. Beans and rice, a lot, are what we eat, stuff like that.” (Male, ages 50–62)
Women are much more likely than men to feel financially anxious when thinking about their personal finances and stressed when discussing their finances. Challenges to women have been well documented in social science research. Women are more likely to take on household and family caregiving responsibilities, and these responsibilities commonly cause workforce interruptions or reduced work hours, which can limit women’s earning potential, ability to save for retirement, and ability to qualify for an employer-provided retirement plan (Hochschild, 1989; Collins et al., 2020; Weller and Tolson, 2020). Further, women have faced a history of sexism in America that has limited their income and access to economic opportunities. As discussed in the focus groups, lack of retirement savings is an important factor in financial anxiety and stress, especially among the group of older women with high dependency on the spouse’s income and/or limited earning opportunities. Moreover, research has shown that women are more likely than men to be financially fragile, feel they have too much debt, and lack savings (Yakoboski et al., 2020c; Hasler and Lusardi, 2019; de Bassa Scheresberg and Lusardi, 2017). Further, and something that could be observed

Financial Anxiety and Stress 4/28/2021
Page 13
during the focus group sessions, anxiety and stress are perceived differently by men and women.
Interestingly, controlling for all other demographic variables, Black and Hispanic adults are less likely than their White peers to feel financially anxious. For Black respondents, the same holds for the stress variable. This result is rather surprising against the backdrop of the existing evidence indicating that Black and Hispanic Americans are economically vulnerable and face greater economic challenges, including a persistent wealth gap across race and ethnicity. Research shows that Black and Hispanic Americans are underrepresented in the top income quantiles, are more likely than Whites to be low income, and are less likely to have access to employer-sponsored benefits, including healthcare and retirement benefits (Akee et al., 2019; Gould and Wilson, 2020; Gould, Perez, and Wilson, 2020). Further research has shown that even before the onset of COVID-19 and its economic consequences there was a significant gap in financial resilience between Black and White adults. Specifically, Black Americans were less optimistic about their ability to cope with a mid-sized emergency expense of $2,000 within a month’s timeframe, to possess non-retirement savings, and to save and plan for retirement, and they were more likely to feel constrained by their debt (Yakoboski et al., 2020a & 2020b). And prior to the pandemic, the least financially resilient households in America were disproportionally Black and Hispanic (Valdes et al., 2021), which translates to a headwind many minorities face that is driven, in part, by a history of systemic racism in the United States that has limited the economic opportunities of minorities. The current crisis has likely further exacerbated those financial issues for many, especially because historically underrepresented communities have been disproportionately impacted by the pandemic and its economic fallout. This lack of resilience is also represented in short-term financial challenges; a larger percentage of Black adults express trouble making ends meet in a typical month and inability to pay bills in full and on time each month. Recent research shows that these financial challenges are also prevalent among Hispanics (Yakoboski et al., 2021). It is unclear why Black and Hispanic respondents report being less likely to experience financial stress or anxiety (when controlling for demographic factors) while generally facing more economic challenges and financial vulnerabilities. That said, it is possible that these findings reflect different financial expectations among these segments of the population. It is also possible that Black and Hispanic adults may have better coping skills in the face of financial difficulties.
This result indicates that there are differences in how individuals perceive their financial situation and how their struggles manifest in anxiety and stress levels. Financial anxiety and stress are inherently subjective measures, which became evident during the focus group discussions. Two individuals with objectively different financial situations may respond

Financial Anxiety and Stress 4/28/2021
Page 14
identically to the anxiety and stress question due to differences in how they evaluate and perceive their financial situation. This measure may be influenced by myriad internal and external factors, including socioeconomic status, culture, and family background.
Recent research on Black and Hispanic women shows similar findings for financial well-being, which is also an inherently subjective measure (Clark et al., 2021). Given this research, we analyze the percentage of financially anxious and stressed adults across gender and race. Results can be seen in Figure 2. It is apparent that more women than men feel financially anxious or stressed, except among Black individuals. Among Black adults, 55% of women and 59% of men feel financially anxious and 48% of women and 51% of men feel financially stressed. This finding is further backed by regression results. Table A2 of Appendix A shows the same regressions as in Table 5 but adds interaction terms between gender and race/ethnicity. In line with the descriptive statistics of Figure 2, only the coefficient estimate for the Black women interaction term is statistically significant and negative. When holding everything else equal, Black women are significantly less likely to be anxious or stressed than White women, but Black men are no less likely than White men to be anxious or stressed.
Figure 2: Percentage of anxious and stressed U.S. adults by gender and race
53%59%
55%51%
58%66%
55%
68%61%
66%
0%
10%
20%
30%
40%
50%
60%
70%
80%
White Black Hispanic Asian Other
Percentage of anxious adults
Male Female

Financial Anxiety and Stress 4/28/2021
Page 15
Source: 2018 FINRA Foundation’s National Financial Capability Study. Note: DNK responses to the anxiety and stress questions are excluded. People are classified as anxious or stressed if they selected 5, 6, or 7 on a scale from 1 (strongly disagree) to 7 (strongly agree) in response to the following statements: “Thinking about my personal finances can make me feel anxious” and “Discussing my finances can make my heart race or make me feel stressed.” All statistics are weighted.
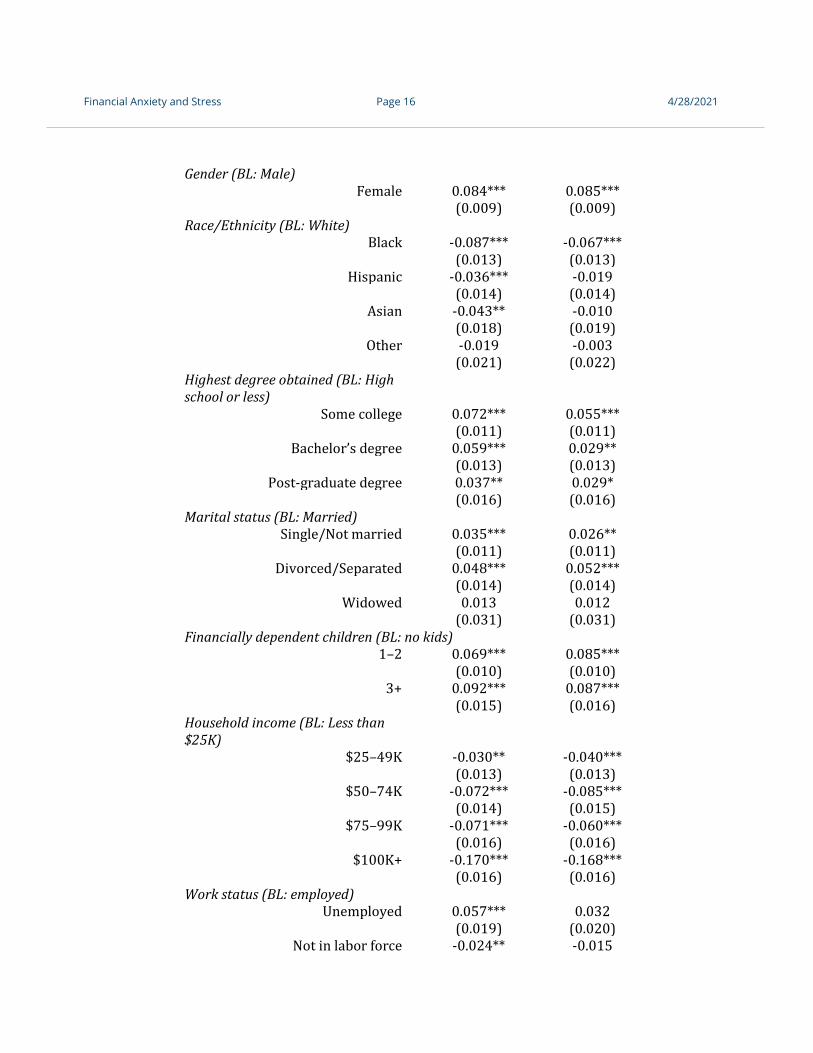
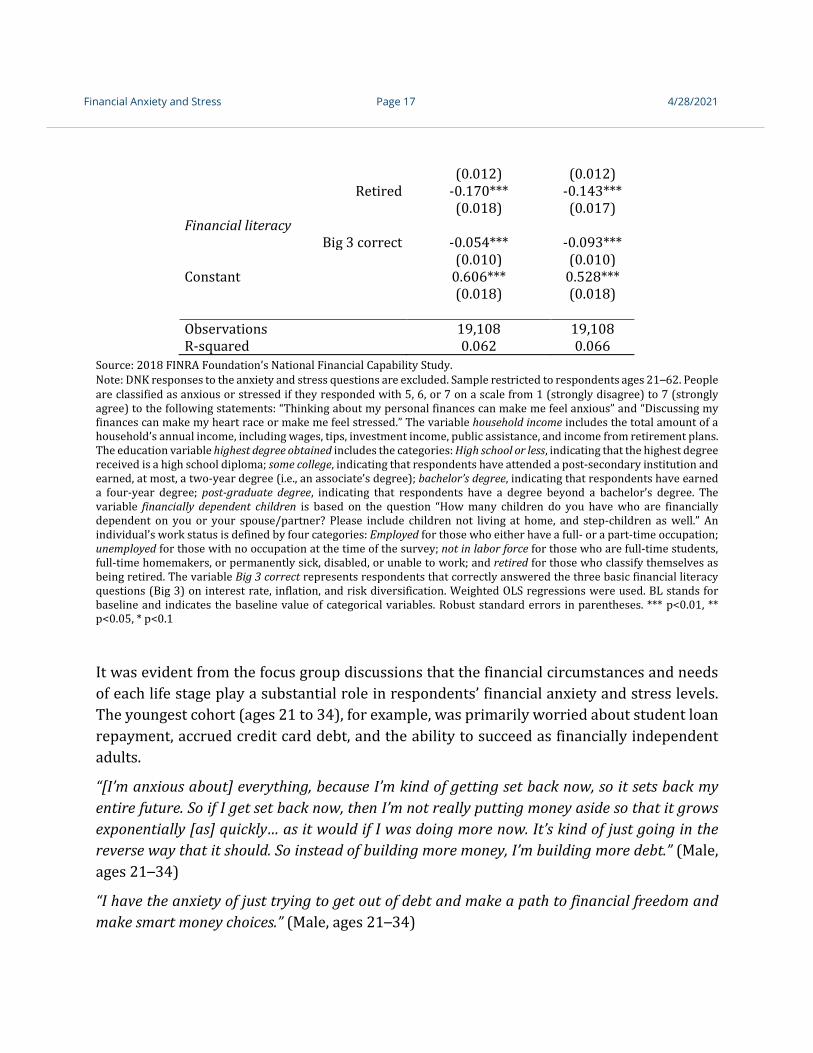
Further, marital status and dependent children have a large influence on financial anxiety and stress. Single or divorced/separated individuals are much more likely than their married counterparts to feel anxious and stressed about their personal finances. And, holding all else equal, those with financially dependent children are much more likely to report being anxious and stressed than those without children. As expected, those with higher income are less likely to experience financial anxiety and stress. Being unemployed has a significant influence as well. As discussed above, financial literacy proves to have a significant impact, which is confirmed in the regression analysis. Those who could answer the Big 3 financial literacy questions correctly are significantly less likely to feel financially anxious or stressed. Table 5: Regression analysis for being anxious and stressed
Dependent variable: Being anxious/being stressed
Anxious (5–7)
Stressed (5–7)
Age (BL: Young 21–34 years)
Middle (35–49 years) -0.041*** -0.043*** (0.011) (0.011)
Old (50–62 years) -0.084*** -0.090*** (0.012) (0.012)
42%
51%46% 45% 43%
56%
48%
60%
52%
60%
0%
10%
20%
30%
40%
50%
60%
70%
White Black Hispanic Asian Other
Percentage of stressed adults
Male Female
Financial Anxiety and Stress 4/28/2021
Page 16
Gender (BL: Male) Female 0.084*** 0.085***
(0.009) (0.009) Race/Ethnicity (BL: White)
Black -0.087*** -0.067*** (0.013) (0.013)
Hispanic -0.036*** -0.019 (0.014) (0.014)
Asian -0.043** -0.010 (0.018) (0.019)
Other -0.019 -0.003 (0.021) (0.022) Highest degree obtained (BL: High school or less)
Some college 0.072*** 0.055*** (0.011) (0.011)
Bachelor’s degree 0.059*** 0.029** (0.013) (0.013)
Post-graduate degree 0.037** 0.029* (0.016) (0.016) Marital status (BL: Married)
Single/Not married 0.035*** 0.026** (0.011) (0.011)
Divorced/Separated 0.048*** 0.052*** (0.014) (0.014)
Widowed 0.013 0.012 (0.031) (0.031) Financially dependent children (BL: no kids)
1–2 0.069*** 0.085*** (0.010) (0.010)
3+ 0.092*** 0.087*** (0.015) (0.016) Household income (BL: Less than $25K)
$25–49K -0.030** -0.040*** (0.013) (0.013)
$50–74K -0.072*** -0.085*** (0.014) (0.015)
$75–99K -0.071*** -0.060*** (0.016) (0.016)
$100K+ -0.170*** -0.168*** (0.016) (0.016) Work status (BL: employed)
Unemployed 0.057*** 0.032 (0.019) (0.020)
Not in labor force -0.024** -0.015
Financial Anxiety and Stress 4/28/2021
Page 17
(0.012) (0.012) Retired -0.170*** -0.143***
(0.018) (0.017) Financial literacy
Big 3 correct -0.054*** -0.093*** (0.010) (0.010) Constant 0.606*** 0.528*** (0.018) (0.018) Observations 19,108 19,108 R-squared 0.062 0.066
Source: 2018 FINRA Foundation’s National Financial Capability Study. Note: DNK responses to the anxiety and stress questions are excluded. Sample restricted to respondents ages 21–62. People are classified as anxious or stressed if they responded with 5, 6, or 7 on a scale from 1 (strongly disagree) to 7 (strongly agree) to the following statements: “Thinking about my personal finances can make me feel anxious” and “Discussing my finances can make my heart race or make me feel stressed.” The variable household income includes the total amount of a household’s annual income, including wages, tips, investment income, public assistance, and income from retirement plans. The education variable highest degree obtained includes the categories: High school or less, indicating that the highest degree received is a high school diploma; some college, indicating that respondents have attended a post-secondary institution and earned, at most, a two-year degree (i.e., an associate’s degree); bachelor’s degree, indicating that respondents have earned a four-year degree; post-graduate degree, indicating that respondents have a degree beyond a bachelor’s degree. The variable financially dependent children is based on the question “How many children do you have who are financially dependent on you or your spouse/partner? Please include children not living at home, and step-children as well.” An individual’s work status is defined by four categories: Employed for those who either have a full- or a part-time occupation; unemployed for those with no occupation at the time of the survey; not in labor force for those who are full-time students, full-time homemakers, or permanently sick, disabled, or unable to work; and retired for those who classify themselves as being retired. The variable Big 3 correct represents respondents that correctly answered the three basic financial literacy questions (Big 3) on interest rate, inflation, and risk diversification. Weighted OLS regressions were used. BL stands for baseline and indicates the baseline value of categorical variables. Robust standard errors in parentheses. *** p<0.01, ** p<0.05, * p<0.1
It was evident from the focus group discussions that the financial circumstances and needs of each life stage play a substantial role in respondents’ financial anxiety and stress levels. The youngest cohort (ages 21 to 34), for example, was primarily worried about student loan repayment, accrued credit card debt, and the ability to succeed as financially independent adults.
“[I’m anxious about] everything, because I’m kind of getting set back now, so it sets back my entire future. So if I get set back now, then I’m not really putting money aside so that it grows exponentially [as] quickly… as it would if I was doing more now. It’s kind of just going in the reverse way that it should. So instead of building more money, I’m building more debt.” (Male, ages 21–34)
“I have the anxiety of just trying to get out of debt and make a path to financial freedom and make smart money choices.” (Male, ages 21–34)

Financial Anxiety and Stress 4/28/2021
Page 18
Thus, in the next section, we shed more light on the financial situation and money management behavior of financially anxious and stressed respondents.
Link to Financial Situation and Money Management
Table 6 shows that financially anxious and stressed respondents seem to be less likely to own a home, have a retirement plan, or have other investments (aside from retirement accounts). At the same time, these households seem to be highly indebted, indicating that they carry credit card balances and possess auto loans, student loans, mortgages, and home equity loans. The percentage of individuals with debt is higher among the financially anxious and stressed subgroups than among the general population. Table 6: Financial situation of anxious and stressed individuals
All Anxious (5–7)
Stressed (5–7)
Assets Has a checking or saving account 91% 91% 90% Owns a home 54% 50% 49% Has a retirement plan 61% 57% 56% Has other investments aside from a retirement account* 31% 28% 27%
Has at least one credit card 78% 76% 75% Liabilities Has carried over a credit card balance and paid interest** 52% 62% 63%
Has an auto loan 36% 39% 40% Has a student loan 32% 38% 39% Has a mortgage** 66% 70% 71% Has a home equity loan** 18% 22% 24% Observations 19,108 11,506 9,643
Source: 2018 FINRA Foundation’s National Financial Capability Study. Note: DNK responses to the anxiety and stress questions are excluded. Sample restricted to respondents ages 21–62. All statistics are weighted. *Indicates statistics are conditional on having the related assets.
These empirical findings are confirmed by the focus group discussions. Across all groups, one of the three main factors driving financial anxiety and stress is debt. Credit card and student loan debt were particularly mentioned as major sources of anxiety. Even though student loan debt was a topic more heavily discussed among the younger participants, it is still of significant concern across all age groups. Reasons mentioned by the older

Financial Anxiety and Stress 4/28/2021
Page 19
respondents were that they borrowed on behalf of their children or got a college degree for themselves later in life.
“My federal student loans, all of them are now higher... the balance is now higher than when they started, so I have been paying on them for ten years, and I’ve made negative progress.” (Male, ages 21–34)
“I have debt. I have credit card debt and I have student loans. So, I worry, especially now, if I lose my job, what am I going to do?” (Female, ages 35–49)
“[I have] sons that I signed parent plus loans for, I have student loan debt because I’m a non-traditional student and got degrees later on in life. I am overwhelmed when I think about it, how they could come in and take my money out of the bank or they could garnish my wages. And I got over $100,000 in student loan debt between the three of us.” (Female, ages 50–62)
Interestingly, during the focus group discussions, mortgages were not frequently mentioned as part of debt. Rather, they were viewed as a large expense adding to respondents’ anxiety and stress levels.
Table 7 reports the money management behavior of financially anxious and stressed individuals. The findings clearly show that among financially anxious and stressed subpopulations, the percentage of people overdrawing their checking account, demonstrating expensive credit card management behavior, and using alternative financial services is much higher than it is among the general population. Financially anxious and stressed individuals are also borrowing from themselves. A higher percentage have past-due medical bills and have made some form of withdrawal from their retirement account. They are also much more likely to be late on mortgage and student loan payments. Table 7: Money management behavior of anxious and stressed individuals
All Anxious (5–7)
Stressed (5–7)
SHORT-TERM BEHAVIOR Checking account management (in the past year)
Occasionally overdraw checking account* 23% 30% 33% Credit card management (in the past year) Has made only the minimum payment* 42% 53% 56% Was charged a fee for late payment* 20% 26% 29%

Financial Anxiety and Stress 4/28/2021
Page 20
Was charged an over-the-limit fee* 12% 17% 20% Was charged a fee for a cash advance* 15% 19% 21% Demonstrated at least one expensive behavior* 50% 61% 65%
Use of alternative financial services (in the past 5 years)
Took out an auto title loan 14% 17% 19% Took out a payday loan 17% 21% 23% Used a pawn shop 22% 27% 30% Used a rent-to-own store 15% 18% 20% Used at least one form of AFS 33% 39% 42% Bill management Medical bills that are past due 27% 36% 39% LONG-TERM BEHAVIOR Retirement account (in the past year) Took a loan from their retirement account* 16% 23% 26% Made a hardship withdrawal from their retirement account* 13% 20% 23%
Made some form of withdrawal* 19% 27% 30% Loan payments Late on mortgage payments 21% 31% 35% Late on student loan payments 32% 37% 39% Observations 19,108 11,506 9,643
Source: 2018 FINRA Foundation’s National Financial Capability Study. Note: DNK responses to the anxiety and stress questions are excluded. Sample restricted to respondents ages 21–62. All statistics are weighted. *Indicates statistics are conditional on having the related assets or liabilities.
This money management behavior indicates a need for liquidity, which can result from an inability to cover expenses and monthly bills and/or insufficient income. Besides debt, the focus group discussions revealed two main factors driving financial anxiety and stress: (1) insufficient income or changes to and impediments in the respondent’s ability to earn income, and (2) too many expenses and monthly bills. Medical expenses were mentioned as a major contributor to stress and anxiety among the middle and oldest age groups, especially among parents of special needs children.

Financial Anxiety and Stress 4/28/2021
Page 21
“I’ve always been able to keep at least somewhat of a base, and so the stress is still there, just because you’re always worried that you’re one job loss away, or one bad month away from everything falling apart on you.” (Male, ages 35–49)
“I’ve got a daughter who has serious disabilities. I’m assuming I’m going to be working well into my 70s, that I won’t retire until at least 75, just to make ends meet. But I’m going to have to deal with my other daughter probably for as long as I’m alive, and I don’t know how to do that.” (Male, ages 50–62)
“I have a child with now major emerging medical and chronic needs and special needs. And so, we’re worried as we look at our options… I can’t just decide what’s best for my kid, I have to decide, well, can we afford that? And where could we cut? What’s possible? And I can’t believe that we’re actually, again, at a place where we lay in bed at night, we worry and we wonder, how is this going to work out?” (Female, ages 35–49)
Additionally, the focus group participants expressed anxiety and stress over unexpected expenses, such as a car repair, the replacement of home appliances, or medical costs related to unforeseen health issues and accidents. Interestingly, many said that they just about make it from month to month but described their finances as a very fragile structure with many weak and unstable components; if just one of those components were to fail, the entire structure would collapse.
“It’s probably more of what might happen… fear of the unknown. Something unexpected. As long as things stay status quo, I guess I can eke by. But for instance, at the end of August, we had a microburst where I live. My car got buried under a tree. I wasn’t planning on a new car for at least another two to three years, but there you go. I had to get a new car because it was totaled. Something like that is kind of really what worries me.” (Male, ages 50–62)
Social Drivers, Family Influences, and Past Decisions
Precarious financial situations and money management challenges are not the only factors contributing to financial anxiety and stress. Various other drivers can be social comparison or family structures and circumstances. According to the focus group participants, comparing their financial situation to their peers and social network can be a major stressor and contributing factor to anxiety.
“Embarrassed, sometimes. Just because I see all my friends getting houses and stuff, and I’m still stuck in this apartment because I’m weighed down by all my student loan debt and credit card debt. So I just feel like I’m kind of behind where I should be.” (Male, ages 21–34)
“I think the factor that gives me the most anxiety is kind of feeling behind, in a sense. I know I’m not supposed to compare myself to others, but I feel like other people I know my age are already

Financial Anxiety and Stress 4/28/2021
Page 22
investing and doing retirement things with a Roth IRA. I still don’t understand any of those concepts. And so I’m feeling anxious, feeling behind. I compare myself to others.” (Female, ages 21–34)
Family structures and circumstances have a strong influence on financial anxiety and stress levels as well. Unexpected expenditures of all kinds like braces or dietary restrictions of children put a strain on their family budgets and create financial anxiety.
“Both [of my infants] are, I think, lactose-intolerant. So now we do almond milk [instead of regular milk]. And it’s like $3 or $4 a carton… They drink gallons a week. So we’re spending, I mean, that’s like a takeout budget, like $300, $400 a month on this milk. And that makes me anxious.” (Female, ages 35–49)
“It’s those little decisions, those constant little decisions on [expenses for my children]. That’s exhausting. I’m constantly doing that negotiation in my head. How to save, well, I could return that, but they really need it. You outgrew those shoes already? Oh, shoot. Okay. And it’s just a little hum in the back of your mind, but it’s there.” (Female, ages 35–49)
Moreover, the focus group discussions revealed that financial anxiety among the participants is not a temporary state, but rather the result of various financial decisions and adverse circumstances that took place and occurred over a longer period of time. A general inability to save in the past was often mentioned as a contributor to current financial anxiety. Among the older participants, it was also apparent that the Great Recession of 2007–2009 still has repercussions on their financial situation and employment.
“I had a pretty hot salary. But I went nuts with it. I just spent on anything I wanted or gave money to people, ate out all the time and just threw it all away. But I just wasted all that money. I regret it... I would be doing okay right now, I wouldn’t be homeless if I would’ve saved, instead of throwing it all away.” (Male, ages 50–62)
“When [my husband and I] were younger, we did like to spend a lot. We had a shoe thing and we couldn’t afford our tastes. And so just swipe, swipe, swipe, and we were always minimum payment. And then we started having kids and then there was more expenses. And it feels like we just never caught up.” (Female, ages 35–49)
Retirement Planning
In this last section, we looked at the importance of financial anxiety and stress by examining its impact on retirement planning. We do so for three reasons. First, retirement planning is a strong predictor of wealth, as shown by Lusardi and Mitchell (2007). Because the NFCS does not provide information on wealth, we use as a proxy the information on whether individuals have given any thought to what they need for their retirement. Second, given the
Financial Anxiety and Stress 4/28/2021
Page 23
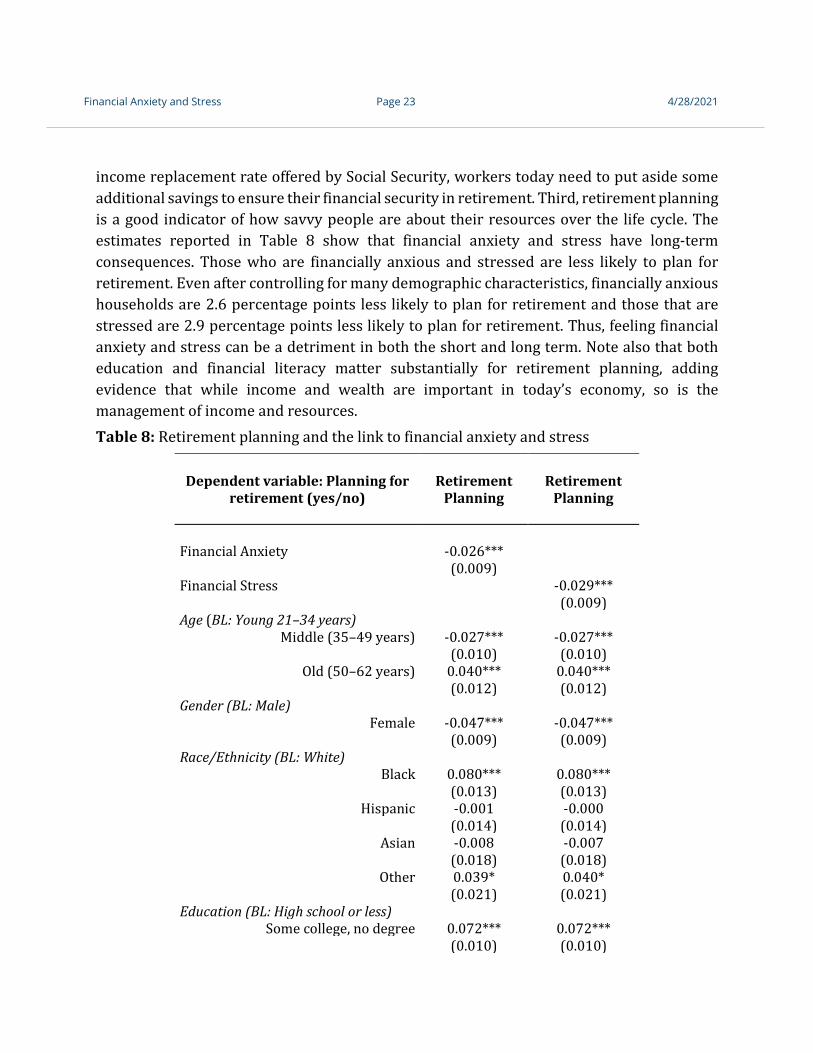
income replacement rate offered by Social Security, workers today need to put aside some additional savings to ensure their financial security in retirement. Third, retirement planning is a good indicator of how savvy people are about their resources over the life cycle. The estimates reported in Table 8 show that financial anxiety and stress have long-term consequences. Those who are financially anxious and stressed are less likely to plan for retirement. Even after controlling for many demographic characteristics, financially anxious households are 2.6 percentage points less likely to plan for retirement and those that are stressed are 2.9 percentage points less likely to plan for retirement. Thus, feeling financial anxiety and stress can be a detriment in both the short and long term. Note also that both education and financial literacy matter substantially for retirement planning, adding evidence that while income and wealth are important in today’s economy, so is the management of income and resources. Table 8: Retirement planning and the link to financial anxiety and stress
Dependent variable: Planning for retirement (yes/no)
Retirement Planning
Retirement Planning
Financial Anxiety -0.026*** (0.009) Financial Stress -0.029*** (0.009) Age (BL: Young 21–34 years)
Middle (35–49 years) -0.027*** -0.027*** (0.010) (0.010)
Old (50–62 years) 0.040*** 0.040*** (0.012) (0.012) Gender (BL: Male)
Female -0.047*** -0.047*** (0.009) (0.009) Race/Ethnicity (BL: White)
Black 0.080*** 0.080*** (0.013) (0.013)
Hispanic -0.001 -0.000 (0.014) (0.014)
Asian -0.008 -0.007 (0.018) (0.018)
Other 0.039* 0.040* (0.021) (0.021) Education (BL: High school or less)
Some college, no degree 0.072*** 0.072*** (0.010) (0.010)

Financial Anxiety and Stress 4/28/2021
Page 24
Bachelor’s degree 0.091*** 0.090*** (0.013) (0.013)
Post-graduate degree 0.133*** 0.133*** (0.015) (0.015) Marital status (BL: Married)
Single/Not married -0.042*** -0.042*** (0.011) (0.011)
Divorced/Separated -0.070*** -0.069*** (0.014) (0.014)
Widowed -0.065** -0.065** (0.029) (0.029) Financially dependent children (BL: no kids)
1–2 0.019* 0.020** (0.010) (0.010)
3+ 0.020 0.020 (0.014) (0.014) Income (BL: Less than $25K)
$25–49K 0.090*** 0.090*** (0.012) (0.012)
$50–74K 0.158*** 0.157*** (0.014) (0.014)
$75–99K 0.254*** 0.255*** (0.016) (0.016)
$100K+ 0.304*** 0.303*** (0.016) (0.016) Employment status (BL: employed)
Unemployed -0.116*** -0.117*** (0.018) (0.018)
Not in labor force -0.093*** -0.093*** (0.011) (0.011)
Retired 0.045** 0.045** (0.018) (0.018) Financial literacy
Big 3 correct 0.135*** 0.133*** (0.010) (0.010) Constant 0.257*** 0.256*** (0.018) (0.018) Observations 18,289 18,289 R-squared 0.165 0.165
Source: 2018 FINRA Foundation’s National Financial Capability Study. Note: DNK responses to the anxiety and stress questions as well as the planning for retirement question are excluded. Sample restricted to respondents ages 21–62. All statistics are weighted. People are said to plan for retirement if they report that they tried to figure out how much they need to save for retirement. People are classified as anxious or stressed if they selected 5, 6, or 7 on a scale from 1 (strongly disagree) to 7 (strongly agree) in response to the following statements:

Financial Anxiety and Stress 4/28/2021
Page 25
“Thinking about my personal finances can make me feel anxious” and “Discussing my finances can make my heart race or make me feel stressed.” Income represents household annual income from all sources, such as wages, tips, investment income, public assistance, and retirement plans. Financial literacy is a dummy variable taking the value of 1 if the respondent correctly answered three basic financial literacy questions (Big 3), which assess understanding of interest rate, inflation, and risk diversification. BL stands for baseline and indicates the baseline value of categorical variables. Robust standard errors in parentheses. *** p<0.01, ** p<0.05, * p<0.1
Focus group participants expressed financial anxiety and stress around both short- and long-term finances. Middle-aged participants (35–49 years) reported worry about concrete, day-to-day expenses, such as bills and childcare costs, as well as more abstract, long-term concerns, such as retirement savings. The same was seen for respondents of the oldest cohort (50–62 years). However, given they are closer to retirement, retirement security tended to be a more concrete and short-term concern.
“I feel like I frame it two different ways when I stress about it. I do stress about this month, rent, bills, the short-term month. But then I also frame it as, what I think of in my head as ‘retirement.’ I don’t even know how far out that is. But I think about the very short term and the very long term, but I don’t typically stress or even contemplate five years down the road.” (Male, ages 35–49)
“Our plan is that by the time we turn 70, our mortgage will be paid off. We cannot go into retirement with a mortgage, but that’s significant to go through your whole sixties like that. So I’ll be working for the next nine years and my husband for the next eight, for sure. So those things I think are, those are big worries.” (Female, ages 50-62)
The youngest cohort, however, expressed more abstract anxiety about their future in general and expressed fewer worries about short-term finances, like making ends meet day-to-day.
“[My anxiety is] just kind of a vague overarching thing. Just kind of thinking of the future. How am I ever going to pay all this stuff off? Thinking I guess big picture more instead of paying each bill on time or whatever. I can always pay off [the monthly] bills. That’s not a problem. Sometimes [the long term future] just seems kind of insurmountable.” (Male, ages 21–34)
“I feel like lately [my anxiety has] been more long-term, and how are we ever going to pay all of this off and pay for the other expenses that will come our way?” (Female, ages 21–34)
CONCLUSION
The economic impact of the COVID-19 crisis has brought to light the deeply rooted financial struggles that many Americans face. This paper shows that even before the pandemic, a substantial share of households was anxious and stressed about their personal finances and could not face a mid-sized shock. In 2018, at a time when the economy was in expansion, 60% of 21- to 62-year-old respondents said that thinking about their finances makes them

Financial Anxiety and Stress 4/28/2021
Page 26
anxious and 50% said that discussing their finances is stressful. The greatest anxiety and stress about personal finances was expressed by women, young adults, those with lower income, those with more financially dependent children, those who are not married, and those who are unemployed.
In this paper, we analyze potential factors underlying financial anxiety and stress. For a comprehensive understanding of financial stress and anxiety, we investigate not only households’ assets and lack thereof but also their debt and payment obligations, financial literacy, and socio-demographic characteristics. We also do an in-depth analysis of the link between financial stress and retirement planning, which helps us determine the effect on financial security in the long run. The empirical analysis is based on the 2018 NFCS and complemented by focus group findings. Small focus groups allowed for in-depth discussions of the factors driving financial stress and anxiety and of how financial struggles are perceived. Financial anxiety and stress are inherently subjective measures and may be influenced by myriad internal and external factors, including socioeconomic status, culture, and family background, which was apparent during the focus group discussions.
We find that the lack of assets, too much debt, and money management challenges, such as the use of alternative financial services, are major factors contributing to high levels of financial anxiety and stress. But our focus group findings indicate that there are various other drivers of stress and anxiety over personal finances as well, such as peer comparison or family structures and circumstances. Unexpected expenditures of all kinds, like braces or children’s dietary needs, put a strain on family budgets and create financial anxiety. We also find that financial anxiety and stress can have long-term consequences; those who are financially anxious and stressed are less likely to plan for retirement.
Finally, financial literacy seems to matter. Among the financially literate subgroup, identified as those who can answer three widely used financial literacy questions correctly, significantly fewer people reported feeling anxious when thinking and stressed when talking about their personal finances. This holds even after controlling for other demographic factors.
These findings are sobering when considering that they reflect household circumstances before the COVID-19 pandemic hit. Over the past year, American’s financial struggles have likely been further exacerbated and their anxiety and stress levels worsened. Focus group discussions seem to reveal that for most participants, the pandemic has not created new

Financial Anxiety and Stress 4/28/2021
Page 27
financial anxiety but has exacerbated existing anxiety.5 The main contributor has been the increased income uncertainty.
Financial anxiety and stress can affect people’s lives in major ways. Most focus group participants reported that they are monitoring and limiting their spending and expenses on a daily basis. Financial anxiety can put stress on relationships, and younger respondents mentioned that it has affected their career or educational choices. Building financial resilience can lessen the experiences of financial anxiety that affect so many Americans. Increased resilience as part of the recovery path out of the pandemic will increase the likelihood that American households will be able to weather future financial shocks and could increase the financial well-being and, by extension, the overall well-being of Americans.
5 Note: Recruiting quotas were set so that no more than half of the respondents in each group indicated that the pandemic had a negative effect on their financial situation.
Financial Anxiety and Stress 4/28/2021
Page 28
REFERENCES
Akee, R., Jones, M.R., and Porter, S.P. (2019). “Race Matters: Income Shares, Income Inequality, and Income Mobility for All U.S. Races.” National Bureau of Economic Research. Working Paper No. 23733.
Clark, R., Lusardi, A., Mitchell, O., Davis, H. (2021). “Financial Well-Being among Black and Hispanic Women,” GFLEC Working Paper Series. WP 2021-1.
Collins, C., Landivar, L.C., Ruppanner, L., and Scarborough, W.J. (2020). “COVID-19 and the Gender Gap in Work Hours.” Forthcoming, Gender, Work & Organization.
de Bassa Scheresberg, C., and Lusardi, A. (2017). “Financial Capability and Financial Literacy among Working Women: NewInsights.” TIAA Institute Research Dialogue, 129.
Gould, E., and Wilson, V. (2020). “Black Workers Face Two of the Most Lethal Preexisting Conditions for Coronavirus–Racism and Economic Inequality.” Economic Policy Institute Report.
Gould, E., Perez, D., and Wilson, V. (2020). “Latinx Workers–Particularly Women–Face Devastating Job Losses in the COVID-19 Recession.” Economic Policy Institute Report.
Hasler, A., and Lusardi, A. (2019). “Financial Fragility among Middle-Income Households: Evidence Beyond Asset Building.” GFLEC Working Paper Series 2019-1.
Hochschild, A.R. (1989/2003). The Second Shift. NewYork: AvonBooks.
Valdes, O., and Mottola, G. (2021). “Bouncing Back? The Financial Resilience Of Americans,” FINRA Investor Education Foundation report.
Weller, C.E., and Tolson, M.E. (2020). “The Retirement Savings Penalty Borne by Women.” Challenge. 63(4), pp. 1-18. Yakoboski, P., Lusardi, A., and Hasler, A. (2020a). “Financial Literacy and Wellness among African-Americans: New Insights from the Personal Finance (P-Fin) Index.” The Journal of Retirement 8 (1): 22-31.
Yakoboski, P., Lusardi, A., and Hasler, A. (2020b). “Financial Literacy, Wellness, and Resilience among African Americans.” The TIAA Institute and Global Financial Literacy Excellence Center Report (September 2020).
Yakoboski, P., Lusardi, A., and Hasler, A. (2020c). “Financial Literacy and Wellness Among U.S. Women: Insights on Underrepresented Minority Women.” The TIAA Institute and Global Financial Literacy Excellence Center Report (November 2020).
Yakoboski, P., Lusardi, A., and Hasler, A. (2021). “Financial Wellbeing and Literacy in the Midst of a Pandemic” The TIAA Institute and Global Financial Literacy Excellence Center Report (April 2021).

Financial Anxiety and Stress 4/28/2021
Page 29
APPENDIX A
Figure A1: Percentage of anxious and stressed U.S. adults by age
Source: 2018 FINRA Foundation’s National Financial Capability Study. Note: DNK responses to the anxiety and stress questions are excluded. People are classified as anxious or stressed if they selected 5, 6, or 7 on a scale from 1 (strongly disagree) to 7 (strongly agree) in response to the following statements: “Thinking about my personal finances can make me feel anxious” and “Discussing my finances can make my heart race or make me feel stressed.” All statistics are weighted.
62%67%
62%56%
46%
34%
27%
0%
10%
20%
30%
40%
50%
60%
70%
80%
18-24 25-34 35-44 45-54 55-64 65-74 75 +
Percentage of anxious adults
52%58%
53%46%
37%
26%19%
0%
10%
20%
30%
40%
50%
60%
70%
18-24 25-34 35-44 45-54 55-64 65-74 75 +
Percentage of stressed adults

Financial Anxiety and Stress 4/28/2021
Page 30
Table A1: Demographic comparison for total population, anxious and stressed individuals
All Anxious (5-7)
Stressed (5-7)
Household income
Less than $25K 23% 26% 27% $25–49K 25 27 27 $50–74K 19 19 18 $75–99K 14 14 14
$100K+ 19 15 14 Age
Young (21–34 years) 35 39 40 Middle (35–49 years) 34 34 35
Old (50–62 years) 31 27 25 Highest degree obtained
High school or less 29 29 29 Some college 40 43 43
Bachelor’s degree 20 19 18 Post-graduate degree 11 10 9
Gender
Male 49 45 44 Female 51 55 56
Race/Ethnicity
White, non-Hispanic 59 59 58 Black, non-Hispanic 13 13 13
Hispanic 18 19 20 Asian, non-Hispanic 6 6 6 Other, non-Hispanic 3 3 3
Marital status
Married 50 47 47 Single/Not married 37 39 39
Divorced/Separated 11 12 12 Widowed 2 2 2
Financially dependent children
0 54 51 50 1–2 35 37 38
3+ 10 12 12

Financial Anxiety and Stress 4/28/2021
Page 31
Work status
Employed 69 69 68 Unemployed 6 7 7
Not in labor force 19 21 21 Retired 6 4 3
Financial literacy Not financially literate 73 77 80
Financially literate (Big 3 correct) 27 23 20 Total Observations 19,108 11,506 9,643
Source: 2018 FINRA Foundation’s National Financial Capability Study. Note: DNK responses to the anxiety and stress questions are excluded. Sample restricted to respondents ages 21–62. The variable household income includes the total amount of a household’s annual income, including wages, tips, investment income, public assistance, and income from retirement plans. The education variable highest degree obtained includes the categories High school or less, indicating that the highest degree received is a high school diploma; some college, indicating that respondents have attended a post-secondary institution and earned, at most, a two-year degree (i.e., an associate’s degree); bachelor’s degree, indicating that respondents have earned a four-year degree, post-graduate degree, indicating that respondents have a degree beyond a bachelor’s degree. The variable financially dependent children is based on the question “How many children do you have who are financially dependent on you or your spouse/partner? Please include children not living at home, and step-children as well.” An individual’s work status is defined by four categories: Employed for those who either have a full- or a part-time occupation; unemployed for those with no occupation at the time of the survey; not in labor force for those who are full-time students, full-time homemakers, or permanently sick, disabled, or unable to work; and retired for those who classify themselves as being retired. The proportion of financially literate represents respondents who correctly answered the three basic financial literacy questions (Big 3), which assess understanding of interest rate, inflation, and risk diversification. Statistics read as “55% of anxious individuals in the NFCS are women.” All statistics are weighted.
Table A2: Regression analysis for being anxious and stressed with interaction terms
Dependent variable: Being anxious/being stressed
Anxious (5–7)
Stressed (5–7)
Age (BL: Young 21–34 years)
Middle (35–49 years) -0.038*** -0.041*** (0.011) (0.011)
Old (50–62 years) -0.080*** -0.087*** (0.012) (0.012) Gender (BL: Male)
Female 0.109*** 0.101*** (0.010) (0.010) Race/Ethnicity (BL: White)
Black -0.012 -0.005 (0.019) (0.019)
Hispanic -0.037* -0.034 (0.022) (0.022)

Financial Anxiety and Stress 4/28/2021
Page 32
Asian -0.026 0.019 (0.028) (0.028)
Other 0.003 -0.035 (0.036) (0.037)
Interaction Gender*Race (BL: Female*White) Female*Black -0.161*** -0.133***
(0.026) (0.026) Female*Hispanic 0.001 0.027
(0.027) (0.028) Female*Asian -0.034 -0.058
(0.036) (0.037) Female*Other -0.042 0.051
(0.044) (0.045) Highest degree obtained (BL: High school or less)
Some college 0.072*** 0.054*** (0.011) (0.011)
Bachelor’s degree 0.061*** 0.030** (0.013) (0.013)
Post-graduate degree 0.041*** 0.032** (0.016) (0.016) Marital status (BL: Married)
Single/Not married 0.037*** 0.028** (0.011) (0.011)
Divorced/Separated 0.047*** 0.051*** (0.014) (0.014)
Widowed 0.014 0.012 (0.031) (0.031) Financially dependent children (BL: no kids)
1–2 0.071*** 0.086*** (0.010) (0.010)
3+ 0.093*** 0.088*** (0.015) (0.016) Household income (BL: Less than $25K)
$25–49K -0.030** -0.040*** (0.013) (0.013)
$50–74K -0.073*** -0.086*** (0.014) (0.015)
$75–99K -0.076*** -0.065*** (0.016) (0.016)
$100K+ -0.173*** -0.171*** (0.016) (0.016) Work status (BL: employed)
Unemployed 0.056*** 0.031 (0.019) (0.020)

Financial Anxiety and Stress 4/28/2021
Page 33
Not in labor force -0.026** -0.016 (0.012) (0.012)
Retired -0.170*** -0.143*** (0.018) (0.017) Financial literacy
Big 3 correct -0.051*** -0.090*** (0.010) (0.010) Constant 0.590*** 0.519*** (0.018) (0.019) Observations 19,108 19,108 R-squared 0.065 0.069
Source: 2018 FINRA Foundation’s National Financial Capability Study. Note: DNK responses to the anxiety and stress questions are excluded. Sample restricted to respondents ages 21–62. People are classified as anxious or stressed if they responded with 5, 6, or 7 on a scale from 1 (strongly disagree) to 7 (strongly agree) to the following statements: “Thinking about my personal finances can make me feel anxious” and “Discussing my finances can make my heart race or make me feel stressed.” The variable household income includes the total amount of a household’s annual income, including wages, tips, investment income, public assistance, and income from retirement plans. The education variable highest degree obtained includes the categories: High school or less, indicating that the highest degree received is a high school diploma; some college, indicating that respondents have attended a post-secondary institution and earned, at most, a two-year degree (i.e., an associate’s degree); bachelor’s degree, indicating that respondents have earned a four-year degree; post-graduate degree, indicating that respondents have a degree beyond a bachelor’s degree. The variable financially dependent children is based on the question “How many children do you have who are financially dependent on you or your spouse/partner? Please include children not living at home, and step-children as well.” An individual’s work status is defined by four categories: Employed for those who either have a full- or a part-time occupation; unemployed for those with no occupation at the time of the survey; not in labor force for those who are full-time students, full-time homemakers, or permanently sick, disabled, or unable to work; and retired for those who classify themselves as being retired. The variable Big 3 correct represents respondents that correctly answered the three basic financial literacy questions (Big 3) on interest rate, inflation, and risk diversification. Weighted OLS regressions were used. BL stands for baseline and indicates the baseline value of categorical variables. Robust standard errors in parentheses. *** p<0.01, ** p<0.05, * p<0.1
APPENDIX B: FOCUS GROUP DISCUSSION OF SURVEY QUESTIONS
Anxiety Question
Focus group participants found the wording of the anxiety question to be clear and straight-forward. There was no ambiguity in the interpretation of the question; focus group participants interpreted and responded to the question uniformly, consistent with our expectations. Most respondents took their entire balance sheet into account when answering this question, which confirms that anxiety is driven by multiple contributing factors (as discussed in the empirical part of this report). Moreover, there was consensus on the interpretation of the terms used (thinking, personal finances, feeling anxious) in the statement.
The 1 to 7 scale was well understood and there was a clear distinction between 5 and 7. Participants indicated that the 7-point scale was easy to use. However, as responses are

Financial Anxiety and Stress 4/28/2021
Page 34
intended to measure a personal feeling, the severity of the financial situation that motivates selection of a specific number might vary among respondents, meaning that two people selecting the same number might have quite different financial situations, but those situations manifest in a comparable anxiety level. Also, ease of moving from one number to the next tends to be nonlinear among anxious respondents. For example, a 5 response might become a 6 due to a small change in financial situation, but moving from a 5 response to a 4 or lower is seen as out of the question. Please note that this observation holds for anxious people (those who answered 5, 6, or 7 on the 7-point scale) and we cannot make any statements about those with lower anxiety levels.
Stress Question
This question seemed to create confusion and was not interpreted consistently by focus group participants. The main contributing factors were:
- With whom they discussed finances (and whether those discussions involved a sense of judgment/guilt versus support/understanding or were in the context of a close relationship, such with a spouse or parents, or of a more anonymous relationship, such as with a financial planner)
- How they physically experience financial stress (i.e., the physical manifestations of stress, such as a racing heart)
- How they interpreted the word discussing (either to refer to the action of talking with someone or more generally as thinking about or dealing with)
- Whether they perceived a difference in thinking about and talking about finances and between stress and anxiety (i.e., whether they perceive a clear difference between the anxiety question and the stress question)
Overall, the interpretations of the stress question varied; some respondents saw it as identical to the anxiety question and some saw it as mutually exclusive from the anxiety question. This was driven by different interpretations of the words stress and anxiety, personal experiences of the physical manifestations of stress and anxiety, or differences in the action taken, i.e., thinking versus discussing.
Moreover, in responding to the question, respondents across the different age groups made different assumptions about who they would be discussing their finances with. Thus, there was no consensus as to who respondents pictured they would be talking to. However, there was agreement that their answer was largely dependent on who they would discuss their finances with. As we do not have any information on whom respondents are picturing as discussing partners when answering this question, the responses are difficult to interpret.

This and other Global Financial Literacy Excellence Center working papers and publications are available online at www.gflec.org
Global Financial Literacy Excellence CenterThe George Washington University School of Business
Duquès Hall, Suite 4502201 G Street NW
Washington, DC 20052
T: 202-994-7148 | E: [email protected]
FINRA Investor Education Foundation1735 K Street, NW
Washington, D.C. 20006-1506
(202) 728-8988 | www.finrafoundation.org