financial capability - amazon web services
TRANSCRIPT

Findings from two years of the CFFC’s survey data Dr Celestyna Galicki, Commission for Financial Capability Peer reviewed by Assoc. Prof. Aaron Gilbert, Department of Finance, Auckland University of Technology
cffc.govt.nz
Financial Capability Barometer 2018-2019
1CFFC Financial Capability Barometer 2018-2019
ForewordWhen I arrived at the Commission for Financial Capability in February I started a steep learning curve on the definition of this entity’s name. I soon discovered that financial capability is much more than financial literacy – it’s not just what you know, it’s what you do. And motivating those actions is not only education, but culture, upbringing, feelings and aspirations. How do we measure all that to find out how to help New Zealanders become better with money?
Our Financial Capability Barometer survey, launched in 2017, has proved a good start. Summarised in this document is data from the past two years of rolling surveys, to which a remarkable 15,519 New Zealanders contributed. We see how people spend, borrow, save and plan, or not; their knowledge of KiwiSaver and what they might need for retirement, or how little they think about it. By segmenting by gender, age and ethnicity we can see more clearly the groups that need particular help.
These results present the lay of the land pre-COVID – another research project we completed during lockdown gave a stark insight into the lack of New Zealanders’ financial resilience, which reinforced some of the findings here. It was a warning that we need to do much more, and better, to help people improve their financial capability. I think we’ll achieve more by working together.
Which is why we want to share this report with anyone who also works in our area. This analysis has thrown up as many questions as answers, and shown us the gaps in our knowledge. We welcome your feedback as we prepare new research projects that will inform our work in the future. By gaining a clear picture of where New Zealanders are at financially, together we can help them along a path to a secure financial future, and greater peace of mind.
Jane Wrightston Mana Ahungarua / Retirement Commissioner

2CFFC Financial Capability Barometer 2018-2019
EXECUTIVE SUMMARYBackgroundThe Financial Capability Barometer 2018-2019 was a survey of 15,519 adult New Zealanders on their financial behaviours, attitudes and experiences. The survey was inspired by 30 in-depth interviews with households in 2017. The Financial Capability Barometer represents the first attempt to develop an in-depth understanding of financial capability (as distinct from financial literacy) in New Zealand.
The survey’s primary goal was to better understand and target the audiences of CFFC’s financial capability initiatives. Therefore, the design of the survey was driven by CFFC’s operational data needs rather than by a cohesive underlying framework of financial capability and financial well-being. Nonetheless, the data has provided valuable insights into the state of New Zealanders’ personal finances. Importantly, the survey is also a snapshot of New Zealand’s personal finances before the 2020 COVID-19 crisis which exposed the low financial resilience of many New Zealand households.1
The CFFC is working on a new survey that will provide us with a more robust measurement of the financial capability or financial wellbeing of New Zealanders. While that is being developed, we wanted to share the findings of the Financial Capability Barometer. We hope they will prove useful to financial capability practitioners, researchers, policymakers and other interested stakeholders. By sharing these findings we also aim to start a discussion about what we need to know, going forward, to help all of us work together to improve New Zealanders’ financial capability.
Findings: Retirement planningMOST PEOPLE DO NOT PLAN FINANCIALLY FOR RETIREMENT. 65% of respondents did not think much, or at all, about how much money they will need in retirement. Older people were more likely to have thought financially about their retirement. Nonetheless, even in the 51-60 years age group half of respondents thought “hardly at all” or just “a little” about how much money they would need. Only 5% of respondents had a specific plan to save or invest money to have enough in retirement, and a further 16% had a good idea how much they would need to save or invest; 79% did not know their “number”. Regression results suggest that some people, particularly younger people, seem over-confident about having a financially comfortable retirement despite being under-prepared for it.
PEOPLE EXPECT NZ SUPER AND KIWISAVER TO BE THE BASIS OF THEIR RETIREMENT INCOME. 38% expected NZ Super to be their main source of income once they retire; 23% expected KiwiSaver to be their main source of income; 16% did not know what will be the main source of their income in retirement. Younger respondents were more likely to count on KiwiSaver for their retirement income.
KIWISAVER ENROLMENT IS HIGH FOR THE EMPLOYED BUT MANY HAVE LIMITED KNOWLEDGE ABOUT KIWISAVER. Of those employed, 75% were in KiwiSaver and making contributions, compared to 29% of those not in employment. Out of the 11,251 respondents who were in KiwiSaver, 27% did not know what type of fund they were in and 17% did not know what their contribution rate was. 10% did not know either the fund type or contribution rate. Not knowing one’s KiwiSaver fund type was especially high among Māori respondents aged 18-30 (49% of them did not know what fund they were in) and Pacific Peoples aged 18-30 (44% of them did not know what fund they were in). 33% of women, compared to 20% of men, did not know their KiwiSaver fund type.
Findings: Savings and debtLIMITED SHORT-TERM (EMERGENCY) SAVINGS. 53% of respondents said they were able to save money monthly or weekly. However, only 29% of Barometer respondents reported that they could access 3 months’ worth of income in case of an emergency. Those who had access to 3 months’ worth of income were, on average, older, had higher personal and household incomes and were more optimistic. Māori and Pacific Peoples were more likely to have limited emergency savings, compared to other ethnic groups. 44% of non-homeowners can only access less than 1 months’ worth of income,
1 This impact is explored in our report “Impact of COVID-19 on Financial Wellbeing in New Zealand.”, cffc-assets-prod.s3.ap-southeast-2.amazonaws.com/public/Uploads/Research-2020%2B/COVID-19/CFFC-COVID-19-Research-Report-May-2020.pdf

3CFFC Financial Capability Barometer 2018-2019
which puts them at risk of high interest borrowing in an emergency. Credit card debt has the strongest negative effect on the likelihood of having a 3-month emergency fund.
CONSUMER DEBT IS COMMON AND NOT LIMITED TO THOSE ON LOW INCOMES. 30% of respondents owed money on a credit card or store card where they did not pay off the balance by the end of the interest free period, and 20% owed money to a finance company. 27% of respondents did not owe money to anyone in the previous year. Of those who had debt, 25% were “quite worried” and 9% were “very worried”.
Findings: Home ownershipDEMOGRAPHIC DIFFERENCES BETWEEN RENTERS, MORTGAGE HOLDERS AND MORTGAGE-FREE OWNERS. Renters are, on average, younger and on lower incomes; mortgage-free home owners are on average older and have relatively low average incomes (which is linked to their age as many of them are retired and rely on NZ Superannuation). Homeowners who have a mortgage are, on average, somewhat older than renters and have the highest average incomes. Home ownership rates increase with age, but within all age groups home ownership rates are lower for Māori and Pacific Peoples than for Europeans.
FINANCIAL STRESS AMONG MORTGAGE HOLDERS IS CLOSER TO THAT OF RENTERS THAN FREEHOLD OWNERS. Close to half (46%) of mortgage-holders report feeling stressed due to financial concerns, compared to 58% of renters, and 29% of mortgage-free homeowners.
Findings: Subjective financial wellbeingCOMPLEX RELATIONSHIP BETWEEN OBJECTIVE AND SUBJECTIVE FINANCIAL WELLBEING. Subjective financial wellbeing (how good people feel about their financial situation) is linked to home ownership, higher household income and being able to access health services. However, even among those who report high subjective financial wellbeing we find respondents who are paying interest on credit card debt, or who did not access health services due to money concerns (albeit at a lower rate than among those with low subjective financial wellbeing). The relationship between objective financial situation and subjective self-reported wellbeing is not straightforward.
VARIED INTERPRETATIONS OF WEALTH AT DIFFERENT LEVELS OF SUBJECTIVE FINANCIAL WELLBEING. Those who report high subjective financial wellbeing tended to understand wealth as health, good relationships, independence and the ability to help others in addition to financial wealth. Those in the middle tended to describe wealth in terms of having surplus income that can be spent on wants, luxuries, or even “wasted”, with no need to budget and monitor expenses. Those with the lowest subjective financial wellbeing described wealth primarily as protection – from worrying, from having to beg, from emergencies.
Findings: Factors affecting financial outcomes and behavioursDEMOGRAPHIC AND SOCIOECONOMIC FACTORS ARE IMPORTANT BUT ATTITUDES MATTER TOO. Better financial outcomes and more financially capable behaviours are linked to age (being older), ethnicity (European or Asian), income (higher) and home ownership. However, having long-term goals, optimism about the future, consumer debt and propensity to spend money make a difference to outcomes even when controlling for socio-economic and demographic factors.
THERE ARE GAPS IN OUR KNOWLEDGE WHICH REQUIRE FURTHER RESEARCH. There are many factors that may affect people’s financial behaviour and outcomes that were not included in the survey, such as social and cultural norms, social capital, physical and mental health, life events, emotions, and external influences such as policies and available information, and the impact of partners on financial decision-making of people who are in a couple relationship. The survey was also not designed to measure the financial capability or wellbeing of a respondent, and targeted individuals rather than households. We hope to address many of these limitations in the redesign of the survey and to provide more evidence for effective interventions.
4CFFC Financial Capability Barometer 2018-2019
INTRODUCTIONWhat is financial capability?Financial capability is the ability to make informed judgements and effective decisions regarding the use and management of money.2 According to Elaine Kempson’s model of financial wellbeing,3 financially capable behaviours include: spending restraint (not buying things one does not need or cannot afford; restrained use of consumer credit), informed financial decision making and financial product choice (understanding the terms and conditions, product-need fit and comparing options, understanding of risk), saving money regularly, planning how income is used and keeping track of money.
These financially capable behaviours require knowledge, but are also influenced by attitudes and traits such as self-control (being good at resisting temptation and following through on plans), not avoiding difficult or unpleasant tasks, internal locus of control, focus on the long term as opposed to the short-term and not caring too much how other people see you. Financially capable behaviours result in financial wellbeing outcomes such as being able to meet current financial commitments, being prepared for the future, and being able to cope with unexpected expenses.
This model of financial capability assumes adequate income. Being unable to pay bills, or not having an emergency fund to cover unexpected expenses, may be a result of lack of financial capability (making the wrong choices with money) or a result of not having enough income, or a combination of both. CFFC’s focus has been on those whose income is adequate, and for whom behaviour change alone can significantly improve their financial situation. At the same time, CFFC has been working with partners such as the Ministry of Social Development (MSD) and Te Puni Kōkiri (TPK) to improve the financial capability of those who need more support.
About the dataset and the reportThe first version of the Financial Capability Barometer survey commenced fieldwork in February 2017. The survey was inspired by 30 in-depth interviews with a broad range of households about their financial behaviours, beliefs and attitudes. The initial goal of the survey was to explore further the themes and the segmentation developed as a result of the interviews. In 2018, substantial changes were made to the survey in response to new data needs, resulting in “Barometer 2.0.” which is used in this report.4 In 2018-2019 the survey has been repeated quarterly (2018) and monthly (2019) to accumulate a total of 15,519 responses.5 Appendix 1 describes the methodology of sampling and data collection.
Despite its name – Financial Capability Barometer - the design of the survey was not guided by Elaine Kempson’s framework above, or indeed any other framework of financial capability. The survey was initially developed by a market research company to better understand the financial attitudes and behaviours of New Zealanders to facilitate a more effective delivery of CFFC’s financial capability initiatives.6 This lack of a cohesive underlying framework of financial capability and financial well-being is a major limitation of the dataset: the dataset, despite providing detailed information on a range of
2 Some authors use the terms financial literacy and financial capability inter-changeably (for example, Taylor, S., & Wagland, S. (2011). Financial literacy: A review of government policy and initiatives. Australasian Accounting, Business and Finance Journal, 5(2), 101-125.) However, others use the terms financial literacy and financial capability to differentiate between two approaches: - the financial literacy approach is focused on knowledge and assumes that knowledge determines behaviour. In this approach, effective delivery of financial education is all that is needed to improve financial outcomes. The financial capability approach focuses on what people actually do, rather than what they know. According to this approach, the link between knowledge and behaviour is far from straightforward. People’s behaviour can be influenced by personal attitudes, motivation, behavioural biases, social norms, access to financial services, the behaviour of financial firms, consumer protection legislation, and poverty/scarcity (among others). The financial capability approach supports a broad range of interventions, including, but not limited to financial education (Holzmann, R., Mulaj, F., & Perotti, V. (2013). Financial capability in low-and middle-income countries: measurement and evaluation. Washington: World Bank).
3 Kempson, E. & Poppe, Ch. (2018). Understanding Financial Well-Being and Capability - A Revised Model and Comprehensive Analysis.Oslo: SIFO. Another framework, informed by a consumer finance approach, is proposed in Xiao J.J. (2016) Consumer Financial Capability and Wellbeing. In: Xiao J. (eds) Handbook of Consumer Finance Research, Springer and includes objective financial literacy, subjective financial literacy, desirable or undesirable financial behaviour (with sub-scales for cash management, credit management, savings and investment, and insurance), and perceived financial capability.
4 While a small number of variables have continuity with the 2017 version, the 2018-2019 version is dissimilar enough to be a separate dataset.
5 Despite the Barometer being conceived as a trends monitor, all variables used in this report have been very stable during the period of data collection, and the use of unique identifiers for panel members ensured that the same people did not fill it in twice in different waves.
6 Due to this focus on audiences, the survey took an individualistic approach to personal finance and did not include household-level questions, or questions that would clarify the dynamics of finance management within households (such as whether resources are pooled, or who makes financial decisions). Because of insufficient information about pooling and decision-making, as well as incomplete household composition data (the household composition question was changed during data collection), personal and household incomes are reported separately in this report.
5CFFC Financial Capability Barometer 2018-2019
financial attitudes and behaviours, does not have the information necessary for a measurement of the financial capability or wellbeing of a respondent. CFFC is currently working on a redesign of the survey to collect more data that will support developing evidence-led interventions to improve New Zealanders’ financial capability and wellbeing.
CFFC has used insights from the Financial Capability Barometer dataset to inform the content and targeting of financial education delivered by Sorted courses, seminars, workshops and the sorted.org.nz website. Data points or insights from the dataset were also used in media releases as a starting point for promoting financial capability and were shared with other government agencies and National Strategy for Financial Capability partners.
The goal of this report is to share the data with the broader community of financial capability practitioners, researchers, and policymakers. We hope that this information will assist them in targeting, development and delivery of effective financial capability initiatives. We invite feedback on what is missing in our body of knowledge on New Zealanders’ financial capability and financial wellbeing, so that we can align future research to the needs of the financial capability community.
This report presents high-level findings from the dataset. It does not attempt to exhaust the possibilities of analysis offered by the dataset. University-based researchers who wish to further investigate the data for projects that contribute to the goal of improving New Zealanders’ financial capability and retirement preparedness are invited to request the data access policy and data access request form by emailing [email protected]
Main themesThere are three themes that emerge from the Financial Capability Barometer.
First, few New Zealanders plan for the long term. The majority are not thinking about retirement and many are unaware what type of KiwiSaver fund they are in. Most New Zealanders do not have a 3-month emergency fund and less than half say they are able to save money monthly or weekly. The prevalence of a short-term perspective is a challenge for financial capability initiatives.
Second, home ownership (with or without a mortgage) is strongly linked to good financial outcomes and financially capable behaviours, compared to those who do not own a house. The role of home ownership raises questions regarding whether we should do more to support home ownership, or, perhaps, change policy settings so that home ownership (increasingly out of reach for many) is not necessary to retire with confidence.
Third, subjective factors – not all of them related to money - play an important role in self-assessed financial wellbeing and confidence. Young people who have not run the numbers are more confident about their retirement than people who are closer to retirement and who have a plan. Some low-income respondents (many of them older New Zealanders) with low expenses and good social support report high financial wellbeing, while some high earners are stressed by the amount of debt they have. Simple measures such as income do not reflect the complexity of people’s financial lives.
6CFFC Financial Capability Barometer 2018-2019
41%
29%
26%
21%
11%
21%
31%
32%
29%
23%
25%
27%
29%
30%
38%
13%
14%
14%
20%
28%
0% 20% 40% 60% 80% 100%
18-30
31-40
41-50
51-60
61-70
Hardly at all A little A fair amount A great deal
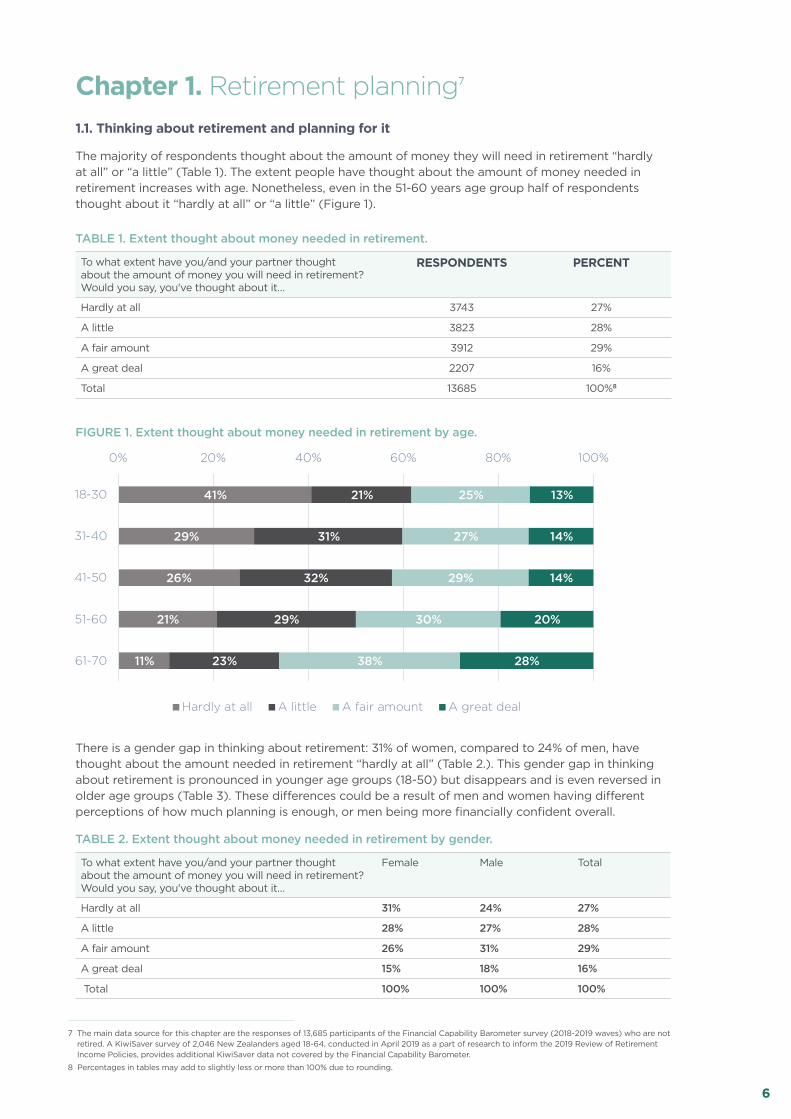
TABLE 1. Extent thought about money needed in retirement.
To what extent have you/and your partner thought about the amount of money you will need in retirement? Would you say, you've thought about it…
RESPONDENTS PERCENT
Hardly at all 3743 27%
A little 3823 28%
A fair amount 3912 29%
A great deal 2207 16%
Total 13685 100%8
FIGURE 1. Extent thought about money needed in retirement by age.
There is a gender gap in thinking about retirement: 31% of women, compared to 24% of men, have thought about the amount needed in retirement “hardly at all” (Table 2.). This gender gap in thinking about retirement is pronounced in younger age groups (18-50) but disappears and is even reversed in older age groups (Table 3). These differences could be a result of men and women having different perceptions of how much planning is enough, or men being more financially confident overall.
TABLE 2. Extent thought about money needed in retirement by gender.
To what extent have you/and your partner thought about the amount of money you will need in retirement? Would you say, you've thought about it…
Female Male Total
Hardly at all 31% 24% 27%
A little 28% 27% 28%
A fair amount 26% 31% 29%
A great deal 15% 18% 16%
Total 100% 100% 100%
7 The main data source for this chapter are the responses of 13,685 participants of the Financial Capability Barometer survey (2018-2019 waves) who are not retired. A KiwiSaver survey of 2,046 New Zealanders aged 18-64, conducted in April 2019 as a part of research to inform the 2019 Review of Retirement Income Policies, provides additional KiwiSaver data not covered by the Financial Capability Barometer.
8 Percentages in tables may add to slightly less or more than 100% due to rounding.
Chapter 1. Retirement planning7 1.1. Thinking about retirement and planning for it
The majority of respondents thought about the amount of money they will need in retirement “hardly at all” or “a little” (Table 1). The extent people have thought about the amount of money needed in retirement increases with age. Nonetheless, even in the 51-60 years age group half of respondents thought about it “hardly at all” or “a little” (Figure 1).

7CFFC Financial Capability Barometer 2018-2019
TABLE 3. Percent who thought “hardly at all” or “a little” about the amount of money they will need in retirement by age and gender.
Age Female Male
18-30 69% 51%
31-40 65% 54%
41-50 61% 54%
51-60 47% 53%
61-70 33% 35%
The question Do you know how much money you will need to save or invest for a comfortable retirement? assumes that the respondent knows how much money he or she needs to have in retirement in the first place. As we have seen above, knowing “the number” is not common.9 It should not come as a surprise that having a specific plan to achieve that number is rare: only 5% of respondents have a plan, and a further 16% have “a good idea”. This leaves 79% who have “no idea”, “a rough idea” or “some idea” (Table 4).
Only among those who thought “a great deal” about amount of money needed in retirement, more than 5% have a specific plan (Table 5). However, thinking about the amount needed in retirement is not a guarantee of having a plan – even among those who thought a great deal about their retirement income needs, only 18% have a specific plan.
TABLE 4. Knowing how much to save or invest for retirement.
Do you know how much money you will need to save or invest for a comfortable retirement?
Respondents Percent
I have no idea 4756 35%
I have a rough idea 2546 19%
I have some idea but I’m not sure of the number 3576 26%
I have quite a good idea of the number but not all the details 2134 16%
I have a clear idea of how much I will need with a specific plan 673 5%
Total 13685 100%
TABLE 5. Knowing how much to save or invest for retirement by extent thought about the amount of money needed for retirement.
Do you know how much money you will need to save or invest for a comfortable retirement?
Hardly at all
A little A fair amount
A great deal
Total
I have no idea 69% 33% 15% 15% 35%
I have a rough idea 13% 24% 20% 15% 19%
I have some idea but I’m not sure of the number 13% 32% 35% 22% 26%
I have quite a good idea of the number but not all the details
4% 9% 26% 30% 16%
I have a clear idea of how much I will need with a specific plan
1% 1% 4% 18% 5%
100% 100% 100% 100% 100%
Among people aged 50 and over, 18% still have thought “hardly at all” about the amount of money they will need in retirement (Table 6) and only 7% have a specific plan to save or invest for retirement (Table 7).
9 We also do not know if the amount of money needed for retirement, for those who thought about it, was realistic, because the survey did not ask about the specific amount.

8CFFC Financial Capability Barometer 2018-2019
TABLE 6. Extent thought about money needed in retirement – respondents aged 50 and over.
To what extent have you/and your partner thought about the amount of money you will need in retirement? (not retired, aged 50+)
Respondents Percent
Hardly at all 828 18%
A little 1249 28%
A fair amount 1462 32%
A great deal 972 22%
Total 4511 100%
TABLE 7. Knowing how much to save or invest for retirement – respondents aged 50 and over.
Do you know how much money you will need to save or invest for a comfortable retirement? (not retired, aged 50+)
Respondents Percent
I have no idea 1303 29%
I have a rough idea 805 18%
I have some idea but I’m not sure of the number 1191 26%
I have quite a good idea of the number but not all the details 880 20%
I have a clear idea of how much I will need with a specific plan 332 7%
Total 4511 100.0
10 cffc-assets-prod.s3.ap-southeast-2.amazonaws.com/public/Uploads/Retirement-Income-Policy-Review/2019-RRIP/Research-docs/The-big-picture/Ipsos-Focus-Group-Research.pdf
We need further research into retirement outcomes to discover what degree of retirement planning is desirable and what form this retirement planning ought to take. Survey questions above do not account for the role of non-financial planning for retirement.10 In focus groups commissioned by CFFC to better understand how people think about retirement several Māori participants said that they planned to go back to whānau land and live with their extended family when they retire. Accordingly, they planned for retirement by supporting their children so that the children can support them in the future. Such planning and preparation did not involve finding out how much money to save/invest but nonetheless could lead to good retirement outcomes.
One focus group participant commented that, in New Zealand, for a long time there was no necessity nor expectation to think about retirement.
I suppose we live in a society where, well, for me anyway, there is that kind of ‘oh, well, when I retire there will be the pension’ and I think growing up that was just kind of the expectation that we don’t need to think too much about retirement or savings because the government will look after us because we will get our pension and possibly, I don’t know if that was easy to live on, but certainly now it is not easy to live on the pension and then of course there is KiwiSaver, but it is just sort a historical attitude that we are part of the welfare society.
This comment is supported by data about expected sources of retirement income, discussed in the following section.

9CFFC Financial Capability Barometer 2018-2019
1.2. Expected sources of income in retirementWe asked the respondents who have not retired yet: What main source of retirement income do you expect to have? Respondents can choose from a broad range of options (Table 8) but over three quarters selected one of the following: NZ Super (38%), KiwiSaver (23%) or “Don’t know” (16%). A further 8% expected savings to be their main source of retirement income; each of the remaining options were selected by less than 3% respondents. To simplify further analysis, all responses other than “NZ Super”, “KiwiSaver” and “Don’t know” were aggregated as “Other” (Table 9).
TABLE 8. Expected main source of retirement income.
Respondents Percent
NZ Super 5243 38%
KiwiSaver 3077 23%
I’m not sure 2207 16%
Savings 1076 8%
Other pension/super (teacher, veterans etc.) 296 2%
Property investments 275 2%
Other retirement schemes (managed funds) 259 2%
Rental income (from property you own) 228 2%
Selling or downsizing my house 223 2%
Working part time 214 2%
Income from bonds, stocks and shares 104 1%
Inheritance or trust fund 93 1%
Something else 91 1%
Overseas government or state funded pension 79 1%
Overseas private or employer-based pension 79 1%
Income from a spouse or partner 79 1%
Selling assets (car, art, jewellery antiques etc.) 33 0%
Support from children or other family members 26 0%
Iwi Dividends 3 0%
Total 13685 100%
TABLE 9. Aggregated expected sources of main retirement income.
Respondents Percent
NZSuper 5243 38%
KiwiSaver 3077 23%
Other 3158 23%
Don’t know 2207 16%
Total 13685 100%
The main expected source of retirement income is linked to age (Figure 2). The older the respondent, the more likely he or she was to select NZ Super as their expected main source of retirement income. Younger respondents were more likely to select KiwiSaver as their main expected source of retirement income and were also more likely to say that they did not know what the main source of their retirement income would be.

10CFFC Financial Capability Barometer 2018-2019
18%
28%
40%
56%
66%
30%
31%
22%
13%
6%
23%
23%
24%
22%
24%
28%
18%
13%
10%
5%
0% 20% 40% 60% 80% 100%
18-30
31-40
41-50
51-60
61-70
NZSuper KiwiSaver Other Dont know
FIGURE 2. Expected main source of retirement income by age group.
The top place of New Zealand Superannuation among expected main sources of retirement income may partially explain the low levels of planning discussed above. Receiving New Zealand Superannuation does not require any planning or preparation (eligibility criteria are limited to having citizenship/permanent residency and time spent living in New Zealand). However, research done for the 2019 Review of Retirement Income Policies suggests that, to avoid hardship, a recipient of New Zealand Super should own a house and preferably have other, supplementary sources of income.11
Among respondents 40 years old and younger, KiwiSaver is the top expected main source of retirement income. This might be because these respondents expect their KiwiSaver income to be higher than Superannuation, or because they think that Superannuation will not be available to them (an opinion expressed by a number of young people in focus groups), or because they are overly optimistic about the value of their KiwiSaver at retirement.
1.3. KiwiSaver membershipSeparately to the Financial Capability Barometer, CFFC conducted a survey for the Review of Retirement Income Policies 2019, focused on KiwiSaver. Using the same methodology as the Barometer, 2,046 respondents aged 18-64 were surveyed. Of them, 77% were KiwiSaver members and 59% of all respondents (76% of KiwiSaver members) were making contributions (Table 10).
TABLE 10. KiwiSaver survey – kiwiSaver membership.
Are you in KiwiSaver? Respondents Percent
Yes, I’m in KiwiSaver and I’m making contributions 1212 59%
Yes, I’m in KiwiSaver, but I am not making contributions 373 18%
No, I’m not in KiwiSaver 461 23%
Total 2046 100%
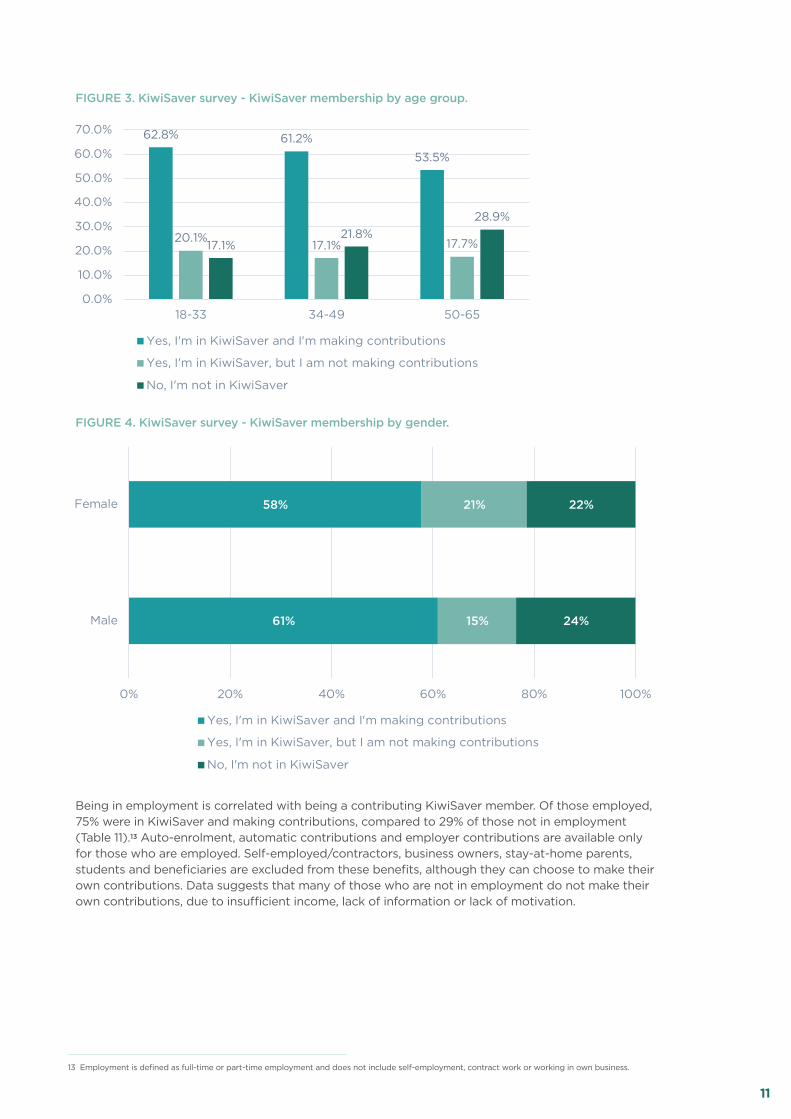
KiwiSaver membership was highest in the 18-33 age group (83%; Figure 3). Men and women had a similar rate of KiwiSaver membership (76% of men and 78.5% of women in the sample were KiwiSaver members) , but women were more likely than men to be non-contributing members (21% of women and 15% of men in the sample were in KiwiSaver but not contributing; Figure 4). This difference is likely due to more women than men taking time off work for childrearing and caregiving, and more women than men working in low-paid occupations.12
11 cffc-assets-prod.s3.ap-southeast-2.amazonaws.com/public/Uploads/Retirement-Income-Policy-Review/2019-RRIP/Research-docs/The-big-picture/CFFC-Research-Income-Sources-and-Hardship-in-Retirement.pdf
12 www.stats.govt.nz/news/women-in-paid-work; https://teara.govt.nz/en/gender-inequalities/page-4
11CFFC Financial Capability Barometer 2018-2019
62.8% 61.2%
53.5%
20.1%17.1% 17.7%17.1%
21.8%28.9%
0.0%
10.0%
20.0%
30.0%
40.0%
50.0%
60.0%
70.0%
18-33 34-49 50-65
Yes, I'm in KiwiSaver and I'm making contributions
Yes, I'm in KiwiSaver, but I am not making contributions
No, I'm not in KiwiSaver
61%
58%
15%
21%
24%
22%
0% 20% 40% 60% 80% 100%
Male
Female
Yes, I'm in KiwiSaver and I'm making contributions
Yes, I'm in KiwiSaver, but I am not making contributions
No, I'm not in KiwiSaver
FIGURE 3. KiwiSaver survey - KiwiSaver membership by age group.
FIGURE 4. KiwiSaver survey - KiwiSaver membership by gender.
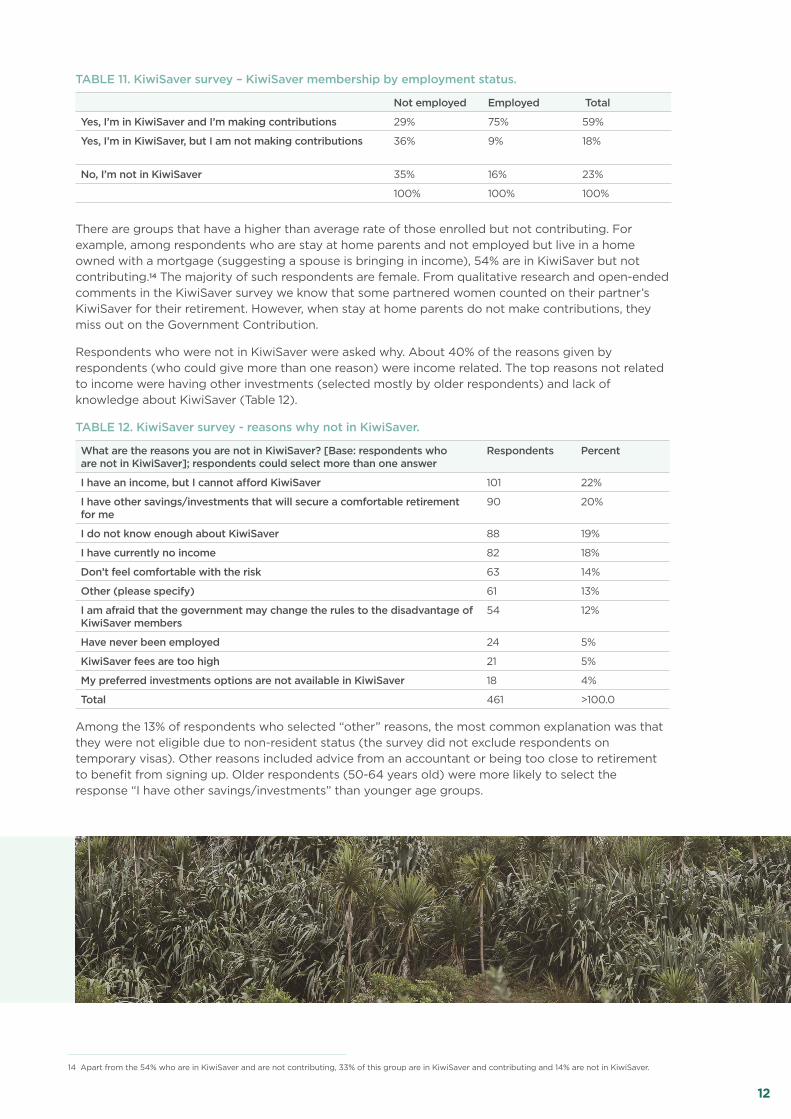
Being in employment is correlated with being a contributing KiwiSaver member. Of those employed, 75% were in KiwiSaver and making contributions, compared to 29% of those not in employment (Table 11).13 Auto-enrolment, automatic contributions and employer contributions are available only for those who are employed. Self-employed/contractors, business owners, stay-at-home parents, students and beneficiaries are excluded from these benefits, although they can choose to make their own contributions. Data suggests that many of those who are not in employment do not make their own contributions, due to insufficient income, lack of information or lack of motivation.
13 Employment is defined as full-time or part-time employment and does not include self-employment, contract work or working in own business.
12CFFC Financial Capability Barometer 2018-2019
TABLE 11. KiwiSaver survey – KiwiSaver membership by employment status.
Not employed Employed Total
Yes, I’m in KiwiSaver and I’m making contributions 29% 75% 59%
Yes, I’m in KiwiSaver, but I am not making contributions 36% 9% 18%
No, I’m not in KiwiSaver 35% 16% 23%
100% 100% 100%
There are groups that have a higher than average rate of those enrolled but not contributing. For example, among respondents who are stay at home parents and not employed but live in a home owned with a mortgage (suggesting a spouse is bringing in income), 54% are in KiwiSaver but not contributing.14 The majority of such respondents are female. From qualitative research and open-ended comments in the KiwiSaver survey we know that some partnered women counted on their partner’s KiwiSaver for their retirement. However, when stay at home parents do not make contributions, they miss out on the Government Contribution.
Respondents who were not in KiwiSaver were asked why. About 40% of the reasons given by respondents (who could give more than one reason) were income related. The top reasons not related to income were having other investments (selected mostly by older respondents) and lack of knowledge about KiwiSaver (Table 12).
TABLE 12. KiwiSaver survey - reasons why not in KiwiSaver.
What are the reasons you are not in KiwiSaver? [Base: respondents who are not in KiwiSaver]; respondents could select more than one answer
Respondents Percent
I have an income, but I cannot afford KiwiSaver 101 22%
I have other savings/investments that will secure a comfortable retirement for me
90 20%
I do not know enough about KiwiSaver 88 19%
I have currently no income 82 18%
Don’t feel comfortable with the risk 63 14%
Other (please specify) 61 13%
I am afraid that the government may change the rules to the disadvantage of KiwiSaver members
54 12%
Have never been employed 24 5%
KiwiSaver fees are too high 21 5%
My preferred investments options are not available in KiwiSaver 18 4%
Total 461 >100.0
Among the 13% of respondents who selected “other” reasons, the most common explanation was that they were not eligible due to non-resident status (the survey did not exclude respondents on temporary visas). Other reasons included advice from an accountant or being too close to retirement to benefit from signing up. Older respondents (50-64 years old) were more likely to select the response “I have other savings/investments” than younger age groups.
14 Apart from the 54% who are in KiwiSaver and are not contributing, 33% of this group are in KiwiSaver and contributing and 14% are not in KiwiSaver.
13CFFC Financial Capability Barometer 2018-2019
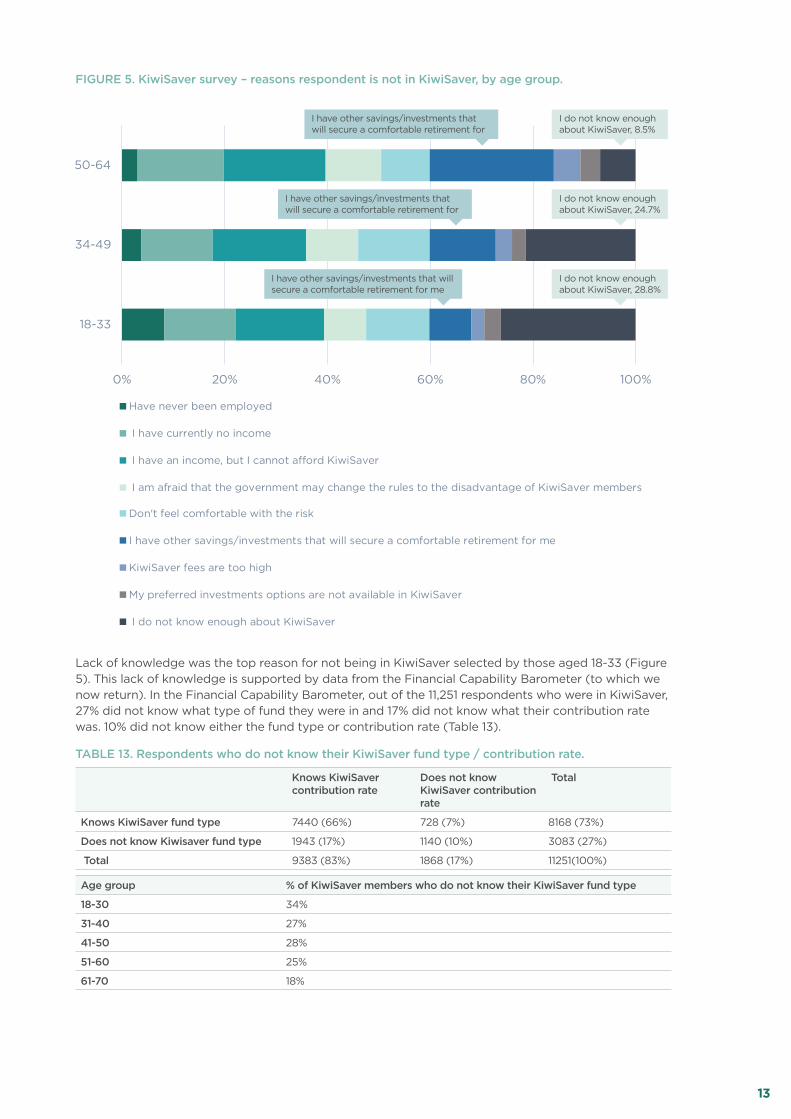
FIGURE 5. KiwiSaver survey – reasons respondent is not in KiwiSaver, by age group.
Lack of knowledge was the top reason for not being in KiwiSaver selected by those aged 18-33 (Figure 5). This lack of knowledge is supported by data from the Financial Capability Barometer (to which we now return). In the Financial Capability Barometer, out of the 11,251 respondents who were in KiwiSaver, 27% did not know what type of fund they were in and 17% did not know what their contribution rate was. 10% did not know either the fund type or contribution rate (Table 13).
TABLE 13. Respondents who do not know their KiwiSaver fund type / contribution rate.
Knows KiwiSaver contribution rate
Does not know KiwiSaver contribution rate
Total
Knows KiwiSaver fund type 7440 (66%) 728 (7%) 8168 (73%)
Does not know Kiwisaver fund type 1943 (17%) 1140 (10%) 3083 (27%)
Total 9383 (83%) 1868 (17%) 11251(100%)
Age group % of KiwiSaver members who do not know their KiwiSaver fund type
18-30 34%
31-40 27%
41-50 28%
51-60 25%
61-70 18%
0% 20% 40% 60% 80% 100%
18-33
34-49
50-64
Have never been employed
I have currently no income
I have an income, but I cannot a�ord KiwiSaver
I am afraid that the government may change the rules to the disadvantage of KiwiSaver members
Don't feel comfortable with the risk
I have other savings/investments that will secure a comfortable retirement for me
KiwiSaver fees are too high
My preferred investments options are not available in KiwiSaver
I do not know enough about KiwiSaver
I do not know enough about KiwiSaver, 8.5%
I do not know enough about KiwiSaver, 24.7%
I do not know enough about KiwiSaver, 28.8%
I have other savings/investments that will secure a comfortable retirement for
I have other savings/investments that will secure a comfortable retirement for
I have other savings/investments that will secure a comfortable retirement for me

14CFFC Financial Capability Barometer 2018-2019
Not knowing one’s fund type can have a negative impact on long term net worth. If those who need their money soon – for retirement or house deposit – are in a high-risk fund and a market downturn happens, they can end up with less money than they need or expect. We have seen this happen during the 2020 coronavirus crisis, when several KiwiSaver members found they did not have enough in their fund to purchase the property they had planned to purchase. Conversely, if those who do not need the money soon, keep it in a low-risk fund they can miss out on higher returns. Someone who does not know which fund they’re in has probably not considered any of the above and may be in a fund that is not the best fit for their situation.15
Not knowing one’s fund type was higher among younger respondents (Table 13). Not knowing one’s KiwiSaver fund type was especially high among Māori respondents aged 18-30 (49% of them did not know which fund they were in) and Pacific Peoples aged 18-30 (44% of them did not know which fund they were in, compared to 34% of all respondents aged 18-30). Qualitative research conducted for the 2019 Review of Retirement Income Policies suggests some possible reasons for Māori disengagement with KiwiSaver, such as a belief that they will not live long enough to access the money, and the inflexibility of KiwiSaver hardship and first home withdrawal rules.
There was also a gender gap - 33% of women, compared to 20% of men, did not know their KiwiSaver fund type. The reasons for this gender gap need to be explored further, because if this gap in knowing one’s fund type persists it can lead to exacerbating the existing gender inequality in net worth at retirement.16
1.4. Subjective confidence in ability to have a financially comfortable retirement
The survey also asked the respondents who have not retired yet to rate their agreement with the statement I am confident I will be able to have a financially comfortable retirement on a scale from 1 to 10 (1-completely disagree, 10 – completely agree). The distribution of responses is shown in Table 14. Responses cluster around the middle of the scale and the most common response was 5 out of 10. To facilitate comparison between different groups, we aggregated the responses into three levels (Table 15): low confidence (1 to 3; 24% of respondents), medium confidence (4 to 7; 55% of respondents) and high confidence (8 to 10; 21% of respondents).17
TABLE 14. Confidence in a financially comfortable retirement (out of 10).
I am confident I will be able to have a financially comfortable retirement Respondents Percent
Completely disagree 1 1375 10%
2 731 5%
3 1205 9%
4 1172 9%
5 2987 22%
6 1687 12%
7 1676 12%
8 1347 10%
9 602 4%
Completely agree 10 903 7%
Total 13685 100%
15 This inflexibility was discussed in the Review of Retirement Income Policies 2019 cffc-assets-prod.s3.ap-southeast-2.amazonaws.com/public/Uploads/Retirement-Income-Policy-Review/2019-RRIP/CFFC-Review-of-Retirement-Income-Policies-2019.pdf ; First home withdrawals limit house types, and occupancy requirements do not allow those who need to live in a large city (where they cannot afford to buy) to buy a property in a cheaper part of the country where they plan to retire in the future.
16 A Review of Gender Differences in Retirement Income, by Yanshu Huang and Jennifer Curtin, cffc-assets-prod.s3.ap-southeast-2.amazonaws.com/public/Uploads/Retirement-Income-Policy-Review/2019-RRIP/Research-docs/The-big-picture/Ak-Uni-PPI-Gender-Pension-Gap-Report.pdf
17 For brevity, these groups will be described in tables and graphs as “low”, “medium” and “high” retirement confidence, rather than “low confidence in a financially comfortable retirement” etc.

15CFFC Financial Capability Barometer 2018-2019
TABLE 15. Aggregation of responses to “extent agree will be able to have a financially comfortable retirement”.
Score out of 10 Percent of respondents Retirement confidence
1 to 3 24% Low
4 to 7 55% Medium
8 to 10 21% High
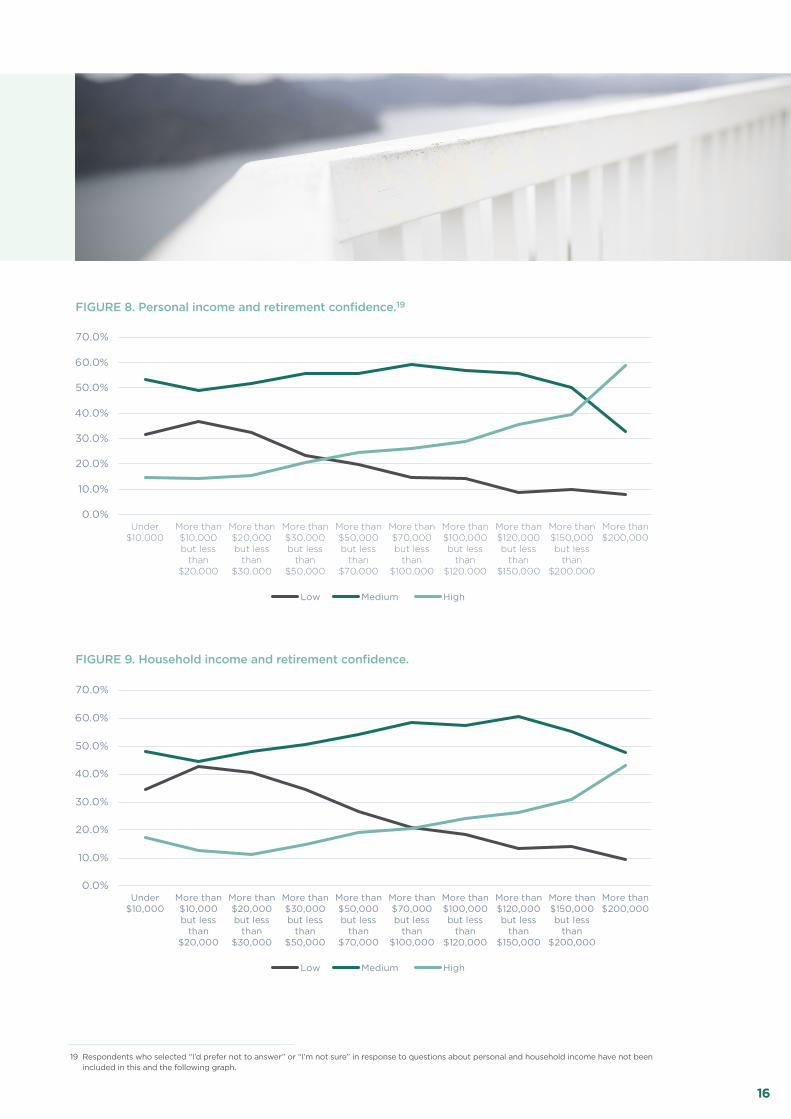
As expected, confidence that one will be able to have a financially comfortable retirement is linked to socio-economic status. Home owners are more likely to have high confidence (Figure 7),18 and higher personal and household income were correlated with higher retirement confidence (Figure 8 and Figure 9). Also, those who were able to save money more often were more likely to have high confidence in their ability to have a financially comfortable retirement (Figure 10).
FIGURE 7. Home ownership status and retirement confidence.
18 This data may not reflect the full impact of home ownership status on confidence in a financially comfortable retirement. Some of the respondents who do not own a home may expect to become home owners in the future, and these expectations can affect how they rate their retirement confidence.
31%
18%
53%
57%
16%
25%
0% 20% 40% 60% 80% 100%
Non-homeowner
Homeowner
Low Medium High
16CFFC Financial Capability Barometer 2018-2019
FIGURE 9. Household income and retirement confidence.
19 Respondents who selected “I’d prefer not to answer” or “I’m not sure” in response to questions about personal and household income have not been included in this and the following graph.
FIGURE 8. Personal income and retirement confidence.19
0.0%
10.0%
20.0%
30.0%
40.0%
50.0%
60.0%
70.0%
Under$10,000
More than$10,000but less
than$20,000
More than$20,000but less
than$30,000
More than$30,000but less
than$50,000
More than$50,000but less
than$70,000
More than$70,000but less
than$100,000
More than$100,000but less
than$120,000
More than$120,000but less
than$150,000
More than$150,000but less
than$200,000
More than$200,000
Low Medium High
Low Medium High
0.0%
10.0%
20.0%
30.0%
40.0%
50.0%
60.0%
70.0%
Under$10,000
More than$10,000but less
than$20,000
More than$20,000but less
than$30,000
More than$30,000but less
than$50,000
More than$50,000but less
than$70,000
More than$70,000but less
than$100,000
More than$100,000but less
than$120,000
More than$120,000but less
than$150,000
More than$150,000but less
than$200,000
More than$200,000
Low Medium High
Low Medium High

17CFFC Financial Capability Barometer 2018-2019
Those who agreed or strongly agreed that “I set long term goals and strive to achieve them” were three times more likely to have high confidence in their ability to have a financially comfortable retirement, compared to those who disagreed with this statement or were neutral (Figure 11). Those who had higher confidence that they will have a financially comfortable retirement had, on average, done more thinking about how much money they need in retirement and more planning (Figure 12 and Figure 13). Setting financial goals is a skill that can be learned and is one of the foundational skills taught in Sorted financial education courses and seminars, and through the Sorted.org.nz website.
FIGURE 11. Setting long term goals and retirement confidence.
FIGURE 10. Frequency of saving and retirement confidence.
13% 13% 15%27%
44%60%
57% 60% 63%
59%
49%34%
30% 27% 22%13% 8% 6%
0%
10%
20%
30%
40%
50%
60%
70%
80%
90%
100%
Every 1 to 2weeks
Every month Most months Somemonths
Rarely Never
How often are you able to save money?
Low Medium High
35%
15%
55%
54%
10%
31%
0% 20% 40% 60% 80% 100%
Do not Agree or Strongly Agree that "I setlong term goals and strive to achieve them"
Agree or Strongly Agree that "I set long termgoals and strive to achieve them"
Low Medium High
42%
26%15%
27%
32%
18%
18%30%
37%
14% 12%
29%
0%
10%
20%
30%
40%
50%
60%
70%
80%
90%
100%
Low RetirementConfidence
Medium RetirementConfidence
High RetirementConfidence
A great deal
A fair amount
A little
Hardly at all

18CFFC Financial Capability Barometer 2018-2019
FIGURE 12. Extent thought about the amount of money needed in retirement, by retirement confidence.
FIGURE 13. Knowing how much to save or invest for retirement, by retirement confidence.
57%
32%
16%
18%
20%
17%
16%
32%
23%
8%14%
29%
2% 2%
16%
0%
10%
20%
30%
40%
50%
60%
70%
80%
90%
100%
Low RetirementConfidence
Medium RetirementConfidence
High RetirementConfidence
I have a clear idea ofhow much I will needwith a specific plan
I have quite a goodidea of the numberbut not all the details
I have some idea butI'm not sure of thenumber
I have a rough idea
I have no idea
35%
15%
55%
54%
10%
31%
0% 20% 40% 60% 80% 100%
Do not Agree or Strongly Agree that "I setlong term goals and strive to achieve them"
Agree or Strongly Agree that "I set long termgoals and strive to achieve them"
Low Medium High
42%
26%15%
27%
32%
18%
18%30%
37%
14% 12%
29%
0%
10%
20%
30%
40%
50%
60%
70%
80%
90%
100%
Low RetirementConfidence
Medium RetirementConfidence
High RetirementConfidence
A great deal
A fair amount
A little
Hardly at all
19CFFC Financial Capability Barometer 2018-2019
20 Regression tables are in Appendix 2.
21 “Saver” was defined as a score at least 8 out of 10 in response to “I am a spender rather than a saver” (1-completely disagree, 10-completely agree).
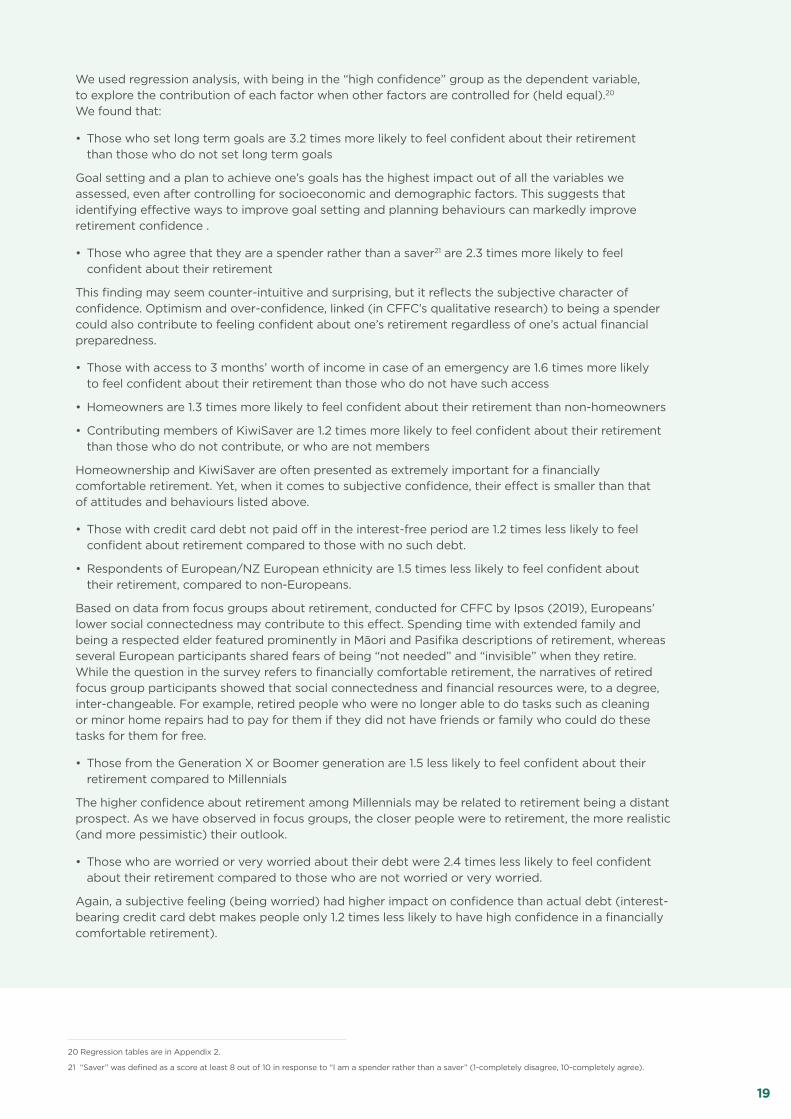
We used regression analysis, with being in the “high confidence” group as the dependent variable, to explore the contribution of each factor when other factors are controlled for (held equal).20 We found that:
• Those who set long term goals are 3.2 times more likely to feel confident about their retirement than those who do not set long term goals
Goal setting and a plan to achieve one’s goals has the highest impact out of all the variables we assessed, even after controlling for socioeconomic and demographic factors. This suggests that identifying effective ways to improve goal setting and planning behaviours can markedly improve retirement confidence .
• Those who agree that they are a spender rather than a saver21 are 2.3 times more likely to feel confident about their retirement
This finding may seem counter-intuitive and surprising, but it reflects the subjective character of confidence. Optimism and over-confidence, linked (in CFFC’s qualitative research) to being a spender could also contribute to feeling confident about one’s retirement regardless of one’s actual financial preparedness.
• Those with access to 3 months’ worth of income in case of an emergency are 1.6 times more likely to feel confident about their retirement than those who do not have such access
• Homeowners are 1.3 times more likely to feel confident about their retirement than non-homeowners
• Contributing members of KiwiSaver are 1.2 times more likely to feel confident about their retirement than those who do not contribute, or who are not members
Homeownership and KiwiSaver are often presented as extremely important for a financially comfortable retirement. Yet, when it comes to subjective confidence, their effect is smaller than that of attitudes and behaviours listed above.
• Those with credit card debt not paid off in the interest-free period are 1.2 times less likely to feel confident about retirement compared to those with no such debt.
• Respondents of European/NZ European ethnicity are 1.5 times less likely to feel confident about their retirement, compared to non-Europeans.
Based on data from focus groups about retirement, conducted for CFFC by Ipsos (2019), Europeans’ lower social connectedness may contribute to this effect. Spending time with extended family and being a respected elder featured prominently in Māori and Pasifika descriptions of retirement, whereas several European participants shared fears of being “not needed” and “invisible” when they retire. While the question in the survey refers to financially comfortable retirement, the narratives of retired focus group participants showed that social connectedness and financial resources were, to a degree, inter-changeable. For example, retired people who were no longer able to do tasks such as cleaning or minor home repairs had to pay for them if they did not have friends or family who could do these tasks for them for free.
• Those from the Generation X or Boomer generation are 1.5 less likely to feel confident about their retirement compared to Millennials
The higher confidence about retirement among Millennials may be related to retirement being a distant prospect. As we have observed in focus groups, the closer people were to retirement, the more realistic (and more pessimistic) their outlook.
• Those who are worried or very worried about their debt were 2.4 times less likely to feel confident about their retirement compared to those who are not worried or very worried.
Again, a subjective feeling (being worried) had higher impact on confidence than actual debt (interest-bearing credit card debt makes people only 1.2 times less likely to have high confidence in a financially comfortable retirement).
20CFFC Financial Capability Barometer 2018-2019
22 p<.01 was used to define significance. If relaxed to p<.05, gender and personal income over 100k per annum would be significant.
23 sorted.org.nz/must-reads/rainy-day-funds-enjoy-their-day-in-the-sun/
24 This question is phrased in terms of income rather than expenses, which means that it sets the bar somewhat higher than the traditional emergency fund. Many people do not spend their whole income on current expenses. The question also does not provide a good response option for people who do not have their own income. Notwithstanding these limitations, this question does measure the availability of emergency funds. For comparison, the corresponding question from the OECD/INFE Adult Measurement Toolkit is:
If you lost your main source of income, how long could you continue to cover your living expenses without borrowing any money or moving house?
(Less than a week / At least a week, but not one month / At least one month, but not three months/ At least 3 months, but not six months/ Six months or more). This question focuses on expenses. It explicitly states ‘without borrowing’ because some people may view their available credit card limit as ‘available cash’. The condition ‘without moving house’ clarifies how long the respondent can survive without taking drastic measures to cut expenses.
There are variables that were found to be not significant.22 These include:
• Gender
• Income range (while this may be unexpected, income is proxied by many of the significant variables discussed above).
• Debts other than credit card: hire purchase, personal loan, mortgage, finance company
• Living in Auckland
• University degree
These findings suggest that confidence in one’s ability to have a financially comfortable retirement may be affected by subjective factors that have little causal relationship with being actually prepared for retirement. Therefore, self-reported confidence should not be treated as a measure of people’s actual preparedness for retirement. Nonetheless, confidence is important: we know from CFFC’s qualitative research that lack of confidence (a belief that one has no chance of having a financially comfortable retirement) can lead to avoiding the topic of retirement saving altogether. These findings also suggest that confidence in a financially comfortable retirement can be improved by teaching people to set long term financial goals and teaching strategies to deal with debt that result in less worrying about debt.
Chapter 2. Savings and debt2.1. Short-term savings: Emergency fund
An emergency fund (or a rainy-day fund) is money set aside for unexpected expenses, such as car repairs, job loss, medical expenses or unplanned but necessary travel. Having an emergency fund reduces the need to borrow money in such situations. Sorted.org.nz, as well as many personal finance experts, recommend saving at least 3 months’ worth of expenses as a rainy-day fund.23
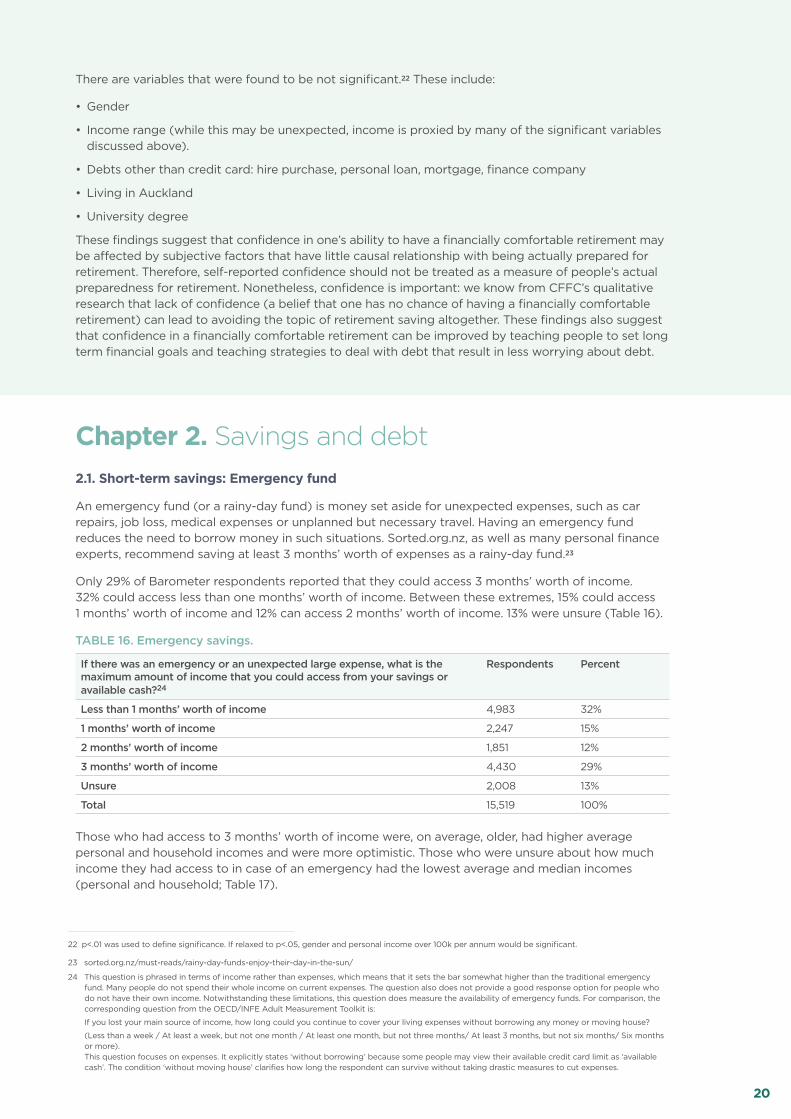
Only 29% of Barometer respondents reported that they could access 3 months’ worth of income. 32% could access less than one months’ worth of income. Between these extremes, 15% could access 1 months’ worth of income and 12% can access 2 months’ worth of income. 13% were unsure (Table 16).
TABLE 16. Emergency savings.
If there was an emergency or an unexpected large expense, what is the maximum amount of income that you could access from your savings or available cash?24
Respondents Percent
Less than 1 months’ worth of income 4,983 32%
1 months’ worth of income 2,247 15%
2 months’ worth of income 1,851 12%
3 months’ worth of income 4,430 29%
Unsure 2,008 13%
Total 15,519 100%
Those who had access to 3 months’ worth of income were, on average, older, had higher average personal and household incomes and were more optimistic. Those who were unsure about how much income they had access to in case of an emergency had the lowest average and median incomes (personal and household; Table 17).
21CFFC Financial Capability Barometer 2018-2019
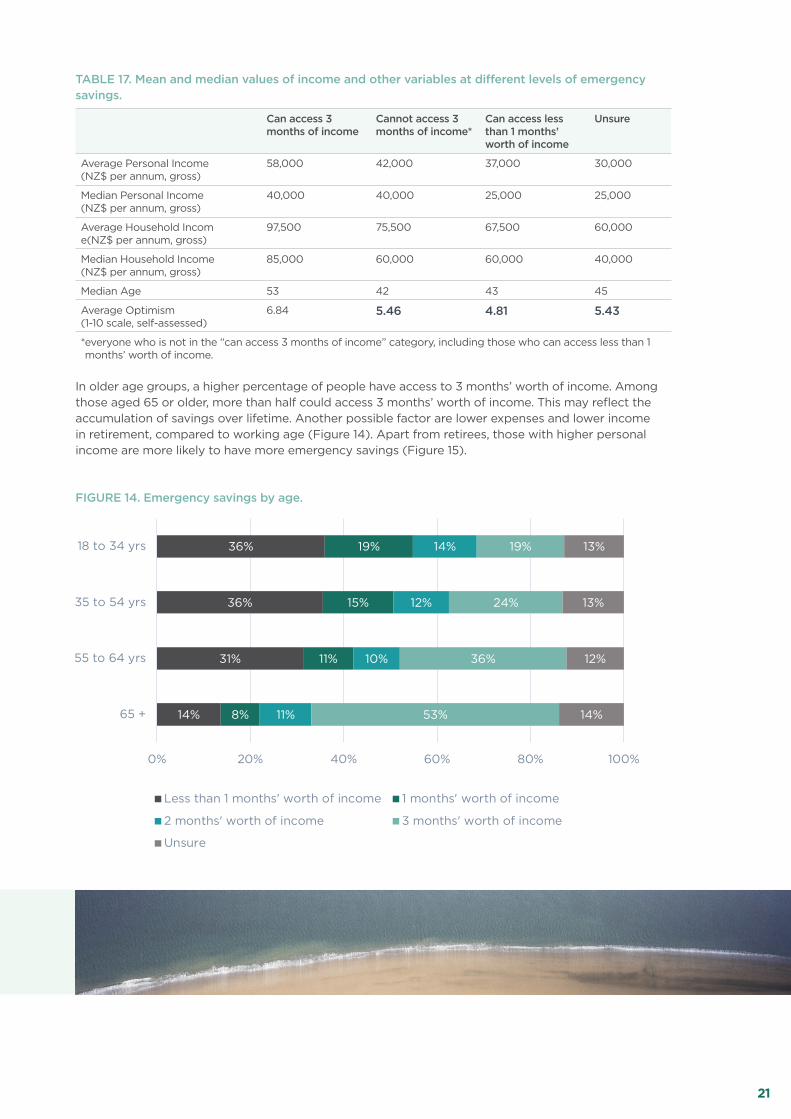
TABLE 17. Mean and median values of income and other variables at different levels of emergency savings.
Can access 3 months of income
Cannot access 3 months of income*
Can access less than 1 months’ worth of income
Unsure
Average Personal Income (NZ$ per annum, gross)
58,000 42,000 37,000 30,000
Median Personal Income (NZ$ per annum, gross)
40,000 40,000 25,000 25,000
Average Household Incom e(NZ$ per annum, gross)
97,500 75,500 67,500 60,000
Median Household Income (NZ$ per annum, gross)
85,000 60,000 60,000 40,000
Median Age 53 42 43 45
Average Optimism (1-10 scale, self-assessed)
6.84 5.46 4.81 5.43
* everyone who is not in the “can access 3 months of income” category, including those who can access less than 1 months’ worth of income.
In older age groups, a higher percentage of people have access to 3 months’ worth of income. Among those aged 65 or older, more than half could access 3 months’ worth of income. This may reflect the accumulation of savings over lifetime. Another possible factor are lower expenses and lower income in retirement, compared to working age (Figure 14). Apart from retirees, those with higher personal income are more likely to have more emergency savings (Figure 15).
FIGURE 14. Emergency savings by age.
36%
36%
31%
14%
19%
15%
11%
8%
14%
12%
10%
11%
19%
24%
36%
53%
13%
13%
12%
14%
0% 20% 40% 60% 80% 100%
18 to 34 yrs
35 to 54 yrs
55 to 64 yrs
65 +
Less than 1 months' worth of income 1 months' worth of income
2 months' worth of income 3 months' worth of income
Unsure
39%
28%
12%
14%
17%
17%
10%
17%
15%
24%
34%
52%
13%
5%
3%
0% 20% 40% 60% 80% 100%
under 50k
50-100k
100k+
Less than 1 months' worth of income 1 months' worth of income
2 months' worth of income 3 months' worth of income
Unsure

22CFFC Financial Capability Barometer 2018-2019
FIGURE 15. Emergency savings by personal income.
FIGURE 16. Emergency savings by ethnicity.
Māori and Pacific Peoples are more likely to have limited emergency savings, compared to other ethnic groups (Figure 16). However, these results need to be interpreted with caution. The high proportion of “unsure” responses among Māori and Pacific Peoples, compared to other ethnic groups, may signal that the question did not resonate with these respondents. Other CFFC research indicates that Māori and Pacific Peoples are more likely to have irregular income, or to rely on their extended family in case of an emergency. In such cases, respondents may find it difficult to assess their safety net in terms of multiples of monthly income.
45%
40%
19%
32%
27%
11%
16%
21%
14%
17%
8%
8%
17%
12%
15%
12%
10%
30%
31%
27%
24%
25%
13%
11%
13%
0% 20% 40% 60% 80% 100%
Maori
Pacific Peoples
Asian
European
Other
Less than 1 months' worth of income 1 months' worth of income
2 months' worth of income 3 months' worth of income
Unsure
36%
36%
31%
14%
19%
15%
11%
8%
14%
12%
10%
11%
19%
24%
36%
53%
13%
13%
12%
14%
0% 20% 40% 60% 80% 100%
18 to 34 yrs
35 to 54 yrs
55 to 64 yrs
65 +
Less than 1 months' worth of income 1 months' worth of income
2 months' worth of income 3 months' worth of income
Unsure
39%
28%
12%
14%
17%
17%
10%
17%
15%
24%
34%
52%
13%
5%
3%
0% 20% 40% 60% 80% 100%
under 50k
50-100k
100k+
Less than 1 months' worth of income 1 months' worth of income
2 months' worth of income 3 months' worth of income
Unsure
23CFFC Financial Capability Barometer 2018-2019
25 Regression table in Appendix 2.2.
Another large gap in access to emergency funds was between home owners and non-home owners (non-home owners include renters, people living with parents or in other housing arrangements such as student halls or a boarding house). In Table 18, we see that 45% of non-home owners can only access less than 1 months’ worth of income, which puts them at risk of high interest borrowing in an emergency compared to home owners, who, even without an emergency fund, can usually access their home equity or get a “mortgage holiday” from their bank, both of which are relatively low-interest forms of borrowing.
TABLE 18. Emergency savings by homeownership status.
If there was an emergency or an unexpected large expense, what is the maximum amount of income that you could access from your savings or available cash?
Non-homeowners Homeowners Total
Less than 1 months’ worth of income 45% 22% 32%
1 months’ worth of income 13% 16% 15%
2 months’ worth of income 9% 14% 12%
3 months’ worth of income 16% 39% 29%
Unsure 18% 9% 13%
100.0% 100.0% 100.0%
Again, we used regression analysis to explore the relative contribution of various factors to having an emergency fund. When controlling for other relevant factors:
• Age (older) and income (higher) increase the odds of having an emergency fund. Boomers are 2.7 times more likely to have an emergency fund compared to Millennials, everything else being equal; those earning more than 100k per annum are 2.9 times more likely to have an emergency fund than those earning less than 50k.
• Homeowners are 2.1 time more likely to have an emergency fund than non-homeowners, even when controlling for age, income, and other relevant factors. We do not know the direction of causality – perhaps a mortgage is an incentive to save to not fall behind on payments, or maybe those who manage money better to begin with (including having an emergency fund) are more likely to become home owners.
• Asians and Europeans are more than twice as likely to have an emergency fund than Māori and Pacific Peoples. An explanation suggested by Sorted facilitators who work with Māori and Pasifika communities is that people tend to share their money with their families and communities, rather than save it, and rely on reciprocity when they are in need. Further research would be useful to compare the outcomes of those relying on networks and those relying on own savings.
• Credit card debt has the strongest negative effect on the likelihood of having a 3-month emergency fund; someone who carries a balance on a credit card is more than 3 times less likely to have an emergency fund than someone who does not carry a balance. We will see later in this chapter that credit card debt is concentrated among those who can afford to borrow, rather than among those most disadvantaged. While some people do not have an emergency fund because their income is too low to save three months’ worth of it, for others not having an emergency fund is linked to over-spending.
2.2. Regular savingIn response to a question about how often they were able to save money, 53% of respondents said they were able to save money monthly or weekly. The ability to save regularly was correlated with income levels (Table 19).
TABLE 19. Rate of regular saving within different income groups.
Characteristic Percent able to save money monthly or weekly
Personal income under 50k 45%
Personal income 50-100k 66%
Personal income 100k+ 72%
Household income under 50k 37%
Household income 50-100k 55%
Household income 100k+ 69%

24CFFC Financial Capability Barometer 2018-2019
Interestingly, age groups that were more likely to report an ability to save regularly reported lower rates of access to 3 months’ worth of income (Table 20). When looking at individuals by their ability to save and access to emergency funds, we see that 39% were not able to access 3 months’ worth of income and were not able to save at least monthly. A further 20% were able to save monthly and could access 3 months’ worth of income. The 8% who were not able to save but had an emergency fund probably stopped working after they have accumulated the savings (Table 21).
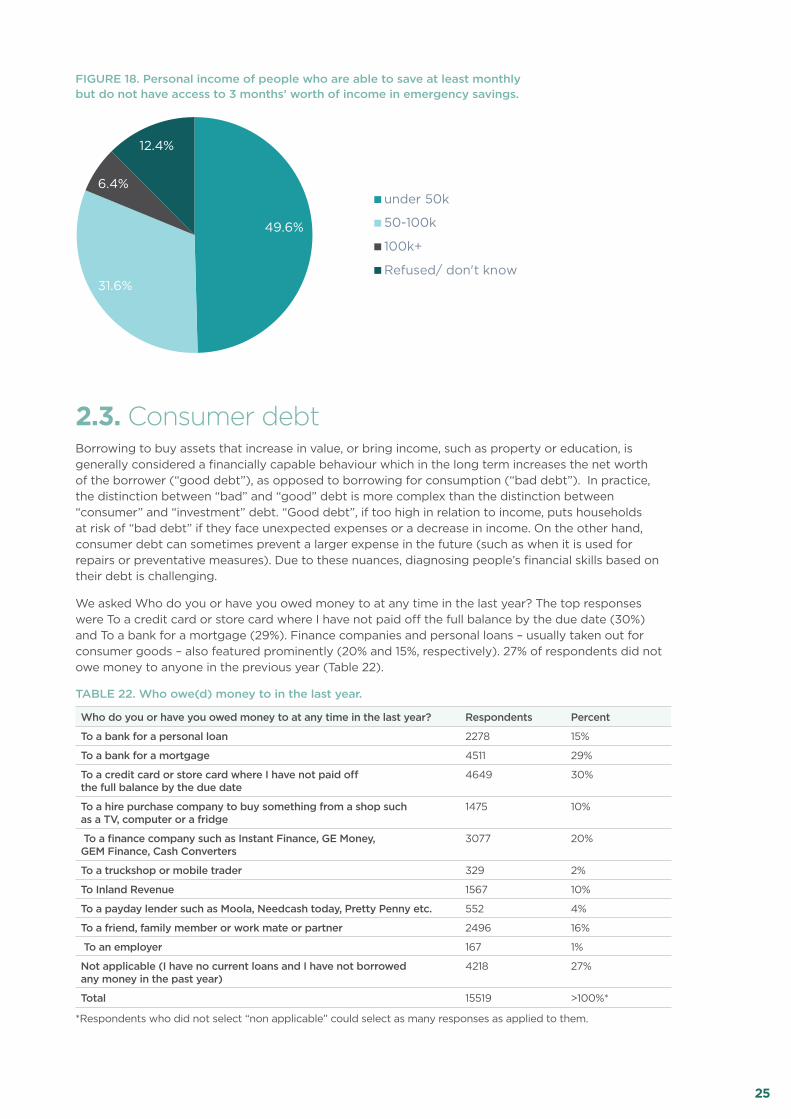
The 33% who were able to save money at least monthly but did not have an emergency fund were, on average, young (Figure 17) and had low personal incomes (Figure 18). This suggests that while they were able to save regularly, the amount saved was not enough to accumulate the recommended 3-month emergency fund, or that they saved for consumption rather than for an emergency fund.
TABLE 20. Rate of regular savings in different age groups, compared with the percentage of those who have access to 3 months’ worth of income.
Age group Percent able to save money monthly or weekly
Percent able to access 3 months’ worth of income in an emergency
18-30 63% 18%
31-40 55% 22%
41-50 49% 24%
51-60 49% 31%
61-70 50% 47%
70+ 44% 54%
TABLE 21. Ability to save money and access to emergency funds
Not able to save money at least monthly Able to save money at least monthly
Can’t access 3 months’ worth of income
39% (of total sample) 33% (of total sample)
Can access 3 months’ worth of income
8% (of total sample) 20% (of total sample)
30%
24%
20%
16%
8%3%
18-30
31-40
41-50
51-60
61-70
70+
49.6%
31.6%
6.4%
12.4%
under 50k
50-100k
100k+
Refused/ don't know
FIGURE 17. Age of people who are able to save at least monthly but do not have access to 3 months’ worth of income in emergency savings.
25CFFC Financial Capability Barometer 2018-2019
FIGURE 18. Personal income of people who are able to save at least monthly but do not have access to 3 months’ worth of income in emergency savings.
2.3. Consumer debt Borrowing to buy assets that increase in value, or bring income, such as property or education, is generally considered a financially capable behaviour which in the long term increases the net worth of the borrower (“good debt”), as opposed to borrowing for consumption (“bad debt”). In practice, the distinction between “bad” and “good” debt is more complex than the distinction between “consumer” and “investment” debt. “Good debt”, if too high in relation to income, puts households at risk of “bad debt” if they face unexpected expenses or a decrease in income. On the other hand, consumer debt can sometimes prevent a larger expense in the future (such as when it is used for repairs or preventative measures). Due to these nuances, diagnosing people’s financial skills based on their debt is challenging.
We asked Who do you or have you owed money to at any time in the last year? The top responses were To a credit card or store card where I have not paid off the full balance by the due date (30%) and To a bank for a mortgage (29%). Finance companies and personal loans – usually taken out for consumer goods – also featured prominently (20% and 15%, respectively). 27% of respondents did not owe money to anyone in the previous year (Table 22).
TABLE 22. Who owe(d) money to in the last year.
Who do you or have you owed money to at any time in the last year? Respondents Percent
To a bank for a personal loan 2278 15%
To a bank for a mortgage 4511 29%
To a credit card or store card where I have not paid off the full balance by the due date
4649 30%
To a hire purchase company to buy something from a shop such as a TV, computer or a fridge
1475 10%
To a finance company such as Instant Finance, GE Money, GEM Finance, Cash Converters
3077 20%
To a truckshop or mobile trader 329 2%
To Inland Revenue 1567 10%
To a payday lender such as Moola, Needcash today, Pretty Penny etc. 552 4%
To a friend, family member or work mate or partner 2496 16%
To an employer 167 1%
Not applicable (I have no current loans and I have not borrowed any money in the past year)
4218 27%
Total 15519 >100%*
*Respondents who did not select “non applicable” could select as many responses as applied to them.
30%
24%
20%
16%
8%3%
18-30
31-40
41-50
51-60
61-70
70+
49.6%
31.6%
6.4%
12.4%
under 50k
50-100k
100k+
Refused/ don't know
26CFFC Financial Capability Barometer 2018-2019
Loan data from the Barometer has several limitations. We do not know how many loans of each type respondents had, and we do not know the balance of these loans. We also do not know what the loan was for, making some forms of loans challenging to assess in terms of financially capable behaviour. For example, the category “loans from friends and family” captures those who borrow for consumption due to hardship, as well as those who receive a loan from parents to buy a house.
Taking the above limitations into account, in this section we will focus on credit cards and store cards where the borrower pays interest (that is, the borrower did not pay off the balance in full by the due date). Such interest-bearing credit card and store card debt fits the “bad debt” category as defined at the start of this section.
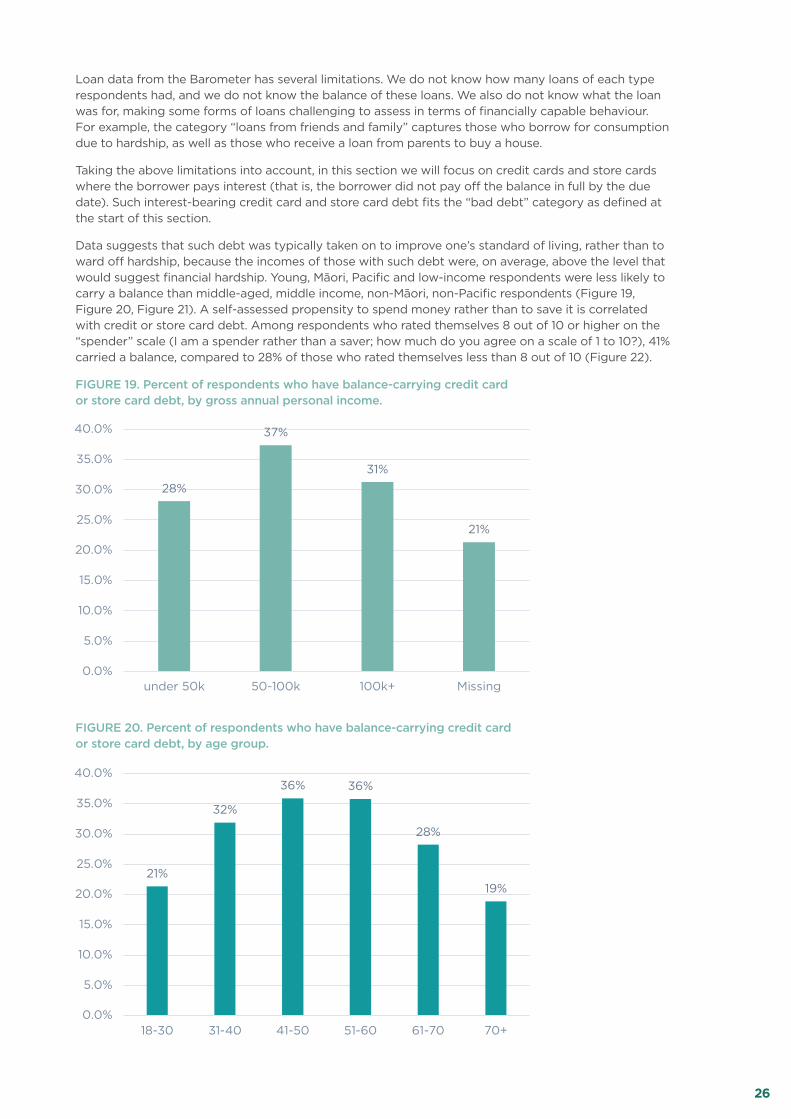
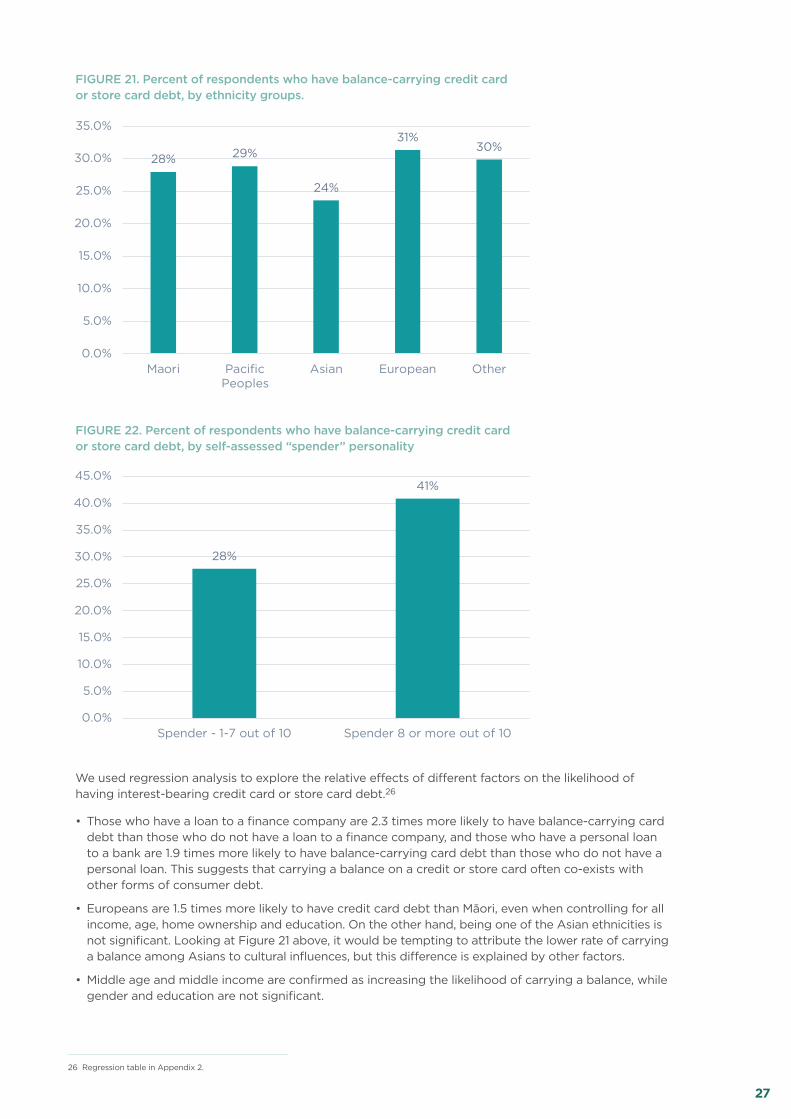
Data suggests that such debt was typically taken on to improve one’s standard of living, rather than to ward off hardship, because the incomes of those with such debt were, on average, above the level that would suggest financial hardship. Young, Māori, Pacific and low-income respondents were less likely to carry a balance than middle-aged, middle income, non-Māori, non-Pacific respondents (Figure 19, Figure 20, Figure 21). A self-assessed propensity to spend money rather than to save it is correlated with credit or store card debt. Among respondents who rated themselves 8 out of 10 or higher on the “spender” scale (I am a spender rather than a saver; how much do you agree on a scale of 1 to 10?), 41% carried a balance, compared to 28% of those who rated themselves less than 8 out of 10 (Figure 22).
FIGURE 19. Percent of respondents who have balance-carrying credit card or store card debt, by gross annual personal income.
FIGURE 20. Percent of respondents who have balance-carrying credit card or store card debt, by age group.
28%
37%
31%
21%
0.0%
5.0%
10.0%
15.0%
20.0%
25.0%
30.0%
35.0%
40.0%
under 50k 50-100k 100k+ Missing
21%
32%
36% 36%
28%
19%
0.0%
5.0%
10.0%
15.0%
20.0%
25.0%
30.0%
35.0%
40.0%
18-30 31-40 41-50 51-60 61-70 70+
28% 29%
24%
31%30%
0.0%
5.0%
10.0%
15.0%
20.0%
25.0%
30.0%
35.0%
Maori PacificPeoples
Asian European Other
27CFFC Financial Capability Barometer 2018-2019
FIGURE 21. Percent of respondents who have balance-carrying credit card or store card debt, by ethnicity groups.
FIGURE 22. Percent of respondents who have balance-carrying credit card or store card debt, by self-assessed “spender” personality
We used regression analysis to explore the relative effects of different factors on the likelihood of having interest-bearing credit card or store card debt.26
• Those who have a loan to a finance company are 2.3 times more likely to have balance-carrying card debt than those who do not have a loan to a finance company, and those who have a personal loan to a bank are 1.9 times more likely to have balance-carrying card debt than those who do not have a personal loan. This suggests that carrying a balance on a credit or store card often co-exists with other forms of consumer debt.
• Europeans are 1.5 times more likely to have credit card debt than Māori, even when controlling for all income, age, home ownership and education. On the other hand, being one of the Asian ethnicities is not significant. Looking at Figure 21 above, it would be tempting to attribute the lower rate of carrying a balance among Asians to cultural influences, but this difference is explained by other factors.
• Middle age and middle income are confirmed as increasing the likelihood of carrying a balance, while gender and education are not significant.
28%
41%
0.0%
5.0%
10.0%
15.0%
20.0%
25.0%
30.0%
35.0%
40.0%
45.0%
Spender - 1-7 out of 10 Spender 8 or more out of 10
26 Regression table in Appendix 2.
21%
32%
36% 36%
28%
19%
0.0%
5.0%
10.0%
15.0%
20.0%
25.0%
30.0%
35.0%
40.0%
18-30 31-40 41-50 51-60 61-70 70+
28% 29%
24%
31%30%
0.0%
5.0%
10.0%
15.0%
20.0%
25.0%
30.0%
35.0%
Maori PacificPeoples
Asian European Other
28CFFC Financial Capability Barometer 2018-2019
Those who over-spend and over-borrow while having sufficient incomes to save (if they constrained their spending) have been one of the target groups of CFFC’s educational initiatives and the focus of CFFC’s qualitative research. This is the group where behaviour change can have the most impact on their financial future and retirement preparedness. Those “in the middle” who over-spend are not poor enough, or in enough trouble, to benefit from initiatives directed at those in financial hardship. They are also not rich enough to be attractive customers for commercial financial advice services. Because consumer borrowing and living for the present moment has been normalised in their social circles, they are often unaware of the consequences over-borrowing can have on their retirement.
The data show that consumer debt is common in New Zealand and not limited to socio-economically disadvantaged groups who may be forced to borrow to make ends meet, but prevalent also among those on average and high incomes as previously discussed. Without knowing the amount of debt people have in relation to their income it is hard to tell how much of this debt is excessive. Nonetheless, we know that New Zealand has a low household savings rate compared to other OECD countries.27
2.5. Debt and worryWe have asked survey respondents who reported at least one form of debt (N=11,301) how worried or comfortable they were with the amount of debt they had (Table 23); 25% of those who had any debt were “quite worried” and 9% were “very worried”. For further analysis, we have collapsed the responses above into two categories: 1) worried or very worried and 2) not worried or neither/nor (Table 24). In Table 25 we see that except for mortgage debt, those who were worried tended to have higher prevalence of debt, especially high-interest debt. More research is needed to investigate the links between debt, stress and mental health. If we could prove that decreasing non-mortgage debt of New Zealanders would improve mental health, it would be a strong argument in favour of more investment in financial capability.
TABLE 23. How comfortable or worried with current debt.
B2 How comfortable or worried are you with the amount of debt you have at the moment? Respondents Percent
Very worried 1035 9%
Quite worried 2823 25%
Neither / nor 3703 33%
Quite comfortable 2573 23%
Very comfortable 1167 10%
Total 11301 100%
TABLE 24. How worried about debt (collapsed).
Respondents Percent
Not worried or neither/not 7443 66%
Worried or very worried about debt 3858 34%
Total 11301 100.0
27 data.oecd.org/hha/household-savings.html
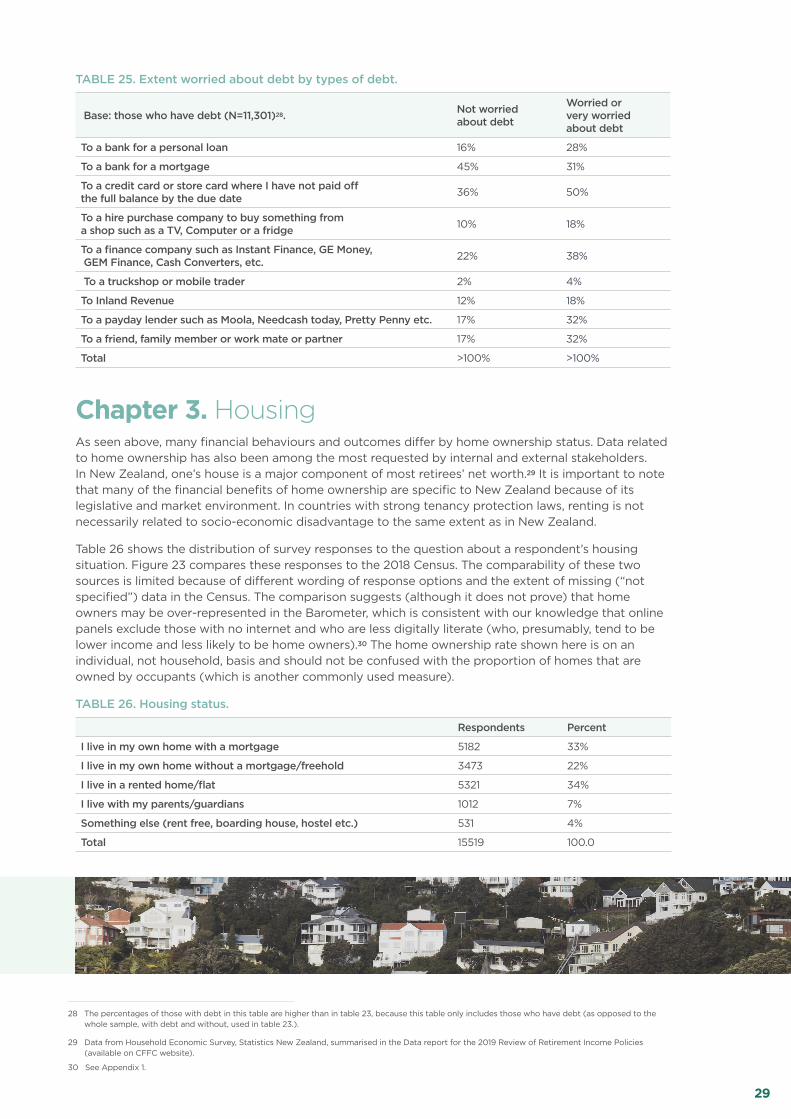
29CFFC Financial Capability Barometer 2018-2019
TABLE 25. Extent worried about debt by types of debt.
Base: those who have debt (N=11,301)28. Not worried about debt
Worried or very worried about debt
To a bank for a personal loan 16% 28%
To a bank for a mortgage 45% 31%
To a credit card or store card where I have not paid off the full balance by the due date 36% 50%
To a hire purchase company to buy something from a shop such as a TV, Computer or a fridge 10% 18%
To a finance company such as Instant Finance, GE Money, GEM Finance, Cash Converters, etc. 22% 38%
To a truckshop or mobile trader 2% 4%
To Inland Revenue 12% 18%
To a payday lender such as Moola, Needcash today, Pretty Penny etc. 17% 32%
To a friend, family member or work mate or partner 17% 32%
Total >100% >100%
Chapter 3. HousingAs seen above, many financial behaviours and outcomes differ by home ownership status. Data related to home ownership has also been among the most requested by internal and external stakeholders. In New Zealand, one’s house is a major component of most retirees’ net worth.29 It is important to note that many of the financial benefits of home ownership are specific to New Zealand because of its legislative and market environment. In countries with strong tenancy protection laws, renting is not necessarily related to socio-economic disadvantage to the same extent as in New Zealand.
Table 26 shows the distribution of survey responses to the question about a respondent’s housing situation. Figure 23 compares these responses to the 2018 Census. The comparability of these two sources is limited because of different wording of response options and the extent of missing (“not specified”) data in the Census. The comparison suggests (although it does not prove) that home owners may be over-represented in the Barometer, which is consistent with our knowledge that online panels exclude those with no internet and who are less digitally literate (who, presumably, tend to be lower income and less likely to be home owners).30 The home ownership rate shown here is on an individual, not household, basis and should not be confused with the proportion of homes that are owned by occupants (which is another commonly used measure).
TABLE 26. Housing status.
Respondents Percent
I live in my own home with a mortgage 5182 33%
I live in my own home without a mortgage/freehold 3473 22%
I live in a rented home/flat 5321 34%
I live with my parents/guardians 1012 7%
Something else (rent free, boarding house, hostel etc.) 531 4%
Total 15519 100.0
28 The percentages of those with debt in this table are higher than in table 23, because this table only includes those who have debt (as opposed to the whole sample, with debt and without, used in table 23.).
29 Data from Household Economic Survey, Statistics New Zealand, summarised in the Data report for the 2019 Review of Retirement Income Policies (available on CFFC website).
30 See Appendix 1.

30CFFC Financial Capability Barometer 2018-2019
FIGURE 23. A comparison of home ownership data from the Barometer 2018-2019 and from the 2018 census.
3.1. Demographics of home owners with and without a mortgage and renters
Figure 24 shows box plots31 of age values for different housing tenures. Those with mortgage-free home ownership are, on average, the oldest: over half are over 60 years old. Renters, on average, are younger than those who own a house with a mortgage, but the difference between the two groups is small compared to the difference between mortgage-free homeowners and everyone else. Mortgage holders have, on average, the highest incomes (Figure 25, Figure 26). The relatively low incomes of freehold owners are age related: many of them are retired and rely on NZ Superannuation.
FIGURE 24. Box plots of age by housing tenure.
31 “X” is the mean; the horizontal line in the box is the median (50% are over, 50% are under); the bottom of the box is halfway between the median and the lowest value, and the top of the box is halfway between the median and the highest value. The whiskers show the range for the bottom and top 25%, excluding outliers (shown as points; an explanation how the software used (SPPS) defines outliers can be found at www.unige.ch/ses/sococ/cl/spss/concepts/outliers.html).
Own or partly own 35%
Family trust 9%
Missing data 15%
Do not own 41%Renting 34%
Own house with mortgage33%
Other 11%
Own house without mortgage33%
Barometer (2018 - 2019) 2018 Census (Statistic NZ)
FIGURE 24. BOX PLOTS OF AGE BY HOUSING TENURE.
0
10
20
30
40
50
60
70
80
90
100
Per
son
al in
com
e (N
ZD
gro
ss p
a)
0
50000
100000
150000
200000
250000
Own (Mortgage)
Ag
e
Own (No Mortgage) Renting Live with parents Other
Own (Mortgage) Own (No Mortgage) Renting Live with parents Other

31CFFC Financial Capability Barometer 2018-2019
FIGURE 25. Box plots of annual personal income by housing tenure.
FIGURE 26. Box plots of annual household income by housing tenure.
Data on housing tenure within different age groups (Figure 27) reflects the expected progression from renting or living with parents in younger age groups, acquiring a mortgage and paying the mortgage off when close to retirement. However, this is not true for everyone. Those who do not achieve home ownership by the time they retire are at risk of worse retirement outcomes. Due to the overall trend of decreasing home ownership, we may see this group grow in the future. Data on housing status by age for Māori (Figure 28) and Pacific Peoples (Figure 29) shows much lower rates of home ownership in all age groups (note: the sample of Māori and Pacific Peoples over 60 years old in the Financial Capability is small and data for these age groups should be used with caution).
FIGURE 26. BOX PLOTS OF ANNUAL HOUSEHOLD INCOME BY HOUSING TENURE.
Ho
use
ho
ld in
com
e (N
ZD
gro
ss p
a)
0
50000
100000
150000
200000
250000 Own (Mortgage) Own (No Mortgage) Renting Live with parents Other
FIGURE 24. BOX PLOTS OF AGE BY HOUSING TENURE.
0
10
20
30
40
50
60
70
80
90
100
Per
son
al in
com
e (N
ZD
gro
ss p
a)
0
50000
100000
150000
200000
250000
Own (Mortgage)
Ag
e
Own (No Mortgage) Renting Live with parents Other
Own (Mortgage) Own (No Mortgage) Renting Live with parents Other

32CFFC Financial Capability Barometer 2018-2019
FIGURE 27. Housing tenure by age.
FIGURE 28. Housing tenure by age – Māori. (Note: small sample sizes for 61-70 and 70+ groups).
21%
44%47%
37%
22%
10%
4%
7%
13%27% 55%
75%48%
41%
35%30%
20%11%
22%
5% 3% 2%5% 3% 3% 4% 3% 4%
0%
10%
20%
30%
40%
50%
60%
70%
80%
90%
100%
18-30 31-40 41-50 51-60 61-70 70+
Something else (rent free,boarding house, hostel etc.)
I live with myparents/guardians
I live in a rented home/flat
I live in my own home withouta mortgage/freehold
I live in my own home with amortgage
14%
26%33%
26%
13% 10%
4%
7%
8%17%
37%
62%50%
54%
50% 46%
42%
21%23%
6%2%
1%1%
9% 6% 6% 9% 7% 7%
0%
10%
20%
30%
40%
50%
60%
70%
80%
90%
100%
18-30 31-40 41-50 51-60 61-70 70+
Something else (rent free,boarding house, hostel etc.)
I live with myparents/guardians
I live in a rented home/flat
I live in my own home withouta mortgage/freehold
I live in my own home with amortgage
11%20% 18%
24%16%
21%3%
7% 8%4%
25%
53%
39%
57% 58%62%
51%
26%
42%
11%7%
4%6%
5% 5%9% 7%
2%
0%
10%
20%
30%
40%
50%
60%
70%
80%
90%
100%
18-30 31-40 41-50 51-60 61-70 70+
Something else (rent free,boarding house, hostel etc.)
I live with myparents/guardians
I live in a rented home/flat
I live in my own home withouta mortgage/freehold
I live in my own home with amortgage
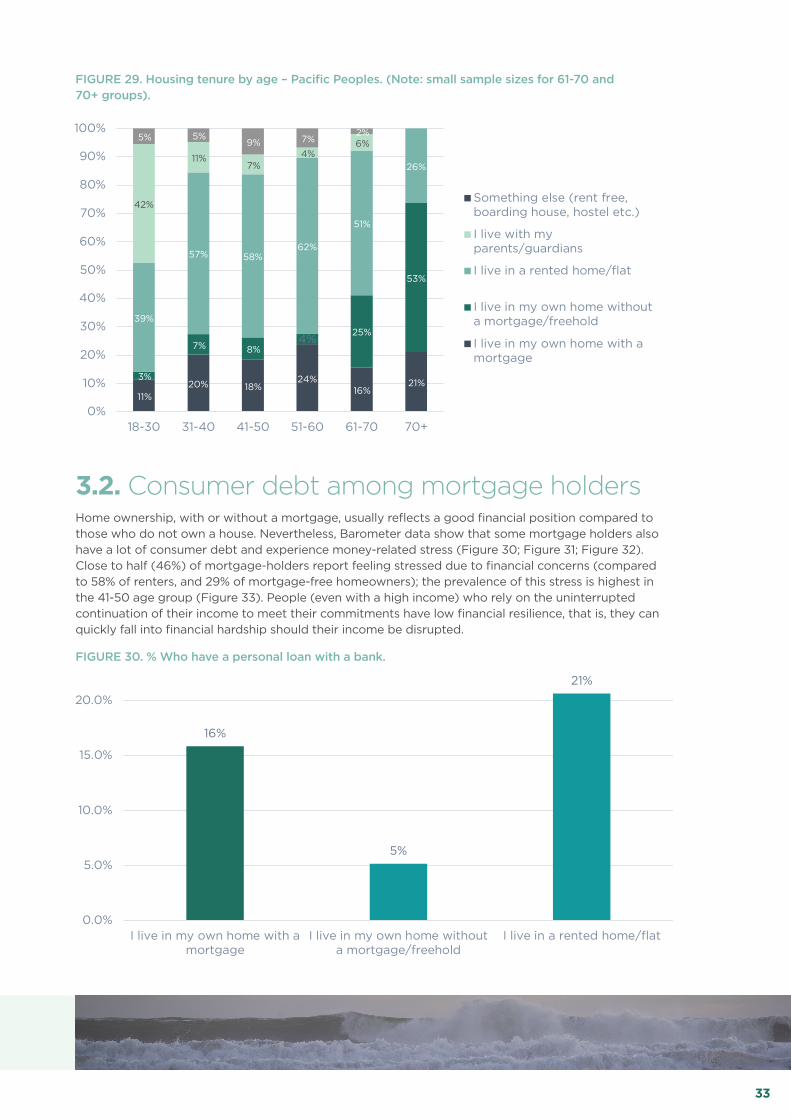
33CFFC Financial Capability Barometer 2018-2019
FIGURE 29. Housing tenure by age – Pacific Peoples. (Note: small sample sizes for 61-70 and 70+ groups).
3.2. Consumer debt among mortgage holdersHome ownership, with or without a mortgage, usually reflects a good financial position compared to those who do not own a house. Nevertheless, Barometer data show that some mortgage holders also have a lot of consumer debt and experience money-related stress (Figure 30; Figure 31; Figure 32). Close to half (46%) of mortgage-holders report feeling stressed due to financial concerns (compared to 58% of renters, and 29% of mortgage-free homeowners); the prevalence of this stress is highest in the 41-50 age group (Figure 33). People (even with a high income) who rely on the uninterrupted continuation of their income to meet their commitments have low financial resilience, that is, they can quickly fall into financial hardship should their income be disrupted.
FIGURE 30. % Who have a personal loan with a bank.
14%
26%33%
26%
13% 10%
4%
7%
8%17%
37%
62%50%
54%
50% 46%
42%
21%23%
6%2%
1%1%
9% 6% 6% 9% 7% 7%
0%
10%
20%
30%
40%
50%
60%
70%
80%
90%
100%
18-30 31-40 41-50 51-60 61-70 70+
Something else (rent free,boarding house, hostel etc.)
I live with myparents/guardians
I live in a rented home/flat
I live in my own home withouta mortgage/freehold
I live in my own home with amortgage
11%20% 18%
24%16%
21%3%
7% 8%4%
25%
53%
39%
57% 58%62%
51%
26%
42%
11%7%
4%6%
5% 5%9% 7%
2%
0%
10%
20%
30%
40%
50%
60%
70%
80%
90%
100%
18-30 31-40 41-50 51-60 61-70 70+
Something else (rent free,boarding house, hostel etc.)
I live with myparents/guardians
I live in a rented home/flat
I live in my own home withouta mortgage/freehold
I live in my own home with amortgage
16%
5%
21%
0.0%
5.0%
10.0%
15.0%
20.0%
25.0%
I live in my own home with amortgage
I live in my own home withouta mortgage/freehold
I live in a rented home/flat

34CFFC Financial Capability Barometer 2018-2019
FIGURE 31. % Who have debt to a credit card or store card where they have not paid off the full balance by the due date
FIGURE 32. % Who have debt to a finance company such as Instant Finance, GE Money, Gem Finance, Cash Converters, etc.
39%
17%
32%
0.0%
5.0%
10.0%
15.0%
20.0%
25.0%
30.0%
35.0%
40.0%
45.0%
I live in my own home with amortgage
I live in my own homewithout a mortgage/freehold
I live in a rented home/flat
22%
7%
27%
0.0%
5.0%
10.0%
15.0%
20.0%
25.0%
30.0%
I live in my own home with amortgage
I live in my own homewithout a mortgage/freehold
I live in a rented home/flat
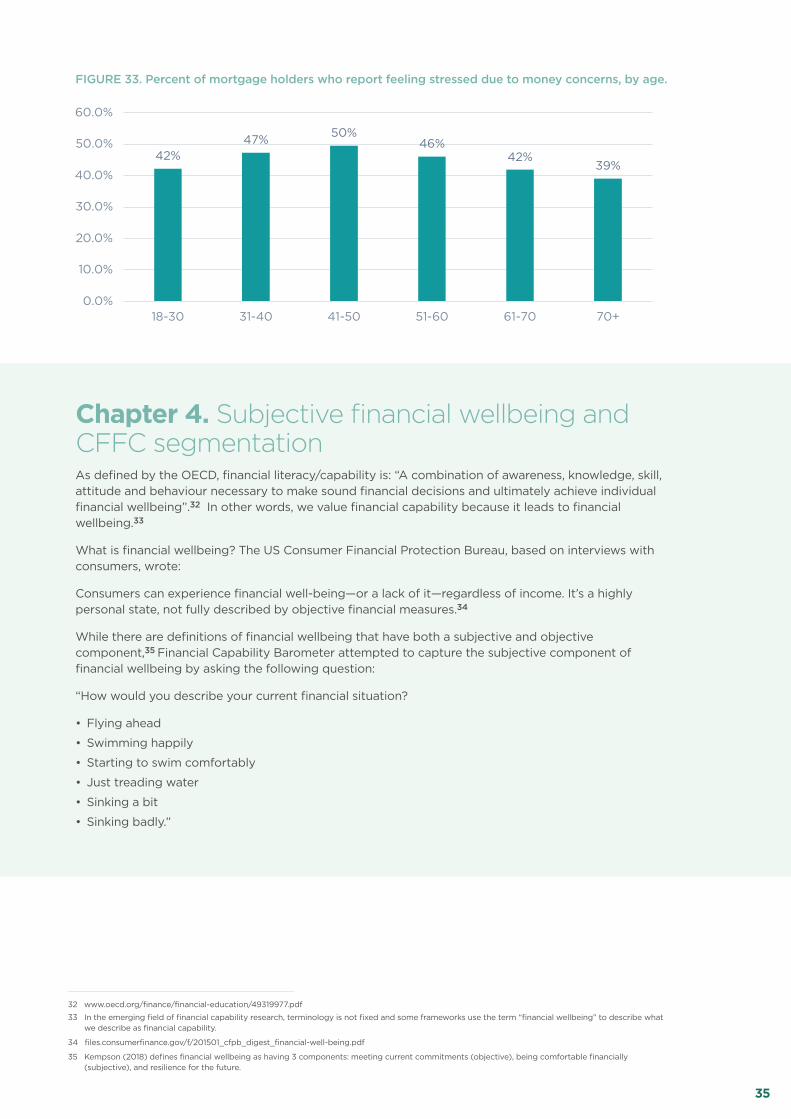
35CFFC Financial Capability Barometer 2018-2019
FIGURE 33. Percent of mortgage holders who report feeling stressed due to money concerns, by age.
Chapter 4. Subjective financial wellbeing and CFFC segmentationAs defined by the OECD, financial literacy/capability is: “A combination of awareness, knowledge, skill, attitude and behaviour necessary to make sound financial decisions and ultimately achieve individual financial wellbeing”.32 In other words, we value financial capability because it leads to financial wellbeing.33
What is financial wellbeing? The US Consumer Financial Protection Bureau, based on interviews with consumers, wrote:
Consumers can experience financial well-being—or a lack of it—regardless of income. It’s a highly personal state, not fully described by objective financial measures.34
While there are definitions of financial wellbeing that have both a subjective and objective component,35 Financial Capability Barometer attempted to capture the subjective component of financial wellbeing by asking the following question:
“How would you describe your current financial situation?
• Flying ahead
• Swimming happily
• Starting to swim comfortably
• Just treading water
• Sinking a bit
• Sinking badly.”
32 www.oecd.org/finance/financial-education/49319977.pdf
33 In the emerging field of financial capability research, terminology is not fixed and some frameworks use the term “financial wellbeing” to describe what we describe as financial capability.
34 files.consumerfinance.gov/f/201501_cfpb_digest_financial-well-being.pdf
35 Kempson (2018) defines financial wellbeing as having 3 components: meeting current commitments (objective), being comfortable financially (subjective), and resilience for the future.
42%47% 50%
46%42%
39%
0.0%
10.0%
20.0%
30.0%
40.0%
50.0%
60.0%
18-30 31-40 41-50 51-60 61-70 70+
% who report feeling stressed due to money concerns by age - live in my own home with a
mortgage
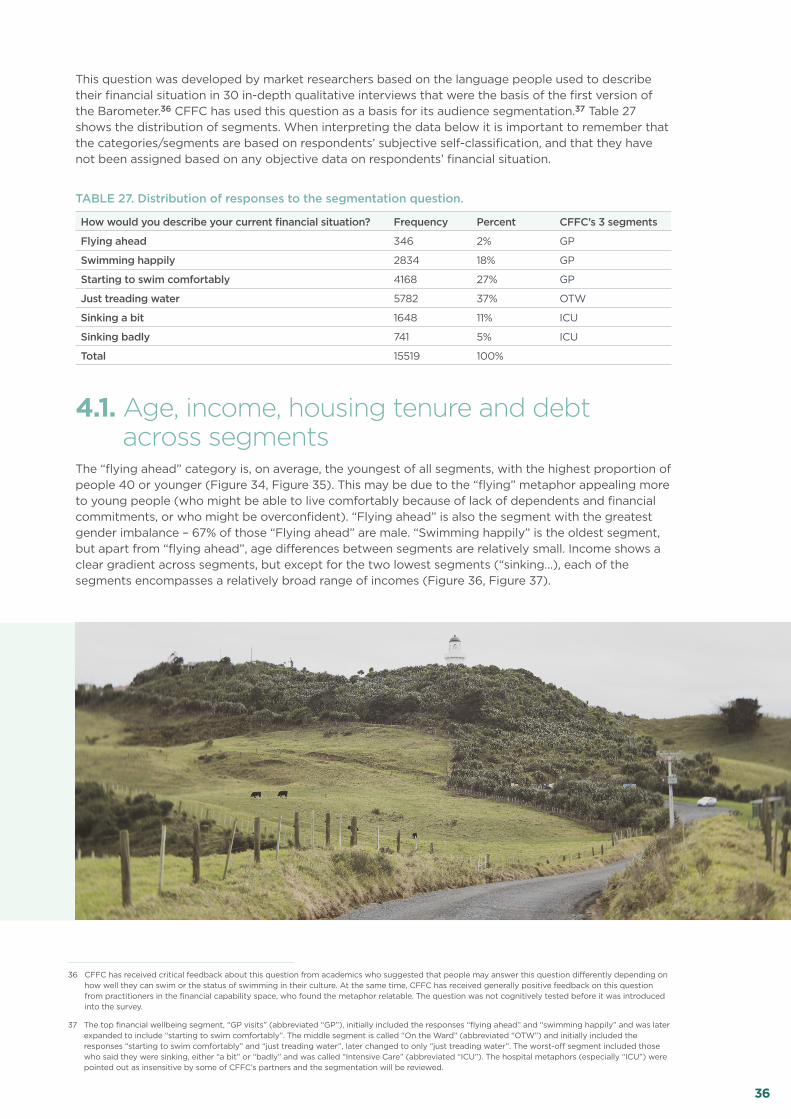
36CFFC Financial Capability Barometer 2018-2019
This question was developed by market researchers based on the language people used to describe their financial situation in 30 in-depth qualitative interviews that were the basis of the first version of the Barometer.36 CFFC has used this question as a basis for its audience segmentation.37 Table 27 shows the distribution of segments. When interpreting the data below it is important to remember that the categories/segments are based on respondents’ subjective self-classification, and that they have not been assigned based on any objective data on respondents’ financial situation.
TABLE 27. Distribution of responses to the segmentation question.
How would you describe your current financial situation? Frequency Percent CFFC’s 3 segments
Flying ahead 346 2% GP
Swimming happily 2834 18% GP
Starting to swim comfortably 4168 27% GP
Just treading water 5782 37% OTW
Sinking a bit 1648 11% ICU
Sinking badly 741 5% ICU
Total 15519 100%
4.1. Age, income, housing tenure and debt across segments
The “flying ahead” category is, on average, the youngest of all segments, with the highest proportion of people 40 or younger (Figure 34, Figure 35). This may be due to the “flying” metaphor appealing more to young people (who might be able to live comfortably because of lack of dependents and financial commitments, or who might be overconfident). “Flying ahead” is also the segment with the greatest gender imbalance – 67% of those “Flying ahead” are male. “Swimming happily” is the oldest segment, but apart from “flying ahead”, age differences between segments are relatively small. Income shows a clear gradient across segments, but except for the two lowest segments (“sinking…), each of the segments encompasses a relatively broad range of incomes (Figure 36, Figure 37).
36 CFFC has received critical feedback about this question from academics who suggested that people may answer this question differently depending on how well they can swim or the status of swimming in their culture. At the same time, CFFC has received generally positive feedback on this question from practitioners in the financial capability space, who found the metaphor relatable. The question was not cognitively tested before it was introduced into the survey.
37 The top financial wellbeing segment, “GP visits” (abbreviated “GP”), initially included the responses “flying ahead” and “swimming happily” and was later expanded to include “starting to swim comfortably”. The middle segment is called “On the Ward” (abbreviated “OTW”) and initially included the responses “starting to swim comfortably” and “just treading water”, later changed to only “just treading water”. The worst-off segment included those who said they were sinking, either “a bit” or “badly” and was called “Intensive Care” (abbreviated “ICU”). The hospital metaphors (especially “ICU”) were pointed out as insensitive by some of CFFC’s partners and the segmentation will be reviewed.

37CFFC Financial Capability Barometer 2018-2019
FIGURE 34. Box plots of age by segment.
FIGURE 35. Age groups by segment.
How would you describe your current financial situation?
Flying ahead
Swimming happily
Starting to
swim
comfortably
Just treading water
Sinking a bit
Sinking badly
Ag
e (y
ears
)
0
10
20
30
40
50
60
70
80
90
100
36%
18% 21% 19%24% 23%
31%
19%22%
20%
21% 22%
13%
15%
22%22%
20% 24%
10%
18%
19%20%
20%23%
6%
17%
11%13%
9%6%
4%13%
5% 7% 6% 2%
0%
10%
20%
30%
40%
50%
60%
70%
80%
90%
100%
Flying ahead Swimminghappily
Starting toswim
comfortably
Justtreading
water
Sinking a bit Sinkingbadly
18-30 31-40 41-50 51-60 61-70 70+
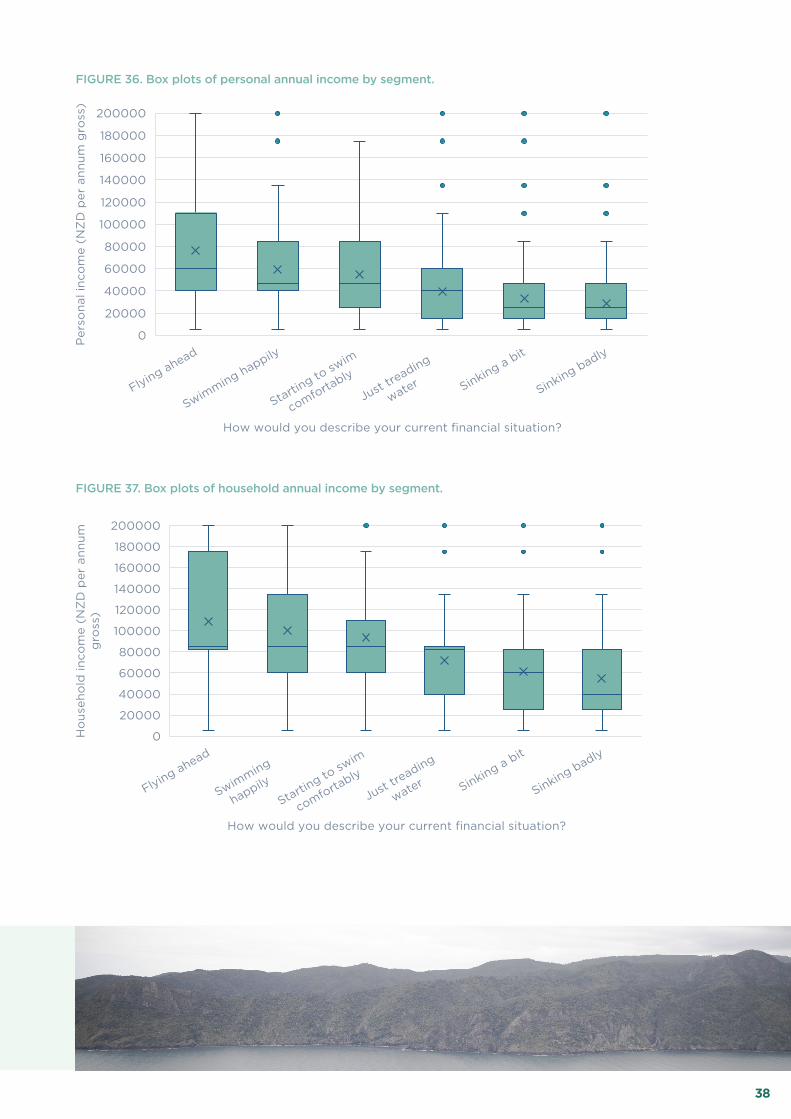
38CFFC Financial Capability Barometer 2018-2019
FIGURE 36. Box plots of personal annual income by segment.
FIGURE 37. Box plots of household annual income by segment.
How would you describe your current financial situation?
Flying ahead
Swimming happily
Starting to
swim
comfortably
Just treading
water Sinking a bit
Sinking badly
Per
son
al in
com
e (N
ZD
per
an
nu
m g
ross
)
0
20000
40000
60000
80000
100000
120000
140000
160000
180000
200000
How would you describe your current financial situation?
Flying ahead
Swimming
happily
Starting to
swim
comfortably
Just treading
water Sinking a bit
Sinking badly
Ho
use
ho
ld in
com
e (N
ZD
per
an
nu
m
gro
ss)
0
20000
40000
60000
80000
100000
120000
140000
160000
180000
200000
How would you describe your current financial situation?
Flying ahead
Swimming happily
Starting to
swim
comfortably
Just treading
water Sinking a bit
Sinking badly
Per
son
al in
com
e (N
ZD
per
an
nu
m g
ross
)
0
20000
40000
60000
80000
100000
120000
140000
160000
180000
200000
How would you describe your current financial situation?
Flying ahead
Swimming
happily
Starting to
swim
comfortably
Just treading
water Sinking a bit
Sinking badly
Ho
use
ho
ld in
com
e (N
ZD
per
an
nu
m
gro
ss)
0
20000
40000
60000
80000
100000
120000
140000
160000
180000
200000
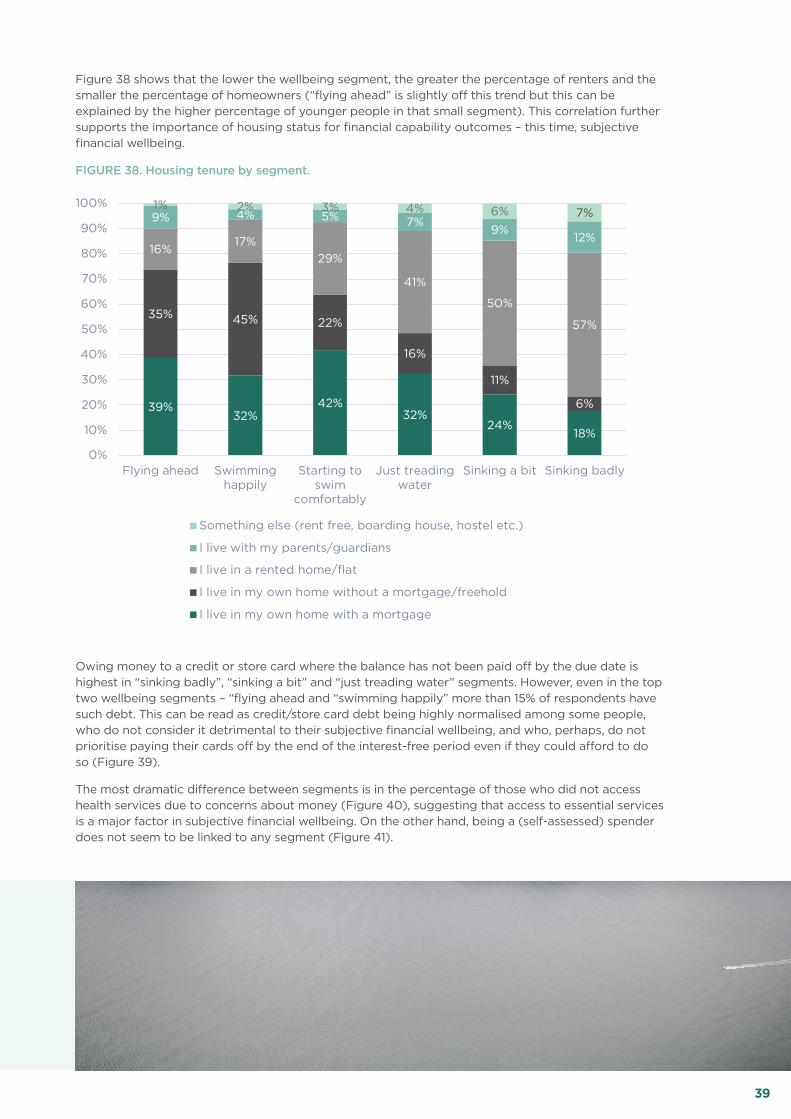
39CFFC Financial Capability Barometer 2018-2019
Figure 38 shows that the lower the wellbeing segment, the greater the percentage of renters and the smaller the percentage of homeowners (“flying ahead” is slightly off this trend but this can be explained by the higher percentage of younger people in that small segment). This correlation further supports the importance of housing status for financial capability outcomes – this time, subjective financial wellbeing.
FIGURE 38. Housing tenure by segment.
Owing money to a credit or store card where the balance has not been paid off by the due date is highest in “sinking badly”, “sinking a bit” and “just treading water” segments. However, even in the top two wellbeing segments – “flying ahead and “swimming happily” more than 15% of respondents have such debt. This can be read as credit/store card debt being highly normalised among some people, who do not consider it detrimental to their subjective financial wellbeing, and who, perhaps, do not prioritise paying their cards off by the end of the interest-free period even if they could afford to do so (Figure 39).
The most dramatic difference between segments is in the percentage of those who did not access health services due to concerns about money (Figure 40), suggesting that access to essential services is a major factor in subjective financial wellbeing. On the other hand, being a (self-assessed) spender does not seem to be linked to any segment (Figure 41).
FIGURE 38. HOUSING TENURE BY SEGMENT.
39%32%
42%32%
24%18%
35% 45% 22%
16%
11%
6%
16%17%
29%
41%
50%
57%
9% 4% 5% 7%9%
12%
1% 2% 3% 4% 6% 7%
0%
10%
20%
30%
40%
50%
60%
70%
80%
90%
100%
Flying ahead Swimminghappily
Starting toswim
comfortably
Just treadingwater
Sinking a bit Sinking badly
Something else (rent free, boarding house, hostel etc.)
I live with my parents/guardians
I live in a rented home/flat
I live in my own home without a mortgage/freehold
I live in my own home with a mortgage

40CFFC Financial Capability Barometer 2018-2019
FIGURE 39. Percent who owe money to a credit card/store card where the balance has not been paid off by the due date, by segment.
16% 17%
28%
35%38% 38%
0.0%
5.0%
10.0%
15.0%
20.0%
25.0%
30.0%
35.0%
40.0%
45.0%
Flying ahead Swimminghappily
Starting toswim
comfortably
Justtreading
water
Sinking a bit Sinkingbadly
10%7%
18%
40%
55%
65%
0.0%
10.0%
20.0%
30.0%
40.0%
50.0%
60.0%
70.0%
Flying ahead Swimminghappily
Starting toswim
comfortably
Just treadingwater
Sinking a bit Sinkingbadly
FIGURE 40. Percent who did not access health services due to concerns about money, by segment.
16% 17%
28%
35%38% 38%
0.0%
5.0%
10.0%
15.0%
20.0%
25.0%
30.0%
35.0%
40.0%
45.0%
Flying ahead Swimminghappily
Starting toswim
comfortably
Justtreading
water
Sinking a bit Sinkingbadly
10%7%
18%
40%
55%
65%
0.0%
10.0%
20.0%
30.0%
40.0%
50.0%
60.0%
70.0%
Flying ahead Swimminghappily
Starting toswim
comfortably
Just treadingwater
Sinking a bit Sinkingbadly
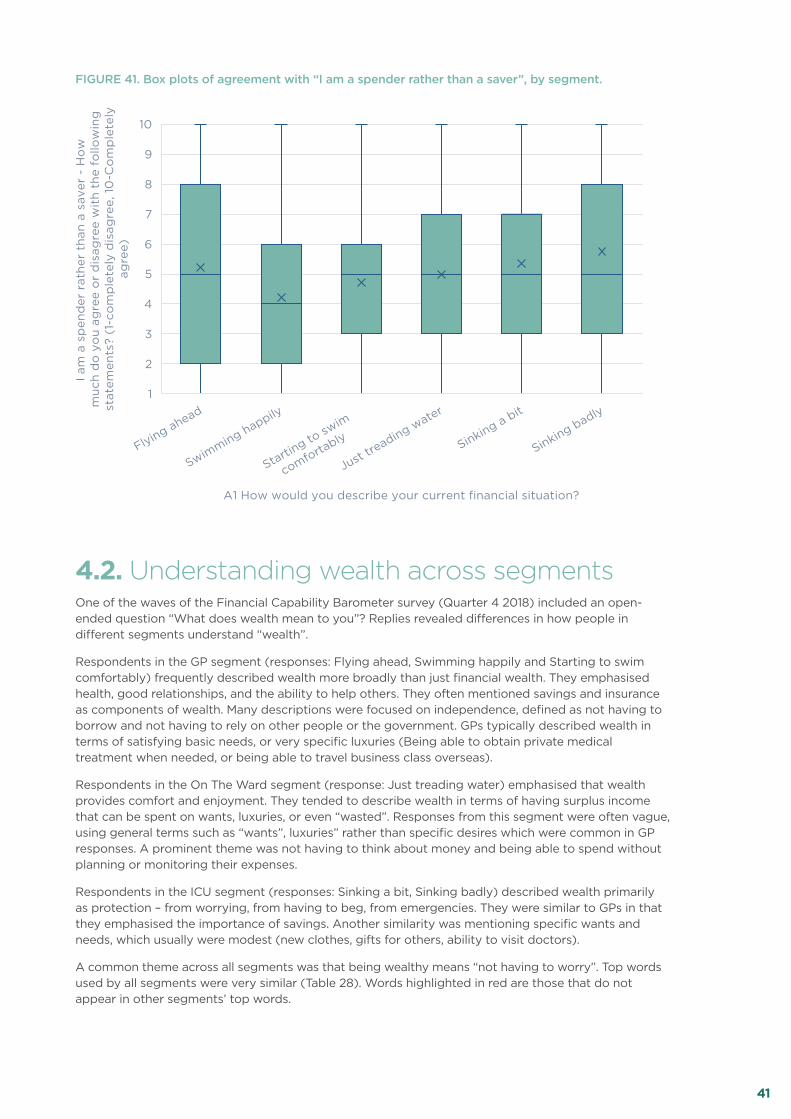
41CFFC Financial Capability Barometer 2018-2019
FIGURE 41. Box plots of agreement with “I am a spender rather than a saver”, by segment.
4.2. Understanding wealth across segmentsOne of the waves of the Financial Capability Barometer survey (Quarter 4 2018) included an open-ended question “What does wealth mean to you”? Replies revealed differences in how people in different segments understand “wealth”.
Respondents in the GP segment (responses: Flying ahead, Swimming happily and Starting to swim comfortably) frequently described wealth more broadly than just financial wealth. They emphasised health, good relationships, and the ability to help others. They often mentioned savings and insurance as components of wealth. Many descriptions were focused on independence, defined as not having to borrow and not having to rely on other people or the government. GPs typically described wealth in terms of satisfying basic needs, or very specific luxuries (Being able to obtain private medical treatment when needed, or being able to travel business class overseas).
Respondents in the On The Ward segment (response: Just treading water) emphasised that wealth provides comfort and enjoyment. They tended to describe wealth in terms of having surplus income that can be spent on wants, luxuries, or even “wasted”. Responses from this segment were often vague, using general terms such as “wants”, luxuries” rather than specific desires which were common in GP responses. A prominent theme was not having to think about money and being able to spend without planning or monitoring their expenses.
Respondents in the ICU segment (responses: Sinking a bit, Sinking badly) described wealth primarily as protection – from worrying, from having to beg, from emergencies. They were similar to GPs in that they emphasised the importance of savings. Another similarity was mentioning specific wants and needs, which usually were modest (new clothes, gifts for others, ability to visit doctors).
A common theme across all segments was that being wealthy means “not having to worry”. Top words used by all segments were very similar (Table 28). Words highlighted in red are those that do not appear in other segments’ top words.
A1 How would you describe your current financial situation?
Flying ahead
Swimming happily
Starting to
swim
comfortably
Just treading water
Sinking a bit
Sinking badly
I am
a s
pen
der
rat
her
th
an a
sav
er -
Ho
w
mu
ch d
o y
ou
ag
ree
or
dis
agre
e w
ith
th
e fo
llow
ing
st
atem
ents
? (1
-co
mp
lete
ly d
isag
ree,
10
-Co
mp
lete
ly
agre
e)
1
2
3
4
5
6
7
8
9
10
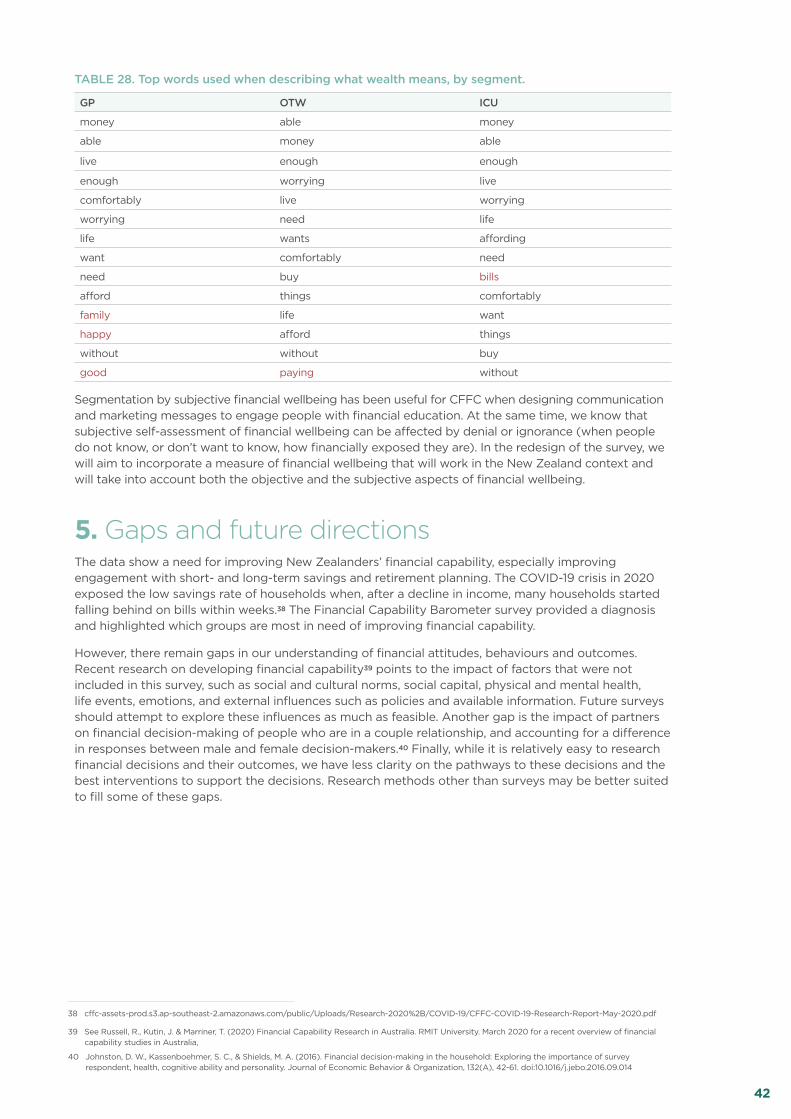
42CFFC Financial Capability Barometer 2018-2019
TABLE 28. Top words used when describing what wealth means, by segment.
GP OTW ICU
money able money
able money able
live enough enough
enough worrying live
comfortably live worrying
worrying need life
life wants affording
want comfortably need
need buy bills
afford things comfortably
family life want
happy afford things
without without buy
good paying without
Segmentation by subjective financial wellbeing has been useful for CFFC when designing communication and marketing messages to engage people with financial education. At the same time, we know that subjective self-assessment of financial wellbeing can be affected by denial or ignorance (when people do not know, or don’t want to know, how financially exposed they are). In the redesign of the survey, we will aim to incorporate a measure of financial wellbeing that will work in the New Zealand context and will take into account both the objective and the subjective aspects of financial wellbeing.
5. Gaps and future directionsThe data show a need for improving New Zealanders’ financial capability, especially improving engagement with short- and long-term savings and retirement planning. The COVID-19 crisis in 2020 exposed the low savings rate of households when, after a decline in income, many households started falling behind on bills within weeks.38 The Financial Capability Barometer survey provided a diagnosis and highlighted which groups are most in need of improving financial capability.
However, there remain gaps in our understanding of financial attitudes, behaviours and outcomes. Recent research on developing financial capability39 points to the impact of factors that were not included in this survey, such as social and cultural norms, social capital, physical and mental health, life events, emotions, and external influences such as policies and available information. Future surveys should attempt to explore these influences as much as feasible. Another gap is the impact of partners on financial decision-making of people who are in a couple relationship, and accounting for a difference in responses between male and female decision-makers.40 Finally, while it is relatively easy to research financial decisions and their outcomes, we have less clarity on the pathways to these decisions and the best interventions to support the decisions. Research methods other than surveys may be better suited to fill some of these gaps.
38 cffc-assets-prod.s3.ap-southeast-2.amazonaws.com/public/Uploads/Research-2020%2B/COVID-19/CFFC-COVID-19-Research-Report-May-2020.pdf
39 See Russell, R., Kutin, J. & Marriner, T. (2020) Financial Capability Research in Australia. RMIT University. March 2020 for a recent overview of financial capability studies in Australia,
40 Johnston, D. W., Kassenboehmer, S. C., & Shields, M. A. (2016). Financial decision-making in the household: Exploring the importance of survey respondent, health, cognitive ability and personality. Journal of Economic Behavior & Organization, 132(A), 42-61. doi:10.1016/j.jebo.2016.09.014
43CFFC Financial Capability Barometer 2018-2019
Appendix 1. MethodologyData was collected through an online survey, using the Dynata/Research Now online panel, with quotas applied to ensure that the composition of the sample with regard to sex, ethnicity, age group, region and income level reflects the composition of adult population of New Zealand as per 2013 Census data.41 Tables in Appendix 3 show the demographic composition of the sample used in this report.
The speed and cost-effectiveness of online panel survey research has made this method increasingly popular, and market research companies commonly refer to samples such as the one described above as “nationally representative”. However, according to statistical theory, such samples cannot be considered representative and margins of error cannot be calculated, because such samples are not randomly selected from the whole population. Online panel participants need to have internet access and be digitally literate enough to join the panel, so some people will be excluded.42 Benchmarking studies have found behavioural and attitudinal differences between survey samples from online panels and samples randomly selected from the whole population (by methods such as random-digit dialling or address-based sampling).43
Despite these limitations, quota-based samples from online panels, when compared to each other and to probabilistic samples, tend to show a broadly similar story and retain the rankings, if not point estimates, of responses.44 When using data from the Financial Capability Barometer it is important to remember that it shows the broad contours of New Zealanders’ financial attitudes, behaviours and beliefs, rather than accurate measurements. The Financial Capability Barometer survey is valuable because the diversity of questions gives an opportunity to explore the relationships between demographic and socioeconomic factors and financial behaviours and attitudes.
41 The latest available at the time when the survey started.
42 For further discussion of online panels in the New Zealand context, see Lara.M.Greaves, An Investigation into the Feasibility of an Online National Probability Panel Study in New Zealand, COMPASS Centre, University of Auckland, 2017, auckland.figshare.com/articles/An_Investigation_into_the_Feasibility_of_an_Online_National_Probability_Panel_Study_in_New_Zealand/5010740/2
43 For example, D.W. Pennay, D. Neiger, P.J. Lavrakas and K. Borg, The Online Panels Benchmarking Study: a Total Survey Error comparison of findings from probability-based surveys and nonprobability online panel surveys in Australia, CSRM & SRC Methods Paper, NO. 2/2018, Social Research Centre, Australian National University, 2018. csrm.cass.anu.edu.au/sites/default/files/docs/2018/12/CSRM_MP2_2018_ONLINE_PANELS.pdf (this study includes the panel used by the Financial Capability Barometer, Research Now)
44 Courtney Kennedy, Andrew Mercer, Scott Keeter, Nick Hatley, Kyley McGeeney, and Alejandra Gimenez, Evaluating Online Nonprobability Surveys , Pew Research Center, 2016. assets.pewresearch.org/wp-content/uploads/sites/12/2016/04/Nonprobability-report-May-2016-FINAL.pdf
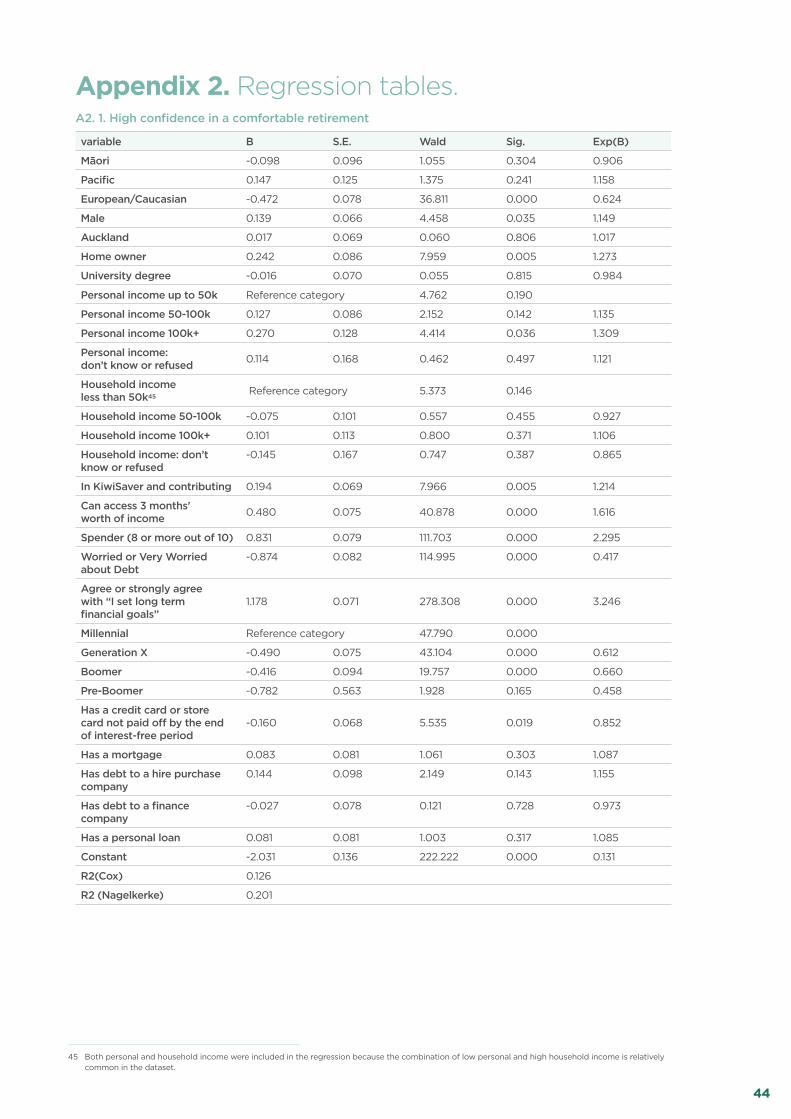
44CFFC Financial Capability Barometer 2018-2019
Appendix 2. Regression tables. A2. 1. High confidence in a comfortable retirement
variable B S.E. Wald Sig. Exp(B)
Māori -0.098 0.096 1.055 0.304 0.906
Pacific 0.147 0.125 1.375 0.241 1.158
European/Caucasian -0.472 0.078 36.811 0.000 0.624
Male 0.139 0.066 4.458 0.035 1.149
Auckland 0.017 0.069 0.060 0.806 1.017
Home owner 0.242 0.086 7.959 0.005 1.273
University degree -0.016 0.070 0.055 0.815 0.984
Personal income up to 50k Reference category 4.762 0.190
Personal income 50-100k 0.127 0.086 2.152 0.142 1.135
Personal income 100k+ 0.270 0.128 4.414 0.036 1.309
Personal income: don’t know or refused 0.114 0.168 0.462 0.497 1.121
Household income less than 50k45 Reference category 5.373 0.146
Household income 50-100k -0.075 0.101 0.557 0.455 0.927
Household income 100k+ 0.101 0.113 0.800 0.371 1.106
Household income: don’t know or refused
-0.145 0.167 0.747 0.387 0.865
In KiwiSaver and contributing 0.194 0.069 7.966 0.005 1.214
Can access 3 months’ worth of income 0.480 0.075 40.878 0.000 1.616
Spender (8 or more out of 10) 0.831 0.079 111.703 0.000 2.295
Worried or Very Worried about Debt
-0.874 0.082 114.995 0.000 0.417
Agree or strongly agree with “I set long term financial goals”
1.178 0.071 278.308 0.000 3.246
Millennial Reference category 47.790 0.000
Generation X -0.490 0.075 43.104 0.000 0.612
Boomer -0.416 0.094 19.757 0.000 0.660
Pre-Boomer -0.782 0.563 1.928 0.165 0.458
Has a credit card or store card not paid off by the end of interest-free period
-0.160 0.068 5.535 0.019 0.852
Has a mortgage 0.083 0.081 1.061 0.303 1.087
Has debt to a hire purchase company
0.144 0.098 2.149 0.143 1.155
Has debt to a finance company
-0.027 0.078 0.121 0.728 0.973
Has a personal loan 0.081 0.081 1.003 0.317 1.085
Constant -2.031 0.136 222.222 0.000 0.131
R2(Cox) 0.126
R2 (Nagelkerke) 0.201
45 Both personal and household income were included in the regression because the combination of low personal and high household income is relatively common in the dataset.
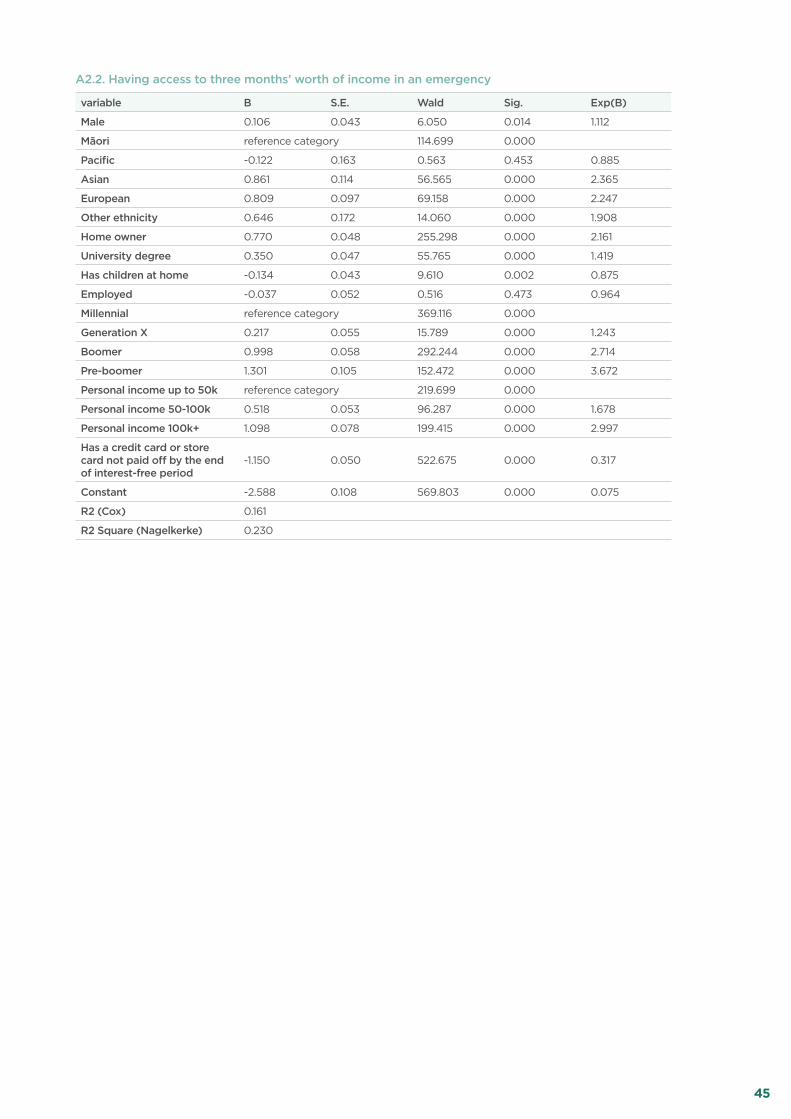
45CFFC Financial Capability Barometer 2018-2019
A2.2. Having access to three months’ worth of income in an emergency
variable B S.E. Wald Sig. Exp(B)
Male 0.106 0.043 6.050 0.014 1.112
Māori reference category 114.699 0.000
Pacific -0.122 0.163 0.563 0.453 0.885
Asian 0.861 0.114 56.565 0.000 2.365
European 0.809 0.097 69.158 0.000 2.247
Other ethnicity 0.646 0.172 14.060 0.000 1.908
Home owner 0.770 0.048 255.298 0.000 2.161
University degree 0.350 0.047 55.765 0.000 1.419
Has children at home -0.134 0.043 9.610 0.002 0.875
Employed -0.037 0.052 0.516 0.473 0.964
Millennial reference category 369.116 0.000
Generation X 0.217 0.055 15.789 0.000 1.243
Boomer 0.998 0.058 292.244 0.000 2.714
Pre-boomer 1.301 0.105 152.472 0.000 3.672
Personal income up to 50k reference category 219.699 0.000
Personal income 50-100k 0.518 0.053 96.287 0.000 1.678
Personal income 100k+ 1.098 0.078 199.415 0.000 2.997
Has a credit card or store card not paid off by the end of interest-free period
-1.150 0.050 522.675 0.000 0.317
Constant -2.588 0.108 569.803 0.000 0.075
R2 (Cox) 0.161
R2 Square (Nagelkerke) 0.230
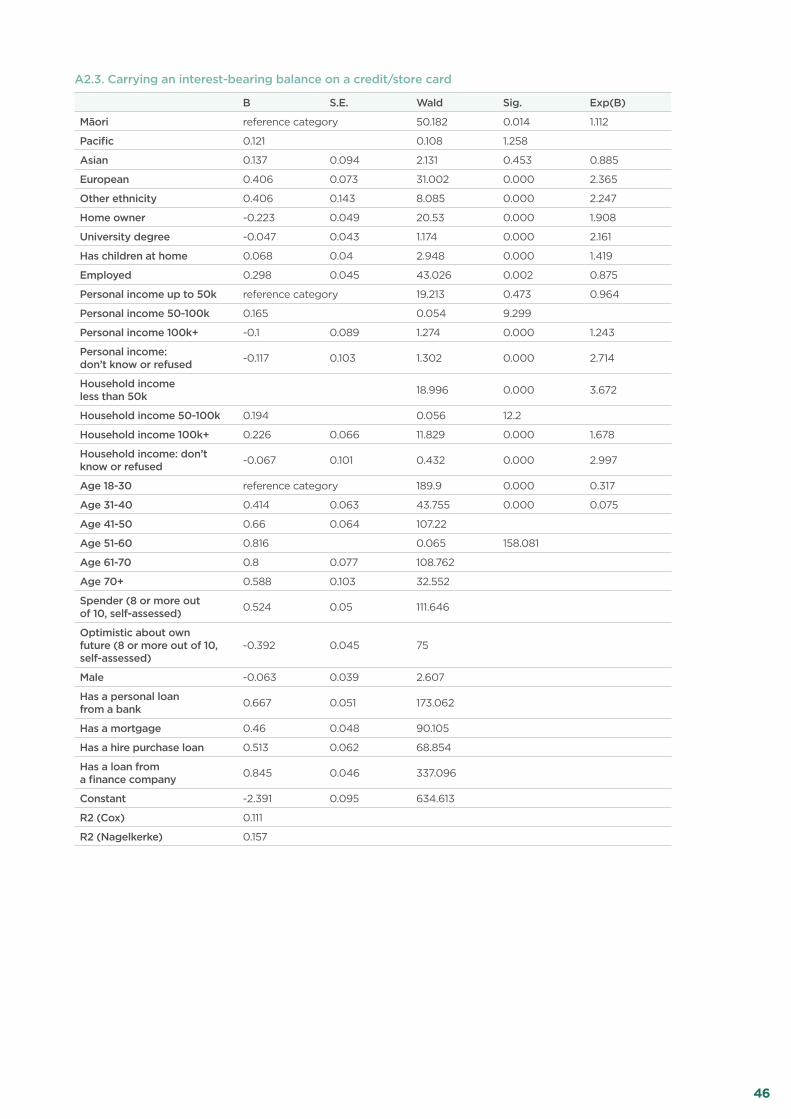
46CFFC Financial Capability Barometer 2018-2019
A2.3. Carrying an interest-bearing balance on a credit/store card
B S.E. Wald Sig. Exp(B)
Māori reference category 50.182 0.014 1.112
Pacific 0.121 0.108 1.258
Asian 0.137 0.094 2.131 0.453 0.885
European 0.406 0.073 31.002 0.000 2.365
Other ethnicity 0.406 0.143 8.085 0.000 2.247
Home owner -0.223 0.049 20.53 0.000 1.908
University degree -0.047 0.043 1.174 0.000 2.161
Has children at home 0.068 0.04 2.948 0.000 1.419
Employed 0.298 0.045 43.026 0.002 0.875
Personal income up to 50k reference category 19.213 0.473 0.964
Personal income 50-100k 0.165 0.054 9.299
Personal income 100k+ -0.1 0.089 1.274 0.000 1.243
Personal income: don’t know or refused -0.117 0.103 1.302 0.000 2.714
Household income less than 50k 18.996 0.000 3.672
Household income 50-100k 0.194 0.056 12.2
Household income 100k+ 0.226 0.066 11.829 0.000 1.678
Household income: don’t know or refused -0.067 0.101 0.432 0.000 2.997
Age 18-30 reference category 189.9 0.000 0.317
Age 31-40 0.414 0.063 43.755 0.000 0.075
Age 41-50 0.66 0.064 107.22
Age 51-60 0.816 0.065 158.081
Age 61-70 0.8 0.077 108.762
Age 70+ 0.588 0.103 32.552
Spender (8 or more out of 10, self-assessed) 0.524 0.05 111.646
Optimistic about own future (8 or more out of 10, self-assessed)
-0.392 0.045 75
Male -0.063 0.039 2.607
Has a personal loan from a bank 0.667 0.051 173.062
Has a mortgage 0.46 0.048 90.105
Has a hire purchase loan 0.513 0.062 68.854
Has a loan from a finance company 0.845 0.046 337.096
Constant -2.391 0.095 634.613
R2 (Cox) 0.111
R2 (Nagelkerke) 0.157

47CFFC Financial Capability Barometer 2018-2019
Appendix 3. Demographic composition of the sample.
Age N Percent
18 to 34 years 4236 27%
35 to 54 years 6451 42%
55 to 64 years 2875 19%
65 + years 1957 13%
Total 15519 100%
Sex N Percent
Male 7373 48%
Female 8146 52%
Total 15519 100%
Ethnicity (respondents could select more than one ethnicity, so responses add to more than 100%)
N Percent
Māori 2370 15%
Pacific Peoples 1021 7%
Other Asian46 530 3%
European 11291 73%
Chinese 726 5%
Indian 709 5%
Other 355 2%
Total 15519 >100%
Region N Percent
Auckland 5085 33%
Porirua/ Hutt Valley/ Wellington 1761 11%
Christchurch 1870 12%
Other North Island 5004 32%
Other South Island 1799 12%
Total 15519 100%
46 The “Asian” category in the report aggregates responses from “Other Asian”, “Chinese” and “Indian”.
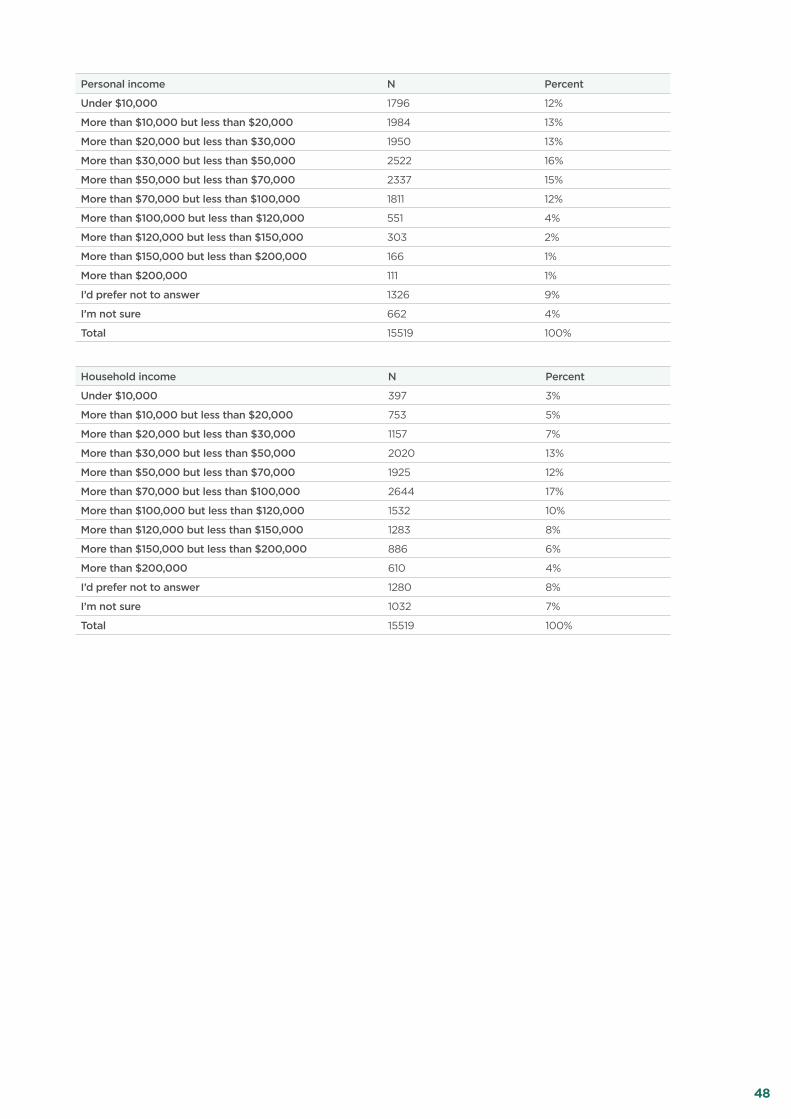
48CFFC Financial Capability Barometer 2018-2019
Personal income N Percent
Under $10,000 1796 12%
More than $10,000 but less than $20,000 1984 13%
More than $20,000 but less than $30,000 1950 13%
More than $30,000 but less than $50,000 2522 16%
More than $50,000 but less than $70,000 2337 15%
More than $70,000 but less than $100,000 1811 12%
More than $100,000 but less than $120,000 551 4%
More than $120,000 but less than $150,000 303 2%
More than $150,000 but less than $200,000 166 1%
More than $200,000 111 1%
I’d prefer not to answer 1326 9%
I’m not sure 662 4%
Total 15519 100%
Household income N Percent
Under $10,000 397 3%
More than $10,000 but less than $20,000 753 5%
More than $20,000 but less than $30,000 1157 7%
More than $30,000 but less than $50,000 2020 13%
More than $50,000 but less than $70,000 1925 12%
More than $70,000 but less than $100,000 2644 17%
More than $100,000 but less than $120,000 1532 10%
More than $120,000 but less than $150,000 1283 8%
More than $150,000 but less than $200,000 886 6%
More than $200,000 610 4%
I’d prefer not to answer 1280 8%
I’m not sure 1032 7%
Total 15519 100%

Quay Building, Level 3, 106–108 Quay St, Auckland Central 1010 PO Box 106-056, Auckland City 1143
Office phone: +64 9 356 0052 | Office email: [email protected]
cffc.govt.nz | sorted.org.nz