financial-economic analysis of current best...
TRANSCRIPT
Financial-economic analysis of current best management practices for sugarcane, horticulture, grazing and forestry industries
in the Tully-Murray catchment
P. C. Roebeling1, A. J. Webster2, J. Biggs3 and P. Thorburn3
CSIRO Sustainable Ecosystems 1 Davies Laboratory, Private Mail Bag, PO Aitkenvale, QLD 4814
2 Tropical Forest Research Centre, PO Box 780, Atherton, QLD 4883 3 Queensland Biosciences Precinct, 306 Carmody Road, St. Lucia, QLD 4068
Supported by the Australian Government’s Marine and Tropical Sciences Research Facility
Project 3.7.5 Socio-economic constraints to and incentives for the adoption of land use and management options for water quality
© CSIRO Sustainable Ecosystems CSIRO Sustainable Ecosystems advises that the information contained in this document comprises general statements based on scientific research. The reader is advised that such information may be incomplete or not appropriate for application to any specific situation. No reliance or actions must therefore be made on the basis of the information contained in this report without seeking prior expert advice. To the extent permitted by law, CSIRO Sustainable Ecosystems (including its employees and consultants) excludes all liability to any person for any consequences, including but not limited to all losses, damages, costs, expenses and any other compensation, arising directly or indirectly from using this publication (in part or in whole) and any information or material contained in it. This report should be cited as: Roebeling, P. C., Webster, A. J., Biggs, J. and Thorburn, P. (2007) Financial-economic analysis of current best management practices for sugarcane, horticulture, grazing and forestry industries in the Tully-Murray catchment. Report to the Marine and Tropical Sciences Research Facility. Reef and Rainforest Research Centre, Cairns (59pp.). Made available online by the Reef and Rainforest Research Centre for the Australian Government’s Marine and Tropical Sciences Research Facility. The Marine and Tropical Sciences Research Facility (MTSRF) is part of the Australian Government’s Commonwealth Environment Research Facilities programme. The MTSRF is represented in North Queensland by the Reef and Rainforest Research Centre Limited (RRRC). The aim of the MTSRF is to ensure the health of North Queensland’s public environmental assets – particularly the Great Barrier Reef and its catchments, tropical rainforests including the Wet Tropics World Heritage Area, and the Torres Strait – through the generation and transfer of world class research and knowledge sharing. This publication is copyright. The Copyright Act 1968 permits fair dealing for study, research, information or educational purposes subject to inclusion of a sufficient acknowledgement of the source. The views and opinions expressed in this publication are those of the authors and do not necessarily reflect those of the Australian Government or the Minister for the Environment and Water Resources. While reasonable effort has been made to ensure that the contents of this publication are factually correct, the Commonwealth does not accept responsibility for the accuracy or completeness of the contents, and shall not be liable for any loss or damage that may be occasioned directly or indirectly through the use of, or reliance on, the contents of this publication. This report is available for download from the Reef and Rainforest Research Centre Limited website: http://www.rrrc.org.au/mtsrf/theme_3/project_3_7_5.html June 2007

Financial-economic analysis of current best management practices: Tully-Murray catchment
i
Contents Acknowledgements .................................................................................................................. ii Executive Summary ................................................................................................................ iii 1. Introduction .....................................................................................................................1 2. Approach to financial-economic analysis of industry current best
management practices ...................................................................................................3 2.1 Production system simulation models ........................................................................3 2.1.1 Sugarcane crop growth model – APSIM.............................................................3 2.1.2 Horticulture crop growth model – LUCTOR ........................................................5 2.1.3 Grazing production model – PASTOR................................................................6 2.1.4 Forestry crop growth model – LUCTOR .............................................................7 2.2 Water quality model – SedNet / ANNEX ....................................................................8 2.2.1 Fine suspended sediment delivery .....................................................................8 2.2.2 Dissolved inorganic nitrogen delivery .................................................................9 2.2.3 Herbicide delivery .............................................................................................10 2.3 Cost benefit analysis ................................................................................................10
3. Financial-economic analysis of industry current best management practices ......12 3.1 Sugarcane ................................................................................................................12 3.2 Horticulture ...............................................................................................................18 3.3 Grazing.....................................................................................................................22 3.4 Forestry ....................................................................................................................26
4. Climate change and population growth ......................................................................28 4.1 Climate change ........................................................................................................28 4.2 Population growth.....................................................................................................31
5. Discussion and conclusions........................................................................................33 6. References .....................................................................................................................36 Appendix 1 .............................................................................................................................41
Welfare gains from urbanising landscapes in Great Barrier Reef Catchments? A spatial environmental-economic modelling approach..................................................41

Roebeling et al.
ii
Acknowledgements This study was funded through the Marine Tropical Sciences Research Facility (MTSRF) and the Far North Queensland Natural Resource Management Board (FNQ NRM Ltd), which is currently co-ordinating the development of a Water Quality Improvement Plan (WQIP) for the Tully-Murray catchment. We thank all industry representatives and experts from CSIRO, ACTFR, QDNR&W, QDPI&F, CaneGrowers, GrowCom and ITC for their valuable contribution to this report. Also, we would like to thank the Cardwell Shire Floodplain Program (CSFP) and the Production Action Team (PAT) for their continuous support and feedback.

Financial-economic analysis of current best management practices: Tully-Murray catchment
iii
Executive Summary This report has been prepared for the Cardwell Shire Floodplain Program, coordinated by the Far North Queensland Natural Resource Management Board (FNQ NRM Ltd) under Task 3.3b,c,d and Task 2.15 of the Water Quality Improvement Program (WQIP) for the Tully-Murray catchment. This study analyses the cost-effectiveness of most promising best-management-practices (BMPs) for water quality improvement in sugarcane, horticulture, grazing and forestry production in the Tully-Murray catchment. More specifically, the objectives of this study are to: • Determine the (plot level) financial-economic consequences of BMP implementation in
sugarcane, horticulture, grazing and forestry production; • Determine the effectiveness of these BMPs in reducing fine suspended sediment,
dissolved inorganic nitrogen and persistent herbicide delivery; and • Assess the impact of climate change and population growth on BMP cost-effectiveness
and attainment of water quality targets We therefore apply and extend the approach developed by Roebeling et al. (2005), which uses production system simulation models (APSIM, LUCTOR and PASTOR) and a hydrological model (SedNet/ANNEX) in combination with sound cost-benefit analysis, while the impact of population growth on attainment of water quality targets is assessed using a classic urban economic model with environmental amenities (see Roebeling et al. 2007). Scenarios for BMPs are based on the compilation of practices identified in Task 3.3(a) (see Roebeling and Webster, 2007), and include tillage management, fallow management, nitrogen application rate, nitrogen application method and herbicide application rate in the case of sugarcane production; inter-row management and fertiliser application rate in the case of (banana) horticulture production; stocking rate and nitrogen application rate in the case of grazing production; and finally inter-row management in the case of forestry production.
Production system Management practice Gross
margin FSS
delivery DIN
delivery HER
delivery
Sugarcane Tillage management Fallow management Nitrogen application rate ~ requirements Nitrogen application method Herbicide application rate
(+) + +
(0) (–)
++ 0
(0) 0 0
0 –
++ (+) 0
0 0 0 0
++
Horticulture Interrow management Fertiliser application rate ~ requirements
(–) –
++ (0)
0 +
0 0
Grazing Stocking rate ~ carrying capacity Nitrogen application rate ~ requirements
+ +
(+) (0)
(0) (+)
0 0
Forestry Interrow management (–) (+) 0 0

Roebeling et al.
iv
• In sugarcane production, moving towards a zero tillage system as well as moving towards a legume (rather than a bare) fallow are attractive from a financial-economic perspective, while only zero tillage leads to a reduction in water pollutant (fine suspended sediment – FSS) delivery. Matching nitrogen application rates to crop requirements is attractive from a financial-economic as well as a water pollutant (dissolved inorganic nitrogen – DIN) delivery perspective, while split (rather than single) application of nitrogen leads to minor changes in profitability and water pollutant delivery. Reduced herbicide application comes at a small cost while leading to a considerable reduction water pollutant (persistent herbicide – HER) delivery.
• In (banana) horticulture production, maintenance of grassed (rather than bare) interrows leads to a small reduction in profitability though does lead to a considerable reduction in water pollutant (FSS) delivery. Matching fertiliser application rates to crop requirements rates lead to a decrease in water pollutant (DIN) delivery and gross margins, unless efficiency gains can be made through re-composition of fertiliser application ratios.
• In grazing production, matching stocking rates to pasture carrying capacity leads to a small reduction in water pollutant (FSS) delivery as well as an increase in profitability. Matching nitrogen application rates to pasture requirements is attractive from a financial-economic perspective and leads to small reductions in water pollutant (DIN) delivery.
• In (hard timber) forestry production, maintenance of grassed (rather than bare) interrows leads to a small reduction in water pollutant (FSS) delivery and profitability.
Consequently, options for cost-effective water quality improvement are largest in sugarcane production (tillage management, nitrogen application rate and herbicide application rate) and (banana) horticulture production (interrow management in (banana), while options for cost-effective water quality improvement in grazing and forestry production are limited. Climate change and population growth are shown to potentially impact on the attainment of water quality targets. While climate change does not seem to affect, for an example of the sugarcane industry, BMP cost-effectiveness, it may lead to a significant increase in levels of water pollutant (DIN) delivery under some climate change projections for 2070. In case water pollution from residential land uses exceeds water pollution from the land uses it replaces, it can be expected that water pollution increases with population size and that the potential for water quality improvement through BMP adoption in agriculture is reduced due to population growth. A number of caveats to this study must be mentioned. First, this BMP cost-effectiveness assessment is a plot-level study and, consequently, does not include costs associated with BMP implementation at the farm and community level. Second, not all of the used production system simulation models are equally suited for BMP cost-effectiveness assessment – APSIM resulted to be best suited as it contains the most sophisticated routines for the calculation of C-factors and DIN concentrations while it also allows for the assessment of the largest range of current and future BMPs. Third, persistent herbicide (HER) delivery calculations are fairly simplistic as there is no hydrological model available that accurately describes the relationship between plot level persistent herbicide concentrations and persistent herbicide delivery. Finally, it must be noted that the figures in this document are generated for the Tully-Murray catchment and, consequently, care should be taken when transferring these figures to other catchments.

Financial-economic analysis of current best management practices: Tully-Murray catchment
1
1. Introduction The development of a water quality improvement plan for the Tully-Murray catchment, which is co-ordinated by the Far North Queensland Natural Resource Management board (FNQ-NRM Ltd), requires the integration of results from Tasks outlined in the Water Quality Improvement Program (WQIP) for the Tully-Murray catchment. The overall objective of this particular project is to assess and identify landscape management (i.e. the way in which land is used and managed) and arrangement (i.e. the spatial distribution of land use and management) options and pathways for water quality improvement in the Tully-Murray catchment. To this end, the following tasks described in the Water Quality Improvement Program (WQIP) for the Tully-Murray catchment will be developed simultaneously: • Task 2.8: Identify the specific locations where investment in improved riparian, wetland
and instream conditions may deliver cost-effective reductions in pollutants. • Task 2.12: Estimate WQIP targets for suspended sediments, nitrogen, phosphorus and
pesticides to the receiving water body, to be applied during the period of this WQIP for the purpose of achieving the water quality objectives and total maximum load objectives.
• Task 2.15: Describe how the impacts of future growth and climate change will be accounted for in proposed management measures and control actions, and attainment and maintenance of the total maximum pollutant load for key pollutants to the receiving water body.
• Tasks 3.3a,b,c,d: Review of strengths and weaknesses of best-management-practices in Wet Tropics catchments, in particular as related to water quality improvement.
• Task 3.5: Evaluate incentives for uptake and long-term implementation of BMPs. This report focuses on Task 3.3b,c,d and Task 2.15, analysing the cost-effectiveness of most promising best-management-practices (BMPs) for water quality improvement in sugarcane, horticulture, grazing and forestry production in the Tully-Murray catchment (as identified in Task 3.3a – see Roebeling and Webster, 2007) and assessing the impact of climate change and population growth on BMP cost-effectiveness and attainment of water quality targets. We determine the plot level financial-economic consequences of BMP implementation in sugarcane, horticulture, grazing and forestry production, as well as the effectiveness of these BMPs in reducing fine suspended sediment (FSS), dissolved inorganic nitrogen (DIN) and persistent herbicide (HER) delivery – which are considered the most important water pollutants in the Tully-Murray catchment (Mitchell et al. 2007). We therefore apply and extend the approach developed by Roebeling et al. (2005) that uses production system simulation models (APSIM, LUCTOR and PASTOR) and a hydrological model (SedNet/ANNEX) in combination with sound cost-benefit analysis. The impact of climate change on BMP cost-effectiveness and attainment of water quality targets is assessed using the above mentioned approach in combination with climate change projections for 2030 and 2070 (see for example Park et al. 2007), while the impact of population growth on attainment of water quality targets is assessed using a classic urban economic model with environmental amenities (see Roebeling et al. 2007). The structure of this report is as follows. Chapter 2 describes the methodology applied in this study, which links production system simulation models, water quality models and costs-benefit analysis to assess the plot level financial-economic cost-effectiveness of management practices in sugarcane, horticulture, grazing and forestry production. In Chapter 3 results are presented and analysed for the identified management practices, thereby looking at annuity gross margins and average annual water pollutant deliveries. In Chapter 4

Roebeling et al.
2
the potential impacts of climate change and population growth on the effectiveness of BMPs for water quality improvement are discussed. Finally, Chapter 5 summarises key results and offers concluding remarks and observations.

Financial-economic analysis of current best management practices: Tully-Murray catchment
3
2. Approach to financial-economic analysis of industry current best management practices
Agricultural production systems can be implemented using a wide variety of management practices (MPs), i.e. ways in which soils are prepared, crops are treated and cattle are managed. To analyse the cost-effectiveness of these MPs for water quality improvement, we apply an approach that uses production system simulation models (APSIM, LUCTOR and PASTOR) and an hydrological model (SedNet/ANNEX) in combination with sound cost-benefit analysis (see Roebeling et al. 2005). The effects of different management practices on sugarcane, horticulture, grazing and forestry production at the plot level, are estimated using production system simulation models (Keating et al. 2003; Hengsdijk et al. 2000; Bouman et al. 1998; see Section 2.1). In turn, the contribution of these management practices to fine suspended sediment (FSS) and dissolved inorganic nitrogen (DIN) delivery is estimated using the water quality model SedNet/ANNEX (Bartley et al. 2004; Hateley et al. 2006; see Section 2.2), while persistent herbicide (HER) is estimated by assigning a fixed delivery coefficient to Diuron application based on literature and expert knowledge. Finally, the financial-economic implications of management practice implementation are determined using standard cost-benefit analysis (Zerbe and Dively, 1994; see Section 2.3).
2.1 Production system simulation models 2.1.1 Sugarcane crop growth model – APSIM
Sugarcane input-output data for different management practices (MPs) are generated using the APSIM crop growth model (see for example Robertson et al. 1995; Keating et al. 1999, 2003). The APSIM sugar module simulates, for a uniform block of cane, per hectare long term dry cane and sucrose weight, ground cover, soil water balance and nitrogen uptake and partitioning to leaf and cane stem. Model simulation results are determined by soil factors such as depth, water holding capacity and nitrogen availability, management factors such as planting date, harvesting date, crop residue management and fertiliser use, genetic factors such as sugarcane variety, and climatic factors like rainfall, radiation and temperature. For the analysis of sugarcane BMPs in the Tully-Murray catchment, we identify the following soil, management, genetic and environmental factors: • One set of soil factors is considered, thereby differentiating between four soil classes.
The soil classification is based on the soils and land use suitability study of Murtha and Smith (1994). Soil classes include well drained sandy loam soils from granite origin (S1), well drained medium to heavy clay soils from alluvial origin (S2), slowly drained gradational or duplex textured (S3), and poorly drained loam soils from alluvial origin (S4).
• Seven sets of management factors are considered, including three tillage management practices, two fallow management practices, six nitrogen application rates, two nitrogen application methods, two herbicide application rates, one headland type, one trash management practice and one harvest strategy. Tillage management practice has been identified as an important management factor by industry and experts in the Tully-Murray catchment (Roebeling and Webster, 2007), determining ground cover and, thus, erosion and sediment delivery from sugarcane systems. Tillage levels are defined for actual (TL1), minimum (TL2) and zero (TL3) tillage. Actual tillage refers to double rotary hoeing and disking-rolling, and single ripping, cross ripping and disking. Minimum tillage refers to single rotary hoeing, disking and
Roebeling et al.
4
disking-rolling. Zero tillage refers to spraying (instead of plowing) out the sugarcane by applying glyphosphate. Fallow management practice is another management factor considered important by industry and experts in the Tully-Murray catchment (Roebeling and Webster, 2007), determining ground cover and nutrient availability and, thus, sediment and nutrient delivery from sugarcane systems. Fallow management practices are defined for bare (F1) and legume (F2) fallow. Bare fallow implies that the field is left idle after the fourth ratoon harvest until sugarcane is planted in the second week of June the following year and harvested as of the year after that. Legume fallow implies that the field is planted with a legume crop in December after the fourth ratoon harvest before sugarcane is planted in the second week of June the following year (legume sprayed out second week of May and ploughing starts the first week of June) and harvested as of the year after that. Nitrogen (N) application rate has also been identified as an important management factor in the Tully-Murray catchment (Roebeling and Webster, 2007), determining inorganic nitrogen addition and, thus, inorganic nutrient delivery from sugarcane systems. Defined N-application rates range from below recommended N-application rates (N060 = 60 kg/ha) to frequently observed and perceived high N-application rates (N210 = 210 kg/ha), in five steps of 30 kg N/ha, as well as the nitrogen replacement strategy (NREPL) which aims at a fertiliser application rate matching nitrogen removed or lost from the soil during a crop (Thorburn et al. 2007). A differentiation is made by fallow strategy, to distinguish between N-application rates in the plant crop stage.1 Nitrogen (N) application method is, potentially, an important management practice to reduce nutrient delivery from sugarcane systems (Chapman, 1994). Defined N-application methods include single (NA1) and split (NA2) application of nitrogen. Herbicide application rate is considered an important management practice determining chemical delivery from sugarcane systems. Defined herbicide application rates include current (H1) and reduced (H2) herbicide application rates. In the reduced herbicide application option (H2), persistent herbicides like Diuron are only applied on the plant row and non-persistent herbicides like Round-up in the interrow using a hooded sprayer (common in the Douglas Shire area). Alternatively, a knock-down herbicide is used on the plant row and Diuron is used on the interrow using a hooded sprayer (more common in the Cardwell Shire). In both cases, persistent herbicide use is halved using a hooded sprayer, while assuming no yield impacts. Headland type refers to the establishment of bare or grassed headlands, the latter functioning as a sediment sink (Roth and Visser, 2003; Visser, 2003). As about 80% of the sugarcane growers in Tully-Murray catchment makes use of grassed headlands (Roebeling and Webster, 2007), we take all headlands to be grassed. Trash management practices include burning cane prior to harvest or leaving green crop residue on the field after harvesting (green cane trash blanketing – GCTB). As the majority (90%) of sugarcane growers in the Tully-Murray catchment apply GCTB (Roebeling and Webster, 2007), we take all crop residue to be left on the field after harvest. Harvest strategy refers to the timing of harvest during the harvest season. For this study we take all harvests to occur in the middle of the harvest season (August-September).
• One combination of genetic factors is considered, which implies the use of a sugarcane variety that is characterized by a CCS-peak in the middle of the harvesting season (August-September). Other varieties might be considered and may have important yield effects (see for example Jackson et al. 1999), though variety has not been identified as
1 When a bare fallow is used, the N-application rate to the plant cane is 75% of the N-application rate to the ratoon cane. When a legume fallow is used, no nitrogen is applied to plant cane.

Financial-economic analysis of current best management practices: Tully-Murray catchment
5
an important management practice for water quality improvement by industry and experts in the Tully-Murray catchment (Roebeling and Webster, 2007).
• One combination of environmental factors is considered, which encompasses historical rainfall, radiation and temperature patched-point data for the Tully-Murray catchment over the last 95 years (SILO, 2006). Consequently, APSIM simulates sugarcane growth over this 95 year period thereby taking into account climate variability as well as soil N depletion over time.
APSIM is used to generate input and output data for all of the combinations of the defined soil, management, genetic and environmental factors. In total, 1152 unique combinations of inputs and corresponding outputs are assessed2. Inputs include fertilisers, herbicides, labour and machinery, and outputs include sugarcane yield, CCS content, ground cover, dissolved inorganic nitrogen (DIN) concentration, and persistent herbicide concentration. The net contribution to total sediment and nutrient delivery is based on ground cover and DIN concentration, and determined using SedNet/ANNEX (see Section 2.2.1 and 2.2.2), while the net contribution to total persistent herbicide delivery is taken as a proportion of persistent herbicide concentration (see Section 2.2.3). 2.1.2 Horticulture crop growth model – LUCTOR
Horticulture input-output data for different management practices (MPs) are generated using the LUCTOR crop growth model (see for example Hengsdijk et al. 1998; Hengsdijk et al. 2000). The perennial production system module simulates, for a uniform block of land, per hectare long term sustainable yield, crop biomass, ground cover and nutrient balances. Model simulation results are determined by soil factors such as depth, water holding capacity and nutrient availability, management factors such as herbicide use, pesticide use, crop residue management and fertiliser use, genetic factors such as crop variety, and climatic factors like rainfall, radiation and temperature. For the analysis of banana BMPs in the Tully-Murray catchment, we identify the following soil, management, genetic and environmental factors: • One set of soil factors is considered, thereby differentiating between three soil classes.
The soil classification is based on the soils and land use suitability study by Murtha and Smith (1994), as described in Section 2.1.1. Poorly drained loam soils from alluvial origin (S4) are not suitable for banana production without proper drainage systems in place (Murtha and Smith, 1994), and are thus excluded from the analysis.
• Two sets of management factors are considered, including two interrow management practices and nine fertiliser application rates. Interrow management is an important management factor identified by industry and experts in the Tully-Murray catchment (Roebeling and Webster, 2007), determining ground cover and, thus, erosion and sediment delivery from horticulture systems. Defined interrow management practices include bare (R1) and grassed (R2) interrows. Under R1 the interrow is maintained through regular non-persistent herbicide application (e.g. Roundup), while under R2 the interrow is maintained through regular slashing. Fertiliser application rate has also been identified as an important management factor by industry and experts in the Tully-Murray catchment (Roebeling and Webster, 2007), determining inorganic nutrient addition and, thus, inorganic nutrient delivery from
2 Four soil classes, times three tillage management practices, times two fallow management practices, times six N-application rates, times two post-fallow N-application rates, times two N-application methods, times two herbicide application rates, times one headland type, times one trash management practice, times one harvest strategy, times one combination of genetic and environmental factors, yields 1152 combinations.

Roebeling et al.
6
horticulture systems. Defined nutrient (N, P and K) application rates range from 20% (F02) to 100% (F10) of the application rate that is required to realize the maximum attainable production, in eight steps of 10%.
• One combination of genetic factors is considered, which implies the use of banana variety Cavendish 'Williams' AAA – the predominant commercial variety in Australia (Hamill, 2005).
• One combination of environmental factors is considered, which encompasses historical average annual rainfall, radiation and temperature patched-point data for the Tully-Murray catchment over the last 95 years (SILO, 2006).
LUCTOR is used to generate input and output data for all of the combinations of the defined soil, management, genetic and environmental factors. In total, 54 unique combinations of inputs and corresponding outputs are assessed3. Inputs include fertilisers, herbicides, pesticides, labour and machinery, and outputs include banana yield, ground cover and nutrient concentrations. The net contribution to total water pollutant delivery is based on ground cover and DIN concentration, and determined using SedNet/ANNEX (see Section 2.2). 2.1.3 Grazing production model – PASTOR
Grazing input-output data for different management practices (MPs) are generated using the PASTOR beef cattle modelling tool (see for example Bouman et al. 1998; Hengsdijk et al. 2000) which simulates, for a uniform block of grazed land, long term sustainable beef production, ground cover and nutrient balances given the complex interaction between pasture growth and stocking rate. Consequently, PASTOR contains separate modules for the calculation of input-output figures for pasture, herd and feed supplement systems. The pasture module quantifies input-output figures for fertilised, grass-legume and unfertilised pastures. This module simulates, for a uniform block of pasture, maximum attainable metabolizable energy (ME), crude protein (CP) and phosphorus (P) production as a function of stocking rate and nitrogen (N) application rate. Pasture input costs and labour requirements calculations are based on items such as fences, equipment, herbicides and fertilisers. For the Tully-Murray catchment case study, a signal grass (Brachiaria decumbens) fertilised pasture system is considered as this is the most widespread pasture production system in the area. The herd module quantifies input-output figures for breeding, fattening and dual purpose systems. Breeding refers to a system where calves are bred and sold at a specified age, fattening refers to a system where calves are bought, fattened and sold at a specified weight, and dual purpose refers to a system where milk and calves are produced and sold. This module simulates cattle feed requirements (in terms of ME, PC and P) as well as beef and milk production for a stationary herd4 on the basis of the specified herd structure, target animal growth rates, and target buying and selling strategy. Input costs and labour requirements of the herd are calculated for items like animal health care, yard and fence maintenance, and equipment. For the Tully-Murray catchment case study, a Brahman cross fattening system is considered – the prevalent cattle production system in the area (Teitzel, 1992).
3 Three soil classes, times two interrow management practices, times nine nutrient application rates, times one combination of genetic and environmental factors, yields 54 combinations. 4 A stationary herd refers to a stable herd size and composition over time (see Hengsdijk et al. 1998; 2000).

Financial-economic analysis of current best management practices: Tully-Murray catchment
7
The feed supplement module converts supplement data into feed characteristics (ME, CP and P), input costs and labour application requirements. For the Tully-Murray catchment case study, supplements include sugarcane molasses and a P mineral salt. For the analysis of grazing BMPs in the Tully-Murray catchment, we identify the following soil, management, genetic and environmental factors: • One set of soil factors is considered, thereby differentiating between four soil classes.
The soil classification is based on the soils and land use suitability study by Murtha and Smith (1994), as described in Section 2.1.1.
• Two sets of management factors are considered, including fifteen stocking rates and eleven nitrogen application rates. Stocking rate (or carrying capacity) is an important management factor identified by industry and experts in the Tully-Murray catchment (Roebeling and Webster, 2007), determining ground cover and, thus, soil erosion and sediment delivery from grazing systems. Defined stocking rates range from 0.5 AU/ha (R11) to 4.0 AU/ha (R25) in fourteen steps of 0.25 AU, and where one animal unit (AU) equals 400 kg live weight. Nitrogen (N) application rate has also been identified as an important management factor by industry and experts in the Tully-Murray catchment (Roebeling and Webster, 2007), determining inorganic nitrogen addition and, thus, inorganic nutrient delivery from grazing systems. Defined N-application rates range from 0% (S20) to 100% (S30) of the N-application rate that is required to realize the maximum attainable production, in ten steps of 10%.
• One combination of genetic factors is considered, which implies the use of fertilised signal grass (Brachiaria decumbens) and Brahman cattle.
• One combination of environmental factors is considered, which encompasses historical average annual rainfall, radiation and temperature patched-point data for the Tully-Murray catchment over the last 95 years (SILO, 2006).
PASTOR is used to generate input and output data for all of the combinations of the defined soil, management, genetic and environmental factors. In total, 660 unique combinations of inputs and corresponding outputs are assessed.5 Inputs include cattle, fertilisers, herbicides, labour, equipment and machinery, and outputs include beef production, ground cover and nutrient concentrations. The net contribution to total water pollutant delivery is based on ground cover and DIN concentration, and determined using SedNet/ANNEX (see Section 2.2). 2.1.4 Forestry crop growth model – LUCTOR
Forestry input-output data for different management practices (MPs) are generated using the LUCTOR crop growth model (see for example Hengsdijk et al. 2000). The timber plantation production system module simulates, for a uniform block of land, per hectare long term sustainable yield, crop biomass, ground cover and nutrient balances. Model simulation results are determined by soil factors such as depth, water holding capacity and nutrient availability, management factors such as crop residue management, genetic factors such as timber specie, and climatic factors like rainfall, radiation and temperature. For the analysis of tropical hard timber BMPs in the Tully-Murray catchment, we identify the following soil, management, genetic and environmental factors:
5 Four soil classes, times fifteen stocking rates, times eleven N-applications rates, times one combination of genetic and environmental factors, yields 660 combinations.
Roebeling et al.
8
• One set of soil factors is considered, thereby differentiating between three soil classes. The soil classification is based on the soils and land use suitability study by Murtha and Smith (1994), as described in Section 2.1.1. Slowly drained gradational or duplex textured soils (S3) are generally not suitable for teak production (Kashio and White, 1998) and thus not included in thus study.
• One set of management factors is considered: two interrow management practices. Interrow management is an important management factor in the Tully-Murray catchment (Roebeling and Webster, 2007), determining ground cover and, thus, erosion and sediment delivery from forestry systems. Interrow management practices include bare (R1) and grassed (R2) interrows. Under R1 the interrow is maintained through regular non-persistent herbicide application (e.g. Roundup), while under R2 the interrow is maintained through regular slashing.
• One combination of genetic factors is considered, which implies the use of the tropical hard timber specie Tectona Grandis (Teak).
• One combination of environmental factors is considered, which encompasses historical average annual rainfall, radiation and temperature patched-point data for the Tully-Murray catchment over the last 95 years (SILO, 2006).
LUCTOR is used to generate input and output data for all of the combinations of the defined soil, management, genetic and environmental factors. In total, 6 unique combinations of inputs and corresponding outputs are assessed.6 Inputs include fertilisers, herbicides, pesticides, labour and machinery, and outputs include timber yield, ground cover and nutrient concentrations. The net contribution to total water pollutant delivery is based on ground cover and DIN concentration, and determined using SedNet/ANNEX (see Section 2.2), while the net contribution to total persistent herbicide delivery is taken as a proportion of persistent herbicide concentration (see Section 2.2.3).
2.2 Water quality model – SedNet / ANNEX The hydrological model SedNet/ANNEX (Sediment River Network model/Annual Network Nutrient Export) is used to estimate the net contribution from production systems (PSs) and management practices (MPs) to total fine suspended sediment (FSS) and dissolved inorganic nitrogen (DIN) delivery which, together with persistent herbicide (HER) delivery, are considered the most important water pollutants in the Tully-Murray catchment (Mitchell et al. 2007). SedNet/ANNEX was originally developed as part of the National Land and Water Resources Audit (NLWRA) by CSIRO Land and Water (see for example Prosser et al. 2001a, 2001b; Young et al. 2001; DeRose et al. 2002, 2003; Bartley et al. 2003, 2004). The SedNet/ANNEX model calculates the mean annual supply, within catchment deposition and subsequent downstream delivery of sediments and nutrients through the construction of sediment and nutrient budgets for river networks. 2.2.1 Fine suspended sediment delivery
A sediment budget is an account of the most important sources and sinks for eroded material (Wilkinson et al. 2004). Sources of sediment include hillslope erosion, erosion of gullies, erosion of stream and river banks, and erosion of drains. Sinks for sediment include fine sediment floodplain deposition, coarse sediment river bed deposition, and fine and coarse sediment reservoir deposition. Total fine and coarse sediment delivery at the river mouth is
6 Three soil classes, times two herbicide application rates, times one combination of genetic and environmental factors, yields 6 combinations.
Financial-economic analysis of current best management practices: Tully-Murray catchment
9
the net result of sediment erosion and deposition originating from upstream internal watersheds and connecting gullies, streams and rivers. The net contribution of PSs and MPs to total fine suspended sediment (FSS) delivery at the river mouth is determined in four steps: 1. C-factors for PSs and MPs are estimated using crop growth simulation models based on
the ground cover of each MP (see Section 2.1). 2. Minimum and maximum plot level C-factor values, as determined by the different MPs,
are identified for each PS. 3. SedNet simulations are performed for C-factors in between these minimum and
maximum values, to determine the corresponding total fine suspended sediment delivery for each PS.
4. A relationship between plot level C-factor and fine suspended sediment delivery is quantified for each PS, and the net contribution of different MPs to fine suspended sediment delivery is calculated.
On the basis of the plot level C-factor values of PSs and MPs, we thus estimate the per hectare contribution of these PSs and MPs to fine suspended sediment (FSS) delivery. Note that it is implicitly assumed that the land use pattern in the catchment remains unchanged. 2.2.2 Dissolved inorganic nitrogen delivery
Similar to the sediment budget, a nutrient budget is an account of the most important sources and sinks for physical nutrients (Young et al. 2001). Sources of nutrients include sediment associated nutrients, dissolved organic and inorganic nutrient loads in runoff water, and point sources of nutrients. Sinks for nutrients are associated with sediment deposition, denitrification and phosphorus adsorption-desorption. Total nutrient delivery at the river mouth is the net result of the above processes in upstream internal watersheds and connecting gullies, streams and rivers. The net contribution of PSs and MPs to dissolved inorganic nitrogen (DIN) delivery at the river mouth is determined in four steps: 1. Plot level DIN-concentrations for PSs and MPs are estimated using crop growth
simulation models based on nitrogen application rate and crop nitrogen uptake (see Section 2.1).
2. Minimum and maximum plot level DIN-concentrations, as determined by the different MPs, are identified for each PS.
3. ANNEX simulations are performed for DIN-concentrations in between these minimum and maximum values, to determine the corresponding total DIN delivery for each PS.
4. A relationship between plot level DIN-concentration and dissolved inorganic nitrogen delivery is quantified for each PS, and the net contribution of different MPs to dissolved inorganic nitrogen delivery is calculated.
On the basis of the plot level DIN-concentrations of PSs and MPs, we can thus estimate the per hectare contribution of these PSs and MPs to dissolved inorganic nitrogen delivery. Again note that it is implicitly assumed that the land use pattern in the catchment remains unchanged.

Roebeling et al.
10
2.2.3 Herbicide delivery
There is no hydrological module available in SedNet/ANNEX that accurately describes the relationship between plot level persistent herbicide concentrations and persistent herbicide delivery (Lewis et al. 2006). Based on discussions with Brodie (2006, personal communication) and Green and Young (2006), we take 5% of the plot level rate of herbicide (Diuron) application to be delivered to the river mouth.
2.3 Cost benefit analysis All analysed production systems (PSs) and management practices (MPs) have a duration exceeding one year. These PSs and MPs occupy the land for a number of years and require (considerable) investments during startup. As values that occur later in time are worth less at present than those occurring earlier in time, a time discount rate r is used to value future costs and benefits streams in present-day terms. To compare PSs and MPs with varying life-spans and outlay bases, annuities of net present values are calculated for each of them. The net present value NPV of a project is defined as the discounted sum of differences between benefits Bt and costs Ct that are attributable to the installation of the project and that occur in each period t over the entire lifetime of the project T (Zerbe and Dively, 1994). The NPV is given by:
( ) ( )∑∑== +
−+
=T
tt
tT
tt
t
rC
rBNPV
00 11 (1)
where r is the time discount rate. The NPV rule states that investment in a project should take place in case NPV > 0. To be able to compare projects with different lifetimes T, net present values are converted into annuities (Schipper et al. 2000). The annuity A of a net present value is calculated using the capital recovery factor, which is given by (Zerbe and Dively, 1994):
( ) ⎥⎦
⎤⎢⎣
⎡
+−= −Tr
rNPVA11
(2)
where T is the project lifetime (generally in years). Eq. (2) states that an annual amount A needs to be obtained at the end of each period over the life span of the project T to recover the net present value NPV at the end of the seventh period at discount rate r. Using the NPV approach in combination with the capital recovery factor to determine the annuity A produces correct financial decisions in all cases (Zerbe and Dively, 1994). This procedure is not only applied to determine the annuity gross margin of PSs and MPs, but also to determine intermediate annuity figures for, for example, yields and sediment supply (indeed, in physical terms) as well as annuity labour use and input costs (Schipper et al. 2000). For the calculation of costs and benefits of PSs and MPs, constant 2005 prices are used for input, labour and machinery use, and average 2003 to 2005 prices are used for outputs. Input and machinery use prices are based on Mossman Agricultural Services (MAS) data, output prices are based on Queensland Sugar Limited (2006), FAOSTAT (2006) and ITTO (2004), and agricultural wages are extrapolated from 2000-2001 ATO income tax data. The time discount rate r is set at 5% per year, which is between the suggested 3% that is used in long-term environmental studies (Kaya and Yokobori, 1997) and the 8% geometric mean of

Financial-economic analysis of current best management practices: Tully-Murray catchment
11
real interest rates in Australia over the period 1982 to 1999 (World Bank, 1999). Taxes, non-production system specific fixed asset depreciation and maintenance costs, and capital costs are not considered in the gross margin figures at the plot level.
Roebeling et al.
12
3. Financial-economic analysis of industry current best management practices
This chapter summarises the results of the cost-effectiveness of management practices (MPs) in sugarcane, horticulture, grazing and forestry production in the Tully-Murray catchment. As there are hundreds of MPs, each of these MPs cannot be discussed separately and in great detail. Consequently, for the analysis of the cost-effectiveness of MPs in sugarcane, horticulture, grazing and forestry production we will look at two indicators: annuity gross margin (in AU$/ha/yr) and average annual water pollutant delivery (in t, kg or ml per ha/yr) per MP at the plot level. Gross margin is defined as the production value net of variable input, labour and machinery costs as well as production system specific fixed asset maintenance and depreciation costs. Finally, it is important to note that taxes, non-production system specific fixed asset depreciation and maintenance costs (e.g. machinery, barns and sheds), and capital costs (i.e. opportunity or finance costs of fixed assets) are not considered in the gross margin figures at the plot level as these costs are determined at the farm level7.
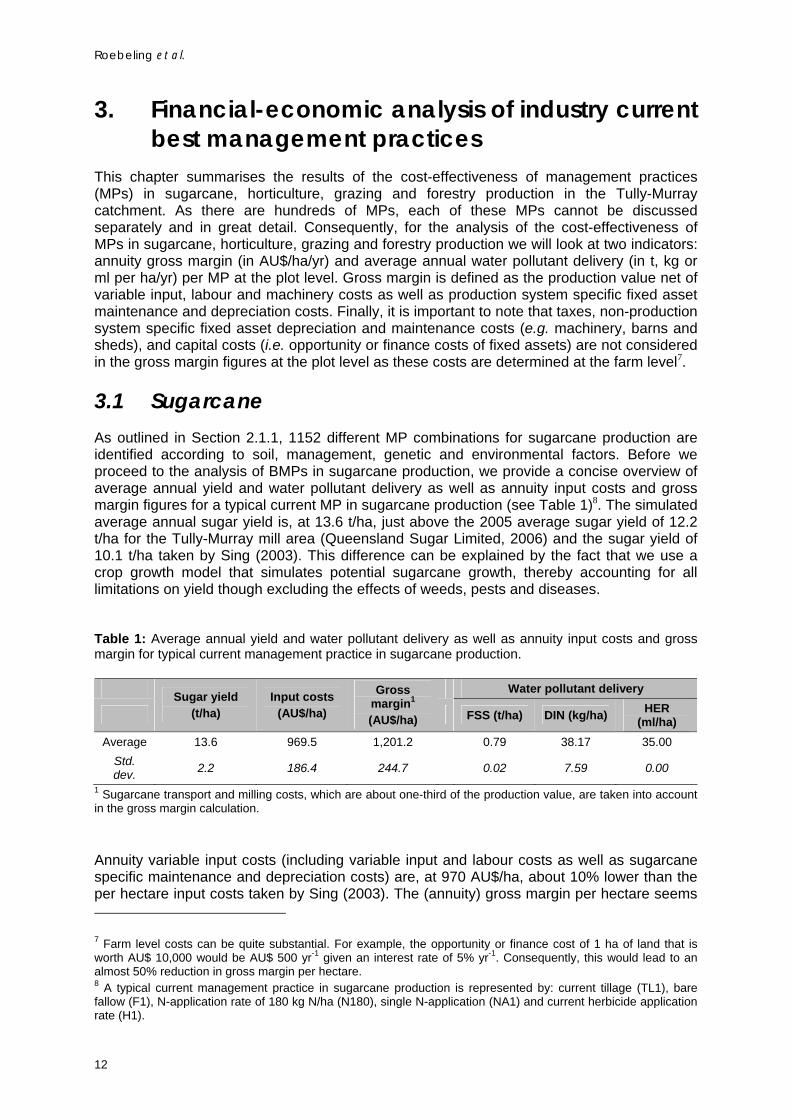
3.1 Sugarcane As outlined in Section 2.1.1, 1152 different MP combinations for sugarcane production are identified according to soil, management, genetic and environmental factors. Before we proceed to the analysis of BMPs in sugarcane production, we provide a concise overview of average annual yield and water pollutant delivery as well as annuity input costs and gross margin figures for a typical current MP in sugarcane production (see Table 1)8. The simulated average annual sugar yield is, at 13.6 t/ha, just above the 2005 average sugar yield of 12.2 t/ha for the Tully-Murray mill area (Queensland Sugar Limited, 2006) and the sugar yield of 10.1 t/ha taken by Sing (2003). This difference can be explained by the fact that we use a crop growth model that simulates potential sugarcane growth, thereby accounting for all limitations on yield though excluding the effects of weeds, pests and diseases. Table 1: Average annual yield and water pollutant delivery as well as annuity input costs and gross margin for typical current management practice in sugarcane production.
Water pollutant delivery
Sugar yield
(t/ha) Input costs
(AU$/ha)
Gross margin1
(AU$/ha) FSS (t/ha) DIN (kg/ha) HER (ml/ha)
Average 13.6 969.5 1,201.2 0.79 38.17 35.00 Std. dev. 2.2 186.4 244.7 0.02 7.59 0.00
1 Sugarcane transport and milling costs, which are about one-third of the production value, are taken into account in the gross margin calculation. Annuity variable input costs (including variable input and labour costs as well as sugarcane specific maintenance and depreciation costs) are, at 970 AU$/ha, about 10% lower than the per hectare input costs taken by Sing (2003). The (annuity) gross margin per hectare seems 7 Farm level costs can be quite substantial. For example, the opportunity or finance cost of 1 ha of land that is worth AU$ 10,000 would be AU$ 500 yr-1 given an interest rate of 5% yr-1. Consequently, this would lead to an almost 50% reduction in gross margin per hectare. 8 A typical current management practice in sugarcane production is represented by: current tillage (TL1), bare fallow (F1), N-application rate of 180 kg N/ha (N180), single N-application (NA1) and current herbicide application rate (H1).
Financial-economic analysis of current best management practices: Tully-Murray catchment
13
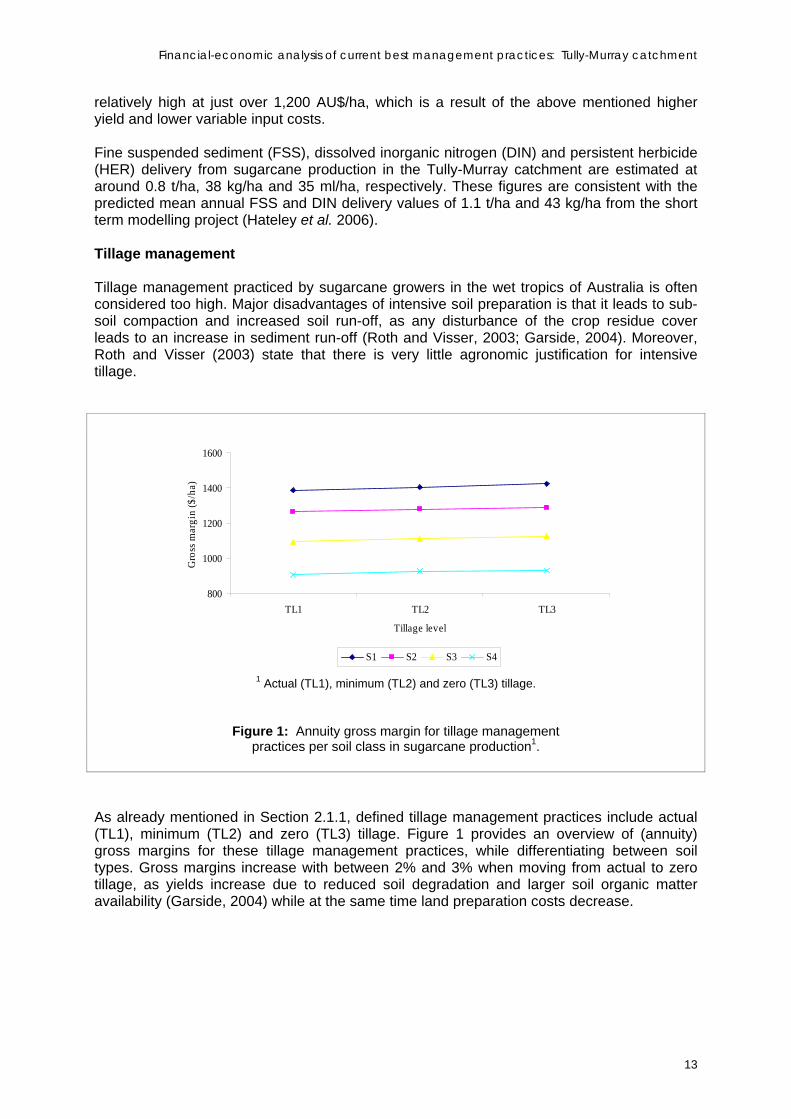
relatively high at just over 1,200 AU$/ha, which is a result of the above mentioned higher yield and lower variable input costs. Fine suspended sediment (FSS), dissolved inorganic nitrogen (DIN) and persistent herbicide (HER) delivery from sugarcane production in the Tully-Murray catchment are estimated at around 0.8 t/ha, 38 kg/ha and 35 ml/ha, respectively. These figures are consistent with the predicted mean annual FSS and DIN delivery values of 1.1 t/ha and 43 kg/ha from the short term modelling project (Hateley et al. 2006). Tillage management Tillage management practiced by sugarcane growers in the wet tropics of Australia is often considered too high. Major disadvantages of intensive soil preparation is that it leads to sub-soil compaction and increased soil run-off, as any disturbance of the crop residue cover leads to an increase in sediment run-off (Roth and Visser, 2003; Garside, 2004). Moreover, Roth and Visser (2003) state that there is very little agronomic justification for intensive tillage.
800
1000
1200
1400
1600
TL1 TL2 TL3
Tillage level
Gro
ss m
argi
n ($
/ha)
S1 S2 S3 S4
1 Actual (TL1), minimum (TL2) and zero (TL3) tillage.
Figure 1: Annuity gross margin for tillage management practices per soil class in sugarcane production1.
As already mentioned in Section 2.1.1, defined tillage management practices include actual (TL1), minimum (TL2) and zero (TL3) tillage. Figure 1 provides an overview of (annuity) gross margins for these tillage management practices, while differentiating between soil types. Gross margins increase with between 2% and 3% when moving from actual to zero tillage, as yields increase due to reduced soil degradation and larger soil organic matter availability (Garside, 2004) while at the same time land preparation costs decrease.

Roebeling et al.
14
0.45
0.55
0.65
0.75
0.85
TL1 TL2 TL3
Tillage level
FSS
deliv
ery
(t/ha
)
S1 S2 S3 S4
1 Actual (TL1), minimum (TL2) and zero (TL3) tillage.
Figure 2: Average annual fine suspended sediment (FSS) delivery for tillage management practices per soil class in sugarcane production1.
Figures 2 and 3 provide, respectively, an estimation of average annual FSS and DIN deliveries for the assessed tillage management practices. A shift from actual (TL1) to zero (TL3) tillage leads to a considerable reduction in FSS delivery (for all soil types FSS delivery decreases with about 30%), while there is no significant change in DIN delivery. Finally, HER delivery is, at 35 ml/ha, the same for all tillage management practices and soil types.
0.0
10.0
20.0
30.0
40.0
50.0
60.0
TL1 TL2 TL3
Tillage level
DIN
del
iver
y (k
g/ha
)
S1 S2 S3 S4
1 Actual (TL1), minimum (TL2) and zero (TL3) tillage.
Figure 3: Average annual dissolved inorganic nitrogen (DIN) delivery for tillage management practices per soil class in sugarcane production1.
Financial-economic analysis of current best management practices: Tully-Murray catchment
15
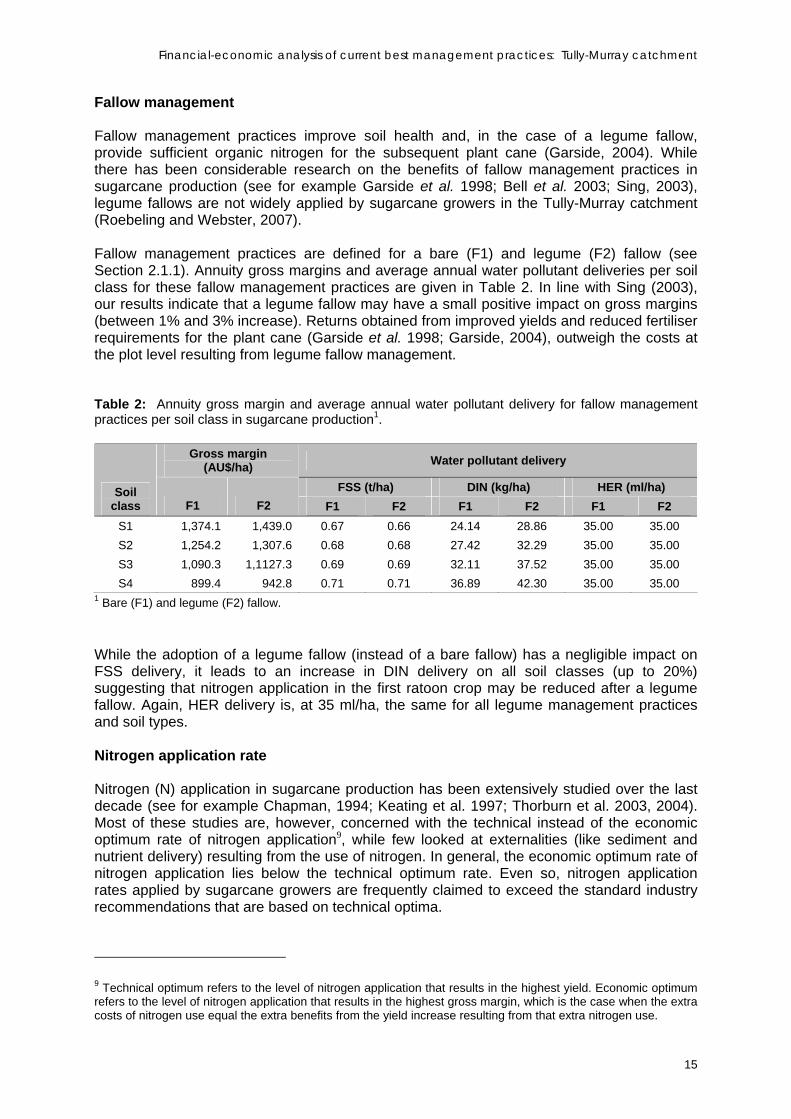
Fallow management Fallow management practices improve soil health and, in the case of a legume fallow, provide sufficient organic nitrogen for the subsequent plant cane (Garside, 2004). While there has been considerable research on the benefits of fallow management practices in sugarcane production (see for example Garside et al. 1998; Bell et al. 2003; Sing, 2003), legume fallows are not widely applied by sugarcane growers in the Tully-Murray catchment (Roebeling and Webster, 2007). Fallow management practices are defined for a bare (F1) and legume (F2) fallow (see Section 2.1.1). Annuity gross margins and average annual water pollutant deliveries per soil class for these fallow management practices are given in Table 2. In line with Sing (2003), our results indicate that a legume fallow may have a small positive impact on gross margins (between 1% and 3% increase). Returns obtained from improved yields and reduced fertiliser requirements for the plant cane (Garside et al. 1998; Garside, 2004), outweigh the costs at the plot level resulting from legume fallow management. Table 2: Annuity gross margin and average annual water pollutant delivery for fallow management practices per soil class in sugarcane production1.
Gross margin (AU$/ha) Water pollutant delivery
FSS (t/ha) DIN (kg/ha) HER (ml/ha) Soil class F1 F2 F1 F2 F1 F2 F1 F2
S1 1,374.1 1,439.0 0.67 0.66 24.14 28.86 35.00 35.00 S2 1,254.2 1,307.6 0.68 0.68 27.42 32.29 35.00 35.00 S3 1,090.3 1,1127.3 0.69 0.69 32.11 37.52 35.00 35.00 S4 899.4 942.8 0.71 0.71 36.89 42.30 35.00 35.00
1 Bare (F1) and legume (F2) fallow. While the adoption of a legume fallow (instead of a bare fallow) has a negligible impact on FSS delivery, it leads to an increase in DIN delivery on all soil classes (up to 20%) suggesting that nitrogen application in the first ratoon crop may be reduced after a legume fallow. Again, HER delivery is, at 35 ml/ha, the same for all legume management practices and soil types. Nitrogen application rate Nitrogen (N) application in sugarcane production has been extensively studied over the last decade (see for example Chapman, 1994; Keating et al. 1997; Thorburn et al. 2003, 2004). Most of these studies are, however, concerned with the technical instead of the economic optimum rate of nitrogen application9, while few looked at externalities (like sediment and nutrient delivery) resulting from the use of nitrogen. In general, the economic optimum rate of nitrogen application lies below the technical optimum rate. Even so, nitrogen application rates applied by sugarcane growers are frequently claimed to exceed the standard industry recommendations that are based on technical optima.
9 Technical optimum refers to the level of nitrogen application that results in the highest yield. Economic optimum refers to the level of nitrogen application that results in the highest gross margin, which is the case when the extra costs of nitrogen use equal the extra benefits from the yield increase resulting from that extra nitrogen use.
Roebeling et al.
16
800900
10001100
12001300
14001500
1600
N060 N090 N120 N150 N180 N210 NREPL
N application rate
Gro
ss m
argi
n ($
/ha)
800900
10001100
12001300
14001500
1600
Gro
ss m
argi
n ($
/ha)
S1 S2 S3 S4
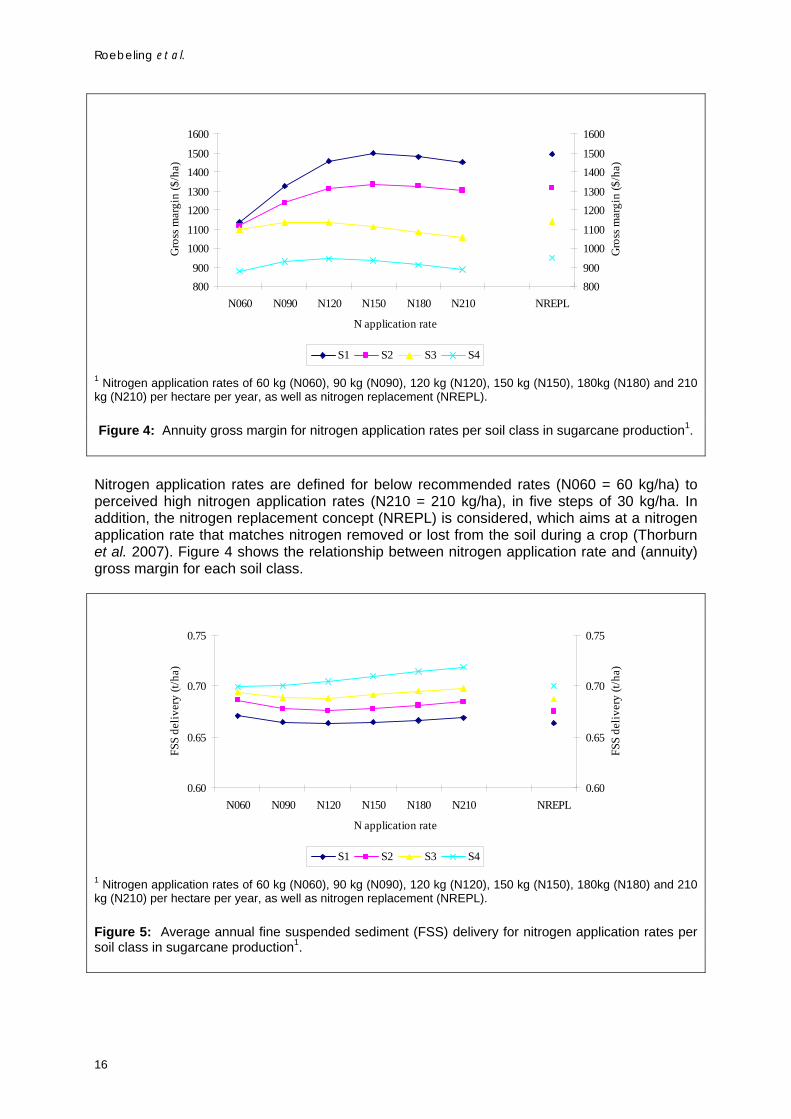
1 Nitrogen application rates of 60 kg (N060), 90 kg (N090), 120 kg (N120), 150 kg (N150), 180kg (N180) and 210 kg (N210) per hectare per year, as well as nitrogen replacement (NREPL). Figure 4: Annuity gross margin for nitrogen application rates per soil class in sugarcane production1.
Nitrogen application rates are defined for below recommended rates (N060 = 60 kg/ha) to perceived high nitrogen application rates (N210 = 210 kg/ha), in five steps of 30 kg/ha. In addition, the nitrogen replacement concept (NREPL) is considered, which aims at a nitrogen application rate that matches nitrogen removed or lost from the soil during a crop (Thorburn et al. 2007). Figure 4 shows the relationship between nitrogen application rate and (annuity) gross margin for each soil class.
0.60
0.65
0.70
0.75
N060 N090 N120 N150 N180 N210 NREPL
N application rate
FSS
deliv
ery
(t/ha
)
0.60
0.65
0.70
0.75
FSS
deliv
ery
(t/ha
)
S1 S2 S3 S4
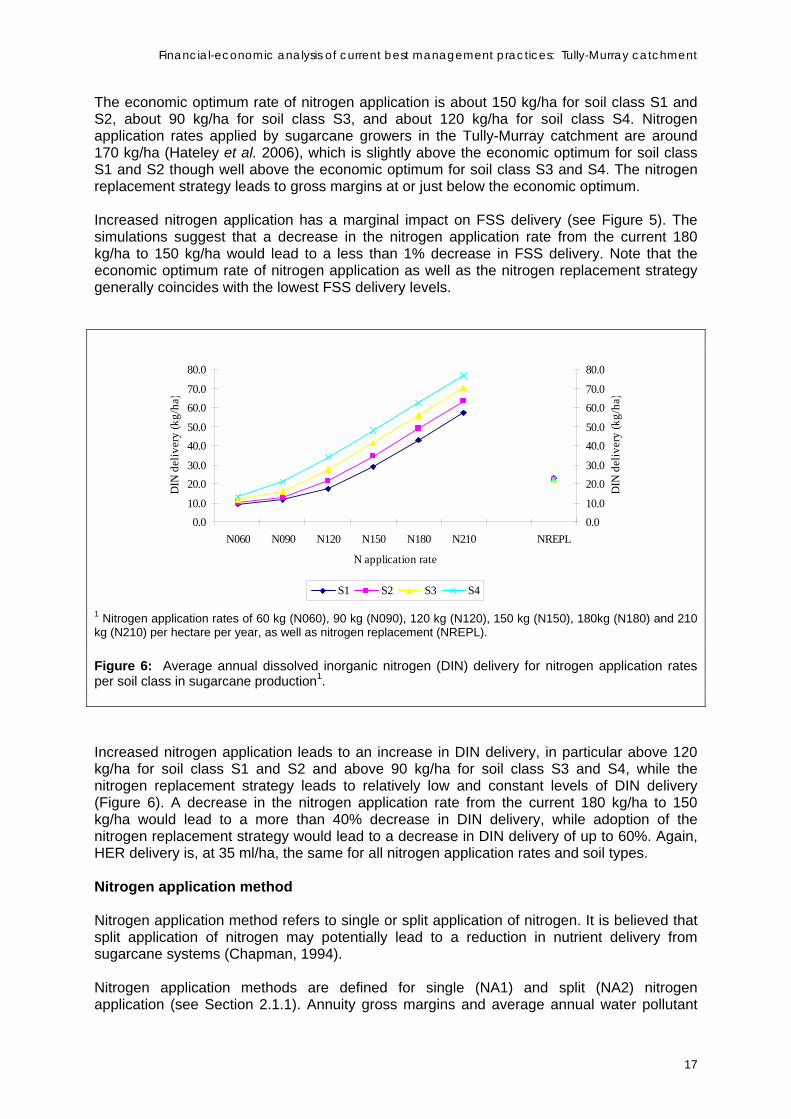
1 Nitrogen application rates of 60 kg (N060), 90 kg (N090), 120 kg (N120), 150 kg (N150), 180kg (N180) and 210 kg (N210) per hectare per year, as well as nitrogen replacement (NREPL). Figure 5: Average annual fine suspended sediment (FSS) delivery for nitrogen application rates per soil class in sugarcane production1.
Financial-economic analysis of current best management practices: Tully-Murray catchment
17
The economic optimum rate of nitrogen application is about 150 kg/ha for soil class S1 and S2, about 90 kg/ha for soil class S3, and about 120 kg/ha for soil class S4. Nitrogen application rates applied by sugarcane growers in the Tully-Murray catchment are around 170 kg/ha (Hateley et al. 2006), which is slightly above the economic optimum for soil class S1 and S2 though well above the economic optimum for soil class S3 and S4. The nitrogen replacement strategy leads to gross margins at or just below the economic optimum. Increased nitrogen application has a marginal impact on FSS delivery (see Figure 5). The simulations suggest that a decrease in the nitrogen application rate from the current 180 kg/ha to 150 kg/ha would lead to a less than 1% decrease in FSS delivery. Note that the economic optimum rate of nitrogen application as well as the nitrogen replacement strategy generally coincides with the lowest FSS delivery levels.
0.010.0
20.030.0
40.050.0
60.070.0
80.0
N060 N090 N120 N150 N180 N210 NREPL
N application rate
DIN
del
iver
y (k
g/ha
)
0.010.0
20.030.0
40.050.0
60.070.0
80.0
DIN
del
iver
y (k
g/ha
)
S1 S2 S3 S4
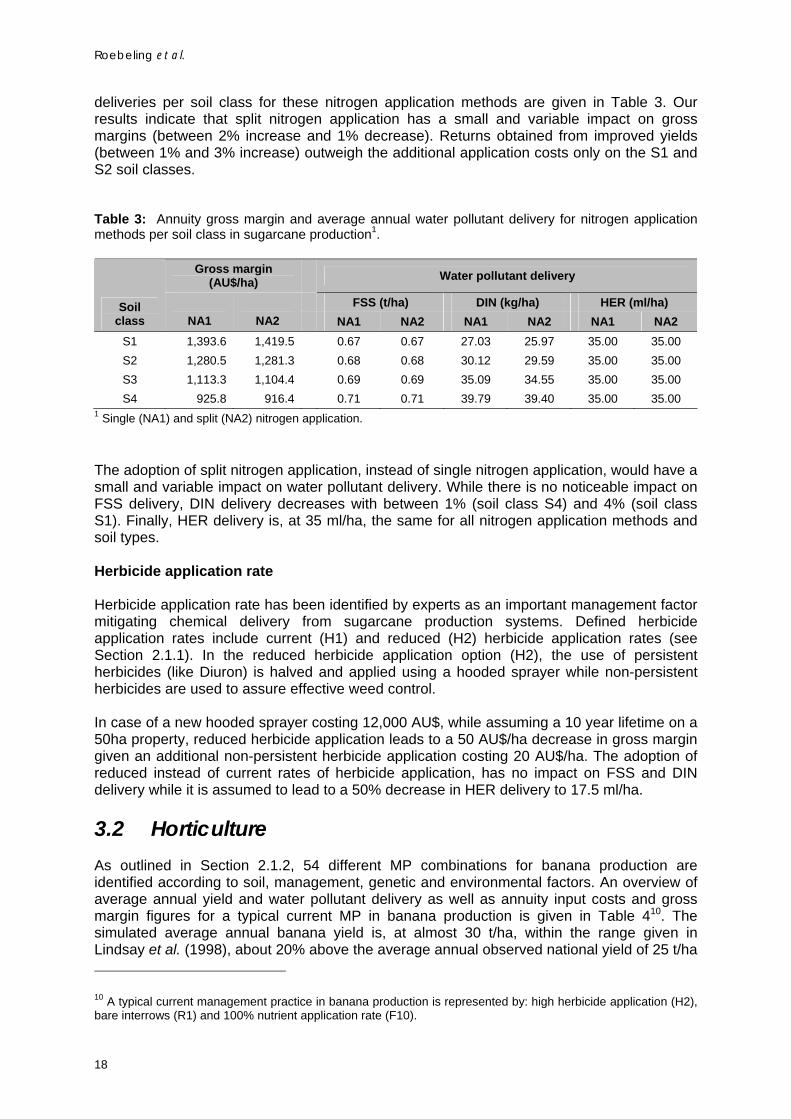
1 Nitrogen application rates of 60 kg (N060), 90 kg (N090), 120 kg (N120), 150 kg (N150), 180kg (N180) and 210 kg (N210) per hectare per year, as well as nitrogen replacement (NREPL). Figure 6: Average annual dissolved inorganic nitrogen (DIN) delivery for nitrogen application rates per soil class in sugarcane production1.
Increased nitrogen application leads to an increase in DIN delivery, in particular above 120 kg/ha for soil class S1 and S2 and above 90 kg/ha for soil class S3 and S4, while the nitrogen replacement strategy leads to relatively low and constant levels of DIN delivery (Figure 6). A decrease in the nitrogen application rate from the current 180 kg/ha to 150 kg/ha would lead to a more than 40% decrease in DIN delivery, while adoption of the nitrogen replacement strategy would lead to a decrease in DIN delivery of up to 60%. Again, HER delivery is, at 35 ml/ha, the same for all nitrogen application rates and soil types. Nitrogen application method Nitrogen application method refers to single or split application of nitrogen. It is believed that split application of nitrogen may potentially lead to a reduction in nutrient delivery from sugarcane systems (Chapman, 1994). Nitrogen application methods are defined for single (NA1) and split (NA2) nitrogen application (see Section 2.1.1). Annuity gross margins and average annual water pollutant
Roebeling et al.
18
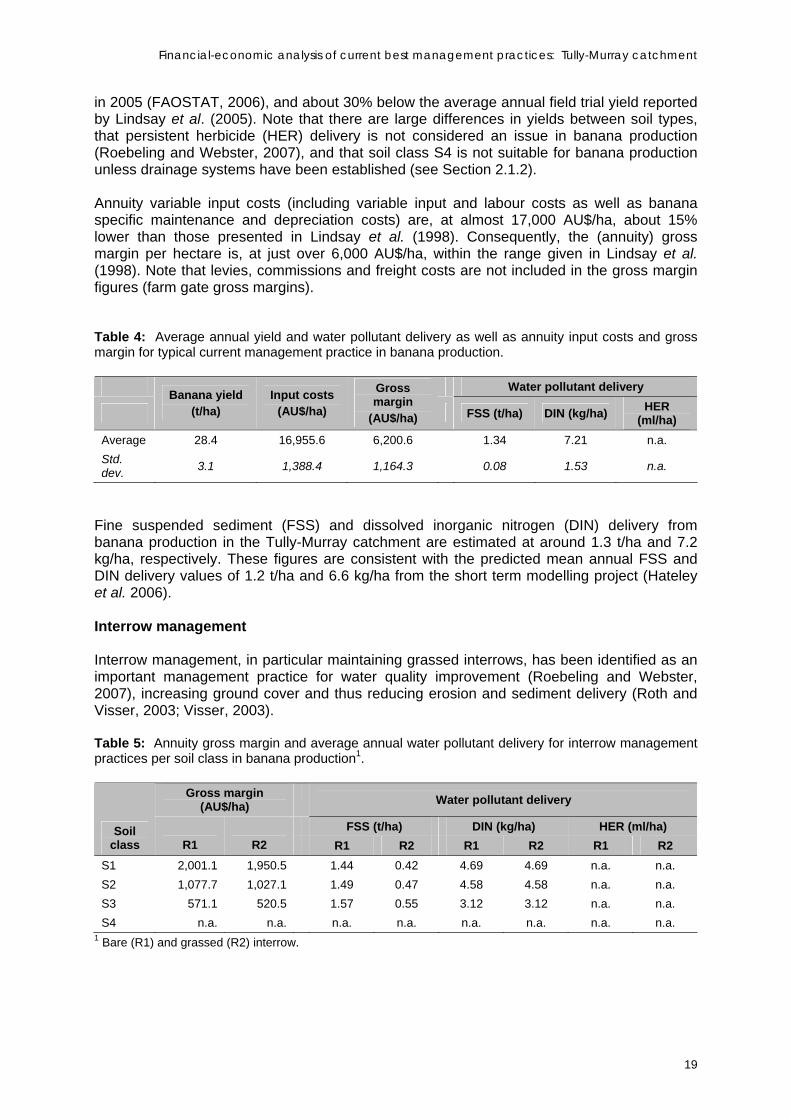
deliveries per soil class for these nitrogen application methods are given in Table 3. Our results indicate that split nitrogen application has a small and variable impact on gross margins (between 2% increase and 1% decrease). Returns obtained from improved yields (between 1% and 3% increase) outweigh the additional application costs only on the S1 and S2 soil classes. Table 3: Annuity gross margin and average annual water pollutant delivery for nitrogen application methods per soil class in sugarcane production1.
Gross margin (AU$/ha)
Water pollutant delivery
FSS (t/ha) DIN (kg/ha) HER (ml/ha) Soil class NA1 NA2 NA1 NA2 NA1 NA2 NA1 NA2
S1 1,393.6 1,419.5 0.67 0.67 27.03 25.97 35.00 35.00 S2 1,280.5 1,281.3 0.68 0.68 30.12 29.59 35.00 35.00 S3 1,113.3 1,104.4 0.69 0.69 35.09 34.55 35.00 35.00 S4 925.8 916.4 0.71 0.71 39.79 39.40 35.00 35.00
1 Single (NA1) and split (NA2) nitrogen application. The adoption of split nitrogen application, instead of single nitrogen application, would have a small and variable impact on water pollutant delivery. While there is no noticeable impact on FSS delivery, DIN delivery decreases with between 1% (soil class S4) and 4% (soil class S1). Finally, HER delivery is, at 35 ml/ha, the same for all nitrogen application methods and soil types. Herbicide application rate Herbicide application rate has been identified by experts as an important management factor mitigating chemical delivery from sugarcane production systems. Defined herbicide application rates include current (H1) and reduced (H2) herbicide application rates (see Section 2.1.1). In the reduced herbicide application option (H2), the use of persistent herbicides (like Diuron) is halved and applied using a hooded sprayer while non-persistent herbicides are used to assure effective weed control. In case of a new hooded sprayer costing 12,000 AU$, while assuming a 10 year lifetime on a 50ha property, reduced herbicide application leads to a 50 AU$/ha decrease in gross margin given an additional non-persistent herbicide application costing 20 AU$/ha. The adoption of reduced instead of current rates of herbicide application, has no impact on FSS and DIN delivery while it is assumed to lead to a 50% decrease in HER delivery to 17.5 ml/ha.
3.2 Horticulture As outlined in Section 2.1.2, 54 different MP combinations for banana production are identified according to soil, management, genetic and environmental factors. An overview of average annual yield and water pollutant delivery as well as annuity input costs and gross margin figures for a typical current MP in banana production is given in Table 410. The simulated average annual banana yield is, at almost 30 t/ha, within the range given in Lindsay et al. (1998), about 20% above the average annual observed national yield of 25 t/ha 10 A typical current management practice in banana production is represented by: high herbicide application (H2), bare interrows (R1) and 100% nutrient application rate (F10).
Financial-economic analysis of current best management practices: Tully-Murray catchment
19
in 2005 (FAOSTAT, 2006), and about 30% below the average annual field trial yield reported by Lindsay et al. (2005). Note that there are large differences in yields between soil types, that persistent herbicide (HER) delivery is not considered an issue in banana production (Roebeling and Webster, 2007), and that soil class S4 is not suitable for banana production unless drainage systems have been established (see Section 2.1.2). Annuity variable input costs (including variable input and labour costs as well as banana specific maintenance and depreciation costs) are, at almost 17,000 AU$/ha, about 15% lower than those presented in Lindsay et al. (1998). Consequently, the (annuity) gross margin per hectare is, at just over 6,000 AU$/ha, within the range given in Lindsay et al. (1998). Note that levies, commissions and freight costs are not included in the gross margin figures (farm gate gross margins). Table 4: Average annual yield and water pollutant delivery as well as annuity input costs and gross margin for typical current management practice in banana production.
Water pollutant delivery
Banana yield
(t/ha) Input costs
(AU$/ha)
Gross margin
(AU$/ha) FSS (t/ha) DIN (kg/ha) HER (ml/ha)
Average 28.4 16,955.6 6,200.6 1.34 7.21 n.a. Std. dev. 3.1 1,388.4 1,164.3 0.08 1.53 n.a.
Fine suspended sediment (FSS) and dissolved inorganic nitrogen (DIN) delivery from banana production in the Tully-Murray catchment are estimated at around 1.3 t/ha and 7.2 kg/ha, respectively. These figures are consistent with the predicted mean annual FSS and DIN delivery values of 1.2 t/ha and 6.6 kg/ha from the short term modelling project (Hateley et al. 2006). Interrow management Interrow management, in particular maintaining grassed interrows, has been identified as an important management practice for water quality improvement (Roebeling and Webster, 2007), increasing ground cover and thus reducing erosion and sediment delivery (Roth and Visser, 2003; Visser, 2003). Table 5: Annuity gross margin and average annual water pollutant delivery for interrow management practices per soil class in banana production1.
Gross margin (AU$/ha)
Water pollutant delivery
FSS (t/ha) DIN (kg/ha) HER (ml/ha) Soil class R1 R2 R1 R2 R1 R2 R1 R2
S1 2,001.1 1,950.5 1.44 0.42 4.69 4.69 n.a. n.a. S2 1,077.7 1,027.1 1.49 0.47 4.58 4.58 n.a. n.a. S3 571.1 520.5 1.57 0.55 3.12 3.12 n.a. n.a. S4 n.a. n.a. n.a. n.a. n.a. n.a. n.a. n.a.
1 Bare (R1) and grassed (R2) interrow.
Roebeling et al.
20
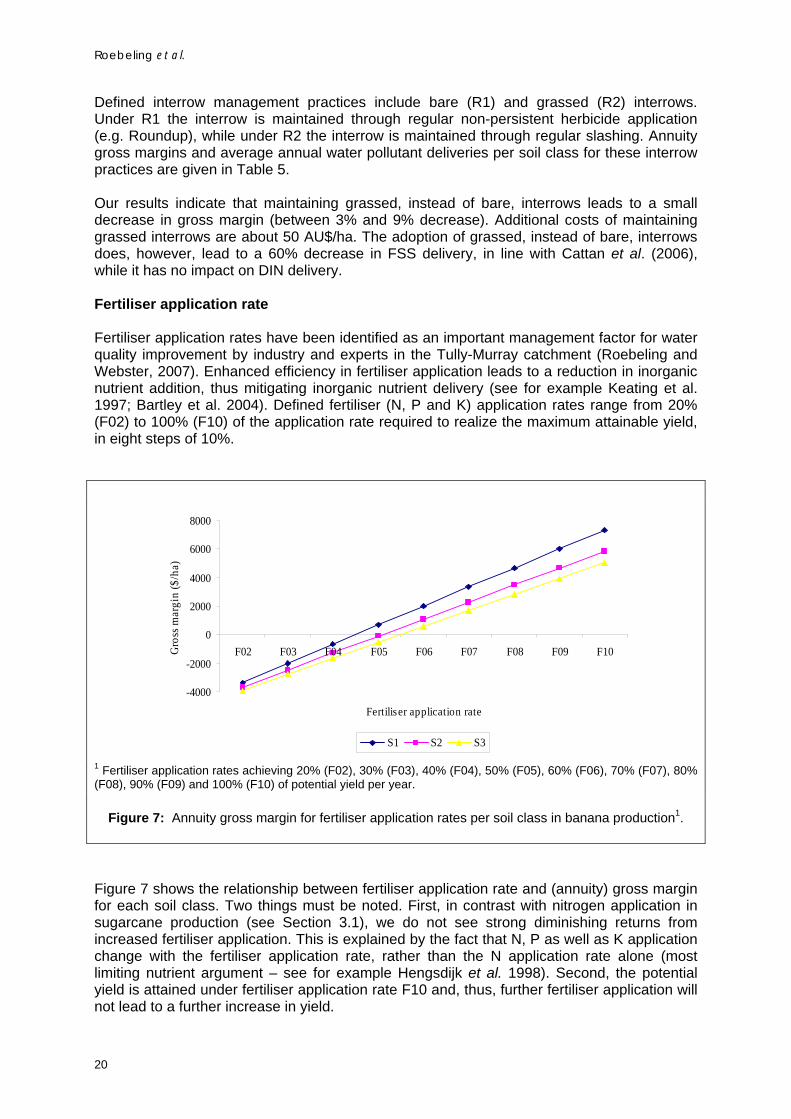
Defined interrow management practices include bare (R1) and grassed (R2) interrows. Under R1 the interrow is maintained through regular non-persistent herbicide application (e.g. Roundup), while under R2 the interrow is maintained through regular slashing. Annuity gross margins and average annual water pollutant deliveries per soil class for these interrow practices are given in Table 5. Our results indicate that maintaining grassed, instead of bare, interrows leads to a small decrease in gross margin (between 3% and 9% decrease). Additional costs of maintaining grassed interrows are about 50 AU$/ha. The adoption of grassed, instead of bare, interrows does, however, lead to a 60% decrease in FSS delivery, in line with Cattan et al. (2006), while it has no impact on DIN delivery. Fertiliser application rate Fertiliser application rates have been identified as an important management factor for water quality improvement by industry and experts in the Tully-Murray catchment (Roebeling and Webster, 2007). Enhanced efficiency in fertiliser application leads to a reduction in inorganic nutrient addition, thus mitigating inorganic nutrient delivery (see for example Keating et al. 1997; Bartley et al. 2004). Defined fertiliser (N, P and K) application rates range from 20% (F02) to 100% (F10) of the application rate required to realize the maximum attainable yield, in eight steps of 10%.
-4000
-2000
0
2000
4000
6000
8000
F02 F03 F04 F05 F06 F07 F08 F09 F10
Fertiliser application rate
Gro
ss m
argi
n ($
/ha)
S1 S2 S3
1 Fertiliser application rates achieving 20% (F02), 30% (F03), 40% (F04), 50% (F05), 60% (F06), 70% (F07), 80% (F08), 90% (F09) and 100% (F10) of potential yield per year.
Figure 7: Annuity gross margin for fertiliser application rates per soil class in banana production1.
Figure 7 shows the relationship between fertiliser application rate and (annuity) gross margin for each soil class. Two things must be noted. First, in contrast with nitrogen application in sugarcane production (see Section 3.1), we do not see strong diminishing returns from increased fertiliser application. This is explained by the fact that N, P as well as K application change with the fertiliser application rate, rather than the N application rate alone (most limiting nutrient argument – see for example Hengsdijk et al. 1998). Second, the potential yield is attained under fertiliser application rate F10 and, thus, further fertiliser application will not lead to a further increase in yield.

Financial-economic analysis of current best management practices: Tully-Murray catchment
21
0.00
0.25
0.50
0.75
1.00
1.25
1.50
F02 F03 F04 F05 F06 F07 F08 F09 F10
Fertiliser application rate
FSS
deliv
ery
(t/ha
)
S1 S2 S3
1 Fertiliser application rates achieving 20% (F02), 30% (F03), 40% (F04), 50% (F05), 60% (F06), 70% (F07), 80% (F08), 90% (F09) and 100% (F10) of potential yield per year. Figure 8: Average annual fine suspended sediment (FSS) delivery for fertiliser application rates per soil class in banana production1.
Largest gross margins are attained at N, P and K application rates of around 308 kg/ha, 21 kg/ha and 728 kg/ha (F10), respectively, thereby noting that nutrient requirements and ratios vary considerably per soil class. Nitrogen application rates applied by banana growers in the Great Barrier Reef catchments can be over 400 kg/ha (Brodie et al. 2003), indicating that re-composition of N, P and K ratios may provide options for a decrease in nitrogen requirements.
0.01.02.03.04.05.06.07.08.09.0
F02 F03 F04 F05 F06 F07 F08 F09 F10
Herbicide level
DIN
del
iver
y (k
g/ha
)
S1 S2 S3
1 Fertiliser application rates achieving 20% (F02), 30% (F03), 40% (F04), 50% (F05), 60% (F06), 70% (F07), 80% (F08), 90% (F09) and 100% (F10) of potential yield per year. Figure 9: Average annual dissolved inorganic nitrogen (DIN) delivery for fertiliser application rates per soil class in banana production1.
Roebeling et al.
22
Increased fertiliser application leads to a small decrease in FSS delivery (Figure 8), as increased fertiliser application stimulates plant growth, canopy cover and crop residue cover, while it leads to a considerable increase in DIN delivery, with some notable differences between soil classes (Figure 9).
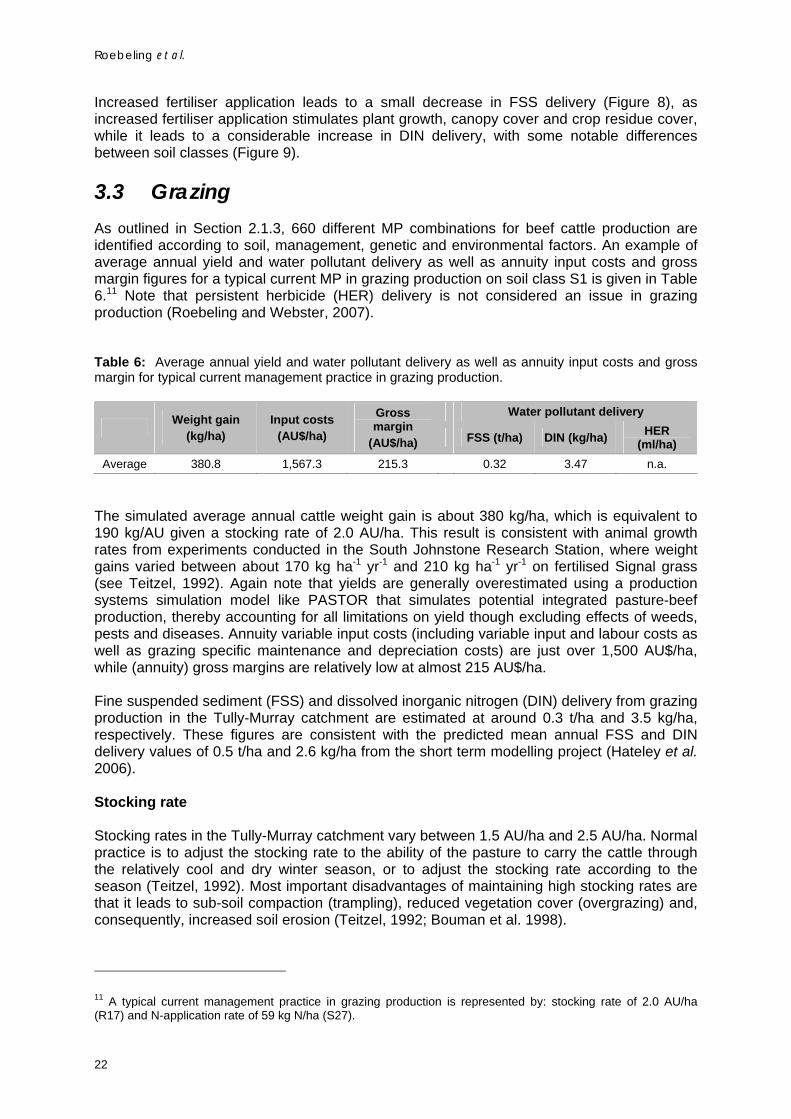
3.3 Grazing As outlined in Section 2.1.3, 660 different MP combinations for beef cattle production are identified according to soil, management, genetic and environmental factors. An example of average annual yield and water pollutant delivery as well as annuity input costs and gross margin figures for a typical current MP in grazing production on soil class S1 is given in Table 6.11 Note that persistent herbicide (HER) delivery is not considered an issue in grazing production (Roebeling and Webster, 2007). Table 6: Average annual yield and water pollutant delivery as well as annuity input costs and gross margin for typical current management practice in grazing production.
Water pollutant delivery Weight gain
(kg/ha) Input costs
(AU$/ha)
Gross margin
(AU$/ha) FSS (t/ha) DIN (kg/ha) HER (ml/ha)
Average 380.8 1,567.3 215.3 0.32 3.47 n.a. The simulated average annual cattle weight gain is about 380 kg/ha, which is equivalent to 190 kg/AU given a stocking rate of 2.0 AU/ha. This result is consistent with animal growth rates from experiments conducted in the South Johnstone Research Station, where weight gains varied between about 170 kg ha-1 yr-1 and 210 kg ha-1 yr-1 on fertilised Signal grass (see Teitzel, 1992). Again note that yields are generally overestimated using a production systems simulation model like PASTOR that simulates potential integrated pasture-beef production, thereby accounting for all limitations on yield though excluding effects of weeds, pests and diseases. Annuity variable input costs (including variable input and labour costs as well as grazing specific maintenance and depreciation costs) are just over 1,500 AU$/ha, while (annuity) gross margins are relatively low at almost 215 AU$/ha. Fine suspended sediment (FSS) and dissolved inorganic nitrogen (DIN) delivery from grazing production in the Tully-Murray catchment are estimated at around 0.3 t/ha and 3.5 kg/ha, respectively. These figures are consistent with the predicted mean annual FSS and DIN delivery values of 0.5 t/ha and 2.6 kg/ha from the short term modelling project (Hateley et al. 2006). Stocking rate Stocking rates in the Tully-Murray catchment vary between 1.5 AU/ha and 2.5 AU/ha. Normal practice is to adjust the stocking rate to the ability of the pasture to carry the cattle through the relatively cool and dry winter season, or to adjust the stocking rate according to the season (Teitzel, 1992). Most important disadvantages of maintaining high stocking rates are that it leads to sub-soil compaction (trampling), reduced vegetation cover (overgrazing) and, consequently, increased soil erosion (Teitzel, 1992; Bouman et al. 1998).
11 A typical current management practice in grazing production is represented by: stocking rate of 2.0 AU/ha (R17) and N-application rate of 59 kg N/ha (S27).

Financial-economic analysis of current best management practices: Tully-Murray catchment
23
0
50
100
150
200
250
300
1.25 1.50 1.75 2.00 2.25 2.50 2.75 3.00 3.25
Stocking rate (AU/ha)
Gro
ss m
argi
n ($
/ha)
S1 S2 S3 S4
Figure 10: Annuity gross margin for stocking rates per soil class in grazing production.
Defined stocking rates range from 0.5 AU/ha to 4.0 AU/ha, in fourteen steps of 0.25 AU. The relationship between (annuity) gross margins and stocking rates for each of the identified soil classes is given in Figure 10. The economic optimum stocking rate is about 2.25 AU/ha for soil class S1, about 2.00 AU/ha for soil class S2 and S3, and about 1.75 AU/ha for soil class S4. Consequently, gross margins are lower for pastures with a lower carrying capacity, i.e. in particular for pastures on soils where pasture growth is affected by water logging.
0.00
0.10
0.20
0.30
0.40
0.50
0.60
0.70
1.25 1.50 1.75 2.00 2.25 2.50 2.75 3.00 3.25
Stocking rate (AU/ha)
FSS
deliv
ery
(t/ha
)
S1 S2 S3 S4
Figure 11: Average annual fine suspended sediment (FSS) delivery for stocking rates per soil class in grazing production.
Roebeling et al.
24
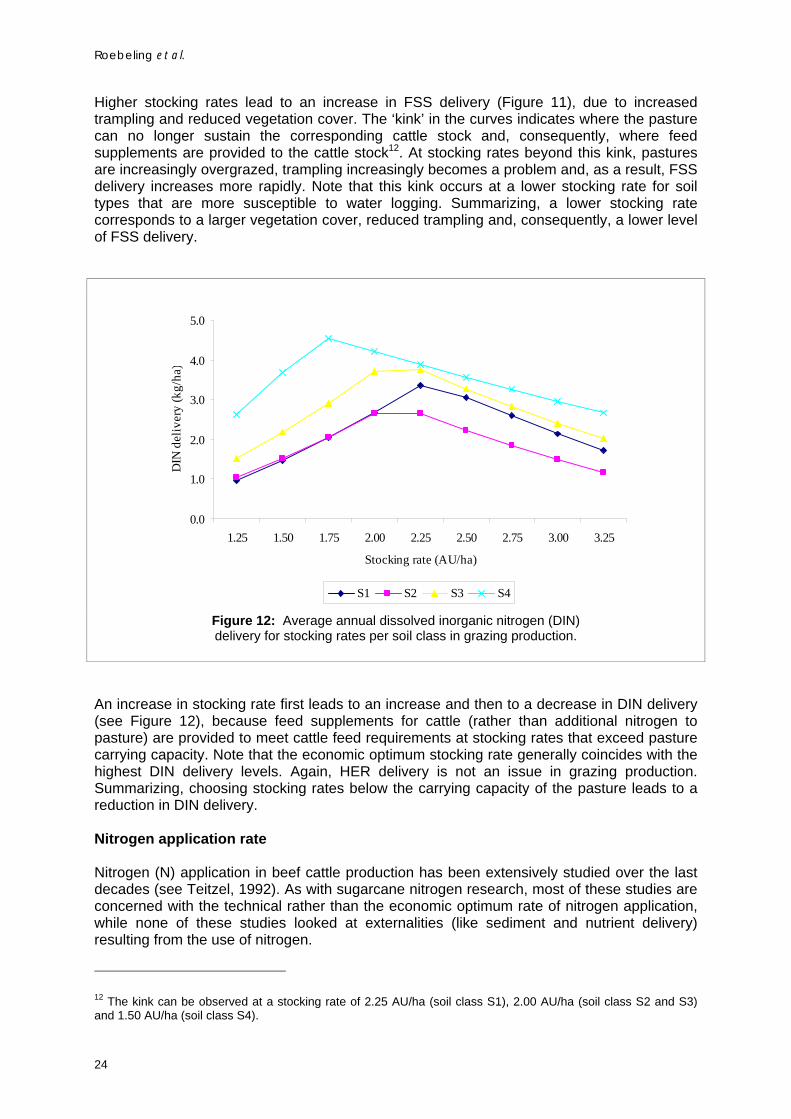
Higher stocking rates lead to an increase in FSS delivery (Figure 11), due to increased trampling and reduced vegetation cover. The ‘kink’ in the curves indicates where the pasture can no longer sustain the corresponding cattle stock and, consequently, where feed supplements are provided to the cattle stock12. At stocking rates beyond this kink, pastures are increasingly overgrazed, trampling increasingly becomes a problem and, as a result, FSS delivery increases more rapidly. Note that this kink occurs at a lower stocking rate for soil types that are more susceptible to water logging. Summarizing, a lower stocking rate corresponds to a larger vegetation cover, reduced trampling and, consequently, a lower level of FSS delivery.
0.0
1.0
2.0
3.0
4.0
5.0
1.25 1.50 1.75 2.00 2.25 2.50 2.75 3.00 3.25
Stocking rate (AU/ha)
DIN
del
iver
y (k
g/ha
)
S1 S2 S3 S4
Figure 12: Average annual dissolved inorganic nitrogen (DIN) delivery for stocking rates per soil class in grazing production.
An increase in stocking rate first leads to an increase and then to a decrease in DIN delivery (see Figure 12), because feed supplements for cattle (rather than additional nitrogen to pasture) are provided to meet cattle feed requirements at stocking rates that exceed pasture carrying capacity. Note that the economic optimum stocking rate generally coincides with the highest DIN delivery levels. Again, HER delivery is not an issue in grazing production. Summarizing, choosing stocking rates below the carrying capacity of the pasture leads to a reduction in DIN delivery. Nitrogen application rate Nitrogen (N) application in beef cattle production has been extensively studied over the last decades (see Teitzel, 1992). As with sugarcane nitrogen research, most of these studies are concerned with the technical rather than the economic optimum rate of nitrogen application, while none of these studies looked at externalities (like sediment and nutrient delivery) resulting from the use of nitrogen.
12 The kink can be observed at a stocking rate of 2.25 AU/ha (soil class S1), 2.00 AU/ha (soil class S2 and S3) and 1.50 AU/ha (soil class S4).
Financial-economic analysis of current best management practices: Tully-Murray catchment
25
0
50
100
150
200
250
300
0.0 20.0 40.0 60.0 80.0 100.0
Nitrogen application rate (kg/ha)
Gro
ss m
argi
n ($
/ha)
S1 S2 S3 S4
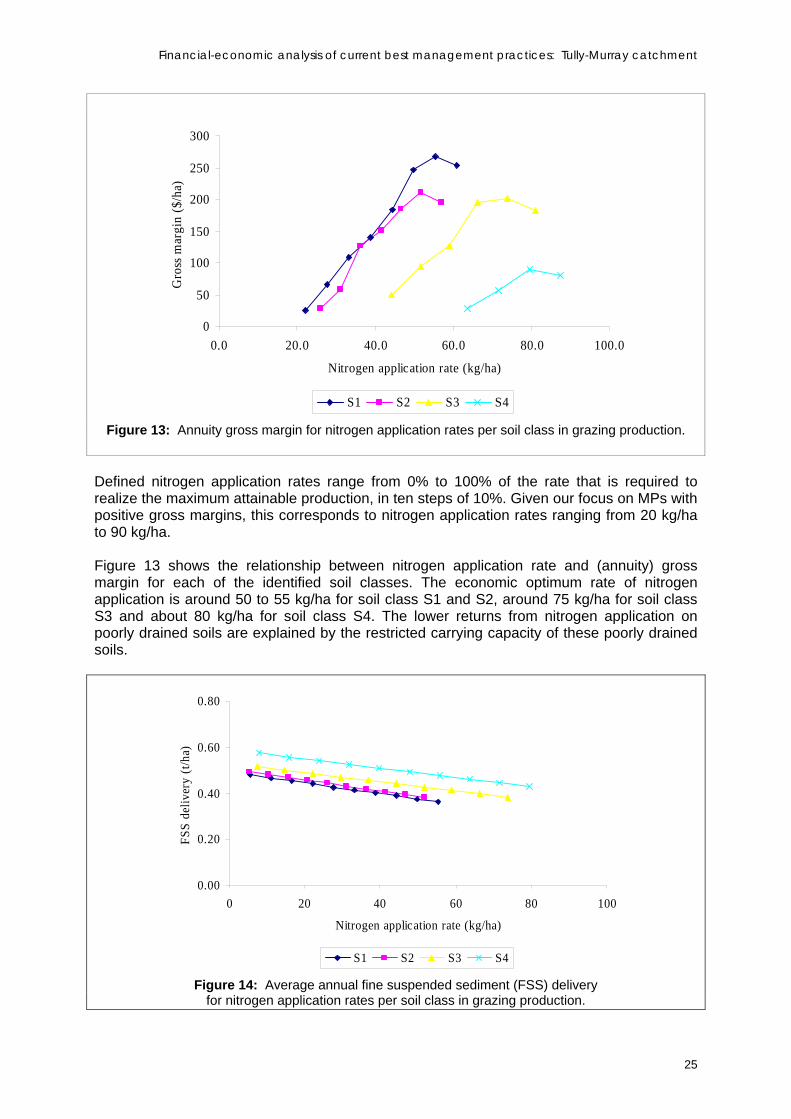
Figure 13: Annuity gross margin for nitrogen application rates per soil class in grazing production.
Defined nitrogen application rates range from 0% to 100% of the rate that is required to realize the maximum attainable production, in ten steps of 10%. Given our focus on MPs with positive gross margins, this corresponds to nitrogen application rates ranging from 20 kg/ha to 90 kg/ha. Figure 13 shows the relationship between nitrogen application rate and (annuity) gross margin for each of the identified soil classes. The economic optimum rate of nitrogen application is around 50 to 55 kg/ha for soil class S1 and S2, around 75 kg/ha for soil class S3 and about 80 kg/ha for soil class S4. The lower returns from nitrogen application on poorly drained soils are explained by the restricted carrying capacity of these poorly drained soils.
0.00
0.20
0.40
0.60
0.80
0 20 40 60 80 100
Nitrogen application rate (kg/ha)
FSS
deliv
ery
(t/ha
)
S1 S2 S3 S4
Figure 14: Average annual fine suspended sediment (FSS) delivery for nitrogen application rates per soil class in grazing production.
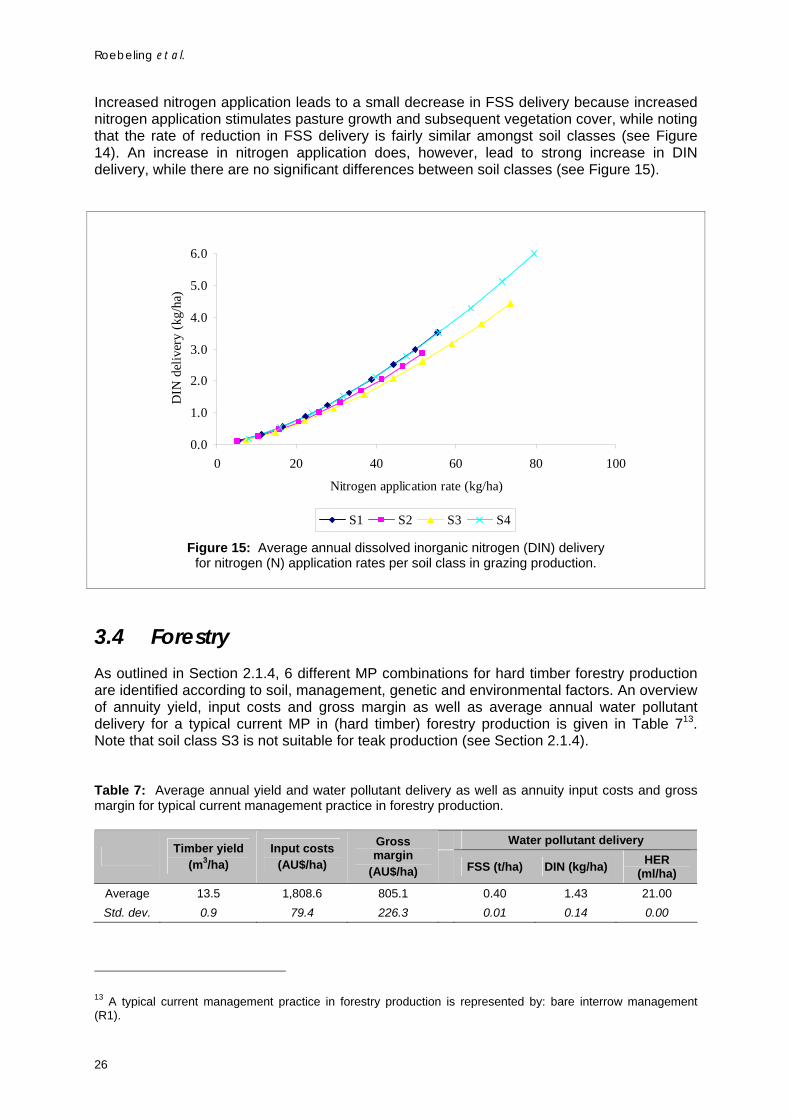
Roebeling et al.
26
Increased nitrogen application leads to a small decrease in FSS delivery because increased nitrogen application stimulates pasture growth and subsequent vegetation cover, while noting that the rate of reduction in FSS delivery is fairly similar amongst soil classes (see Figure 14). An increase in nitrogen application does, however, lead to strong increase in DIN delivery, while there are no significant differences between soil classes (see Figure 15).
0.0
1.0
2.0
3.0
4.0
5.0
6.0
0 20 40 60 80 100
Nitrogen application rate (kg/ha)
DIN
del
iver
y (k
g/ha
)
S1 S2 S3 S4
Figure 15: Average annual dissolved inorganic nitrogen (DIN) delivery for nitrogen (N) application rates per soil class in grazing production.
3.4 Forestry As outlined in Section 2.1.4, 6 different MP combinations for hard timber forestry production are identified according to soil, management, genetic and environmental factors. An overview of annuity yield, input costs and gross margin as well as average annual water pollutant delivery for a typical current MP in (hard timber) forestry production is given in Table 713. Note that soil class S3 is not suitable for teak production (see Section 2.1.4). Table 7: Average annual yield and water pollutant delivery as well as annuity input costs and gross margin for typical current management practice in forestry production.
Water pollutant delivery Timber yield
(m3/ha) Input costs
(AU$/ha)
Gross margin
(AU$/ha) FSS (t/ha) DIN (kg/ha) HER (ml/ha)
Average 13.5 1,808.6 805.1 0.40 1.43 21.00 Std. dev. 0.9 79.4 226.3 0.01 0.14 0.00
13 A typical current management practice in forestry production is represented by: bare interrow management (R1).

Financial-economic analysis of current best management practices: Tully-Murray catchment
27
The simulated average annual timber yield is, at 13.5 m3/ha, about 15% higher than the yields reported by Kashio and White (1998) and, as already mentioned before, can be explained by the fact that we use a crop growth model that simulates potential timber growth. Annuity variable input costs (including variable input and labour costs as well as forestry specific maintenance and depreciation costs) are estimated at around 1,800 AU$/ha and subsequent gross margins at around 800 AU$/ha. Fine suspended sediment (FSS), dissolved inorganic nitrogen (DIN) and persistent herbicide (HER) delivery from forestry production in the Tully-Murray catchment are estimated at around 0.4 t/ha and 1.4 kg/ha and 21 ml/ha, respectively. These figures are consistent with predicted mean annual FSS and DIN delivery values of 0.5 t/ha and 1.4 kg/ha from Hateley et al. (2006). Interrow management Interrow management (i.e. maintaining grassed interrows) in forestry production has been identified as an important practice for water quality improvement (Roebeling and Webster, 2007), increasing ground cover and thus reducing erosion and sediment delivery (Roth and Visser, 2003; Visser, 2003). Table 8: Annuity gross margin and average annual water pollutant delivery for interrow management practices per soil class in forestry production1.
Gross margin (AU$/ha)
Water pollutant delivery
FSS (t/ha) DIN (kg/ha) HER (ml/ha) Soil class R1 R2 R1 R2 R1 R2 R1 R2
S1 1,053.0 1,002.4 0.40 0.39 1.55 1.55 21.00 21.00 S2 880.1 829.5 0.40 0.39 1.25 1.25 21.00 21.00 S3 n.a. n.a. n.a. n.a. n.a. n.a. 21.00 21.00 S4 558.1 507.5 0.41 0.40 1.48 1.48 21.00 21.00
1 Bare (R1) and grassed (R2) interrow. Defined interrow management practices include bare (R1) and grassed (R2) interrows. Under R1 the interrow is maintained through regular non-persistent herbicide application (e.g. Roundup), while under R2 the interrow is maintained through regular slashing. Annuity gross margins and average annual water pollutant deliveries per soil class for these interrow practices are given in Table 8. Results indicate that maintaining grassed, instead of bare, interrows leads to a small decrease in gross margin (between 5% and 10% decrease) given the additional costs of about 50 AU$/ha for maintaining grassed interrows. The adoption of grassed, instead of bare, interrows leads to only a small decrease (3%) in FSS delivery (as ‘bare’ interrows are generally covered in weeds or weed trash blankets) while it has no impact on DIN and HER delivery.

Roebeling et al.
28
4. Climate change and population growth Agricultural industries in the Wet Tropics area of the GBR region in Australia face a number of future challenges, including climate change and population growth (Howden et al. 2006). While many other factors may influence the long term cost-effectiveness of agricultural land use and management options for water quality improvement, these issues are considered of a nature and scale that need to be addressed explicitly.
4.1 Climate change Climate change, generally reflected in higher temperatures, increased CO2 concentrations and altered patterns of rainfall, will have a substantial impact on agricultural production worldwide (IPCC, 2001). The agricultural sector in Australia is considered particularly vulnerable, with potential for negative impacts on the amount and quality of produce, reliability of production, and the environment (Howden et al. 2006). The purpose of this section is not to discuss whether or not climate change will eventuate, but to assess the potential impact of climate change on the cost-effectiveness of best-management-practices (BMPs) for water quality improvement in the Tully-Murray catchment should there be a change in climate. An example is given for sugarcane production.
Table 9: Climate projections for Tully in 2030 and 2070 (source: Cai et al. 2005).
2030 2070 Season
Rainfall Temperature Rainfall Temperature Summer -7% to +13% +0.2°C to +1.6°C -20% to +40% +0.7°C to +4.8°C Autumn -13% to +7% +0.2°C to +1.3°C -40% to +20% +0.7°C to +4.8°C Winter -20% to 0% +0.2°C to +1.3°C -60% to 0% +0.7°C to +4.0°C Spring -20% to 0% +0.2°C to +1.6°C -60% to 0% +0.7°C to +4.8°C
Like before, we use the production system simulation model APSIM and the hydrological model SedNet/ANNEX in combination with cost-benefit analysis, to assess the cost-effectiveness of BMPs in sugarcane production (see Chapter 2). In line with Park et al. (2007), the impact of rainfall, temperature and CO2 changes on input-output data for BMPs in sugarcane production is assessed with APSIM by altering the historic climate data according to the climate change projections for 2030 and 2070 presented in Table 9 (Cai et al. 2005). Climate scenarios are defined for low (#1), average (#2) and high (#3) projections of rainfall (R#) and temperature (T#), with atmospheric CO2 concentrations of 437 ppm in 2030 and 610 ppm in 2070 (IPCC, 2001), thus resulting in 9 climate scenarios for 2030 and 9 climate scenarios for 2070. For the BMP cost-effectiveness analysis we will look at plot level annuity gross margin (in AU$/ha/yr) and average annual water pollutant delivery (in t, kg or ml per ha/yr), comparing baseline values (Base; see Chapter 3) with values for the least (R1T3) and most (R3T1) favourable 2070 climate scenarios. Tillage management Baseline climate and 2070 climate scenario results for actual, minimum and zero tillage management practices, are provided in Table 10. Under the least favourable 2070 climate scenario (R1T3), and as compared to the baseline climate scenario, we can observe a 20% decrease in gross margin due to reduced yield potentials, while dissolved inorganic nitrogen (DIN) delivery increases with almost 20% as a result of reduced cane growth. There is no significant change in fine suspended sediment (FSS) delivery. Reduced and zero tillage remain equally cost-effective in managing FSS delivery, leading to a significant decrease in FSS delivery and a small increase in gross margin.

Financial-economic analysis of current best management practices: Tully-Murray catchment
29
Table 10: Base and 2070 climate scenarios’ annuity gross margin and average annual water pollutant delivery for tillage management practices in sugarcane production1,2.
Gross margin (AU$/ha) Water pollutant delivery FSS (t/ha) DIN (kg/ha)
Base R1T3 R3T1 Base R1T3 R3T1 Base R1T3 R3T1
TL1 1,164.0 933.2 1,254.1 0.78 0.79 0.78 32.72 38.87 31.27 TL2 1,181.7 934.3 1,255.9 0.74 0.74 0.74 32.70 38.82 31.25 TL3 1,192.3 940.3 1,257.9 0.54 0.55 0.54 32.65 38.95 31.22
1 Actual (TL1), minimum (TL2) and zero (TL3) tillage. 2 Baseline climate (Base), and 2070 least favourable (R1T3) and most favourable (R3T1) climate scenarios. Under the most favourable 2070 climate scenario (R3T1), we see an almost 10% increase in gross margin (due to enhanced yield potentials) and a less than 5% decrease in DIN delivery (due to increased cane growth). Again, there is no significant change in FSS delivery while tillage management remains equally cost-effective in managing FSS delivery. Fallow management In Table 11, baseline climate and 2070 climate scenario results are presented for bare and legume fallow management practices. Under the least favourable 2070 climate scenario (R1T3) we see an almost 20% decrease in gross margin (due to reduced yield potentials), an almost 20% increase in DIN delivery and no significant change in FSS delivery. Compared to a bare fallow, the legume fallow still results in slightly higher gross margins as well as levels of DIN delivery. Table 11: Base and 2070 climate scenarios’ annuity gross margin and average annual water pollutant delivery for fallow management practices in sugarcane production1,2.
Gross margin (AU$/ha) Water pollutant delivery FSS (t/ha) DIN (kg/ha)
Base R1T3 R3T1 Base R1T3 R3T1 Base R1T3 R3T1
F1 1,154.5 921.0 1,230.8 0.69 0.70 0.69 30.14 36.01 28.75 F2 1,204.2 950.9 1,281.1 0.69 0.70 0.69 35.24 41.74 33.75
1 Bare (F1) and legume (F2) fallow. 2 Baseline climate (Base), and 2070 least favourable (R1T3) and most favourable (R3T1) climate scenarios. Under the most favourable 2070 climate scenario (R3T1), gross margin increases with just over 5% due to enhanced yield potentials and, as a result, we see a less than 5% decrease in DIN delivery. Again, there is no significant change in FSS delivery. Nitrogen application rate Figure 16 provides baseline climate and 2070 climate scenario results for six nitrogen application rates and the nitrogen replacement concept. The vertical bars represent the range of results from the simulations for all of the modelled climate scenarios. Under the least favourable 2070 climate scenario (R1T3) we see, like before, a 20% decrease in gross margin, a 20% increase in DIN delivery and no significant change in FSS delivery. Reduced nitrogen application and, in particular, nitrogen replacement remain cost-effective in managing DIN delivery, leading to a significant decrease in DIN delivery at a small increase in gross margin.
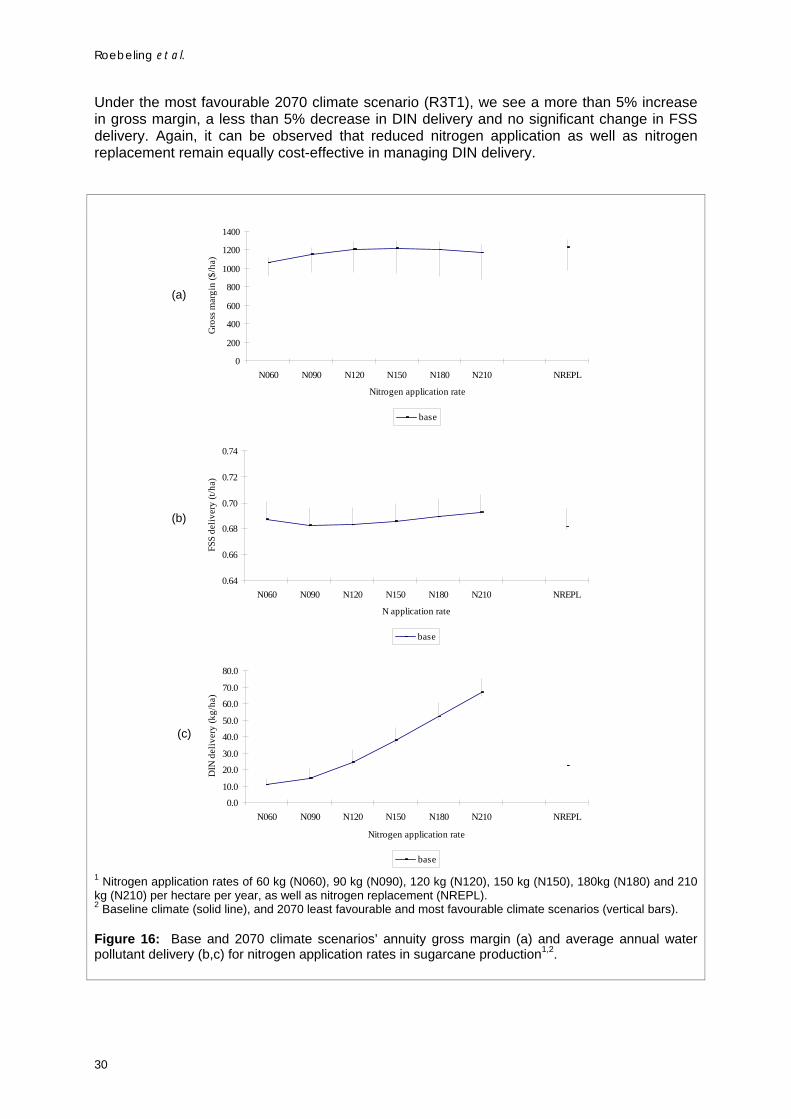
Roebeling et al.
30
Under the most favourable 2070 climate scenario (R3T1), we see a more than 5% increase in gross margin, a less than 5% decrease in DIN delivery and no significant change in FSS delivery. Again, it can be observed that reduced nitrogen application as well as nitrogen replacement remain equally cost-effective in managing DIN delivery.
0
200
400
600
800
1000
1200
1400
N060 N090 N120 N150 N180 N210 NREPL
Nitrogen application rate
Gro
ss m
argi
n ($
/ha)
base
0.64
0.66
0.68
0.70
0.72
0.74
N060 N090 N120 N150 N180 N210 NREPL
N application rate
FSS
deliv
ery
(t/ha
)
base
0.0
10.0
20.0
30.0
40.0
50.0
60.0
70.0
80.0
N060 N090 N120 N150 N180 N210 NREPL
Nitrogen application rate
DIN
del
iver
y (k
g/ha
)
base 1 Nitrogen application rates of 60 kg (N060), 90 kg (N090), 120 kg (N120), 150 kg (N150), 180kg (N180) and 210
kg (N210) per hectare per year, as well as nitrogen replacement (NREPL). 2 Baseline climate (solid line), and 2070 least favourable and most favourable climate scenarios (vertical bars). Figure 16: Base and 2070 climate scenarios’ annuity gross margin (a) and average annual water pollutant delivery (b,c) for nitrogen application rates in sugarcane production1,2.
(a)
(b)
(c)

Financial-economic analysis of current best management practices: Tully-Murray catchment
31
Nitrogen application method Table 12 presents baseline climate and the minimum and maximum 2070 climate scenario results for single and split nitrogen application methods. Under the least favourable 2070 climate scenario (R1T3) we see an almost 20% decrease in gross margin, a 20% increase in DIN delivery and no significant change in FSS delivery. As compared to single nitrogen application, split nitrogen application remains equally cost-effective in managing DIN delivery – leading to only a small decrease in DIN delivery at no additional costs. Table 12: Base and 2070 climate scenarios’ annuity gross margin and average annual water pollutant delivery for nitrogen application methods in sugarcane production1,2.
Gross margin (AU$/ha) Water pollutant delivery FSS (t/ha) DIN (kg/ha)
Base R1T3 R3T1 Base R1T3 R3T1 Base R1T3 R3T1
NA1 1,178.3 945.2 1,253.6 0.69 0.70 0.69 33.01 39.00 31.59 NA2 1,180.4 926.6 1,258.3 0.69 0.70 0.69 32.38 38.75 30.90
1 Single (NA1) and split (NA2) nitrogen application. 2 Baseline climate (Base), and 2070 least favourable (R1T3) and most favourable (R3T1) climate scenarios. Under the most favourable 2070 climate scenario (R3T1) we see a 5% increase in gross margin, a 5% decrease in DIN delivery and, again, no significant changes in FSS delivery. Split nitrogen application remains equally cost-effective in managing DIN delivery.
4.2 Population growth Population growth in the GBR region is amongst the highest in Australia, the agricultural sector thus experiencing land use pressures while associated residential developments are expected to lead to a decline in water quality (Zipperer et al. 2000). Although residential development does not influence the plot-level cost-effectiveness of land use and management options, it does influence the location and the extent to which these can be implemented (given the conversion from agricultural to residential land use) and may also lead to significant agricultural land use changes (e.g. closing down of sugar mills due to insufficient feedstock). The net effect of population growth on water pollution and the potential for water quality improvement thus depends on the type of water pollution, the land use specific water quality characteristics and the population growth induced land use change patterns. In a recent paper by Roebeling et al. (2007), a classic urban economic model with environmental amenities (see for example Wu, 2006) is used to explore land use patterns for a range of catchment population growth scenarios which they, in turn, relate back to terrestrial benefits, associated water pollution and subsequent marine costs to explore welfare gains that can be obtained from population growth in a linked terrestrial and marine ecosystem (see Appendix 1 for a detailed description of the methodology). Generated population size specific land use patterns for a case study of the Douglas Shire (see Figure 17) indicate that: i) residential development first takes place near urban centres (Mossman and Port Douglas), waterways (ocean and river) and hillside areas (forest), ii) the rate of land use conversion is increasing in population size, and iii) the rate of nitrogen water pollution is increasing in population size. Based on these findings and assuming that water pollution from residential land uses exceeds water pollution from the agricultural land uses it replaces, it can be expected that: i)

Roebeling et al.
32
water pollution increases with population size at an increasing rate, and ii) the potential for water quality improvement through BMP adoption in agricultural land uses is reduced due to population growth induced residential development. Hence, to attain and maintain water quality targets under population growth it is crucial to be able to implement BMPs for agricultural land uses as well as for residential land uses. Alternatively, population growth and associated residential development may be constrained and is shown to provide welfare gains in case downstream costs from water pollution are taken into account Roebeling et al. (2007).
Figure 17: Terrestrial benefit maximizing land use patterns in Douglas Shire for three catchment population scenarios Qt (source: Roebeling et al. 2007).
Qt = 12,000 Qt = 26,000 Qt = 55,000
Forest Ocean Sugarcane Grazing River Residential Wetland
Port Douglas
Mossman
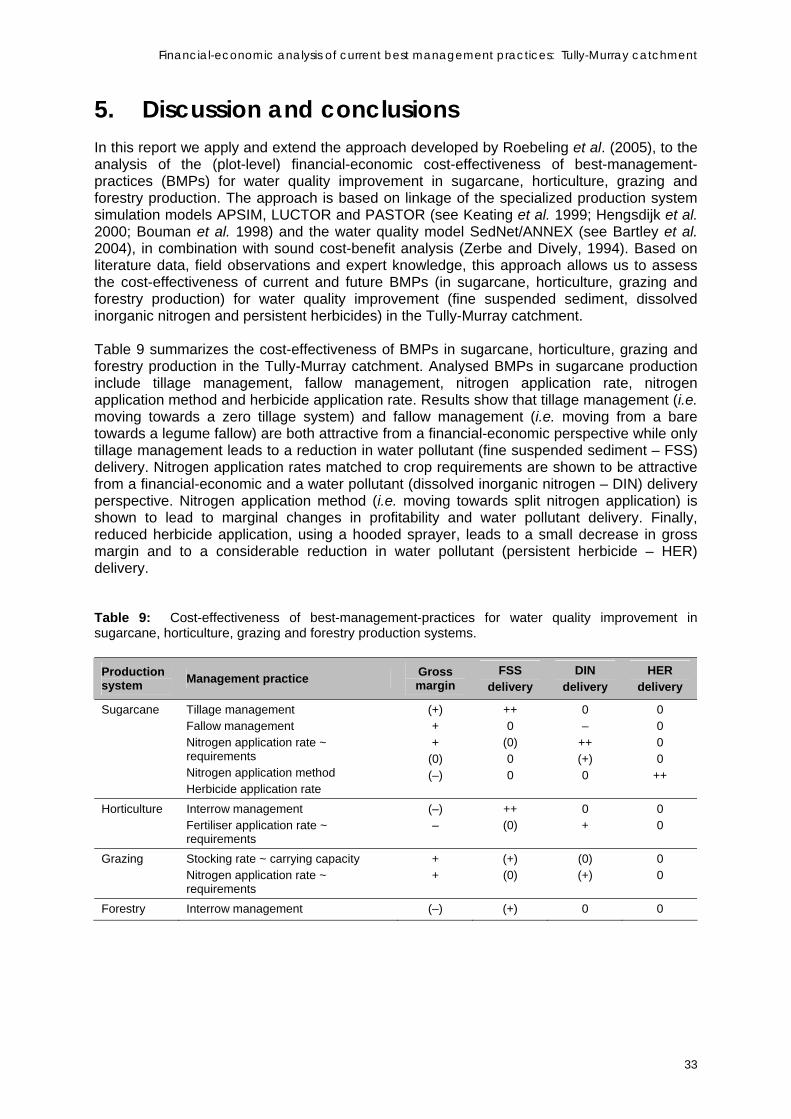
Financial-economic analysis of current best management practices: Tully-Murray catchment
33
5. Discussion and conclusions In this report we apply and extend the approach developed by Roebeling et al. (2005), to the analysis of the (plot-level) financial-economic cost-effectiveness of best-management-practices (BMPs) for water quality improvement in sugarcane, horticulture, grazing and forestry production. The approach is based on linkage of the specialized production system simulation models APSIM, LUCTOR and PASTOR (see Keating et al. 1999; Hengsdijk et al. 2000; Bouman et al. 1998) and the water quality model SedNet/ANNEX (see Bartley et al. 2004), in combination with sound cost-benefit analysis (Zerbe and Dively, 1994). Based on literature data, field observations and expert knowledge, this approach allows us to assess the cost-effectiveness of current and future BMPs (in sugarcane, horticulture, grazing and forestry production) for water quality improvement (fine suspended sediment, dissolved inorganic nitrogen and persistent herbicides) in the Tully-Murray catchment. Table 9 summarizes the cost-effectiveness of BMPs in sugarcane, horticulture, grazing and forestry production in the Tully-Murray catchment. Analysed BMPs in sugarcane production include tillage management, fallow management, nitrogen application rate, nitrogen application method and herbicide application rate. Results show that tillage management (i.e. moving towards a zero tillage system) and fallow management (i.e. moving from a bare towards a legume fallow) are both attractive from a financial-economic perspective while only tillage management leads to a reduction in water pollutant (fine suspended sediment – FSS) delivery. Nitrogen application rates matched to crop requirements are shown to be attractive from a financial-economic and a water pollutant (dissolved inorganic nitrogen – DIN) delivery perspective. Nitrogen application method (i.e. moving towards split nitrogen application) is shown to lead to marginal changes in profitability and water pollutant delivery. Finally, reduced herbicide application, using a hooded sprayer, leads to a small decrease in gross margin and to a considerable reduction in water pollutant (persistent herbicide – HER) delivery. Table 9: Cost-effectiveness of best-management-practices for water quality improvement in sugarcane, horticulture, grazing and forestry production systems.
Production system Management practice Gross
margin FSS
delivery DIN
delivery HER
delivery
Sugarcane Tillage management Fallow management Nitrogen application rate ~ requirements Nitrogen application method Herbicide application rate
(+) + +
(0) (–)
++ 0
(0) 0 0
0 –
++ (+) 0
0 0 0 0
++
Horticulture Interrow management Fertiliser application rate ~ requirements
(–) –
++ (0)
0 +
0 0
Grazing Stocking rate ~ carrying capacity Nitrogen application rate ~ requirements
+ +
(+) (0)
(0) (+)
0 0
Forestry Interrow management (–) (+) 0 0
Roebeling et al.
34
Analysed BMPs in (banana) horticulture production include interrow management and fertiliser application rate. Results show that interrow management (i.e. maintaining grassed interrows) leads to a considerable reduction in water pollutant (FSS) delivery though also to a small reduction in profitability. Reduced fertiliser application rates lead to a decrease in water pollutant (DIN) delivery and gross margins, unless efficiency gains can be made through re-composition of N, P and K ratios. Analysed BMPs in grazing production include stocking rate and nitrogen application rate. Stocking rates matched to pasture carrying capacity are shown to lead to a small reduction in water pollutant (FSS) delivery as well as an increase in profitability. Nitrogen application rates matched to pasture requirements are shown to be attractive from a financial-economic perspective and lead to small reductions in water pollutant (DIN) delivery. Finally, the analysed BMP in (hard timber) forestry production involves interrow management (i.e. maintaining grassed interrows), which leads to a small reduction in water pollutant (FSS) delivery and gross margins. Thus, most of the assessed BMPs lead to a reduction in water pollutant delivery while either providing a financial-economic benefit or coming at a small financial-economic cost. Options for cost-effective water quality improvement are largest in sugarcane and (banana) horticulture production, including BMPs like tillage management, nitrogen application rate and herbicide application rate in sugarcane production, and interrow management in (banana) horticulture production. Options for cost-effective water quality improvement in grazing and forestry production are limited. The impact of climate change on BMP cost-effectiveness and attainment of water quality targets has been assessed for an example of the sugar industry. Results indicate that BMP cost-effectiveness is generally not affected by climate change – i.e. BMPs remain proportionally equally effective in reducing water pollutant delivery. Levels of water pollutant (DIN) delivery may, however, increase significantly under climate change projections for 2070 (up to 20% increase in DIN delivery), thus potentially jeopardizing the attainment of water quality targets. The impact of population growth on the attainment of water quality targets has been assessed based on a study in the Douglas Shire. In case water pollution from residential land uses exceeds water pollution from the land uses it replaces, it can be expected that: i) water pollution increases with population size at an increasing rate, and ii) the potential for water quality improvement through BMP adoption in agriculture is reduced due to residential development. Consequently, attaining water quality targets under population growth requires implementation of BMPs for agricultural as well as residential land uses. Alternatively, population growth and associated residential development may need to be constrained. A number of caveats to this study must be mentioned. First, this BMP cost-effectiveness assessment is a plot-level study and, consequently, does not include costs associated with BMP implementation at the farm and community level. While production technologies may be cost-effective at the plot level, they may not be at the farm or community level due to, for example, labour or capital constraints, market (Sadoulet and De Janvry, 1995). Second, we can conclude that not all of the used production system simulation models are equally suited for BMP cost-effectiveness assessment. As compared to LUCTOR (Hengsdijk et al. 2000) and PASTOR (Bouman et al. 1998), APSIM (Keating et al. 1999) resulted to be best suited as it contains the most sophisticated routines for the calculation of C-factors and DIN concentrations (which are used in the calculation of water pollutant run-off and delivery using SedNet/ANNEX – see Bartley et al. 2004) while it also allows for the assessment of the largest range of current and future BMPs. Third, persistent herbicide (HER) delivery calculations are fairly simplistic (i.e. fixed share of persistent herbicide application) as there is no hydrological module available in SedNet/ANNEX that accurately describes the relationship between plot level persistent herbicide concentrations and persistent herbicide delivery (Lewis et al. 2006). Finally, it must be noted that the figures in this document are

Financial-economic analysis of current best management practices: Tully-Murray catchment
35
generated for the Tully-Murray catchment and, consequently, care should be taken when transferring these figures to other catchments. This not only holds for yield, input cost and gross margin figures, which are dependent on locally specific bio-physical and socio-economic conditions, but also for water pollutant delivery figures, which are dependent on locally specific bio-physical conditions and land use patterns.

Roebeling et al.
36
6. References Bartley, R. A. Henderson, I.P. Prosser, A.O. Hughes, L. McKergow, H. Lu, J. Brodie, Z. Bainbridge and C.H. Roth, 2003. Patterns of erosion and sediment and nutrient transport in the Herbert river catchment, Queensland. CSIRO Land and Water Report, Atherton, Australia. 56 pp.
Bartley, R., A. Henderson, G. Baker, M. Bormans and S. Wilkinson, 2004. Patterns of erosion and sediment nutrient transport in the Douglas Shire catchments (Daintree, Saltwater, Mossman and Mowbray), Queensland. CSIRO Land and Water Client Report, Atherton, Australia. 61pp.
Bell, M.J., N.V. Halpin, A.L. Garside, P.W. Moody, G.R. Stirling and B.J. Robotham, 2003. Evaluating combinations of fallow management, controlled traffic and tillage options in prototype sugarcane farming systems at Bundaberg. Proceedings Australian Society of Sugar Cane Technologists 25: p. 17.
Bouman, B.A.M., A. Nieuwenhuyse and H. Hengsdijk, 1998. PASTOR: a technical coefficient generator for pasture and livestock systems in the humid tropics, version 2.0. Quantitative Approaches in Systems Analysis No.18. AB-DLO/C.T. de Wit Graduate school for Production Ecology. Wageningen, The Netherlands. 59 pp., plus appendices.
Bureau of Rural Sciences (BRS), 1999. Silviculture, management and infrastructure requirements for hardwood plantations in South-East Queensland. Bureau of Rural Sciences (BRS) and Australian Bureau of Agricultural and Resource Economics (ABARE), Canberra, Australia. 69 pp.
Brodie, J., L.A. McKergow, I.P. Prosser, M. Furnas, A.O. Hughes and H. Hunter, 2003. Sources of sediment and nutrient exports to the Great Barrier Reef World Heritage Area, Australian Centre for Tropical Freshwater Research (ACTFR), Townsville, 2003. 192 pp.
Cai, W., S. Crimp, R. Jones, K. McInnes, P. Durack, B. Cechet, J. Bathols and S. Wilkinson, 2005. Climate change in Queensland under enhanced greenhouse conditions. Report 2004-2005. CSIRO Marine and Atmospheric Research, Aspendale.
Cattan, P., Y.M. Cabidoche, J.G. Lacas and M. Voltz, 2006. Effects of tillage and mulching on runoff under banana (Musa spp.) on a tropical Andosol. Soil & Tillage Research 86: 38-51.
Chapman, L.S., 1994. Fertiliser N management in Australia. Proceedings Australian Society of Sugarcane Technology 16: 83-92.
DeRose, R.C., I.P. Prosser, L.J. Wilkinson, A.O. Hughes and W.J. Young, 2002. Regional patterns of erosion and sediment and nutrient transport in the Mary river catchment, Queensland. CSIRO Land and Water Technical Report 37/02, Canberra, Australia.
DeRose, R.C., I.P. Prosser, L.J. Wilkinson, A.O. Hughes and W.J. Young, 2003. Regional patterns of erosion and sediment and nutrient transport in the Goulburn and Broken river catchments, Victoria. CSIRO Land and Water Technical Report 11/03, Canberra, Australia.
FAOSTAT, 2006. FAO statistical database. Food and Agricultural Organization (FAO). Downloaded: http://faostat.fao.org/site/336/default.aspx, October 2006.
Financial-economic analysis of current best management practices: Tully-Murray catchment
37
Garside, A.L., A.D. Noble, J.E. Berthelsen and C.L. Richards, 1998. Fallow histories: Effects on nitrogen contribution, growth and yield of plant and ratoon crops of sugarcane. Proceedings Australian Sugarcane Technology 20: 104-111.
Garside, A.L., 2004. Potential impact on water quality of sugar yield decline joint venture research and development program. Page 31 in: Robertson, L.N. and R.J. Troedson (Eds) Cane farming to improve water quality. SRDC Technical Report 1/2004, Brisbane, Australia. 40pp.
Green, P.G. and T.M. Young, 2006. Loading of the herbicide diuron into the California water system. Environmental Engineering Science. 23:545-551.
Hamill, S., 2005. Biotechnology and the Australian banana industry: a successful partnership! Pages 120-122 in: Proceedings of the High Flyers Think Tank: Biotechnology and the Future of Australian Agriculture. Canberra, Australia.
Hateley, L., J. Armour, G. Pitt, A.L. Cogle, B. Sherman, A. Read, Y. Chen and J. Brodie, 2006. Sediment and nutrient modelling in Far North Queensland. Department of Natural Resources and Mines (DNR&M), Mareeba, Australia. 34 pp.
Hengsdijk, H., A. Nieuwenhuyse and B.A.M. Bouman, 1998. LUCTOR: Land crop technical coefficient generator. A model to quantify cropping systems in the northern Atlantic Zone of Costa Rica. Version 2.0. Quantitative Approaches in Systems Analysis No.17. AB-DLO/C.T. de Wit Graduate School for Production Ecology. Wageningen, The Netherlands. 65 pp., plus appendices.
Hengsdijk, H., B.A.M. Bouman, A. Nieuwenhuyse, R.A. Schipper and J. Bessembinder, 2000. Technical coefficient generators for quantifying land use systems. Pages 97-114 in: Bouman, B.A.M., H.G.P. Jansen, R.A. Schipper, H. Hengsdijk and A. Nieuwenhuyse (Eds) Tools for land use analysis on differrent scales: With case studies for Costa Rica. Kluwer Academic Publishers, Dordrecht, The Netherlands. 274 pp.
Howden, S.M., P.R. Brown, P.J. Thorburn, R.G.V. Bramley, P.C. Roebeling, G. McDonald, S.P. Park, A.J. Higgins, R. Nelson and B.L. Keating, 2006. Challenges facing a sustainable sugar industry in Australia’s future. Discussion paper on future farming for the Sugar Research and Development Corporation (SRDC). CSIRO Sustainable Ecosystems, Canberra. 24 pp.
IPCC, 2001. Climate change 2001: impacts, adaptation and vulnerability. Contribution of Working Group II to the 3rd Assessment report of the Intergovernmental Panel on Climate Change (IPCC). Cambridge University Press.
ITTO, 2004. Annual review and assessment of the world timber situation 1997-2002. International Tropical Timber Organization (ITTO). Download: http://www.itto.or.jp/live/PageDisplayHandler ?pageId=199, September 2004.
Jackson, P., G. Bonnett, M. Hogarth, P. Chudleigh, A. Wood and W. Massey, 1999. Whole of industry economic evaluation of new varieties. SRDC Project CTA041, Australia. 47 pp.
Kashio, M. and K. White, 1998. Teak for the future – proceedings of the second regional seminar on teak. Food and Agricultural Organization (FAO), TEAKNET Publication no.1, Bangkok, Thailand. 248 pp.
Kaya, Y. and K. Yokobori, 1997. Environment, energy and economy: Strategies for sustainability. United Nation University Press, New York, USA.

Roebeling et al.
38
Keating, B.A., K. Verburg, N.I. Hurth and M.J. Robertson, 1997. Nitrogen management in intensive agriculture: Sugarcane in Australia. Pages 221-242 in: Keating, B.A. and J.R. Wilson (Eds) Intensive sugarcane production: Meeting the challenges beyond 2000. CAB International Wallingford. 531 pp.
Keating, B.A., M.J. Robertson, R.C. Muchow and N.I. Huth, 1999. Modelling sugarcane production systems I. Development and performance of the sugarcane module. Field Crops Research 61: 253-271.
Keating, B.A., P.S. Carberry, G.L. Hammer, M.E. Probert, M.J. Robertson, D. Holzworth, N.I. Huth, J.N.G. Hargreaves, H. Meinke, Z. Hochman, G. McLean, K. Verburg, V. Snow, J.P. Dimes, M. Silburn, E. Wang, S. Brown, K.L. Bristow, S. Asseng, S. Chapman, R.L. McCown, D.M. Freebairn and C.J. Smith, 2003. An overview of APSIM, a model for farming systems simulation. European Journal of Agronomy 18: 267-288.
Lewis, S., J. Brodie and E. Ledee, 2006. The spatial extent of delivery of terrestrial materials from the Mackay Whitsunday region in the Great Barrier Reef lagoon. Australian Centre for Tropical Freshwater Research (ACTFR) Report 06/14. 76 pp.
Lindsay, S., C. Lemin, D. Campagnolo, T. Pattison, J. Daniells, R. Peterson, D. Evans, B. Pinese, R. Goubel, D. Wharton, M. Gunther, I. Kernot, 1998. Agrilink manual – tropical banana information kit. Department of Primary Industries and Fisheries (DPI&F), Nambour, Australia. 38 pp.
Mitchell, A., J. Reghenzani, M. Furnas, G. De’ath, J. Brodie and S. Lewis, 2007. Nutrients and suspended sediments in the Tully River: Spatial and temporal trends. ACTFR report No. 06/06 for Far North Queensland NRM Ltd., Australian Centre for Tropical Freshwater Research (ACTFR), James Cook University, Townsville and the Australian Institute of Marine Science, Townsville. 115pp.
Murtha, G.G. and C.D. Smith, 1994. Key to the soils and land suitability of the wet tropical coast: Cardwell – Cape Tribulation. CSIRO Division of Soils and Queensland Department of Primary Industries.
Park, S.P., S.M. Howden, A. Higgins, D. McRae, H. Horan and K. Hennessy, 2007. Climate change: informing the Australian sugar industry on potential impacts, possible strategies for adaptation and best-bet option for future R&D. Report to SRDC, CSIRO Sustainable Ecosystems, Toowoomba.
Prosser, I., A. Hughes, P. Rustomji and C. Moran, 2001a. Predictions of the sediment regime of Australian rivers. Pages 529-533 in: Rutherfurd, I., G. Brierley, S. Bunn, F. Sheldon and C. Kenyon (Eds) The proceedings of the third Australian stream management conference. Cooperative Research Centre for Catchment Hydrology, Melbourne, Australia.
Prosser, I., B. Young, P. Rustomji, C. Moran and A. Hughes, 2001b. Constructing river basin sediment budgets for the national land and water resources audit. CSIRO Land and Water Technical Report 15/01, Canberra, Australia.
Queensland Sugar Limited, 2006. Queensland sugar annual 2005. Berekua Pty. Ltd, Brisbane, Australia. 85 pp.
Robertson M.J., B.A. Keating and R.C. Muchow, 1995. APSIM-sugar: Its history, conceptual basis, uses and wider applications. Pages 35-42 in: Roberston, M.J. (Ed.) Research and modelling approaches to assess sugarcane production opportunities and constraints.

Financial-economic analysis of current best management practices: Tully-Murray catchment
39
Proceedings of workshop organized by CSIRO Tropical Crops and Pastures, Brisbane, Australia. 144 pp.
Roebeling, P.C., D.M. Smith, J. Biggs, A.J. Webster and P. Thorburn, 2005. Private-economic analysis of drivers promoting the adoption of best management practices for water quality improvement in the Douglas Shire: Report on the cost-effectiveness of BMP implementation for water quality improvement. Report prepared for the Douglas Shire Water Quality Improvement Program, CSIRO-Sustainable Ecosystems, Townsville, Australia. 95 pp.
Roebeling, P.C. and A.J. Webster, 2007. Review of current and future best-management-practices for sugarcane, horticulture, grazing and forestry industries in the Tully-Murray catchment. Report to FNQ-NRM Ltd, CSIRO Sustainable Ecosystems, Townsville, Australia. 58 pp.
Roebeling, P.C., C.S. Fletcher, D.W. Hilbert and J. Udo, 2007. Welfare gains from urbanizing landscapes in Great Barrier Reef catchments? A spatial environmental-economic modelling approach. Pages 737-749 in: Kongulas, A., C.A. Brebbia and E. Beriatos (Eds) Sustainable development and planning III – Volume 2. WIT Press, Southampton, UK. 1062 pp.
Roth, C.H. and F. Visser, 2003. Quantifying and managing sources of sediments and nutrients on low-lying canelands. CSIRO Land and Water Technical Report No. 52/03, Townsville, Australia. 40 pp.
Sadoulet, S., and A. De Janvry, 1995. Quantitative development policy analysis. The Johns Hopkins University Press, Baltimore, USA. 397 pp.
Schipper, R.A., B.A.M. Bouman, H.G.P. Jansen, H. Hengsdijk and A. Nieuwenhuyse, 2000. Integrated biophysical and socio-economic analysis of regional land use. Pages 115-144 in: Bouman, B.A.M., H.G.P. Jansen, R.A. Schipper, H. Hengsdijk and A. Nieuwenhuyse (Eds) Tools for land use analysis on differrent scales: With case studies for Costa Rica. Kluwer Academic Publishers, Dordrecht, The Netherlands. 274 pp.
SILO, 2006. Website: http://www.bom.gov.au/silo/.
Sing, N., 2003. Increasing profitability with new farming systems. Australian Sugarcane 12/2003: 17-19.
Teitzel, J.K., 1992. Sustainable pasture systems in the humid tropics of Queensland. Tropical Grasslands 26: 196-205.
Thorburn, P.J., S.E. Park and I.M. Biggs, 2003. Nitrogen fertiliser management in the Australian sugar industry: Strategic opportunities for improved efficiency. Proceedings ASSCT 25: 12pp.
Thorburn, P.J., 2004. Influences of N fertiliser management practices on off-site loss of water contaminants. Pages 32-34 in: Robertson, L.N. and R.J. Troedson (Eds) Cane farming to improve water quality. SRDC Technical Report 1/2004, Brisbane, Australia. 40pp.
Thorburn, P.J., A.J. Webster, I.M. Biggs, J.S. Biggs, S.E. Park and M.F. Spillman, 2007. Towards innovative management of nitrogen fertiliser for a sustainable sugar industry. Proceedings Australian Society of Sugar Cane Technologists 25: 85-96.
Visser, F., 2003. Sediment budget for cane land on the lower Herbert river floodplain, North Queensland, Australia. Ph.D. thesis, The Australian National University, Canberra, Australia. 294 pp.
Roebeling et al.
40
Wilkinson, S., A. Henderson and Y. Chen, 2004. SedNet user guide. Version 1.0.0. Client report for the cooperative research centre for catchment hydrology. CSIRO Land and Water, Canberra, Australia. 76 pp.
World Bank, 1999. World development indicators. CD-ROM.
Wu, J., 2006. Environmental amenities, urban sprawl, and community characteristics. Journal of Environmental Economics and Management 52: 527-547.
Young, W. J., P. Rustomji, A.O. Hughes, and D. Wilkins, 2001. Regionalisations of flow variables used in modelling riverine material transport in the National Land and Water Resources Audit. Canberra, CSIRO Land and Water. http://www.clw.csiro.au/publications/technical2001/tr36-01.pdf.
Zerbe, R.O. and D.D. Dively, 1994. Benefit-cost analysis in theory and practice. Harper Collins College Publishers, New York, USA. 557 pp.
Zipperer, W.C., J. Wu, R.V. Pouyat and S.T.A. Pickett, 2000. The application of ecological principles to urban and urbanizing landscapes. Ecological Applications 10(3): 685-688.

Financial-economic analysis of current best management practices: Tully-Murray catchment
41
Appendix 1 Welfare gains from urbanising landscapes in Great Barrier Reef Catchments? A spatial environmental-economic modelling approach
P. C. Roebeling, C. S. Fletcher, D. W. Hilbert and J. Udo
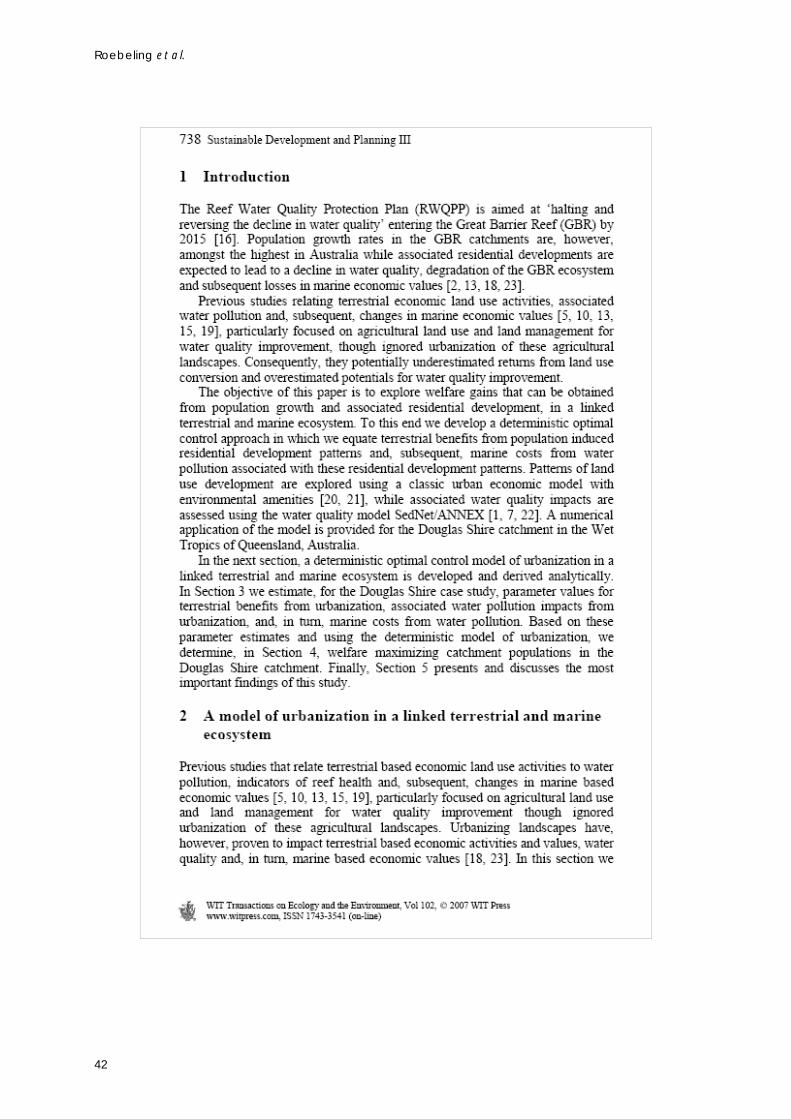
Roebeling et al.
42
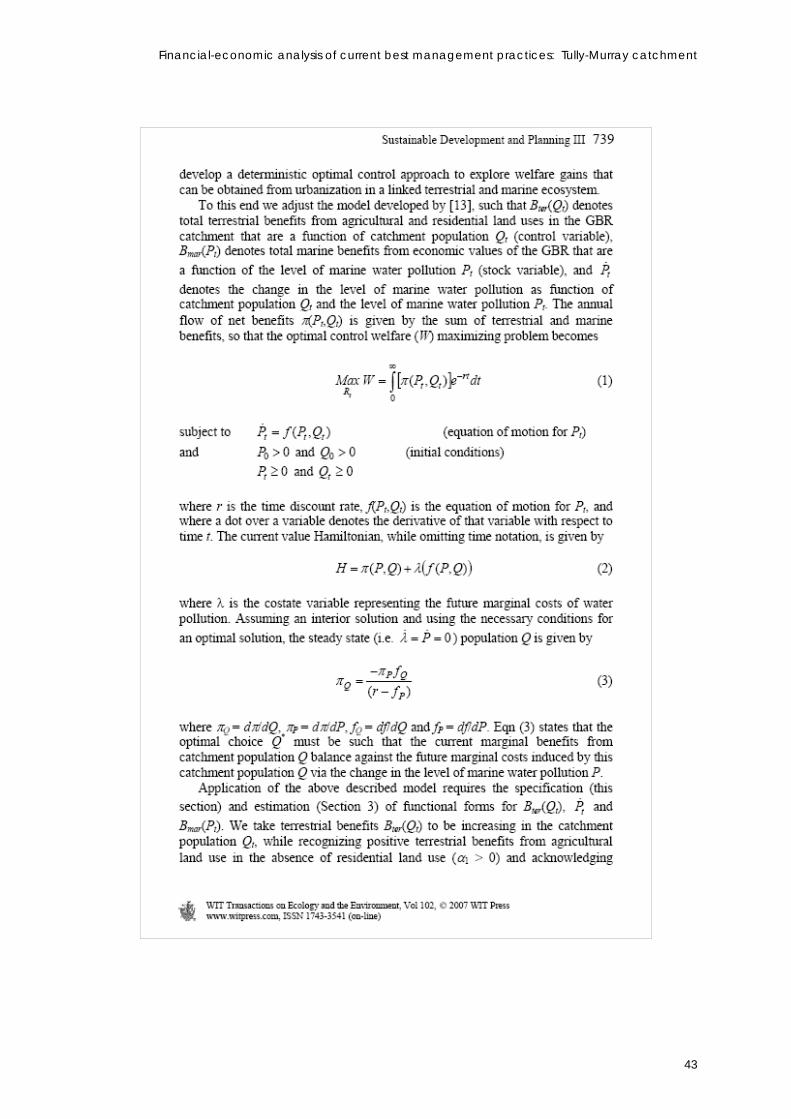
Financial-economic analysis of current best management practices: Tully-Murray catchment
43
Roebeling et al.
44
Financial-economic analysis of current best management practices: Tully-Murray catchment
45
Roebeling et al.
46
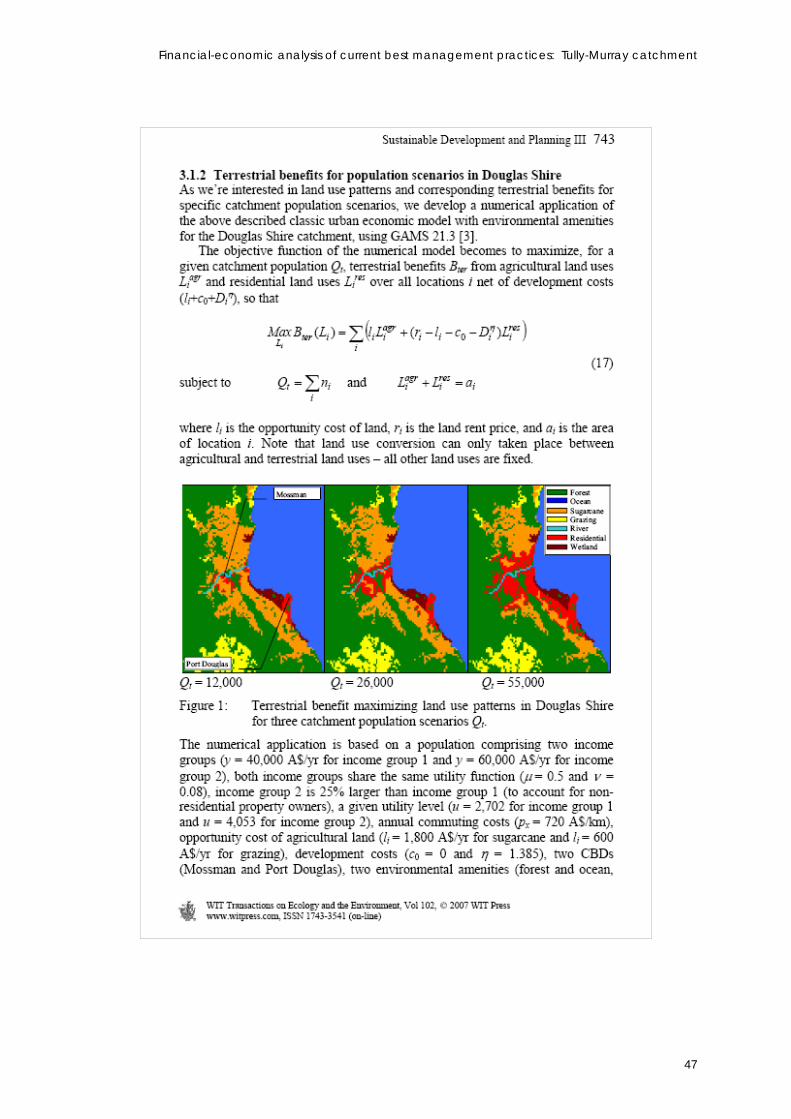
Financial-economic analysis of current best management practices: Tully-Murray catchment
47
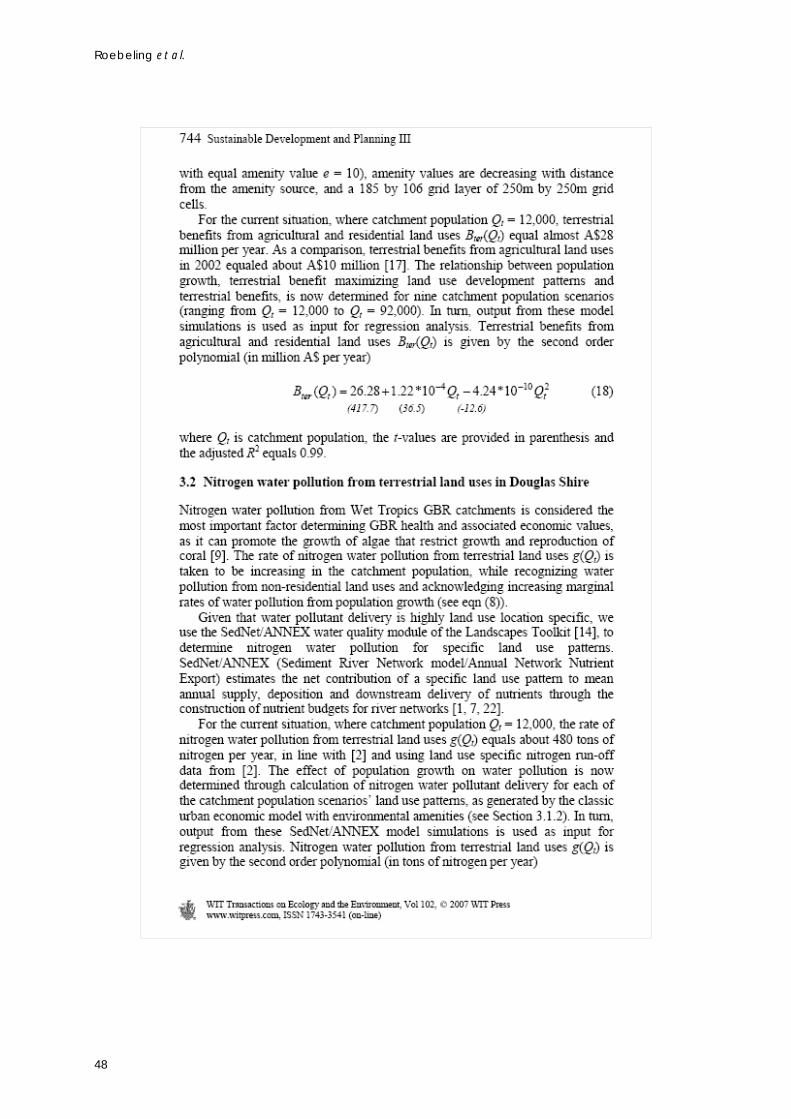
Roebeling et al.
48

Financial-economic analysis of current best management practices: Tully-Murray catchment
49
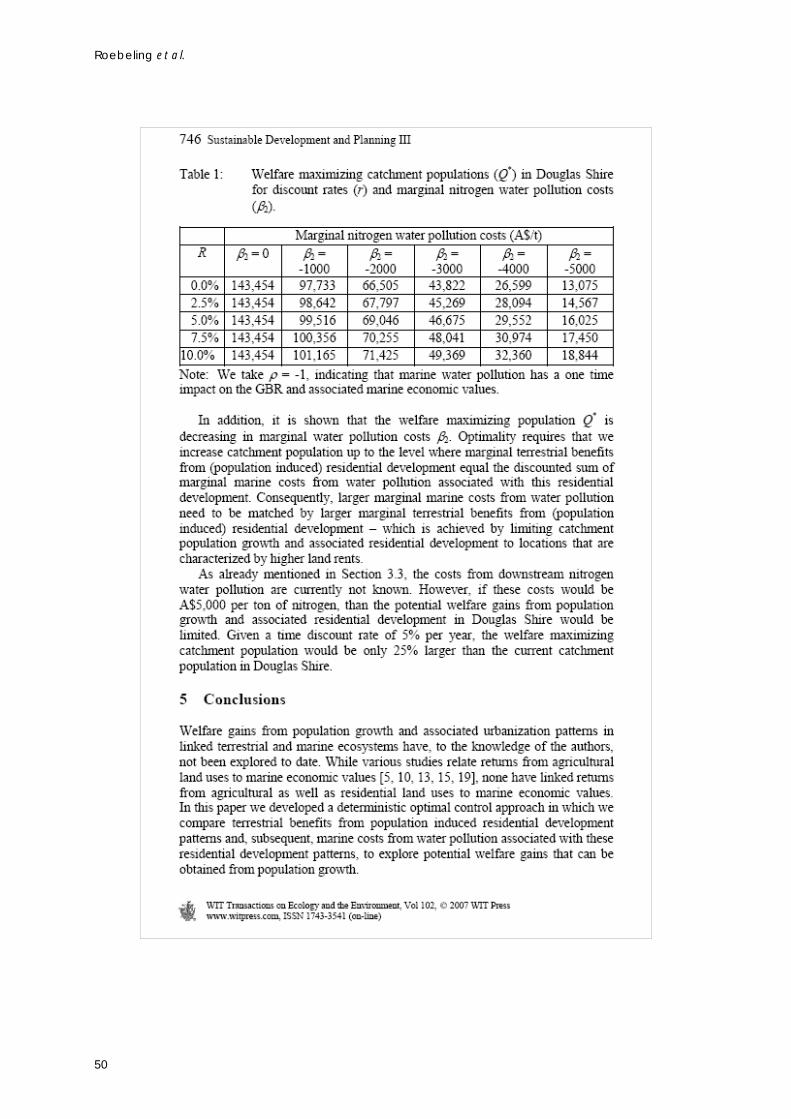
Roebeling et al.
50
Financial-economic analysis of current best management practices: Tully-Murray catchment
51
Roebeling et al.
52

Financial-economic analysis of current best management practices: Tully-Murray catchment
53