financial highlights –...
TRANSCRIPT
Outside Front Cover
MagnaInternationalInc.
337MagnaDrive Aurora,Ontario CanadaL4G7K1
Telephone:(905)726-2462 Fax:(905)726-7164
Visitourwebsiteat: www.magna.com
PrintedinCanada
Magna International Inc. is a leading global supplier of technologically advanced automotive components, systems and modules.
The Company employs over 82,000 people and operates 224 manufacturing operations and 60 product development and engineering centres in 22 countries.
As the most diversified automotive supplier in the world, Magna manufactures a complete range of automotive systems and providesdesign, engineering, testing, assembly and program management services to its customers, the world’s major automotive OriginalEquipment Manufacturers (OEMs).
Magna’s product capabilities span a number of major automotive areas, including:• interior systems• seating systems• closure systems• metal body & chassis systems• mirror systems• electronic systems• plastic body, lighting & exterior trim systems• powertrain & drivetrain systems• roof systems• complete vehicle engineering & assembly
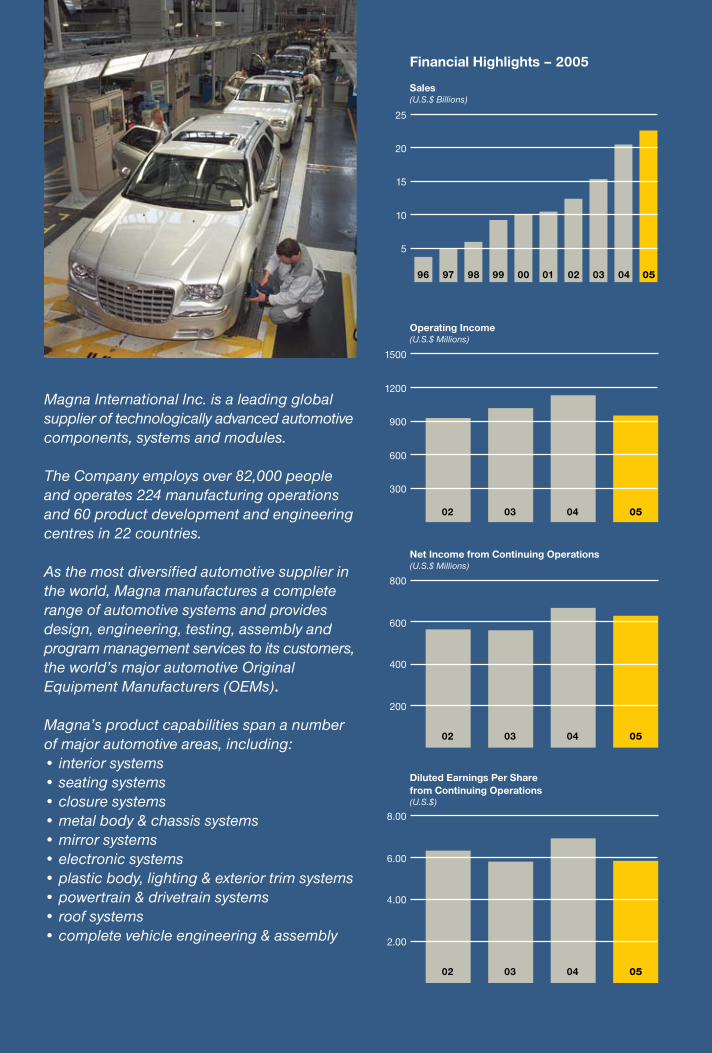
Financial Highlights – 2005
Sales(U.S.$ Billions)
25
20
15
10
5
05040302010099989796
1500
1200
900
600
300
Operating Income(U.S.$ Millions)
800
600
400
200
Net Income from Continuing Operations(U.S.$ Millions)
Diluted Earnings Per Sharefrom Continuing Operations(U.S.$)
05040302
05040302
8.00
6.00
4.00
2.00
05040302
2 0 0 5 A N N U A L R E P O R T
Outside Front Cover
MagnaInternationalInc.
337MagnaDrive Aurora,Ontario CanadaL4G7K1
Telephone:(905)726-2462 Fax:(905)726-7164
Visitourwebsiteat: www.magna.com
PrintedinCanada
Magna International Inc. is a leading global supplier of technologically advanced automotive components, systems and modules.
The Company employs over 82,000 people and operates 224 manufacturing operations and 60 product development and engineering centres in 22 countries.
As the most diversified automotive supplier in the world, Magna manufactures a complete range of automotive systems and providesdesign, engineering, testing, assembly and program management services to its customers, the world’s major automotive OriginalEquipment Manufacturers (OEMs).
Magna’s product capabilities span a number of major automotive areas, including:• interior systems• seating systems• closure systems• metal body & chassis systems• mirror systems• electronic systems• plastic body, lighting & exterior trim systems• powertrain & drivetrain systems• roof systems• complete vehicle engineering & assembly
Financial Highlights – 2005
Sales(U.S.$ Billions)
25
20
15
10
5
05040302010099989796
1500
1200
900
600
300
Operating Income(U.S.$ Millions)
800
600
400
200
Net Income from Continuing Operations(U.S.$ Millions)
Diluted Earnings Per Sharefrom Continuing Operations(U.S.$)
05040302
05040302
8.00
6.00
4.00
2.00
05040302
2 0 0 5 A N N U A L R E P O R T
MetalBody&ChassisSystemsCosma International
•ChassisSystems•Metalforming Technologies•BodySystems•Body-in-white•Finishing
PlasticBody,Lighting&ExteriorTrimSystemsDecoma International
•Front&RearBumper Systems•GreenhouseSystems•LightingSystems•SealingSystems•VehicleEnhancement Packages•BodySidePanels•PolymericGlazing Systems
MirrorSystemsMagna Donnelly
•InteriorMirrors•ExteriorMirrors•EngineeredGlass
SeatingSystemsIntier Automotive Seating
•ModularSeatAssemblies•StowableSeating•HeadRestraints &Armrests•SeatingHardwareSystems
Powertrain&DrivetrainSystemsMagna Powertrain
•DrivetrainSystems& Componentswith SpecialCompetencein 4WD/AWD•Axles&Chassis Modules•EngineSystems& Modules•TransmissionSystems& Modules
ClosureSystemsMagna Closures
•DoorModules•WindowSystems•DriverControls•PowerClosureSystems•LatchingSystems•HandleAssemblies
CompleteVehicleEngineering&AssemblyMagna Steyr
•VehicleEngineering•VehicleAssembly•Components,Modules& TankSystems
ElectronicSystemsMagna Electronics
•PowerSystems•DriverAssistance& Safety•BodyElectronics•WirelessSystems
InteriorSystemsIntier Automotive Interiors
•CompleteInterior Integration•Sidewall&TrimSystems•CockpitSystems•CargoManagement Systems•OverheadSystems•FloorCarpet&Complete VehicleAcousticSystems
Magna’sproductcapabilitiesinclude:
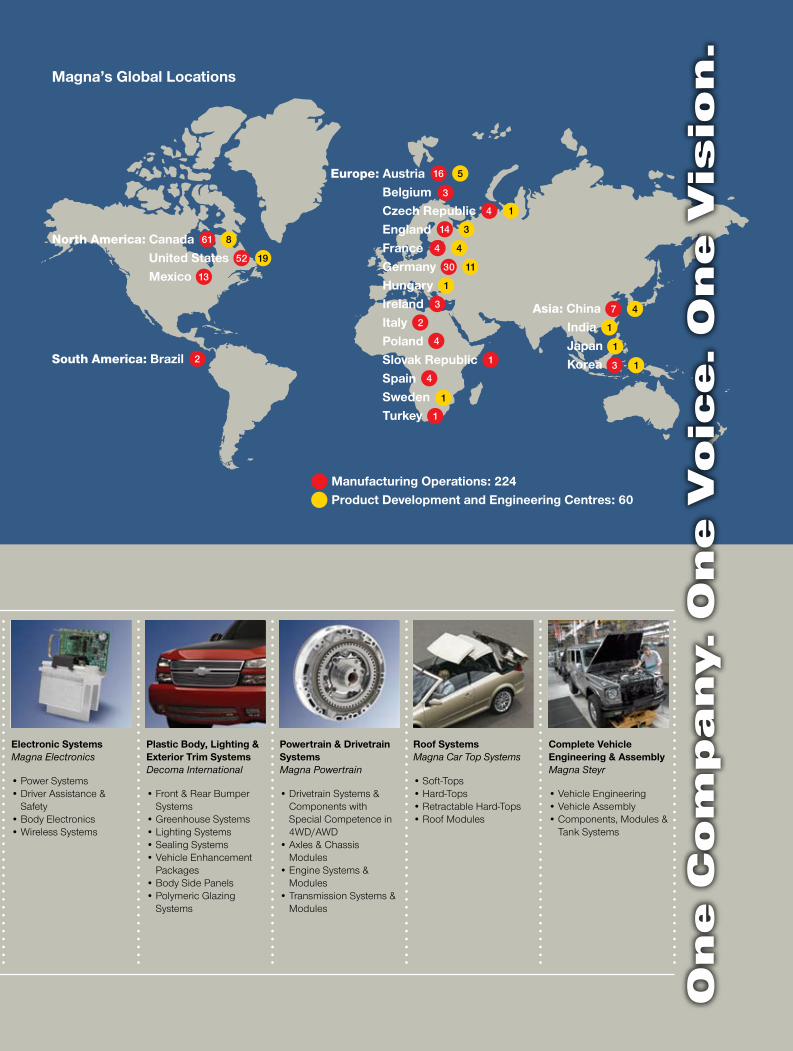
North America:Canada UnitedStates Mexico
Magna’sGlobalLocations
2005AnnualReport
Copiesofthe2005AnnualReportmaybeobtainedfrom:TheSecretary,MagnaInternationalInc.,337MagnaDrive,Aurora,Ontario,CanadaL4G7K1orwww.magna.com.CopiesoffinancialdataandotherpubliclyfileddocumentsareavailablethroughtheinternetontheCanadianSecurities
Administrators’SystemforElectronicDocumentAnalysisandRetrieval(SEDAR)whichcanbeaccessedatwww.sedar.comandontheUnitedStatesSecuritiesandExchangeCommission’sElectronicDataGathering,Analysis,andRetrievalSystem(EDGAR)whichcanbeaccessedatwww.sec.gov
©MagnaInternationalInc.2006.MagnaandthelogoareregisteredtrademarksofMagnaInternationalInc.
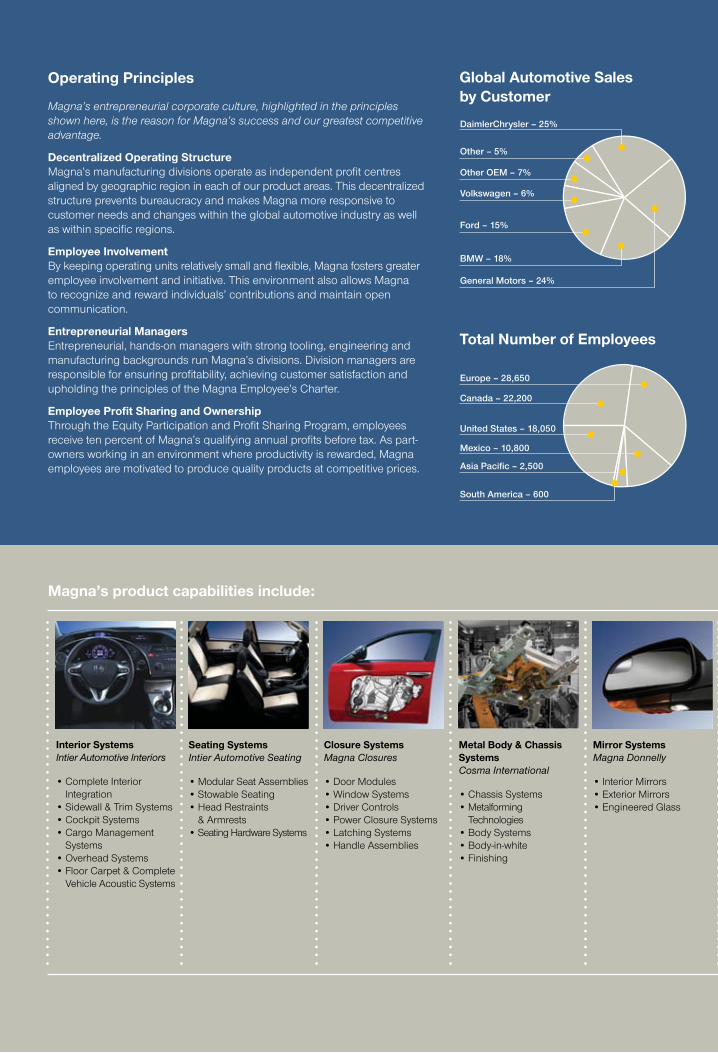
DaimlerChrysler – 25%
Other – 5%
Other OEM – 7%
Volkswagen – 6%
Europe – 28,650
Ford – 15%
BMW – 18%
General Motors – 24%
Asia Pacific – 2,500
South America – 600
Mexico – 10,800
United States – 18,050
Canada – 22,200
GlobalAutomotiveSalesbyCustomer
TotalNumberofEmployees
OperatingPrinciples
Magna’s entrepreneurial corporate culture, highlighted in the principles shown here, is the reason for Magna’s success and our greatest competitive advantage.
DecentralizedOperatingStructureMagna’smanufacturingdivisionsoperateasindependentprofitcentresalignedbygeographicregionineachofourproductareas.ThisdecentralizedstructurepreventsbureaucracyandmakesMagnamoreresponsivetocustomerneedsandchangeswithintheglobalautomotiveindustryaswellaswithinspecificregions.
EmployeeInvolvementBykeepingoperatingunitsrelativelysmallandflexible,Magnafostersgreateremployeeinvolvementandinitiative.ThisenvironmentalsoallowsMagnatorecognizeandrewardindividuals’contributionsandmaintainopencommunication.
EntrepreneurialManagersEntrepreneurial,hands-onmanagerswithstrongtooling,engineeringandmanufacturingbackgroundsrunMagna’sdivisions.Divisionmanagersareresponsibleforensuringprofitability,achievingcustomersatisfactionandupholdingtheprinciplesoftheMagnaEmployee’sCharter.
EmployeeProfitSharingandOwnershipThroughtheEquityParticipationandProfitSharingProgram,employeesreceivetenpercentofMagna’squalifyingannualprofitsbeforetax.Aspart-ownersworkinginanenvironmentwhereproductivityisrewarded,Magnaemployeesaremotivatedtoproducequalityproductsatcompetitiveprices.
The2006AnnualMeetingofShareholdersThe2006AnnualMeetingofShareholderswillbeheldatRoyThomsonHall,60SimcoeStreet,Toronto,OntarioCanada
onMay2,2006,commencingat10:00a.m.(Toronto time)
RoofSystemsMagna Car Top Systems
•Soft-Tops•Hard-Tops•RetractableHard-Tops•RoofModules
South America:Brazil
Europe:Austria Belgium CzechRepublic England France Germany Hungary Ireland Italy Poland SlovakRepublic Spain Sweden Turkey
Asia:China India Japan Korea
ManufacturingOperations:224ProductDevelopmentandEngineeringCentres:60
61 8
52 19
13
2
16 5
3
4 1
14 3
4 4
30 11
1
3
2
4
1
4
1
1
7 4
1
1
3 1
CorporateDirectory
DIRECTORS
FrankStronach
WilliamH.Fike
ManfredGingl
MichaelD.Harris
EdwardC.Lumley
KlausMangold
DonaldResnick
RoydenR.Richardson
FranzVranitzky
DonaldJ.Walker
SiegfriedWolf
LawrenceWorrall
CORPORATEOFFICE
MagnaInternationalInc.337MagnaDriveAurora,OntarioCanadaL4G7K1Telephone:(905)726-2462www.magna.com
OFFICERS
FrankStronachChairman of the Board
DonaldJ.WalkerCo-Chief Executive Officer
SiegfriedWolfCo-Chief Executive Officer
ManfredGinglExecutive Vice-Chairman
MarkT.HoganPresident
J.BrianColburnExecutive Vice-President,Special Projects and Secretary
VincentJ.GalifiExecutive Vice-Presidentand Chief Financial Officer
PeterKoobExecutive Vice-President,Corporate Development
MarcNeebExecutive Vice-President,Global Human Resources
JeffreyO.PalmerExecutive Vice-President
GerhardRandaExecutive Vice-President,Planning
TomSkudutisExecutive Vice-President,Operations
KeithJ.SteinSenior Vice-President,Corporate Affairs
GerdBrusiusVice-President, Operational Improvement and Quality – Europe
AnthonyDobranowskiVice-President
HubertHödlVice-President, Marketing and New Business Development – Europe
PatrickW.D.McCannVice-President and Controller
Asa“foreignprivateissuer”listedontheNewYorkStockExchange(NYSE),MagnaisrequiredtodisclosethesignificantwaysinwhichourcorporategovernancepracticesdifferfromthosetobefollowedbyU.S.domesticissuersundertheNYSElistingstandards.Pleaseseethecorporategovernancesectionofourwebsite(www.magna.com)forourStatementofSignificantCorporateGovernanceDifferences(NYSE).Additionally,pleaserefertotheManagementInformationCircular/ProxyStatementforour2006AnnualShareholders’MeetingforadescriptionofourcorporategovernancepracticesincomparisontotherequirementsandguidelinesoftheCanadiansecuritiesadministrators.
Shareholderswishingtocommunicatewiththenon-managementmembersoftheMagnaBoardofDirectorsmaydosobycontactingtheLeadDirectorthroughtheofficeofMagna’sCorporateSecretaryat337MagnaDrive,Aurora,Ontario,CanadaL4G7K1,(905)726-7022.
RolandB.NimmoVice-President,Internal Audit
ScottParadiseVice-President, Marketing and New Business Development– The Americas
StevenReesorVice-President,Special Projects
ThomasSchultheissVice-President and General Counsel – Europe
MichaelSinneaveVice-President, Operational Improvement and Quality– The Americas
LouisTonelliVice-President,Investor Relations
PaulBrockTreasurer
BassemShakeelAssistant Secretary
TRANSFERAGENTSANDREGISTRARS
Canada–ClassASubordinateVotingandClassBSharesComputershareTrustCompanyofCanada100UniversityAvenueToronto,OntarioM5J2Y1,CanadaTelephone:1-800-564-6253
UnitedStates–ClassASubordinateVotingSharesComputershareTrustCompany,Inc.350IndianaStreetGolden,Colorado80401,USA.Telephone:(303)262-0600www.computershare.com
EXCHANGELISTING
As part of the Toronto Stock Exchange’s symbol change initiative, effective November 15, 2004, new trading symbol extensions were added to our ticker symbols. The TSX subsequently announced that they were reverting to the original ticker symbols effective May 8, 2006.
ClassASubordinateVotingSharesTorontoStockExchange MG.A (on/after May 8, 2006) MG.SV.A(November 15, 2004 to May 8, 2006) MG.A(before November 15, 2004)TheNewYorkStockExchange MGA
ClassBSharesTorontoStockExchange MG.B(on/after May 8, 2006) MG.MV.B(November 15, 2004 to May 8, 2006) MG.B(before November 15, 2004)
On
e C
om
pa
ny. O
ne V
oic
e. O
ne V
isio
n.
MetalBody&ChassisSystemsCosma International
•ChassisSystems•Metalforming Technologies•BodySystems•Body-in-white•Finishing
PlasticBody,Lighting&ExteriorTrimSystemsDecoma International
•Front&RearBumper Systems•GreenhouseSystems•LightingSystems•SealingSystems•VehicleEnhancement Packages•BodySidePanels•PolymericGlazing Systems
MirrorSystemsMagna Donnelly
•InteriorMirrors•ExteriorMirrors•EngineeredGlass
SeatingSystemsIntier Automotive Seating
•ModularSeatAssemblies•StowableSeating•HeadRestraints &Armrests•SeatingHardwareSystems
Powertrain&DrivetrainSystemsMagna Powertrain
•DrivetrainSystems& Componentswith SpecialCompetencein 4WD/AWD•Axles&Chassis Modules•EngineSystems& Modules•TransmissionSystems& Modules
ClosureSystemsMagna Closures
•DoorModules•WindowSystems•DriverControls•PowerClosureSystems•LatchingSystems•HandleAssemblies
CompleteVehicleEngineering&AssemblyMagna Steyr
•VehicleEngineering•VehicleAssembly•Components,Modules& TankSystems
ElectronicSystemsMagna Electronics
•PowerSystems•DriverAssistance& Safety•BodyElectronics•WirelessSystems
InteriorSystemsIntier Automotive Interiors
•CompleteInterior Integration•Sidewall&TrimSystems•CockpitSystems•CargoManagement Systems•OverheadSystems•FloorCarpet&Complete VehicleAcousticSystems
Magna’sproductcapabilitiesinclude:
North America:Canada UnitedStates Mexico
Magna’sGlobalLocations
2005AnnualReport
Copiesofthe2005AnnualReportmaybeobtainedfrom:TheSecretary,MagnaInternationalInc.,337MagnaDrive,Aurora,Ontario,CanadaL4G7K1orwww.magna.com.CopiesoffinancialdataandotherpubliclyfileddocumentsareavailablethroughtheinternetontheCanadianSecurities
Administrators’SystemforElectronicDocumentAnalysisandRetrieval(SEDAR)whichcanbeaccessedatwww.sedar.comandontheUnitedStatesSecuritiesandExchangeCommission’sElectronicDataGathering,Analysis,andRetrievalSystem(EDGAR)whichcanbeaccessedatwww.sec.gov
©MagnaInternationalInc.2006.MagnaandthelogoareregisteredtrademarksofMagnaInternationalInc.
DaimlerChrysler – 25%
Other – 5%
Other OEM – 7%
Volkswagen – 6%
Europe – 28,650
Ford – 15%
BMW – 18%
General Motors – 24%
Asia Pacific – 2,500
South America – 600
Mexico – 10,800
United States – 18,050
Canada – 22,200
GlobalAutomotiveSalesbyCustomer
TotalNumberofEmployees
OperatingPrinciples
Magna’s entrepreneurial corporate culture, highlighted in the principles shown here, is the reason for Magna’s success and our greatest competitive advantage.
DecentralizedOperatingStructureMagna’smanufacturingdivisionsoperateasindependentprofitcentresalignedbygeographicregionineachofourproductareas.ThisdecentralizedstructurepreventsbureaucracyandmakesMagnamoreresponsivetocustomerneedsandchangeswithintheglobalautomotiveindustryaswellaswithinspecificregions.
EmployeeInvolvementBykeepingoperatingunitsrelativelysmallandflexible,Magnafostersgreateremployeeinvolvementandinitiative.ThisenvironmentalsoallowsMagnatorecognizeandrewardindividuals’contributionsandmaintainopencommunication.
EntrepreneurialManagersEntrepreneurial,hands-onmanagerswithstrongtooling,engineeringandmanufacturingbackgroundsrunMagna’sdivisions.Divisionmanagersareresponsibleforensuringprofitability,achievingcustomersatisfactionandupholdingtheprinciplesoftheMagnaEmployee’sCharter.
EmployeeProfitSharingandOwnershipThroughtheEquityParticipationandProfitSharingProgram,employeesreceivetenpercentofMagna’squalifyingannualprofitsbeforetax.Aspart-ownersworkinginanenvironmentwhereproductivityisrewarded,Magnaemployeesaremotivatedtoproducequalityproductsatcompetitiveprices.
The2006AnnualMeetingofShareholdersThe2006AnnualMeetingofShareholderswillbeheldatRoyThomsonHall,60SimcoeStreet,Toronto,OntarioCanada
onMay2,2006,commencingat10:00a.m.(Toronto time)
RoofSystemsMagna Car Top Systems
•Soft-Tops•Hard-Tops•RetractableHard-Tops•RoofModules
South America:Brazil
Europe:Austria Belgium CzechRepublic England France Germany Hungary Ireland Italy Poland SlovakRepublic Spain Sweden Turkey
Asia:China India Japan Korea
ManufacturingOperations:224ProductDevelopmentandEngineeringCentres:60
61 8
52 19
13
2
16 5
3
4 1
14 3
4 4
30 11
1
3
2
4
1
4
1
1
7 4
1
1
3 1
CorporateDirectory
DIRECTORS
FrankStronach
WilliamH.Fike
ManfredGingl
MichaelD.Harris
EdwardC.Lumley
KlausMangold
DonaldResnick
RoydenR.Richardson
FranzVranitzky
DonaldJ.Walker
SiegfriedWolf
LawrenceWorrall
CORPORATEOFFICE
MagnaInternationalInc.337MagnaDriveAurora,OntarioCanadaL4G7K1Telephone:(905)726-2462www.magna.com
OFFICERS
FrankStronachChairman of the Board
DonaldJ.WalkerCo-Chief Executive Officer
SiegfriedWolfCo-Chief Executive Officer
ManfredGinglExecutive Vice-Chairman
MarkT.HoganPresident
J.BrianColburnExecutive Vice-President,Special Projects and Secretary
VincentJ.GalifiExecutive Vice-Presidentand Chief Financial Officer
PeterKoobExecutive Vice-President,Corporate Development
MarcNeebExecutive Vice-President,Global Human Resources
JeffreyO.PalmerExecutive Vice-President
GerhardRandaExecutive Vice-President,Planning
TomSkudutisExecutive Vice-President,Operations
KeithJ.SteinSenior Vice-President,Corporate Affairs
GerdBrusiusVice-President, Operational Improvement and Quality – Europe
AnthonyDobranowskiVice-President
HubertHödlVice-President, Marketing and New Business Development – Europe
PatrickW.D.McCannVice-President and Controller
Asa“foreignprivateissuer”listedontheNewYorkStockExchange(NYSE),MagnaisrequiredtodisclosethesignificantwaysinwhichourcorporategovernancepracticesdifferfromthosetobefollowedbyU.S.domesticissuersundertheNYSElistingstandards.Pleaseseethecorporategovernancesectionofourwebsite(www.magna.com)forourStatementofSignificantCorporateGovernanceDifferences(NYSE).Additionally,pleaserefertotheManagementInformationCircular/ProxyStatementforour2006AnnualShareholders’MeetingforadescriptionofourcorporategovernancepracticesincomparisontotherequirementsandguidelinesoftheCanadiansecuritiesadministrators.
Shareholderswishingtocommunicatewiththenon-managementmembersoftheMagnaBoardofDirectorsmaydosobycontactingtheLeadDirectorthroughtheofficeofMagna’sCorporateSecretaryat337MagnaDrive,Aurora,Ontario,CanadaL4G7K1,(905)726-7022.
RolandB.NimmoVice-President,Internal Audit
ScottParadiseVice-President, Marketing and New Business Development– The Americas
StevenReesorVice-President,Special Projects
ThomasSchultheissVice-President and General Counsel – Europe
MichaelSinneaveVice-President, Operational Improvement and Quality– The Americas
LouisTonelliVice-President,Investor Relations
PaulBrockTreasurer
BassemShakeelAssistant Secretary
TRANSFERAGENTSANDREGISTRARS
Canada–ClassASubordinateVotingandClassBSharesComputershareTrustCompanyofCanada100UniversityAvenueToronto,OntarioM5J2Y1,CanadaTelephone:1-800-564-6253
UnitedStates–ClassASubordinateVotingSharesComputershareTrustCompany,Inc.350IndianaStreetGolden,Colorado80401,USA.Telephone:(303)262-0600www.computershare.com
EXCHANGELISTING
As part of the Toronto Stock Exchange’s symbol change initiative, effective November 15, 2004, new trading symbol extensions were added to our ticker symbols. The TSX subsequently announced that they were reverting to the original ticker symbols effective May 8, 2006.
ClassASubordinateVotingSharesTorontoStockExchange MG.A (on/after May 8, 2006) MG.SV.A(November 15, 2004 to May 8, 2006) MG.A(before November 15, 2004)TheNewYorkStockExchange MGA
ClassBSharesTorontoStockExchange MG.B(on/after May 8, 2006) MG.MV.B(November 15, 2004 to May 8, 2006) MG.B(before November 15, 2004)
On
e C
om
pa
ny. O
ne V
oic
e. O
ne V
isio
n.
Magna International Inc. – Annual Report 2005
Magna International Inc.Financial Review and Other Information
2005The Chairman’s Message 1
The Magna Corporate ConstitutionThe Magna Employee’s Charter 2
Letter to Shareholders 3
Financial Review and Other Information
Management’s Discussion and Analysis of Results of Operationsand Financial Position 6
Management’s Responsibility for Financial Reporting 39
Auditors’ Report 40
Consolidated Statements of Income 41
Consolidated Statements of Retained EarningsConsolidated Statements of Cash Flows 42
Consolidated Balance Sheets 43
Notes to Consolidated Financial Statements 44
Supplementary Financial and Share Information 77
Corporate Directory Inside Back Cover
Magna International Inc. – Annual Report 2005– 1 –
The Chairman’s Message
Despite significant difficulties in the North American and European automotive markets, Magna had anotheryear of solid operating results. With our strong balance sheet, diverse product capabilities and experiencedmanagement, we are well positioned to capitalize on the major shakeout taking place within the global automotiveparts industry.
However, Magna’s future success is tied to a great extent to the success of our major customers in this competitiveglobal automotive industry. Unfortunately, some of our major automotive customers have been experiencingdeclining production volumes and reduced profitability and competitiveness. This troubling decline incompetitiveness in the North American and European auto markets has been evident for the past few years.Last year I sounded a public warning about the state of the auto industry in these two markets.
I believe that there is recognition within the auto industry that there must be a major correction and it is myhope that the necessary changes will take place. In North America, I believe it is important that the majorNorth American-based auto manufacturers and the unions sit down and create a framework for a betterrelationship that will allow them to be more competitive. Many of the fundamental problems facing the NorthAmerican industry can only be solved if the auto manufacturers and the unions are willing to develop a newrelationship and work together to preserve jobs. This is also generally true in Europe. We at Magna are hopefulthis will happen and are willing to play a constructive role in ensuring that some of the major players in theNorth American and European automotive markets regain their competitiveness.
I believe that one method to ensure Magna’s continued success is through diversification. We are currentlymaking good strides in diversifying our customer base, but I also believe we can protect our profits andachieve better margins by diversifying our economic base in other ways, including looking at other applicationsof our unique technologies, processes and manufacturing expertise as well as by keeping an open mind inregard to new opportunities.
Business must always have the flexibility to respond to economic trends and to consider a wide range ofopportunities for maximizing shareholder wealth. With the expiry of the Forbearance Agreement in May of thisyear, Magna will again have the flexibility to take advantage of these kinds of opportunities, subject to theprotection enshrined in our Corporate Constitution. The Constitution gives shareholders the right to approveany investment in an unrelated business should that investment exceed 20% of Magna’s equity. Additionally,any such investments would be subject to the same scrutiny by our management and board of directors aswould any of the investments we make in our automotive business, and any related-party transactions wouldcontinue to be subject to review and approval by the independent members of our Board of Directors.
In closing, I wish to thank our Board of Directors and management team for continuing to chart a successfulcourse for Magna during a period of transition and turbulence in the auto industry. We will stand by our customersduring this period of transition as they seek to regain a competitive edge. I also wish to thank our hard-workingand committed employees in 22 countries around the world. Finally, on behalf of our shareholders, I wish tothank the many individuals within Magna and the many companies in Canada and the U.S. that assisted inthe Magna-led evacuation of hundreds of victims of Hurricane Katrina. The evacuees have since been movedto a new village in Louisiana where they are rebuilding their lives and have renewed hope for the future.The rescue and resettlement of the hurricane evacuees was a great example of the good that companies can do.
Frank StronachChairman of the Board
/s/Frank Stronach
Magna International Inc. – Annual Report 2005– 2 –
The MagnaEmployee’s Charter
Magna is committed to an operating philosophywhich is based on fairness and concern for people.
It includes these principles:
Job SecurityBeing competitive by making a better product for a better priceis the best way to enhance job security. Magna is committed to
working together with you to help protect your job security.To assist you, Magna will provide:
• Job Counselling • Training• Employee Assistance Programs
A Safe and Healthful WorkplaceMagna strives to provide you with a working environment which
is safe and healthful.
Fair TreatmentMagna offers equal opportunities based on an individual’squalifications and performance, free from discrimination or
favouritism.
Competitive Wages and BenefitsMagna will provide you with information which will enable you to
compare your total compensation, including total wages andtotal benefits, with those earned by employees of your
competitors, as well as with other plants in your community.If your total compensation is found not to be competitive,
then your wages will be adjusted.
Employee Equity and Profit ParticipationMagna believes that every employee should share in our
financial success.
Communication and InformationThrough regular monthly meetings between management andemployees and through publications, Magna will provide you
with information so that you will know what is going on atMagna and within the industry.
The HotlineShould you have a problem, or feel the above principles are not
being met, we encourage you to call the Hotline or use theself-addressed Hotline Envelopes to register your complaints.
You do not have to give your name, but if you do, it will be heldin strict confidence. Hotline Investigators will answer your call.
The Hotline is committed to investigating and resolving allconcerns or complaints and must report the outcome to
Magna’s Global Human Resources Department.
Employee Relations Advisory BoardThe Employee Relations Advisory Board is a group of people
who have proven recognition and credibility relating tohumanitarian and social issues. This Board will monitor, adviseand ensure that Magna operates within the spirit of the Magna
Employee’s Charter and the principles ofMagna’s Corporate Constitution.
The MagnaCorporate Constitution
Magna’s Corporate Constitution is the cornerstone of ourentrepreneurial culture. At the heart of the Corporate
Constitution is a clear-cut and transparent formula that allowsMagna’s key stakeholders to participate
in our growth and success.
Shareholder Profit ParticipationMagna will distribute, on average, not less than 20 percent of its
annual net profit after tax to shareholders.
Employee Equity and Profit ParticipationTen percent of Magna’s qualifying profit before tax will be allocatedto employees. These funds will be used in part for the purchaseof Magna shares in trust for employees and for cash distributions
to employees, recognizing length of service.
Management Profit ParticipationTo obtain long-term contractual commitment from senior
management, Magna provides a compensation arrangementwhich, in addition to a base salary below industry standards,
allows for the distribution of up to six percent of its profit before taxas incentive bonuses to Corporate Management.
Research and DevelopmentMagna will allocate a minimum of seven percent of its profit
before tax for research and development to ensureits long-term viability.
Social ResponsibilityMagna will allocate a maximum of two percent of its profit beforetax for charitable, cultural, educational and political purposes to
support the basic fabric of society.
Minimum Profit PerformanceManagement has an obligation to produce a profit.
If Magna does not generate a minimum after-tax return of fourpercent on share capital for two consecutive years,Magna’s Class A shareholders, voting as a class,
will have the right to elect additional directors.
Unrelated InvestmentsMagna Class A and Class B shareholders, with each class voting
separately, will have the right to approve any investment in anunrelated business in the event such investment together with allother investments in unrelated businesses exceeds 20 percent
of Magna’s equity.
Board of DirectorsMagna believes that outside directors provide independent
counsel and discipline. A majority of the members of Magna’sBoard of Directors will be outsiders.
Constitutional AmendmentsAny change to Magna’s Corporate Constitution will require the
approval of its Class A and Class B shareholders, with eachclass voting separately.
Magna International Inc. – Annual Report 2005– 3 –
Letter to Shareholders
In 2005, Magna again recorded solid operating results, despite difficult conditions for the global automotiveindustry.
Challenging industry conditions included significantly higher commodity costs and pressure from our customersfor increased price concessions. In addition, we were affected by lower production volumes on a number ofour key vehicle programs. Despite these difficulties, Magna still achieved record sales in 2005 of $22.8 billion– a 10% increase from the previous year.
Operating Highlights
In a number of respects, 2005 was a year of transformation for Magna. We privatized our former publicsubsidiaries, Tesma, Decoma and Intier, thereby improving our strategic positioning, flexibility and costeffectiveness in this period of challenging industry conditions. Following the completion of these privatizations,we completed an assessment of our global operating footprint. That assessment resulted in the sale, closureand/or consolidation of a number of facilities around the world, measures which were necessary to ensure thatwe further bolstered our competitiveness and positioned ourselves for the future. Unfortunately, we experiencedsignificant operating challenges at certain facilities, particularly in Europe, as a result of which we recordedsignificant restructuring and impairment charges in 2005.
Over the years, Magna has built a solid foundation, including a strong balance sheet, diverse product capability,innovative technologies and an experienced management team. During 2005, we had a number of importantachievements which built on this foundation:
• We continued to make progress in diversifying our customer base. We were awarded a number ofnew contracts with Asian-based customers, for programs around the world, such as our first ever transfer case business from Nissan for two vehicle programs, one of which will be built in North America and the other of which will be built in Japan. In addition, we recently launched a new metal stamping facility in France to supply Peugeot-Citroën on various vehicle programs.
• We launched a number of new production facilities, each supplying key programs. These include:a plant in Hermosillo, Mexico that began to supply various stampings for the Ford Fusion, MercuryMilan and Lincoln Zephyr; a facility in Kentucky that began to supply frames for the new Ford Explorerand Mercury Mountaineer and, within the next year, will also supply frames for Ford’s Superduty pickup trucks; and a fascia mould and paint facility in Georgia that began to supply fascias and other exterior parts for the Mercedes M-Class and R-Class. While these facilities incurred start-up losses in 2005, we expect an improvement in profitability at these facilities as they continue to ramp up production.
• We strengthened our relationship with two important customers. In July, DaimlerChrysler announcedthe development of a deeper relationship with a select group of key suppliers. Magna was identifiedas one of DaimlerChrysler’s Highly Integrated Partnership Organizations (HI-POs). This improved model of co-operation with suppliers is intended to provide numerous benefits to the HI-POs, including early involvement in the product development of future models. Similarly, in September, Ford announced that it was entering into new long-term “Aligned Business Framework” agreementswith select suppliers and identified Magna and six other automotive suppliers as the first of the strategic suppliers in the initial phase of Ford’s new framework. The framework anticipates asignificant reduction over time in the number of suppliers to Ford.
Magna International Inc. – Annual Report 2005– 4 –
• In December, we announced that we had signed an agreement to acquire CTS Fahrzeug-DachsystemeGmbH, Bietigheim-Bissingen ("CTS"), from Porsche AG. CTS, which stands for Car Top Systems, is one of the world's leading manufacturers of retractable hard top and soft top roof systems, a product area that we believe has good growth potential. The acquisition, which we completed in early 2006, will allow us to take advantage of new opportunities combining CTS’ capabilities withour current closure systems and complete vehicle capabilities.
Industry Overview
Although the automotive industry is currently experiencing a number of difficult challenges, it also presents arange of good opportunities for us to grow and strengthen our position. For example:
• Global automotive sales and production have been growing year-over-year and are expected to continue to grow in the future. Although most of this growth is occurring in emerging markets, specifically Asia, we expect to see future growth in our core markets of North America and Europe.
• Our customers are increasingly looking to outsource larger, more complex modules as a winning strategy for driving down costs and bringing exciting new products to the marketplace much morequickly. Based on our diverse product and process capabilities, our understanding of complete vehicle engineering and assembly and the continuing growth of our electronics expertise, we are strongly positioned to produce the most advanced and cost-effective major modules in the global automotive industry. Such modules include complete interiors, front ends, body-in-white, drivetrains,doors, roofs and tailgates. These modules require a wide range of capabilities and Magna is the only supplier in the world that possesses all of these capabilities in one global organization.
Strategic Direction
In the short term, we remain focused on continuous improvement of our world-class manufacturing andassembly operations to ensure that we are the best in quality, efficiency, profitability and value to our customers.In order to achieve this, we intend to:
• continue to implement our initiatives in Magna-wide purchasing coordination to reduce our supplybase and leverage the scale of our purchasing volumes;
• strengthen the sharing of best practices across Magna and fully implement them in all aspects of our business;
• seek and implement cost reduction ideas from our employees, as well as our supply base;
• efficiently launch new business that we have been awarded for 2006; and
• further reinforce all aspects of our Employee’s Charter and fully utilize the ideas, efforts and energyof our employees to make us the best automotive supplier in the world.
Magna International Inc. – Annual Report 2005– 5 –
Now that we have completed the privatization of our former public subsidiaries and integrated our recentacquisitions, one of our main priorities is the refinement of our product strategy based on our current andplanned global manufacturing footprint, as well as the technological innovations we possess or are bringing tothe market. In connection with this, we will focus on those customers that are most open to working for ourmutual benefit, including through joint improvement of efficiencies and reduction of costs. The combinationof our product strategy, innovation roadmap and customer strategy will drive future capital expenditures, R&Dinvestment and our acquisition strategy.
To ensure continued growth, we will continue to push the envelope in relation to new product and processinnovations. As part of our efforts in this regard, we will continue directing significant effort to bringing newproduct and process innovations to market. In addition, our acquisition strategy involves the purchase orlicense of strategic technologies that we believe will provide additional value to our customers and us.
Recognizing that much of the future growth potential in the automotive industry lies in new markets, we willseek to expand our global footprint to take advantage of growing vehicle production in various regions of theworld. In expanding our global footprint, we will also be focused on ensuring that we can compete in productsthat can be delivered globally.
In closing, we would like to thank our employees for their extraordinary efforts and contributions and for theircontinuous improvement ideas that help our customers be more competitive. Magna’s continued success isthe result of the hard work and dedication of our employees and managers around the world. We also wish tothank our shareholders, who weathered a tough year in the stock market for the automotive sector generally.However, we firmly believe that the current turmoil in the automotive industry will continue to present us with anumber of opportunities that we can consider and capitalize on and that will ultimately further strengthen ourposition in the global automotive industry. Lastly, we wish to thank our customers, who continue to allow us toassist them in cutting costs and supplying innovative and well-designed systems solutions. We greatly appreciatetheir continued confidence in our products and services.
Manfred Gingl Mark T. Hogan Vincent J. GalifiExecutive Vice-Chairman President Executive Vice-President
and Chief Financial Officer
Donald J. Walker Siegfried WolfCo-Chief Executive Officer Co-Chief Executive Officer
/s/Donald J. Walker /s/Siegfried Wolf
/s/Manfred Gingl /s/Mark T. Hogan /s/Vincent J. Galifi
Magna International Inc. – Annual Report 2005– 6 –
All amounts in this Management's Discussion and Analysis of Results of Operations and Financial Position ("MD&A") are in U.S. dollars and all tabularamounts are in millions of U.S. dollars, except per share figures and average dollar content per vehicle, which are in U.S. dollars, unless otherwise noted.When we use the terms "we", "us", "our", or "Magna", we are referring to Magna International Inc. and its subsidiaries and jointly controlled entities, unlessthe context otherwise requires.
This MD&A should be read in conjunction with the accompanying audited consolidated financial statements for the year ended December 31, 2005, whichare prepared in accordance with Canadian generally accepted accounting principles ("GAAP"), as well as the "Forward-Looking Statements" on page 38.This MD&A has been prepared as of February 27, 2006.
OVERVIEW
We are a leading global supplier of technologically advanced automotive systems, assemblies, modules and components. We follow acorporate policy of functional and operational decentralization. We conduct our operations through divisions, which function asautonomous business units that operate within pre-determined guidelines. As at December 31, 2005, we had 224 manufacturing divisionsand 60 product development and engineering centres in 22 countries. We design, develop and manufacture automotive systems,assemblies, modules and components, and engineer and assemble complete vehicles for sale to original equipment manufacturers("OEMs") of cars and light trucks in North America, Europe, Asia and South America. Our product capabilities span a number of majorautomotive areas including: interiors; seating; closures; metal body systems; exterior and interior mirrors and engineered glass; electronics;plastic body, lighting and exterior trim systems; various powertrain and drivetrain systems; retractable hard top and soft top roof systems;and complete vehicle engineering and assembly.
Historically, we had supplied these products and services through global product groups, three of which were publicly traded companiesin which we had a controlling interest. In April 2005, we completed our previously announced plans to take each of these publicly tradedsubsidiaries private (the "Privatizations").
Shortly after we completed the Privatizations, we began to reorganize and segment our operations on a geographic basis, among NorthAmerica, Europe and Rest of World (primarily Asia and South America).
Our success is primarily dependent upon the levels of North American and European (and currently to a lesser extent Asian and SouthAmerican) car and light truck production by our customers. OEM production volumes in different regions may be impacted by factorswhich may vary from one region to the next, including general economic conditions, interest rates, fuel prices and availability, infrastructure,legislative changes, environmental emission and safety issues and labour and/or trade relations.
Given these differences between the regions in which we operate, we have segmented our operations on a geographic basis betweenNorth America, Europe, and Rest of World. In connection with this, we appointed a Chief Executive Officer for each of our two principalregions, North America and Europe. The role of the North American and European management teams is to manage our interests toensure a coordinated effort across our different product capabilities. In addition to maintaining key customer, supplier and governmentcontacts in their respective markets, our regional management teams centrally manage key aspects of our operations while permittingour divisions enough flexibility through our decentralized structure to foster an entrepreneurial environment.
HIGHLIGHTS
During 2005, we reported solid financial results, including record sales of $22.8 billion. The higher sales level was achieved as a resultof increases in our North American and European dollar content per vehicle. In North America, vehicle production was unchanged at15.7 million units, while our content per vehicle increased 17% to $731, both as compared to 2004. In Europe, Western European vehicleproduction declined 4% to 16.0 million units, while our content per vehicle increased 11% to $317, both as compared to 2004.
Operating income for 2005 decreased 16% to $942 million from $1.1 billion for 2004. Excluding the unusual items recorded in 2005and 2004 (see "Unusual Items" below), operating income for 2005 decreased $83 million or 7%. The decrease in operating income wasprimarily as a result of higher commodity prices, lower production volumes on certain of our high content programs, incremental customerprice concessions, the negative impact of start-up costs at new facilities during 2005, and non-cash costs related to the Privatizations,including additional depreciation and amortization and stock compensation expense. The factors contributing to the decrease in operatingincome were partially offset by additional margins earned as a result of the launch of new programs during or subsequent to 2004, theacquisition of the New Venture Gear, Inc. ("NVG") business in September 2004, productivity and efficiency improvements at certain facilities,and the closure of several facilities that were incurring losses during 2004.
Net income for 2005 decreased 5% to $639 million from $676 million for 2004. Excluding the unusual items recorded in 2005 and 2004(see "Unusual Items" below), net income for 2005 increased $51 million or 7%. The increase in net income was primarily as a result ofreductions in income taxes and minority interest partially offset by the decrease in operating income.
Management’s Discussion and Analysis of Results of Operations and Financial PositionMagna International Inc.
Magna International Inc. – Annual Report 2005– 7 –
Management’s Discussion and Analysis of Results of Operations and Financial PositionMagna International Inc.
Diluted earnings per share for 2005 decreased 15% to $5.90 from $6.95 for 2004. Excluding the unusual items recorded in 2005 and2004 (see "Unusual Items" below), diluted earnings per share decreased $0.28 from 2004 to 2005 as a result of an increase in theweighted average number of diluted shares outstanding during the year, primarily as a result of the Class A Subordinate Voting Sharesissued on completion of the Privatizations, partially offset by the increase in net income (excluding unusual items).
Unusual Items
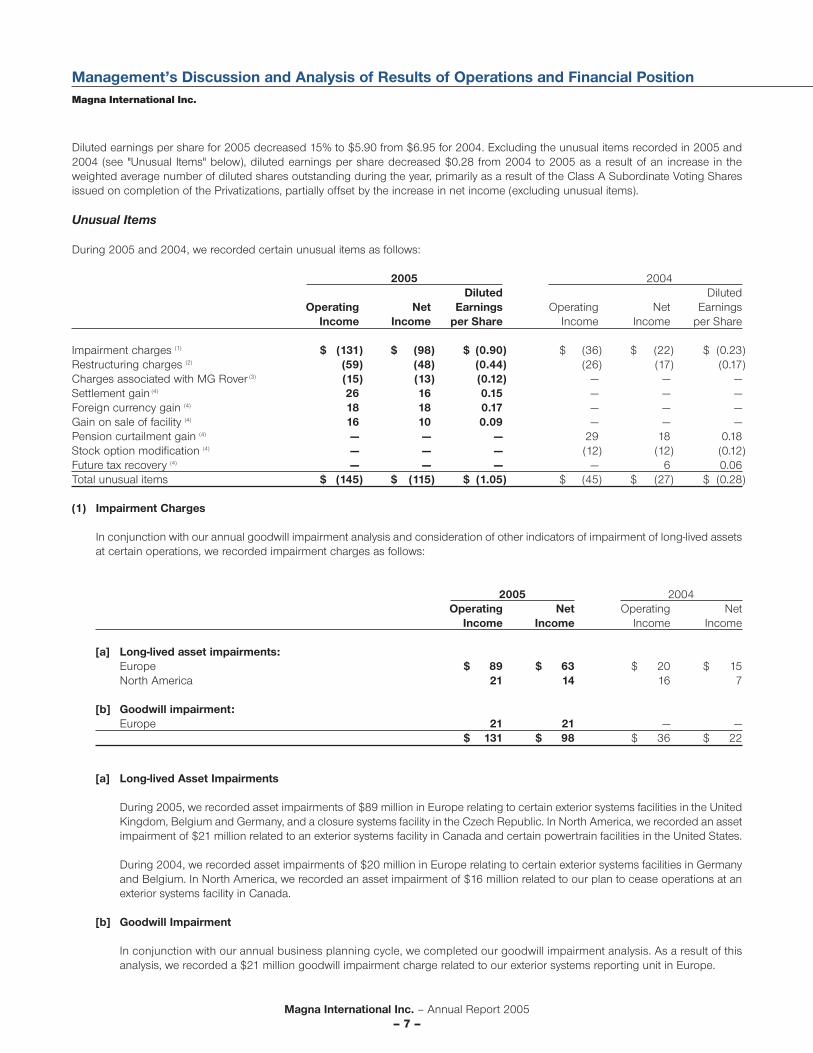
During 2005 and 2004, we recorded certain unusual items as follows:
2005 2004Diluted Diluted
Operating Net Earnings Operating Net EarningsIncome Income per Share Income Income per Share
Impairment charges (1) $ (131) $ (98) $ (0.90) $ (36) $ (22) $ (0.23)Restructuring charges (2) (59) (48) (0.44) (26) (17) (0.17)Charges associated with MG Rover (3) (15) (13) (0.12) — — —Settlement gain (4) 26 16 0.15 — — —Foreign currency gain (4) 18 18 0.17 — — —Gain on sale of facility (4) 16 10 0.09 — — —Pension curtailment gain (4) — — — 29 18 0.18Stock option modification (4) — — — (12) (12) (0.12)Future tax recovery (4) — — — — 6 0.06Total unusual items $ (145) $ (115) $ (1.05) $ (45) $ (27) $ (0.28)
(1) Impairment Charges
In conjunction with our annual goodwill impairment analysis and consideration of other indicators of impairment of long-lived assetsat certain operations, we recorded impairment charges as follows:
2005 2004Operating Net Operating Net
Income Income Income Income
[a] Long-lived asset impairments:Europe $ 89 $ 63 $ 20 $ 15North America 21 14 16 7
[b] Goodwill impairment:Europe 21 21 — —
$ 131 $ 98 $ 36 $ 22
[a] Long-lived Asset Impairments
During 2005, we recorded asset impairments of $89 million in Europe relating to certain exterior systems facilities in the UnitedKingdom, Belgium and Germany, and a closure systems facility in the Czech Republic. In North America, we recorded an assetimpairment of $21 million related to an exterior systems facility in Canada and certain powertrain facilities in the United States.
During 2004, we recorded asset impairments of $20 million in Europe relating to certain exterior systems facilities in Germanyand Belgium. In North America, we recorded an asset impairment of $16 million related to our plan to cease operations at anexterior systems facility in Canada.
[b] Goodwill Impairment
In conjunction with our annual business planning cycle, we completed our goodwill impairment analysis. As a result of thisanalysis, we recorded a $21 million goodwill impairment charge related to our exterior systems reporting unit in Europe.
Magna International Inc. – Annual Report 2005– 8 –
(2) Restructuring Charges
In connection with the Privatizations and industry conditions generally, during 2005 we completed an assessment of our global operatingstructure and capacity. As a result of this assessment, we began to implement a rationalization strategy that includes operatinggroup restructuring and plant consolidations, sales and closures. These actions are necessary to ensure that we remain globallycompetitive.
In Europe, restructuring charges totalled $33 million in 2005 compared to $7 million in 2004. The restructuring charges in 2005related primarily to severance costs at three facilities:
• a mirrors facility in Ireland;• an exterior systems facility in Belgium; and• an engineering centre in France.
The European restructuring charges in 2004 related to costs incurred with respect to the reorganization and closure of certain interiorsfacilities in Germany and the United Kingdom.
In North America, restructuring charges totalled $21 million in 2005 compared to $19 million in 2004. The restructuring charges in2005 related primarily to severance costs incurred as a result of the Privatizations and the consolidation and/or closure of certainexterior systems, powertrain and stampings facilities in Canada and the United States. The restructuring charges in 2004 relatedprimarily to accelerated depreciation and amortization on certain program specific assets that went out of service earlier than originallyplanned.
In addition, we expect to incur additional restructuring and rationalization charges during 2006 in the range of $30 million to $40 millionrelated to activities that were initiated in 2005. Specifically, in January 2006, we reached an agreement with the workers council at anexterior systems facility in Belgium that covers non-contractual termination benefits for employees at this facility. As a result, we willrecord the $8 million cost of this agreement in the first quarter of 2006.
(3) MG Rover
In April 2005, MG Rover Group Limited ("MG Rover") was placed into administration, which is similar to Chapter 11 bankruptcy protectionin the United States (the "MG Rover situation"). As a result, we recorded charges of $15 million related to our MG Rover assets andsupplier obligations during 2005.
(4) Other Unusual Items
In addition to the above, during 2005 we also recorded the following unusual items:
• the receipt of $26 million awarded by a court in a lawsuit commenced by us in 1998 in respect of defective materials installed by asupplier in a real estate project;
• an $18 million foreign currency gain on the repatriation of funds from Europe; and• a $16 million gain on sale of a non-core seat component facility in North America.
In addition to the above, during 2004 we also recorded the following unusual items:
• a $29 million pension curtailment gain as a result of freezing certain defined benefit pension plans since no further benefits accrueunder these plans;
• a $12 million one-time charge to compensation expense as a result of modifying option agreements with certain of our formeremployees; and
• a $6 million future income tax recovery as a result of a reduction in future income tax rates in Europe.
Magna International Inc. – Annual Report 2005– 9 –
Management’s Discussion and Analysis of Results of Operations and Financial PositionMagna International Inc.
Significant Issues
In addition to the unusual items described above, the most significant issues that affected our financial results in 2005 included:
1. Commodity Pricing
During 2005, we paid more for raw materials, including purchased components, used in our production compared to 2004.Although a significant portion of our steel, resins and other components are covered under customer resale programs or short-term andlong-term contracts, increased commodity prices negatively impacted our results in 2005, as compared to 2004. At the same time,scrap steel prices have decreased which negatively impacted our results in 2005, as compared to 2004.
2. Production on Key Programs
In the North American market, 2005 saw the continued trend of declining production and market share of General Motors ("GM")and Ford, two of our largest customers. While North American vehicle production volumes in 2005 remained relatively consistentwith 2004 vehicle production volumes, GM and Ford production volumes declined by 7% and 6%, respectively. More importantly,production volumes on certain of our high content programs declined even further. Production volumes for the Ford Freestar andMercury Monterey, the Ford Explorer and Mercury Mountaineer and the GMT800 platform declined 42%, 30% and 13%, respectivelyin 2005.
Although we experienced declines in volumes on these key programs, we had increases in production volumes on certain other highcontent programs. Production volumes for the Chrysler 300 and 300C, and the Dodge Caravan, Grand Caravan and Chrysler Town &Country increased 38% and 11%, respectively.
3. Pricing Pressures
Given the increasingly competitive nature of the automotive industry, we faced additional price concessions from our customers in 2005as compared to 2004.
4. Launches
During 2005, some of our recently completed production facilities launched significant programs, including:
• a plant in Hermosillo, Mexico that began to supply various stampings for the Ford Fusion, Mercury Milan and Lincoln Zephyr;• a facility in Bowling Green, Kentucky that began to supply frames for the new Ford Explorer and Mercury Mountaineer; and• a fascia mould and paint facility in Georgia that began to supply fascias, rocker panels and body side mouldings for the Mercedes
M-Class and R-Class.
Within the next year, the facility in Kentucky will launch the frame for the new Ford F-Series Super Duty pickup trucks.
As anticipated, the new facilities in Mexico, Kentucky and Georgia incurred start-up losses in 2005, however, we expect an improvementin profitability at these facilities as they continue to ramp-up production.
In addition to the programs launched at these new facilities, we also launched several new programs at existing facilities, including:
• the Chevrolet Cobalt and Pontiac Pursuit;• the Ford Mustang;• the Dodge Charger;• the Mercedes A-Class, B-Class and M-Class; and• the Land Rover Discovery.
Magna International Inc. – Annual Report 2005– 10 –
5. Privatizations
During 2005, we successfully completed the privatizations of our former public subsidiaries: Tesma International Inc. ("Tesma");Decoma International Inc. ("Decoma"); and Intier Automotive Inc. ("Intier"). The Privatizations have allowed us to improve our strategicpositioning, particularly with respect to the development of vehicle modules that cross our traditional product lines, and to betterexploit our various competencies, particularly our complete vehicle expertise. In addition, the Privatizations have allowed us to re-alignour product portfolio, as we did by combining the powertrain capabilities of our former Tesma and Magna Drivetrain businesses,and to avoid duplication of investment, particularly in new markets. We were also able to improve our financial liquidity by completinga new five-year revolving term facility that expires on October 12, 2010. The facility has a North American tranche of $1.57 billion, aEuropean tranche of €300 million and an Asian tranche of $50 million. The new facility replaced the various existing credit lines inplace prior to the Privatizations.
Our operating results for 2005 were negatively impacted by non-cash costs related to the Privatizations, including $30 million due tothe amortization of fair value increments (reflected in the preliminary purchase accounting) and $7 million due to additional stock optioncompensation expense. Offsetting the additional amortization was a reduction in minority interest expense since no minority interestexpense was recorded subsequent to the first quarter of 2005. Finally, our diluted earnings per share were negatively impacted as aresult of the 11.9 million additional Class A Subordinate Voting Shares that were included in the weighted average number of dilutedshares outstanding as a result of the Privatizations.
6. Income Taxes
During 2005, we realized a significant decrease in our effective income tax rate (excluding the unusual items above) compared to 2004,primarily as a result of a decrease in income tax rates in Austria and Mexico, an increase in utilization of losses not previously benefited,a reduction in losses not benefited and tax settlements in certain jurisdictions. In addition to the lower income tax rates, we believe thatour effective income tax rate will remain below historical levels as we expect to capitalize on income tax planning strategies that maycontinue to be available as a result of the Privatizations.
Key Achievements
In addition to managing the significant issues described above, we also took important steps to further strengthen and better positionMagna for the future, including:
1. Strengthened Management
With the successful completion of the Privatizations, our management team was further strengthened. In April 2005, we announced thatDonald Walker and Siegfried Wolf had been appointed as co-Chief Executive Officers with responsibility for North America and Europe,respectively. Don and Siegfried, along with Manfred Gingl, Mark Hogan and Vincent Galifi, combine to create a strong managementpartnership that has the complementary skills necessary to lead us in our continuing evolution and to protect the decentralized andentrepreneurial culture needed for Magna to remain a leader in the global automotive industry. This culture, combined with the commitmentand dedication of our many managers and employees, has been and will remain the cornerstone of our success.
2. Strengthened Customer Relationships
In July, DaimlerChrysler announced the development of a deeper relationship with a select group of key suppliers. Magna was identifiedas one of DaimlerChrysler's Highly Integrated Partnership Organizations ("HI-POs"). This improved model of co-operation with suppliersis intended to provide numerous benefits to the HI-POs, including early involvement in the product development of future models.As an example of this early involvement, DaimlerChrysler announced that Magna had been awarded the vehicle interior, excludingseats, for a future model of the Chrysler Group, scheduled for launch in model year 2008.
Similarly, in September Ford announced that it was entering into new long term "Aligned Business Framework" agreements withselect suppliers, and identified Magna and six other automotive component suppliers as the first of the strategic suppliers in the initialphase of Ford's new framework. The framework anticipates a significant reduction over time in the number of suppliers to Ford.
Magna International Inc. – Annual Report 2005– 11 –
Management’s Discussion and Analysis of Results of Operations and Financial PositionMagna International Inc.
3. Progress in Diversifying our Customer Base
During 2005, we continued our progress in broadening our customer base:
• we were awarded our first ever transfer case business from Nissan for two vehicle programs, one of which is built in North Americaand the other in Japan. These important awards demonstrate our ability to introduce our four-wheel and all-wheel drive competenceto new customers;
• we were awarded significant new interiors and stamping business with an Asian-based OEM for a vehicle built in North America;• we recently launched a new metal stamping facility in France to supply PSA on various vehicle programs;• we were awarded seating and interiors business in Korea; and• we signed a joint venture agreement to supply mirrors in India.
4. Acquisition of Car Top Systems
In December, we announced that we had signed an agreement to purchase CTS Fahrzeug-Dachsysteme GmbH, Bietingheim-Bissingen ("CTS") from Porsche AG. CTS, which stands for Car Top Systems, is one of the world's leading manufacturers of retractablehard top and soft top roof systems, a product area that we believe has good growth potential. The acquisition, which was completedin February of 2006, will allow us to leverage our current closure systems and complete vehicle capabilities. For the year endedDecember 31, 2004, CTS reported sales of approximately €400 million. CTS has six facilities in Europe and two facilities in NorthAmerica, with approximately 1,100 employees.
INDUSTRY TRENDS AND RISKS
A number of trends have had a significant impact on the global automotive industry in recent years, including:
• growth of Asian-based OEMs in North America and Europe and declining production volumes at certain of our traditional North Americanand European customers;
• increased pressure by OEMs on automotive component suppliers to reduce their prices, including through annual retroactive pricereductions, and to bear various additional costs;
• growth of the automotive industry in China, India and other Asian countries, as well as parts of eastern Europe, and the migration ofmanufacturing to such lower cost countries;
• deterioration of the financial condition of the supply base and certain OEMs;• increased engineering capabilities required in order to be awarded new business for more complex systems and modules;• increased prevalence of vehicles built off high-volume global vehicle platforms;• volatility of steel, resin and other commodity prices; and• increases in gas prices prompting consumers to purchase passenger cars instead of large SUVs.
The following are some of the more significant risks that could affect our ability to achieve our desired results:
• The global automotive industry is cyclical and consumer demand for automobiles is sensitive to changes in certain economic and politicalconditions, including interest rates and international conflicts (including acts of terrorism). As a result of these conditions, some of ourcustomers are currently experiencing reduced consumer demand for their vehicles, leading to declining vehicle production volumes.A continued reduction in vehicle production volumes by any of our significant customers could have a material adverse effect on ourprofitability.
• Rising healthcare, pension and other post-employment benefit costs are having a significant adverse effect on the profitability andcompetitiveness of a number of North American and European OEMs and automotive component suppliers. Increased raw materialprices, including steel and resins, are also adversely affecting OEMs and automotive component suppliers. Other economic conditions,such as increased gas prices, have affected and could further threaten sales of certain models, such as full-size sport utility vehicles.All of these conditions, coupled with a decline in market share and overall production volumes, could further threaten the financialcondition of some of our customers, putting additional pressure on us to reduce our prices and exposing us to greater credit risk. In theevent that our customers are unable to satisfy their financial obligations or seek protection from their creditors, as in the case of MGRover, we may incur additional expenses as a result of such credit exposure, which could have a material adverse effect on ourprofitability and financial condition.
Magna International Inc. – Annual Report 2005– 12 –
• Although we supply parts to all of the leading OEMs, a significant majority of our sales are to four OEMs, two of which are rated asbelow investment grade by credit rating agencies. We are attempting to further diversify our customer base, particularly to increaseour business with Asian-based OEMs. A decline in overall production volumes by any of our four largest customers could have an adverseeffect on our profitability, particularly if we are unable to further diversify our customer base. Moreover, while we supply parts for a widevariety of vehicles produced in North America and Europe, we do not supply parts for all vehicles produced, nor is the number or valueof parts evenly distributed among the vehicles for which we do supply parts. Shifts in market share among vehicles (including shifts awayfrom vehicles we assemble) or the early termination, loss, renegotiation of the terms of, or delay in the implementation of any significantproduction or assembly contract could have an adverse effect on our profitability.
• The competitive environment in the automotive industry has been intensifying as our customers seek to take advantage of lower operatingcosts in China, other countries in Asia and parts of eastern Europe. As a result, we are facing increased competition from supplierswhich have manufacturing operations in low cost countries. While we continue to expand our manufacturing footprint with a view totaking advantage of manufacturing opportunities in low cost countries, we cannot guarantee that we will be able to fully realize suchopportunities. Additionally, establishment of manufacturing operations in emerging market countries carries its own risks, including thoserelating to political and economic instability; trade, customs and tax risks; currency exchange rates; currency controls; insufficient infrastructure;and other risks associated with conducting business internationally.
• Over the last year we have experienced significant price increases for key commodities used in our parts production, particularly steeland resin. We expect steel prices will remain at elevated levels in 2006 compared to levels earlier this decade. Approximately half of oursteel is acquired through resale programs operated by the OEMs, which do not expose us to steel price increases, and the balance isacquired through spot, short-term and long-term contracts. However, a steel supplier has challenged its long-term agreements with us forcertain steel products while steel prices were rising and, to the extent that it successfully continues to dispute, terminate or otherwiserefuses to honour its contracts, our exposure to steel price increases will increase to the extent that steel prices remain at elevated levels.We also sell scrap steel, which is generated through our parts production process, and the revenues from these sales have reducedsome of our exposure to steel price increases in the past. However, if scrap steel prices decline, while steel prices remain high, ourability to reduce our exposure to steel price increases will diminish. To the extent we are unable to fully mitigate our exposure toincreased commodity prices by engineering products with reduced steel, resin or other commodity content, or by passing additionalsteel and resin costs to our customers, such additional commodity costs could have a material adverse effect on our profitability.
• We rely on a number of suppliers to supply us with a wide range of components required in connection with our business. Economicconditions, intense pricing pressures, increased commodity prices and a number of other factors have left many automotive componentssuppliers in varying degrees of financial distress. The continued financial distress or the insolvency or bankruptcy of one of our majorsuppliers could disrupt the supply of components to us from these suppliers, possibly resulting in a temporary disruption in the supplyof products by us to our customers. Additionally, the financial distress or the insolvency or bankruptcy of a significant supplier to oneof our customers could disrupt the supply of products to such customer, resulting in a reduction in production by our customer. Sucha reduction in our customer's production could negatively impact our production, resulting in unrecoverable losses, which could havean adverse effect on our profitability. Any prolonged disruption in the supply of critical components by our suppliers or suppliers toone of our customers, the inability to re-source production of a critical component from a financially distressed automotive componentssub-supplier, or any temporary shut-down of one of our production lines or the production lines of our customers, could have a materialadverse effect on our profitability. Additionally, the insolvency, bankruptcy or financial restructuring of any of our critical suppliers couldresult in us incurring unrecoverable costs related to the financial work-out of such suppliers and/or increased exposure for product liability,warranty or recall costs relating to the components supplied by such suppliers to the extent such suppliers are not able to assumeresponsibility for such amounts, which could have an adverse effect on our profitability.
• We have entered into, and will continue to enter into, long-term supply arrangements with our customers which provide for, amongother things, price concessions over the supply term. To date, these concessions have been fully or partially offset by cost reductions arisingprincipally from product and process improvements and price reductions from our suppliers. However, the competitive automotiveindustry environment in North America, Europe and Asia has caused these pricing pressures to intensify. Some of our customers havedemanded, and in light of challenging automotive industry conditions may continue to demand, additional price concessions and/orretroactive price reductions. We may not be successful in offsetting all of these price concessions through improved operating efficiencies,reduced expenditures or reduced prices from our suppliers. To the extent that we are not able to offset price concessions throughcost reductions or improved operating efficiencies, such concessions could have a material adverse effect on our profitability.
Magna International Inc. – Annual Report 2005– 13 –
Management’s Discussion and Analysis of Results of Operations and Financial PositionMagna International Inc.
• We continue to be pressured to absorb costs related to product design, engineering and tooling, as well as other items previously paidfor directly by OEMs. In particular, some OEMs have requested that we pay for design, engineering and tooling costs that are incurredup to the start of production and recover these costs through amortization in the piece price of the applicable component. Some of thesecosts cannot be capitalized, which could adversely affect our profitability until the programs in respect of which they have been incurredare launched. In addition, since our contracts generally do not include any guaranteed minimum purchase requirements, if estimatedproduction volumes are not achieved, these costs may not be fully recovered, which could have an adverse effect on our profitability.
• Our customers continue to demand that we bear the cost of the repair and replacement of defective products which are either coveredunder their warranty or are the subject of a recall by them. If our products are, or are alleged to be, defective, we may be required toparticipate in a recall of those products, particularly if the actual or alleged defect relates to vehicle safety. Warranty provisions areestablished based on our best estimate of the amounts necessary to settle existing or probable claims on product default issues.Recall costs are costs incurred when government regulators and/or our customers decide to recall a product due to a known or suspectedperformance issue, and we are required to participate either voluntarily or involuntarily. Costs typically include the cost of the productbeing replaced, the customer's cost of the recall and labour to remove and replace the defective part. We continue to experienceincreased customer pressure to assume greater warranty responsibility. Currently we only account for existing or probable claims,however, the obligation to repair or replace such products could have a material adverse effect on our profitability and financial condition.
• Contracts from our customers consist of blanket purchase orders which generally provide for the supply of a customer's annualrequirements for a particular vehicle, instead of a specified quantity of products. These blanket purchase orders can be terminated bya customer at any time and, if terminated, could result in us incurring various pre-production, engineering and other costs which we maynot recover from our customer and which could have an adverse effect on our profitability.
• We are also subject to the risk of exposure to product liability claims in the event that the failure of our products results in bodily injuryand/or property damage. Currently, we have bodily injury coverage under insurance policies. This coverage will continue untilSeptember 2006 and is subject to renewal on an annual basis and a per claim deductible. A successful claim against us in excessof our available insurance coverage could have an adverse effect on our profitability and financial condition.
• Although our financial results are reported in U.S. dollars, a significant portion of our sales and operating costs are realized in Canadiandollars, euros, British pounds and other currencies. Our profitability is affected by movements of the U.S. dollar against the Canadiandollar, the euro, the British pound and other currencies in which we generate revenues and incur expenses. However, as a result of hedgingprograms employed by us, primarily in Canada, foreign currency transactions are not fully impacted by the recent movements in exchangerates. We record foreign currency transactions at the hedged rate where applicable. Despite these measures, significant long-term fluctuationsin relative currency values, in particular a significant change in the relative values of the U.S. dollar, Canadian dollar, euro or the Britishpound, could have an adverse effect on our profitability and financial condition.
• In response to the increasingly competitive automotive industry conditions, we may further rationalize some of our production facilities.In the course of such rationalization, we will incur costs related to plant closings and relocations and employee severance costs. Such costscould have an adverse effect on our short-term profitability. In addition, we are working to turnaround financially underperforming divisions,however, there is no guarantee that we will be successful in doing so with respect to some or all such divisions.
• We recorded significant impairment charges in 2005 and may do so in the future. Goodwill must be tested for impairment annually,or more frequently when an event occurs that more likely than not reduces the fair value of a reporting unit below its carrying value.We also evaluate fixed assets and other long-lived assets for impairment whenever indicators of impairment exist. The bankruptcy of asignificant customer or the early termination, loss, renegotiation of the terms of, or delay in the implementation of any significant productioncontract could be indicators of impairment. In addition, to the extent that forward-looking assumptions regarding the impact ofimprovement plans on current operations, in-sourcing and other new business opportunities, program price and cost assumptions oncurrent and future business, the timing of new program launches and future forecasted production volumes are not met, any resultingimpairment loss could have a material adverse impact on our profitability.
• From time to time, we may be contingently liable for contractual and other claims with customers, suppliers and former employees.On an ongoing basis, we attempt to assess the likelihood of any adverse judgements or outcomes to these claims, although it is difficultto predict final outcomes with any degree of certainty. At this time, we do not believe that any of the claims which we are party to willhave a material adverse effect on our financial position, however, we cannot provide any assurance to this effect.

Magna International Inc. – Annual Report 2005– 14 –
RESULTS OF OPERATIONS
Accounting Change
Financial Instruments – Disclosure and Presentation
In 2003, the Canadian Institute of Chartered Accountants ("CICA") amended Handbook Section 3860 "Financial Instruments –Disclosure and Presentation" ("CICA 3860") to require certain obligations that may be settled with an entity's own equity instruments tobe reflected as a liability. The amendments require us to present our Preferred Securities and Subordinated Debentures as liabilities, withthe exception of the equity value ascribed to the holders' option to convert the 6.5% Convertible Subordinated Debentures into Class ASubordinate Voting Shares, and to present the related liability carrying costs as a charge to net income. We adopted these new recommendationseffective January 1, 2005 on a retroactive basis.
The impact of this accounting policy change on the consolidated balance sheet as at December 31, 2004 was as follows:
Increase in other assets $ 2
Decrease in income taxes payables $ 1Increase in long-term debt 216Decrease in debentures' interest obligation 38Decrease in minority interest 68
Decrease in other paid-in-capital $ 75Increase in retained earnings 2Decrease in currency translation adjustment 34
The impact of this accounting policy change on the consolidated statements of income was as follows:
Three months Yearended ended
December 31, December 31,2004 2004
Increase in interest expense $ 2 $ 31Decrease in income taxes — (11)Decrease in minority interest (1) (4)Decrease in net income (1) (16)Decrease in financing charges on Preferred Securities and other paid-in-capital 1 16Decrease in foreign exchange gain on redemption of Preferred Securities — (18)Decrease in net income available to Class A Subordinate Voting and
Class B Shareholders $ — $ (18)
Reduction of earnings per Class A Subordinate Voting or Class B ShareBasic $ — $ (0.18)Diluted $ — $ (0.18)
Magna International Inc. – Annual Report 2005– 15 –
Management’s Discussion and Analysis of Results of Operations and Financial PositionMagna International Inc.
Comparative Period Amounts
European Average Dollar Content per Vehicle
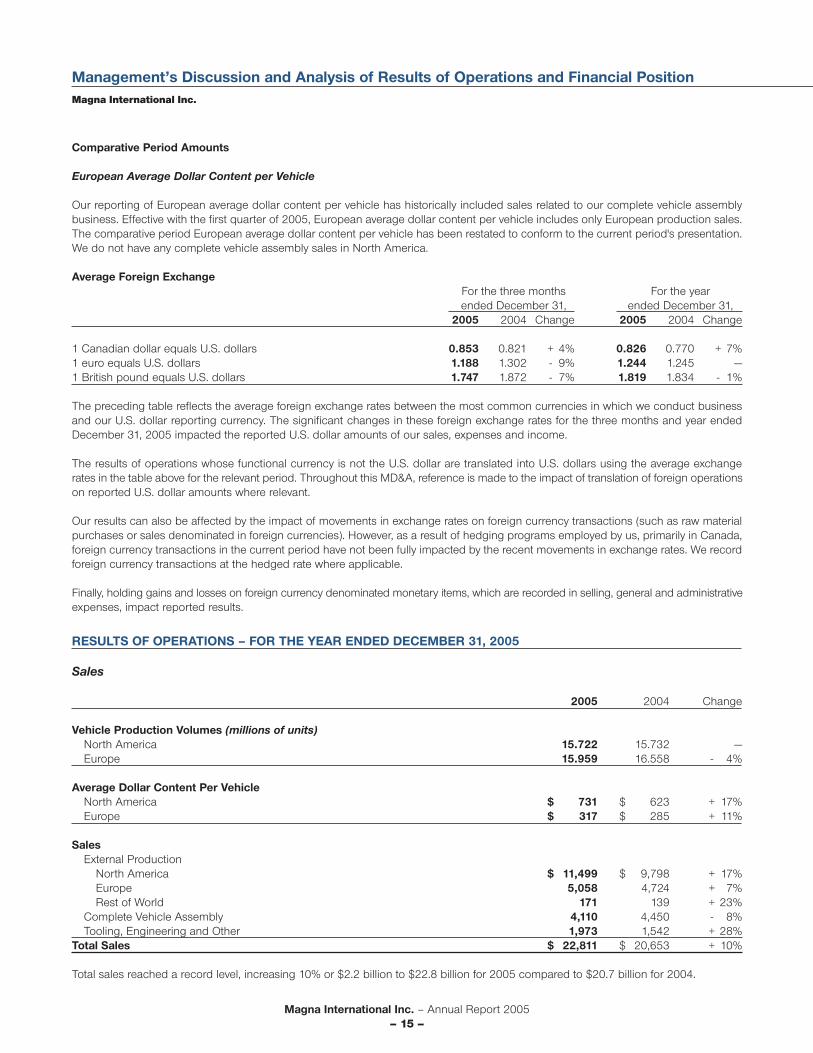
Our reporting of European average dollar content per vehicle has historically included sales related to our complete vehicle assemblybusiness. Effective with the first quarter of 2005, European average dollar content per vehicle includes only European production sales.The comparative period European average dollar content per vehicle has been restated to conform to the current period's presentation.We do not have any complete vehicle assembly sales in North America.
Average Foreign ExchangeFor the three months For the yearended December 31, ended December 31,
2005 2004 Change 2005 2004 Change
1 Canadian dollar equals U.S. dollars 0.853 0.821 + 4% 0.826 0.770 + 7%1 euro equals U.S. dollars 1.188 1.302 - 9% 1.244 1.245 —1 British pound equals U.S. dollars 1.747 1.872 - 7% 1.819 1.834 - 1%
The preceding table reflects the average foreign exchange rates between the most common currencies in which we conduct businessand our U.S. dollar reporting currency. The significant changes in these foreign exchange rates for the three months and year endedDecember 31, 2005 impacted the reported U.S. dollar amounts of our sales, expenses and income.
The results of operations whose functional currency is not the U.S. dollar are translated into U.S. dollars using the average exchangerates in the table above for the relevant period. Throughout this MD&A, reference is made to the impact of translation of foreign operationson reported U.S. dollar amounts where relevant.
Our results can also be affected by the impact of movements in exchange rates on foreign currency transactions (such as raw materialpurchases or sales denominated in foreign currencies). However, as a result of hedging programs employed by us, primarily in Canada,foreign currency transactions in the current period have not been fully impacted by the recent movements in exchange rates. We recordforeign currency transactions at the hedged rate where applicable.
Finally, holding gains and losses on foreign currency denominated monetary items, which are recorded in selling, general and administrativeexpenses, impact reported results.
RESULTS OF OPERATIONS – FOR THE YEAR ENDED DECEMBER 31, 2005
Sales
2005 2004 Change
Vehicle Production Volumes (millions of units)North America 15.722 15.732 —Europe 15.959 16.558 - 4%
Average Dollar Content Per VehicleNorth America $ 731 $ 623 + 17%Europe $ 317 $ 285 + 11%
SalesExternal Production
North America $ 11,499 $ 9,798 + 17%Europe 5,058 4,724 + 7%Rest of World 171 139 + 23%
Complete Vehicle Assembly 4,110 4,450 - 8%Tooling, Engineering and Other 1,973 1,542 + 28%
Total Sales $ 22,811 $ 20,653 + 10%
Total sales reached a record level, increasing 10% or $2.2 billion to $22.8 billion for 2005 compared to $20.7 billion for 2004.

Magna International Inc. – Annual Report 2005– 16 –
External Production Sales - North America
External production sales in North America increased 17% or $1.7 billion to $11.5 billion for 2005 compared to $9.8 billion for 2004. This increasein production sales reflects a 17% increase in our North American average dollar content per vehicle as North American vehicle productionvolumes for 2005 remained relatively consistent with 2004 vehicle production volumes.
Our average dollar content per vehicle grew by 17% or $108 to $731 for 2005 compared to $623 for 2004, primarily as a result of:
• the launch of new programs during or subsequent to the year ended December 31, 2004, including:• the Chevrolet Cobalt and Pontiac Pursuit;• the Hummer H3;• the Ford Mustang;• the Chevrolet HHR;• the Mercedes M-Class; and• the Pontiac Montana SV6, Saturn Relay, Buick Terazza and Chevrolet Uplander;
• the acquisition of the North American operations of NVG in September 2004;• an increase in reported U.S. dollar sales due to the strengthening of the Canadian dollar against the U.S. dollar; and• increased production and/or content on certain programs, including:
• the Chrysler 300 and 300C; and• the Dodge Caravan, Grand Caravan and Chrysler Town & Country.
The factors contributing to the growth in our average dollar content per vehicle were partially offset by:
• the impact of lower production and/or content on certain high content programs, including:• the GMT800 platform;• the Ford Freestar and Mercury Monterey;• the Dodge Ram Pickup;• the Mazda Tribute and Ford Escape; and• the GMC Canyon and Chevrolet Colorado;
• programs that ended production during or subsequent to the year ended December 31, 2004; and• incremental customer price concessions.
External Production Sales - Europe
External production sales in Europe increased 7% or $334 million to $5.1 billion for 2005 compared to $4.7 billion for 2004. This increasein production sales reflects an 11% increase in our European average dollar content per vehicle partially offset by a 4% decline inEuropean vehicle production volumes.
Our average dollar content per vehicle grew by 11% or $32 to $317 for 2005 compared to $285 for 2004, primarily as a result of:
• the launch of new programs during or subsequent to the year ended December 31, 2004, including:• the Mercedes A-Class;• the Mercedes B-Class;• the Land Rover Discovery;• the Land Rover Range Rover Sport; and• the Volkswagen Passat;
• the acquisition of the European operations of NVG in September 2004; and• increased production and/or content on certain programs, including:
• the BMW 1-Series; and• the Volkswagen Transporter and Multivan.
The factors contributing to the growth in our average dollar content per vehicle were partially offset by:
• the impact of lower production and/or content on certain programs, including:• the Mercedes E-Class; and• the Volkswagen Golf;
• the end of production on certain programs, including the end of production on all MG Rover programs as a result of the MG Roversituation; and
• incremental customer price concessions.
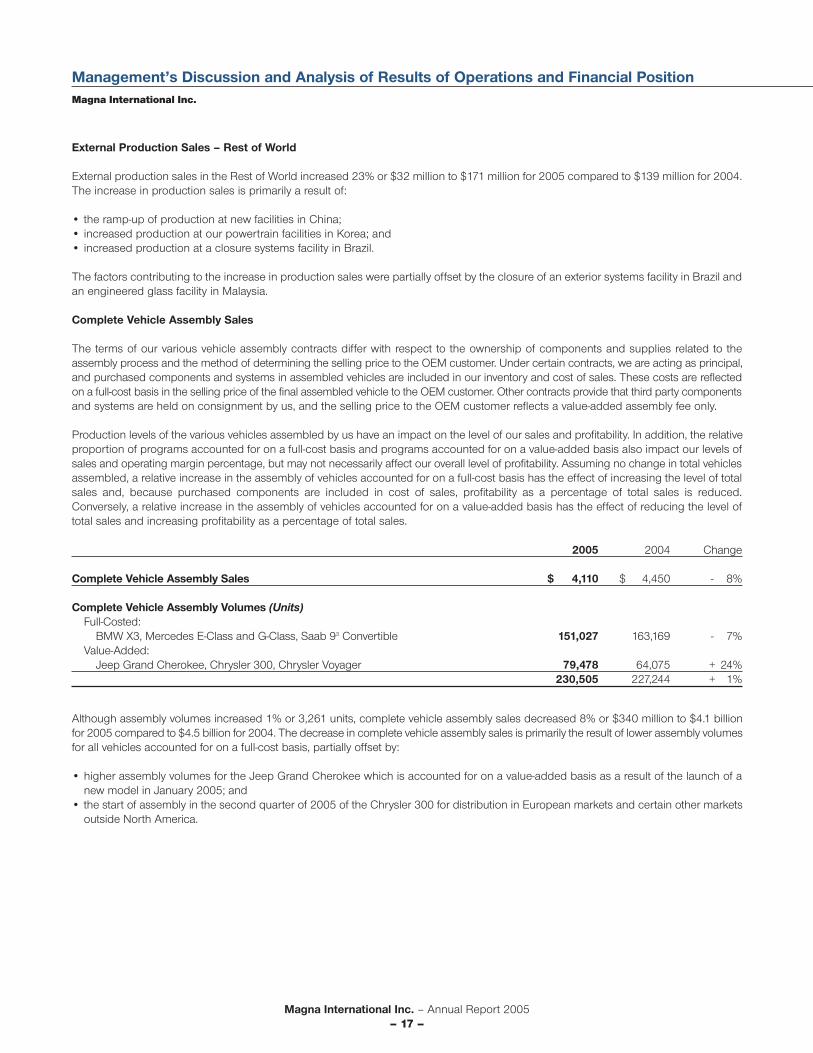
Magna International Inc. – Annual Report 2005– 17 –
Management’s Discussion and Analysis of Results of Operations and Financial PositionMagna International Inc.
External Production Sales – Rest of World
External production sales in the Rest of World increased 23% or $32 million to $171 million for 2005 compared to $139 million for 2004.The increase in production sales is primarily a result of:
• the ramp-up of production at new facilities in China;• increased production at our powertrain facilities in Korea; and• increased production at a closure systems facility in Brazil.
The factors contributing to the increase in production sales were partially offset by the closure of an exterior systems facility in Brazil andan engineered glass facility in Malaysia.
Complete Vehicle Assembly Sales
The terms of our various vehicle assembly contracts differ with respect to the ownership of components and supplies related to theassembly process and the method of determining the selling price to the OEM customer. Under certain contracts, we are acting as principal,and purchased components and systems in assembled vehicles are included in our inventory and cost of sales. These costs are reflectedon a full-cost basis in the selling price of the final assembled vehicle to the OEM customer. Other contracts provide that third party componentsand systems are held on consignment by us, and the selling price to the OEM customer reflects a value-added assembly fee only.
Production levels of the various vehicles assembled by us have an impact on the level of our sales and profitability. In addition, the relativeproportion of programs accounted for on a full-cost basis and programs accounted for on a value-added basis also impact our levels ofsales and operating margin percentage, but may not necessarily affect our overall level of profitability. Assuming no change in total vehiclesassembled, a relative increase in the assembly of vehicles accounted for on a full-cost basis has the effect of increasing the level of totalsales and, because purchased components are included in cost of sales, profitability as a percentage of total sales is reduced.Conversely, a relative increase in the assembly of vehicles accounted for on a value-added basis has the effect of reducing the level oftotal sales and increasing profitability as a percentage of total sales.
2005 2004 Change
Complete Vehicle Assembly Sales $ 4,110 $ 4,450 - 8%
Complete Vehicle Assembly Volumes (Units)Full-Costed:
BMW X3, Mercedes E-Class and G-Class, Saab 93 Convertible 151,027 163,169 - 7%Value-Added:
Jeep Grand Cherokee, Chrysler 300, Chrysler Voyager 79,478 64,075 + 24%230,505 227,244 + 1%
Although assembly volumes increased 1% or 3,261 units, complete vehicle assembly sales decreased 8% or $340 million to $4.1 billionfor 2005 compared to $4.5 billion for 2004. The decrease in complete vehicle assembly sales is primarily the result of lower assembly volumesfor all vehicles accounted for on a full-cost basis, partially offset by:
• higher assembly volumes for the Jeep Grand Cherokee which is accounted for on a value-added basis as a result of the launch of anew model in January 2005; and
• the start of assembly in the second quarter of 2005 of the Chrysler 300 for distribution in European markets and certain other marketsoutside North America.
Magna International Inc. – Annual Report 2005– 18 –
Tooling, Engineering and Other
Tooling, engineering and other sales increased 28% or $431 million to $2.0 billion for 2005 compared to $1.5 billion for 2004.
In 2005 the major programs for which we recorded tooling, engineering and other sales were:
• the BMW X5;• the Jeep Wrangler;• the Mercedes M-Class and R-Class;• GM's next generation full-size pickup and sport utilities platform;• the Ford F-Series Super Duty;• the Ford Fusion, Mercury Milan and Lincoln Zephyr;• the Hummer H3; and• the Dodge Caliber.
In 2004 the major programs for which we recorded tooling, engineering and other sales were:
• the Ford Fusion and Mercury Milan;• the Ford Explorer and Mercury Mountaineer; and• the Mercedes M-Class and R-Class.
In addition, tooling, engineering and other sales increased as a result of the strengthening of the Canadian dollar against the U.S. dollar.
Gross Margin
Gross margin increased $23 million to $2.98 billion for 2005 compared to $2.96 billion for 2004. Gross margin as a percentage of totalsales decreased to 13.1% for 2005 compared to 14.3% for 2004.
On a year-over-year basis, the unusual items, discussed in the "Highlights" section above, negatively impacted gross margin by $40 millionand accounted for a 0.1% decrease in gross margin as a percentage of sales. In addition to these items, gross margin as a percentage ofsales was negatively impacted by:
• an increase in commodity prices, combined with lower scrap steel prices;• a decrease in production volumes for several of our high content programs including the GMT800 platform, and the Ford Freestar and
Mercury Monterey;• inefficiencies at certain facilities;• the acquisition of the NVG business, which currently operates at margins that are lower than our consolidated average gross margin;• incremental customer price concessions;• costs incurred during 2005 at new facilities in preparation for programs that launched during 2005 or for programs that will be launching
subsequent to the end of the year, including:• a new frame facility in Kentucky for the recently launched Ford Explorer and the upcoming launch of the next generation F-Series
Super Duty pickup trucks; and• a new fascia moulding and paint facility in Georgia to support the launches of the Mercedes M-Class and R-Class; and
• an increase in tooling and other sales that earn low or no margins.
The factors contributing to the decrease in gross margin as a percentage of sales were partially offset by:
• productivity and efficiency improvements at certain divisions;• price reductions from our suppliers;• decreased complete vehicle assembly sales for certain vehicles accounted for on a full-cost basis; and• incremental gross margin earned on program launches.

Magna International Inc. – Annual Report 2005– 19 –
Management’s Discussion and Analysis of Results of Operations and Financial PositionMagna International Inc.
Depreciation and Amortization
Depreciation and amortization costs increased 19% or $113 million to $711 million for 2005 compared to $598 million for 2004.Depreciation and amortization costs for 2004 included $14 million of accelerated depreciation recorded on certain program specificassets that went out of service earlier than originally planned. Excluding this accelerated depreciation, the $127 million increase in depreciationwas primarily as a result of:
• an increase in assets employed in the business to support future growth;• amortization of fair value increments related to the Privatizations;• acquisitions completed during or subsequent to 2004; and• an increase in reported U.S. dollar depreciation and amortization due to the strengthening of the Canadian dollar against the U.S. dollar.
Selling, General and Administrative ("SG&A")
SG&A expenses as a percentage of sales decreased to 5.3% for 2005 compared to 5.7% for 2004. SG&A expenses increased 1% or $12 millionto $1,198 million for 2005 compared to $1,186 million for 2004.
The unusual items discussed in the "Highlights" section above effectively reduced SG&A expenses by $21 million on a year-over-year basis.Excluding these items, the $33 million increase in SG&A expenses is primarily a result of:
• increased spending as a result of the acquisition of NVG;• additional stock compensation expense as a result of the Privatizations;• an increase in reported U.S. dollar SG&A due to the strengthening of the Canadian dollar against the U.S. dollar; and• higher infrastructure costs to support the increase in sales levels, including spending to support program launches.
Impairment Charges
Impairment charges increased $95 million to $131 million for 2005 compared to $36 million for 2004. For a complete discussion of theimpairment charges see the "Highlights" section above and note 3 of the accompanying audited consolidated financial statements for theyear ended December 31, 2005.
Earnings before Interest and Taxes ("EBIT") (1)
2005 2004 Change
North America $ 733 $ 886 - 17%Europe 82 176 - 53%Rest of World 2 10 - 80%Corporate and Other 131 79 + 66%Total EBIT $ 948 $ 1,151 - 18%
Included in EBIT for the years ended December 31, 2005 and 2004 were the following unusual items, which have been discussed in the"Highlights" section above.
(1) EBIT is defined as operating income as presented on our audited consolidated financial statements before net interest expense.
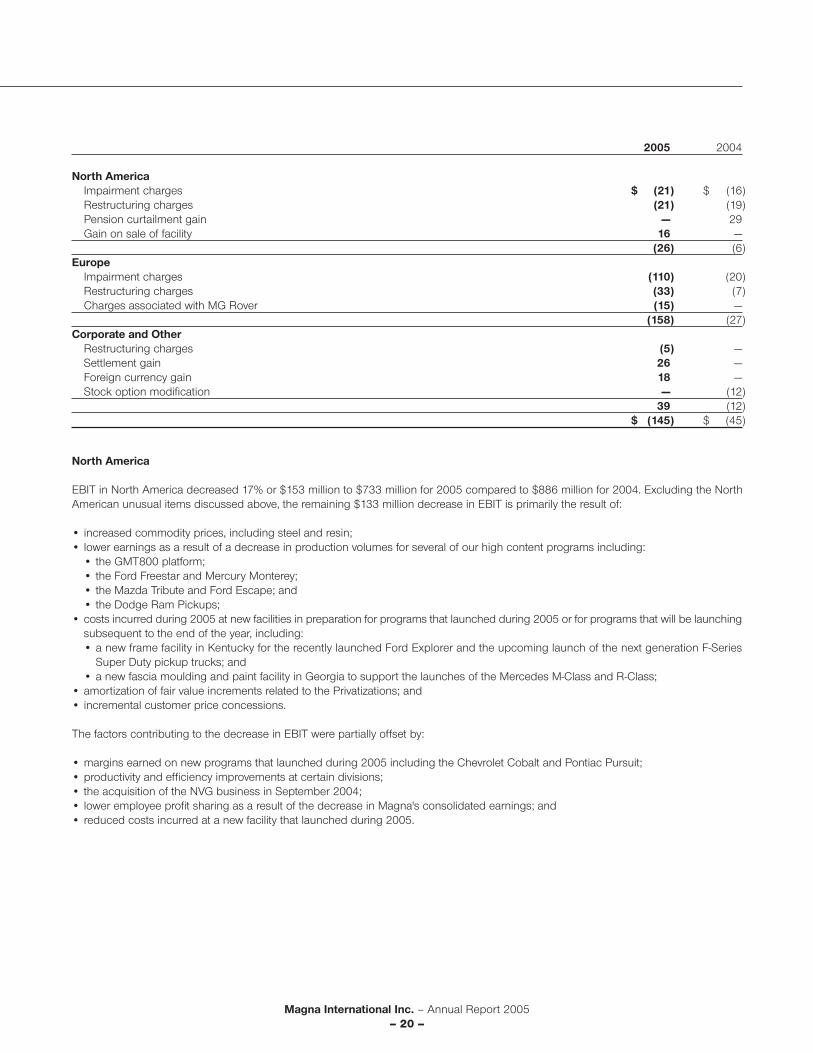
Magna International Inc. – Annual Report 2005– 20 –
2005 2004
North AmericaImpairment charges $ (21) $ (16)Restructuring charges (21) (19)Pension curtailment gain — 29Gain on sale of facility 16 —
(26) (6)Europe
Impairment charges (110) (20)Restructuring charges (33) (7)Charges associated with MG Rover (15) —
(158) (27)Corporate and Other
Restructuring charges (5) —Settlement gain 26 —Foreign currency gain 18 —Stock option modification — (12)
39 (12)$ (145) $ (45)
North America
EBIT in North America decreased 17% or $153 million to $733 million for 2005 compared to $886 million for 2004. Excluding the NorthAmerican unusual items discussed above, the remaining $133 million decrease in EBIT is primarily the result of:
• increased commodity prices, including steel and resin;• lower earnings as a result of a decrease in production volumes for several of our high content programs including:
• the GMT800 platform;• the Ford Freestar and Mercury Monterey;• the Mazda Tribute and Ford Escape; and• the Dodge Ram Pickups;
• costs incurred during 2005 at new facilities in preparation for programs that launched during 2005 or for programs that will be launchingsubsequent to the end of the year, including:• a new frame facility in Kentucky for the recently launched Ford Explorer and the upcoming launch of the next generation F-Series
Super Duty pickup trucks; and• a new fascia moulding and paint facility in Georgia to support the launches of the Mercedes M-Class and R-Class;
• amortization of fair value increments related to the Privatizations; and• incremental customer price concessions.
The factors contributing to the decrease in EBIT were partially offset by:
• margins earned on new programs that launched during 2005 including the Chevrolet Cobalt and Pontiac Pursuit;• productivity and efficiency improvements at certain divisions;• the acquisition of the NVG business in September 2004;• lower employee profit sharing as a result of the decrease in Magna's consolidated earnings; and• reduced costs incurred at a new facility that launched during 2005.
Magna International Inc. – Annual Report 2005– 21 –
Management’s Discussion and Analysis of Results of Operations and Financial PositionMagna International Inc.
Europe
EBIT in Europe decreased 53% or $94 million to $82 million for 2005 compared to $176 million for 2004. Excluding the European unusualitems described above, EBIT increased $37 million in Europe, primarily as a result of:
• increased profits earned in our complete vehicle assembly operations, including the launch of the Chrysler 300 during 2005;• the closure of facilities that generated losses in 2004;• productivity and efficiency improvements at certain divisions;• lower employee profit sharing as a result of the decrease in Magna's consolidated earnings; and• increased margin earned on new programs that launched during or subsequent to 2004.
The factors contributing to the increase in EBIT were partially offset by:
• operating inefficiencies at certain facilities;• lower margins as a result of the decrease in sales on certain high-content programs;• amortization of fair value increments related to the Privatizations;• increased commodity prices; and• incremental customer price concessions.
Rest of World
EBIT in the Rest of World decreased 80% or $8 million to $2 million for 2005 compared to $10 million for 2004. The decrease in EBIT isprimarily the result of costs incurred at new facilities, primarily in China, as we continue to pursue opportunities in this growing market.Partially offsetting these costs was the additional margin earned on the increased production sales discussed above.
Corporate and Other
Corporate and Other EBIT increased 66% or $52 million to $131 million for 2005 compared to $79 million for 2004. Excluding theCorporate and Other unusual items described above, EBIT was relatively unchanged, increasing only by $1 million as a result of:
• increased affiliation fees earned as a result of the increase in sales; and• decreased executive incentive compensation as a result of the decrease in Magna's consolidated earnings.
The factors contributing to the increase in EBIT were partially offset by:
• an increase in stock compensation expense related to the Privatizations; and• a decrease in equity income earned.
Interest Expense
Interest expense decreased 77% or $20 million to $6 million for 2005 compared to $26 million for 2004. The reduction in net interestexpense is primarily the result of:
• a reduction of interest expense related to the Preferred Securities which were redeemed for cash in the third quarter of 2004; and• a reduction in interest expense as a result of the repayments of long-term debt during 2004 and 2005, including the Decoma bank facility
and certain government debt.
The factors contributing to the decrease in net interest expense were partially offset by interest that has been accreted on the senior unsecuredzero-coupon notes that were issued in connection with the NVG acquisition.
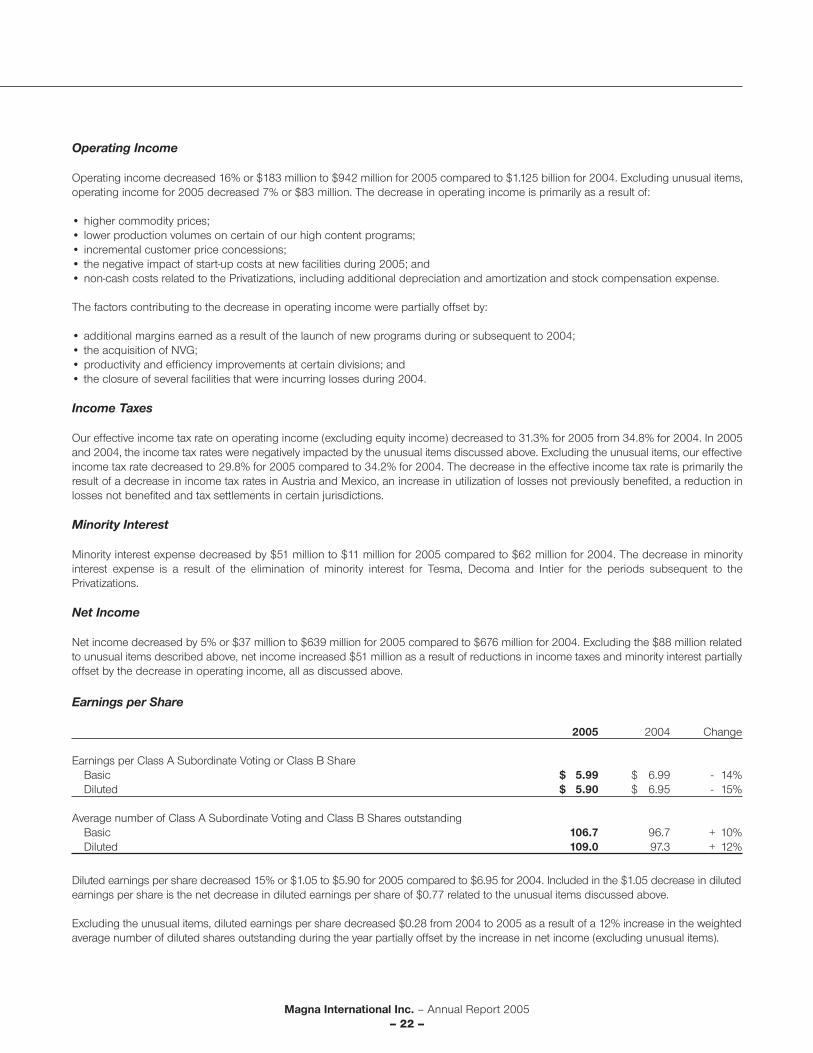
Magna International Inc. – Annual Report 2005– 22 –
Operating Income
Operating income decreased 16% or $183 million to $942 million for 2005 compared to $1.125 billion for 2004. Excluding unusual items,operating income for 2005 decreased 7% or $83 million. The decrease in operating income is primarily as a result of:
• higher commodity prices;• lower production volumes on certain of our high content programs;• incremental customer price concessions;• the negative impact of start-up costs at new facilities during 2005; and• non-cash costs related to the Privatizations, including additional depreciation and amortization and stock compensation expense.
The factors contributing to the decrease in operating income were partially offset by:
• additional margins earned as a result of the launch of new programs during or subsequent to 2004;• the acquisition of NVG;• productivity and efficiency improvements at certain divisions; and• the closure of several facilities that were incurring losses during 2004.
Income Taxes
Our effective income tax rate on operating income (excluding equity income) decreased to 31.3% for 2005 from 34.8% for 2004. In 2005and 2004, the income tax rates were negatively impacted by the unusual items discussed above. Excluding the unusual items, our effectiveincome tax rate decreased to 29.8% for 2005 compared to 34.2% for 2004. The decrease in the effective income tax rate is primarily theresult of a decrease in income tax rates in Austria and Mexico, an increase in utilization of losses not previously benefited, a reduction inlosses not benefited and tax settlements in certain jurisdictions.
Minority Interest
Minority interest expense decreased by $51 million to $11 million for 2005 compared to $62 million for 2004. The decrease in minorityinterest expense is a result of the elimination of minority interest for Tesma, Decoma and Intier for the periods subsequent to thePrivatizations.
Net Income
Net income decreased by 5% or $37 million to $639 million for 2005 compared to $676 million for 2004. Excluding the $88 million relatedto unusual items described above, net income increased $51 million as a result of reductions in income taxes and minority interest partiallyoffset by the decrease in operating income, all as discussed above.
Earnings per Share
2005 2004 Change
Earnings per Class A Subordinate Voting or Class B ShareBasic $ 5.99 $ 6.99 - 14%Diluted $ 5.90 $ 6.95 - 15%
Average number of Class A Subordinate Voting and Class B Shares outstandingBasic 106.7 96.7 + 10%Diluted 109.0 97.3 + 12%
Diluted earnings per share decreased 15% or $1.05 to $5.90 for 2005 compared to $6.95 for 2004. Included in the $1.05 decrease in dilutedearnings per share is the net decrease in diluted earnings per share of $0.77 related to the unusual items discussed above.
Excluding the unusual items, diluted earnings per share decreased $0.28 from 2004 to 2005 as a result of a 12% increase in the weightedaverage number of diluted shares outstanding during the year partially offset by the increase in net income (excluding unusual items).
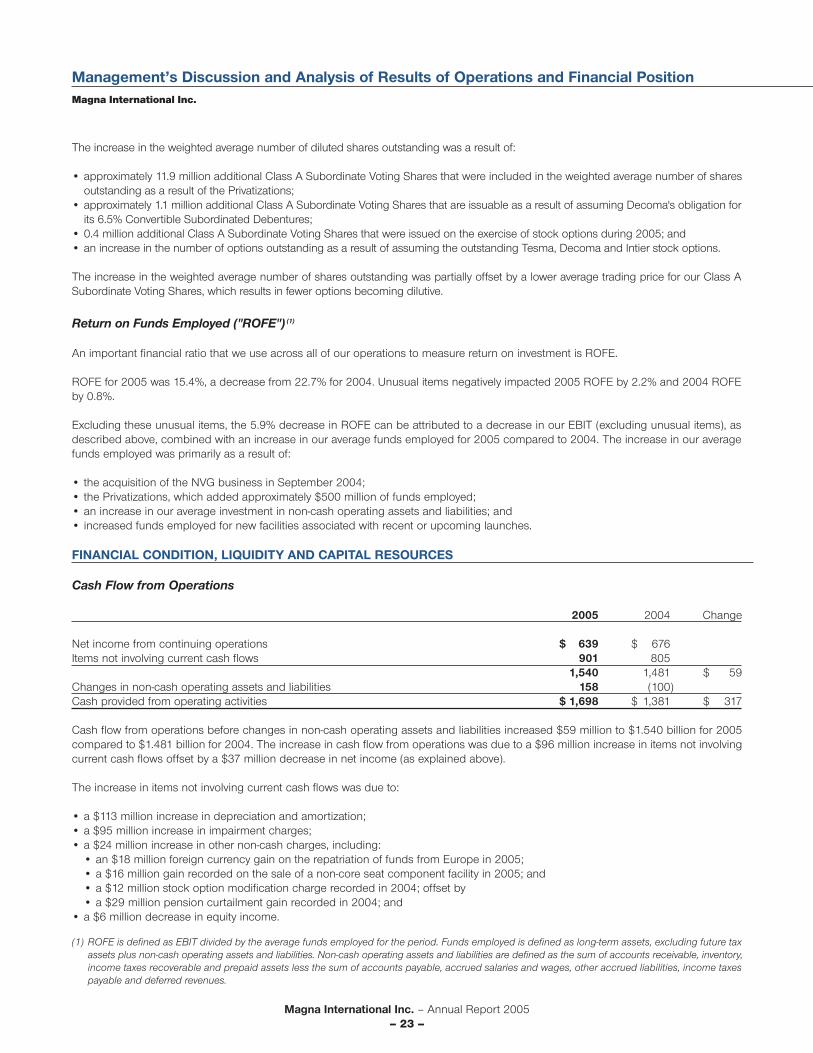
Magna International Inc. – Annual Report 2005– 23 –
Management’s Discussion and Analysis of Results of Operations and Financial PositionMagna International Inc.
The increase in the weighted average number of diluted shares outstanding was a result of:
• approximately 11.9 million additional Class A Subordinate Voting Shares that were included in the weighted average number of sharesoutstanding as a result of the Privatizations;
• approximately 1.1 million additional Class A Subordinate Voting Shares that are issuable as a result of assuming Decoma's obligation forits 6.5% Convertible Subordinated Debentures;
• 0.4 million additional Class A Subordinate Voting Shares that were issued on the exercise of stock options during 2005; and• an increase in the number of options outstanding as a result of assuming the outstanding Tesma, Decoma and Intier stock options.
The increase in the weighted average number of shares outstanding was partially offset by a lower average trading price for our Class ASubordinate Voting Shares, which results in fewer options becoming dilutive.
Return on Funds Employed ("ROFE") (1)
An important financial ratio that we use across all of our operations to measure return on investment is ROFE.
ROFE for 2005 was 15.4%, a decrease from 22.7% for 2004. Unusual items negatively impacted 2005 ROFE by 2.2% and 2004 ROFEby 0.8%.
Excluding these unusual items, the 5.9% decrease in ROFE can be attributed to a decrease in our EBIT (excluding unusual items), asdescribed above, combined with an increase in our average funds employed for 2005 compared to 2004. The increase in our averagefunds employed was primarily as a result of:
• the acquisition of the NVG business in September 2004;• the Privatizations, which added approximately $500 million of funds employed;• an increase in our average investment in non-cash operating assets and liabilities; and• increased funds employed for new facilities associated with recent or upcoming launches.
(1) ROFE is defined as EBIT divided by the average funds employed for the period. Funds employed is defined as long-term assets, excluding future taxassets plus non-cash operating assets and liabilities. Non-cash operating assets and liabilities are defined as the sum of accounts receivable, inventory,income taxes recoverable and prepaid assets less the sum of accounts payable, accrued salaries and wages, other accrued liabilities, income taxespayable and deferred revenues.
FINANCIAL CONDITION, LIQUIDITY AND CAPITAL RESOURCES
Cash Flow from Operations
2005 2004 Change
Net income from continuing operations $ 639 $ 676Items not involving current cash flows 901 805
1,540 1,481 $ 59Changes in non-cash operating assets and liabilities 158 (100)Cash provided from operating activities $ 1,698 $ 1,381 $ 317
Cash flow from operations before changes in non-cash operating assets and liabilities increased $59 million to $1.540 billion for 2005compared to $1.481 billion for 2004. The increase in cash flow from operations was due to a $96 million increase in items not involvingcurrent cash flows offset by a $37 million decrease in net income (as explained above).
The increase in items not involving current cash flows was due to:
• a $113 million increase in depreciation and amortization;• a $95 million increase in impairment charges;• a $24 million increase in other non-cash charges, including:
• an $18 million foreign currency gain on the repatriation of funds from Europe in 2005;• a $16 million gain recorded on the sale of a non-core seat component facility in 2005; and• a $12 million stock option modification charge recorded in 2004; offset by• a $29 million pension curtailment gain recorded in 2004; and
• a $6 million decrease in equity income.
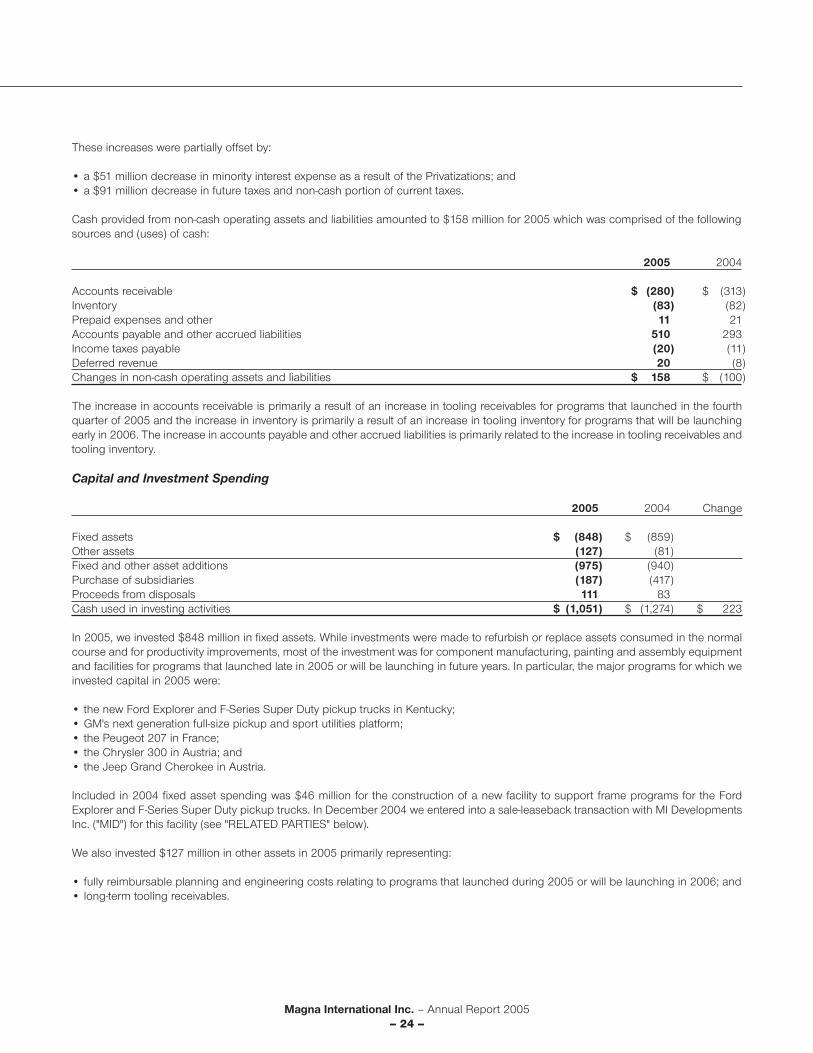
Magna International Inc. – Annual Report 2005– 24 –
These increases were partially offset by:
• a $51 million decrease in minority interest expense as a result of the Privatizations; and• a $91 million decrease in future taxes and non-cash portion of current taxes.
Cash provided from non-cash operating assets and liabilities amounted to $158 million for 2005 which was comprised of the followingsources and (uses) of cash:
2005 2004
Accounts receivable $ (280) $ (313)Inventory (83) (82)Prepaid expenses and other 11 21Accounts payable and other accrued liabilities 510 293Income taxes payable (20) (11)Deferred revenue 20 (8)Changes in non-cash operating assets and liabilities $ 158 $ (100)
The increase in accounts receivable is primarily a result of an increase in tooling receivables for programs that launched in the fourthquarter of 2005 and the increase in inventory is primarily a result of an increase in tooling inventory for programs that will be launchingearly in 2006. The increase in accounts payable and other accrued liabilities is primarily related to the increase in tooling receivables andtooling inventory.
Capital and Investment Spending
2005 2004 Change
Fixed assets $ (848) $ (859)Other assets (127) (81)Fixed and other asset additions (975) (940)Purchase of subsidiaries (187) (417)Proceeds from disposals 111 83Cash used in investing activities $ (1,051) $ (1,274) $ 223
In 2005, we invested $848 million in fixed assets. While investments were made to refurbish or replace assets consumed in the normalcourse and for productivity improvements, most of the investment was for component manufacturing, painting and assembly equipmentand facilities for programs that launched late in 2005 or will be launching in future years. In particular, the major programs for which weinvested capital in 2005 were:
• the new Ford Explorer and F-Series Super Duty pickup trucks in Kentucky;• GM's next generation full-size pickup and sport utilities platform;• the Peugeot 207 in France;• the Chrysler 300 in Austria; and• the Jeep Grand Cherokee in Austria.
Included in 2004 fixed asset spending was $46 million for the construction of a new facility to support frame programs for the FordExplorer and F-Series Super Duty pickup trucks. In December 2004 we entered into a sale-leaseback transaction with MI DevelopmentsInc. ("MID") for this facility (see "RELATED PARTIES" below).
We also invested $127 million in other assets in 2005 primarily representing:
• fully reimbursable planning and engineering costs relating to programs that launched during 2005 or will be launching in 2006; and • long-term tooling receivables.
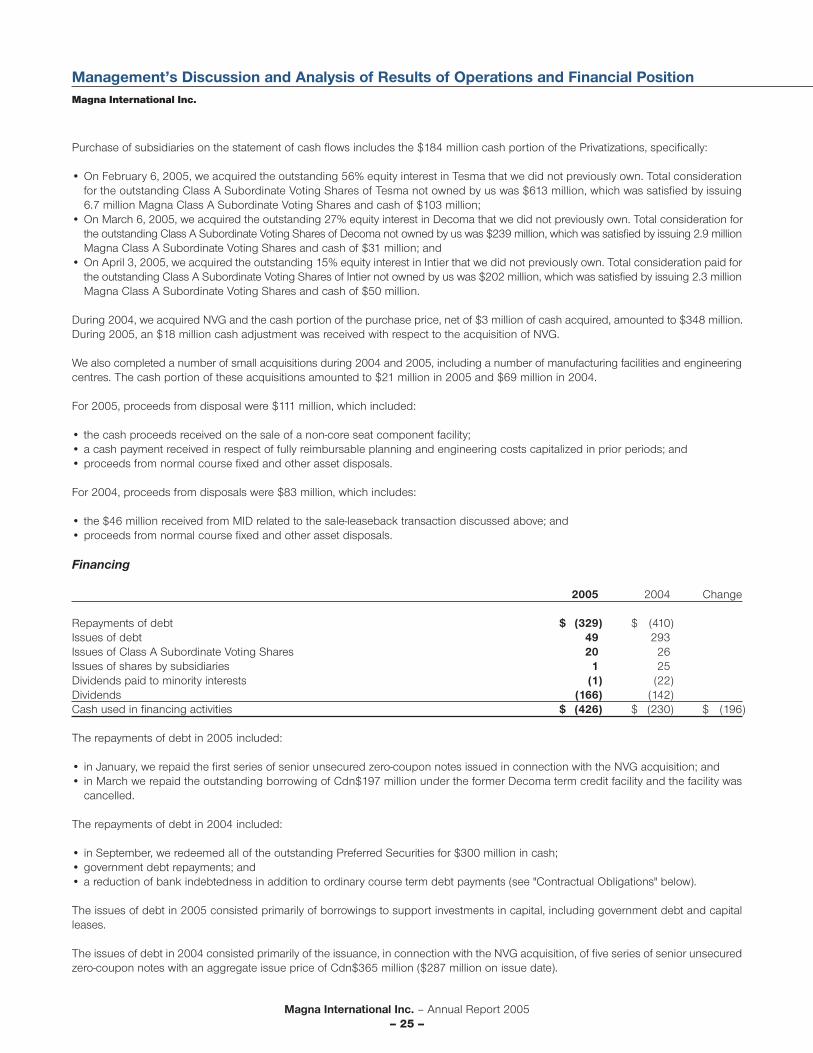
Magna International Inc. – Annual Report 2005– 25 –
Management’s Discussion and Analysis of Results of Operations and Financial PositionMagna International Inc.
Purchase of subsidiaries on the statement of cash flows includes the $184 million cash portion of the Privatizations, specifically:
• On February 6, 2005, we acquired the outstanding 56% equity interest in Tesma that we did not previously own. Total considerationfor the outstanding Class A Subordinate Voting Shares of Tesma not owned by us was $613 million, which was satisfied by issuing6.7 million Magna Class A Subordinate Voting Shares and cash of $103 million;
• On March 6, 2005, we acquired the outstanding 27% equity interest in Decoma that we did not previously own. Total consideration forthe outstanding Class A Subordinate Voting Shares of Decoma not owned by us was $239 million, which was satisfied by issuing 2.9 millionMagna Class A Subordinate Voting Shares and cash of $31 million; and
• On April 3, 2005, we acquired the outstanding 15% equity interest in Intier that we did not previously own. Total consideration paid forthe outstanding Class A Subordinate Voting Shares of Intier not owned by us was $202 million, which was satisfied by issuing 2.3 millionMagna Class A Subordinate Voting Shares and cash of $50 million.
During 2004, we acquired NVG and the cash portion of the purchase price, net of $3 million of cash acquired, amounted to $348 million.During 2005, an $18 million cash adjustment was received with respect to the acquisition of NVG.
We also completed a number of small acquisitions during 2004 and 2005, including a number of manufacturing facilities and engineeringcentres. The cash portion of these acquisitions amounted to $21 million in 2005 and $69 million in 2004.
For 2005, proceeds from disposal were $111 million, which included:
• the cash proceeds received on the sale of a non-core seat component facility;• a cash payment received in respect of fully reimbursable planning and engineering costs capitalized in prior periods; and• proceeds from normal course fixed and other asset disposals.
For 2004, proceeds from disposals were $83 million, which includes:
• the $46 million received from MID related to the sale-leaseback transaction discussed above; and• proceeds from normal course fixed and other asset disposals.
Financing
2005 2004 Change
Repayments of debt $ (329) $ (410)Issues of debt 49 293Issues of Class A Subordinate Voting Shares 20 26Issues of shares by subsidiaries 1 25Dividends paid to minority interests (1) (22)Dividends (166) (142)Cash used in financing activities $ (426) $ (230) $ (196)
The repayments of debt in 2005 included:
• in January, we repaid the first series of senior unsecured zero-coupon notes issued in connection with the NVG acquisition; and• in March we repaid the outstanding borrowing of Cdn$197 million under the former Decoma term credit facility and the facility was
cancelled.
The repayments of debt in 2004 included:
• in September, we redeemed all of the outstanding Preferred Securities for $300 million in cash;• government debt repayments; and• a reduction of bank indebtedness in addition to ordinary course term debt payments (see "Contractual Obligations" below).
The issues of debt in 2005 consisted primarily of borrowings to support investments in capital, including government debt and capitalleases.
The issues of debt in 2004 consisted primarily of the issuance, in connection with the NVG acquisition, of five series of senior unsecuredzero-coupon notes with an aggregate issue price of Cdn$365 million ($287 million on issue date).
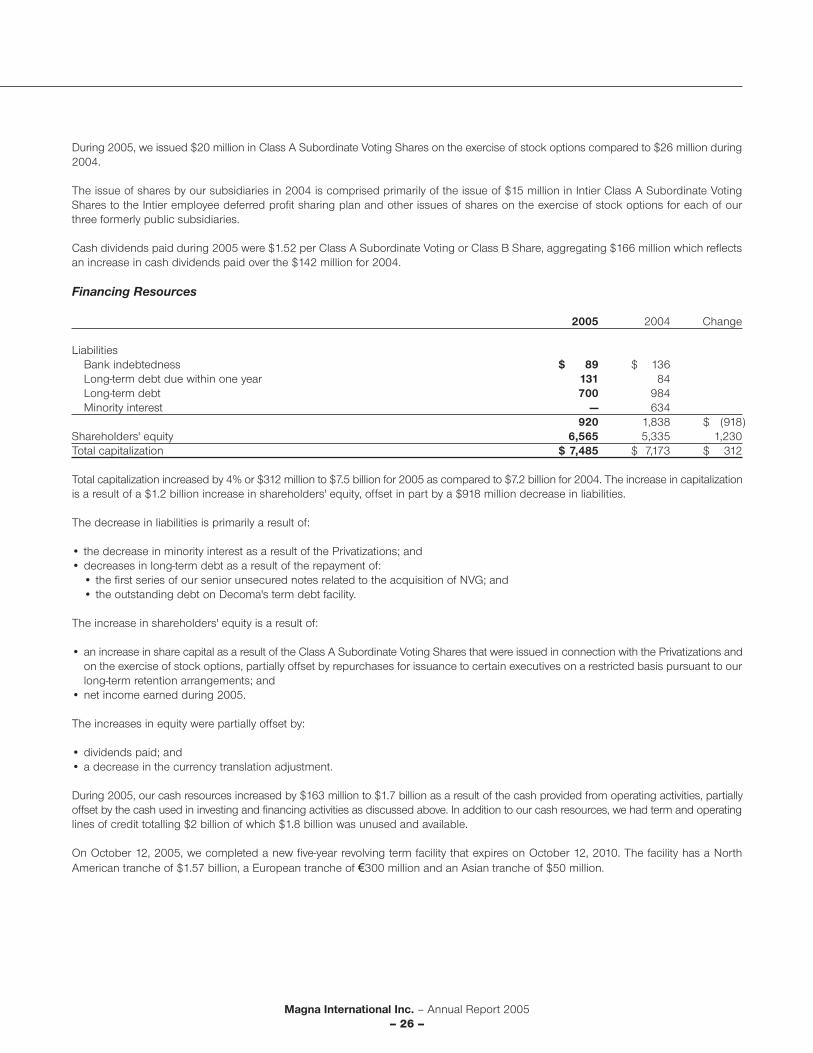
Magna International Inc. – Annual Report 2005– 26 –
During 2005, we issued $20 million in Class A Subordinate Voting Shares on the exercise of stock options compared to $26 million during2004.
The issue of shares by our subsidiaries in 2004 is comprised primarily of the issue of $15 million in Intier Class A Subordinate VotingShares to the Intier employee deferred profit sharing plan and other issues of shares on the exercise of stock options for each of ourthree formerly public subsidiaries.
Cash dividends paid during 2005 were $1.52 per Class A Subordinate Voting or Class B Share, aggregating $166 million which reflectsan increase in cash dividends paid over the $142 million for 2004.
Financing Resources
2005 2004 Change
LiabilitiesBank indebtedness $ 89 $ 136Long-term debt due within one year 131 84Long-term debt 700 984Minority interest — 634
920 1,838 $ (918)Shareholders' equity 6,565 5,335 1,230Total capitalization $ 7,485 $ 7,173 $ 312
Total capitalization increased by 4% or $312 million to $7.5 billion for 2005 as compared to $7.2 billion for 2004. The increase in capitalizationis a result of a $1.2 billion increase in shareholders' equity, offset in part by a $918 million decrease in liabilities.
The decrease in liabilities is primarily a result of:
• the decrease in minority interest as a result of the Privatizations; and• decreases in long-term debt as a result of the repayment of:
• the first series of our senior unsecured notes related to the acquisition of NVG; and• the outstanding debt on Decoma's term debt facility.
The increase in shareholders' equity is a result of:
• an increase in share capital as a result of the Class A Subordinate Voting Shares that were issued in connection with the Privatizations andon the exercise of stock options, partially offset by repurchases for issuance to certain executives on a restricted basis pursuant to ourlong-term retention arrangements; and
• net income earned during 2005.
The increases in equity were partially offset by:
• dividends paid; and• a decrease in the currency translation adjustment.
During 2005, our cash resources increased by $163 million to $1.7 billion as a result of the cash provided from operating activities, partiallyoffset by the cash used in investing and financing activities as discussed above. In addition to our cash resources, we had term and operatinglines of credit totalling $2 billion of which $1.8 billion was unused and available.
On October 12, 2005, we completed a new five-year revolving term facility that expires on October 12, 2010. The facility has a NorthAmerican tranche of $1.57 billion, a European tranche of €300 million and an Asian tranche of $50 million.
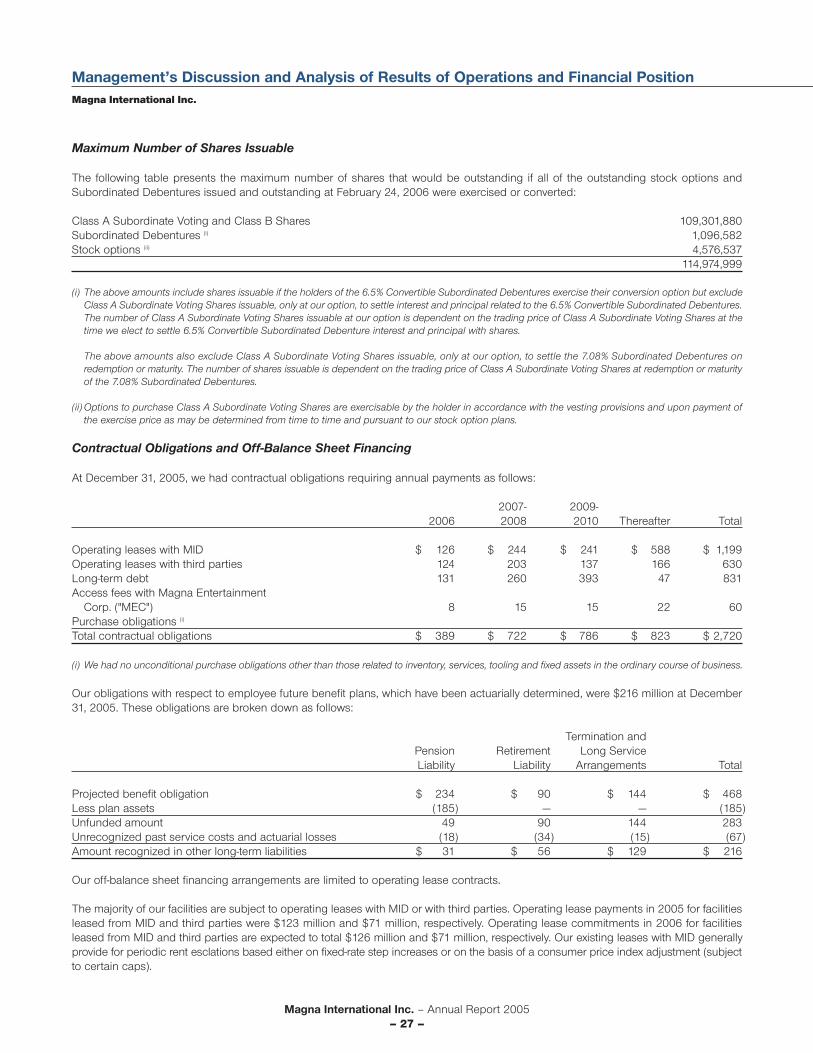
Magna International Inc. – Annual Report 2005– 27 –
Management’s Discussion and Analysis of Results of Operations and Financial PositionMagna International Inc.
Maximum Number of Shares Issuable
The following table presents the maximum number of shares that would be outstanding if all of the outstanding stock options andSubordinated Debentures issued and outstanding at February 24, 2006 were exercised or converted:
Class A Subordinate Voting and Class B Shares 109,301,880Subordinated Debentures (i) 1,096,582Stock options (ii) 4,576,537
114,974,999
(i) The above amounts include shares issuable if the holders of the 6.5% Convertible Subordinated Debentures exercise their conversion option but excludeClass A Subordinate Voting Shares issuable, only at our option, to settle interest and principal related to the 6.5% Convertible Subordinated Debentures.The number of Class A Subordinate Voting Shares issuable at our option is dependent on the trading price of Class A Subordinate Voting Shares at thetime we elect to settle 6.5% Convertible Subordinated Debenture interest and principal with shares.
The above amounts also exclude Class A Subordinate Voting Shares issuable, only at our option, to settle the 7.08% Subordinated Debentures onredemption or maturity. The number of shares issuable is dependent on the trading price of Class A Subordinate Voting Shares at redemption or maturityof the 7.08% Subordinated Debentures.
(ii) Options to purchase Class A Subordinate Voting Shares are exercisable by the holder in accordance with the vesting provisions and upon payment ofthe exercise price as may be determined from time to time and pursuant to our stock option plans.
Contractual Obligations and Off-Balance Sheet Financing
At December 31, 2005, we had contractual obligations requiring annual payments as follows:
2007- 2009-2006 2008 2010 Thereafter Total
Operating leases with MID $ 126 $ 244 $ 241 $ 588 $ 1,199Operating leases with third parties 124 203 137 166 630Long-term debt 131 260 393 47 831Access fees with Magna Entertainment
Corp. ("MEC") 8 15 15 22 60Purchase obligations (i)
Total contractual obligations $ 389 $ 722 $ 786 $ 823 $ 2,720
(i) We had no unconditional purchase obligations other than those related to inventory, services, tooling and fixed assets in the ordinary course of business.
Our obligations with respect to employee future benefit plans, which have been actuarially determined, were $216 million at December31, 2005. These obligations are broken down as follows:
Termination and Pension Retirement Long ServiceLiability Liability Arrangements Total
Projected benefit obligation $ 234 $ 90 $ 144 $ 468Less plan assets (185) — — (185)Unfunded amount 49 90 144 283Unrecognized past service costs and actuarial losses (18) (34) (15) (67)Amount recognized in other long-term liabilities $ 31 $ 56 $ 129 $ 216
Our off-balance sheet financing arrangements are limited to operating lease contracts.
The majority of our facilities are subject to operating leases with MID or with third parties. Operating lease payments in 2005 for facilitiesleased from MID and third parties were $123 million and $71 million, respectively. Operating lease commitments in 2006 for facilitiesleased from MID and third parties are expected to total $126 million and $71 million, respectively. Our existing leases with MID generallyprovide for periodic rent esclations based either on fixed-rate step increases or on the basis of a consumer price index adjustment (subjectto certain caps).

Magna International Inc. – Annual Report 2005– 28 –
We also have operating lease commitments for equipment. These leases are generally of shorter duration. Operating lease payments forequipment totaled $54 million for 2005, and are expected to total $53 million in 2006.
Although our consolidated contractual annual lease commitments decline year by year, we expect that existing leases will either berenewed or replaced, resulting in lease commitments being sustained at current levels, or we will incur capital expenditures to acquireequivalent capacity.
Long-term receivables in other assets are reflected net of outstanding borrowings from a customer's finance subsidiary of $59 millionsince we have a legal right of set-off of the customer's long-term receivable payable to us against such borrowings and intend to settlethe related amounts simultaneously.
Foreign Currency Activities
Our North American operations negotiate sales contracts with OEMs for payment in both U.S. and Canadian dollars. Materials and equipmentare purchased in various currencies depending upon competitive factors, including relative currency values. The North American operationsuse labour and materials which are paid for in both U.S. and Canadian dollars. Our Mexican operations generally use the U.S. dollar asthe functional currency.
Our European operations negotiate sales contracts with OEMs for payment principally in euros and British pounds. The European operations'material, equipment and labour are paid for principally in euros and British pounds.
We employ hedging programs, primarily through the use of foreign exchange forward contracts, in an effort to manage our foreignexchange exposure, which arises when manufacturing facilities have committed to the delivery of products for which the selling pricehas been quoted in foreign currencies. These commitments represent our contractual obligations to deliver products over the durationof the product programs, which can last for a number of years. The amount and timing of the forward contracts will be dependent upona number of factors, including anticipated production delivery schedules and anticipated production costs, which may be paid in the foreigncurrency. Despite these measures, significant long-term fluctuations in relative currency values, in particular a significant change in therelative values of the U.S. dollar, Canadian dollar, euro or British pound, could have an adverse effect on our profitability and financialcondition (as discussed throughout this MD&A).
RELATED PARTIES
Mr. Stronach, our Chairman of the Board, and two members of his family are trustees of the Stronach Trust. The Stronach Trust controlsus through the right to direct the votes attaching to 66% of Magna's Class B Shares and also controls MID, and therefore MEC, throughthe right to direct the votes attaching to 66% of MID's Class B Shares. Various land and buildings used in our operations are leased fromMID under operating lease agreements which are effected on normal commercial terms. Lease expense included in the consolidatedstatements of income with respect to MID for the years ended December 31, 2005 and 2004 was $123 million and $128 million, respectively.Included in accounts payable are trade amounts owing to MID and its subsidiaries in the amount of $2 million.
During 2004, MID provided project management services to us in connection with the construction of a new plant. In December 2004,the land and building for this plant were sold to MID for $46 million and the assumption of related development liabilities of $12 million,representing our cost of these assets. The land and building have been leased back under a 17-year operating lease.
We have agreements with affiliates of the Chairman of the Board for the provision of business development and consulting services. In addition,we have an agreement with the Chairman of the Board for the provision of business development and other services. The aggregateamount expensed under these agreements with respect to the years ended December 31, 2005 and 2004 was $33 million and $40 million,respectively.
During the year ended December 31, 2005, trusts which exist to make orderly purchases of our shares for employees either for transferto the EPSP or to recipients of either bonuses or rights to purchase such shares from the trusts, borrowed up to $51 million from us tofacilitate the purchase of Class A Subordinate Voting Shares. At December 31, 2005, the trusts' indebtedness to us was $21 million.
Investments include $3 million, at cost, in respect of an investment in a company that was established to acquire our shares for sale toemployees.
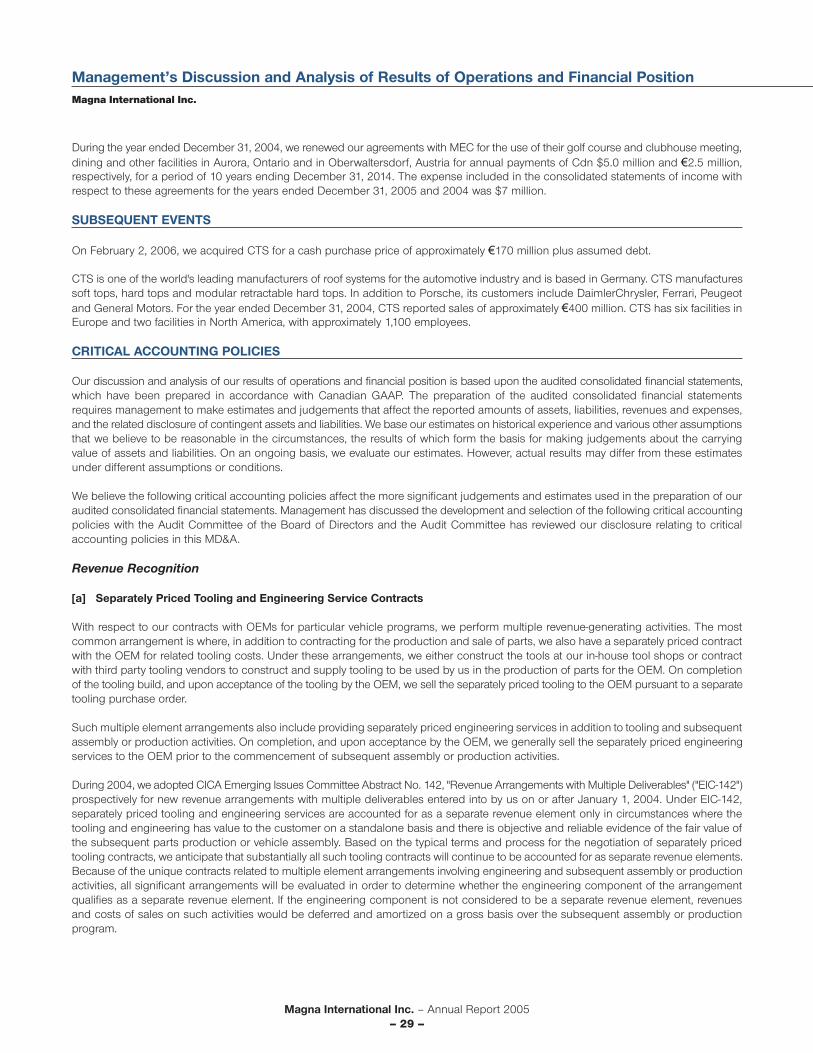
Magna International Inc. – Annual Report 2005– 29 –
Management’s Discussion and Analysis of Results of Operations and Financial PositionMagna International Inc.
During the year ended December 31, 2004, we renewed our agreements with MEC for the use of their golf course and clubhouse meeting,dining and other facilities in Aurora, Ontario and in Oberwaltersdorf, Austria for annual payments of Cdn $5.0 million and €2.5 million,respectively, for a period of 10 years ending December 31, 2014. The expense included in the consolidated statements of income withrespect to these agreements for the years ended December 31, 2005 and 2004 was $7 million.
SUBSEQUENT EVENTS
On February 2, 2006, we acquired CTS for a cash purchase price of approximately €170 million plus assumed debt.
CTS is one of the world's leading manufacturers of roof systems for the automotive industry and is based in Germany. CTS manufacturessoft tops, hard tops and modular retractable hard tops. In addition to Porsche, its customers include DaimlerChrysler, Ferrari, Peugeotand General Motors. For the year ended December 31, 2004, CTS reported sales of approximately €400 million. CTS has six facilities inEurope and two facilities in North America, with approximately 1,100 employees.
CRITICAL ACCOUNTING POLICIES
Our discussion and analysis of our results of operations and financial position is based upon the audited consolidated financial statements,which have been prepared in accordance with Canadian GAAP. The preparation of the audited consolidated financial statementsrequires management to make estimates and judgements that affect the reported amounts of assets, liabilities, revenues and expenses,and the related disclosure of contingent assets and liabilities. We base our estimates on historical experience and various other assumptionsthat we believe to be reasonable in the circumstances, the results of which form the basis for making judgements about the carryingvalue of assets and liabilities. On an ongoing basis, we evaluate our estimates. However, actual results may differ from these estimatesunder different assumptions or conditions.
We believe the following critical accounting policies affect the more significant judgements and estimates used in the preparation of ouraudited consolidated financial statements. Management has discussed the development and selection of the following critical accountingpolicies with the Audit Committee of the Board of Directors and the Audit Committee has reviewed our disclosure relating to criticalaccounting policies in this MD&A.
Revenue Recognition
[a] Separately Priced Tooling and Engineering Service Contracts
With respect to our contracts with OEMs for particular vehicle programs, we perform multiple revenue-generating activities. The mostcommon arrangement is where, in addition to contracting for the production and sale of parts, we also have a separately priced contractwith the OEM for related tooling costs. Under these arrangements, we either construct the tools at our in-house tool shops or contractwith third party tooling vendors to construct and supply tooling to be used by us in the production of parts for the OEM. On completionof the tooling build, and upon acceptance of the tooling by the OEM, we sell the separately priced tooling to the OEM pursuant to a separatetooling purchase order.
Such multiple element arrangements also include providing separately priced engineering services in addition to tooling and subsequentassembly or production activities. On completion, and upon acceptance by the OEM, we generally sell the separately priced engineeringservices to the OEM prior to the commencement of subsequent assembly or production activities.
During 2004, we adopted CICA Emerging Issues Committee Abstract No. 142, "Revenue Arrangements with Multiple Deliverables" ("EIC-142")prospectively for new revenue arrangements with multiple deliverables entered into by us on or after January 1, 2004. Under EIC-142,separately priced tooling and engineering services are accounted for as a separate revenue element only in circumstances where thetooling and engineering has value to the customer on a standalone basis and there is objective and reliable evidence of the fair value ofthe subsequent parts production or vehicle assembly. Based on the typical terms and process for the negotiation of separately pricedtooling contracts, we anticipate that substantially all such tooling contracts will continue to be accounted for as separate revenue elements.Because of the unique contracts related to multiple element arrangements involving engineering and subsequent assembly or productionactivities, all significant arrangements will be evaluated in order to determine whether the engineering component of the arrangementqualifies as a separate revenue element. If the engineering component is not considered to be a separate revenue element, revenuesand costs of sales on such activities would be deferred and amortized on a gross basis over the subsequent assembly or productionprogram.
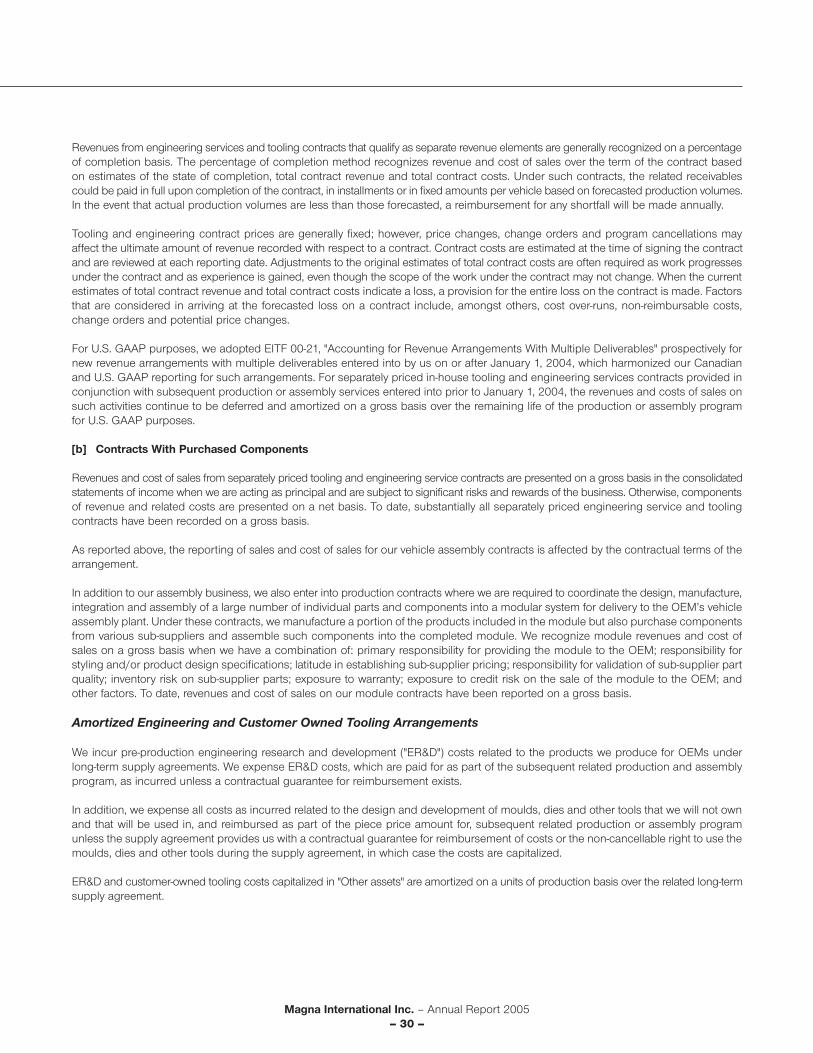
Magna International Inc. – Annual Report 2005– 30 –
Revenues from engineering services and tooling contracts that qualify as separate revenue elements are generally recognized on a percentageof completion basis. The percentage of completion method recognizes revenue and cost of sales over the term of the contract basedon estimates of the state of completion, total contract revenue and total contract costs. Under such contracts, the related receivablescould be paid in full upon completion of the contract, in installments or in fixed amounts per vehicle based on forecasted production volumes.In the event that actual production volumes are less than those forecasted, a reimbursement for any shortfall will be made annually.
Tooling and engineering contract prices are generally fixed; however, price changes, change orders and program cancellations mayaffect the ultimate amount of revenue recorded with respect to a contract. Contract costs are estimated at the time of signing the contractand are reviewed at each reporting date. Adjustments to the original estimates of total contract costs are often required as work progressesunder the contract and as experience is gained, even though the scope of the work under the contract may not change. When the currentestimates of total contract revenue and total contract costs indicate a loss, a provision for the entire loss on the contract is made. Factorsthat are considered in arriving at the forecasted loss on a contract include, amongst others, cost over-runs, non-reimbursable costs,change orders and potential price changes.
For U.S. GAAP purposes, we adopted EITF 00-21, "Accounting for Revenue Arrangements With Multiple Deliverables" prospectively fornew revenue arrangements with multiple deliverables entered into by us on or after January 1, 2004, which harmonized our Canadianand U.S. GAAP reporting for such arrangements. For separately priced in-house tooling and engineering services contracts provided inconjunction with subsequent production or assembly services entered into prior to January 1, 2004, the revenues and costs of sales onsuch activities continue to be deferred and amortized on a gross basis over the remaining life of the production or assembly programfor U.S. GAAP purposes.
[b] Contracts With Purchased Components
Revenues and cost of sales from separately priced tooling and engineering service contracts are presented on a gross basis in the consolidatedstatements of income when we are acting as principal and are subject to significant risks and rewards of the business. Otherwise, componentsof revenue and related costs are presented on a net basis. To date, substantially all separately priced engineering service and toolingcontracts have been recorded on a gross basis.
As reported above, the reporting of sales and cost of sales for our vehicle assembly contracts is affected by the contractual terms of thearrangement.
In addition to our assembly business, we also enter into production contracts where we are required to coordinate the design, manufacture,integration and assembly of a large number of individual parts and components into a modular system for delivery to the OEM’s vehicleassembly plant. Under these contracts, we manufacture a portion of the products included in the module but also purchase componentsfrom various sub-suppliers and assemble such components into the completed module. We recognize module revenues and cost ofsales on a gross basis when we have a combination of: primary responsibility for providing the module to the OEM; responsibility forstyling and/or product design specifications; latitude in establishing sub-supplier pricing; responsibility for validation of sub-supplier partquality; inventory risk on sub-supplier parts; exposure to warranty; exposure to credit risk on the sale of the module to the OEM; andother factors. To date, revenues and cost of sales on our module contracts have been reported on a gross basis.
Amortized Engineering and Customer Owned Tooling Arrangements
We incur pre-production engineering research and development ("ER&D") costs related to the products we produce for OEMs underlong-term supply agreements. We expense ER&D costs, which are paid for as part of the subsequent related production and assemblyprogram, as incurred unless a contractual guarantee for reimbursement exists.
In addition, we expense all costs as incurred related to the design and development of moulds, dies and other tools that we will not ownand that will be used in, and reimbursed as part of the piece price amount for, subsequent related production or assembly programunless the supply agreement provides us with a contractual guarantee for reimbursement of costs or the non-cancellable right to use themoulds, dies and other tools during the supply agreement, in which case the costs are capitalized.
ER&D and customer-owned tooling costs capitalized in "Other assets" are amortized on a units of production basis over the related long-termsupply agreement.
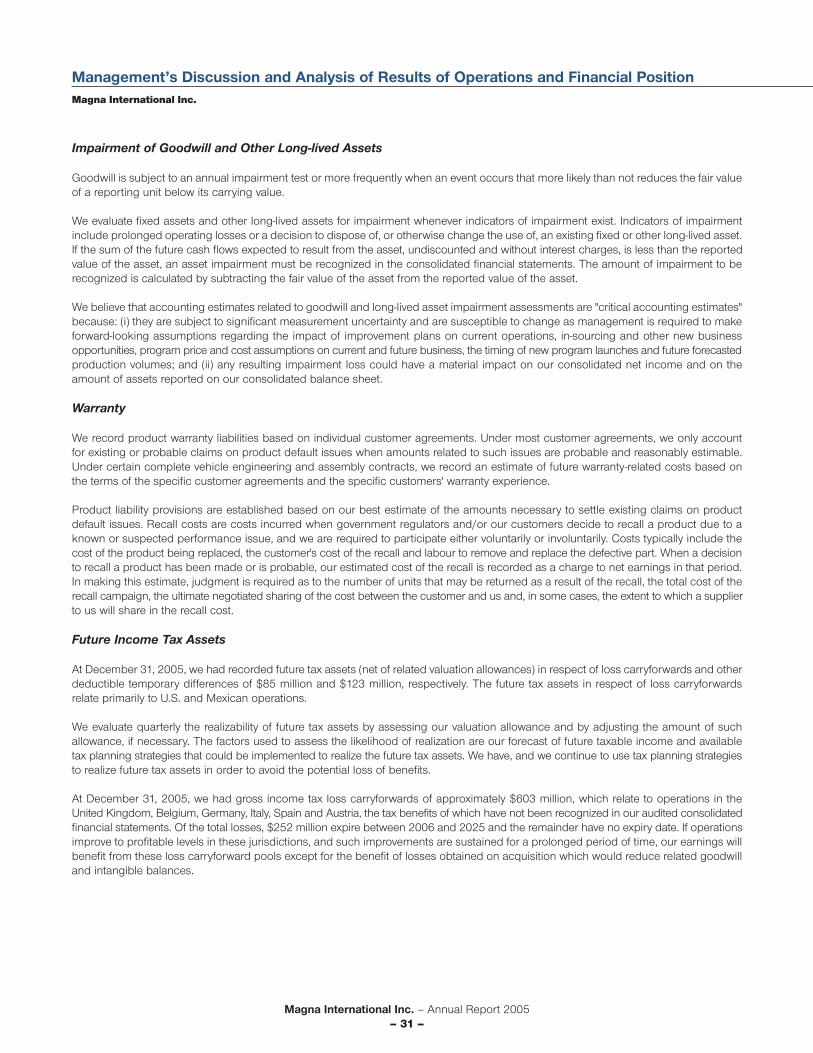
Magna International Inc. – Annual Report 2005– 31 –
Management’s Discussion and Analysis of Results of Operations and Financial PositionMagna International Inc.
Impairment of Goodwill and Other Long-lived Assets
Goodwill is subject to an annual impairment test or more frequently when an event occurs that more likely than not reduces the fair valueof a reporting unit below its carrying value.
We evaluate fixed assets and other long-lived assets for impairment whenever indicators of impairment exist. Indicators of impairmentinclude prolonged operating losses or a decision to dispose of, or otherwise change the use of, an existing fixed or other long-lived asset.If the sum of the future cash flows expected to result from the asset, undiscounted and without interest charges, is less than the reportedvalue of the asset, an asset impairment must be recognized in the consolidated financial statements. The amount of impairment to berecognized is calculated by subtracting the fair value of the asset from the reported value of the asset.
We believe that accounting estimates related to goodwill and long-lived asset impairment assessments are "critical accounting estimates"because: (i) they are subject to significant measurement uncertainty and are susceptible to change as management is required to makeforward-looking assumptions regarding the impact of improvement plans on current operations, in-sourcing and other new businessopportunities, program price and cost assumptions on current and future business, the timing of new program launches and future forecastedproduction volumes; and (ii) any resulting impairment loss could have a material impact on our consolidated net income and on theamount of assets reported on our consolidated balance sheet.
Warranty
We record product warranty liabilities based on individual customer agreements. Under most customer agreements, we only accountfor existing or probable claims on product default issues when amounts related to such issues are probable and reasonably estimable.Under certain complete vehicle engineering and assembly contracts, we record an estimate of future warranty-related costs based onthe terms of the specific customer agreements and the specific customers' warranty experience.
Product liability provisions are established based on our best estimate of the amounts necessary to settle existing claims on productdefault issues. Recall costs are costs incurred when government regulators and/or our customers decide to recall a product due to aknown or suspected performance issue, and we are required to participate either voluntarily or involuntarily. Costs typically include thecost of the product being replaced, the customer's cost of the recall and labour to remove and replace the defective part. When a decisionto recall a product has been made or is probable, our estimated cost of the recall is recorded as a charge to net earnings in that period.In making this estimate, judgment is required as to the number of units that may be returned as a result of the recall, the total cost of therecall campaign, the ultimate negotiated sharing of the cost between the customer and us and, in some cases, the extent to which a supplierto us will share in the recall cost.
Future Income Tax Assets
At December 31, 2005, we had recorded future tax assets (net of related valuation allowances) in respect of loss carryforwards and otherdeductible temporary differences of $85 million and $123 million, respectively. The future tax assets in respect of loss carryforwardsrelate primarily to U.S. and Mexican operations.
We evaluate quarterly the realizability of future tax assets by assessing our valuation allowance and by adjusting the amount of suchallowance, if necessary. The factors used to assess the likelihood of realization are our forecast of future taxable income and availabletax planning strategies that could be implemented to realize the future tax assets. We have, and we continue to use tax planning strategiesto realize future tax assets in order to avoid the potential loss of benefits.
At December 31, 2005, we had gross income tax loss carryforwards of approximately $603 million, which relate to operations in theUnited Kingdom, Belgium, Germany, Italy, Spain and Austria, the tax benefits of which have not been recognized in our audited consolidatedfinancial statements. Of the total losses, $252 million expire between 2006 and 2025 and the remainder have no expiry date. If operationsimprove to profitable levels in these jurisdictions, and such improvements are sustained for a prolonged period of time, our earnings willbenefit from these loss carryforward pools except for the benefit of losses obtained on acquisition which would reduce related goodwilland intangible balances.
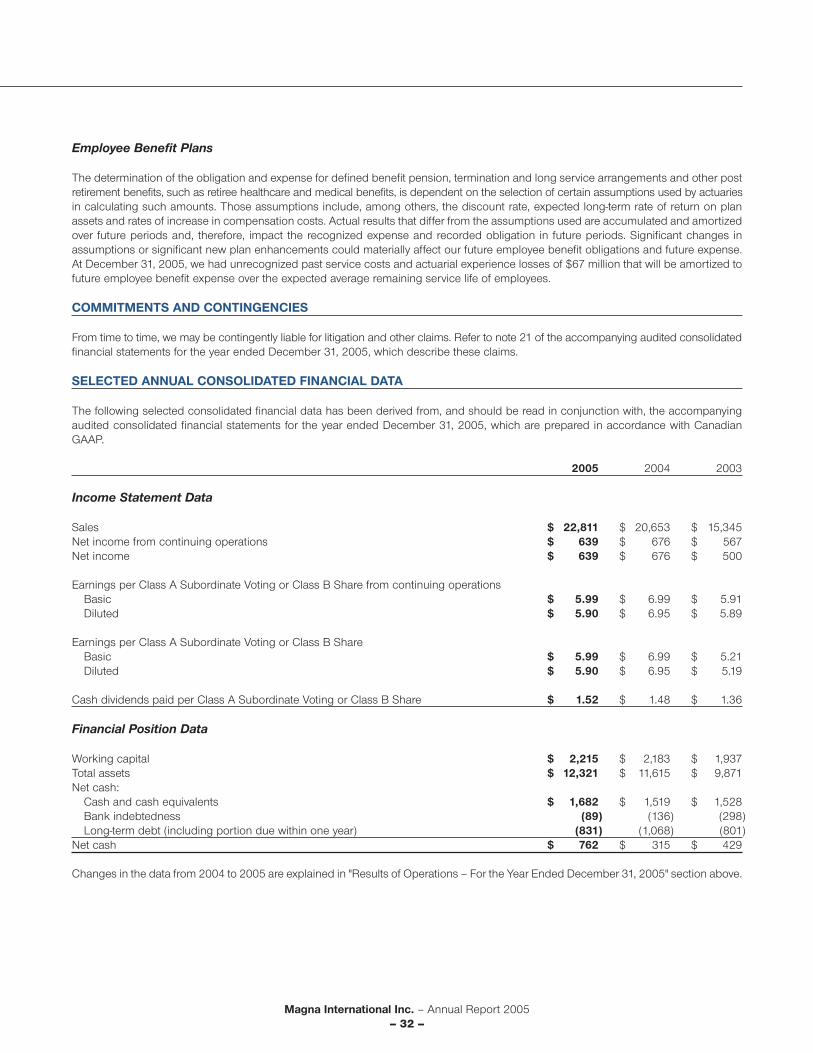
Magna International Inc. – Annual Report 2005– 32 –
Employee Benefit Plans
The determination of the obligation and expense for defined benefit pension, termination and long service arrangements and other postretirement benefits, such as retiree healthcare and medical benefits, is dependent on the selection of certain assumptions used by actuariesin calculating such amounts. Those assumptions include, among others, the discount rate, expected long-term rate of return on planassets and rates of increase in compensation costs. Actual results that differ from the assumptions used are accumulated and amortizedover future periods and, therefore, impact the recognized expense and recorded obligation in future periods. Significant changes inassumptions or significant new plan enhancements could materially affect our future employee benefit obligations and future expense.At December 31, 2005, we had unrecognized past service costs and actuarial experience losses of $67 million that will be amortized tofuture employee benefit expense over the expected average remaining service life of employees.
COMMITMENTS AND CONTINGENCIES
From time to time, we may be contingently liable for litigation and other claims. Refer to note 21 of the accompanying audited consolidatedfinancial statements for the year ended December 31, 2005, which describe these claims.
SELECTED ANNUAL CONSOLIDATED FINANCIAL DATA
The following selected consolidated financial data has been derived from, and should be read in conjunction with, the accompanyingaudited consolidated financial statements for the year ended December 31, 2005, which are prepared in accordance with CanadianGAAP.
2005 2004 2003
Income Statement Data
Sales $ 22,811 $ 20,653 $ 15,345Net income from continuing operations $ 639 $ 676 $ 567Net income $ 639 $ 676 $ 500
Earnings per Class A Subordinate Voting or Class B Share from continuing operationsBasic $ 5.99 $ 6.99 $ 5.91Diluted $ 5.90 $ 6.95 $ 5.89
Earnings per Class A Subordinate Voting or Class B ShareBasic $ 5.99 $ 6.99 $ 5.21Diluted $ 5.90 $ 6.95 $ 5.19
Cash dividends paid per Class A Subordinate Voting or Class B Share $ 1.52 $ 1.48 $ 1.36
Financial Position Data
Working capital $ 2,215 $ 2,183 $ 1,937Total assets $ 12,321 $ 11,615 $ 9,871Net cash:
Cash and cash equivalents $ 1,682 $ 1,519 $ 1,528Bank indebtedness (89) (136) (298)Long-term debt (including portion due within one year) (831) (1,068) (801)
Net cash $ 762 $ 315 $ 429
Changes in the data from 2004 to 2005 are explained in "Results of Operations – For the Year Ended December 31, 2005" section above.
Magna International Inc. – Annual Report 2005– 33 –
Management’s Discussion and Analysis of Results of Operations and Financial PositionMagna International Inc.
2004 COMPARED TO 2003
Sales
External Production Sales - North America
External production sales in North America increased 18% or $1.5 billion to $9.8 billion for 2004 compared to $8.3 billion for 2003. This increasein production sales reflects a 19% increase in our North American average dollar content per vehicle over 2003, partially offset by a 1%decline in North American vehicle production volumes from 2003.
Our average dollar content per vehicle grew by 19% or $98 to $623 for 2004 compared to $525 for 2003. The increase relates primarily to:
• the launch of new programs during or subsequent to 2003, including:• the Chevrolet Equinox;• the GMC Canyon and Chevrolet Colorado;• the Ford Freestar and Mercury Monterey;• the Ford F-Series;• the Chevrolet Malibu; and• the Dodge Durango;
• acquisitions completed during 2004, including the NVG and Davis Industries Inc. ("Davis") acquisitions; and• an increase in reported U.S. dollar sales due to the strengthening of the Canadian dollar against the U.S. dollar.
These factors contributing to the growth in our average dollar content per vehicle were partially offset by:
• the impact of lower content and/or production on certain programs including:• the GMT800 platform;• the GMC Envoy, Chevrolet Trailblazer and Buick Rainier; and• the Ford Explorer and Mercury Mountaineer; and
• incremental customer price concessions.
External Production Sales - Europe
External production sales in Europe increased 25% or $935 million to $4.7 billion for 2004 compared to $3.8 billion for 2003. This increasein sales reflects a 23% increase in our European average dollar content per vehicle combined with a 1% increase in European vehicleproduction volumes over 2003.
Our average dollar content per vehicle grew by $54 to $285 for 2004 compared to $231 for 2003, primarily as a result of:
• programs that launched during or subsequent to 2003, including:• the BMW X3;• the BMW 6-Series;• the MINI Convertible; and• the Mercedes E-Class; and
• higher reported U.S. dollar sales due to the strengthening of the euro and the British pound, each against the U.S. dollar.
The factors contributing to the growth in our average dollar content per vehicle were partially offset by:
• lower production on certain programs including:• the Ford Transit;• the MINI Cooper; and• the smart for two; and
• incremental customer price concessions.
Magna International Inc. – Annual Report 2005– 34 –
External Production Sales – Rest of World
External production sales in the Rest of World increased 53% or $49 million to $139 million for 2004 compared to $90 million for 2003.The increase in production sales is primarily a result of:
• the acquisition of the remaining interest in several joint venture mirror facilities in China;• the ramp-up of production at new facilities in China; • increased production at our powertrain facilities in Korea; and• increased production at our closure systems facility in Brazil.
Complete Vehicle Assembly Sales
Complete vehicle assembly sales increased 176% or $2.8 billion to $4.4 billion for 2004 compared to $1.6 billion for 2003. The increasein complete vehicle assembly sales is primarily the result of:
• the launch of the BMW X3 program during the fourth quarter of 2003;• higher reported U.S. dollar sales due to the strengthening of the euro and the British pound, each against the U.S. dollar; and• the launch of the Saab 93 Convertible program during the third quarter of 2003.
Tooling, Engineering and Other
Tooling, engineering and other sales were $1.5 billion for 2004, representing an increase of 2% or $26 million over 2003. The increasewas primarily the result of an increase in reported U.S. dollar sales due to the strengthening of the Canadian dollar, euro and Britishpound, each against the U.S. dollar.
Excluding the impact of foreign exchange, tooling sales decreased in 2004, reflecting the launch of many programs during the third andfourth quarters of 2003. In 2004 the major programs for which we recorded tooling, engineering and other sales were:
• the Ford Fusion, Mercury Milan and Lincoln Zephyr;• the Ford Explorer and Mercury Mountaineer; and• the Mercedes M-Class and R-Class.
In 2003, the major programs on which we recorded tooling, engineering and other sales included:
• the BMW X3;• the Saab 93 Convertible;• the second and third row stow in floor seats for the DaimlerChrysler minivans;• the Ford Freestar and Mercury Mountaineer; and• the Ford Mustang.
Net Income and Net Income from Continuing Operations
Net income increased 35% or $176 million to $676 million for 2004 compared to $500 million for 2003. Net income in 2003 includesthe results of our former controlling interest in MEC, which have been presented as discontinued operations. In 2003, we recognized a$68 million non-cash impairment loss equal to the excess of the carrying value of our investment in MEC over the fair value of MID's controllinginterest in MEC on the distribution date.
Magna International Inc. – Annual Report 2005– 35 –
Management’s Discussion and Analysis of Results of Operations and Financial PositionMagna International Inc.
Net income from continuing operations increased 19% or $109 million to $676 million for 2004 compared to $567 million for 2003.Included in net income from continuing operations are the following items (net of minority interest and income taxes):
2004 2003 Change
Impairment charges $ 22 $ 13Restructuring charges 17 5Pension curtailment gain (18) —Stock options 12 —Other loss — 6Future income tax charge (recovery) related to tax rate changes (6) 10
$ 27 $ 34 $ (7)
The unusual items in 2004 have been discussed above in the "Highlights" section. During 2003, the unusual items were as follows:
• impairment charges relating to certain exterior systems facilities in Europe;• restructuring charges related to the reorganization and closure of certain facilities in Europe;• a non-cash impairment loss at the date of the MID distribution equal to the excess of our carrying value of certain real estate properties
of MID over their fair values; and• a future income tax charge related to the increase in future income tax rates in Canada.
Excluding the unusual items, net income from continuing operations increased by $102 million as a result of an increase in gross marginof $389 million and a decrease in minority interest expense of $3 million, partially offset by increases in SG&A spending, depreciationand amortization, income taxes and interest expense of $162 million, $78 million, $45 million and $3 million, respectively, and a $2 milliondecrease in equity income.
Gross margin as a percentage of total sales decreased to 14.3% for 2004 compared to 16.5% for 2003. Excluding the unusual items discussedabove, gross margin as a percentage of total sales for 2004 decreased 2.2% as a result of:
• the launches of the BMW X3 and the Saab 93 Convertible complete vehicle assembly programs;• costs incurred for new facilities;• inefficiencies at certain exterior systems facilities in Europe;• the MID distribution as the distribution effectively added additional lease expense;• a change in sales mix during 2004 to programs that operate at lower margins;• the strengthening of the euro against the U.S. dollar;• the NVG and Davis acquisitions;• increased raw material prices; and• incremental customer price concessions.
Partially offsetting these decreases were:
• the positive impact of programs that launched during or subsequent to 2003; and• improved performance and productivity at a number of divisions.
The increase in depreciation and amortization in 2004 was primarily a result of:
• an increase in assets employed in the business to support future growth, including acquisitions completed during the year;• an increase in reported U.S. dollar depreciation and amortization due to the strengthening of the euro, Canadian dollar and British
pound, each against the U.S. dollar; and• accelerated depreciation on certain program specific assets in 2004.
These increases in depreciation and amortization were partially offset by a reduction of depreciation as a result of the MID distribution.
The increase in SG&A expense relates primarily to:
• higher infrastructure costs to support the increase in sales levels, including spending to support launches;• an increase in reported U.S. dollar SG&A due to the strengthening of the euro, Canadian dollar and British pound, each against the
U.S. dollar; and• increased SG&A spending as a result of acquisitions completed during or subsequent to 2003, including the NVG and Davis acquisitions.
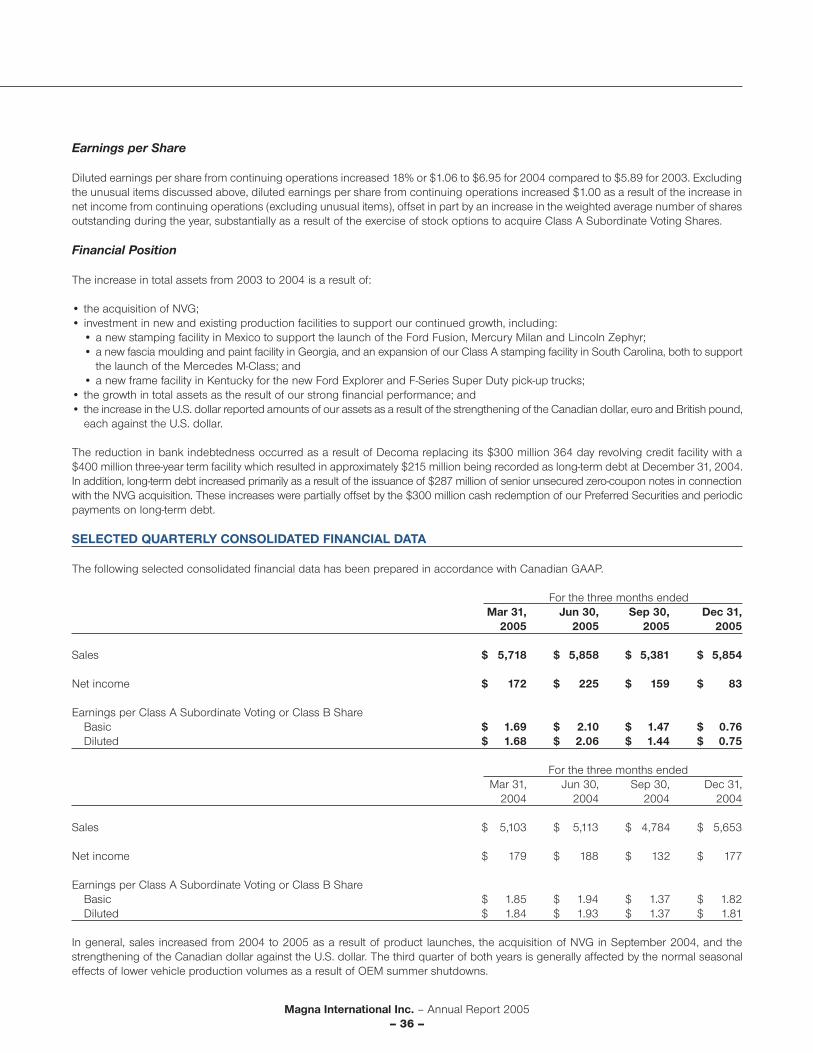
Magna International Inc. – Annual Report 2005– 36 –
Earnings per Share
Diluted earnings per share from continuing operations increased 18% or $1.06 to $6.95 for 2004 compared to $5.89 for 2003. Excludingthe unusual items discussed above, diluted earnings per share from continuing operations increased $1.00 as a result of the increase innet income from continuing operations (excluding unusual items), offset in part by an increase in the weighted average number of sharesoutstanding during the year, substantially as a result of the exercise of stock options to acquire Class A Subordinate Voting Shares.
Financial Position
The increase in total assets from 2003 to 2004 is a result of:
• the acquisition of NVG;• investment in new and existing production facilities to support our continued growth, including:
• a new stamping facility in Mexico to support the launch of the Ford Fusion, Mercury Milan and Lincoln Zephyr;• a new fascia moulding and paint facility in Georgia, and an expansion of our Class A stamping facility in South Carolina, both to support
the launch of the Mercedes M-Class; and• a new frame facility in Kentucky for the new Ford Explorer and F-Series Super Duty pick-up trucks;
• the growth in total assets as the result of our strong financial performance; and• the increase in the U.S. dollar reported amounts of our assets as a result of the strengthening of the Canadian dollar, euro and British pound,
each against the U.S. dollar.
The reduction in bank indebtedness occurred as a result of Decoma replacing its $300 million 364 day revolving credit facility with a$400 million three-year term facility which resulted in approximately $215 million being recorded as long-term debt at December 31, 2004.In addition, long-term debt increased primarily as a result of the issuance of $287 million of senior unsecured zero-coupon notes in connectionwith the NVG acquisition. These increases were partially offset by the $300 million cash redemption of our Preferred Securities and periodicpayments on long-term debt.
SELECTED QUARTERLY CONSOLIDATED FINANCIAL DATA
The following selected consolidated financial data has been prepared in accordance with Canadian GAAP.
For the three months endedMar 31, Jun 30, Sep 30, Dec 31,
2005 2005 2005 2005
Sales $ 5,718 $ 5,858 $ 5,381 $ 5,854
Net income $ 172 $ 225 $ 159 $ 83
Earnings per Class A Subordinate Voting or Class B ShareBasic $ 1.69 $ 2.10 $ 1.47 $ 0.76Diluted $ 1.68 $ 2.06 $ 1.44 $ 0.75
For the three months endedMar 31, Jun 30, Sep 30, Dec 31,
2004 2004 2004 2004
Sales $ 5,103 $ 5,113 $ 4,784 $ 5,653
Net income $ 179 $ 188 $ 132 $ 177
Earnings per Class A Subordinate Voting or Class B ShareBasic $ 1.85 $ 1.94 $ 1.37 $ 1.82Diluted $ 1.84 $ 1.93 $ 1.37 $ 1.81
In general, sales increased from 2004 to 2005 as a result of product launches, the acquisition of NVG in September 2004, and thestrengthening of the Canadian dollar against the U.S. dollar. The third quarter of both years is generally affected by the normal seasonaleffects of lower vehicle production volumes as a result of OEM summer shutdowns.
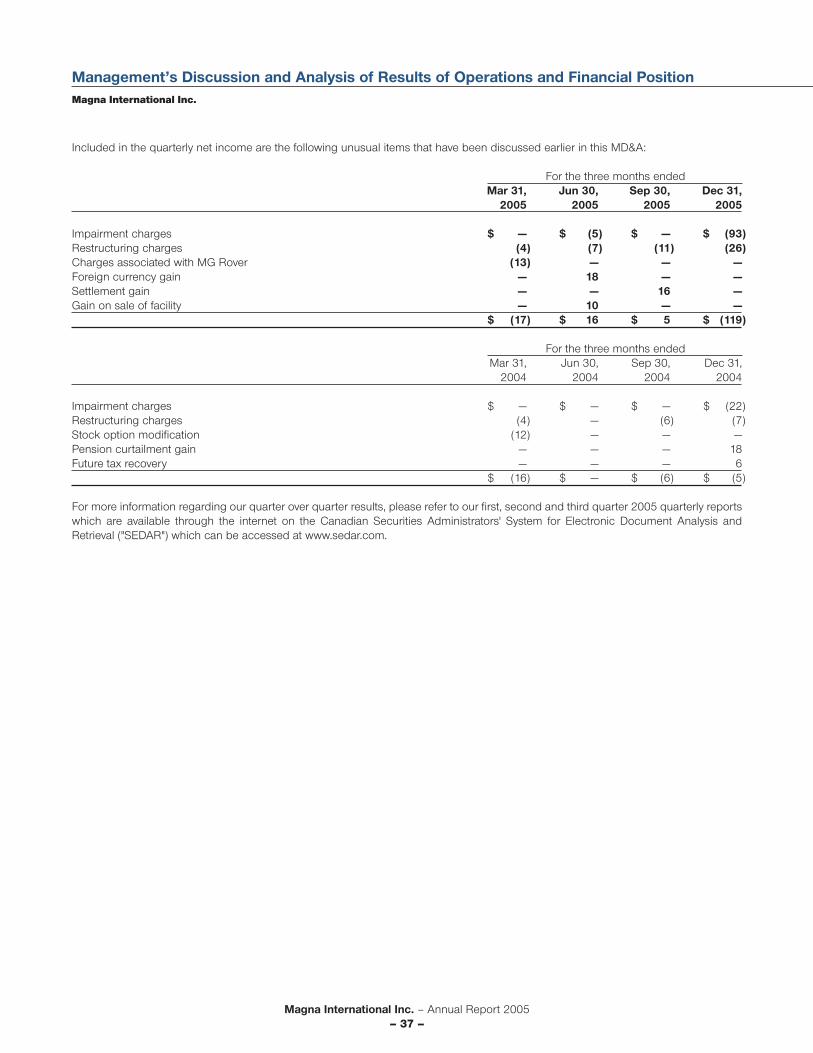
Magna International Inc. – Annual Report 2005– 37 –
Included in the quarterly net income are the following unusual items that have been discussed earlier in this MD&A:
For the three months endedMar 31, Jun 30, Sep 30, Dec 31,
2005 2005 2005 2005
Impairment charges $ — $ (5) $ — $ (93)Restructuring charges (4) (7) (11) (26)Charges associated with MG Rover (13) — — —Foreign currency gain — 18 — —Settlement gain — — 16 —Gain on sale of facility — 10 — —
$ (17) $ 16 $ 5 $ (119)
For the three months endedMar 31, Jun 30, Sep 30, Dec 31,
2004 2004 2004 2004
Impairment charges $ — $ — $ — $ (22)Restructuring charges (4) — (6) (7)Stock option modification (12) — — —Pension curtailment gain — — — 18Future tax recovery — — — 6
$ (16) $ — $ (6) $ (5)
For more information regarding our quarter over quarter results, please refer to our first, second and third quarter 2005 quarterly reportswhich are available through the internet on the Canadian Securities Administrators' System for Electronic Document Analysis andRetrieval ("SEDAR") which can be accessed at www.sedar.com.
Management’s Discussion and Analysis of Results of Operations and Financial PositionMagna International Inc.
Magna International Inc. – Annual Report 2005– 38 –
DISCLOSURE CONTROLS AND PROCEDURES
Disclosure controls and procedures are designed to provide reasonable, but not absolute, assurance that material information requiredto be publicly disclosed by a public company is communicated in a timely manner to senior management to enable them to make timelydecisions regarding public disclosure of such information. We have conducted an evaluation of our disclosure controls and proceduresas of December 31, 2005 under the supervision, and with the participation of, our Chief Executive Officers and our Chief FinancialOfficer. Based on this evaluation, our Chief Executive Officers and our Chief Financial Officer have concluded that our disclosure controlsand procedures (as this term is defined in the rules adopted by Canadian securities regulatory authorities and the United StatesSecurities and Exchange Commission) are effective in providing reasonable assurance that material information relating to Magna(including all consolidated subsidiaries) is communicated to our senior management, including our Chief Executive Officers and ourChief Financial Officer, in a timely manner to enable them to make decisions regarding the public disclosure of such information.
FORWARD-LOOKING STATEMENTS
The previous discussion contains statements that, to the extent that they are not recitations of historical fact, constitute "forward-lookingstatements" within the meaning of applicable securities legislation. Forward-looking statements may include financial and other projections,as well as statements regarding our future plans, objectives or economic performance, or the assumptions underlying any of the foregoing.We use words such as "may", "would", "could", "will", "likely", "expect", "anticipate", "believe", "intend", "plan", "forecast", "project", "estimate"and similar expressions to identify forward-looking statements. Any such forward-looking statements are based on assumptions andanalyses made by us in light of our experience and our perception of historical trends, current conditions and expected future developments,as well as other factors we believe are appropriate in the circumstances. However, whether actual results and developments will conformwith our expectations and predictions is subject to a number of risks, assumptions and uncertainties. These risks, assumptions anduncertainties include, but are not limited to, the impact of: cyclicality of the automotive industry due to global economic and political conditions(including acts of terrorism) and resulting changes in consumer demand for automobiles; declining market share and production volumesof some of our customers; our reliance on a small number of automobile manufacturers, several of which are rated as below investmentgrade by credit rating agencies; shifts in market share among vehicles, including those we assemble; the termination, loss, renegotiationof the terms of, or delay in the implementation of any significant production or assembly contract; competition from suppliers with manufacturingoperations in low cost countries; risks associated with conducting business internationally; increased commodity prices and our abilityto offset such increases; deterioration of the financial condition of the supply base and certain customers; intense pricing pressures;increased pressure from our customers to absorb various fixed costs; product warranty and recall costs; product liability risks; fluctuationsin relative currency values; our facility rationalization efforts; our success in improving results at our underperforming divisions; goodwilland fixed asset impairments; legal proceedings to which we are or may become a party; changes in governmental regulations, includingenvironmental laws and regulations; our relationship with our controlling shareholder; and other factors set out in our Annual InformationForm filed with securities commissions in Canada and our annual report on Form 40-F filed with the United States Securities andExchange Commission, and subsequent filings. In evaluating forward-looking statements, readers should specifically consider the variousfactors which could cause actual events or results to differ materially from those indicated by such forward-looking statements. Unlessotherwise required by applicable securities laws, we do not intend, nor do we undertake any obligation, to update or revise any forward-lookingstatements to reflect subsequent information, events, results or circumstances or otherwise.
Magna's management is responsible for the preparation and presentation of the consolidated financial statements and all the informationin this Annual Report. The consolidated financial statements were prepared by management in accordance with Canadian generallyaccepted accounting principles.
Where alternative accounting methods exist, management has selected those it considered to be most appropriate in the circumstances.Financial statements include certain amounts based on estimates and judgments. Management has determined such amounts on a reasonablebasis designed to ensure that the consolidated financial statements are presented fairly, in all material respects. Financial informationpresented elsewhere in this Annual Report has been prepared by management to ensure consistency with that in the consolidated financialstatements. The consolidated financial statements have been reviewed by the Audit Committee, audited by the independent auditors andapproved by the Board of Directors of the Company.
Management is responsible for the development and maintenance of systems of internal accounting and administrative cost controls ofhigh quality, consistent with reasonable cost. Such systems are designed to provide reasonable assurance that the financial informationis accurate, relevant and reliable, and that the Company's assets are appropriately accounted for and adequately safeguarded.
The Company's Audit Committee is appointed by its Board of Directors annually and is comprised solely of outside independent directors.The Audit Committee meets periodically with management, as well as with the independent auditors, to satisfy itself that each is properlydischarging its responsibilities, to review the consolidated financial statements and the independent auditors' report and to discuss significantfinancial reporting issues and auditing matters. The Audit Committee reports its findings to the Board of Directors for consideration whenapproving the consolidated financial statements for issuance to the shareholders.
The consolidated financial statements have been audited by Ernst & Young LLP, the independent auditors, in accordance with Canadiangenerally accepted auditing standards and the standards of the Public Company Accounting Oversight Board (United States) on behalfof the shareholders. The Auditors' Report outlines the nature of their examination and their opinion on the consolidated financial statementsof the Company. The independent auditors have full and unrestricted access to the Audit Committee.
Vincent J. Galifi Patrick W.D. McCannExecutive Vice-President Vice-Presidentand Chief Financial Officer and Controller
Toronto, Canada,February 26, 2006.
Magna International Inc. – Annual Report 2005– 39 –
Management’s Responsibility for Financial ReportingMagna International Inc.
/s/Vincent J. Galifi /s/Patrick W.D. McCann
Magna International Inc. – Annual Report 2005– 40 –
Auditors’ Report
To the Shareholders ofMagna International Inc.
We have audited the consolidated balance sheets of Magna International Inc. as at December 31, 2005 and 2004 and the consolidatedstatements of income, retained earnings and cash flows for each of the years in the three-year period ended December 31, 2005. Thesefinancial statements are the responsibility of the Company's management. Our responsibility is to express an opinion on these financialstatements based on our audits.
We conducted our audits in accordance with Canadian generally accepted auditing standards and the standards of the Public CompanyAccounting Oversight Board (United States). Those standards require that we plan and perform an audit to obtain reasonable assurancewhether the financial statements are free of material misstatement. We were not engaged to perform an audit of the Company's internalcontrol over financial reporting. An audit includes consideration of internal control over financial reporting as a basis for designing auditprocedures that are appropriate in the circumstances, but not for the purpose of expressing an opinion on the effectiveness of theCompany's internal control over financial reporting. Accordingly, we express no such opinion. An audit also includes examining, on atest basis, evidence supporting the amounts and disclosures in the financial statements, assessing the accounting principles used andsignificant estimates made by management, and evaluating the overall financial statement presentation. We believe that our audits providea reasonable basis for our opinion.
In our opinion, these consolidated financial statements present fairly, in all material respects, the financial position of the Company as atDecember 31, 2005 and 2004 and the results of its operations and its cash flows for each of the years in the three-year period endedDecember 31, 2005 in conformity with Canadian generally accepted accounting principles.
As described in note 2 to these consolidated financial statements, in 2005 the Company changed its method of accounting for financialinstruments.
Toronto, Canada,February 26, 2006. Chartered Accountants
/s/Ernst & Young LLP
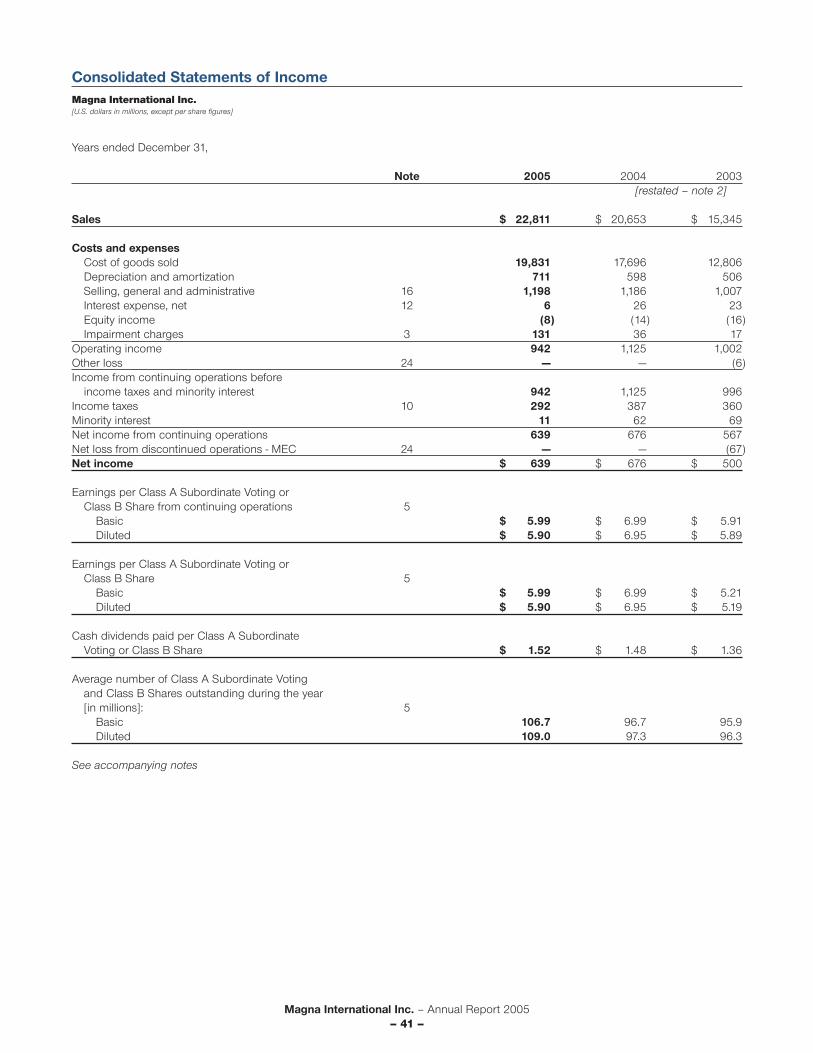
Magna International Inc. – Annual Report 2005– 41 –
Consolidated Statements of IncomeMagna International Inc.[U.S. dollars in millions, except per share figures]
Years ended December 31,
Note 2005 2004 2003[restated – note 2]
Sales $ 22,811 $ 20,653 $ 15,345
Costs and expensesCost of goods sold 19,831 17,696 12,806Depreciation and amortization 711 598 506Selling, general and administrative 16 1,198 1,186 1,007Interest expense, net 12 6 26 23Equity income (8) (14) (16)Impairment charges 3 131 36 17
Operating income 942 1,125 1,002Other loss 24 — — (6)Income from continuing operations before
income taxes and minority interest 942 1,125 996Income taxes 10 292 387 360Minority interest 11 62 69Net income from continuing operations 639 676 567Net loss from discontinued operations - MEC 24 — — (67)Net income $ 639 $ 676 $ 500
Earnings per Class A Subordinate Voting orClass B Share from continuing operations 5
Basic $ 5.99 $ 6.99 $ 5.91Diluted $ 5.90 $ 6.95 $ 5.89
Earnings per Class A Subordinate Voting or Class B Share 5
Basic $ 5.99 $ 6.99 $ 5.21Diluted $ 5.90 $ 6.95 $ 5.19
Cash dividends paid per Class A SubordinateVoting or Class B Share $ 1.52 $ 1.48 $ 1.36
Average number of Class A Subordinate Votingand Class B Shares outstanding during the year[in millions]: 5
Basic 106.7 96.7 95.9Diluted 109.0 97.3 96.3
See accompanying notes
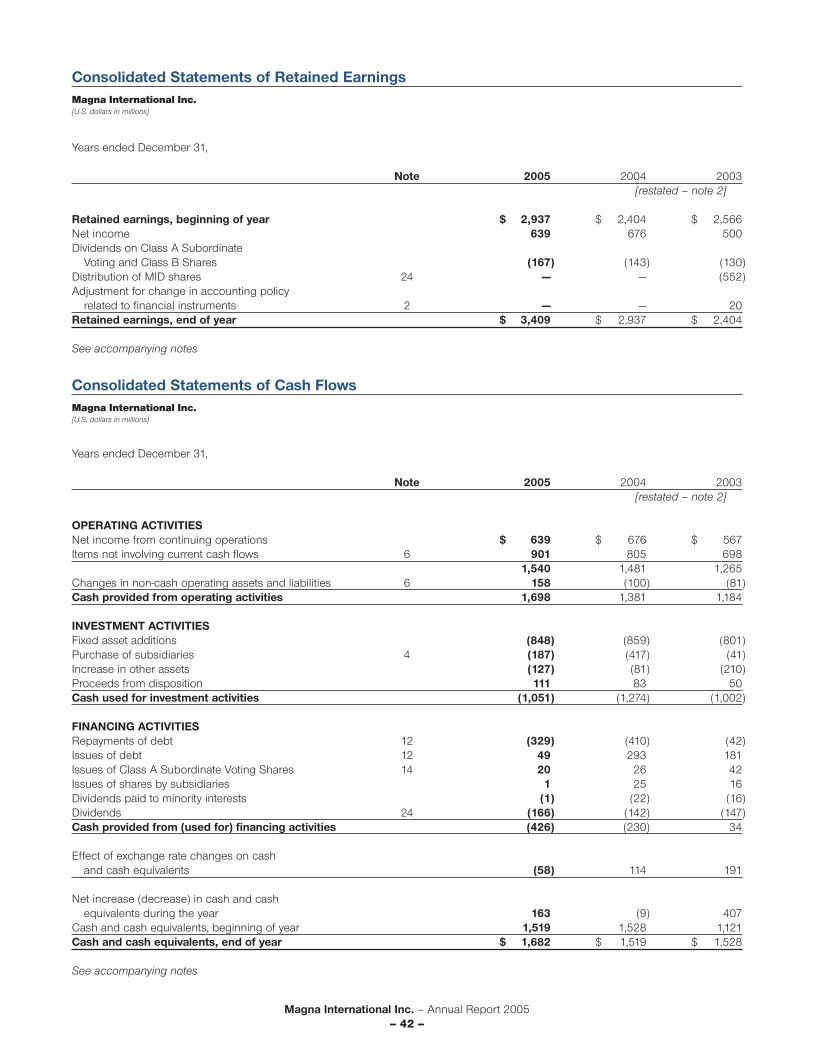
Magna International Inc. – Annual Report 2005– 42 –
Consolidated Statements of Retained EarningsMagna International Inc.[U.S. dollars in millions]
Years ended December 31,
Note 2005 2004 2003[restated – note 2]
Retained earnings, beginning of year $ 2,937 $ 2,404 $ 2,566Net income 639 676 500Dividends on Class A Subordinate
Voting and Class B Shares (167) (143) (130)Distribution of MID shares 24 — — (552)Adjustment for change in accounting policy
related to financial instruments 2 — — 20Retained earnings, end of year $ 3,409 $ 2,937 $ 2,404
See accompanying notes
Consolidated Statements of Cash FlowsMagna International Inc.[U.S. dollars in millions]
Years ended December 31,
Note 2005 2004 2003[restated – note 2]
OPERATING ACTIVITIESNet income from continuing operations $ 639 $ 676 $ 567 Items not involving current cash flows 6 901 805 698
1,540 1,481 1,265Changes in non-cash operating assets and liabilities 6 158 (100) (81)Cash provided from operating activities 1,698 1,381 1,184
INVESTMENT ACTIVITIESFixed asset additions (848) (859) (801) Purchase of subsidiaries 4 (187) (417) (41)Increase in other assets (127) (81) (210)Proceeds from disposition 111 83 50Cash used for investment activities (1,051) (1,274) (1,002)
FINANCING ACTIVITIES Repayments of debt 12 (329) (410) (42)Issues of debt 12 49 293 181Issues of Class A Subordinate Voting Shares 14 20 26 42Issues of shares by subsidiaries 1 25 16Dividends paid to minority interests (1) (22) (16)Dividends 24 (166) (142) (147)Cash provided from (used for) financing activities (426) (230) 34
Effect of exchange rate changes on cashand cash equivalents (58) 114 191
Net increase (decrease) in cash and cashequivalents during the year 163 (9) 407
Cash and cash equivalents, beginning of year 1,519 1,528 1,121Cash and cash equivalents, end of year $ 1,682 $ 1,519 $ 1,528
See accompanying notes

Magna International Inc. – Annual Report 2005– 43 –
Consolidated Balance SheetsMagna International Inc.[U.S. dollars in millions]
As at December 31,
Note 2005 2004[restated –
note 2]
ASSETSCurrent assetsCash and cash equivalents $ 1,682 $ 1,519Accounts receivable 3,436 3,276Inventories 7 1,388 1,376Prepaid expenses and other 97 110
6,603 6,281Investments 13, 20 142 139Fixed assets, net 3, 8 4,124 3,967Goodwill 9 918 747Future tax assets 10 208 199Other assets 11 326 282
$ 12,321 $ 11,615
LIABILITIES AND SHAREHOLDERS' EQUITYCurrent liabilitiesBank indebtedness 12 $ 89 $ 136Accounts payable 3,241 3,006Accrued salaries and wages 474 449Other accrued liabilities 394 350Income taxes payable 10 59 73Long-term debt due within one year 12 131 84
4,388 4,098Deferred revenue 85 70Long-term debt 12 700 984Other long-term liabilities 13 241 240Future tax liabilities 10 342 254Minority interest 4 — 634
5,756 6,280
Shareholders' equityCapital stock 14
Class A Subordinate Voting Shares[issued: 2005 – 108,184,395; 2004 – 95,850,377] 2,470 1,610
Class B Shares[convertible into Class A Subordinate Voting Shares][issued: 1,093,983] — —
Contributed surplus 15 65 16Retained earnings 3,409 2,937Currency translation adjustment 18 621 772
6,565 5,335$ 12,321 $ 11,615
Commitments and contingencies [notes 12, 17, 21 and 25]
See accompanying notes
On behalf of the Board:
Director Chairman of the Board
/s/Don Resnick /s/Frank Stronach
Magna International Inc. – Annual Report 2005– 44 –
Notes to the Consolidated Financial StatementsMagna International Inc.[All amounts in U.S. dollars and all tabular amounts in millions, except per share figures, unless otherwise noted]
1. SIGNIFICANT ACCOUNTING POLICIES
Basis of presentation
Magna designs, develops and manufactures automotive systems, assemblies, modules and components, and engineers and assemblescomplete vehicles, primarily for sale to original equipment manufacturers ["OEMs"] of cars and light trucks in North America, Europe,Asia and South America.
The consolidated financial statements have been prepared in U.S. dollars following Canadian generally accepted accounting principles["Canadian GAAP"]. These principles are also in conformity, in all material respects, with United States generally accepted accountingprinciples ["U.S. GAAP"], except as described in note 23 to the consolidated financial statements.
Principles of consolidation
The consolidated financial statements include the accounts of Magna International Inc. and its subsidiaries [collectively "Magna" or the"Company"], some of which had a minority interest. The Company accounts for its interests in jointly controlled entities using the proportionateconsolidation method. All significant intercompany balances and transactions have been eliminated.
Foreign currency translation
The Company operates globally, which gives rise to a risk that its earnings and cash flows may be adversely impacted by fluctuations inforeign exchange rates.
Assets and liabilities of the Company's operations having a functional currency other than the U.S. dollar are translated into U.S. dollarsusing the exchange rate in effect at the year end, and revenues and expenses are translated at the average rate during the year. Exchangegains or losses on translation of the Company's net investment in these operations are deferred as a separate component of shareholders'equity. Foreign exchange gains or losses on non-U.S. dollar debt that is designated as a hedge of the Company's net investment in theseoperations is also recorded in the separate component of equity. The appropriate amounts of exchange gains or losses accumulated inthe separate component of shareholders' equity are reflected in income when there is a reduction, as a result of capital transactions, in theCompany's net investment in the operations that gave rise to such exchange gains and losses.
Foreign exchange gains and losses on transactions occurring in a currency other than an operation's functional currency are reflectedin income, except for gains and losses on foreign exchange contracts used to hedge specific future commitments in foreign currencies.In particular, the Company uses foreign exchange forward contracts for the sole purpose of hedging certain of the Company's futurecommitted U.S. dollar and euro ["€"] outflows and inflows. Gains and losses on these hedging instruments are recognized in the sameperiod as, and as part of, the hedged transaction. The Company does not enter into foreign exchange contracts for speculative purposes.
Cash and cash equivalents
Cash and cash equivalents include cash on account, demand deposits and short-term investments with remaining maturities of less thanthree months at acquisition.
Inventories
Production inventories and tooling inventories manufactured in-house are valued at the lower of cost and net realizable value, with costbeing determined substantially on a first-in, first-out basis. Cost includes the cost of materials plus direct labour applied to the productand the applicable share of manufacturing overhead.
Outsourced tooling inventories are valued at the lower of subcontracted costs and net realizable value.
Investments
The Company accounts for its investments in which it has significant influence on the equity basis. Investments also include long-terminterest bearing government securities held to partially fund certain Austrian lump sum termination and long service payment arrangementspursuant to local tax laws [note 13[b]]. The government securities are recorded at amortized cost.
Magna International Inc. – Annual Report 2005– 45 –
Notes to the Consolidated Financial StatementsMagna International Inc.[All amounts in U.S. dollars and all tabular amounts in millions, except per share figures, unless otherwise noted]
Long-lived assets
Fixed assets are recorded at historical cost, which includes acquisition and development costs.
Depreciation is provided on a straight-line basis over the estimated useful lives of fixed assets at annual rates of 2% to 5% for buildings,7% to 10% for general purpose equipment and 10% to 30% for special purpose equipment.
The Company assesses fixed and other long-lived assets [excluding goodwill] for recoverability whenever indicators of impairment exist.If the carrying value of the asset exceeds the estimated undiscounted cash flows from the use of the asset, then an impairment loss isrecognized to write the asset down to fair value. The fair value of the long-lived assets is generally determined using estimated discountedfuture cash flows.
Goodwill
Goodwill represents the excess of the cost of an acquired enterprise over the net of the amounts assigned to assets acquired and liabilitiesassumed less any subsequent writedowns for impairment. Goodwill is subject to an annual impairment test. Goodwill impairment is evaluatedbetween annual tests upon the occurrence of certain events or circumstances. Goodwill impairment is assessed based on a comparisonof the fair value of a reporting unit to the underlying carrying value of the reporting unit's net assets, including goodwill. When the carryingamount of the reporting unit exceeds its fair value, the fair value of the reporting unit's goodwill is compared with its carrying amount tomeasure the amount of impairment loss, if any. The fair value of goodwill is determined using the estimated discounted future cash flowsof the reporting unit.
Other assets
Other assets include long-term receivables, which represent the recognized sales value of tooling and design and engineering servicesprovided to customers under certain long-term contracts. The receivables will be paid in full upon completion of the contracts, in instalmentsor in fixed amounts per vehicle based on forecasted production volumes. In the event that actual production volumes are less than thoseforecasted, a reimbursement for any shortfall will be made. The fixed receivable amount per vehicle may include an interest componentfor extended payment terms that will be accrued over time between the beginning of the production period and the collection date.
Preproduction costs related to long-term supply agreements
Costs incurred in establishing new facilities that require substantial time to reach commercial production capability are expensed as incurred.
Costs incurred [net of customer subsidies] related to design and engineering, which are paid for as part of subsequent production pieceprice amounts are expensed as incurred unless a contractual guarantee for reimbursement exists.
Costs incurred [net of customer subsidies] related to design and development costs for moulds, dies and other tools that the Companydoes not own [and that will be used in, and paid for as part of the piece price amount for, subsequent production] are expensed asincurred unless the supply agreement provides a contractual guarantee for reimbursement or the non-cancellable right to use themoulds, dies and other tools during the supply agreement.
Costs deferred in the above circumstances are included in other assets and amortized on a units-of-production basis to cost of goodssold over the anticipated term of the supply agreement.
Warranty
The Company records product warranty liabilities based on its individual customer agreements. Under most customer agreements, theCompany only accounts for existing or probable claims on product default issues when amounts related to such issues are probableand reasonably estimable. Under certain complete vehicle engineering and assembly contracts, the Company records an estimate offuture warranty-related costs based on the terms of the specific customer agreements and the specific customers' warranty experience.
Product liability provisions are established based on the Company's best estimate of the amounts necessary to settle existing claims onproduct default issues. Recall costs are costs incurred when government regulators and/or the customer decides to recall a product dueto a known or suspected performance issue, and the Company is required to participate, either voluntarily or involuntarily, to recall a productdue to a known or suspected performance issue. Costs typically include the cost of the product being replaced, the customer's cost ofthe recall and labour to remove and replace the defective part. When a decision to recall a product has been made or is probable, theCompany's estimated cost of the recall is recorded as a charge to earnings in that period. In making this estimate, judgment is required
Magna International Inc. – Annual Report 2005– 46 –
as to the number of units that may be returned as a result of the recall, the total cost of the recall campaign, the ultimate negotiated sharingof the cost between the Company and the customer and, in some cases, the extent to which a supplier to the Company will share in therecall cost.
Employee future benefit plans
The cost of providing benefits through defined benefit pensions, lump sum termination and long service payment arrangements, andpost-retirement benefits other than pensions is actuarially determined and recognized in income using the projected benefit method pro-ratedon service and management's best estimate of expected plan investment performance, salary escalation, and retirement ages of employees.Differences arising from plan amendments, changes in assumptions and experience gains and losses are recognized in income overthe expected average remaining service life of employees. Gains related to plan curtailments are recognized when the event giving riseto the curtailment has occurred. Plan assets are valued at fair value. The cost of providing benefits through defined contribution pensionplans is charged to income in the period in respect of which contributions become payable.
Asset retirement obligation
The Company recognizes its obligation to restore leased premises at the end of the lease by recording at lease inception the presentvalue of this obligation as other long-term liabilities with a corresponding amount recognized as fixed assets. The fixed asset amount isamortized, and the liability amount is accreted, over the period from lease inception to the time the Company expects to vacate the premises,resulting in both depreciation and interest charges.
Subordinated debentures
The Company's subordinated debentures are recorded as debt with the exception of the equity value ascribed to the holders' option toconvert certain of the subordinated debentures into Class A Subordinate Voting Shares, which is recorded as part of shareholders' equityin contributed surplus. The holders' conversion options are valued using a residual value approach.
Revenue recognition
Revenue from the sale of manufactured products is recognized when the price is fixed or determinable, collectability is reasonablyassured and upon shipment to [or receipt by customers, depending on contractual terms], and acceptance by, customers.
Separately priced tooling and engineering services are accounted for as a separate revenue element only in circumstances where thetooling and engineering has value to the customer on a standalone basis and there is objective and reliable evidence of the fair value ofthe subsequent parts production or vehicle assembly. Revenues from engineering services and tooling contracts that qualify as separaterevenue elements are generally recognized on a percentage of completion basis. Percentage of completion is generally determinedbased on the proportion of accumulated expenditures to date as compared to total anticipated expenditures.
Revenue and cost of sales, including amounts from separately priced engineering and tooling contracts, are presented on a gross basisin the consolidated statements of income when the Company is acting as principal and is subject to significant risks and rewards in connectionwith the process of bringing the product to its final state and in the post-sale dealings with its customers. Otherwise, components of revenuesand related costs are presented on a net basis. With respect to vehicle assembly sales, where Magna is acting as principal with respectto purchased components and systems, the selling price to the customer includes the costs of such inputs. These programs are accountedfor on a full-cost basis under which sales and cost of sales include these input costs. Where third-party components and systems areheld on consignment by the Company, the selling price to the customer reflects a value-added assembly fee only and, accordingly, thecosts of such consignment inputs are not included in sales and cost of sales.
Government financing
The Company makes periodic applications for financial assistance under available government assistance programs in the various jurisdictionsin which the Company operates. Grants relating to capital expenditures are reflected as a reduction of the cost of the related assets.Grants and tax credits relating to current operating expenditures are generally recorded as a reduction of expense at the time the eligibleexpenses are incurred. In the case of certain foreign subsidiaries, the Company receives tax super allowances which are paid in cash.The Company also receives loans which are recorded as liabilities in amounts equal to the cash received.
Research and development
Research costs are expensed as incurred and development costs which meet certain criteria where future benefit is reasonably certainare deferred to the extent of their estimated recovery.

Magna International Inc. – Annual Report 2005– 47 –
Notes to the Consolidated Financial StatementsMagna International Inc.[All amounts in U.S. dollars and all tabular amounts in millions, except per share figures, unless otherwise noted]
Income taxes
The Company uses the liability method of tax allocation for accounting for income taxes. Under the liability method of tax allocation,future tax assets and liabilities are determined based on differences between the financial reporting and tax bases of assets and liabilitiesand are measured using the substantively enacted tax rates and laws that will be in effect when the differences are expected to reverse.
No future tax liability is recorded for taxes that could arise on the remittance of the undistributed earnings of foreign subsidiaries as these earningsare considered to be reinvested for the foreseeable future. Taxes are recorded on such foreign undistributed earnings when circumstanceschange and it becomes apparent that such earnings will be distributed in the foreseeable future.
Stock-based compensation
Effective January 1, 2003, the Company prospectively adopted the fair value method for recognizing compensation expense for stockoptions granted under its option plans. Under the prospective method of adoption, compensation expense is recognized for stockoptions granted, modified, or settled after January 1, 2003 based upon the fair value of the options at the grant or modification date. The fairvalue of the options is recognized over the vesting period of the options as compensation expense in selling, general and administrativeexpense with a corresponding increase to contributed surplus.
For stock options granted prior to January 1, 2003, the Company continues to use the intrinsic value method unless such options weremodified after January 1, 2003.
The fair value of stock options is estimated at the grant date using the Black-Scholes option pricing model. This model requires the inputof a number of assumptions, including expected dividend yields, expected stock price volatility, expected time until exercise and risk-freeinterest rates. Although the assumptions used reflect management's best estimates, they involve inherent uncertainties based on marketconditions generally outside the Company’s control. If other assumptions are used, stock-based compensation expense could be significantlyimpacted.
As stock options are exercised, the proceeds received on exercise, in addition to the portion of the contributed surplus balance relatedto those stock options, is credited to Class A Subordinate Voting Shares and contributed surplus is reduced accordingly.
The Company's restricted stock plans and restricted share unit plans are measured at fair value at the date of grant and amortized tocompensation expense from the effective date of the grant to the final vesting date in selling, general and administrative expense with acorresponding increase to contributed surplus. As restricted stock or restricted share units are released under the plans, the portion ofthe contributed surplus balance relating to the restricted stock or restricted share units is credited to Class A Subordinate Voting Sharesand released from contributed surplus.
Earnings per Class A Subordinate Voting or Class B Share
Basic earnings per Class A Subordinate Voting or Class B Share are calculated on net income using the weighted average number ofClass A Subordinate Voting and Class B Shares outstanding during the year.
Diluted earnings per Class A Subordinate Voting or Class B Share are calculated on the weighted average number of Class ASubordinate Voting and Class B Shares that would have been outstanding during the year had all the convertible subordinated debenturesbeen exercised or converted into Class A Subordinate Voting Shares at the beginning of the year, or date of issuance, if later. In addition,the weighted average number of Class A Subordinate Voting and Class B Shares used to determine diluted earnings per share includesan adjustment for stock options outstanding using the treasury stock method. Under the treasury stock method:
• the exercise of options is assumed to be at the beginning of the period [or at the time of issuance, if later];• the proceeds from the exercise of options, and the amount of compensation expense measured but not yet recognized in income, are
assumed to be used to purchase Class A Subordinate Voting Shares at the average market price during the period; and• the incremental number of Class A Subordinate Voting Shares [the difference between the number of shares assumed issued and the
number of shares assumed purchased] is included in the denominator of the diluted earnings per share computation.
Class A Subordinate Voting Shares that have not been released under the Company's restricted stock plan have been excluded in thecalculation of basic earnings per share but have been included in the calculation of diluted earnings per share.

Magna International Inc. – Annual Report 2005– 48 –
Use of estimates
The preparation of the consolidated financial statements in conformity with Canadian GAAP requires management to make estimatesand assumptions that affect the amounts reported and disclosed in the consolidated financial statements and accompanying notes.Actual results could differ from those estimates.
2. ACCOUNTING CHANGE
Financial Instruments – Disclosure and Presentation
In 2003, the Canadian Institute of Chartered Accountants ["CICA"] amended Handbook Section 3860 "Financial Instruments –Disclosure and Presentation" ["CICA 3860"] to require certain obligations that may be settled with an entity's own equity instruments tobe reflected as a liability. The amendments require the Company to present its Preferred Securities and Subordinated Debentures as liabilities,with the exception of the equity value ascribed to the holders' option to convert certain of the Subordinated Debentures into Class ASubordinate Voting Shares, and to present the related liability carrying costs as a charge to income. The Company adopted these newrecommendations effective January 1, 2005 on a retroactive basis.
The impact of this accounting policy change on the consolidated balance sheet as at December 31, 2004 was as follows:
Increase in other assets $ 2
Decrease in income taxes payable $ 1Increase in long-term debt 216Decrease in debentures' interest obligation 38Decrease in minority interest 68
Decrease in other paid-in-capital $ 75Increase in retained earnings 2Decrease in currency translation adjustment 34
The impact of this accounting policy change on the consolidated statements of income and retained earnings for the years endedDecember 31, 2004 and 2003 were as follows:
2004 2003
Increase in interest expense $ 31 $ 36Decrease in income taxes (11) (13)Decrease in minority interest (4) (3)Decrease in net income (16) (20)Decrease in financing charges on Preferred Securities and other paid-in-capital 16 20Decrease in foreign exchange gain on redemption of Preferred Securities (18) —Decrease in net income available to Class A Subordinate Voting and Class B Shareholders $ (18) $ —
Reduction of earnings per Class A Subordinate Voting or Class B ShareBasic $ (0.18) $ —Diluted $ (0.18) $ —
3. GOODWILL AND LONG-LIVED ASSETS
In conjunction with the Company's annual goodwill impairment analysis and consideration of other indicators of impairment of its long-livedassets at certain operations, the Company has recorded impairment charges as follows:
2005 2004 2003
[a] Long-lived asset impairments:Europe $ 89 $ 20 $ 17North America 21 16 —
[b] Goodwill impairment:Europe 21 — —
$ 131 $ 36 $ 17
Magna International Inc. – Annual Report 2005– 49 –
Notes to the Consolidated Financial StatementsMagna International Inc.[All amounts in U.S. dollars and all tabular amounts in millions, except per share figures, unless otherwise noted]
[a] Long-lived asset impairments
EUROPE
For the year ended December 31, 2005During 2005, the Company recorded asset impairments of $89 million [$63 million after tax] relating to certain assets and facilitiesincluding:
In the United Kingdom, Belgium and Germany, the Company identified issues relating to certain exterior systems facilities, including:(i) recurring losses that were projected to continue as a result of existing sales levels and limited sales growth prospects at certainof these facilities; (ii) uncertain long-term production volumes for the United Kingdom market in general; (iii) excess paint capacityin the European market; and (iv) the resultant rationalization of painting and moulding facilities. As a result, an asset impairment of$80 million was recorded.
The Company also identified an impairment at a closure systems facility in the Czech Republic. Due to recurring losses that wereprojected to continue as a result of existing sales levels and limited sales growth prospects, an asset impairment of $8 million wasrecorded.
For the year ended December 31, 2004During 2004, the Company identified issues relating to certain exterior systems facilities, including recurring losses that were projectedto continue throughout the Company's business planning period as a result of existing sales levels and limited sales growth prospectsrelative to certain assets at these facilities. As a result, an asset impairment of $20 million [$15 million after minority interest] was recorded.
For the year ended December 31, 2003During 2003, the Company recorded an asset impairment of $17 million [$13 million after tax and minority interest] relating to certainexterior systems facilities in Europe.
In the United Kingdom, the issues included the projected continuation of operating losses, uncertain long-term production volumesfor the United Kingdom market in general, and excess paint capacity in the United Kingdom market. As a result, an asset impairmentof $12 million was recorded. The Company also completed a plan to consolidate its continental Europe paint capacity. The consolidationrequired the write down of the carrying value of certain paint line assets by $5 million.
NORTH AMERICA
For the year ended December 31, 2005During 2005, the Company recorded an asset impairment of $21 million [$14 million after tax] relating to certain assets and facilities.
The Company identified issues relating to an exterior systems facility in Canada, including losses that are projected to be incurredthroughout the Company's business planning period as a result of existing and projected sales levels. As a result, an asset impairmentof $12 million was recorded.
The Company also identified issues relating to certain powertrain facilities in the United States, including: (i) ceasing operations ata facility; and (ii) recurring losses that are projected to continue. As a result, asset impairments of $9 million were recorded in respectof certain assets at these facilities.
For the year ended December 31, 2004During 2004, the Company recorded asset impairments of $16 million [$7 million after tax and minority interest] relating to its planto cease operations at an exterior systems facility in Canada.
[b] Goodwill impairment
In conjunction with its annual business planning cycle, the Company completed its goodwill impairment analysis. As a result of thisanalysis, the Company recorded a $21 million goodwill impairment charge related to its exterior systems reporting unit in Europe.This impairment charge has not been tax benefited.
Magna International Inc. – Annual Report 2005– 50 –
4. BUSINESS ACQUISITIONS
The following acquisitions were accounted for using the purchase method:
Acquisitions in the year ended December 31, 2005
[a] Privatizations
In October 2004, Magna announced its proposal to take each of the publicly traded subsidiaries private [the "Privatizations"].The Privatizations were completed over a three-month period as follows:
TesmaOn February 1, 2005, the shareholders of Tesma International Inc. ["Tesma"] approved a plan of arrangement that became effectiveon February 6, 2005 under which Magna acquired the outstanding 56% equity interest in Tesma that it did not previously own. Totalconsideration for the outstanding Class A Subordinate Voting Shares of Tesma not owned by the Company was $613 million, whichwas satisfied by issuing 6.7 million Magna Class A Subordinate Voting Shares [note 14] and cash of $103 million. In addition, Magnaassumed responsibility for the existing stock options of Tesma, resulting in an increase in the purchase price of $17 million, representingthe fair value of the stock options assumed. This fair value has been credited to contributed surplus [note 15]. The excess of the purchaseprice over the Company's incremental interest in the book value of the assets acquired and liabilities assumed was $270 million.
DecomaOn February 28, 2005, the shareholders of Decoma International Inc. ["Decoma"] approved a plan of arrangement that becameeffective on March 6, 2005 under which Magna acquired the outstanding 27% equity interest in Decoma that it did not previouslyown. Total consideration for the outstanding Class A Subordinate Voting Shares of Decoma not owned by the Company was $239 million,which was satisfied by issuing 2.9 million Magna Class A Subordinate Voting Shares [note 14] and cash of $31 million. In addition,Magna assumed responsibility for the existing stock options of Decoma, resulting in an increase in the purchase price of $2 million,representing the fair value of the stock options assumed. This fair value has been credited to contributed surplus [note 15]. The excessof the purchase price over the Company's incremental interest in the book value of the assets acquired and liabilities assumed was$78 million.
The Decoma plan of arrangement resulted in the amalgamation of Magna and Decoma. As a result of this amalgamation, Decoma'sthree-year term credit facility maturing September 30, 2007 and Decoma's 6.5% Convertible Subordinated Debentures maturingMarch 31, 2010 became direct obligations of the Company.
IntierOn March 30, 2005, the shareholders of Intier Automotive Inc. ["Intier"] approved a plan of arrangement that became effective onApril 3, 2005 under which Magna acquired the outstanding 15% equity interest in Intier that it did not previously own. Total considerationfor the outstanding Class A Subordinate Voting Shares of Intier not owned by the Company was $202 million, which was satisfiedby issuing 2.3 million Magna Class A Subordinate Voting Shares [note 14] and cash of $50 million. In addition, Magna assumedresponsibility for the existing stock options of Intier, resulting in an increase in the purchase price of $23 million, representing thefair value of the stock options assumed. This fair value has been credited to contributed surplus [note 15]. The excess of the purchaseprice over the Company's incremental interest in the book value of the assets acquired and liabilities assumed was $87 million.
[b] Other
During 2005, the Company also completed the acquisition of a number of small manufacturing facilities. The total consideration forthe above noted acquisitions amounted to approximately $21 million [net of cash acquired] paid in cash and $12 million of assumed debt.
The purchase price allocations for these acquisitions are preliminary and adjustments to the current allocations may occur as a result ofobtaining more information regarding asset valuations. On a preliminary basis, for each of Tesma, Decoma and Intier an allocation of theexcess purchase price over the book value of assets acquired and liabilities assumed has been made to fixed assets and intangible assets.
Magna International Inc. – Annual Report 2005– 51 –
Notes to the Consolidated Financial StatementsMagna International Inc.[All amounts in U.S. dollars and all tabular amounts in millions, except per share figures, unless otherwise noted]
Acquisitions in the year ended December 31, 2004
[a] On September 29, 2004, the Company completed the acquisition of the worldwide operations of DaimlerChrysler Corporation's["DCC"] wholly owned subsidiary, New Venture Gear, Inc. ["NVG"], a leading supplier of transfer cases and other drivetrain products.Total consideration for the acquisition amounted to $428 million which was satisfied with a combination of $348 million in cash [netof cash acquired of $3 million] and $80 million in zero-coupon notes payable to DCC, which have a face value of $95 million andare due in December 2008.
The net effect on the Company's 2004 consolidated balance sheet was increases in non-cash operating assets and liabilities of $55million, fixed assets of $241 million and goodwill of $132 million. During 2005, the purchase equation for the NVG acquisition wasfinalized which resulted in a net change to the Company's consolidated balance sheet consisting of an increase in non-cash operatingassets and liabilities of $14 million, a decrease in fixed assets of $17 million, an increase in other assets of $6 million and an increasein future income taxes of $1 million with an offset to goodwill of $4 million. Goodwill was also reduced by an $18 million cash purchaseprice adjustment received in the year.
[b] On January 2, 2004, the Company completed the acquisition of Davis Industries Inc. ["Davis"], which produces stamped powertraincomponents and assemblies at three manufacturing facilities in the United States. Total consideration for the acquisition of Davisamounted to $47 million, consisting of $45 million paid in cash and the issuance of a five-year, $2 million note bearing interest atprime plus 1% per annum. Long-term debt of $22 million was also assumed on the acquisition.
[c] During 2004, the Company also completed a number of small acquisitions which include a number of manufacturing facilities andengineering centres. The total consideration for these acquisitions amounted to $69 million paid in cash plus $33 million of assumeddebt.
The net effect on the Company's 2004 consolidated balance sheet was increases in non-cash operating assets and liabilities of $2 million,fixed assets of $52 million, goodwill of $45 million, other assets of $3 million and long-term debt of $33 million. During 2005, thepurchase equations for these small acquisitions were finalized, which resulted in a net change to the Company's consolidated balancesheet consisting of an increase in other assets of $18 million and a decrease in goodwill of $18 million.
Acquisitions in the year ended December 31, 2003
During 2003, the Company completed a number of small acquisitions which include a tooling facility and a number of manufacturingfacilities for total consideration of $46 million, consisting of cash paid of $41 million and a deferred payment of $5 million. The net effecton the Company's consolidated balance sheet was an increase in non-cash operating assets and liabilities of $12 million, fixed assets of$30 million, goodwill of $6 million and long-term debt of $2 million.
Pro forma impact
If the acquisitions completed during 2005 and 2004 occurred on January 1, 2004, the Company's unaudited pro forma consolidatedsales would have been $22.8 billion for the year ended December 31, 2005 [2004 - $22.3 billion] and the unaudited pro forma consolidatednet income of the Company would have been $645 million [2004 - $745 million].
Magna International Inc. – Annual Report 2005– 52 –
5. EARNINGS PER SHARE
Earnings per share are computed as follows:
2005 2004 2003[restated – note 2]
Basic earnings per Class A Subordinate Voting or Class B Share:
Net income $ 639 $ 676 $ 500
Average number of Class A Subordinate Voting andClass B Shares outstanding during the year 106.7 96.7 95.9
Basic earnings per Class A Subordinate Voting or Class B Share $ 5.99 $ 6.99 $ 5.21
Diluted earnings per Class A Subordinate Voting or Class B Share:
Net income available to Class A Subordinate Voting and Class B Shareholders $ 639 $ 676 $ 500
Adjustment [net of related tax effect]:Interest on Convertible Subordinated Debentures 4 — —
$ 643 $ 676 $ 500
Average number of Class A Subordinate Voting andClass B Shares outstanding during the year 106.7 96.7 95.9
Stock options and restricted stock 1.4 0.6 0.4Magna Debentures 0.9 — —
109.0 97.3 96.3
Diluted earnings per Class A Subordinate Voting or Class B Share $ 5.90 $ 6.95 $ 5.19
Diluted earnings per Class A Subordinate Voting or Class B Share exclude Class A Subordinate Voting Shares issuable, only at theCompany's option, to settle the 7.08% Subordinated Debentures. The number of shares issuable is dependent on the trading price ofClass A Subordinate Voting Shares at redemption.
Furthermore, for the year ended December 31, 2005, diluted earnings per Class A Subordinate Voting or Class B Share exclude 3.6 million[2004 - 2.2 million; 2003 - 2.9 million] Class A Subordinate Voting Shares issuable under the Company's Incentive Stock Option Planbecause such options were not 'in-the-money' during these years.
Basic and diluted earnings per Class A Subordinate Voting or Class B Share from continuing operations for 2003 are computed by dividingnet income from continuing operations of $567 million by the respective average number of Class A Subordinate Voting and Class BShares reflected above.
Magna International Inc. – Annual Report 2005– 53 –
Notes to the Consolidated Financial StatementsMagna International Inc.[All amounts in U.S. dollars and all tabular amounts in millions, except per share figures, unless otherwise noted]
6. DETAILS OF CASH FROM OPERATING ACTIVITIES
[a] Items not involving current cash flows:
2005 2004 2003
Depreciation and amortization $ 711 $ 598 $ 506Goodwill and long-lived asset impairments 131 36 17Equity income (8) (14) (16)Minority interest 11 62 69Future income taxes and non-cash portion of current taxes (12) 79 63Other non-cash charges 68 44 59
$ 901 $ 805 $ 698
[b] Changes in non-cash operating assets and liabilities:
2005 2004 2003
Accounts receivable $ (280) $ (313) $ (140)Inventories (83) (82) (37)Prepaid expenses and other 11 21 (21)Accounts payable, accrued salaries and wages and other accrued liabilities 510 293 153Income taxes payable (20) (11) (46)Deferred revenue 20 (8) 10
$ 158 $ (100) $ (81)
7. INVENTORIES
Inventories consist of:
2005 2004
Raw materials and supplies $ 449 $ 474Work-in-process 208 229Finished goods 201 186Tooling and engineering 530 487
$ 1,388 $ 1,376
Tooling and engineering inventory represents costs incurred on separately priced tooling and engineering services contracts in excessof billed and unbilled amounts included in accounts receivable.
8. FIXED ASSETS
Fixed assets consist of:
2005 2004
CostLand $ 92 $ 81Buildings 623 611Machinery and equipment 6,895 6,145Construction in progress 344 504
7,954 7,341Accumulated depreciation
Buildings (196) (184)Machinery and equipment (3,634) (3,190)
$ 4,124 $ 3,967
Magna International Inc. – Annual Report 2005– 54 –
9. GOODWILL
Goodwill consists of:
2005 2004
Balance, beginning of year $ 747 $ 505Acquisitions [note 4] 197 217Impairment [note 3] (21) —Foreign exchange and other (5) 25
$ 918 $ 747
10. INCOME TAXES
[a] The provision for income taxes differs from the expense that would be obtained by applying the Canadian statutory income tax rateas a result of the following:
2005 2004 2003
Canadian statutory income tax rate 36.1% 36.1% 36.6%Manufacturing and processing profits deduction (1.2) (1.0) (2.0)Foreign rate differentials (6.8) (4.6) (3.9)Losses not benefited 2.9 3.3 3.4Earnings of equity investees (0.3) (0.4) (0.5)Increase (reduction) in enacted tax rates 0.2 (0.5) 1.0Other 0.1 1.5 1.5Effective income tax rate 31.0% 34.4% 36.1%
[b] The details of income from continuing operations before income taxes and minority interest by jurisdiction are as follows:
2005 2004 2003
Canadian $ 638 $ 650 $ 583Foreign 304 475 413
$ 942 $ 1,125 $ 996
[c] The details of the income tax provision are as follows:
2005 2004 2003
Current provisionCanadian federal taxes $ 137 $ 146 $ 124Provincial taxes 74 74 58Foreign taxes 116 116 124
327 336 306
Future provisionCanadian federal taxes 12 (4) 9Provincial taxes 7 (2) 13Foreign taxes (54) 57 32
(35) 51 54$ 292 $ 387 $ 360
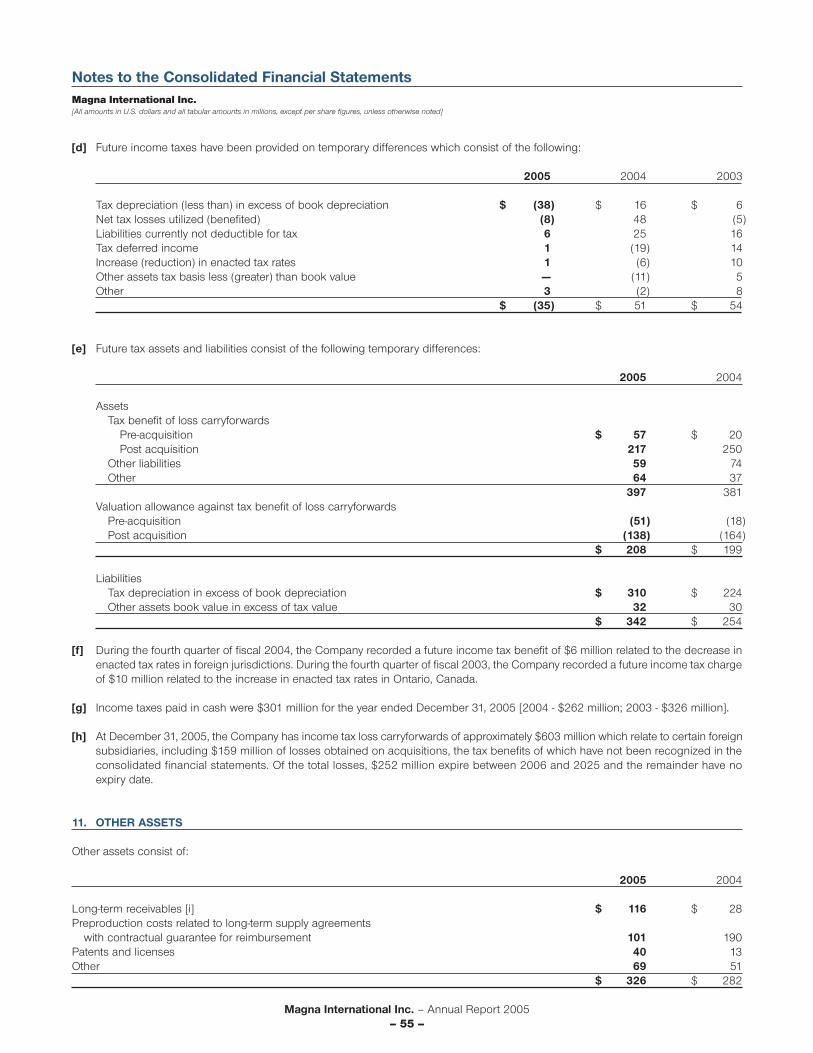
Magna International Inc. – Annual Report 2005– 55 –
Notes to the Consolidated Financial StatementsMagna International Inc.[All amounts in U.S. dollars and all tabular amounts in millions, except per share figures, unless otherwise noted]
[d] Future income taxes have been provided on temporary differences which consist of the following:
2005 2004 2003
Tax depreciation (less than) in excess of book depreciation $ (38) $ 16 $ 6Net tax losses utilized (benefited) (8) 48 (5)Liabilities currently not deductible for tax 6 25 16Tax deferred income 1 (19) 14Increase (reduction) in enacted tax rates 1 (6) 10Other assets tax basis less (greater) than book value — (11) 5Other 3 (2) 8
$ (35) $ 51 $ 54
[e] Future tax assets and liabilities consist of the following temporary differences:
2005 2004
AssetsTax benefit of loss carryforwards
Pre-acquisition $ 57 $ 20Post acquisition 217 250
Other liabilities 59 74Other 64 37
397 381Valuation allowance against tax benefit of loss carryforwards
Pre-acquisition (51) (18)Post acquisition (138) (164)
$ 208 $ 199
LiabilitiesTax depreciation in excess of book depreciation $ 310 $ 224Other assets book value in excess of tax value 32 30
$ 342 $ 254
[f] During the fourth quarter of fiscal 2004, the Company recorded a future income tax benefit of $6 million related to the decrease inenacted tax rates in foreign jurisdictions. During the fourth quarter of fiscal 2003, the Company recorded a future income tax chargeof $10 million related to the increase in enacted tax rates in Ontario, Canada.
[g] Income taxes paid in cash were $301 million for the year ended December 31, 2005 [2004 - $262 million; 2003 - $326 million].
[h] At December 31, 2005, the Company has income tax loss carryforwards of approximately $603 million which relate to certain foreignsubsidiaries, including $159 million of losses obtained on acquisitions, the tax benefits of which have not been recognized in theconsolidated financial statements. Of the total losses, $252 million expire between 2006 and 2025 and the remainder have noexpiry date.
11. OTHER ASSETS
Other assets consist of:
2005 2004
Long-term receivables [i] $ 116 $ 28Preproduction costs related to long-term supply agreements
with contractual guarantee for reimbursement 101 190Patents and licenses 40 13Other 69 51
$ 326 $ 282
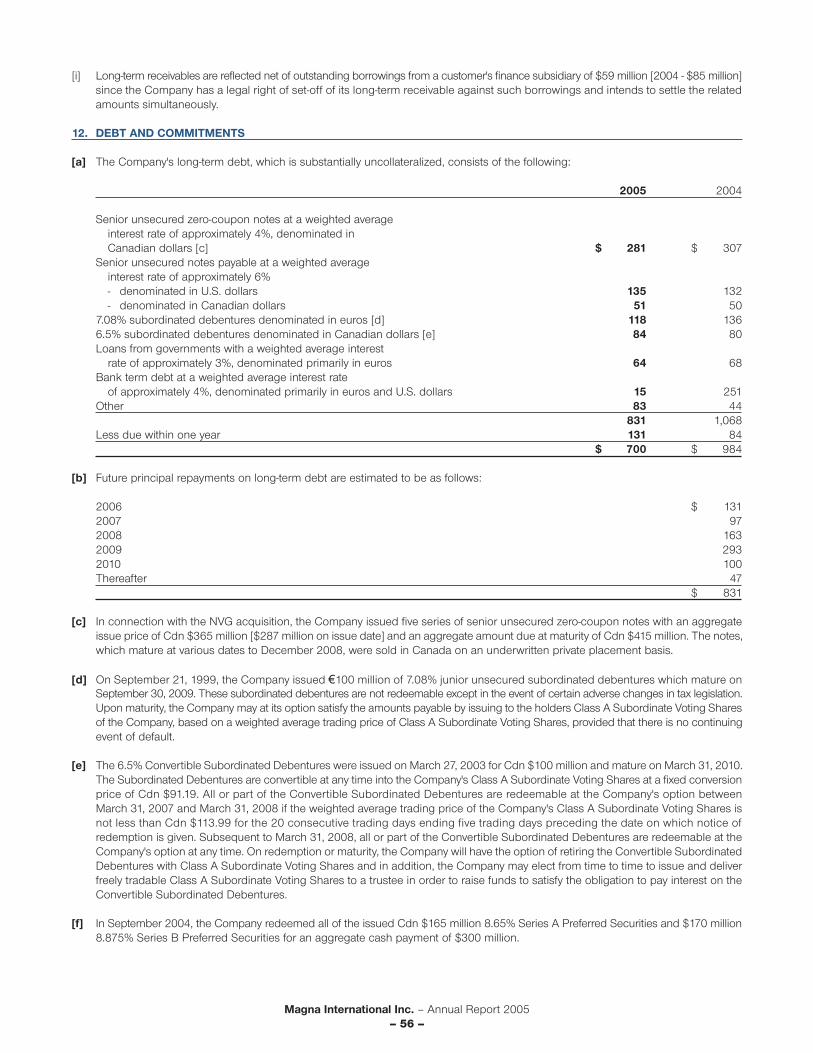
Magna International Inc. – Annual Report 2005– 56 –
[i] Long-term receivables are reflected net of outstanding borrowings from a customer's finance subsidiary of $59 million [2004 - $85 million]since the Company has a legal right of set-off of its long-term receivable against such borrowings and intends to settle the relatedamounts simultaneously.
12. DEBT AND COMMITMENTS
[a] The Company's long-term debt, which is substantially uncollateralized, consists of the following:
2005 2004
Senior unsecured zero-coupon notes at a weighted averageinterest rate of approximately 4%, denominated inCanadian dollars [c] $ 281 $ 307
Senior unsecured notes payable at a weighted averageinterest rate of approximately 6%- denominated in U.S. dollars 135 132- denominated in Canadian dollars 51 50
7.08% subordinated debentures denominated in euros [d] 118 1366.5% subordinated debentures denominated in Canadian dollars [e] 84 80Loans from governments with a weighted average interest
rate of approximately 3%, denominated primarily in euros 64 68Bank term debt at a weighted average interest rate
of approximately 4%, denominated primarily in euros and U.S. dollars 15 251Other 83 44
831 1,068Less due within one year 131 84
$ 700 $ 984
[b] Future principal repayments on long-term debt are estimated to be as follows:
2006 $ 1312007 972008 1632009 2932010 100Thereafter 47
$ 831
[c] In connection with the NVG acquisition, the Company issued five series of senior unsecured zero-coupon notes with an aggregateissue price of Cdn $365 million [$287 million on issue date] and an aggregate amount due at maturity of Cdn $415 million. The notes,which mature at various dates to December 2008, were sold in Canada on an underwritten private placement basis.
[d] On September 21, 1999, the Company issued €100 million of 7.08% junior unsecured subordinated debentures which mature onSeptember 30, 2009. These subordinated debentures are not redeemable except in the event of certain adverse changes in tax legislation.Upon maturity, the Company may at its option satisfy the amounts payable by issuing to the holders Class A Subordinate Voting Sharesof the Company, based on a weighted average trading price of Class A Subordinate Voting Shares, provided that there is no continuingevent of default.
[e] The 6.5% Convertible Subordinated Debentures were issued on March 27, 2003 for Cdn $100 million and mature on March 31, 2010.The Subordinated Debentures are convertible at any time into the Company's Class A Subordinate Voting Shares at a fixed conversionprice of Cdn $91.19. All or part of the Convertible Subordinated Debentures are redeemable at the Company's option betweenMarch 31, 2007 and March 31, 2008 if the weighted average trading price of the Company's Class A Subordinate Voting Shares isnot less than Cdn $113.99 for the 20 consecutive trading days ending five trading days preceding the date on which notice ofredemption is given. Subsequent to March 31, 2008, all or part of the Convertible Subordinated Debentures are redeemable at theCompany's option at any time. On redemption or maturity, the Company will have the option of retiring the Convertible SubordinatedDebentures with Class A Subordinate Voting Shares and in addition, the Company may elect from time to time to issue and deliverfreely tradable Class A Subordinate Voting Shares to a trustee in order to raise funds to satisfy the obligation to pay interest on theConvertible Subordinated Debentures.
[f] In September 2004, the Company redeemed all of the issued Cdn $165 million 8.65% Series A Preferred Securities and $170 million8.875% Series B Preferred Securities for an aggregate cash payment of $300 million.
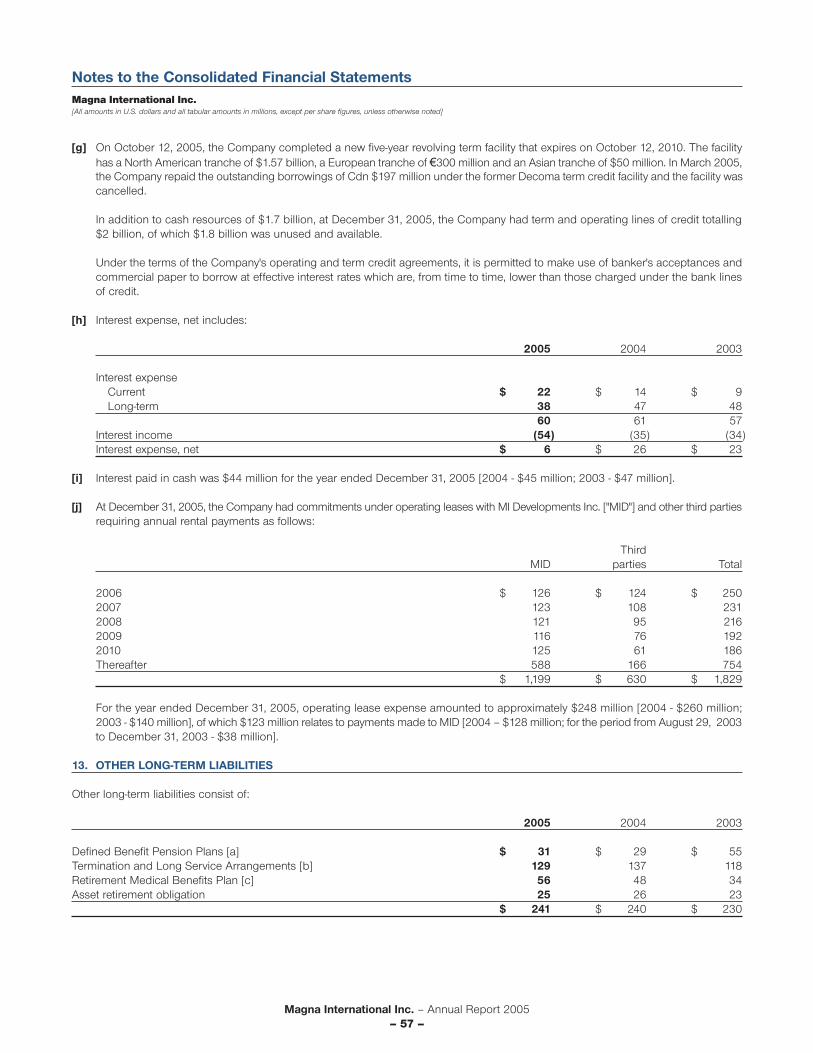
Magna International Inc. – Annual Report 2005– 57 –
Notes to the Consolidated Financial StatementsMagna International Inc.[All amounts in U.S. dollars and all tabular amounts in millions, except per share figures, unless otherwise noted]
[g] On October 12, 2005, the Company completed a new five-year revolving term facility that expires on October 12, 2010. The facilityhas a North American tranche of $1.57 billion, a European tranche of €300 million and an Asian tranche of $50 million. In March 2005,the Company repaid the outstanding borrowings of Cdn $197 million under the former Decoma term credit facility and the facility wascancelled.
In addition to cash resources of $1.7 billion, at December 31, 2005, the Company had term and operating lines of credit totalling$2 billion, of which $1.8 billion was unused and available.
Under the terms of the Company's operating and term credit agreements, it is permitted to make use of banker's acceptances andcommercial paper to borrow at effective interest rates which are, from time to time, lower than those charged under the bank linesof credit.
[h] Interest expense, net includes:
2005 2004 2003
Interest expenseCurrent $ 22 $ 14 $ 9Long-term 38 47 48
60 61 57Interest income (54) (35) (34)Interest expense, net $ 6 $ 26 $ 23
[i] Interest paid in cash was $44 million for the year ended December 31, 2005 [2004 - $45 million; 2003 - $47 million].
[j] At December 31, 2005, the Company had commitments under operating leases with MI Developments Inc. ["MID"] and other third partiesrequiring annual rental payments as follows:
ThirdMID parties Total
2006 $ 126 $ 124 $ 2502007 123 108 2312008 121 95 2162009 116 76 1922010 125 61 186Thereafter 588 166 754
$ 1,199 $ 630 $ 1,829
For the year ended December 31, 2005, operating lease expense amounted to approximately $248 million [2004 - $260 million;2003 - $140 million], of which $123 million relates to payments made to MID [2004 – $128 million; for the period from August 29, 2003to December 31, 2003 - $38 million].
13. OTHER LONG-TERM LIABILITIES
Other long-term liabilities consist of:
2005 2004 2003
Defined Benefit Pension Plans [a] $ 31 $ 29 $ 55Termination and Long Service Arrangements [b] 129 137 118Retirement Medical Benefits Plan [c] 56 48 34Asset retirement obligation 25 26 23
$ 241 $ 240 $ 230

Magna International Inc. – Annual Report 2005– 58 –
[a] Defined Benefit Pension Plans
The Company sponsors a number of defined benefit pension plans and similar arrangements for its employees. European definedbenefit pension plans, other than in the United Kingdom, are unfunded.
Certain defined benefit pension plans in the United States were frozen at December 31, 2004. No further benefits will accrue underthese plans. As a result, a curtailment gain of $29 million was recorded in cost of goods sold in 2004.
All pension plans are funded to at least the minimum legal funding requirements.
The cost of pension benefits earned by employees is actuarially determined using the projected benefit method pro rated on serviceand management's best estimate of expected plan investment performance, salary escalation and retirement ages of employees.
The weighted average of significant actuarial assumptions adopted in measuring the Company's obligations and costs are as follows:
2005 2004 2003
Projected benefit obligationDiscount rate 5.2% 5.6% 5.8%Rate of compensation increase 3.5% 3.4% 3.9%
Net periodic benefit costDiscount rate 5.5% 5.8% 6.4%Rate of compensation increase 3.2% 3.4% 3.9%Expected return on plan assets 7.7% 7.8% 7.8%
Information about the Company's defined benefit pension plans is as follows:
2005 2004 2003
Projected benefit obligationBeginning of year $ 195 $ 243 $ 190Current service and interest costs 33 36 28Actuarial losses and changes in actuarial assumptions 18 5 23Benefits paid (6) (6) (9)Special termination benefits — — 1Divestitures — (57) —Effect of curtailment (4) (34) —Currency translation (2) 8 10
End of year $ 234 $ 195 $ 243
Plan assets at fair valueBeginning of year $ 158 $ 164 $ 114Return on plan assets 20 13 20Employer contributions 14 16 32Benefits paid (6) (6) (9)Divestitures — (35) —Currency translation (1) 6 7
End of year $ 185 $ 158 $ 164
Unfunded amount $ 49 $ 37 $ 79Unrecognized actuarial losses (18) (8) (24)Net amount recognized in the consolidated balance sheets $ 31 $ 29 $ 55
Net periodic benefit cost (income)Current service $ 23 $ 36 $ 28Return on plan assets 10 (7) (8)Actuarial losses (gains) (1) (1) 1Curtailment gain (2) (29) —
Net periodic benefit cost (income) $ 30 $ (1) $ 21
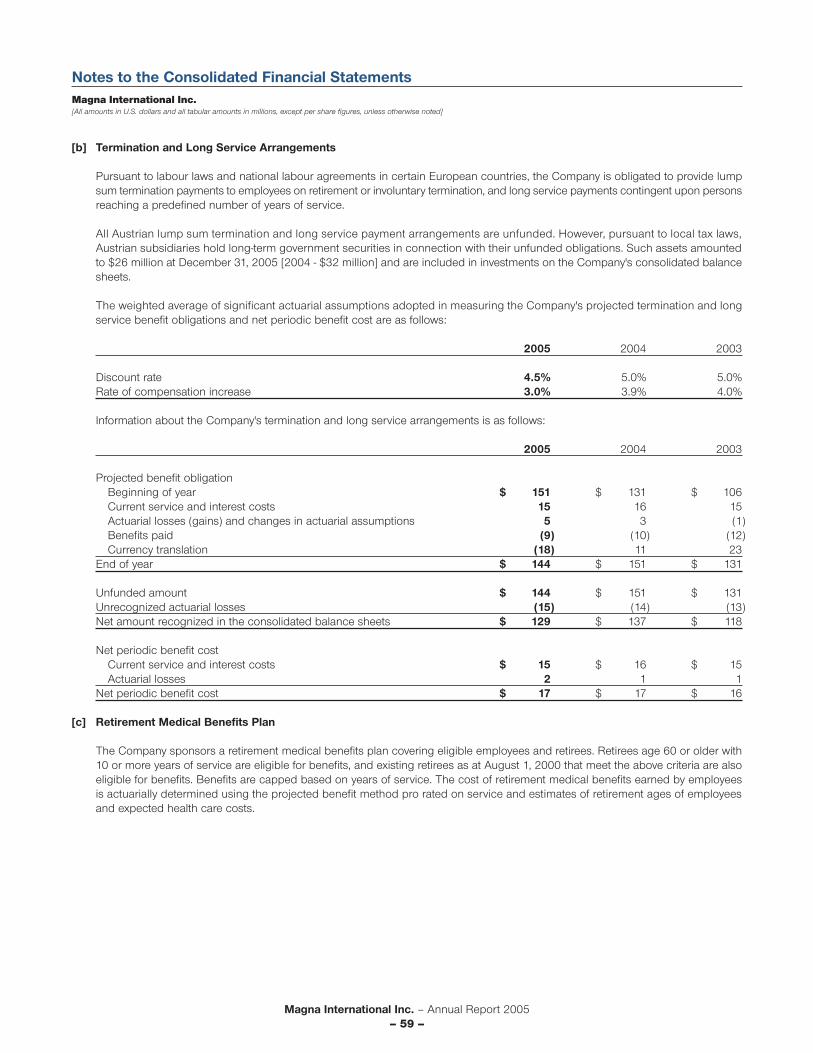
Magna International Inc. – Annual Report 2005– 59 –
Notes to the Consolidated Financial StatementsMagna International Inc.[All amounts in U.S. dollars and all tabular amounts in millions, except per share figures, unless otherwise noted]
[b] Termination and Long Service Arrangements
Pursuant to labour laws and national labour agreements in certain European countries, the Company is obligated to provide lumpsum termination payments to employees on retirement or involuntary termination, and long service payments contingent upon personsreaching a predefined number of years of service.
All Austrian lump sum termination and long service payment arrangements are unfunded. However, pursuant to local tax laws,Austrian subsidiaries hold long-term government securities in connection with their unfunded obligations. Such assets amountedto $26 million at December 31, 2005 [2004 - $32 million] and are included in investments on the Company's consolidated balancesheets.
The weighted average of significant actuarial assumptions adopted in measuring the Company's projected termination and longservice benefit obligations and net periodic benefit cost are as follows:
2005 2004 2003
Discount rate 4.5% 5.0% 5.0%Rate of compensation increase 3.0% 3.9% 4.0%
Information about the Company's termination and long service arrangements is as follows:
2005 2004 2003
Projected benefit obligationBeginning of year $ 151 $ 131 $ 106Current service and interest costs 15 16 15Actuarial losses (gains) and changes in actuarial assumptions 5 3 (1)Benefits paid (9) (10) (12)Currency translation (18) 11 23
End of year $ 144 $ 151 $ 131
Unfunded amount $ 144 $ 151 $ 131Unrecognized actuarial losses (15) (14) (13)Net amount recognized in the consolidated balance sheets $ 129 $ 137 $ 118
Net periodic benefit costCurrent service and interest costs $ 15 $ 16 $ 15Actuarial losses 2 1 1
Net periodic benefit cost $ 17 $ 17 $ 16
[c] Retirement Medical Benefits Plan
The Company sponsors a retirement medical benefits plan covering eligible employees and retirees. Retirees age 60 or older with10 or more years of service are eligible for benefits, and existing retirees as at August 1, 2000 that meet the above criteria are alsoeligible for benefits. Benefits are capped based on years of service. The cost of retirement medical benefits earned by employeesis actuarially determined using the projected benefit method pro rated on service and estimates of retirement ages of employeesand expected health care costs.
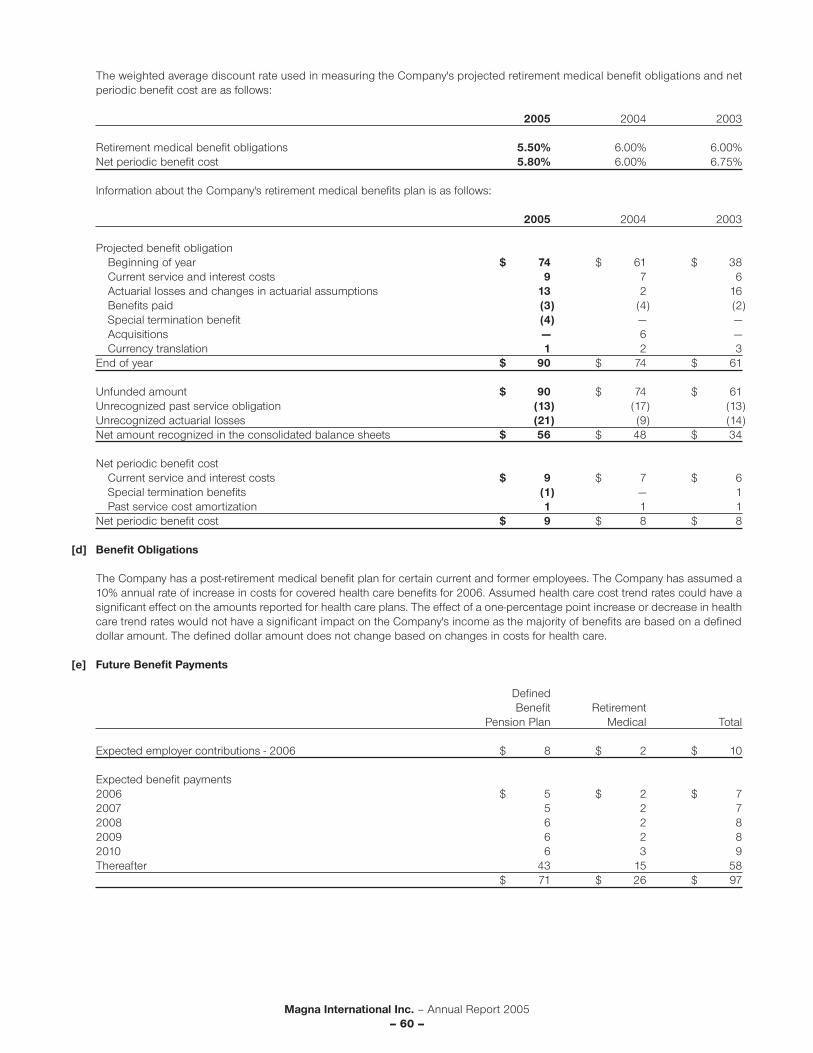
Magna International Inc. – Annual Report 2005– 60 –
The weighted average discount rate used in measuring the Company's projected retirement medical benefit obligations and netperiodic benefit cost are as follows:
2005 2004 2003
Retirement medical benefit obligations 5.50% 6.00% 6.00%Net periodic benefit cost 5.80% 6.00% 6.75%
Information about the Company's retirement medical benefits plan is as follows:
2005 2004 2003
Projected benefit obligationBeginning of year $ 74 $ 61 $ 38Current service and interest costs 9 7 6Actuarial losses and changes in actuarial assumptions 13 2 16Benefits paid (3) (4) (2)Special termination benefit (4) — —Acquisitions — 6 —Currency translation 1 2 3
End of year $ 90 $ 74 $ 61
Unfunded amount $ 90 $ 74 $ 61 Unrecognized past service obligation (13) (17) (13)Unrecognized actuarial losses (21) (9) (14)Net amount recognized in the consolidated balance sheets $ 56 $ 48 $ 34
Net periodic benefit costCurrent service and interest costs $ 9 $ 7 $ 6Special termination benefits (1) — 1Past service cost amortization 1 1 1
Net periodic benefit cost $ 9 $ 8 $ 8
[d] Benefit Obligations
The Company has a post-retirement medical benefit plan for certain current and former employees. The Company has assumed a10% annual rate of increase in costs for covered health care benefits for 2006. Assumed health care cost trend rates could have asignificant effect on the amounts reported for health care plans. The effect of a one-percentage point increase or decrease in healthcare trend rates would not have a significant impact on the Company's income as the majority of benefits are based on a defineddollar amount. The defined dollar amount does not change based on changes in costs for health care.
[e] Future Benefit Payments
DefinedBenefit Retirement
Pension Plan Medical Total
Expected employer contributions - 2006 $ 8 $ 2 $ 10
Expected benefit payments2006 $ 5 $ 2 $ 72007 5 2 72008 6 2 82009 6 2 82010 6 3 9Thereafter 43 15 58
$ 71 $ 26 $ 97
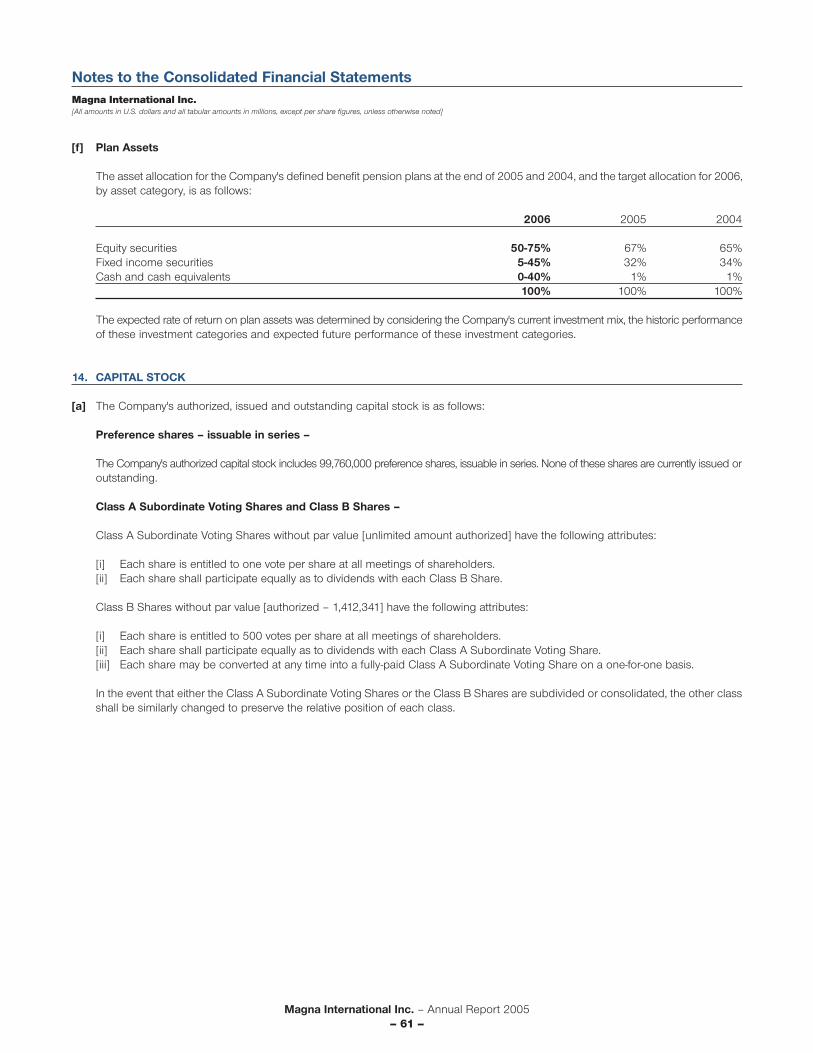
Magna International Inc. – Annual Report 2005– 61 –
Notes to the Consolidated Financial StatementsMagna International Inc.[All amounts in U.S. dollars and all tabular amounts in millions, except per share figures, unless otherwise noted]
[f] Plan Assets
The asset allocation for the Company's defined benefit pension plans at the end of 2005 and 2004, and the target allocation for 2006,by asset category, is as follows:
2006 2005 2004
Equity securities 50-75% 67% 65%Fixed income securities 5-45% 32% 34%Cash and cash equivalents 0-40% 1% 1%
100% 100% 100%
The expected rate of return on plan assets was determined by considering the Company's current investment mix, the historic performanceof these investment categories and expected future performance of these investment categories.
14. CAPITAL STOCK
[a] The Company's authorized, issued and outstanding capital stock is as follows:
Preference shares – issuable in series –
The Company's authorized capital stock includes 99,760,000 preference shares, issuable in series. None of these shares are currently issued oroutstanding.
Class A Subordinate Voting Shares and Class B Shares –
Class A Subordinate Voting Shares without par value [unlimited amount authorized] have the following attributes:
[i] Each share is entitled to one vote per share at all meetings of shareholders.[ii] Each share shall participate equally as to dividends with each Class B Share.
Class B Shares without par value [authorized – 1,412,341] have the following attributes:
[i] Each share is entitled to 500 votes per share at all meetings of shareholders.[ii] Each share shall participate equally as to dividends with each Class A Subordinate Voting Share.[iii] Each share may be converted at any time into a fully-paid Class A Subordinate Voting Share on a one-for-one basis.
In the event that either the Class A Subordinate Voting Shares or the Class B Shares are subdivided or consolidated, the other classshall be similarly changed to preserve the relative position of each class.

Magna International Inc. – Annual Report 2005– 62 –
[b] Changes in the Class A Subordinate Voting Shares and Class B Shares for the years ended December 31, 2005, 2004 and 2003are shown in the following table [number of shares in the following table are expressed in whole numbers and have not been roundedto the nearest million]:
Class ASubordinate Voting Class B
Number of Stated Number of Statedshares value shares value
Issued and outstanding at December 31, 2002 94,477,224 $ 2,487 1,096,509 $ 1Issued under the Dividend Reinvestment Plan [i] 31,869 2Issued for cash under the Incentive Stock Option Plan 801,425 42Return of stated capital on distribution of MID shares [iii] — (939) — (1)Repurchase of Class A Subordinate Voting Shares [ii] — (5)Issued and outstanding at December 31, 2003 95,310,518 1,587 1,096,509 —Issued under the Dividend Reinvestment Plan [i] 5,259 —Issued for cash under the Incentive Stock Option Plan 532,074 27Conversion of Class B Shares to
Class A Subordinate Voting Shares 2,526 — (2,526) —Repurchase of Class A Subordinate Voting Shares [ii] — (4)Issued and outstanding at December 31, 2004 95,850,377 1,610 1,093,983 —Issued on privatization of Tesma [ii] 6,687,709 510Issued on privatization of Decoma [ii] 2,854,400 208Issued on privatization of Intier [ii] 2,332,748 152Exchange of subsidiary restricted
stock for Magna restricted stock [ii] — (27)Issued under the Dividend Reinvestment Plan [i] 15,472 1Issued for cash under the Incentive Stock Option Plan 443,689 31Repurchase of Class A Subordinate Voting Shares [ii] — (15)Issued and outstanding at December 31, 2005 108,184,395 $ 2,470 1,093,983 $ —
[i] The Company has a Dividend Reinvestment Plan whereby shareholders have the option to receive their dividends in the formof Class A Subordinate Voting Shares in lieu of cash.
[ii] At December 31, 2005, 878,281 [2004 – 124,976] Magna Class A Subordinate Voting Shares, which were purchased for cashconsideration of $15 million [2004 – $4 million], have been awarded on a restricted basis to certain executives. Since this stockhas not been released to the executives, it has been reflected as a reduction in the stated value of the Company's Class ASubordinate Voting Shares.
[iii] As a result of the MID distribution, the stated capital of the Class A Subordinate Voting and Class B Shares was reduced by$939 million and $1 million, respectively [note 24].
[c] The following table presents the maximum number of shares that would be outstanding if all the dilutive instruments outstandingat February 24, 2006 were exercised or converted:
Class A Subordinate Voting and Class B Shares 109,301,880Subordinated Debentures 1,096,582Stock options [note 16] 4,576,537
114,974,999
The above amounts include shares issuable if the holders of the 6.5% Convertible Subordinated Debentures exercise their conversionoption but exclude Class A Subordinate Voting Shares issuable, only at the Company's option, to settle interest and principal relatedto the 6.5% Convertible Subordinated Debentures. The number of Class A Subordinate Voting Shares issuable at the Company'soption is dependent on the trading price of the Class A Subordinate Voting Shares at the time the Company elects to settle the 6.5%Convertible Subordinated Debenture interest and principal with shares.
The above amounts also exclude Class A Subordinate Voting Shares issuable, only at the Company's option, to settle the 7.08%Subordinated Debentures on redemption or maturity. The number of shares issuable is dependent on the trading price of Class ASubordinate Voting Shares at redemption or maturity of the 7.08% Subordinated Debentures.
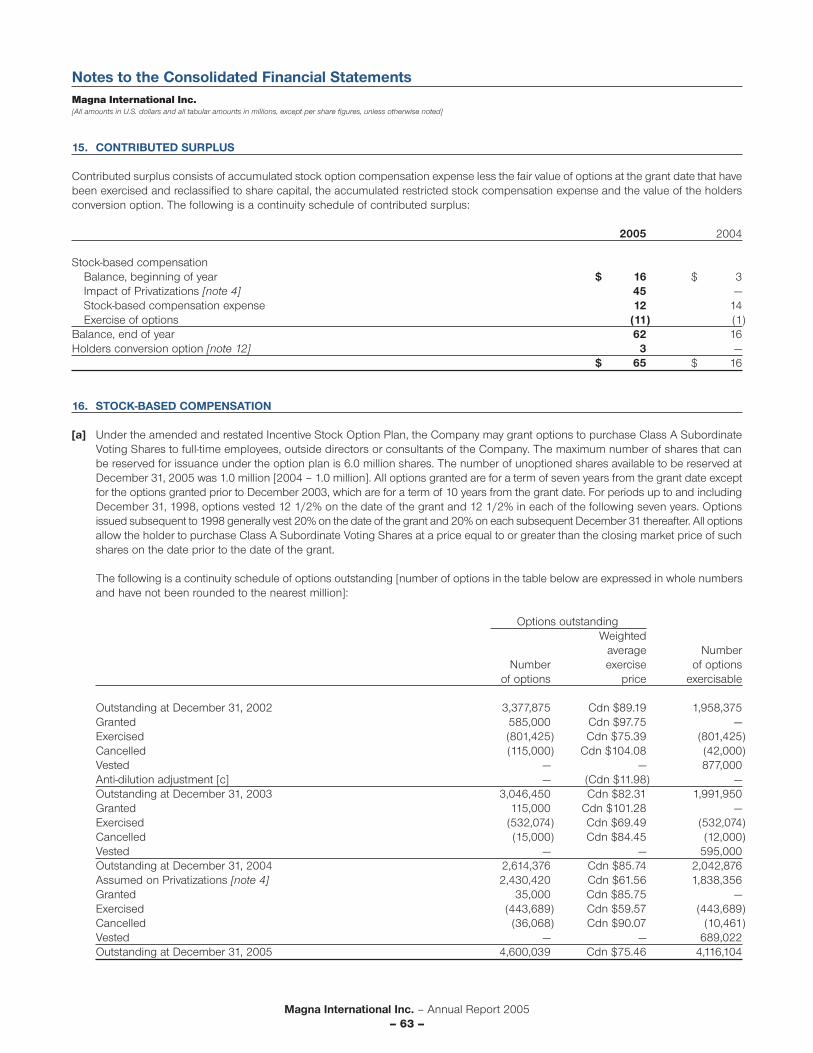
Magna International Inc. – Annual Report 2005– 63 –
Notes to the Consolidated Financial StatementsMagna International Inc.[All amounts in U.S. dollars and all tabular amounts in millions, except per share figures, unless otherwise noted]
15. CONTRIBUTED SURPLUS
Contributed surplus consists of accumulated stock option compensation expense less the fair value of options at the grant date that havebeen exercised and reclassified to share capital, the accumulated restricted stock compensation expense and the value of the holdersconversion option. The following is a continuity schedule of contributed surplus:
2005 2004
Stock-based compensationBalance, beginning of year $ 16 $ 3Impact of Privatizations [note 4] 45 —Stock-based compensation expense 12 14Exercise of options (11) (1)
Balance, end of year 62 16Holders conversion option [note 12] 3 —
$ 65 $ 16
16. STOCK-BASED COMPENSATION
[a] Under the amended and restated Incentive Stock Option Plan, the Company may grant options to purchase Class A SubordinateVoting Shares to full-time employees, outside directors or consultants of the Company. The maximum number of shares that canbe reserved for issuance under the option plan is 6.0 million shares. The number of unoptioned shares available to be reserved atDecember 31, 2005 was 1.0 million [2004 – 1.0 million]. All options granted are for a term of seven years from the grant date exceptfor the options granted prior to December 2003, which are for a term of 10 years from the grant date. For periods up to and includingDecember 31, 1998, options vested 12 1/2% on the date of the grant and 12 1/2% in each of the following seven years. Optionsissued subsequent to 1998 generally vest 20% on the date of the grant and 20% on each subsequent December 31 thereafter. All optionsallow the holder to purchase Class A Subordinate Voting Shares at a price equal to or greater than the closing market price of suchshares on the date prior to the date of the grant.
The following is a continuity schedule of options outstanding [number of options in the table below are expressed in whole numbersand have not been rounded to the nearest million]:
Options outstandingWeighted
average NumberNumber exercise of options
of options price exercisable
Outstanding at December 31, 2002 3,377,875 Cdn $89.19 1,958,375Granted 585,000 Cdn $97.75 —Exercised (801,425) Cdn $75.39 (801,425)Cancelled (115,000) Cdn $104.08 (42,000)Vested — — 877,000Anti-dilution adjustment [c] — (Cdn $11.98) —Outstanding at December 31, 2003 3,046,450 Cdn $82.31 1,991,950Granted 115,000 Cdn $101.28 —Exercised (532,074) Cdn $69.49 (532,074)Cancelled (15,000) Cdn $84.45 (12,000)Vested — — 595,000Outstanding at December 31, 2004 2,614,376 Cdn $85.74 2,042,876Assumed on Privatizations [note 4] 2,430,420 Cdn $61.56 1,838,356Granted 35,000 Cdn $85.75 —Exercised (443,689) Cdn $59.57 (443,689)Cancelled (36,068) Cdn $90.07 (10,461)Vested — — 689,022Outstanding at December 31, 2005 4,600,039 Cdn $75.46 4,116,104
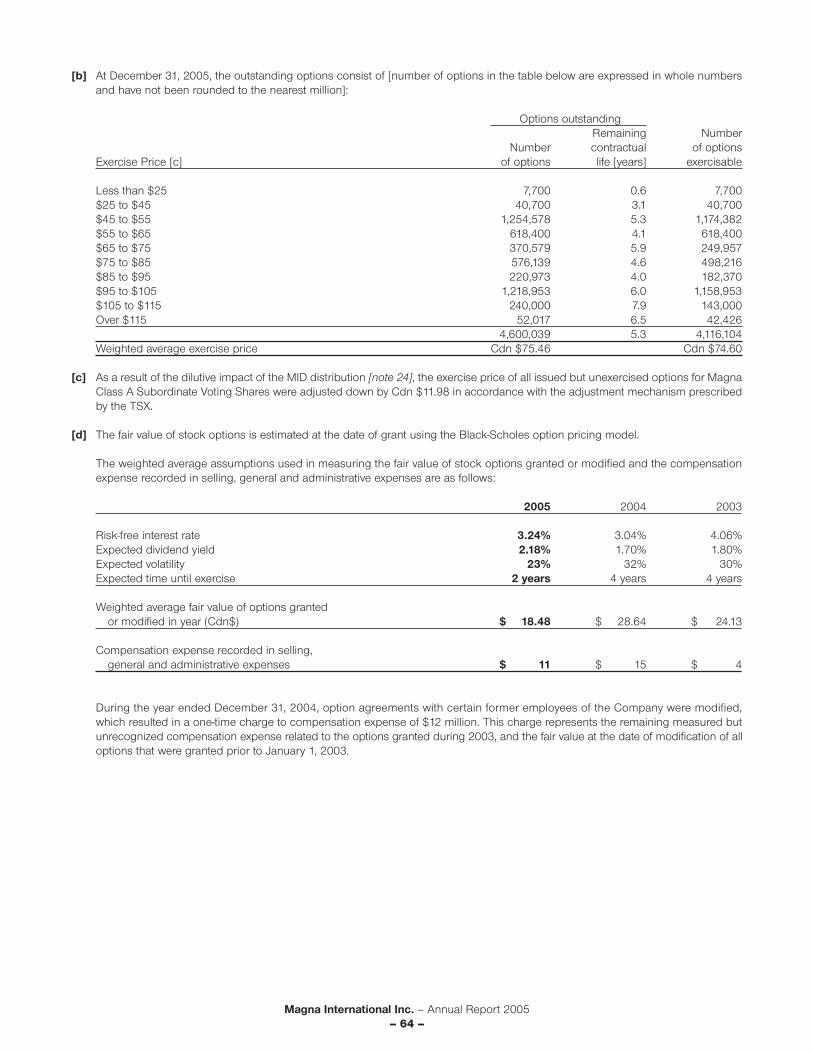
Magna International Inc. – Annual Report 2005– 64 –
[b] At December 31, 2005, the outstanding options consist of [number of options in the table below are expressed in whole numbersand have not been rounded to the nearest million]:
Options outstandingRemaining Number
Number contractual of optionsExercise Price [c] of options life [years] exercisable
Less than $25 7,700 0.6 7,700$25 to $45 40,700 3.1 40,700$45 to $55 1,254,578 5.3 1,174,382$55 to $65 618,400 4.1 618,400$65 to $75 370,579 5.9 249,957$75 to $85 576,139 4.6 498,216$85 to $95 220,973 4.0 182,370$95 to $105 1,218,953 6.0 1,158,953$105 to $115 240,000 7.9 143,000Over $115 52,017 6.5 42,426
4,600,039 5.3 4,116,104Weighted average exercise price Cdn $75.46 Cdn $74.60
[c] As a result of the dilutive impact of the MID distribution [note 24], the exercise price of all issued but unexercised options for MagnaClass A Subordinate Voting Shares were adjusted down by Cdn $11.98 in accordance with the adjustment mechanism prescribedby the TSX.
[d] The fair value of stock options is estimated at the date of grant using the Black-Scholes option pricing model.
The weighted average assumptions used in measuring the fair value of stock options granted or modified and the compensationexpense recorded in selling, general and administrative expenses are as follows:
2005 2004 2003
Risk-free interest rate 3.24% 3.04% 4.06%Expected dividend yield 2.18% 1.70% 1.80%Expected volatility 23% 32% 30%Expected time until exercise 2 years 4 years 4 years
Weighted average fair value of options grantedor modified in year (Cdn$) $ 18.48 $ 28.64 $ 24.13
Compensation expense recorded in selling,general and administrative expenses $ 11 $ 15 $ 4
During the year ended December 31, 2004, option agreements with certain former employees of the Company were modified,which resulted in a one-time charge to compensation expense of $12 million. This charge represents the remaining measured butunrecognized compensation expense related to the options granted during 2003, and the fair value at the date of modification of alloptions that were granted prior to January 1, 2003.
Magna International Inc. – Annual Report 2005– 65 –
Notes to the Consolidated Financial StatementsMagna International Inc.[All amounts in U.S. dollars and all tabular amounts in millions, except per share figures, unless otherwise noted]
If the fair value recognition provisions would have been adopted effective January 1, 2002 for all stock options granted after January 1, 2002,the Company's pro forma net income and pro forma basic and diluted earnings per Class A Subordinate Voting or Class B Sharewould have been as follows:
2005 2004 2003
Pro forma net income $ 636 $ 676 $ 496
Pro forma earnings per Class A Subordinate Voting or Class B Share
Basic $ 5.96 $ 6.99 $ 5.17Diluted $ 5.87 $ 6.95 $ 5.15
[e] The Company has awarded to certain executives an entitlement to Class A Subordinate Voting Shares in the form of restricted stock.Such shares become available to the executives, subject to acceleration on death and disability, after an approximate four-year holdingperiod, provided certain conditions are met, and are to be released in equal amounts over a 10-year period, subject to forfeitureunder certain circumstances. At December 31, 2005, unamortized compensation expense related to the restricted stock arrangementswas $43 million [2004 - $36 million] and has been presented as a reduction of shareholders' equity.
During 2004, the Company has awarded 112,072 Restricted Share Units to an executive, each of which is equivalent to one MagnaClass A Subordinate Voting Share. Such Restricted Share Units will be released to the executive, subject to acceleration on deathand disability, after an approximate five-year holding period, provided certain conditions are met, and are to be released in equalamounts over a 10-year period, subject to forfeiture under certain circumstances. Upon the release of all or any portion of theRestricted Share Units, the executive shall be entitled to receive one Class A Subordinate Voting Share for every Restricted ShareUnit released.
17. FINANCIAL INSTRUMENTS
[a] Foreign exchange contracts
At December 31, 2005, the Company had outstanding foreign exchange forward contracts representing commitments to buy andsell foreign currencies in exchange for Canadian and U.S. dollars as follows:
For Canadian dollars For U.S. dollarsU.S. Weighted Weighted Weighted
dollar average Euro average Euro averageBuy (Sell) amount rate amount rate amount rate
2006 $ 332 1.2557 € 27 1.5496 € 22 1.21602006 (389) 1.2174 (245) 1.4817 (60) 1.20972007 130 1.2896 10 1.6028 2 1.19762007 (81) 1.2950 (51) 1.6568 (7) 1.33542008 81 1.2473 9 1.6216 — —2008 (6) 1.3762 (44) 1.6646 — —2009 37 1.1940 7 1.6321 — —2009 — — (27) 1.6839 — —2010 4 1.1582 1 1.4625 — —
$ 108 € (313) € (43)
Based on forward foreign exchange rates as at December 31, 2005 for contracts with similar remaining terms to maturity, the unrecognizedgains and losses relating to the Company's foreign exchange forward contracts are approximately $81 million and $61 million,respectively. If the Company's forward exchange contracts ceased to be effective as hedges, for example, if projected net foreign cashinflows declined significantly, previously unrecognized gains or losses pertaining to the portion of the hedging transactions in excessof projected foreign currency denominated cash flows would be recognized in income at the time this condition was identified.

Magna International Inc. – Annual Report 2005– 66 –
[b] Fair value
The Company has determined the estimated fair values of its financial instruments based on appropriate valuation methodologies,however, considerable judgment is required to develop these estimates. Accordingly, these estimated fair values are not necessarilyindicative of the amounts the Company could realize in a current market exchange. The estimated fair value amounts can be materiallyaffected by the use of different assumptions or methodologies. The methods and assumptions used to estimate the fair value offinancial instruments are described below:
Cash and cash equivalents, accounts receivable, bank indebtedness, accounts payable and other accrued liabilities
Due to the short period to maturity of the instruments, the carrying values as presented in the consolidated balance sheets are reasonableestimates of fair values.
Investments
Fair value information is not readily available. However, management believes the market value to be in excess of the carrying value ofinvestments.
Long-term debt
The fair values of the Company's long-term debt, based on current rates for debt with similar terms and maturities, are not materiallydifferent from their carrying values.
[c] Credit risk
The Company's financial assets that are exposed to credit risk consist primarily of cash and cash equivalents, accounts receivable,and foreign exchange forward contracts with positive fair values.
The Company, in the normal course of business, is exposed to credit risk from its customers, substantially all of which are in theautomotive industry. These accounts receivable are subject to normal industry credit risks.
Cash and cash equivalents, which consists of short-term investments, including commercial paper, are only invested in governmentsand corporations with an investment grade credit rating. Credit risk is further reduced by limiting the amount which is invested inany one government or corporation.
The Company is also exposed to credit risk from the potential default by any of its counterparties on its foreign exchange forwardcontracts. The Company mitigates this credit risk by dealing with counterparties who are major financial institutions and which theCompany anticipates will satisfy their obligations under the contracts.
[d] Interest rate risk
The Company is not exposed to significant interest rate risk due to the short-term maturity of its monetary current assets and currentliabilities. In addition, the Company's exposure to interest rate risk on fixed rate long-term instruments is also reduced given the minimumperiods to redemption with respect to the subordinated debentures.
18. CURRENCY TRANSLATION ADJUSTMENT
Unrealized currency translation adjustments, which arise on the translation to U.S. dollars of assets and liabilities of the Company's self-sustainingforeign operations, resulted in an unrealized currency translation loss of $151 million during the year ended December 31, 2005 [2004– gain of $233 million; 2003 – gain of $532 million]. The unrealized loss in 2005 resulted primarily from the weakening of the euro andBritish pound partially offset by the strengthening of the Canadian dollar, all against the U.S. dollar. The unrealized gains in 2004 and2003 resulted primarily from the strengthening of the Canadian dollar, euro and British pound against the U.S. dollar.
Magna International Inc. – Annual Report 2005– 67 –
Notes to the Consolidated Financial StatementsMagna International Inc.[All amounts in U.S. dollars and all tabular amounts in millions, except per share figures, unless otherwise noted]
19. INTERESTS IN JOINTLY CONTROLLED ENTITIES
The following is the Company's combined proportionate share of the major components of the financial statements of the jointly controlledentities in which the Company has an interest [before eliminations]:
Balance Sheets2005 2004
Current assets $ 200 $ 167
Long-term assets $ 52 $ 51
Current liabilities $ 86 $ 48
Long-term liabilities $ 43 $ 102
Statements of Income2005 2004 2003
Sales $ 678 $ 658 $ 637Cost of goods sold, expenses and income taxes 604 619 603Net income $ 74 $ 39 $ 34
Statements of Cash Flows2005 2004 2003
Cash provided from (used for):Operating activities $ 101 $ 85 $ 49
Investment activities $ (17) $ (1) $ (14)
Financing activities $ (58) $ (92) $ (24)
The Company's share of equity in the jointly controlled entities includes undistributed earnings of $46 million [2004 - $48 million].
20. TRANSACTIONS WITH RELATED PARTIES
Mr. Stronach, Magna's Chairman of the Board, and two members of his family are trustees of the Stronach Trust. The Stronach Trustcontrols Magna through the right to direct the votes attaching to 66% of Magna's Class B Shares and also controls MID and thereforeMagna Entertainment Corp. ["MEC"], through the right to direct the votes attaching to 66% of MID's Class B Shares. Various land andbuildings used in Magna's operations are leased from MID under operating lease agreements which are effected on normal commercialterms [note 12]. Lease expense included in the consolidated statements of income with respect to MID for the year ended December 31, 2005was $123 million [2004 – $128 million; for the period from August 29, 2003 to December 31, 2003 - $38 million]. Included in accountspayable are trade amounts owing to MID and its subsidiaries in the amount of $2 million [2004 – $1 million].
During 2004, MID provided project management services to the Company in connection with the construction of a new plant. In December2004, the land and building for this plant were sold to MID for $46 million and the assumption of related development liabilities of $12 million,representing the Company's cost of these assets. The land and building have been leased back under a 17-year operating lease.
The Company has agreements with affiliates of the Chairman of the Board for the provision of business development and consultingservices. In addition, the Company has an agreement with the Chairman of the Board for the provision of business development andother services. The aggregate amount expensed under these agreements with respect to the year ended December 31, 2005 was $33 million[2004 - $40 million; 2003 - $36 million].

Magna International Inc. – Annual Report 2005– 68 –
During the year ended December 31, 2005, trusts, which exist to make orderly purchases of the Company's shares for employees eitherfor transfer to the EPSP or to recipients of either bonuses or rights to purchase such shares from the trusts, borrowed up to $51 million[2004 - $29 million; 2003 - $29 million] from the Company to facilitate the purchase of Class A Subordinate Voting Shares. At December31, 2005, the trusts' indebtedness to the Company was $21 million [2004 - $26 million].
Investments include $3 million [2004 - $2 million], at cost, in respect of an investment in a company that was established to acquireshares of the Company for sale to employees.
During the year ended December 31, 2004, the Company renewed its agreements with MEC for the use of their golf course and clubhousemeeting, dining and other facilities in Aurora, Ontario and in Oberwaltersdorf, Austria for annual payments of Cdn $5.0 million and €2.5 million,respectively, for a period of 10 years ending December 31, 2014. The expense included in the consolidated statements of income withrespect to these agreements for the year ended December 31, 2005 was $7 million [2004 – $7 million; for the period from August 29, 2003to December 31, 2003 - $2 million].
21. CONTINGENCIES
[a] In November 1997, the Company and two of its subsidiaries were sued by KS Centoco Ltd., an Ontario-based steering wheel manufacturerin which the Company has a 23% equity interest, and by Centoco Holdings Limited, the owner of the remaining 77% equity interestin KS Centoco Ltd. In March 1999, the plaintiffs were granted leave to make substantial amendments to the original statement of claimin order to add several new defendants and claim additional remedies, and in February 2006, the plaintiffs further amended theirclaim to add an additional remedy. The amended statement of claim alleges, among other things:
• breach of fiduciary duty by the Company and two of its subsidiaries;
• breach by the Company of its binding letter of intent with KS Centoco Ltd., including its covenant not to have any interest, directlyor indirectly, in any entity that carries on the airbag business in North America, other than through MST Automotive Inc., a companyto be 77% owned by Magna and 23% owned by Centoco Holdings Limited;
• the plaintiff's exclusive entitlement to certain airbag technologies in North America pursuant to an exclusive licence agreement,together with an accounting of all revenues and profits resulting from the alleged use by the Company, TRW Inc. ["TRW"] and otherunrelated third party automotive supplier defendants of such technology in North America;
• a conspiracy by the Company, TRW and others to deprive KS Centoco Ltd. of the benefits of such airbag technology in North Americaand to cause Centoco Holdings Limited to sell to TRW its interest in KS Centoco Ltd. in conjunction with the Company's sale to TRWof its interest in MST Automotive GmbH and TEMIC Bayern-Chemie Airbag GmbH; and
• oppression by the defendants.
The plaintiffs are seeking, amongst other things, damages of approximately Cdn $3.5 billion. The Company has filed an amendedStatement of Defence and Counterclaim. Document production is being completed and examinations for discovery have commenced.The Company intends to vigorously defend this case. At this time, notwithstanding the amount of time which has transpired sincethe claim was filed, these legal proceedings remain at an early stage. Notwithstanding this and the difficulty in predicting final outcomes,management believes that the ultimate resolution of these claims will not have a material adverse effect on the consolidated financialposition of the Company.
[b] In June 2004, Intier was served with a statement of claim issued in the Ontario Superior Court of Justice by C-MAC Invotronics Inc.,a subsidiary of Solectron Corporation. The plaintiff is a supplier of electro-mechanical and electronic automotive parts and componentsto Intier. The statement of claim alleges, among other things:
• improper use by Intier of the plaintiff's confidential information and technology in order to design and manufacture certain automotiveparts and components; and
• breach of contract related to a failure by Intier to fulfill certain preferred sourcing obligations arising under a strategic allianceagreement as well as follow a certain re-pricing mechanism set forth in a long-term supply agreement, in each case signed by theparties at the time of the Company's disposition of the Invotronics business division to the plaintiff in September 2000.
The plaintiff is seeking, among other things, compensatory damages in the amount of Cdn $150 million and punitive damages inthe amount of Cdn $10 million and an accounting of profits. Intier filed a Statement of Defence and Counterclaim for misrepresentation,breach of contract, conspiracy and interfering with economic interests. The parties are currently engaged in discoveries. Despite theearly stages of the litigation, management believes it has valid defenses to the plaintiff's claims and therefore intends to defend thiscase vigorously.
Magna International Inc. – Annual Report 2005– 69 –
Notes to the Consolidated Financial StatementsMagna International Inc.[All amounts in U.S. dollars and all tabular amounts in millions, except per share figures, unless otherwise noted]
[c] The Company and/or its subsidiaries Magna Donnelly and Intier have been named with Ford Motor Company as defendants inclass action proceedings in the Ontario Superior Court of Justice as well as state courts in North Carolina and Florida as a result ofMagna Donnelly's role as a supplier to Ford of door handles and Intier's role as a supplier of door latches, and in certain cases doorlatch assemblies, for the Ford F-150, F-250, Expedition, Lincoln Navigator and Blackwood vehicles produced by Ford betweenNovember 1995 and April 2000. Class proceedings in other states are anticipated. In these proceedings, plaintiffs are seekingcompensatory damages in an amount to cover the cost of repairing the vehicles or replacing the door latches, punitive damages,attorney fees and interest. Each of the class actions have similar claims and allege that the door latch systems are defective and donot comply with applicable motor vehicle safety legislation and that the defendants conspired to hide the alleged defects from theend use consumer. These class proceedings are in the early stages and have not been certified by any court. The Company deniesthese allegations and intends to vigorously defend the lawsuits, including taking steps to consolidate the state class proceedings tofederal court wherever possible. Given the early stages of the proceedings, it is not possible to predict their outcome.
[d] Effective August 30, 2004, a supplier purported to terminate its obligations to supply the Company with certain steel products at agreedupon prices under two supply agreements. The supplier subsequently continued to supply steel at an invoice price reflecting currentmarket prices pending resolution of this matter, and the Company continued to pay for the steel products in question at the pricesset out in the two supply agreements. The right of the supplier to terminate its obligations to supply steel under the supply agreementsis being disputed by the Company pursuant to arbitration proceedings that were commenced in the fourth quarter of 2004. The arbitrationhearing is expected to be held in the fall of 2006. If the supplier is successful in the arbitration, the Company's maximum potentialexposure as at December 31, 2005 would be less than $85 million. However, the Company believes it has valid defenses to eachof the claims and will continue to vigorously defend against the supplier's claims.
[e] In the ordinary course of business activities, the Company may be contingently liable for litigation and claims with customers, suppliersand former employees. In addition, the Company may be, or could become, liable to incur environmental remediation costs to bringenvironmental contamination levels back within acceptable legal limits. On an ongoing basis, the Company assesses the likelihood ofany adverse judgments or outcomes to these matters as well as potential ranges of probable costs and losses.
A determination of the provision required, if any, for these contingencies is made after analysis of each individual issue. The requiredprovision may change in the future due to new developments in each matter or changes in approach such as a change in settlementstrategy in dealing with these matters.
[f] In certain circumstances, the Company is at risk for warranty costs including product liability and recall costs. Due to the nature of thecosts, the Company makes its best estimate of the expected future costs, however, the ultimate amount of such costs could be materiallydifferent. The Company continues to experience increased customer pressure to assume greater warranty responsibility. Currently, undermost customer agreements, the Company only accounts for existing or probable claims. Under certain complete vehicle engineeringand assembly contracts, the Company records an estimate of future warranty-related costs based on the terms of the specific customeragreements, and the specific customer’s warranty experience.
22. SEGMENTED INFORMATION
[a] Magna, a leading global supplier of technologically advanced automotive systems, assemblies, modules and components, follows acorporate policy of functional and operational decentralization. It conducts its operations through divisions, which function asautonomous business units. As at December 31, 2005, Magna had 224 manufacturing divisions and 60 product development andengineering centres in 22 countries. Magna designs, develops and manufactures automotive systems, assemblies, modules andcomponents, and engineers and assembles complete vehicles for sale to OEMs of cars and light trucks in North America, Europe,Asia and South America ["Rest of World"]. Magna's product capabilities span a number of major automotive areas including: interiors;seating; closures; metal body systems; exterior and interior mirrors and engineered glass; electronics; plastic body, lighting and exteriortrim systems; various powertrain and drivetrain systems; retractable hard top and soft top roof systems; and complete vehicle engineeringand assembly.
Historically, the Company had supplied these products and services through global product groups, three of which [Tesma,Decoma and Intier] were publicly traded companies in which Magna had a controlling interest. During 2005 the Company acquiredthe outstanding equity interest in the publicly traded companies that it did not previously own [note 4]. There were four key elements toMagna's rationale for the Privatizations:
• improve strategic positioning;• exploit the Company's various competencies;• better alignment of the Company's product portfolio; and• avoid duplication of investment in infrastructure and development costs.
Magna International Inc. – Annual Report 2005– 70 –
Shortly after the Privatizations were completed, the Company began to reorganize its operations on a geographic basis, betweenNorth America, Europe and Rest of World. Accordingly, segment reporting has been restated to reflect the Company's new structure.
Magna's success is directly dependent upon the levels of North American and European [and currently to a lesser extent on Restof World] car and light truck production by its customers. OEM production volumes in each of North America and Europe may beimpacted by a number of geographic factors, including general economic conditions, interest rates, fuel prices and availability, infrastructure,legislative changes, environmental emission and safety issues, and labour and/or trade relations.
Given these differences between the regions in which the Company operates, Magna's operations are segmented on a geographicbasis between North America, Europe and Rest of World. The role of the North American and European management teams is tomanage the interests of the Company to ensure a coordinated effort across the different product capabilities. In addition to maintainingkey customer, supplier and government contacts in their respective markets, the management teams centrally manage key aspectsof their operations while permitting the divisions enough flexibility through its decentralized structure to foster an entrepreneurialenvironment.
Consistent with the organizational changes described above, the Company's internal financial reporting has been revised toseparately segment key internal operating performance measures between North America, Europe and Rest of World for purposesof presentation to the chief operating decision maker to assist in the assessment of operating performance, the allocation of resources,and the long-term strategic direction and future global growth of the Company. The Company's reporting to Magna's CorporateExecutive Team, Board of Directors and shareholders has also been revised accordingly.
The accounting policies of each segment are the same as those set out under "Significant Accounting Policies" [note 1] and intersegmentsales and transfers are accounted for at fair market value.
The following table shows certain information with respect to segment disclosures:
2005Depreciation Fixed Fixed
Total External and asset assets,sales sales amortization EBIT[i] Goodwill additions net
North AmericaCanada $ 6,513 $ 6,215 $ 242 $ 1,078United States 5,714 5,468 213 1,242Mexico 1,123 1,071 49 337Eliminations (551) — — —
North America 12,799 12,754 $ 427 $ 733 $ 603 504 2,657Europe
Euroland [ii] 8,714 8,533 240 1,128Great Britain 918 904 20 66Other European countries 580 442 19 87Eliminations (190) — — —
Europe 10,022 9,879 259 82 250 279 1,281Rest of World 209 178 12 2 65 26 83Corporate and Other [iii], [iv] (219) — 13 131 — 39 103Total reportable segments $ 22,811 $ 22,811 $ 711 $ 948 $ 918 $ 848 4,124Current assets 6,603Investments, goodwill and other assets 1,594Consolidated total assets $ 12,321

Magna International Inc. – Annual Report 2005– 71 –
Notes to the Consolidated Financial StatementsMagna International Inc.[All amounts in U.S. dollars and all tabular amounts in millions, except per share figures, unless otherwise noted]
2004Depreciation Fixed Fixed
Total External and asset assets,sales sales amortization EBIT[i] Goodwill additions net
North AmericaCanada $ 5,860 $ 5,604 $ 191 $ 1,025United States 4,426 4,165 264 1,028Mexico 976 920 88 320Eliminations (543) — — —
North America 10,719 10,689 $ 348 $ 886 $ 437 543 2,373Europe
Euroland [ii] 8,698 8,541 235 1,257Great Britain 928 897 9 92Other European countries 514 384 27 103Eliminations (207) — — —
Europe 9,933 9,822 232 176 257 271 1,452Rest of World 162 142 9 10 53 14 61Corporate and Other [iii], [iv] (161) — 9 79 — 31 81Total reportable segments $ 20,653 $ 20,653 $ 598 $ 1,151 $ 747 $ 859 3,967Current assets 6,281Investments, goodwill and other assets 1,367Consolidated total assets $ 11,615
2003Depreciation Fixed Fixed
Total External and asset assets,sales sales amortization EBIT[i] Goodwill additions net
North AmericaCanada $ 5,066 $ 4,842 $ 211 $ 965United States 3,632 3,417 182 703Mexico 885 839 29 234Eliminations (443) — — —
North America 9,140 9,098 $ 285 $ 866 $ 272 422 1,902Europe
Euroland [ii] 5,211 5,052 292 1,128Great Britain 869 836 10 92Other European countries 368 257 16 74Eliminations (216) — — —
Europe 6,232 6,145 188 44 178 318 1,294Rest of World 107 93 7 — 55 19 58Corporate and Other [iii], [iv] (134) 9 26 115 — 42 59Total reportable segments $ 15,345 $ 15,345 $ 506 $ 1,025 $ 505 $ 801 3,313Current assets 5,371Investments, goodwill and other assets 1,187Consolidated total assets $ 9,871
Notes:
[i] EBIT represents operating income before interest income or expense.[ii] For purposes of segmentation, Euroland has been defined as those European countries that have adopted the euro as their
common currency.[iii] Included in Corporate and Other EBIT are intercompany fees and rent income until August 29, 2003 charged to the other automotive
segments.[iv] During the year ended December 31, 2005, equity income of $8 million is included in the Corporate and Other segment [2004
- $14 million; 2003 - $16 million].
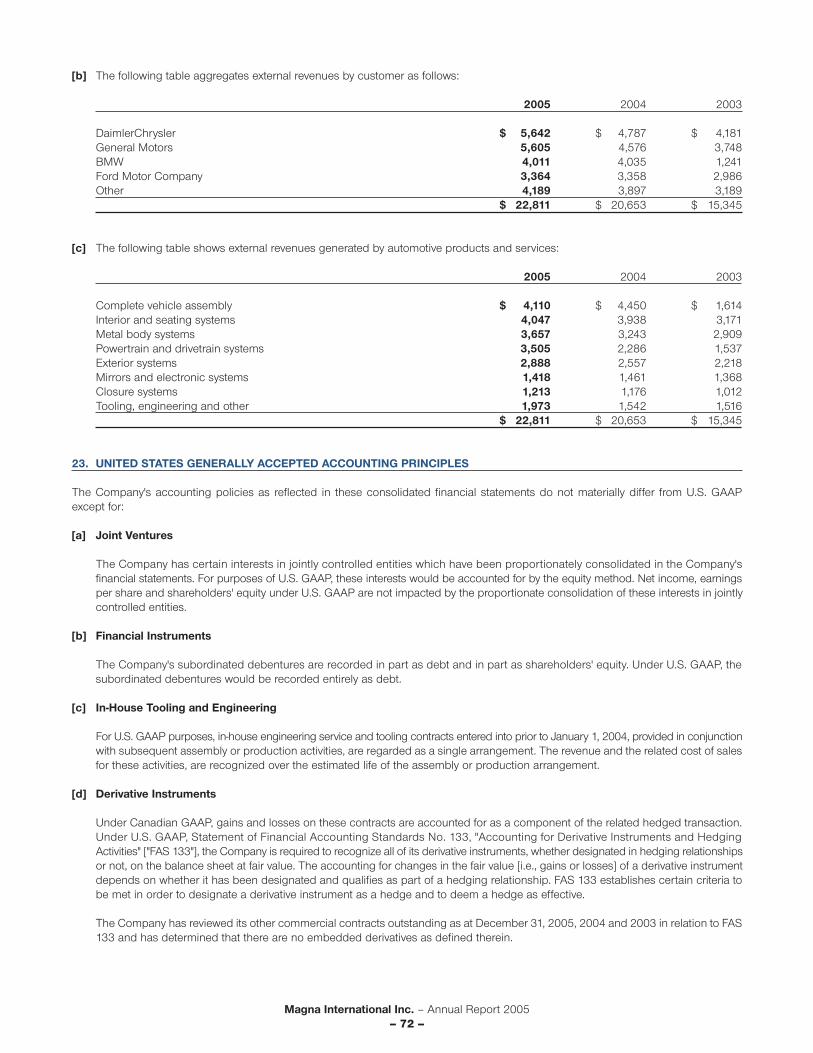
Magna International Inc. – Annual Report 2005– 72 –
[b] The following table aggregates external revenues by customer as follows:
2005 2004 2003
DaimlerChrysler $ 5,642 $ 4,787 $ 4,181General Motors 5,605 4,576 3,748BMW 4,011 4,035 1,241Ford Motor Company 3,364 3,358 2,986Other 4,189 3,897 3,189
$ 22,811 $ 20,653 $ 15,345
[c] The following table shows external revenues generated by automotive products and services:
2005 2004 2003
Complete vehicle assembly $ 4,110 $ 4,450 $ 1,614Interior and seating systems 4,047 3,938 3,171Metal body systems 3,657 3,243 2,909Powertrain and drivetrain systems 3,505 2,286 1,537Exterior systems 2,888 2,557 2,218Mirrors and electronic systems 1,418 1,461 1,368Closure systems 1,213 1,176 1,012Tooling, engineering and other 1,973 1,542 1,516
$ 22,811 $ 20,653 $ 15,345
23. UNITED STATES GENERALLY ACCEPTED ACCOUNTING PRINCIPLES
The Company's accounting policies as reflected in these consolidated financial statements do not materially differ from U.S. GAAPexcept for:
[a] Joint Ventures
The Company has certain interests in jointly controlled entities which have been proportionately consolidated in the Company'sfinancial statements. For purposes of U.S. GAAP, these interests would be accounted for by the equity method. Net income, earningsper share and shareholders' equity under U.S. GAAP are not impacted by the proportionate consolidation of these interests in jointlycontrolled entities.
[b] Financial Instruments
The Company's subordinated debentures are recorded in part as debt and in part as shareholders' equity. Under U.S. GAAP, thesubordinated debentures would be recorded entirely as debt.
[c] In-House Tooling and Engineering
For U.S. GAAP purposes, in-house engineering service and tooling contracts entered into prior to January 1, 2004, provided in conjunctionwith subsequent assembly or production activities, are regarded as a single arrangement. The revenue and the related cost of salesfor these activities, are recognized over the estimated life of the assembly or production arrangement.
[d] Derivative Instruments
Under Canadian GAAP, gains and losses on these contracts are accounted for as a component of the related hedged transaction.Under U.S. GAAP, Statement of Financial Accounting Standards No. 133, "Accounting for Derivative Instruments and HedgingActivities" ["FAS 133"], the Company is required to recognize all of its derivative instruments, whether designated in hedging relationshipsor not, on the balance sheet at fair value. The accounting for changes in the fair value [i.e., gains or losses] of a derivative instrumentdepends on whether it has been designated and qualifies as part of a hedging relationship. FAS 133 establishes certain criteria tobe met in order to designate a derivative instrument as a hedge and to deem a hedge as effective.
The Company has reviewed its other commercial contracts outstanding as at December 31, 2005, 2004 and 2003 in relation to FAS133 and has determined that there are no embedded derivatives as defined therein.
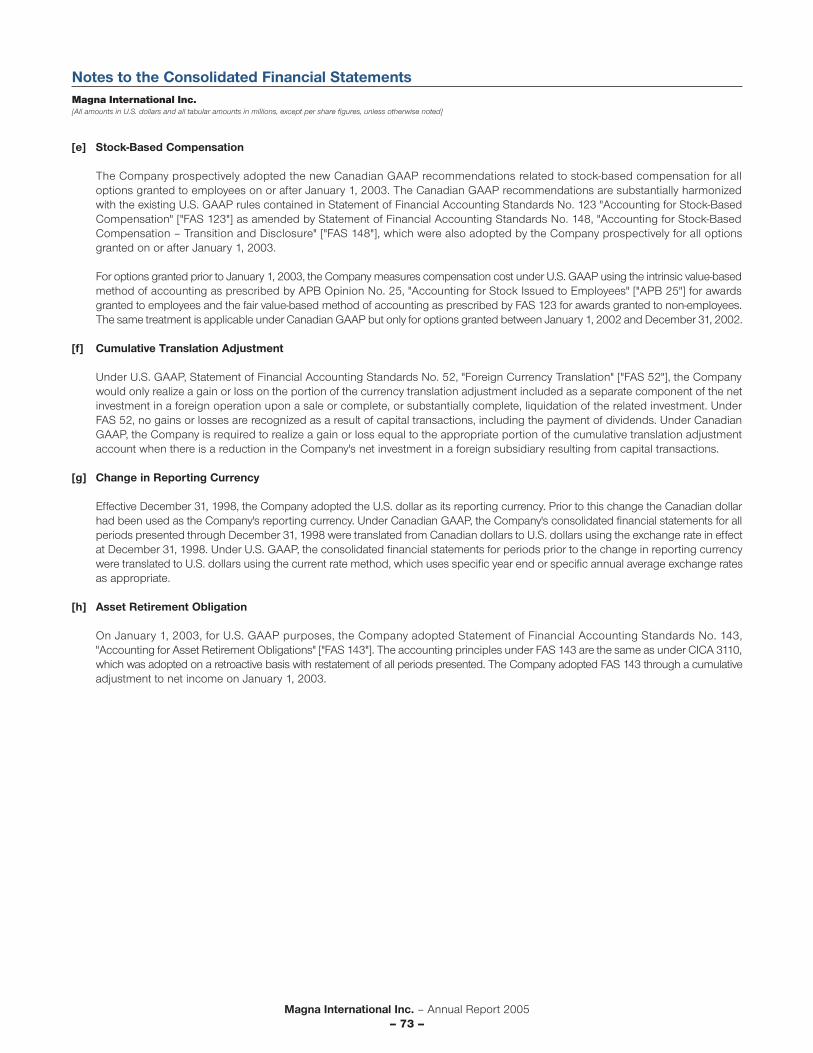
Magna International Inc. – Annual Report 2005– 73 –
Notes to the Consolidated Financial StatementsMagna International Inc.[All amounts in U.S. dollars and all tabular amounts in millions, except per share figures, unless otherwise noted]
[e] Stock-Based Compensation
The Company prospectively adopted the new Canadian GAAP recommendations related to stock-based compensation for alloptions granted to employees on or after January 1, 2003. The Canadian GAAP recommendations are substantially harmonizedwith the existing U.S. GAAP rules contained in Statement of Financial Accounting Standards No. 123 "Accounting for Stock-BasedCompensation" ["FAS 123"] as amended by Statement of Financial Accounting Standards No. 148, "Accounting for Stock-BasedCompensation – Transition and Disclosure" ["FAS 148"], which were also adopted by the Company prospectively for all optionsgranted on or after January 1, 2003.
For options granted prior to January 1, 2003, the Company measures compensation cost under U.S. GAAP using the intrinsic value-basedmethod of accounting as prescribed by APB Opinion No. 25, "Accounting for Stock Issued to Employees" ["APB 25"] for awardsgranted to employees and the fair value-based method of accounting as prescribed by FAS 123 for awards granted to non-employees.The same treatment is applicable under Canadian GAAP but only for options granted between January 1, 2002 and December 31, 2002.
[f] Cumulative Translation Adjustment
Under U.S. GAAP, Statement of Financial Accounting Standards No. 52, "Foreign Currency Translation" ["FAS 52"], the Companywould only realize a gain or loss on the portion of the currency translation adjustment included as a separate component of the netinvestment in a foreign operation upon a sale or complete, or substantially complete, liquidation of the related investment. UnderFAS 52, no gains or losses are recognized as a result of capital transactions, including the payment of dividends. Under CanadianGAAP, the Company is required to realize a gain or loss equal to the appropriate portion of the cumulative translation adjustmentaccount when there is a reduction in the Company's net investment in a foreign subsidiary resulting from capital transactions.
[g] Change in Reporting Currency
Effective December 31, 1998, the Company adopted the U.S. dollar as its reporting currency. Prior to this change the Canadian dollarhad been used as the Company's reporting currency. Under Canadian GAAP, the Company's consolidated financial statements for allperiods presented through December 31, 1998 were translated from Canadian dollars to U.S. dollars using the exchange rate in effectat December 31, 1998. Under U.S. GAAP, the consolidated financial statements for periods prior to the change in reporting currencywere translated to U.S. dollars using the current rate method, which uses specific year end or specific annual average exchange ratesas appropriate.
[h] Asset Retirement Obligation
On January 1, 2003, for U.S. GAAP purposes, the Company adopted Statement of Financial Accounting Standards No. 143,"Accounting for Asset Retirement Obligations" ["FAS 143"]. The accounting principles under FAS 143 are the same as under CICA 3110,which was adopted on a retroactive basis with restatement of all periods presented. The Company adopted FAS 143 through a cumulativeadjustment to net income on January 1, 2003.

Magna International Inc. – Annual Report 2005– 74 –
[i] The following tables present net income and earnings per share information following U.S. GAAP:
2005 2004 2003
Net income under Canadian GAAP $ 639 $ 676 $ 500Adjustments [net of related tax effects]:
In-house tooling and engineering [c] (13) (4) (3)Derivative instruments [d] — — 5Compensation expense [e] 3 (4) (10)Translation loss realized on the reduction of the
net investment in a foreign subsidiary [f] (18) — —Net income under U.S. GAAP before cumulative
catch-up adjustment 611 668 492Cumulative adjustment for change in accounting
policy for asset retirement obligation [h] — — (6)Net income under U.S. GAAP 611 668 486Other comprehensive income (loss):
Foreign currency translation adjustment (134) 192 569Derivative instruments recorded in other
comprehensive income [d] 16 (11) 12Comprehensive income under U.S. GAAP $ 493 $ 849 $ 1,067
Earnings per Class A Subordinate Voting orClass B Share under U.S. GAAP:
BasicBefore cumulative catch-up adjustment $ 5.72 $ 6.91 $ 5.13Cumulative catch-up adjustment [h] — — (0.06)After cumulative catch-up adjustment $ 5.72 $ 6.91 $ 5.07
DilutedBefore cumulative catch-up adjustment $ 5.64 $ 6.87 $ 5.11Cumulative catch-up adjustment [h] — — (0.06)After cumulative catch-up adjustment $ 5.64 $ 6.87 $ 5.05
Earnings per share data after cumulative catch-up adjustment were computed as follows:
2005 2004 2003
Basic earnings per Class A Subordinate Voting or Class B Share– After cumulative catch-up adjustment
Net income under U.S. GAAP $ 611 $ 668 $ 486
Average number of Class A Subordinate Voting andClass B Shares outstanding during the year 106.7 96.7 95.9
Basic earnings per Class A Subordinate Votingor Class B Share $ 5.72 $ 6.91 $ 5.07
Diluted earnings per Class A Subordinate Voting or Class B Share– After cumulative catch-up adjustment
Net income under U.S. GAAP $ 611 $ 668 $ 486Adjustment [net of related tax effect]:Interest on 6.5% Convertible Subordinated Debentures 4 — —
$ 615 $ 668 $ 486
Average number of Class A Subordinate Voting and Class B Sharesoutstanding during the year 106.7 96.7 95.9
Stock options 1.4 0.6 0.4Convertible Subordinated Debentures 0.9 — —
109.0 97.3 96.3
Diluted earnings per Class A Subordinate Voting or Class B Share $ 5.64 $ 6.87 $ 5.05
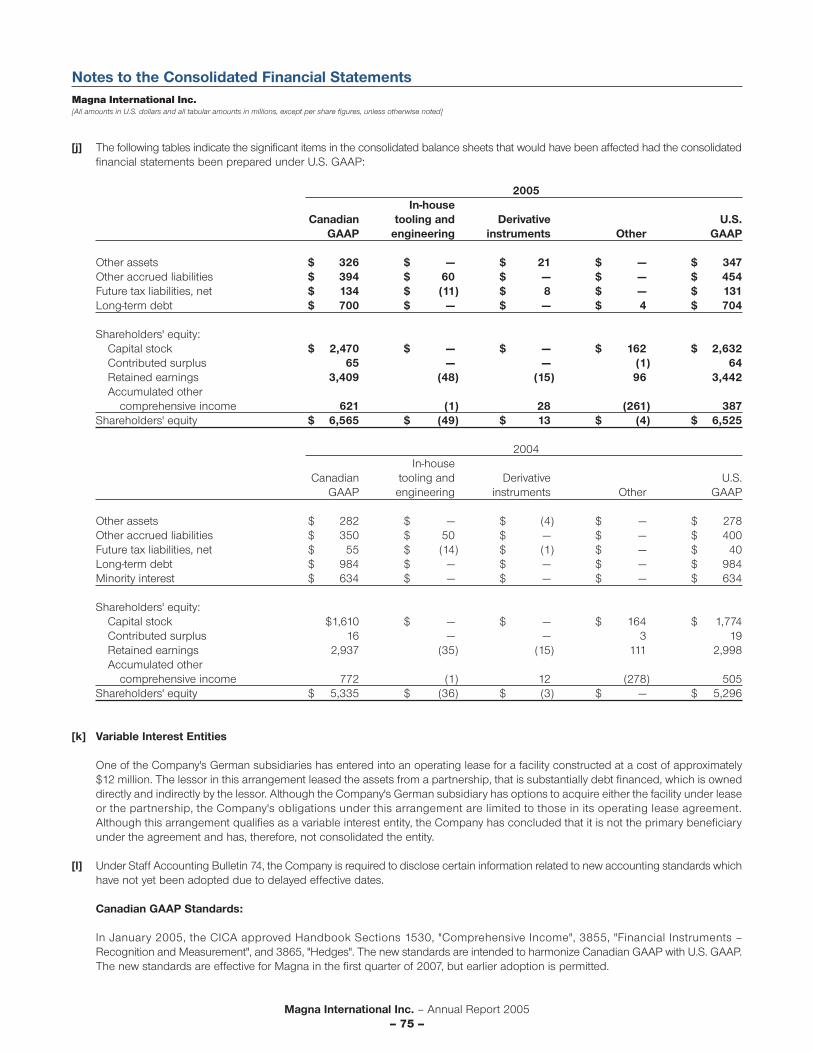
Magna International Inc. – Annual Report 2005– 75 –
Notes to the Consolidated Financial StatementsMagna International Inc.[All amounts in U.S. dollars and all tabular amounts in millions, except per share figures, unless otherwise noted]
[j] The following tables indicate the significant items in the consolidated balance sheets that would have been affected had the consolidatedfinancial statements been prepared under U.S. GAAP:
2005In-house
Canadian tooling and Derivative U.S.GAAP engineering instruments Other GAAP
Other assets $ 326 $ — $ 21 $ — $ 347Other accrued liabilities $ 394 $ 60 $ — $ — $ 454Future tax liabilities, net $ 134 $ (11) $ 8 $ — $ 131Long-term debt $ 700 $ — $ — $ 4 $ 704
Shareholders' equity:Capital stock $ 2,470 $ — $ — $ 162 $ 2,632Contributed surplus 65 — — (1) 64Retained earnings 3,409 (48) (15) 96 3,442Accumulated other
comprehensive income 621 (1) 28 (261) 387Shareholders' equity $ 6,565 $ (49) $ 13 $ (4) $ 6,525
2004In-house
Canadian tooling and Derivative U.S.GAAP engineering instruments Other GAAP
Other assets $ 282 $ — $ (4) $ — $ 278Other accrued liabilities $ 350 $ 50 $ — $ — $ 400Future tax liabilities, net $ 55 $ (14) $ (1) $ — $ 40Long-term debt $ 984 $ — $ — $ — $ 984Minority interest $ 634 $ — $ — $ — $ 634
Shareholders' equity:Capital stock $1,610 $ — $ — $ 164 $ 1,774Contributed surplus 16 — — 3 19Retained earnings 2,937 (35) (15) 111 2,998Accumulated other
comprehensive income 772 (1) 12 (278) 505Shareholders' equity $ 5,335 $ (36) $ (3) $ — $ 5,296
[k] Variable Interest Entities
One of the Company's German subsidiaries has entered into an operating lease for a facility constructed at a cost of approximately$12 million. The lessor in this arrangement leased the assets from a partnership, that is substantially debt financed, which is owneddirectly and indirectly by the lessor. Although the Company's German subsidiary has options to acquire either the facility under leaseor the partnership, the Company's obligations under this arrangement are limited to those in its operating lease agreement.Although this arrangement qualifies as a variable interest entity, the Company has concluded that it is not the primary beneficiaryunder the agreement and has, therefore, not consolidated the entity.
[l] Under Staff Accounting Bulletin 74, the Company is required to disclose certain information related to new accounting standards whichhave not yet been adopted due to delayed effective dates.
Canadian GAAP Standards:
In January 2005, the CICA approved Handbook Sections 1530, "Comprehensive Income", 3855, "Financial Instruments –Recognition and Measurement", and 3865, "Hedges". The new standards are intended to harmonize Canadian GAAP with U.S. GAAP.The new standards are effective for Magna in the first quarter of 2007, but earlier adoption is permitted.
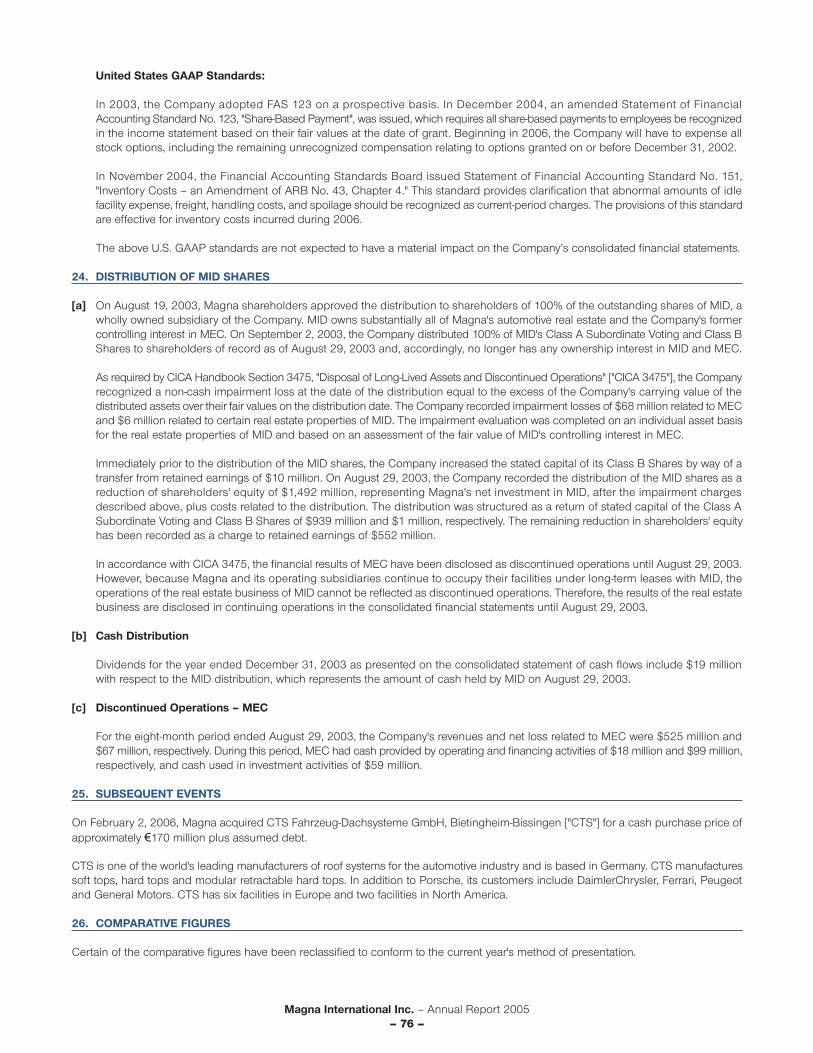
Magna International Inc. – Annual Report 2005– 76 –
United States GAAP Standards:
In 2003, the Company adopted FAS 123 on a prospective basis. In December 2004, an amended Statement of FinancialAccounting Standard No. 123, "Share-Based Payment", was issued, which requires all share-based payments to employees be recognizedin the income statement based on their fair values at the date of grant. Beginning in 2006, the Company will have to expense allstock options, including the remaining unrecognized compensation relating to options granted on or before December 31, 2002.
In November 2004, the Financial Accounting Standards Board issued Statement of Financial Accounting Standard No. 151,"Inventory Costs – an Amendment of ARB No. 43, Chapter 4." This standard provides clarification that abnormal amounts of idlefacility expense, freight, handling costs, and spoilage should be recognized as current-period charges. The provisions of this standardare effective for inventory costs incurred during 2006.
The above U.S. GAAP standards are not expected to have a material impact on the Company’s consolidated financial statements.
24. DISTRIBUTION OF MID SHARES
[a] On August 19, 2003, Magna shareholders approved the distribution to shareholders of 100% of the outstanding shares of MID, awholly owned subsidiary of the Company. MID owns substantially all of Magna's automotive real estate and the Company's formercontrolling interest in MEC. On September 2, 2003, the Company distributed 100% of MID's Class A Subordinate Voting and Class BShares to shareholders of record as of August 29, 2003 and, accordingly, no longer has any ownership interest in MID and MEC.
As required by CICA Handbook Section 3475, "Disposal of Long-Lived Assets and Discontinued Operations" ["CICA 3475"], the Companyrecognized a non-cash impairment loss at the date of the distribution equal to the excess of the Company's carrying value of thedistributed assets over their fair values on the distribution date. The Company recorded impairment losses of $68 million related to MECand $6 million related to certain real estate properties of MID. The impairment evaluation was completed on an individual asset basisfor the real estate properties of MID and based on an assessment of the fair value of MID's controlling interest in MEC.
Immediately prior to the distribution of the MID shares, the Company increased the stated capital of its Class B Shares by way of atransfer from retained earnings of $10 million. On August 29, 2003, the Company recorded the distribution of the MID shares as areduction of shareholders' equity of $1,492 million, representing Magna's net investment in MID, after the impairment chargesdescribed above, plus costs related to the distribution. The distribution was structured as a return of stated capital of the Class ASubordinate Voting and Class B Shares of $939 million and $1 million, respectively. The remaining reduction in shareholders' equityhas been recorded as a charge to retained earnings of $552 million.
In accordance with CICA 3475, the financial results of MEC have been disclosed as discontinued operations until August 29, 2003.However, because Magna and its operating subsidiaries continue to occupy their facilities under long-term leases with MID, theoperations of the real estate business of MID cannot be reflected as discontinued operations. Therefore, the results of the real estatebusiness are disclosed in continuing operations in the consolidated financial statements until August 29, 2003.
[b] Cash Distribution
Dividends for the year ended December 31, 2003 as presented on the consolidated statement of cash flows include $19 millionwith respect to the MID distribution, which represents the amount of cash held by MID on August 29, 2003.
[c] Discontinued Operations – MEC
For the eight-month period ended August 29, 2003, the Company's revenues and net loss related to MEC were $525 million and$67 million, respectively. During this period, MEC had cash provided by operating and financing activities of $18 million and $99 million,respectively, and cash used in investment activities of $59 million.
25. SUBSEQUENT EVENTS
On February 2, 2006, Magna acquired CTS Fahrzeug-Dachsysteme GmbH, Bietingheim-Bissingen ["CTS"] for a cash purchase price ofapproximately €170 million plus assumed debt.
CTS is one of the world's leading manufacturers of roof systems for the automotive industry and is based in Germany. CTS manufacturessoft tops, hard tops and modular retractable hard tops. In addition to Porsche, its customers include DaimlerChrysler, Ferrari, Peugeotand General Motors. CTS has six facilities in Europe and two facilities in North America.
26. COMPARATIVE FIGURES
Certain of the comparative figures have been reclassified to conform to the current year's method of presentation.
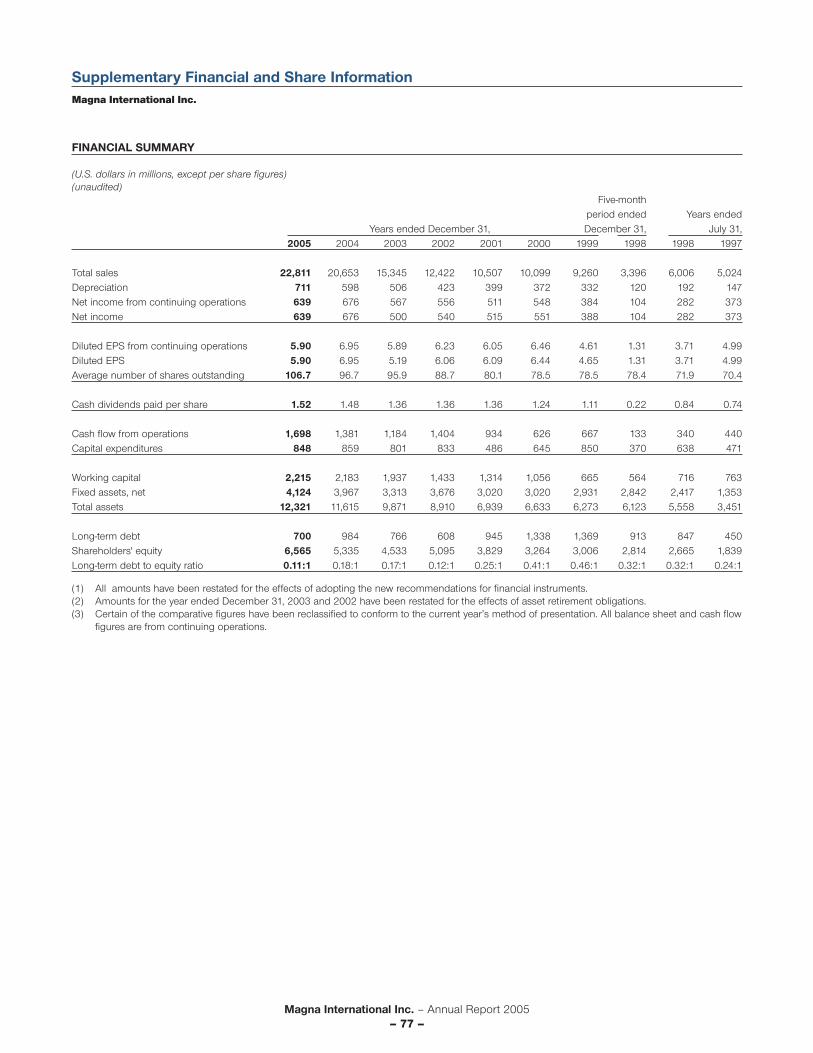
Magna International Inc. – Annual Report 2005– 77 –
Supplementary Financial and Share InformationMagna International Inc.
FINANCIAL SUMMARY
(U.S. dollars in millions, except per share figures)(unaudited)
Five-monthperiod ended Years ended
Years ended December 31, December 31, July 31,2005 2004 2003 2002 2001 2000 1999 1998 1998 1997
Total sales 22,811 20,653 15,345 12,422 10,507 10,099 9,260 3,396 6,006 5,024 Depreciation 711 598 506 423 399 372 332 120 192 147 Net income from continuing operations 639 676 567 556 511 548 384 104 282 373 Net income 639 676 500 540 515 551 388 104 282 373
Diluted EPS from continuing operations 5.90 6.95 5.89 6.23 6.05 6.46 4.61 1.31 3.71 4.99 Diluted EPS 5.90 6.95 5.19 6.06 6.09 6.44 4.65 1.31 3.71 4.99 Average number of shares outstanding 106.7 96.7 95.9 88.7 80.1 78.5 78.5 78.4 71.9 70.4
Cash dividends paid per share 1.52 1.48 1.36 1.36 1.36 1.24 1.11 0.22 0.84 0.74
Cash flow from operations 1,698 1,381 1,184 1,404 934 626 667 133 340 440 Capital expenditures 848 859 801 833 486 645 850 370 638 471
Working capital 2,215 2,183 1,937 1,433 1,314 1,056 665 564 716 763 Fixed assets, net 4,124 3,967 3,313 3,676 3,020 3,020 2,931 2,842 2,417 1,353 Total assets 12,321 11,615 9,871 8,910 6,939 6,633 6,273 6,123 5,558 3,451
Long-term debt 700 984 766 608 945 1,338 1,369 913 847 450 Shareholders' equity 6,565 5,335 4,533 5,095 3,829 3,264 3,006 2,814 2,665 1,839 Long-term debt to equity ratio 0.11:1 0.18:1 0.17:1 0.12:1 0.25:1 0.41:1 0.46:1 0.32:1 0.32:1 0.24:1
(1) All amounts have been restated for the effects of adopting the new recommendations for financial instruments.(2) Amounts for the year ended December 31, 2003 and 2002 have been restated for the effects of asset retirement obligations.(3) Certain of the comparative figures have been reclassified to conform to the current year’s method of presentation. All balance sheet and cash flow
figures are from continuing operations.
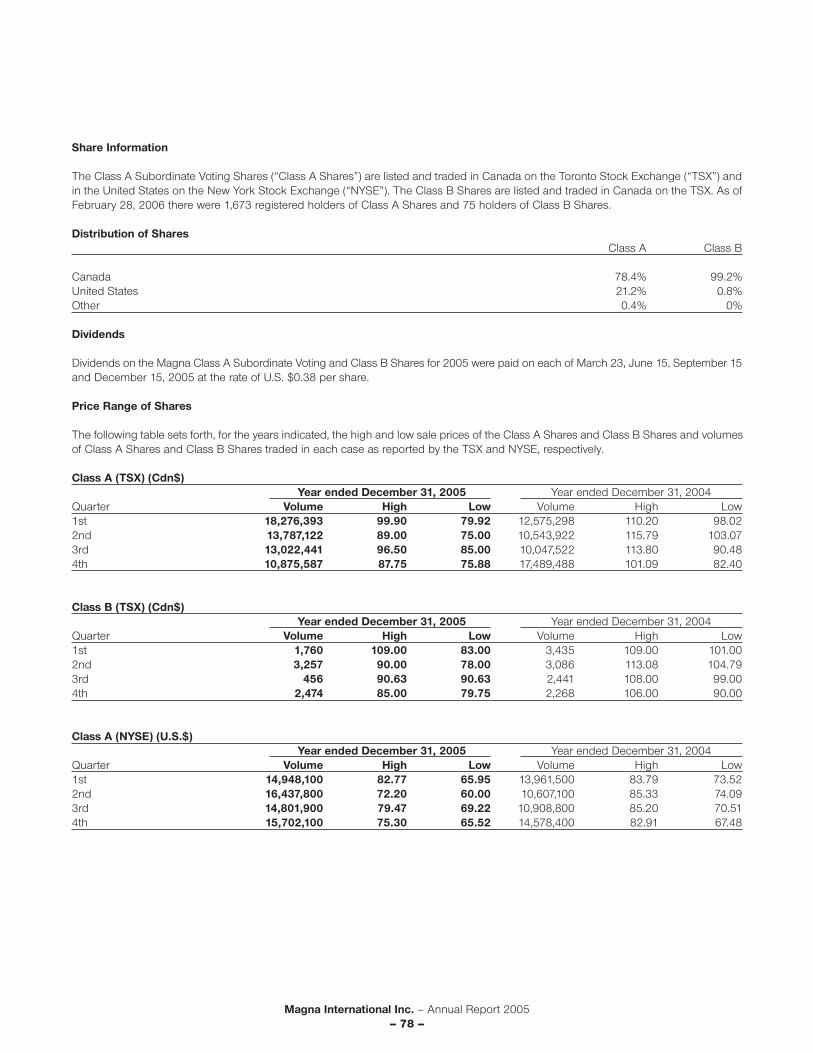
Magna International Inc. – Annual Report 2005– 78 –
Share Information
The Class A Subordinate Voting Shares (“Class A Shares”) are listed and traded in Canada on the Toronto Stock Exchange (“TSX”) andin the United States on the New York Stock Exchange (“NYSE”). The Class B Shares are listed and traded in Canada on the TSX. As ofFebruary 28, 2006 there were 1,673 registered holders of Class A Shares and 75 holders of Class B Shares.
Distribution of SharesClass A Class B
Canada 78.4% 99.2%United States 21.2% 0.8%Other 0.4% 0%
Dividends
Dividends on the Magna Class A Subordinate Voting and Class B Shares for 2005 were paid on each of March 23, June 15, September 15and December 15, 2005 at the rate of U.S. $0.38 per share.
Price Range of Shares
The following table sets forth, for the years indicated, the high and low sale prices of the Class A Shares and Class B Shares and volumesof Class A Shares and Class B Shares traded in each case as reported by the TSX and NYSE, respectively.
Class A (TSX) (Cdn$)Year ended December 31, 2005 Year ended December 31, 2004
Quarter Volume High Low Volume High Low1st 18,276,393 99.90 79.92 12,575,298 110.20 98.022nd 13,787,122 89.00 75.00 10,543,922 115.79 103.073rd 13,022,441 96.50 85.00 10,047,522 113.80 90.484th 10,875,587 87.75 75.88 17,489,488 101.09 82.40
Class B (TSX) (Cdn$)Year ended December 31, 2005 Year ended December 31, 2004
Quarter Volume High Low Volume High Low1st 1,760 109.00 83.00 3,435 109.00 101.002nd 3,257 90.00 78.00 3,086 113.08 104.793rd 456 90.63 90.63 2,441 108.00 99.004th 2,474 85.00 79.75 2,268 106.00 90.00
Class A (NYSE) (U.S.$)Year ended December 31, 2005 Year ended December 31, 2004
Quarter Volume High Low Volume High Low1st 14,948,100 82.77 65.95 13,961,500 83.79 73.522nd 16,437,800 72.20 60.00 10,607,100 85.33 74.093rd 14,801,900 79.47 69.22 10,908,800 85.20 70.514th 15,702,100 75.30 65.52 14,578,400 82.91 67.48

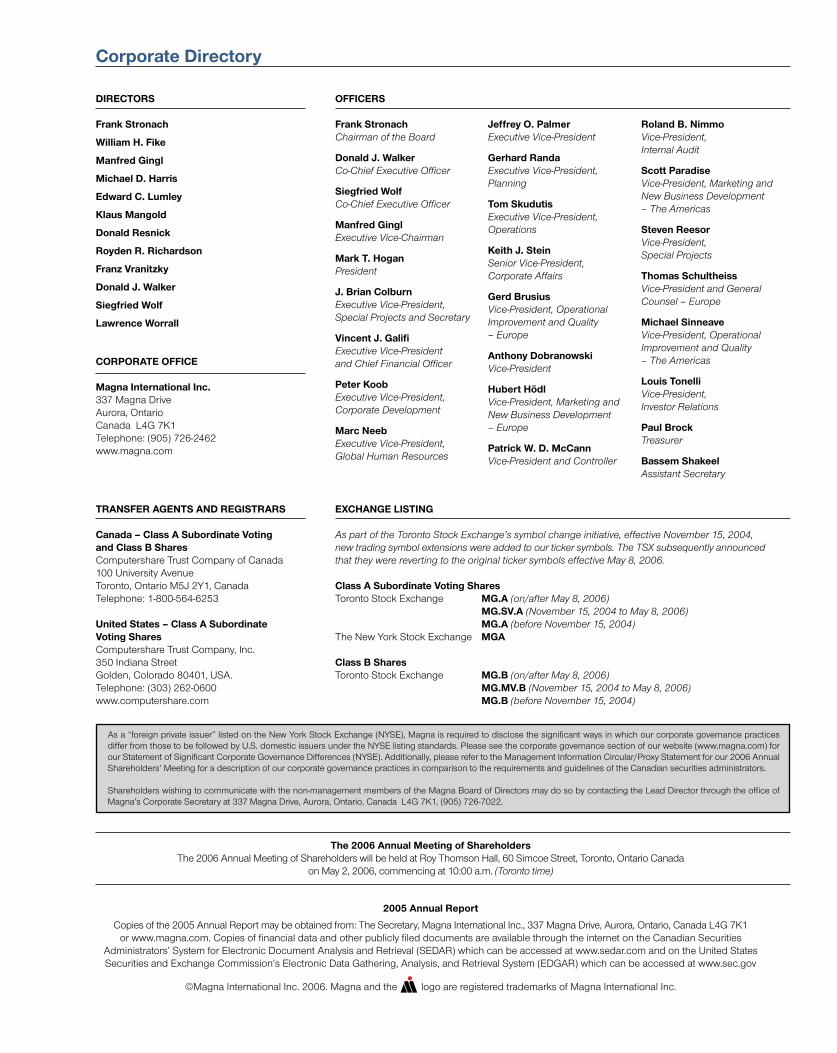
MetalBody&ChassisSystemsCosma International
•ChassisSystems•Metalforming Technologies•BodySystems•Body-in-white•Finishing
PlasticBody,Lighting&ExteriorTrimSystemsDecoma International
•Front&RearBumper Systems•GreenhouseSystems•LightingSystems•SealingSystems•VehicleEnhancement Packages•BodySidePanels•PolymericGlazing Systems
MirrorSystemsMagna Donnelly
•InteriorMirrors•ExteriorMirrors•EngineeredGlass
SeatingSystemsIntier Automotive Seating
•ModularSeatAssemblies•StowableSeating•HeadRestraints &Armrests•SeatingHardwareSystems
Powertrain&DrivetrainSystemsMagna Powertrain
•DrivetrainSystems& Componentswith SpecialCompetencein 4WD/AWD•Axles&Chassis Modules•EngineSystems& Modules•TransmissionSystems& Modules
ClosureSystemsMagna Closures
•DoorModules•WindowSystems•DriverControls•PowerClosureSystems•LatchingSystems•HandleAssemblies
CompleteVehicleEngineering&AssemblyMagna Steyr
•VehicleEngineering•VehicleAssembly•Components,Modules& TankSystems
ElectronicSystemsMagna Electronics
•PowerSystems•DriverAssistance& Safety•BodyElectronics•WirelessSystems
InteriorSystemsIntier Automotive Interiors
•CompleteInterior Integration•Sidewall&TrimSystems•CockpitSystems•CargoManagement Systems•OverheadSystems•FloorCarpet&Complete VehicleAcousticSystems
Magna’sproductcapabilitiesinclude:
North America:Canada UnitedStates Mexico
Magna’sGlobalLocations
2005AnnualReport
Copiesofthe2005AnnualReportmaybeobtainedfrom:TheSecretary,MagnaInternationalInc.,337MagnaDrive,Aurora,Ontario,CanadaL4G7K1orwww.magna.com.CopiesoffinancialdataandotherpubliclyfileddocumentsareavailablethroughtheinternetontheCanadianSecurities
Administrators’SystemforElectronicDocumentAnalysisandRetrieval(SEDAR)whichcanbeaccessedatwww.sedar.comandontheUnitedStatesSecuritiesandExchangeCommission’sElectronicDataGathering,Analysis,andRetrievalSystem(EDGAR)whichcanbeaccessedatwww.sec.gov
©MagnaInternationalInc.2006.MagnaandthelogoareregisteredtrademarksofMagnaInternationalInc.
DaimlerChrysler – 25%
Other – 5%
Other OEM – 7%
Volkswagen – 6%
Europe – 28,650
Ford – 15%
BMW – 18%
General Motors – 24%
Asia Pacific – 2,500
South America – 600
Mexico – 10,800
United States – 18,050
Canada – 22,200
GlobalAutomotiveSalesbyCustomer
TotalNumberofEmployees
OperatingPrinciples
Magna’s entrepreneurial corporate culture, highlighted in the principles shown here, is the reason for Magna’s success and our greatest competitive advantage.
DecentralizedOperatingStructureMagna’smanufacturingdivisionsoperateasindependentprofitcentresalignedbygeographicregionineachofourproductareas.ThisdecentralizedstructurepreventsbureaucracyandmakesMagnamoreresponsivetocustomerneedsandchangeswithintheglobalautomotiveindustryaswellaswithinspecificregions.
EmployeeInvolvementBykeepingoperatingunitsrelativelysmallandflexible,Magnafostersgreateremployeeinvolvementandinitiative.ThisenvironmentalsoallowsMagnatorecognizeandrewardindividuals’contributionsandmaintainopencommunication.
EntrepreneurialManagersEntrepreneurial,hands-onmanagerswithstrongtooling,engineeringandmanufacturingbackgroundsrunMagna’sdivisions.Divisionmanagersareresponsibleforensuringprofitability,achievingcustomersatisfactionandupholdingtheprinciplesoftheMagnaEmployee’sCharter.
EmployeeProfitSharingandOwnershipThroughtheEquityParticipationandProfitSharingProgram,employeesreceivetenpercentofMagna’squalifyingannualprofitsbeforetax.Aspart-ownersworkinginanenvironmentwhereproductivityisrewarded,Magnaemployeesaremotivatedtoproducequalityproductsatcompetitiveprices.
The2006AnnualMeetingofShareholdersThe2006AnnualMeetingofShareholderswillbeheldatRoyThomsonHall,60SimcoeStreet,Toronto,OntarioCanada
onMay2,2006,commencingat10:00a.m.(Toronto time)
RoofSystemsMagna Car Top Systems
•Soft-Tops•Hard-Tops•RetractableHard-Tops•RoofModules
South America:Brazil
Europe:Austria Belgium CzechRepublic England France Germany Hungary Ireland Italy Poland SlovakRepublic Spain Sweden Turkey
Asia:China India Japan Korea
ManufacturingOperations:224ProductDevelopmentandEngineeringCentres:60
61 8
52 19
13
2
16 5
3
4 1
14 3
4 4
30 11
1
3
2
4
1
4
1
1
7 4
1
1
3 1
CorporateDirectory
DIRECTORS
FrankStronach
WilliamH.Fike
ManfredGingl
MichaelD.Harris
EdwardC.Lumley
KlausMangold
DonaldResnick
RoydenR.Richardson
FranzVranitzky
DonaldJ.Walker
SiegfriedWolf
LawrenceWorrall
CORPORATEOFFICE
MagnaInternationalInc.337MagnaDriveAurora,OntarioCanadaL4G7K1Telephone:(905)726-2462www.magna.com
OFFICERS
FrankStronachChairman of the Board
DonaldJ.WalkerCo-Chief Executive Officer
SiegfriedWolfCo-Chief Executive Officer
ManfredGinglExecutive Vice-Chairman
MarkT.HoganPresident
J.BrianColburnExecutive Vice-President,Special Projects and Secretary
VincentJ.GalifiExecutive Vice-Presidentand Chief Financial Officer
PeterKoobExecutive Vice-President,Corporate Development
MarcNeebExecutive Vice-President,Global Human Resources
JeffreyO.PalmerExecutive Vice-President
GerhardRandaExecutive Vice-President,Planning
TomSkudutisExecutive Vice-President,Operations
KeithJ.SteinSenior Vice-President,Corporate Affairs
GerdBrusiusVice-President, Operational Improvement and Quality – Europe
AnthonyDobranowskiVice-President
HubertHödlVice-President, Marketing and New Business Development – Europe
PatrickW.D.McCannVice-President and Controller
Asa“foreignprivateissuer”listedontheNewYorkStockExchange(NYSE),MagnaisrequiredtodisclosethesignificantwaysinwhichourcorporategovernancepracticesdifferfromthosetobefollowedbyU.S.domesticissuersundertheNYSElistingstandards.Pleaseseethecorporategovernancesectionofourwebsite(www.magna.com)forourStatementofSignificantCorporateGovernanceDifferences(NYSE).Additionally,pleaserefertotheManagementInformationCircular/ProxyStatementforour2006AnnualShareholders’MeetingforadescriptionofourcorporategovernancepracticesincomparisontotherequirementsandguidelinesoftheCanadiansecuritiesadministrators.
Shareholderswishingtocommunicatewiththenon-managementmembersoftheMagnaBoardofDirectorsmaydosobycontactingtheLeadDirectorthroughtheofficeofMagna’sCorporateSecretaryat337MagnaDrive,Aurora,Ontario,CanadaL4G7K1,(905)726-7022.
RolandB.NimmoVice-President,Internal Audit
ScottParadiseVice-President, Marketing and New Business Development– The Americas
StevenReesorVice-President,Special Projects
ThomasSchultheissVice-President and General Counsel – Europe
MichaelSinneaveVice-President, Operational Improvement and Quality– The Americas
LouisTonelliVice-President,Investor Relations
PaulBrockTreasurer
BassemShakeelAssistant Secretary
TRANSFERAGENTSANDREGISTRARS
Canada–ClassASubordinateVotingandClassBSharesComputershareTrustCompanyofCanada100UniversityAvenueToronto,OntarioM5J2Y1,CanadaTelephone:1-800-564-6253
UnitedStates–ClassASubordinateVotingSharesComputershareTrustCompany,Inc.350IndianaStreetGolden,Colorado80401,USA.Telephone:(303)262-0600www.computershare.com
EXCHANGELISTING
As part of the Toronto Stock Exchange’s symbol change initiative, effective November 15, 2004, new trading symbol extensions were added to our ticker symbols. The TSX subsequently announced that they were reverting to the original ticker symbols effective May 8, 2006.
ClassASubordinateVotingSharesTorontoStockExchange MG.A (on/after May 8, 2006) MG.SV.A(November 15, 2004 to May 8, 2006) MG.A(before November 15, 2004)TheNewYorkStockExchange MGA
ClassBSharesTorontoStockExchange MG.B(on/after May 8, 2006) MG.MV.B(November 15, 2004 to May 8, 2006) MG.B(before November 15, 2004)
On
e C
om
pa
ny. O
ne V
oic
e. O
ne V
isio
n.
Outside Front Cover
MagnaInternationalInc.
337MagnaDrive Aurora,Ontario CanadaL4G7K1
Telephone:(905)726-2462 Fax:(905)726-7164
Visitourwebsiteat: www.magna.com
PrintedinCanada
Magna International Inc. is a leading global supplier of technologically advanced automotive components, systems and modules.
The Company employs over 82,000 people and operates 224 manufacturing operations and 60 product development and engineering centres in 22 countries.
As the most diversified automotive supplier in the world, Magna manufactures a complete range of automotive systems and providesdesign, engineering, testing, assembly and program management services to its customers, the world’s major automotive OriginalEquipment Manufacturers (OEMs).
Magna’s product capabilities span a number of major automotive areas, including:• interior systems• seating systems• closure systems• metal body & chassis systems• mirror systems• electronic systems• plastic body, lighting & exterior trim systems• powertrain & drivetrain systems• roof systems• complete vehicle engineering & assembly
Financial Highlights – 2005
Sales(U.S.$ Billions)
25
20
15
10
5
05040302010099989796
1500
1200
900
600
300
Operating Income(U.S.$ Millions)
800
600
400
200
Net Income from Continuing Operations(U.S.$ Millions)
Diluted Earnings Per Sharefrom Continuing Operations(U.S.$)
05040302
05040302
8.00
6.00
4.00
2.00
05040302
2 0 0 5 A N N U A L R E P O R T