financial inclusion, active bank accounts and poverty
TRANSCRIPT

ERIA-DP-2020-18
ERIA Discussion Paper Series
No. 345
Financial Inclusion, Active Bank Accounts and
Poverty Reduction in India
Tony CAVOLI
Ilke ONUR
University of South Australia, Australia
Patricia SOURDIN
University of Adelaide, Australia
September 2020
Abstract: Using the World Bank’s Global Findex data, this research first
shows that the efforts by the Indian Government and the Reserve Bank have
been successful in providing access to formal banking services, especially in
the rural areas of the country. Similarly, financial account ownership gap has
been eliminated in terms of gender and income. Further analysis, using the
Financial Inclusion Insights dataset, shows that financial inclusion has a
positive and significant effect on reducing poverty in India. A closer look at
the utilisation of the financial accounts shows that active usage of these
accounts would lead to further reductions in poverty levels in India. Therefore,
targeted programmes, such as offering financial education both in and outside
schools, with the aim of improving financial literacy, could lead to further
poverty reduction in India.
Keywords: Financial inclusion, poverty, India
JEL Classifications: G20, I32, O16

1
1. Introduction
Financial inclusion is defined as having access to useful and affordable
financial products and services, delivered in a responsible and sustainable way
(World Bank, 2020). There have been multiple studies showing access to financial
services promoting growth, especially for developing countries. Similarly, there is
a growing body of literature showing the positive role of financial inclusion on
improving household wellbeing and economic growth. For example, Burgess and
Pande (2005), Beck et al. (2007), and Bruhn and Love (2014) show that greater
access to finance reduces income inequality and poverty. Similar positive effects
on a myriad of outcome measures have also been presented in the literature.1
However, the number of studies linking financial inclusion and reduction in
poverty levels in a country are limited (Chibba, 2009; Jalilian and Kirkpatrick,
2005; Churchill and Marisetty, 2019).2
The focus of this paper is financial inclusion and reducing poverty for India.
To this end, we make use of a unique set of household-level data comprising more
than 47,000 observations across India. India is an important case study, not just
because of the size of the economy, but also because of the targeted efforts of the
Reserve Bank of India (RBI) and the Government of India (GOI). Financial
inclusion was in the RBI’s 2005–6 annual policy statement, and, in 2010, RBI
required both private and public banks to submit a 3-year financial inclusion plan
(Menon, 2019). Furthermore, in August 2014, the Pradhan Mantri Jan Dhan
Yojana (PMJDY) campaign was implemented with the aim of ensuring
households have access to basic bank accounts, as well as combatting black
money in the economy and making banking facilities (savings and deposit
accounts, remittances, credit, insurance and pension) available to the unbanked,
especially by offering zero-balance accounts. More recently, in 2015, the Jan
Dhan-Aadhar-Mobile (JAM) was introduced with the aim of integrating PMJDY
with a biometric ID initiative and mobile technology.
1 See Allen et al. (2016) for an increase in savings, Prasad (2010) for employment, Mani et al.
(2013) for better decision-making, and Angelucci, Karlan, and Zinman (2013) for
improvements in mental wellbeing. 2 In a recent study, Neaime and Gaysset (2018) show that. while financial inclusion decreases income inequality, it has no significant effect on poverty in Middle East and North Africa
(MENA) countries.

2
In 2017, the GOI launched Cashless India, promoting cashless payment
modes (banking cards, mobile wallets, digital banking, etc.). In addition to these
targeted and direct efforts, financial inclusion in India benefitted from an indirect
push through the deposit payments to bank accounts for the Mahatma Gandhi
National Rural Employment Guarantee scheme and the demonetisation
programme that took place on 9 November 2016. These initiatives have helped to
grow financial inclusion in India and encourage previously underbanked
populations, such as women, rural and below-poverty-line individuals, to access
formal financial institutions.
As a result of all these efforts by the RBI and the GOI, many of the
disparities between previously unbanked populations have been reduced. Most
Indians now own a bank account and have access to banking services. Our aim is
to study the effect of this increase in financial inclusion on poverty alleviation in
India. A few studies have previously focussed on this question before, but from a
range of different perspectives. Burgess and Pande (2005), for example, asked the
same question using state-level panel data. More specifically, the authors studied
the effect of rural bank branch expansion and showed that it helped with poverty
reduction in rural India. They observed no significant effect on urban poverty.
More recently, again using panel data for Indian states and union territories, Inoue
(2019) utilised the numbers of bank branches and accounts (financial inclusion
and financial deepening) to show the positive impact on poverty reduction.
However, this effect is present only for public sector banks. Other studies using
country, state, or district-level data to analyse similar research questions are
Binswanger and Khandker (1995), Bell and Rousseau (2001), and Sehrawat and
Giri (2016).
Only a few studies use micro-level data to focus on the poverty-reducing
effect of financial inclusion in India. Using household survey data, Swamy (2014)
focuses on gender differences, while analysing the impact of financial inclusion
programmes on income, expenditure, and food security. Ghosh and Vinod (2017)
also emphasise the importance of gender, showing significant differences in both
access to formal (and informal) finance, as well as the use of finance. Lastly, a
recent study by Churchill and Marisetty (2019) is closest to this paper in terms of

3
the data and the analysis. The authors make use of an earlier wave of the Financial
Inclusion Insights (FII) survey (that will be utilised in this paper) and construct a
multidimensional indicator of financial inclusion to examine the effects of
financial inclusion on poverty. Their findings show a strong poverty-reduction
effect of financial inclusion in India. Moreover, similar to our paper, the authors
utilise instrumental variable techniques to correct for potential endogeneity bias in
the regressions. Our paper, however, uses the most recent wave of the FII survey
and introduces new (and arguably better) variables to be used as exclusion
restrictions. Methodologically, we also add to the current literature by using a
two-stage residual inclusion technique, which has been mostly utilised in the
health economics literature so far. Lastly, in addition to the standard financial
inclusion variables, we also focus on the active usage of bank accounts, due to the
existence of many dormant bank accounts in India.
Our results show a considerable poverty-reduction effect of financial
inclusion, as well as the active use of bank accounts. However, the effect is
statistically significant only after the endogeneity is controlled for. As a result,
one of the major implications of this paper is the need for a careful empirical
analysis before any policy decisions can be made. The real effect of financial
inclusion on poverty could be masked by the bias due to endogeneity of the
variable of interest.
The rest of the paper is structured as follows. The next section provides an
initial look at financial inclusion in India using multiple waves of the World
Bank’s Global Findex database. Section 3 introduces the data and the empirical
model, and section 4 presents the empirical results. In section 5, we provide
concluding remarks and possible policy implications.

4
2. A First Look at Financial Inclusion in India
We first use the World Bank’s Global Findex database to see how the
concerted efforts in India have impacted financial inclusion.3 We focus on three
main indicators of financial inclusion: account ownership (formal account);
savings in a formal financial institution (formal savings); and bank credit usage
(formal credit). In Figure 1, we observe a significant increase in the percentage of
formal accounts held from 35% in 2011 to 80% in 2017 when all adults (aged 15
years or older) are considered. Similar success can be observed in closing the
gender gap for account ownership. In 2017, we see no significant gender
differences amongst Indian adults. We can observe whether access translates to
the usage of these formal accounts for saving or borrowing. Figures 9.2 and 9.3
show the formal saving and credit behaviour for the same period and again for
males and females. We observe a modest increase in the saving behaviour from
12% in 2011 to 20% in 2017. The gender gap, although narrowed, has not been
eliminated, unlike the trend we have seen in account ownership. Formal credit
percentages, on the other hand, had a slight decline over the same period. In 2011,
8% of Indian adults were accessing formal credit while the same number in 2017
was 7%. Moreover, the gender gap in formal credit has widened over time. In
short, we see a considerable success in access (account ownership); however, this
did not clearly translate into usage (formal saving and credit).
3 We use three waves of the Global Findex database (World Bank 2011; 2014; 2017).

5
Figure 1. Formal Account Ownership in India
Source: World Bank Global Findex data 2011–2017.
Figure 2. Formal Savings in India
Source: World Bank Global Findex data, 2011–2017.
0,0
20,0
40,0
60,0
80,0
100,0
2011 2014 2017
% a
ge 1
5+
Formal Account Ownership
Financial institution account (% age 15+)
Financial institution account, female (% age 15+)
Financial institution account, male (% age 15+)
0,0
5,0
10,0
15,0
20,0
25,0
2011 2014 2017
% a
ge 1
5+
Formal Savings
Saved at a financial institution (% age 15+)
Saved at a financial institution, female (% age 15+)
Saved at a financial institution, male (% age 15+)

6
Figure 3. Formal Credit in India
Source: World Bank Global Findex data 2011–2017.
Further success of India’s financial inclusion policies on account ownership
can be observed in Figure 4. Focusing on the 2017 data, we see no significant
difference in terms of age, education, income, being in or out of the labour force,
and also no rural versus urban divide. Compared to other countries such as
Pakistan and Bangladesh, these figures highlight the importance of the targeted
efforts by the RBI and the GOI to address these gaps explicitly. For example, in
both of those countries, there is still a wide account ownership gap in terms of
gender, income, and being in the labour force. It would appear, at least casually,
that the policy objectives of the RBI and GOI have resulted in clear increases in
bank account ownership.
0,0
2,0
4,0
6,0
8,0
10,0
2011 2014 2017
% a
ge 1
5+
Formal Credit
Borrowed from a financial institution (% age 15+)
Borrowed from a financial institution, female (% age 15+)
Borrowed from a financial institution, male (% age 15+)

7
Figure 4. Account Ownership in India for Various Sub-Groups of the
Population
Source: World Bank Global Findex data 2011–2017.
3. Data and Empirical Model
According to the World Bank, ‘financial inclusion is a key enabler to
reducing poverty and boosting prosperity.’ It has also been shown in academic
studies that financial inclusion has been found to reduce rural poverty (Burgess
and Pande, 2005; Swamy, 2014).4 While we observe the success of financial
inclusion, at least in terms of account ownership, in India, the lack of active usage
of these accounts remains a concern. More recent data show 15% of the accounts
having a zero balance and 84% only being ‘operative’, with at least one
transaction in the last 2 years (Abraham, 2019). Our study thus scrutinises
whether basic financial inclusion, defined as account ownership, can alleviate
poverty in India. Consequently, we consider the active users of these accounts,
and see if usage is associated with households’ propensity to be above the poverty
level in India. In order to answer these questions, we make use of the FII survey
database, which is more detailed and more frequently available compared to the
World Bank Global Findex database.
4 For a summary of empirical studies on financial inclusion and growth see Demirguc-Kunt et al.
(2017).
0%10%20%30%40%50%60%70%80%90%
2011 2014 2017

8
We use the fifth wave of the FII surveys, which were collected in 2017.5
The survey started in August 2017 and ended in December 2017. The data were
gathered from a nationally representative sample of adults aged 15 and older.6 The
survey includes information on ownership and usage of banks, other financial
institutions and mobile phones as well as mobile financial services. Financial
behaviours, poverty indicators and socio-demographics, amongst other
information, are also included in the dataset. The 2017 FII survey was carried out
on 47,132 adults. For the purpose of our study, after dropping the observations
with missing information, the final sample includes 44,990 individuals.7
The main model for estimating the relationship between financial inclusion
and poverty is the following:
𝑃𝑜𝑣𝑒𝑟𝑡𝑦𝑖 = 𝛼𝐹𝐼𝑖 + 𝛽𝑋𝑖 + 𝛿𝑖 + 휀𝑖 (9.1)
where 𝑃𝑜𝑣𝑒𝑟𝑡𝑦𝑖 is the main outcome variable, which is the measure of poverty
for household i. As we discuss in detail below, we make use of two distinct
versions of the outcome variable. 𝐹𝐼𝑖 is the financial inclusion variable, which we
measure in three different ways, as specified below. 𝑋𝑖 represents all the control
variables in our analysis, including gender, age, location (rural or urban), marital
status, number of people in the household, literacy, education, ownership of
farmland, employment status and religion. 𝛿𝑖 is the state-level dummy variable
controlling for unobserved heterogeneity amongst the various states in India.
Finally, 휀𝑖 is the error term, which we assume to be normally distributed.
We make use of two different measures of poverty in our analysis. First, we
consider the Poverty Probability Index (PPI), which is already available in our
dataset. PPI is a continuous measure of poverty that provides a score for each
household depending on the household characteristics and asset ownership. This
5 The data are available at: http://finclusion.org/. 6 Sampling weights for the data are based on the probability of selection at each stage of sampling.
They are then adjusted for non-response at the household and household member levels. The
sampling weights are also normalised at the national level. 7 Note that in one part of our analysis we focus only on those respondents with a bank account. In
this part of our study, our sample is reduced to 35,671 respondents.

9
score determines the likelihood of the household living below the poverty line.8 In
our dataset, the poverty line is set by the FII survey at US$2.50 per day. The PPI
score ranges between 0 and 100, with 0 representing the most likely poor
household and 100 with the least likely one.9 Second, we make use of a dummy
variable, Poor, to represent a household living in poverty or not. This variable
takes the value 1 if the household lives below the poverty line of $2.50 per day,
and 0 otherwise.
For the financial inclusion (FI) variable in our regression, we make use of
three different measures. This first one is the financial inclusion measure
introduced in the FII dataset. Financially included are those who have an account
in their name with a full-service institution.10 Our second variable is a basic one.
We use bank account ownership as a measure. It is a dummy variable that is equal
to 1 if the respondent has a bank account under their name, and 0 otherwise. The
last measure we consider is active bank account. Amongst those with a bank
account, we identify the active ones as those who have used their bank account at
least once in the previous 3 months. With this measure, we would like to see
whether actively using the bank account, compared to having an unused one,
matters for poverty alleviation.
Table 1 presents the summary statistics for all the variables in our study.11
More than 60% of the households in our sample are classified as poor, while 78%
are financially included. As mentioned before, due to the concerted efforts of the
GOI, there is no gap in terms of financial inclusion between the poor and non-
poor households. Bank account ownership average is very close to financial
inclusion one since most of these efforts were focused on giving bank accounts
and extending bank branches to rural areas of India. However, amongst those with
a bank account, only 68% use their account actively. The majority of the
households in our sample are in rural areas, with an average of four people in the
household. Most of the respondents are married. While 32% do not have any
8 For further details on PPI, see https://www.povertyindex.org/. 9 In our analysis, we rescale the PPI variable such that it is between 0 and 1. 10 FII considers an institution to be a full-service financial institution if it offers the following
services: savings, credit, money transfers, insurance, and investment. According to the FII survey,
these institutions are banks, mobile money service providers, and non-bank financial institutions,
such as payments banks. 11 Detailed definitions of these variables are presented the Appendix.

10
formal education and 14% have less than 6 years of schooling, 72% of the
respondents are literate. In terms of employment, almost half of the respondents
are not working, with only 23% having a full-time job. Forty percent of
households own farmland and majority of the respondents are Hindus, followed
by 11% of the respondents being Muslim.
The last four variables in Table 1 are used as instrumental variables in our
regression analysis. Twenty-two percent of the respondents are financially literate,
and 9% belong to an informal financial institution. While 8% actively use a
mobile phone, only 2% have an active mobile money account. These figures are
low compared to some other countries, especially those in Africa, where mobile
money services are highly prevalent.
Table 1. Summary Statistics
Variables Mean Std. Dev. Min Max
Poverty Probability Index 0.51 0.22 0 1
Poor 0.61 0.49 0 1
Financial inclusion 0.78 0.41 0 1
Bank account ownership 0.76 0.43 0 1
Active bank accounta 0.68 0.47 0 1
Male 0.52 0.5 0 1
Age:
Age 15–24 0.21 0.41 0 1
Age 25–34 0.26 0.44 0 1
Age 35–44 0.21 0.41 0 1
Age 45–54 0.15 0.35 0 1
Age 55 and over 0.17 0.38 0 1
Rural 0.68 0.46 0 1
Married 0.73 0.44 0 1
Number of People 3.97 1.75 1 8
Education level:
No education 0.32 0.47 0 1
Less than six 0.14 0.35 0 1
Six to 12 0.45 0.5 0 1
More than 12 0.09 0.29 0 1
Literate 0.72 0.45 0 1
Farmland 0.4 0.49 0 1
Employment:
Full-time employed 0.23 0.42 0 1
Part-time employed 0.08 0.26 0 1
Self-employed 0.06 0.24 0 1
Occasionally employed 0.16 0.25 0 1
Not working 0.47 0.50 0 1
Religion:
Hinduism 0.85 0.36 0 1
Islam 0.11 0.32 0 1

11
Christianity 0.02 0.12 0 1
Sikhism 0.01 0.12 0 1
Buddhism 0.003 0.05 0 1
Household head 0.39 0.49 0 1
Financial literacy 0.22 0.41 0 1
Active phone 0.08 0.26 0 1
Active mobile money 0.02 0.14 0 1
Belong to informal financial
institutionb 0.09 0.29 0 1
Num. of Obs. 47,132 Note: All summary statistics have been weighted using the sampling weights provided in the 2017
Financial Inclusion Insights Survey – Wave 5. a Summary statistics for the active bank account
variable are based on a sub-sample of those with a bank account (n=37,165). b Summary statistics
for the informal financial institution variable are based on a reduced sample size due to missing
values (n=39,400).
Source: Authors’ calculations using data from The Financial Inclusion Insights Program,
InterMedia.
4. Empirical Results
Table 2 presents our linear regression results. The dependent variable is the
poverty probability index. As for the variables of interest, column 1 uses the
financial inclusion variable, while columns 2 and 3 have bank account ownership
and active bank account variables. Amongst the three variables of interest, only
the bank account variable is statistically significant, but at the 10% level.
Although the sign is negative, the coefficient is relatively small. In other words, in
our base regressions we find no notable effect of all three variables on poverty
alleviation. For the explanatory variables, we see that gender, age, rural locale,
number of people in the household, literacy and education, employment, having
farmland, and the household head variables seem to have a significant effect. The
two variables that are consistently insignificant for all three columns are the
marital status and religion indicators.

12
Table 2. Linear Regression Assuming Exogeneity
(Dependent Variable: PPI score)
Variables Financial
Inclusion Bank Account
Active Bank
Account
Financial inclusion -0.002
(0.002)
Bank account
ownership
-0.003*
(0.002)
Active bank account 0.000
(0.002)
Male 0.004**
(0.002)
0.004**
(0.002)
0.001
(0.002)
Age 15–24 0.036***
(0.003)
0.036***
(0.003)
0.036***
(0.004)
Age 25–34 0.036***
(0.003)
0.036***
(0.003)
0.038***
(0.003)
Age 35–44 0.022***
(0.003)
0.022***
(0.003)
0.022***
(0.003)
Age 45–54 0.003
(0.003)
0.003
(0.003)
0.003
(0.003)
Rural 0.029***
(0.002)
0.029***
(0.002)
0.026***
(0.002)
Married 0.003
(0.002)
0.003
(0.002)
0.002
(0.002)
Number of people -0.068***
(0.001)
-0.068***
(0.001)
-0.068***
(0.001)
Literate -0.040***
(0.004)
-0.040***
(0.004)
-0.053***
(0.005)
Less than six -0.002
(0.005)
-0.002
(0.005)
0.009
(0.005)
Six to 12 0.004
(0.004)
0.004
(0.004)
0.020***
(0.005)
More than 12 -0.018***
(0.005)
-0.017***
(0.005)
-0.003
(0.006)
Farmland -0.007***
(0.002)
-0.007***
(0.002)
-0.005**
(0.002)
Part-time employed -0.020***
(0.004)
-0.020***
(0.004)
-0.025***
(0.004)
Occasionally
employed
-0.013***
(0.003)
-0.013***
(0.003)
-0.012***
(0.003)
Self-employed -0.005
(0.004)
-0.005
(0.004)
-0.004
(0.004)
Not working -0.010***
(0.003)
-0.011***
(0.003)
-0.010***
(0.003)
Hinduism 0.023
(0.054)
0.023
(0.055)
-0.007
(0.076)
Islam 0.003
(0.055)
0.003
(0.055)
-0.026
(0.077)
Christianity -0.000 -0.000 -0.028

13
(0.055) (0.055) (0.077)
Sikhism -0.010
(0.055)
-0.010
(0.055)
-0.041
(0.077)
Buddhism -0.009
(0.057)
-0.009
(0.057)
-0.040
(0.079)
Household head 0.009***
(0.002)
0.009***
(0.002)
0.013***
(0.003)
R2 0.43 0.43 0.43
N 44,990 44,990 35,671
PPI = Poverty Probability Index.
Note: All models have been weighted using the sampling weights provided in the 2017 Financial
Inclusion Insights Survey – Wave 5. Robust standard errors are reported in parenthesis. *** -
significant at the 1% level; ** - significant at the 5% level; * - significant at the 10% level.
Source: Authors’ calculations.
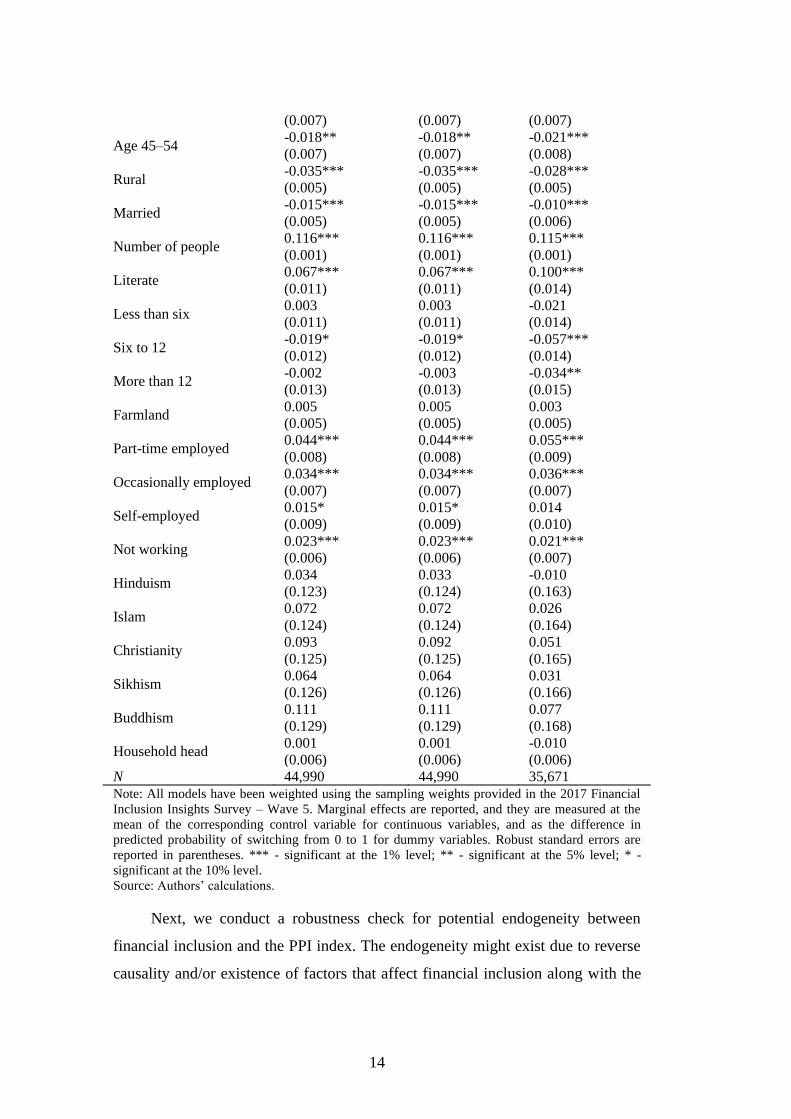
Next, we focus on the results for the probit regression. We now find
statistically significant effects of the three variables of interest. Being financially
included lowers the probability of being poor by 1.3%. Similarly, having a bank
account lessens the likelihood by 1%. Finally, amongst those with a bank account,
active usage of the account lowers the propensity to be poor by 1.4%. While
statistically significant, the magnitudes are quite small to make economic impact.
Given all the work by the Indian government to financially include everyone, a
decrease of 1%–1.4% might not economically justify the efforts. Most of the other
variables in our regressions are statistically significant. Gender, age, rural, marital
status, literacy, education variables and employment status have significant effects
on likelihood of being poor, as expected. Only owning farmland, religion, and
household head variables show no statistical significance.
Table 3. Probit Regression Assuming Exogeneity (Dependent Variable: Poor)
Variables Financial
Inclusion Bank Account
Active Bank
Account
Financial inclusion -0.013**
(0.005)
Bank account ownership -0.010**
(0.005)
Active bank account -0.014***
(0.005)
Male -0.016***
(0.005)
-0.016***
(0.005)
-0.009
(0.006)
Age 15–24 -0.072***
(0.008)
-0.072***
(0.008)
-0.073***
(0.009)
Age 25–34 -0.084***
(0.007)
-0.084***
(0.007)
-0.088***
(0.008)
Age 35–44 -0.057*** -0.057*** -0.060***
14
(0.007) (0.007) (0.007)
Age 45–54 -0.018**
(0.007)
-0.018**
(0.007)
-0.021***
(0.008)
Rural -0.035***
(0.005)
-0.035***
(0.005)
-0.028***
(0.005)
Married -0.015***
(0.005)
-0.015***
(0.005)
-0.010***
(0.006)
Number of people 0.116***
(0.001)
0.116***
(0.001)
0.115***
(0.001)
Literate 0.067***
(0.011)
0.067***
(0.011)
0.100***
(0.014)
Less than six 0.003
(0.011)
0.003
(0.011)
-0.021
(0.014)
Six to 12 -0.019*
(0.012)
-0.019*
(0.012)
-0.057***
(0.014)
More than 12 -0.002
(0.013)
-0.003
(0.013)
-0.034**
(0.015)
Farmland 0.005
(0.005)
0.005
(0.005)
0.003
(0.005)
Part-time employed 0.044***
(0.008)
0.044***
(0.008)
0.055***
(0.009)
Occasionally employed 0.034***
(0.007)
0.034***
(0.007)
0.036***
(0.007)
Self-employed 0.015*
(0.009)
0.015*
(0.009)
0.014
(0.010)
Not working 0.023***
(0.006)
0.023***
(0.006)
0.021***
(0.007)
Hinduism 0.034
(0.123)
0.033
(0.124)
-0.010
(0.163)
Islam 0.072
(0.124)
0.072
(0.124)
0.026
(0.164)
Christianity 0.093
(0.125)
0.092
(0.125)
0.051
(0.165)
Sikhism 0.064
(0.126)
0.064
(0.126)
0.031
(0.166)
Buddhism 0.111
(0.129)
0.111
(0.129)
0.077
(0.168)
Household head 0.001
(0.006)
0.001
(0.006)
-0.010
(0.006)
N 44,990 44,990 35,671
Note: All models have been weighted using the sampling weights provided in the 2017 Financial
Inclusion Insights Survey – Wave 5. Marginal effects are reported, and they are measured at the
mean of the corresponding control variable for continuous variables, and as the difference in
predicted probability of switching from 0 to 1 for dummy variables. Robust standard errors are
reported in parentheses. *** - significant at the 1% level; ** - significant at the 5% level; * -
significant at the 10% level.
Source: Authors’ calculations.
Next, we conduct a robustness check for potential endogeneity between
financial inclusion and the PPI index. The endogeneity might exist due to reverse
causality and/or existence of factors that affect financial inclusion along with the

15
poverty index.12 If our concern of endogeneity is valid, the estimates presented in
Tables 9.2 and 9.3 might be biased. In order to correct for potential endogeneity,
instead of the linear regressions, we employ two-stage least squares (2SLS).
Using two sets of instrumental variables, in the initial stage, we first obtain
predicted values for financial inclusion variables using linear regression. The
predicted values are then substituted into the poverty equation, where a linear
regression is again used to obtain second-stage estimates.
For the regressions where the variables of interest are financial inclusion
and own bank account, we use active phone and active mobile money as the
instruments. The first instrument is where the respondent owns a smartphone and
has been using it for financial transactions in the last 90 days. Similarly, our
second instrument represents those who have used a registered mobile money
account within the past 90 days. We argue that these instruments are highly
correlated with the financial inclusion variables in our dataset. However, these
instruments do not perform well when we restrict the analysis to those
respondents with a bank account in the regression for the active bank account.
Therefore, we use two other instrumental variables; financial literacy and belong
to informal financial institution. The informal financial institutions comprise
informal societies or group saving schemes, while we define financial literacy as
a dummy variable which is equal to 1 if the respondents answered three or more
of the five financial literacy questions in the survey correctly.13 Amongst those
with a bank account, these two instruments are correlated with actively using a
bank account.
Table 4 presents the endogeneity-corrected linear regression results.14 Our
variables of interest are now all positive and highly statistically significant. This
substantial change is evidence of a sizeable downward endogeneity bias. After
correcting for it, our estimates suggest being financially included increases the
PPI value by 0.227 units. The effect of bank account ownership is even larger;
0.34 units. However, amongst those with a bank account, active usage of the
12 See Churchill and Marisetty (2019) for a similar endogeneity correction analysis. 13 Our definition of financial literacy is similar to the one used by Lyons et al. (2019). 14 First-stage regression results, other than the estimates of the instrumental variables, are not
presented in the paper, but they are available upon request.

16
account increases the PPI value only by 0.135 units. All three estimates are
economically significant, hinting at the successful outcome of the efforts by the
GOI to address the issue of poverty reduction through increasing bank accounts in
households.
Next, in the mid-section of Table 4 we present the estimates of the
instruments in the first-stage regression. We observe that they all have significant
explanatory power. Moreover, at the bottom section of Table 4, we present tests
for under-identification, weak identification, and over-identifying restrictions. The
Kleibergen-Paap rk LM statistic indicates that our chosen set of instruments for all
three columns is relevant and that the model is identified.15 We also reject the null
hypothesis of weak identification based on the Kleibergen-Paap rk Wald
statistic.16 Moreover, having multiple instruments lets us test the validity of the
instruments. Based on the Hansen J statistic of overidentifying restrictions, we fail
to reject the joint null hypothesis that the instruments are valid.
Table 4. Linear Regression Controlling for Endogeneity (Dependent
Variable: PPI score)
Variables Financial
Inclusion
Bank
Account
Active Bank
Account
Financial inclusion 0.227***
(0.037)
Bank account ownership 0.340***
(0.062)
Active bank account 0.135***
(0.039)
Other control variables YES YES YES
R2 0.26 0.03 0.33
N 44,990 44,990 30,165
Instrumental variables
15 This is a rank test. Under the null hypothesis that the equation is under-identified, this statistic is
distributed as χ2 with (L1 - K1 + 1) degrees of freedom, where L1 is the number of excluded
instruments and K1 is the number of endogenous regressors. A rejection of the null indicates that
the matrix of reduced form coefficients is of full rank, meaning the model is identified (Baum,
Schaffer, and Stillman, 2010). 16 The weak ID test critical values are compiled by Stock and Yogo (2005) are:
10% maximal IV size – 19.93
15% maximal IV size – 11.59
20% maximal IV size – 8.75
25% maximal IV size – 7.25

17
Active phone 0.052***
(0.007)
0.04***
(0.008)
----
Active mobile money 0.154***
(0.007)
0.093***
(0.011)
----
Financial literacy ---- ---- 0.026***
(0.006)
Belong to informal
financial institution
---- ---- 0.082***
(0.008)
Tests
Kleibergen-Paap rk LM
statistic
(p-value)
522.645
(0.0000)
140.81
(0.0000)
110.454
(0.0000)
Kleibergen-Paap rk Wald F
statistic
(10% maximal IV size)
502.706
(19.93)
78.33
(19.93)
56.189
(19.93)
Hansen J statistic
(p-value)
0.039
(0.8438)
0.443
(0.5057)
0.818
(0.3658)
PPI = Poverty Probability Index.
Note: All models have been weighted using the sampling weights provided in the 2017 Financial
Inclusion Insights Survey – Wave 5. Robust standard errors are reported in parenthesis. *** -
significant at the 1% level; ** - significant at the 5% level; * - significant at the 10% level.
Source: Authors’ calculations.
Earlier, when the dependent variable is poor, we used the probit model to
identify the effects of financial inclusion variables on the household’s likelihood
of being poor. However, we did not control for possible endogeneity. In order to
do that, we again need to implement a two-stage model, similar to 2SLS. Since
poor is a dummy variable, implementing a linear two-stage least squares would
not be appropriate. Thus, we use the two-stage residual inclusion (2SRI) method
to address this concern.17 To do this, in the first stage we estimate the financial
inclusion variables using a linear probability model (LPM) and calculate the
residual from this LPM estimation. We then include the residual as an additional
regressor along with the financial inclusion variable in the probit model for the
poverty regression.
Table 5 presents the endogeneity-corrected results. While the financial
inclusion variables were all negative and significant in Table 3, the magnitudes of
the estimates were minimal. Now, however, we observe the actual effect of these
variables. Compared to not being financially included, those households that are
17 The 2SRI method is a special case of the control function approach to address endogeneity. This
approach has gained popularity recently, especially in applied health research. See for instance,
DeSimone (2002), Shea at al. (2007), Terza, Basu, and Rathouz (2008), Biro (2014), and Eldridge,
Onur, and Velamuri (2017).

18
financially included are 53.3% less likely to be poor. We observe an even larger
effect for bank account ownership, which is consistent with our finding in Table
4. Having a bank account, compared to not having one, lowers the probability of
being poor by 79.7%. Lastly, having an active bank account, compared to having
a dormant one, lowers the likelihood of being poor by 44.5%.
We report the estimates for the first-stage residual, which is added to the
second stage regression. This variable is statistically significant for all three
columns, implying that the financial inclusion variables are indeed endogenous.
Moreover, the bottom section of Table 5 presents the LPM estimates of the
instruments for the first stage regression. All instrumental variables (IVs) are
highly significant.
Table 5. Linear Probability Model Controlling for Endogeneity
(Dependent Variable: Poor)
Variables Financial
Inclusion
Bank
Account
Active Bank
Account
Financial inclusion -0.533***
(0.072)
Bank account ownership -0.797***
(0.109)
Active bank account -0.445***
(0.090)
First-stage residual 0.522***
(0.072)
0.789***
(0.109)
0.429***
(0.090)
Other control variables YES YES YES
N 44,990 44,990 30,165
Instrumental variables
Active phone 0.052***
(0.007)
0.04***
(0.008)
----
Active mobile money 0.154***
(0.007)
0.093***
(0.011)
----
Financial literacy ---- ---- 0.026***
(0.006)
Belong to informal
financial institution
---- ---- 0.082***
(0.008) Note: All models have been weighted using the sampling weights provided in the 2017 Financial Inclusion Insights Survey – Wave 5. Marginal effects are reported, and they are measured at the mean of the corresponding control variable for continuous variables, and as the difference in predicted probability of switching from 0 to 1 for dummy variables. Robust standard errors are reported in parenthesis. *** - significant at the 1% level; ** - significant at the 5% level; * - significant at the 10% level. Source: Authors’ calculations

19
5. Conclusion
This paper focuses on the effect of financial inclusion on poverty reduction
in India. We first highlight the successful efforts by the RBI and the GOI in terms
of extending access to banking services to rural areas of the country. Using the
World Bank’s Global Findex data, we first show that these efforts have been
greatly successful; by 2017, a large majority of Indians had access to formal
banking services. More impressively, the account ownership gaps in terms of
gender, income, and location (rural/urban) have been eliminated.
We then scrutinise the poverty reduction effect of the financial inclusion
success in India. We utilise various measures of poverty, as well as for financial
inclusion. We also correct for possible endogeneity of the financial inclusion
variables in our analysis. Our results show that financial inclusion has a positive
and significant effect on reducing poverty in India. The findings are consistent
across various measures. We also emphasise the importance of controlling for
endogeneity bias. If the bias is not taken into consideration, we find potentially
misleading results of no association between financial inclusion and poverty
levels in India. Policy makers should be cautious about the significant level of
bias while doing a similar analysis.
Lastly, we focus on those with a bank account, and show that an active
usage of the bank accounts would lead to further reductions in poverty levels in
India. In other words, the RBI and the GOI, which have been quite successful in
extending access to formal banking, should consider policies which would
encourage the usage of these bank accounts. Targeted programmes, such as
offering financial education both in and outside the schools, with the aim of
improving financial literacy could lead to further poverty reduction in India.

20
References
Abraham, N. (2019), ‘Financial Inclusion Low Despite 356 Mn Jan Dhan
Accounts’, Factchecker.in, 17 May. https://www.factchecker.in/financial-
inclusion-low-despite-356-mn-jan-dhan-accounts/ (accessed 25 June 2020).
Allen, F., A. Demirguc-Kunt, L. Klapper, and M.S.M. Peria (2016), ‘The
Foundations of Financial Inclusion: Understanding Ownership and Use of
Formal Accounts’, Journal of Financial Intermediation 27, pp.1–30.
Angelucci, M., D. Karlan, and J. Zinman (2013), ‘Win Some Lose Some?
Evidence from a Randomized Microcredit Program Placement Experiment
by Compartamos Banco’, Cambridge, MA: National Bureau of Economic
Research.
Baum, C., M. Schaffer, and S. Stillman (2010), ‘ivreg29: Stata Module for
Extending Instrumental Variables/2SLS, GMM and AC/HAC, LIML and K-
Class Regression’, http://ideas.repec.org/c/boc/bocode/s425401.html
(accessed 17 March 2020).
Beck, T., A. Demirguc-Kunt, and R. Levine (2007), ‘Finance, Inequality and the
Poor’, Journal of Economic Growth, 12, pp.27–49.
Bell, C., and P.L. Rousseau (2001), ‘Post-independence India: A Case of Finance-
led Industrialization?’, Journal of Development Economics, 65(1), pp.153–
75.
Binswanger, H.P., and S.R. Khandker (1995), ‘The Impact of Formal Finance on
the Rural Economy of India. The Journal of Development Studies, 32(2),
pp.234–62.
Biro, A. (2014), ‘Supplementary Private Health Insurance and Health Care
Utilization of People Aged 50+’, Empirical Economics, 46, pp.501–24.
Bruhn, M., and I. Love (2014), ‘The Real Impact of Improved Access to Finance:
Evidence from Mexico’, Journal of Finance, 69, pp.1347–76.
Burgess, R., and R. Pande (2005), ‘Do Rural Banks Matter? Evidence from the
Indian Social Banking Experiment’, American Economic Review, 95(3),
pp.780–95.

21
Chibba, M. (2009), ‘Financial Inclusion, Poverty Reduction and the Millennium
Development Goals’, The European Journal of Development Research,
21(2), pp.213–30.
Churchill, S.A., and V.B, Marisetty (2019), ‘Financial Inclusion and Poverty: A
Tale of Forty- Five Thousand Households’, Applied Economics,
DOI: 10.1080/00036846.2019.1678732 (accessed 17 March 2020).
Demirguc-Kunt, A., S. Leora, and D. Singer (2017), ‘Financial Inclusion and
Inclusive Growth: A Review of Recent Empirical Evidence’, Policy
Research Working Paper, no. WPS. 8040. Washington, DC: World Bank
Group.
http://documents.worldbank.org/curated/en/403611493134249446/pdf/WPS
8040.pdf (accessed 17 March 2020).
DeSimone, J. (2002), ‘Illegal Drug Use and Employment’, Journal of Labor
Economics, 20(4), pp.952–77.
Eldridge, D., I. Onur, and M. Velamuri (2017), ‘The Impact of Private Hospital
Insurance on the Utilization of Hospital Care in Australia’, Applied
Economics, 49(1), pp.78–95.
Ghosh, S., and D. Vinod (2017), ‘What Constrains Financial Inclusion for
Women? Evidence from Micro Data’, World Development, 92, pp.60–81.
Inoue, T. (2019), ‘Financial Inclusion and Poverty Reduction in India’, Journal of
Financial Economic Policy, 11(1), pp.21–33.
Jalilian, H., and C. Kirkpatrick (2005), ‘Does Financial Development Contribute
to Poverty Reduction?’, Journal of Development Studies, 41(4), pp.636–56.
Lyons, A.C., J. Kass-Hanna, F. Liu, A.J. Greenlee, and L. Zeng (2019), ‘Building
Financial Resilience through Financial and Digital Literacy in South Asia
and Sub-Saharan Africa’, ADBI Working Paper Series. Tokyo: Asian
Development Bank Institute.
Mani, A., S. Mullainathan, E. Shafir, and J. Zhao (2013), ‘Poverty Impedes
Cognitive Function’, Science, 341, pp.976–80.
Menon, P. (2019), ‘Financial Inclusion, Banking the Unbanked: Concepts, Issues,
and Policies for India’, Journal of Public Affairs.
https://doi.org/10.1002/pa.1911 (accessed 17 March 2020).

22
Neaime, S., and I. Gaysset (2018), ‘Financial Inclusion and Stability in MENA:
Evidence from Poverty and Inequality’, Finance Research Letters, 24,
pp.230–37.
Prasad, E.S. (2010), ‘Financial Sector Regulation and Reforms in Emerging
Markets: An Overview’, Cambridge, MA: National Bureau of Economic
Research.
Sehrawat, M., and A. Giri (2016), ‘Financial Development and Poverty Reduction
in India: An Empirical Investigation’, International Journal of Social
Economics, 43(2), pp.106–22.
Shea, D., J. Terza, B. Stuart, and B. Briesacher (2007), ‘Estimating the Effects of
Prescription Drug Coverage for Medicare Beneficiaries’, Health Services
Research, Part I, 42(3), pp.933–49.
Stock, J.H., and M. Yogo (2005), ‘Testing for Weak Instruments in Linear IV
Regression’, in D.W.K. Andrews and J.H. Stock (eds.), Identification and
Inference for Econometric Models: Essays in Honor of Thomas of Thomas
Rothenberg. Cambridge, MA: Cambridge University Press, pp. 20–108.
Swamy, V. (2014), ‘Financial Inclusion, Gender Dimension, and Economic
Impact on Poor Households’, World Development, 56, pp.1–15.
Terza, J., A. Basu, P. Rathouz (2008), ‘Two-Stage Residual Inclusion Estimation:
Addressing Endogeneity in Health Econometric Modelling’, Journal of
Health Economics, 27(3), pp.531–43.
World Bank (2020), ‘Financial Inclusion’, Washington, DC: World Bank.
https://www.worldbank.org/en/topic/financialinclusion (accessed 25 June
2020).

23
Table A1: Variable Definitions
Variable Definition
PPI Score A continuous score between 0 and 1 measuring the likelihood of a
household living below the $2.50/day (2005 PPP) poverty line.
Poor Equals 1 if the household is living below the $2.50/day (2005 PPP)
poverty line, and zero otherwise.
Bank account
ownership
Equals 1 if the respondent has a bank account registered in their
name, and zero otherwise.
Active bank
account
Equals 1 if account is used for withdrawal/deposit or other financial
activity in the last 90 days, and zero otherwise.
Male Equals 1 if the respondent is male, and zero otherwise.
Age Age of the respondent.
Rural Equals 1 if the respondent lives in a rural area, and zero otherwise.
Married Equals 1 if the respondent is married, and zero otherwise.
Number of
people Number of people in the household.
Education
Variable that shows the education level of the respondent being no
education, one to 6 years, six to twelve years, or more than twelve
years.
Literate Equals 1 if the respondent is literate, and zero otherwise.
Farmland Equals 1 if the household owns farmland, and zero otherwise.
Employment Variable that shows if a person is full-time, part-time, occasionally,
self-employed, or not employed.
Religion Variable representing the religion of the respondent being Hinduism,
Islam, Christianity, Sikhism or Buddhism.
Household head Equals 1 if the respondent is the head of the household, or zero
otherwise.
Financial
literacy
Equals 1 if the respondent answered three or more of the five
financial literacy questions in the survey correctly, or zero otherwise.
Active phone Equals 1 if the respondent owns a smartphone and has been using it
for financial transactions in the last 90 days, or zero otherwise.
Active mobile
money
Equals 1 if the respondent has used a registered mobile money
account in the last 90 days, or zero otherwise.
Belong to
informal
financial
institution
Equals 1 if the respondent belongs to an informal financial institution
such as informal societies or group saving schemes, or zero
otherwise.
PPI = poverty probability index, PPP = purchasing power parity.
Note: Five financial literacy questions assess the respondent’s knowledge of interest rates,
compounding interest (two questions), inflation and risk diversification.
Source: The Financial Inclusion Insights Program, InterMedia.

24
ERIA Discussion Paper Series
No. Author(s) Title Year
2020-17
(no. 344)
Rashesh SHRESTHA,
Samuel NURSAMSU
Financial Inclusion and Savings in
Indonesia
September
2020
2020-16
(no.343)
Kimty SENG The Poverty-Reducing Effects of
Financial Inclusion: Evidence from
Cambodia
September
2020
2020-15
(no. 342)
Rajabrata BANERJEE,
Ronald DONATO,
Admasu Afsaw
MARUTA
The Effects of Financial Inclusion on
Development Outcomes: New Insights
from ASEAN and East Asian
Countries
September
2020
2020-14
(no. 341)
Rajabrata BANERJEE
and Ronald DONATO
The Composition of Financial
Inclusion in ASEAN and East Asia: A
New Hybrid Index and Some Stylised
Facts
September
2020
2020-13
(no. 340)
Tony CAVOLI and
Rashesh SHRESTHA
The Nature and Landscape of
Financial Inclusion in Asia
September
2020
2020-12
(no. 339)
Han PHOUMIN, TO
Minh Tu, THIM Ly
Sustainable Water Resource
Development Scenarios and Water
Diplomacy in the Lower Mekong
Basin: Policy Implications
September
2020
2020-11
(no. 338)
Kiki VERICO and Mari
Elka PANGESTU
The Economic Impact of Globalisation
in Indonesia
August
2020
2020-10
(no. 337)
Yuziang YANG and
Hongyong ZHANG
The Value-Added Tax Reform and
Labour Market Outcomes: Firm-Level
Evidence from China
August
2020
2020-09
(no. 336)
Juthathip
JONGWANICH,
Archanun
KOHPAIBOON, Ayako
OBASHI
Technological Advancement, Import
Penetration, and Labour Markets:
Evidence from Thai Manufacturing
August
2020
2020-08
(no. 335)
Duc Anh DANG and
Thu Thu VU
Technology Imports and Employment
in Developing Countries: Evidence
from Viet Nam
August
2020

25
2020-07
(no. 334)
Hiroaki ISHIWATA,
Hiroyuki WADA, Koji
SUZUKI, Makoto
IKEDA, Naoto TADA
A Quantitative Analysis of Disaster
Risk Reduction Investment Effects for
Sustainable Development: Indonesia
Case Study
June 2020
2020-06
(no. 333)
Dao Ngoc TIEN,
Nguyen Quynh HUONG
Assessment of Industrial Cluster
Policies in Viet Nam: The Role of
Special Economic Zones in Attracting
Foreign Direct Investment
June 2020
2020-05
(no. 332)
Ayako OBASHI and
Fukunari KIMURA
New Developments in International
Production Networks: Impact of
Digital Technologies
June 2020
2020-04
(no. 331)
Upalat
KORWATANASAKUL,
Youngmin BAEK,
Adam MAJOE
Analysis of Global Value Chain
Participation and the Labour Market in
Thailand:
A Micro-level Analysis
May 2020
2020-03
(no. 330)
Ha Thi Thanh DOAN
and Huong Quynh
NGUYEN
Trade Reform and the Evolution of
Agglomeration in Vietnamese
Manufacturing
April
2020
2020-02
(no. 329)
Kazunobu
HAYAKAWA, Tadashi
ITO, Shujiro URATA
Labour Market Impacts of Import
Penetration from China and Regional
Trade Agreement Partners:
The Case of Japan
April
2020
2020-01
(no. 328)
Fukunari KIMURA,
Shandre Mugan
THANGAVELU,
Dionisius A.
NARJOKO, Christopher
FINDLAY
Pandemic (COVID-19) Policy,
Regional Cooperation, and the
Emerging Global Production Network
April
2020
ERIA discussion papers from the previous years can be found at:
http://www.eria.org/publications/category/discussion-papers