financial inclusion initiatives : economic impact and...
TRANSCRIPT
Financial inclusion initiatives : economic impact and regeneration in city economies
the case of LeedsDayson, KT, Conaty, P, Dawson, J, Marchant, RM, Salt, A and Vik, PM
Title Financial inclusion initiatives : economic impact and regeneration in city economies the case of Leeds
Authors Dayson, KT, Conaty, P, Dawson, J, Marchant, RM, Salt, A and Vik, PM
Type Monograph
URL This version is available at: http://usir.salford.ac.uk/19122/
Published Date 2009
USIR is a digital collection of the research output of the University of Salford. Where copyright permits, full text material held in the repository is made freely available online and can be read, downloaded and copied for noncommercial private study or research purposes. Please check the manuscript for any further copyright restrictions.
For more information, including our policy and submission procedure, pleasecontact the Repository Team at: [email protected].
Financial Inclusion Initiatives
Economic impact and regeneration incity economiesThe case of Leeds
Karl Dayson, Pat Conaty, Jane Dawson, Bob Marchant, Anthony Salt and Pål Vik Community Finance Solutions October, 2009 About CFS Located within the University of Salford, Community Finance Solutions (CFS) is an independent award-winning research and development unit engaged in promoting and developing integrated solutions for financial and social inclusion, and community ownership of assets. For more information about CFS and our work, please visit our website at www.communityfinance.salford.ac.uk
Table of contents Foreword .........................................................................................................................i Preface............................................................................................................................ii Acknowledgements........................................................................................................v Glossary ........................................................................................................................vi EXECUTIVE SUMMARY .........................................................................................vii 1. Introduction............................................................................................................1 2. Methodology ..........................................................................................................2
2.1. Introduction................................................................................................2 2.2. Financial inclusion interventions studied...................................................2 2.3. Survey ........................................................................................................3 2.4. Business Intervention Model .....................................................................4 2.5. Input-output modelling ..............................................................................5
3. The costs and benefits of financial inclusion interventions in Leeds ....................7 3.1. Introduction................................................................................................7 3.2. Survey results.............................................................................................7 3.3. Business Intervention Model ...................................................................11
3.3.1. ABLT ...................................................................................................12 3.3.2. Leeds MAP ..........................................................................................13 3.3.3. Connect Housing..................................................................................14 3.3.4. Leeds Welfare Rights Unit...................................................................15 3.3.5. Leeds City Credit Union ......................................................................16 3.3.6. Leeds Corporate Debt Unit ..................................................................17 3.3.7. npower..................................................................................................18 3.3.8. East North East Homes Leeds (unverified) .........................................19 3.3.9. Leeds MAP (NHS funded provision) ..................................................20
3.4. Overall costs and benefits ........................................................................21 3.5. Discussing the Business Intervention Model...........................................22
4. Economic impact of financial inclusion interventions in Leeds..........................25 4.1. Introduction..............................................................................................25 4.2. The economic impact of financial inclusion interventions in Leeds .......25
5. Reflections and Concluding Comments...............................................................29 6. Bibliography ........................................................................................................32
APPENDICES The appendices mentioned in this report are available to download from Leeds City Council web site at www.leeds.gov.uk/fi Appendix A List of interviewees Appendix B Business Intervention Model (BIM) Overview Appendix C Survey Report and Data Appendix D Questionnaire Appendix E Description of the Economic Model and Applications Appendix F Input/Output Modelling Spreadsheet Appendix G Leeds and the Yorkshire and Humber Economy

ForewordIt is six years since Leeds City Council embarked on a new initiative to try to deal with the problems caused by financial exclusion. Access to affordable financial services, taken for granted by the vast majority of citizens, is not generally available to those who live in the more deprived parts of our major cities.
In Leeds, research was commissioned, to find out in some detail, what the extent and nature of the problem was. The research, published in 2004, uncovered significant evidence of the extent of deprivation resulting from the absence of access to financial services and highlighted the impact of this on people’s lives.
Since that time Leeds City Council and a significant number of voluntary and private sector partners have worked together to implement many initiatives in an attempt to deal with these problems. In doing so the Council was always convinced that these initiatives, in addition to providing significant support for citizens, also had a potentially major impact on the city’s economy.
Traditionally, work associated with enhancing people’s benefits and dealing with their debt problems has been seen almost as a charitable service with significant cost implications, but with no material benefit for the funders of these services. Leeds City Council did not believe that this was the whole story, and therefore, with the support of Yorkshire Forward, the Council commissioned further research to find out in some detail, if there was a general economic benefit and if so, the value of this to the local and regional economy.
When the research was commissioned, we could not have envisaged the extent of the value which we would find when the research was analysed. The research shows that every year £26 million additional income is generated in the local economy in Leeds with an impact on the regional economy of over £28 million.
Economic benefit of this scale simply cannot be ignored by policymakers - whether by Local or National Government, Social Housing Providers, Public Health Professionals or other agencies involved in the regeneration of our more deprived communities. We have shown through this research that investment in financial inclusion work is doubly worthwhile; it provides a significant benefit to individuals, many who are living in poverty. In doing so, it also provides a boost to the economy, not only to the city and the region as a whole but, of important significance, it provides a boost to the economy of those communities which all Governments and public agencies have such difficulty in reaching and regenerating.
Councillor Andrew Carter Tom RiordanDeputy Leader and Chief ExecutiveExecutive Board Member for Yorkshire ForwardDevelopment and RegenerationLeeds City Council
i

ii
Preface The Financial Inclusion Project in Leeds has its origins in early 2003 when discussions between the City Council and Leeds City Credit Union identified problems of high-interest loans from doorstep lenders. During 2004 research was undertaken by Community Finance Solutions (CFS) at the University of Salford, which was published in December of that year. The research included a survey of 410 households. The survey resulted in a comprehensive set of data presenting a vivid picture of the effects of financial exclusion. Some of the key issues were:
• Low utilisation of bank accounts by residents. • Forty percent kept their savings in cash in the house or relatives looked after it. • Of those who borrowed, 15 % used high-interest doorstep lenders. • 38% of single parents who borrowed used doorstep lenders. • A fifth of those who borrowed used the money to pay off other debts or for
day-to-day living. The research identified needs which came under three broad headings: Affordable credit, debt advice and financial literacy The underlying need was for services to be locally provided and integrated. In order to ensure a long-term and sustainable commitment, political support was secured from across all the Council's main political parties. One of the key factors in developing the successful project was the establishment of a broad Steering Group. This Steering Group covers all City Council Departments and many partners from the public, private and voluntary sector. The group now comprises over 100 representatives from 50 partner organisations. Some of the key initiatives developed since that time, include:
Affordable Credit
• The roll out of Credit Union branches in the Council's One Stop Centre and housing cash offices – expansion from 2 branches in 2005 to 10 by 2008.
• Expansion of the development of Credit Union schools saving clubs. • Launch of an enterprise loan scheme run by the Credit Union to provide finance to
small businesses who would not normally be able to raise funds for expansion - funded through the Local Enterprise Growth Initiative (LEGI).
• The launch of the Leeds “Loan Shark” project in conjunction with Birmingham City Council and West Yorkshire Trading Standards.
• Launch of the Credit Union 'Handiloan' affordable loan scheme. • Discussions with the Post Office about greater collaboration in dealing with Credit
Union accounts.
Debt/Money Advice
• Development of the Leeds Money Advice Project (MAP) partnership which unified all the city’s 5 debt advice providers and resulted in a successful joint bid to the DTI (now Department for Business Innovation and Skills - BIS) for additional face-to-face debt advice funding.
iii
• Developing a project to provide basic financial management and debt counselling training to staff working in the Council's customer service points and other front-line staff.
• Offering families advice services via the Council's Children’s Centres which provide integrated childcare and education for early-years children.
• Development of debt and financial advice packages by Leeds Housing Arms Length Management Organisations (ALMO’s) and housing associations, to assist tenants with their debt and money problems.
• Provided an extensive communications network between all partners involved in debt / money advice support to enable easier access to debt counselling appointments for clients.
Financial literacy
• Co-development of financial literacy packages for young children by the Council's library service and Yorkshire Bank.
• Development by Education Leeds (the city’s education administration provider) of financial literacy packages for school-age children.
• Working with the Financial Services Authority (FSA) to deliver financial capability training for all council staff.
Cross initiative/strategic
• Key Improvement Priority in the Leeds Strategic Plan (successor to the Local Area Agreement).
• New approach to developing a Council “Corporate Debt Policy” involving key partners who have direct experience in dealing with debt problems.
• Commissioned this current piece of research to determine the economic and regeneration impacts of financial inclusion initiatives.
• Joined with seven other European partner cities developing joint approaches to social exclusion issues. Leeds City Council showcasing the financial inclusion project.
In recognition of Leeds City Council’s work in this area it was awarded Beacon Status by the Government’s Improvement and Development Agency (IDeA) in 2007 in the theme; Promoting Financial Inclusion and Tackling Over-Indebtedness. The success achieved to-date is a testament to the collaborative arrangements adopted in the city. The original financial exclusion research proved to be valuable in providing the evidence required to convince government and key stakeholders that financial exclusion existed in Leeds, and recommend ways in which it could be best tackled. Furthermore, the research established that there was potentially a significant economic gain from undertaking financial inclusion initiatives. By providing affordable alternatives to doorstep-lending more money is kept within local economies. Evidence also suggests that a higher proportion of income is recycled within these local areas, therefore, potentially equating to an even higher overall economic impact.
It was acknowledged that there was a need to undertake both a more detailed analysis and a wider ranging evaluation of financial inclusion interventions. This should

iv
involve tracking the impact of debt advice, benefits take-up and affordable credit in order to establish the economic and regeneration impact that this work produces.
Therefore, Leeds City Council commissioned this piece of research to identify and quantify the impact of financial inclusion activities on the economy of Leeds. Although the research calculates the impact for the Leeds economy specifically, we hope that the methodology used here may be used to assess and underpin financial inclusion activities in other cities in the UK. We invite you to make use of it.

v
Acknowledgements The research team is grateful to Leeds City Council and the Leeds Financial Inclusion Steering Group for all their comments and input into the research. The team is also especially indebted to Leeds MAP, Leeds Welfare Rights Unit, Leeds City Credit Union, Leeds Benefits Service, Connect Housing, East North East Homes Leeds and npower for their contribution through participating in the research project.
Dr. Karl Dayson, Executive director Community Finance Solutions, University of Salford, and Research Team Leader
vi
Glossary ABLT – Advice and Benefits Liaison Team, part of Leeds Benefits Service ALMO – Arms Length Management Organisation BIM – Business Intervention Model, a cost-benefit analysis methodology developed by CFS for the analysis of financial inclusion interventions CAB – Citizen Advice Bureaux CFS – Community Finance Solutions DWP – Department of Works and Pension ENEHL – East North East Homes Leeds, ALMO managing 20,000 ex-Council homes across east and north east Leeds FRS – Family Resources Survey, bi-annual national survey about the living conditions and resources of UK households Growth Fund – Fund of £36 million fund set up by DWP in 2004 to increase availability of affordable personal loans via third sector (not-for-profit) lenders (e.g. CDFIs and credit unions) Input-output table – Transaction table which shows purchases (input) and sales (output) by sector within a regional or local economy in a given year Keynesian income-expenditure model – Method developed by John Maynard Keynes for estimating impact of changes in demand on an economy based on calculating income and employment multipliers LBS – Leeds Benefit Service LCCU – Leeds City Credit Union, third sector lender with common bond covering people living or working in Leeds LCDU – Leeds Corporate Debt Unit Leeds MAP – Leeds Money Advice Partnership consisting of Leeds CAB, Chapeltown CAB, Burley Lodge Advice Services, Ebor Garden Advice Centre and St. Vincent’s Support Centre LM3 – Local Multiplier 3, simplified method for calculating local multipliers designed measure the impact of a certain economic activity, company or investment on a local economy. Marginal propensity to consume locally – Likelihood of households and firms to purchase locally produced goods Multiplier – Measure of magnitude of the impact of a change in investment beyond what is immediately measurable NEF – New Economics Foundation, independent think-tank based in London WRU – Welfare Rights Unit

vii
EXECUTIVE SUMMARY Financial exclusion work delivers up to £26 million of increased disposable income to the city of Leeds. This is achieved by providing access to affordable credit, increased benefit up-take, reduced financing costs through debt advice and similar ways.
Through synthesis of differing approaches we developed an innovative methodology to help Leeds City Council and its partners understand the financial impact of their work The first stage involved a survey of users of financial inclusion interventions to quantify the benefits of these interventions on the users. This information was then used to cross-reference against organisations own analysis of the impact in stage 2 and fed into the input-output model in stage 3. The second stage was our unique Business Intervention Model (BIM). This is a cost-benefit analysis methodology developed by Community Finance Solutions (CFS) for the analysis of financial inclusion interventions. It involves a forensic assessment and verification of the costs of each intervention and the benefits achieved. Though some estimates are included, these are grounded in accumulated evidence and designed to be conservative.
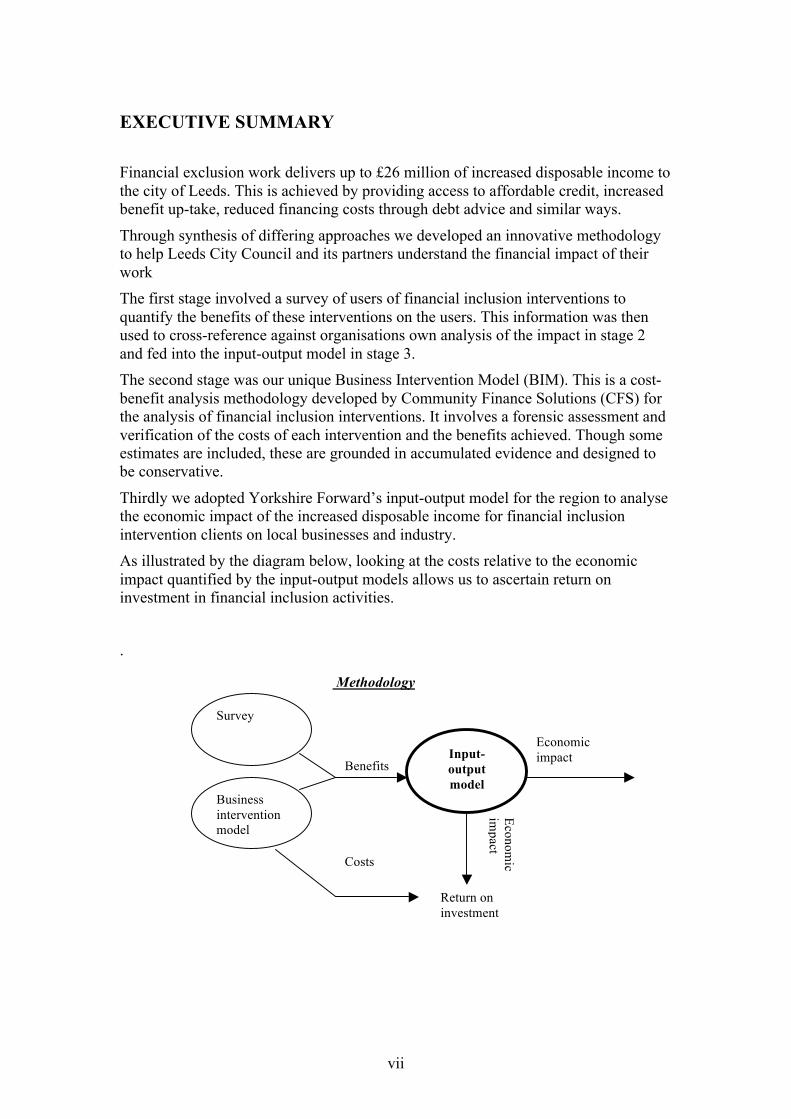
Thirdly we adopted Yorkshire Forward’s input-output model for the region to analyse the economic impact of the increased disposable income for financial inclusion intervention clients on local businesses and industry. As illustrated by the diagram below, looking at the costs relative to the economic impact quantified by the input-output models allows us to ascertain return on investment in financial inclusion activities.
.
Economic
impact
Economic impact
Costs
Benefits
Business intervention model
Survey
Input-output model
Return on investment
Methodology
viii
Stage 1: Users Survey 527 service users of debt and money advise providers, welfare rights and benefit support services and Leeds City Credit Union, were involved in the survey. The survey demonstrated significant individual benefits. 66% of users of debt advice stated that they were better off (23% weren’t sure), 63% of credit union members and 82% using benefit entitlement services.
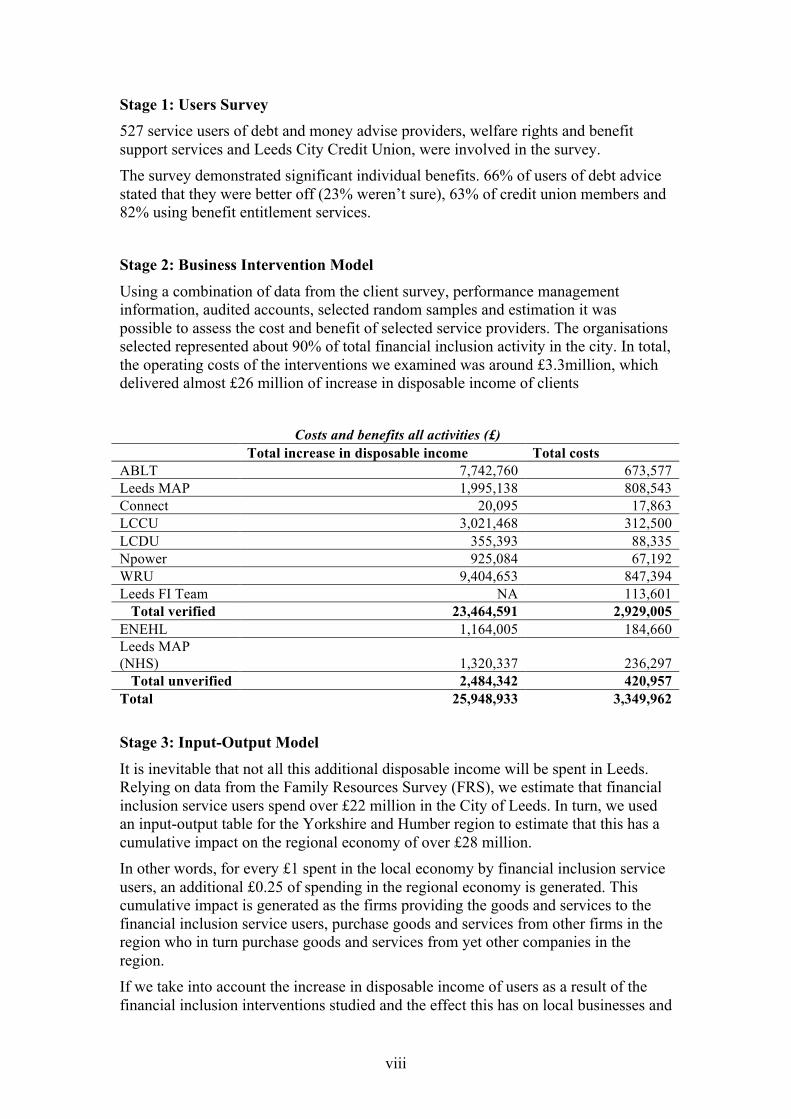
Stage 2: Business Intervention Model Using a combination of data from the client survey, performance management information, audited accounts, selected random samples and estimation it was possible to assess the cost and benefit of selected service providers. The organisations selected represented about 90% of total financial inclusion activity in the city. In total, the operating costs of the interventions we examined was around £3.3million, which delivered almost £26 million of increase in disposable income of clients
Costs and benefits all activities (£)
Total increase in disposable income Total costs ABLT 7,742,760 673,577 Leeds MAP 1,995,138 808,543 Connect 20,095 17,863 LCCU 3,021,468 312,500 LCDU 355,393 88,335 Npower 925,084 67,192 WRU 9,404,653 847,394 Leeds FI Team NA 113,601
Total verified 23,464,591 2,929,005 ENEHL 1,164,005 184,660 Leeds MAP (NHS) 1,320,337 236,297
Total unverified 2,484,342 420,957 Total 25,948,933 3,349,962 Stage 3: Input-Output Model It is inevitable that not all this additional disposable income will be spent in Leeds. Relying on data from the Family Resources Survey (FRS), we estimate that financial inclusion service users spend over £22 million in the City of Leeds. In turn, we used an input-output table for the Yorkshire and Humber region to estimate that this has a cumulative impact on the regional economy of over £28 million. In other words, for every £1 spent in the local economy by financial inclusion service users, an additional £0.25 of spending in the regional economy is generated. This cumulative impact is generated as the firms providing the goods and services to the financial inclusion service users, purchase goods and services from other firms in the region who in turn purchase goods and services from yet other companies in the region. If we take into account the increase in disposable income of users as a result of the financial inclusion interventions studied and the effect this has on local businesses and
ix
industry, this means that for every £1 invested in financial inclusion in Leeds, £8.40 is generated for the regional economy.
Overall, financial inclusion activity in Leeds seems to have produced good value for the user and the Council Taxpayer. On this basis it should be seen as an economic issue and not exclusively a social one. Lessons for those outside of Leeds Clearly the findings of this research project suggest that financial inclusion interventions have an impact on the local and regional economy which goes beyond the client households. By extension the methodology developed for this research project can play a potentially important role in the funding and development of financial inclusion activities in Leeds and other cities in the UK. This is because it builds a business case for investment and evaluates the value-for-money aspect of different interventions. However, it is important to make note of the following cautionary remarks to cities wanting to make use of the methodology: - The results of the modelling are only as reliable as the data used to assess the
increases in disposable income resulting from interventions. Thus there is a strong case for investing in data collection and monitoring mechanisms in the organisations providing financial inclusion services.
- A challenge for cities in evaluating the wider economic effects of interventions is the lack of local input-output data. In this study we relied on regional-level input-output data. City economic development departments may want to investigate the possibility of developing such data on a city level.
- The methodology applied here can help guide financial inclusion policies. But it is important that the funding and support of financial inclusion activities should not be guided by a single measure or indicator. Financial inclusion activities may also have impacts that are not easily quantifiable, including improved mental health and self-esteem, which too are worthwhile acknowledging, developing and funding. It is also necessary to view financial inclusion as a process and a menu. Some people will need help with all the types of services in Leeds, while others will require only one provider.
- It doesn’t measure related health benefits which the survey indicated were significant.
Finally, the research occurred during the beginning of the biggest global recession since the 1930s, caused by the same financial institutions that contribute to financial exclusion. Consequently, though the research is a celebration of city authority activism we shouldn’t expect local communities to solve national and international problems. Tackling the causes of financial exclusion requires a more responsible and accountable financial sector. This report has shown what a proactive northern English city can do, its up to national and international leaders to support these good works.

1
1. Introduction This document presents the findings and the methodology for a research project assessing the impact of financial inclusion interventions on the economy of Leeds. Specifically, the research focused on the interventions by Leeds City Credit Union (LCCU), Connect Housing, East North East Homes Leeds (ENEHL), npower, Leeds Money Advice Partnership (MAP), Leeds Corporate Debt Unit (LCDU), Leeds Welfare Rights Unit (WRU) and Leeds Advice and Benefit Liaison Team (ABTL). The objective of this research project was two-fold. The first and immediate goal was to assess and quantify the impact of current financial inclusion interventions on the economy of Leeds. The second more long-term, strategic objective was to develop and test a scientifically valid and practical method for periodic future assessments by Leeds City Council for quantifying the wider economic impact of financial inclusion activities. Such periodic evaluations could help guide the strategic direction in the support and funding of financial inclusion interventions in the city.
The remainder of this report is organised into four chapters: - Chapter 2: Methodology - Chapter 3: The costs and benefits of financial inclusion interventions in Leeds - Chapter 4: The economic impact of financial inclusion interventions in Leeds - Chapter 5: Reflections and concluding comments
Additional documentation can be found in Appendices A-E - Appendix A: List of interviewees - Appendix B: BIM overview - Appendix C: Survey report - Appendix D: Questionnaire - Appendix E: The economic impact of financial inclusion – models and
applications - Appendix F: Instructions for use of modelling software - Appendix G: Leeds and the Yorkshire and Humber economy
2
2. Methodology
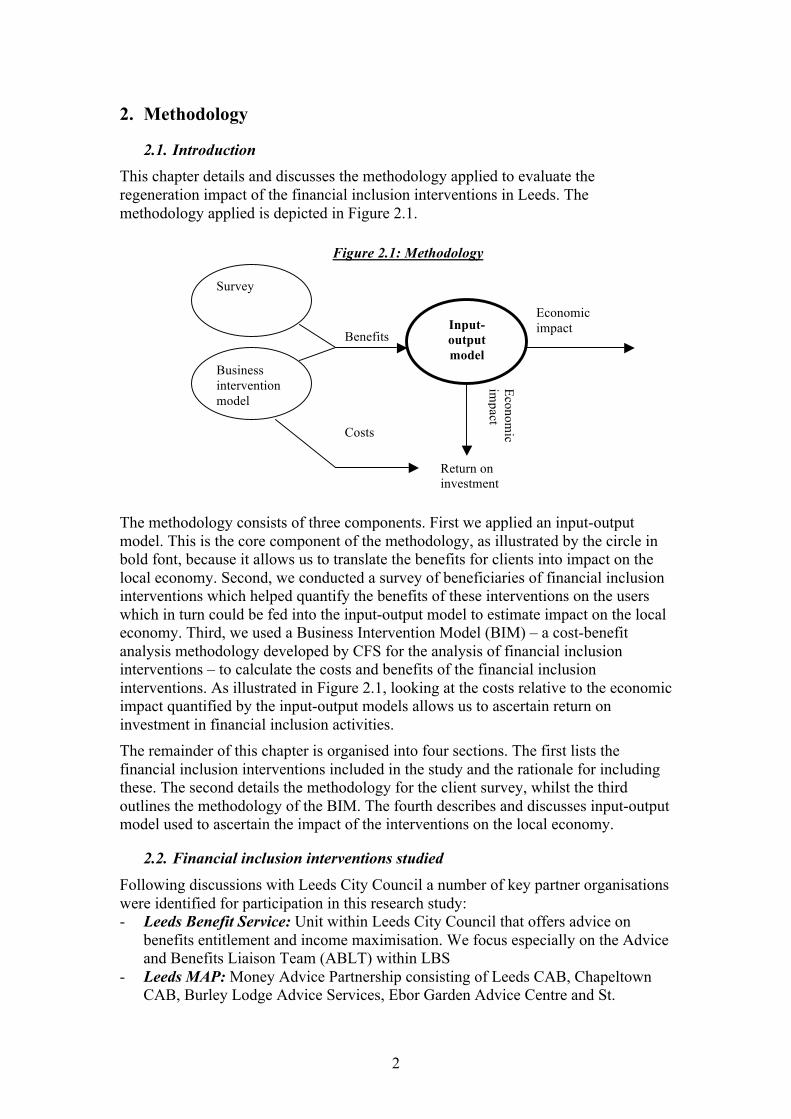
2.1. Introduction This chapter details and discusses the methodology applied to evaluate the regeneration impact of the financial inclusion interventions in Leeds. The methodology applied is depicted in Figure 2.1. The methodology consists of three components. First we applied an input-output model. This is the core component of the methodology, as illustrated by the circle in bold font, because it allows us to translate the benefits for clients into impact on the local economy. Second, we conducted a survey of beneficiaries of financial inclusion interventions which helped quantify the benefits of these interventions on the users which in turn could be fed into the input-output model to estimate impact on the local economy. Third, we used a Business Intervention Model (BIM) – a cost-benefit analysis methodology developed by CFS for the analysis of financial inclusion interventions – to calculate the costs and benefits of the financial inclusion interventions. As illustrated in Figure 2.1, looking at the costs relative to the economic impact quantified by the input-output models allows us to ascertain return on investment in financial inclusion activities. The remainder of this chapter is organised into four sections. The first lists the financial inclusion interventions included in the study and the rationale for including these. The second details the methodology for the client survey, whilst the third outlines the methodology of the BIM. The fourth describes and discusses input-output model used to ascertain the impact of the interventions on the local economy.
2.2. Financial inclusion interventions studied Following discussions with Leeds City Council a number of key partner organisations were identified for participation in this research study: - Leeds Benefit Service: Unit within Leeds City Council that offers advice on
benefits entitlement and income maximisation. We focus especially on the Advice and Benefits Liaison Team (ABLT) within LBS
- Leeds MAP: Money Advice Partnership consisting of Leeds CAB, Chapeltown CAB, Burley Lodge Advice Services, Ebor Garden Advice Centre and St.
Economic
impact
Economic impact
Costs
Benefits
Business intervention model
Survey
Input-output model
Return on investment
Figure 2.1: Methodology
3
Vincent’s Support Centre. Providers of free confidential and impartial money and debt advice.
- Connect Housing: Social housing landlord with around 3,000 properties in Leeds. Offers light-touch in-house advice and signposting and referral to specialist debt advice agencies.
- ENEHL: ALMO managing 20,000 properties across the East and North East of Leeds. It has an in-house benefits advice team, works in partnership with Leeds City Credit Union and operates numerous other financial inclusion interventions.
- Leeds Corporate Debt Unit: Unit within the Council Tax Recovery Unit. Aims to deal with debtors in a holistic and pro-active manner
- Leeds City Credit Union: Mutual financial institution offering savings and loans to its members. Its common bond covers people working or living in Leeds and it has approximately 25,000 members.
- npower: Major UK utility company that has a range of interventions and services aimed at the fuel poor
- Leeds Welfare Rights Unit: Unit within Leeds City Council that offers free, confidential and impartial welfare rights service via the telephone, advice surgeries or home visits
The reasons for choosing these particular partners were numerous, but on the whole they provide a broad mix of perspectives across a range of financial inclusion activities, and offered a cost effective way to undertake the research.
2.3. Survey To assess and quantify the impact of the financial inclusion interventions, a survey was conducted with clients of three financial inclusion service providers. The results of the survey were used in conjunction with the BIM to estimate benefits. The aim was to establish the extent to which clients had benefited from these services in terms of: - managing their money; - the extent to which they used sub-prime sources of credit; - their level of debt; - how much better off they were in financial terms and; - the extent to which this benefited the Leeds economy;
Clients of the following organisations were included in the study: - Leeds Citizens Advice Bureau (CAB), Burley Lodge Advice Centre, Chapeltown
CAB, Ebor Gardens Advice Centre and St Vincents Support Centre; - Leeds Welfare Rights Unit (WRU) and Leeds Advice and Benefits Liaison Team
(ABLT); - Members of Leeds City Credit Union (LCCU) who use services which assist with
financial inclusion such as budgeting accounts and Handiloans (funded through the DWP Growth Fund).
Interviews were conducted over the telephone with clients of the three organisations. To ensure the confidentiality of the agencies’ clients, the agencies concerned contacted their clients and asked them if they would be willing to take part in this survey. All respondents were offered a £5 voucher as an incentive. The contact details of those interested were then passed on to the survey company. The MAP agencies contacted clients who had received their intervention at least six months previously so that there was time to establish what the impact had been. WRU
4
and LBS collected permissions from clients when they visited an advisor (or when an advisor visited the client) but in many cases these were on-going clients. LCCU asked clients if they wished to participate when they were visiting a branch. The final part of the sample was collected by interviewers visiting LCCU branches and collecting names of people willing to be interviewed. LCCU clients were to have a budgeting account, handiloan, funded through the Growth Fund, or have benefits paid into their accounts. The Credit Union sample is not representative of all Credit Union members but was deliberately weighted towards low income households.
Interviews with the MAP clients, Leeds Benefits Service and the majority of WRU clients were conducted between mid July and mid August 2008 with further WRU clients being interviewed in early October 2008. LCCU clients were interviewed between mid July 2008 and mid February 2009.
Table 2.1: Number of interviews conducted with clients of each service Leeds CAB 81 St Vincents 26 Chapeltown CAB 21 Burley Lodge 46 Ebor Gardens 16 Sub-total 190 Credit Union 170 Sub-total 170 WRU 125 Benefits Service 42 Sub-total 167
Total 527
2.4. Business Intervention Model We used a Business Intervention Model (BIM) to quantify the costs and benefits of the financial inclusion interventions in the study. In simple terms, the Leeds BIM works by calculating the net average benefits accrued to beneficiaries by receiving the financial inclusion services provided net of the costs of delivering the services. It involves: - Understanding the roles, responsibilities and required activities of all relevant staff
in terms of delivering and managing the activities - Understanding the interaction and information flows between these parties
(internally and externally, with beneficiaries and also with other agencies); - Understanding the outputs and, to a lesser degree, the outcomes of the
interventions; both with regards to the number of beneficiaries dealt with but also the net average return to the beneficiary as a result of being involved in the activity
- Calculating the cost of delivering the services provided; at an organisational level where appropriate, certainly at a unit level and also, where possible and appropriate at a unit cost per beneficiary level
The calculations have been based on data provided by key partners (e.g. Performance Management Information etc) and on data from the client survey. Where estimates and forecasts have been made we have erred on the conservative side. By providing this BIM framework, the model can be used as a tool to provide some strategic insight to both commissioners and deliverers in order to better help understand the likely
5
impact and return on investment of financial inclusion activities across the City of Leeds.
The creation of the Leeds BIM has involved a number of stages: 1. Identification of potential organisations to review: This involved considering
approximately 60 organisations known to Leeds City Council as attached (loosely or tightly) to the Financial Inclusion Steering Group.
2. Consideration of a subset of organisations to review: Within the constraints of time and budget this review was never going to be able to review every single organisation aligned with the Financial Inclusion Steering Group and all services that these partners deliver. Hence, a representative subset was required.
3. Agreement with key partners to participate in the evaluation: At this stage agreement by the management of the organisations is sought as this is important for completion of the template.
4. Intervention template: The intervention template was designed to provide an overview of the services being delivered by the financial inclusion organisations. This was to provide the foundation for the key partner interviews, ensuring that the interviewer had some knowledge of the type, scale and outputs being generated by the services provided.
5. Field interviews: The majority of the field interviews were undertaken in early January 2009. The interview process was semi-structured in that it looked to broadly follow the format of the Intervention templates (filling the gaps), but would also provide a broader picture of the organisation in line with Figure 3.1 above. At the end of each interview each interviewee was advised that there would be a (small) number of questions according to how the interview had progressed.
6. Follow up information: In most cases there would be need to collect some additional information
7. BIM development: At this stage the results are cross-referenced with the client survey findings. The development of the BIM seeks to: - Understand the organisation and its structure, the context it operates in,
partnerships, any key issues it faces and the services it provides -generally the internal dynamic
- Understand client behaviour and how he / she interacts with service providers - To calculate average beneficiary benefit / loss of benefit per beneficiary - To understand cost of delivery (per FTE equivalent at programme level) plus
management overview and contribution to core costs - To calculate Return on Investment in relatively simple terms: benefit / loss per
beneficiary in the ratio of £1 cost to run the service provided - Rely on actual information wherever possible, and prudent assumptions and
forecasts where necessary - Apply control factors (based on experience wherever possible) to compensate
for other dynamics (might be positive or negative); at an organisational level and, in this instance, further overlaid at a City-wide level
2.5. Input-output modelling The methodology on which the template is based is an input-output approach for modelling impact. (See Appendix E for a discussion and justification for using this particular approach.) In turn this approach uses an input-output table to assess the impact of increased demand (in this case resulting from financial inclusion interventions) on an economy. An input-output table is a transaction table which
6
shows purchases (input) and sales (output) by sector within a regional or local economy in a given year.
The input-output modelling is conducted in three stages. In stage one we quantified the income per beneficiary resulting from the financial inclusion intervention (advice, credit etc). In stage two, using data from the 2005-2006 Family and Resources Survey (FRS) for the lowest income decile we estimated how the households would spend this increased expenditure (i.e. % spent on clothing and footwear, fuel, transport etc). With the exception of non-consumption expenditure (i.e. savings, investments and housing related spending), we assume that residents of Leeds spend all their income within the city and that inward commuters spend all their income where they reside (i.e. outside of Leeds). This is not a realistic assumption as residents of Leeds may go shopping outside of the city and as inward commuters may spend part of their income in Leeds. However, in absence of a viable method of collecting accurate data on proportion of income spent locally, this was deemed the best approach. We assume that all the beneficiaries of the Leeds MAP agencies live locally as this is part of the eligibility criteria of accessing advisory services through Leeds MAP and the Welfare Rights Unit. For Leeds City Credit Union, which common bond dictates that members must work or live in Leeds, we assume as with the overall economically active population that 16% commute into Leeds.1
The fact that inward commuters decrease the income spent in the city is reflected in the calculation of the income per beneficiary resulting from the financial inclusion intervention for the relevant financial inclusion interventions. (The increased income per beneficiary is multiplied by 0.84)
In stage three, once the increased income, discounting inward commuters, has been calculated and allocated by sector according to the FRS 2005-2006, we used the input-output table for the Yorkshire and Humber region to see the distribution of spending by sector on the other industries (e.g. if £10 is spent on agriculture, how much does this sector spend on rubber and plastics, and banking and insurance, and in turn how much does rubber and plastics spend on banking and insurance etc). We have developed a simplified set of equations estimating the percentages of spending by sector. For example, from the input-output table for Yorkshire and Humber we can see that Agriculture, Forestry and Fishing purchases 2% of inputs from Chemicals. Simplified electronic multiplier software has been developed to assist Leeds City Council and other stakeholders in calculating the regeneration impact of their financial inclusion interventions.
1 According to the 2001 Census, the net inward commuting rate for Leeds was 55,300. In 2001 the total economically active population was 342,706 and the population as a whole was 520,479.
7
3. The costs and benefits of financial inclusion interventions in Leeds
3.1. Introduction This chapter details the operating costs of the financial inclusion interventions under study and quantifies the benefits for users and clients of the different programmes. The estimates on benefits presented in this chapter will be used in the input-output modelling in Chapter 4 to assess the impact of financial inclusion interventions on the economy of Leeds. Similarly the costs detailed in this chapter will allow us to estimate the economic benefit generated by each pound invested in financial inclusion activities in Leeds. We draw on both the survey of users and management performance data provided by the financial inclusion service providers.
The remainder of this chapter is structured as follows. The first section details the results of the client survey. The following sections present the costs and benefits, drawing on the survey and management information, for each of the financial inclusion service providers, which are listed alphabetically. Finally we provide data on the overall costs and benefits of the interventions.
3.2. Survey results This section presents the findings of a survey of clients who have received financial support and to assess the impact this intervention had. The survey looked at whether, in what way and how much service users were better off as a result of the financial inclusion intervention in question. Please note that this section only presents the main findings. The full results are presented in a separate report.
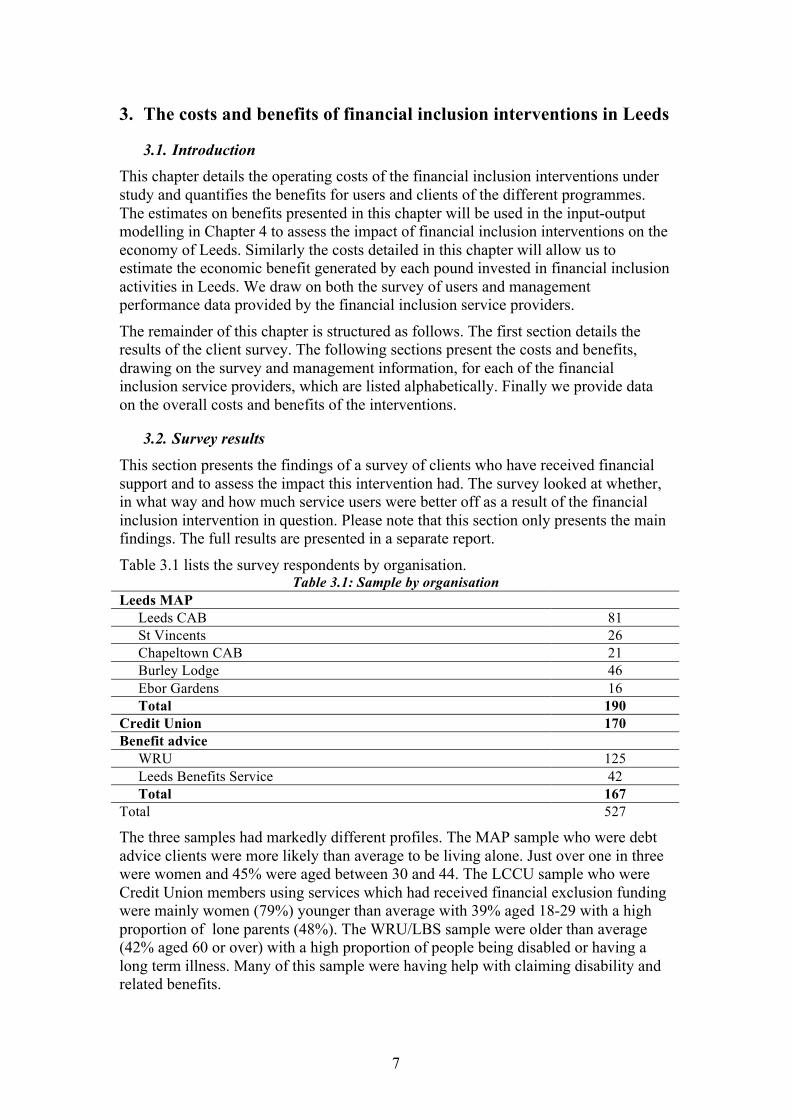
Table 3.1 lists the survey respondents by organisation. Table 3.1: Sample by organisation
Leeds MAP Leeds CAB 81 St Vincents 26 Chapeltown CAB 21 Burley Lodge 46 Ebor Gardens 16 Total 190
Credit Union 170 Benefit advice
WRU 125 Leeds Benefits Service 42 Total 167
Total 527
The three samples had markedly different profiles. The MAP sample who were debt advice clients were more likely than average to be living alone. Just over one in three were women and 45% were aged between 30 and 44. The LCCU sample who were Credit Union members using services which had received financial exclusion funding were mainly women (79%) younger than average with 39% aged 18-29 with a high proportion of lone parents (48%). The WRU/LBS sample were older than average (42% aged 60 or over) with a high proportion of people being disabled or having a long term illness. Many of this sample were having help with claiming disability and related benefits.
8
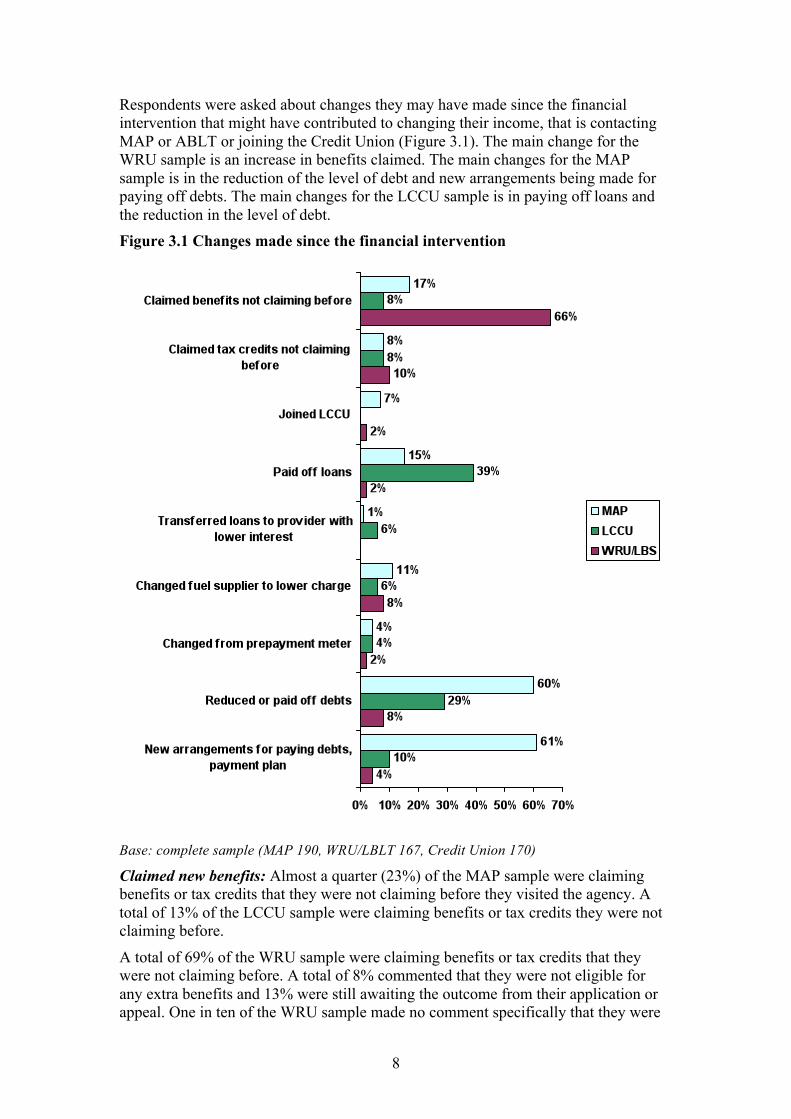
Respondents were asked about changes they may have made since the financial intervention that might have contributed to changing their income, that is contacting MAP or ABLT or joining the Credit Union (Figure 3.1). The main change for the WRU sample is an increase in benefits claimed. The main changes for the MAP sample is in the reduction of the level of debt and new arrangements being made for paying off debts. The main changes for the LCCU sample is in paying off loans and the reduction in the level of debt. Figure 3.1 Changes made since the financial intervention
Base: complete sample (MAP 190, WRU/LBLT 167, Credit Union 170)
Claimed new benefits: Almost a quarter (23%) of the MAP sample were claiming benefits or tax credits that they were not claiming before they visited the agency. A total of 13% of the LCCU sample were claiming benefits or tax credits they were not claiming before.
A total of 69% of the WRU sample were claiming benefits or tax credits that they were not claiming before. A total of 8% commented that they were not eligible for any extra benefits and 13% were still awaiting the outcome from their application or appeal. One in ten of the WRU sample made no comment specifically that they were
9
still waiting to hear or were not eligible but it is likely that these respondents were people who had reapplied for benefits, often where the application forms are complex, so they carried on claiming the benefits they had before. Of those who had contacted the WRU, 73% were claiming additional benefits or tax credits compared with 60% of those contacting the ABLT (but the ABTL sample size was small).
Joined Leeds City Credit Union: 7% of the CAB sample and 2% of the WRU/LBS sample said they had joined the Credit Union since contacting these organisations.
Paid off loans: Overall, 15% of the CAB sample and 39% of the LCCU sample had paid off loans since seeking advice or joining the Credit Union.
Transferred loans to a provider with a lower interest rate: A total of 1% of the MAP sample and 6% of the Credit Union sample said they had transferred loans to a provided with a lower interest rate. It is possible that the true figure is higher than this because a number of LCCU respondents appear to have a loan from the Credit Union now and previously had loans from other companies. They may have used the Credit Union loan to pay off other loans but not considered this as transferring loan to another provider Changed fuel supplier to one with a lower charge: Relatively few respondents had changed their fuel supplier to one with a lower charge since contacting the agency or joining the Credit Union, ranging from 11% of CAB respondents to 8% of WRU/LBS respondents and 6% of LCCU respondents. Changed from a prepayment meter: Only small numbers of the survey respondents (4% MAP, 4% LCCU and 3% WRU/LBL) had changed from a prepayment meter to an alternative payment plan.
Reduced or paid off debts: Three in five of the MAP sample (60%) has reduced or paid off debts since receiving advice. Just over a quarter (29%) of LCCU respondents (just over half of those with debts). A total of 2% of the WRU/LBS sample had paid off debts but very few of this sample had any debts.
Made new arrangements for paying off debts or set up a payment plan: A total of 61% of the MAP sample had made such arrangements as had 10% of the LCCU sample and 4% of the ABLT sample. Some of the LCCU sample who had reduced their debts said they had just paid it off themselves without any specific arrangement
When asked if their income had changed in any other way, 18% of MAP respondents, 16% of LCCU respondents and 3% of WRU/LBS respondents said that it had. Respondents’ income had changed for a variety of reasons, mainly relating to changing jobs, getting a job or losing a job.
10
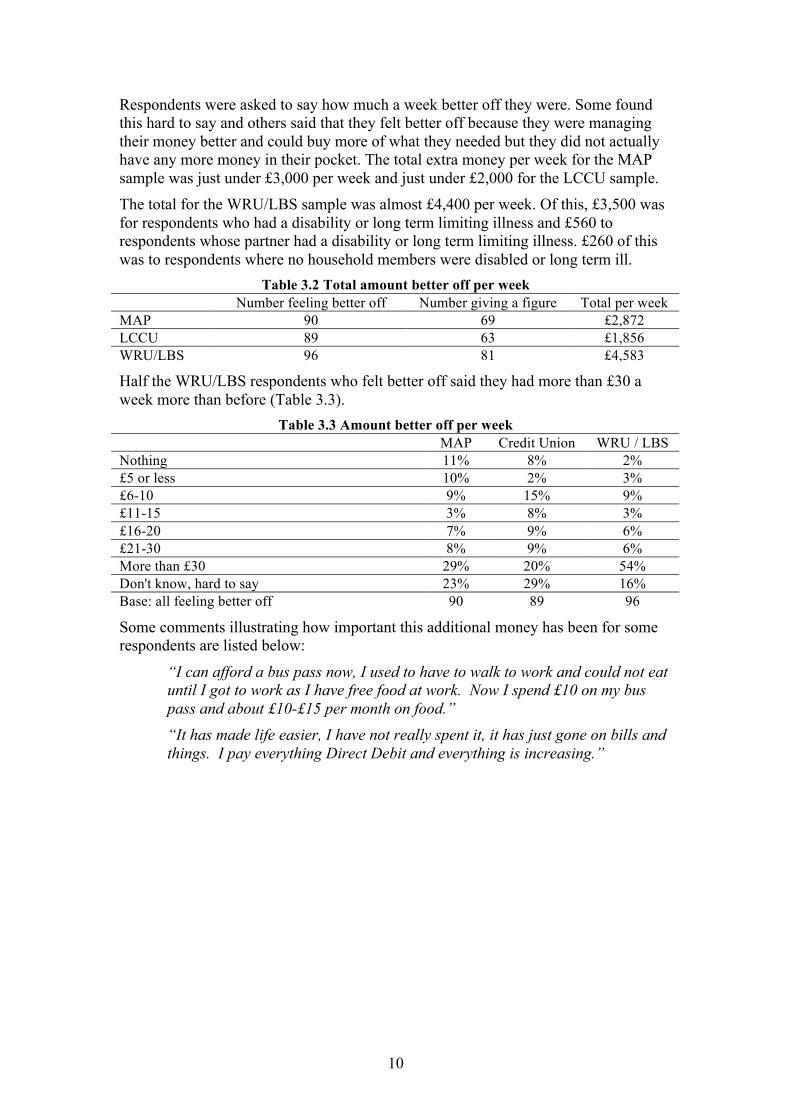
Respondents were asked to say how much a week better off they were. Some found this hard to say and others said that they felt better off because they were managing their money better and could buy more of what they needed but they did not actually have any more money in their pocket. The total extra money per week for the MAP sample was just under £3,000 per week and just under £2,000 for the LCCU sample. The total for the WRU/LBS sample was almost £4,400 per week. Of this, £3,500 was for respondents who had a disability or long term limiting illness and £560 to respondents whose partner had a disability or long term limiting illness. £260 of this was to respondents where no household members were disabled or long term ill.
Table 3.2 Total amount better off per week Number feeling better off Number giving a figure Total per week MAP 90 69 £2,872 LCCU 89 63 £1,856 WRU/LBS 96 81 £4,583
Half the WRU/LBS respondents who felt better off said they had more than £30 a week more than before (Table 3.3).
Table 3.3 Amount better off per week MAP Credit Union WRU / LBS Nothing 11% 8% 2% £5 or less 10% 2% 3% £6-10 9% 15% 9% £11-15 3% 8% 3% £16-20 7% 9% 6% £21-30 8% 9% 6% More than £30 29% 20% 54% Don't know, hard to say 23% 29% 16% Base: all feeling better off 90 89 96
Some comments illustrating how important this additional money has been for some respondents are listed below:
“I can afford a bus pass now, I used to have to walk to work and could not eat until I got to work as I have free food at work. Now I spend £10 on my bus pass and about £10-£15 per month on food.” “It has made life easier, I have not really spent it, it has just gone on bills and things. I pay everything Direct Debit and everything is increasing.”
11
3.3. Business Intervention Model This section presents the results of the Business Intervention Model (BIM). The BIM estimates the increase in disposable income resulting from the financial inclusion interventions and the operating costs of these interventions. We use this data in the input-output modelling in Chapter 4. The BIM calculates costs and benefits by relying on data from a wide range of sources: - The client survey: Where appropriate we use the data from client survey (detailed
in the previous section) to quantify the increase in disposable income. - Performance Management Information: Most of the financial inclusion service
providers collect data on benefit uptake, decreased debt burden, number of clients and other useful information which we use in our calculations.
- Audited accounts: For the costs we have used audited accounts or similar documentation on the operating costs.
- Selected random sample: Where data has been unavailable we have in some cases asked for aggregate data from a random selection of clients.
- Estimation: In some cases, when we have not had data, we have had to make estimates.
Most of the data provided by the organisations is for the financial years of 2007 and 2008. We use more up-to-date where available and older data when necessary. In addition, with two providers (East North East Homes Leeds and Leeds MAP – NHS funded) we were unable to check all of the information provided and though included we have indicated that these BIMs are unverified. This does not necessarily mean the figures are inaccurate only that we were unable to cross-reference the figures to the standard achieved on the verified BIMs.
12
3.3.1. ABLT The Advice and Benefits Liaison Team (ABLT) is part of Leeds City Council’s Revenues and Benefits Service. It has three core areas of work; - Undertaking Housing Benefit and Council Tax Benefit intervention visits - the
main aim of this is to ensure that claimants’ Housing benefit and Council Tax Benefit entitlement is accurate.
- Undertaking Fairer Charging assessments on behalf of the Authority’s Adult Service department - this is to undertake a financial assessment on the ability of the customer to meet the cost of a domiciliary care package provided by the authority;
- Responsibility for the delivery of the Revenues and Benefits Service Take Up strategy in respect of tackling financial exclusion working in partnership with the Pension Service to maximise the income of all current benefit recipients and to identify those not claiming the benefits to which they are entitled.
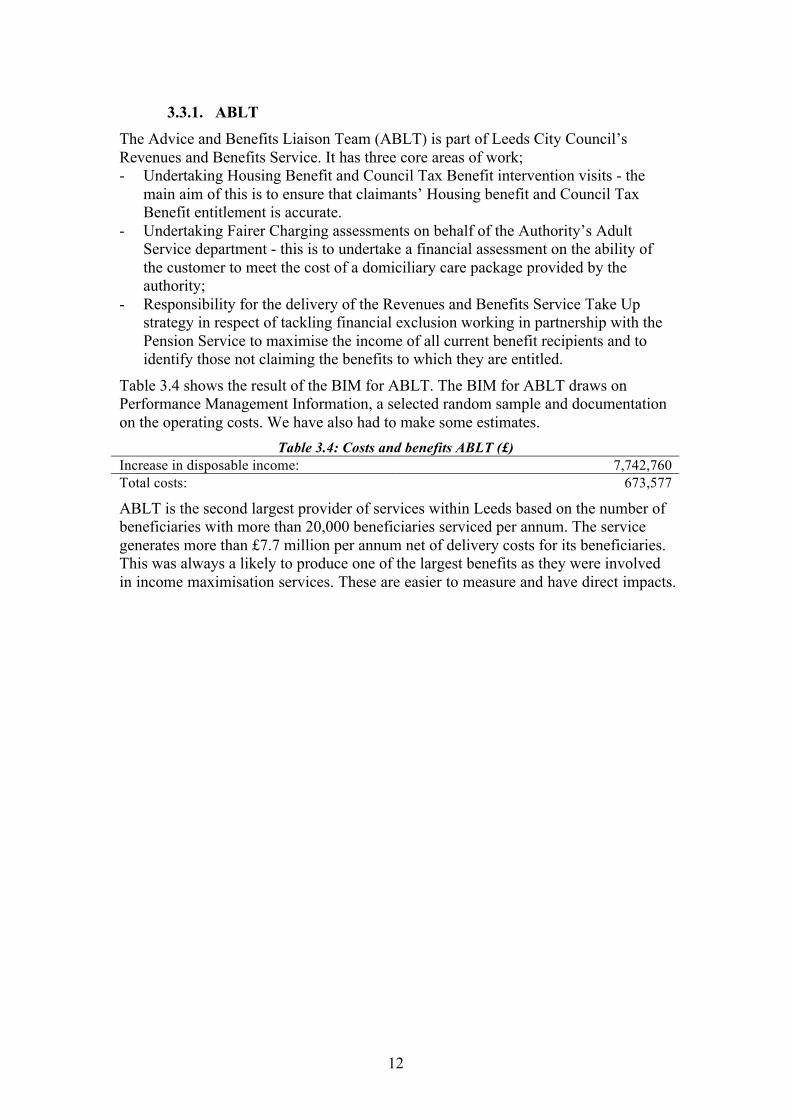
Table 3.4 shows the result of the BIM for ABLT. The BIM for ABLT draws on Performance Management Information, a selected random sample and documentation on the operating costs. We have also had to make some estimates.
Table 3.4: Costs and benefits ABLT (£) Increase in disposable income: 7,742,760 Total costs: 673,577
ABLT is the second largest provider of services within Leeds based on the number of beneficiaries with more than 20,000 beneficiaries serviced per annum. The service generates more than £7.7 million per annum net of delivery costs for its beneficiaries. This was always a likely to produce one of the largest benefits as they were involved in income maximisation services. These are easier to measure and have direct impacts.
13
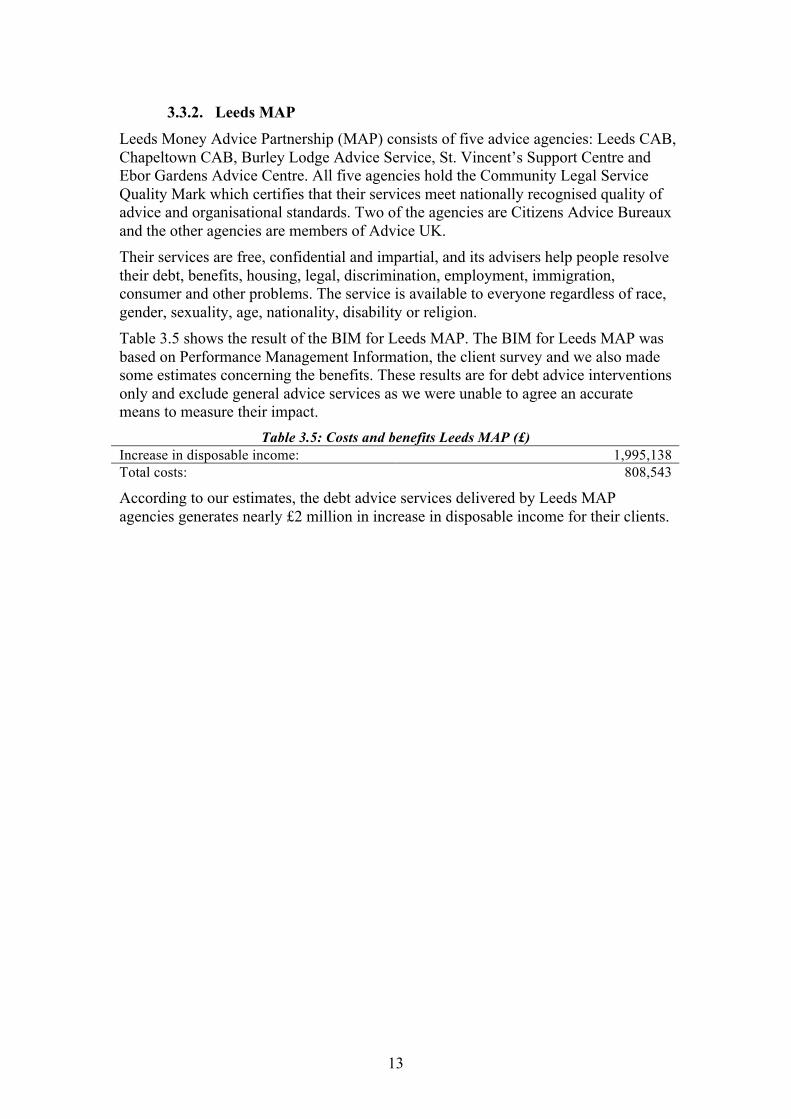
3.3.2. Leeds MAP Leeds Money Advice Partnership (MAP) consists of five advice agencies: Leeds CAB, Chapeltown CAB, Burley Lodge Advice Service, St. Vincent’s Support Centre and Ebor Gardens Advice Centre. All five agencies hold the Community Legal Service Quality Mark which certifies that their services meet nationally recognised quality of advice and organisational standards. Two of the agencies are Citizens Advice Bureaux and the other agencies are members of Advice UK. Their services are free, confidential and impartial, and its advisers help people resolve their debt, benefits, housing, legal, discrimination, employment, immigration, consumer and other problems. The service is available to everyone regardless of race, gender, sexuality, age, nationality, disability or religion. Table 3.5 shows the result of the BIM for Leeds MAP. The BIM for Leeds MAP was based on Performance Management Information, the client survey and we also made some estimates concerning the benefits. These results are for debt advice interventions only and exclude general advice services as we were unable to agree an accurate means to measure their impact.
Table 3.5: Costs and benefits Leeds MAP (£) Increase in disposable income: 1,995,138 Total costs: 808,543
According to our estimates, the debt advice services delivered by Leeds MAP agencies generates nearly £2 million in increase in disposable income for their clients.
14
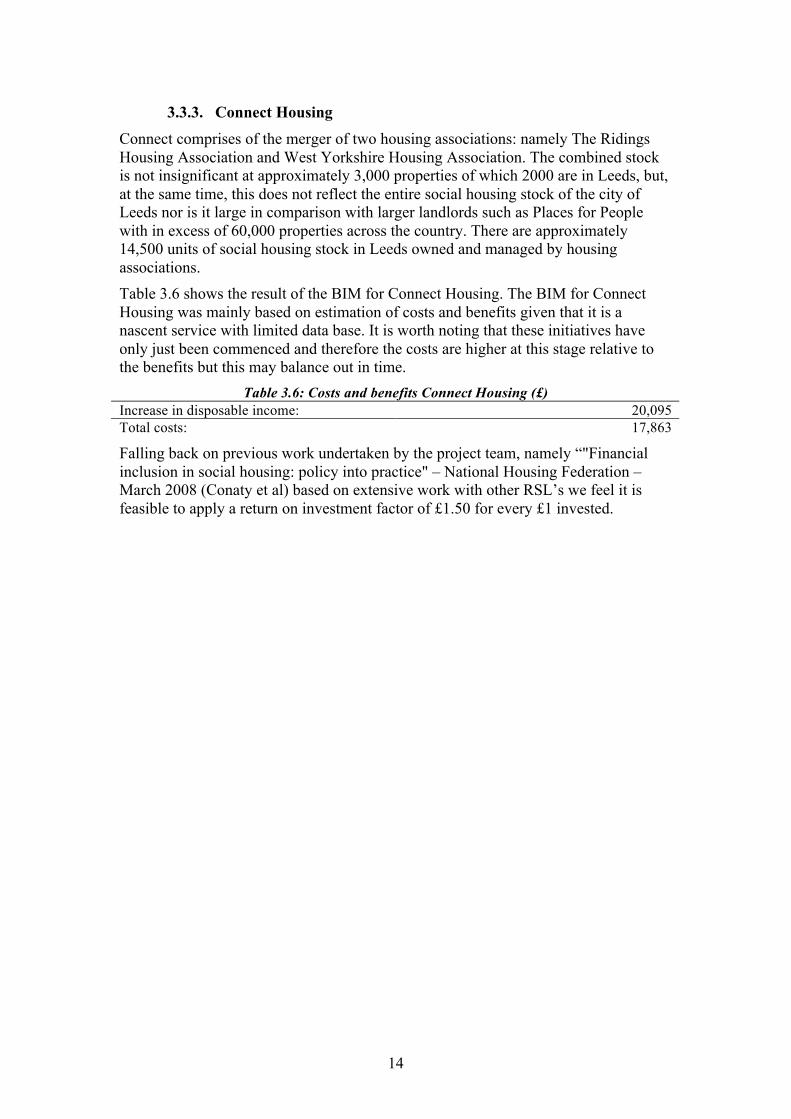
3.3.3. Connect Housing Connect comprises of the merger of two housing associations: namely The Ridings Housing Association and West Yorkshire Housing Association. The combined stock is not insignificant at approximately 3,000 properties of which 2000 are in Leeds, but, at the same time, this does not reflect the entire social housing stock of the city of Leeds nor is it large in comparison with larger landlords such as Places for People with in excess of 60,000 properties across the country. There are approximately 14,500 units of social housing stock in Leeds owned and managed by housing associations. Table 3.6 shows the result of the BIM for Connect Housing. The BIM for Connect Housing was mainly based on estimation of costs and benefits given that it is a nascent service with limited data base. It is worth noting that these initiatives have only just been commenced and therefore the costs are higher at this stage relative to the benefits but this may balance out in time.
Table 3.6: Costs and benefits Connect Housing (£) Increase in disposable income: 20,095 Total costs: 17,863
Falling back on previous work undertaken by the project team, namely “"Financial inclusion in social housing: policy into practice" – National Housing Federation – March 2008 (Conaty et al) based on extensive work with other RSL’s we feel it is feasible to apply a return on investment factor of £1.50 for every £1 invested.
15
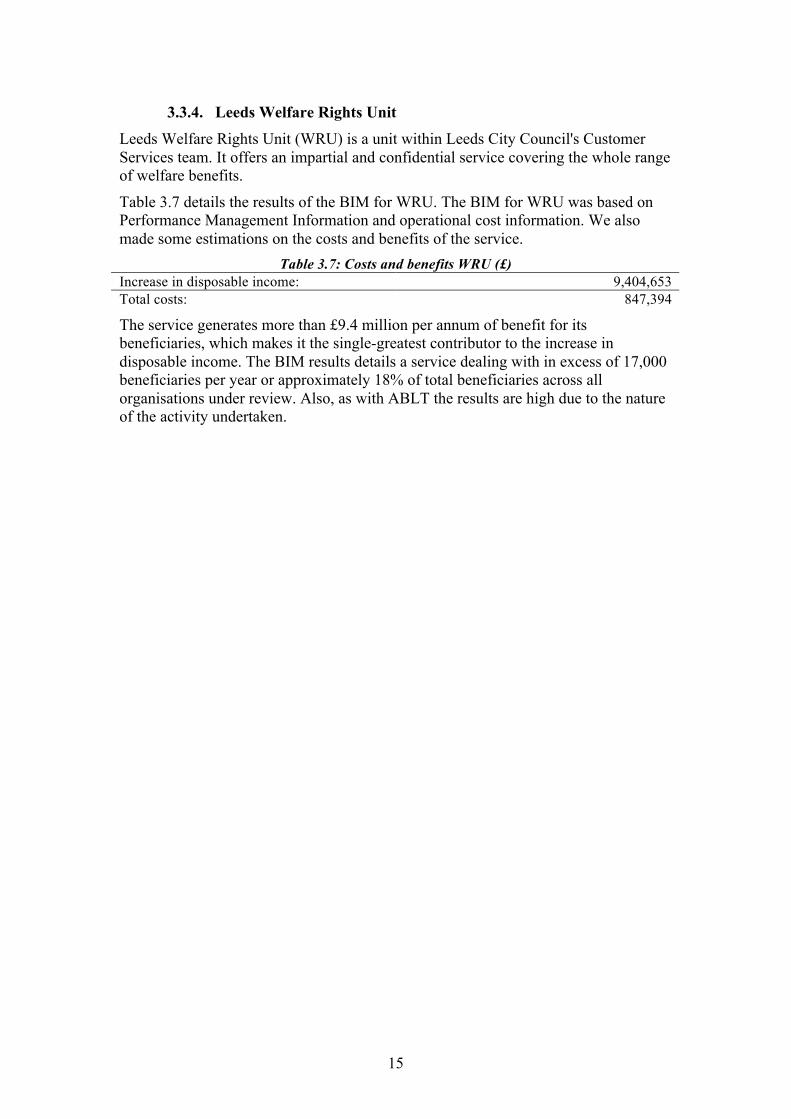
3.3.4. Leeds Welfare Rights Unit Leeds Welfare Rights Unit (WRU) is a unit within Leeds City Council's Customer Services team. It offers an impartial and confidential service covering the whole range of welfare benefits.
Table 3.7 details the results of the BIM for WRU. The BIM for WRU was based on Performance Management Information and operational cost information. We also made some estimations on the costs and benefits of the service.
Table 3.7: Costs and benefits WRU (£) Increase in disposable income: 9,404,653 Total costs: 847,394
The service generates more than £9.4 million per annum of benefit for its beneficiaries, which makes it the single-greatest contributor to the increase in disposable income. The BIM results details a service dealing with in excess of 17,000 beneficiaries per year or approximately 18% of total beneficiaries across all organisations under review. Also, as with ABLT the results are high due to the nature of the activity undertaken.
16
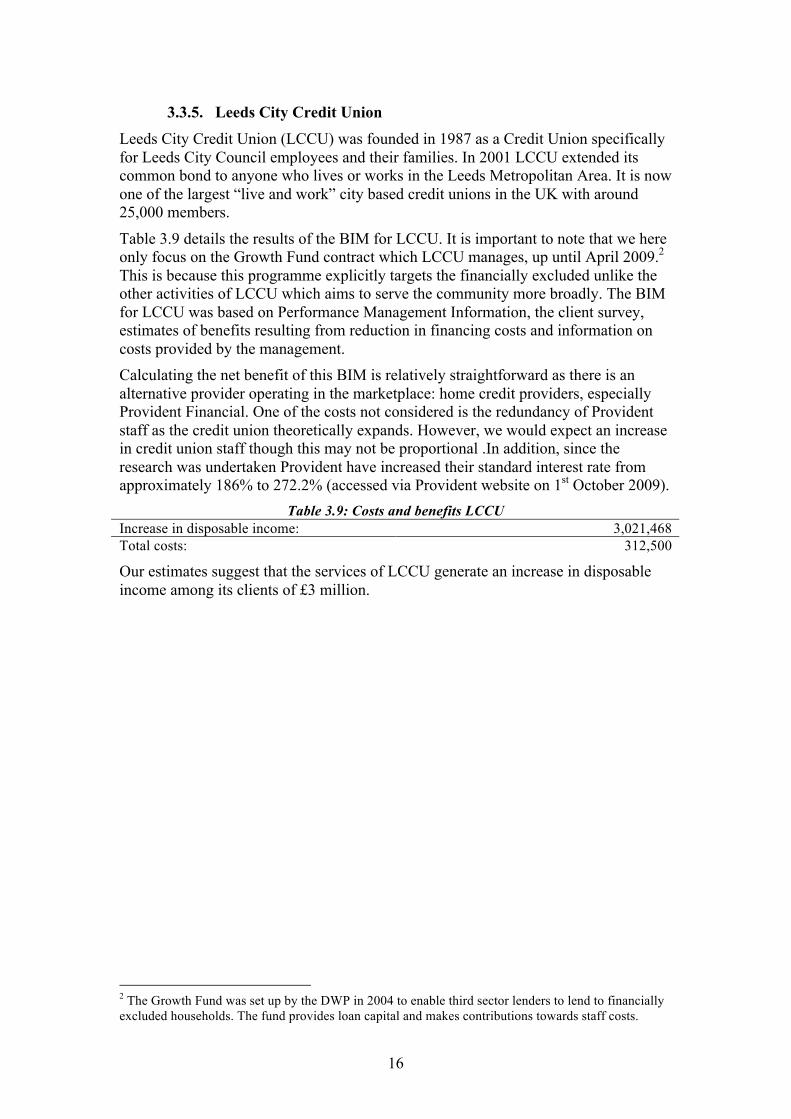
3.3.5. Leeds City Credit Union Leeds City Credit Union (LCCU) was founded in 1987 as a Credit Union specifically for Leeds City Council employees and their families. In 2001 LCCU extended its common bond to anyone who lives or works in the Leeds Metropolitan Area. It is now one of the largest “live and work” city based credit unions in the UK with around 25,000 members.
Table 3.9 details the results of the BIM for LCCU. It is important to note that we here only focus on the Growth Fund contract which LCCU manages, up until April 2009.2 This is because this programme explicitly targets the financially excluded unlike the other activities of LCCU which aims to serve the community more broadly. The BIM for LCCU was based on Performance Management Information, the client survey, estimates of benefits resulting from reduction in financing costs and information on costs provided by the management. Calculating the net benefit of this BIM is relatively straightforward as there is an alternative provider operating in the marketplace: home credit providers, especially Provident Financial. One of the costs not considered is the redundancy of Provident staff as the credit union theoretically expands. However, we would expect an increase in credit union staff though this may not be proportional .In addition, since the research was undertaken Provident have increased their standard interest rate from approximately 186% to 272.2% (accessed via Provident website on 1st October 2009).
Table 3.9: Costs and benefits LCCU Increase in disposable income: 3,021,468 Total costs: 312,500
Our estimates suggest that the services of LCCU generate an increase in disposable income among its clients of £3 million.
2 The Growth Fund was set up by the DWP in 2004 to enable third sector lenders to lend to financially excluded households. The fund provides loan capital and makes contributions towards staff costs.
17
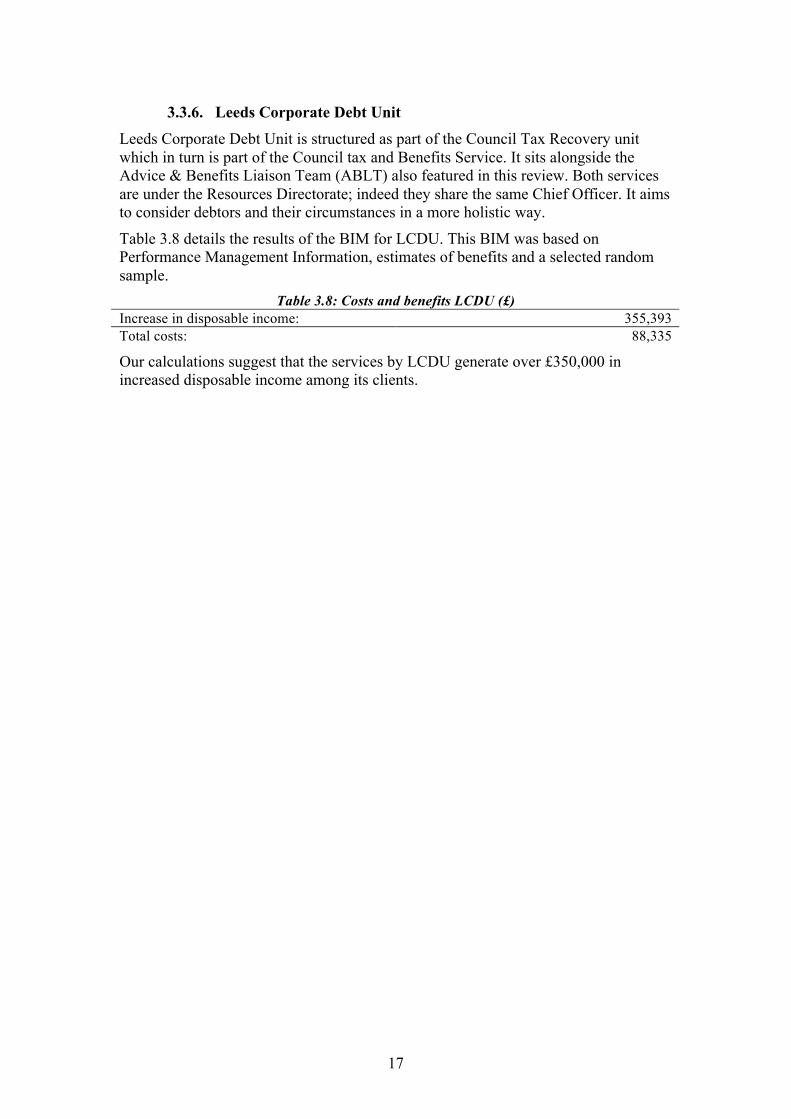
3.3.6. Leeds Corporate Debt Unit Leeds Corporate Debt Unit is structured as part of the Council Tax Recovery unit which in turn is part of the Council tax and Benefits Service. It sits alongside the Advice & Benefits Liaison Team (ABLT) also featured in this review. Both services are under the Resources Directorate; indeed they share the same Chief Officer. It aims to consider debtors and their circumstances in a more holistic way.
Table 3.8 details the results of the BIM for LCDU. This BIM was based on Performance Management Information, estimates of benefits and a selected random sample.
Table 3.8: Costs and benefits LCDU (£) Increase in disposable income: 355,393 Total costs: 88,335
Our calculations suggest that the services by LCDU generate over £350,000 in increased disposable income among its clients.
18
3.3.7. npower npower is a major UK gas and electricity supplier. Its main tool in helping address fuel poverty is its “Spreading Warmth” Social Tariff. This initiative was started in July 2008 and was in response to Government intervention designed at raising the issue of fuel poverty with all power providers. It would seem that, in the early stages, the programme attracted approximately 16,000 customers per month. Access to the tariff is effectively rationed by use of criteria designed to ensure that support is targeted at those in most need.
To put the scale of Social Tariff penetration into context, npower has approximately 6m-7m accounts covering both the electricity and gas markets spread across a customer base of 6m customers (inclusive of Social Tariff). Hence, Social tariff accounts for approximately 1.7% of its customer base.
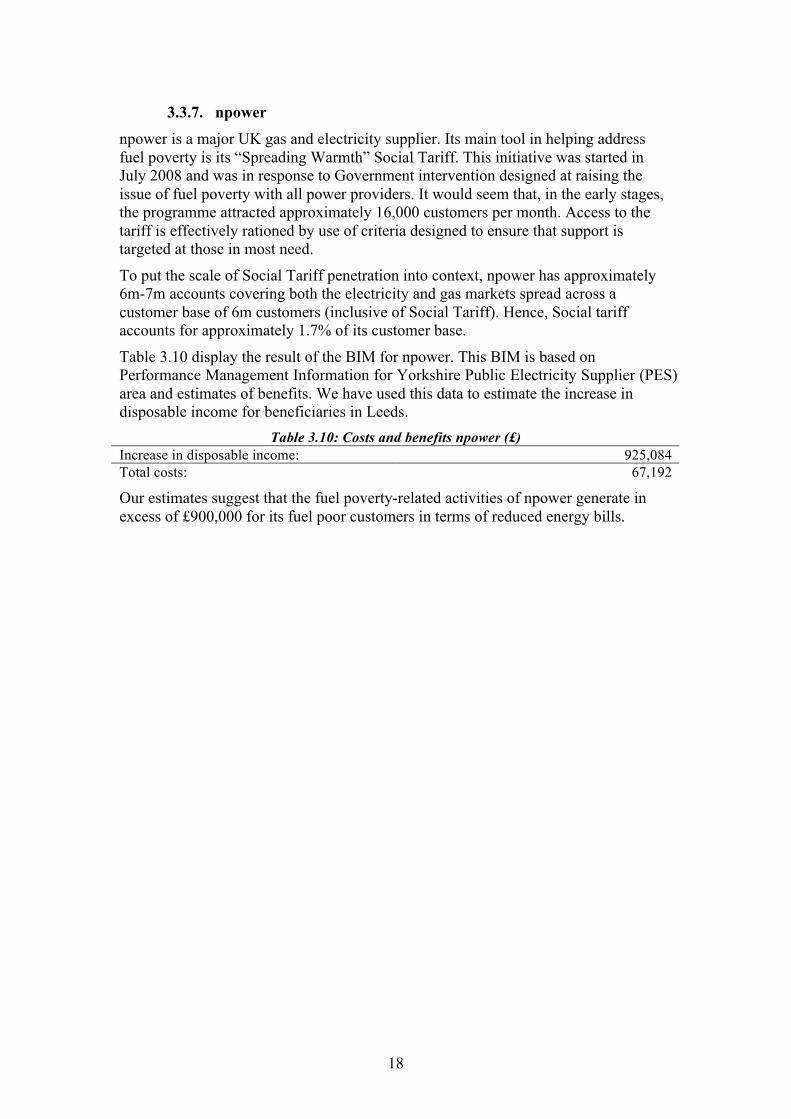
Table 3.10 display the result of the BIM for npower. This BIM is based on Performance Management Information for Yorkshire Public Electricity Supplier (PES) area and estimates of benefits. We have used this data to estimate the increase in disposable income for beneficiaries in Leeds.
Table 3.10: Costs and benefits npower (£) Increase in disposable income: 925,084 Total costs: 67,192
Our estimates suggest that the fuel poverty-related activities of npower generate in excess of £900,000 for its fuel poor customers in terms of reduced energy bills.
19
3.3.8. East North East Homes Leeds (unverified) East North East Homes Leeds (ENEHL) is an Arms-Length Management Organisation (ALMO) managing and maintaining a range of homes across east and north east Leeds. ENEHL is one of three ALMO’s in Leeds which together manage the Councils housing stock of 60,000. ENEHL manages a housing stock of 20,000 properties across 12 wards in Leeds (out of a total of 33 wards).
ENEHL has a wide range of financial inclusion interventions, including: - Affordable credit: ENEHL facilitates tenant access to affordable credit and
savings through promoting and supporting LCCU. It supported the set-up of a branch in Halton Moor by providing premises and covering staff costs over a two-year period. ENEHL management believes that this has had a noticeable and positive impact on rent arrears among their tenants.
- Corporate debt policy procedures: ENEHL seeks to identify tenants with multiple debts owed to Leeds City Council and makes arrangements to reduce all debts.
- New tenancy support: ENEHL seeks to support new tenants by signposting tenants to cheap furniture shops and distributing “the cost of running a home” booklet among other initiatives.
- Fuel poverty: ENEHL has numerous initiatives to combat fuel poverty. All tenants of 75 years of age and older are visited by ENEHL staff to conduct fuel health checks. Recently automatic identification of the cheapest fuel tariff (prepayment meter and direct debit) for the property in question has been introduced for new tenants. New tenancies are automatically connected to the cheapest provider at the time unless the tenant chooses to opt out.
However, in this case study we focus on the in-house benefit advisory team within ENEHL. This is in part because the costs and benefits of this service are well documented and in part because we already cover the activities by LCCU separately. The programme was set up in 2007 and it employs seven in-house full-time benefit advisors
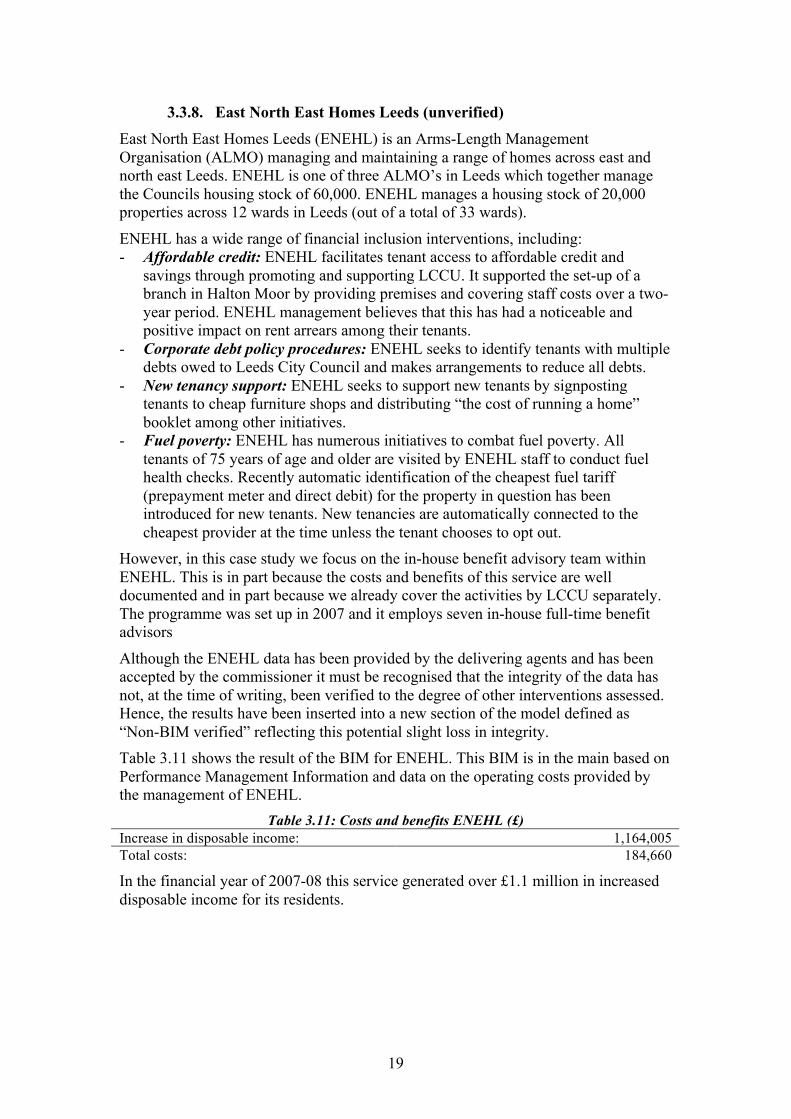
Although the ENEHL data has been provided by the delivering agents and has been accepted by the commissioner it must be recognised that the integrity of the data has not, at the time of writing, been verified to the degree of other interventions assessed. Hence, the results have been inserted into a new section of the model defined as “Non-BIM verified” reflecting this potential slight loss in integrity. Table 3.11 shows the result of the BIM for ENEHL. This BIM is in the main based on Performance Management Information and data on the operating costs provided by the management of ENEHL.
Table 3.11: Costs and benefits ENEHL (£) Increase in disposable income: 1,164,005 Total costs: 184,660
In the financial year of 2007-08 this service generated over £1.1 million in increased disposable income for its residents.
20
3.3.9. Leeds CAB and Chapletown CAB (NHS funded provision) Since 2002, the Primary Care Trusts in Leeds (as of 2006, a Leeds-wide Primary Care Trust, now known as NHS Leeds) have invested in welfare advice outreach sessions in primary and mental health care settings.
The NHS Leeds Public Health Directorate commissions three agencies to provide welfare advice in Primary Care Settings: Leeds CAB, Chapeltown CAB and the Welfare Rights Unit. The three providers offer a total of 20 outreach sessions in GP surgeries and Health Centres/Clinics, primarily in the Inner City areas of Leeds. The financial gains for this work carried out by the Welfare Rights Unit is included within the data shown at 3.3.4.
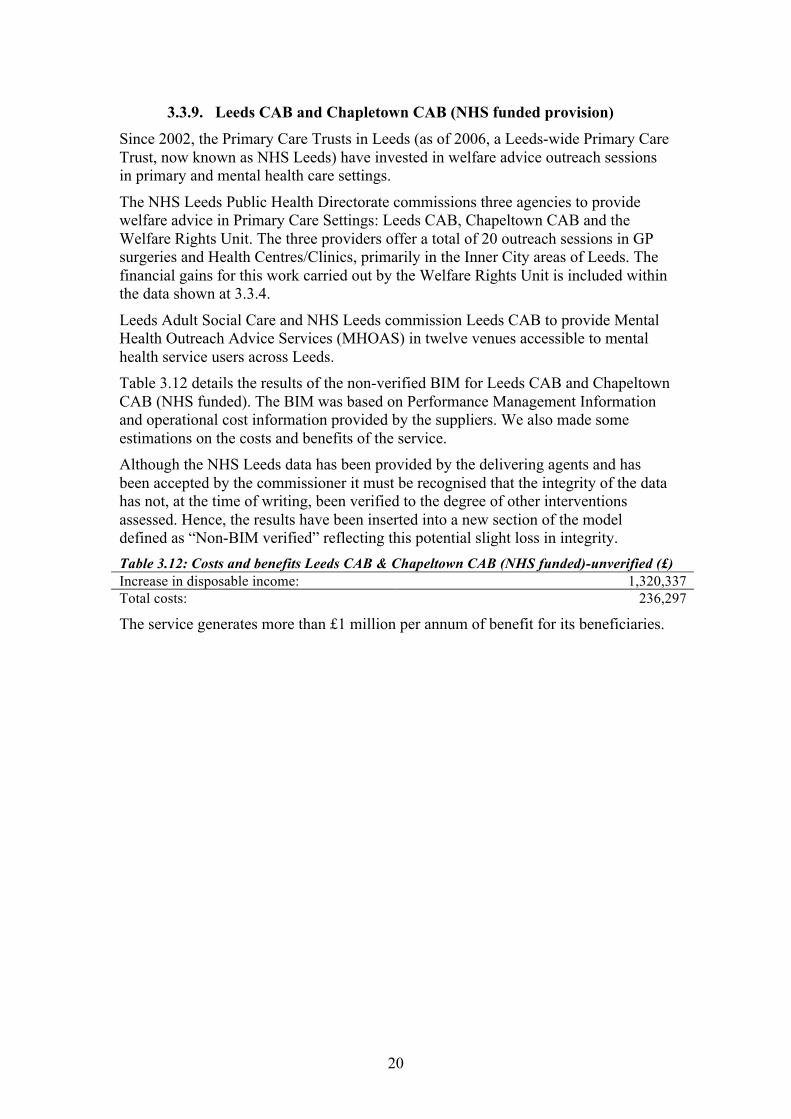
Leeds Adult Social Care and NHS Leeds commission Leeds CAB to provide Mental Health Outreach Advice Services (MHOAS) in twelve venues accessible to mental health service users across Leeds. Table 3.12 details the results of the non-verified BIM for Leeds CAB and Chapeltown CAB (NHS funded). The BIM was based on Performance Management Information and operational cost information provided by the suppliers. We also made some estimations on the costs and benefits of the service. Although the NHS Leeds data has been provided by the delivering agents and has been accepted by the commissioner it must be recognised that the integrity of the data has not, at the time of writing, been verified to the degree of other interventions assessed. Hence, the results have been inserted into a new section of the model defined as “Non-BIM verified” reflecting this potential slight loss in integrity. Table 3.12: Costs and benefits Leeds CAB & Chapeltown CAB (NHS funded)-unverified (£) Increase in disposable income: 1,320,337 Total costs: 236,297
The service generates more than £1 million per annum of benefit for its beneficiaries.
21
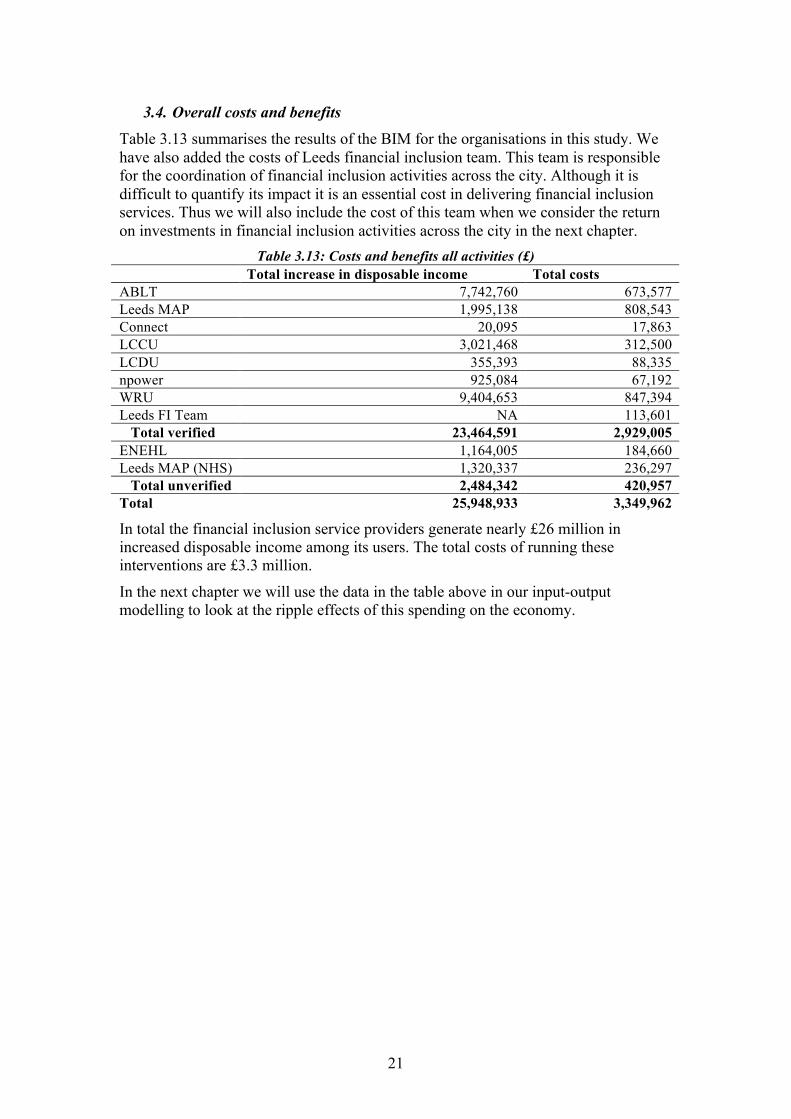
3.4. Overall costs and benefits Table 3.13 summarises the results of the BIM for the organisations in this study. We have also added the costs of Leeds financial inclusion team. This team is responsible for the coordination of financial inclusion activities across the city. Although it is difficult to quantify its impact it is an essential cost in delivering financial inclusion services. Thus we will also include the cost of this team when we consider the return on investments in financial inclusion activities across the city in the next chapter.
Table 3.13: Costs and benefits all activities (£) Total increase in disposable income Total costs ABLT 7,742,760 673,577 Leeds MAP 1,995,138 808,543 Connect 20,095 17,863 LCCU 3,021,468 312,500 LCDU 355,393 88,335 npower 925,084 67,192 WRU 9,404,653 847,394 Leeds FI Team NA 113,601
Total verified 23,464,591 2,929,005 ENEHL 1,164,005 184,660 Leeds MAP (NHS) 1,320,337 236,297
Total unverified 2,484,342 420,957 Total 25,948,933 3,349,962
In total the financial inclusion service providers generate nearly £26 million in increased disposable income among its users. The total costs of running these interventions are £3.3 million.
In the next chapter we will use the data in the table above in our input-output modelling to look at the ripple effects of this spending on the economy.
22
3.5. Discussing the Business Intervention Model Given the innovative nature of the exercise that some assumptions have been made; however, wherever possible we have tried to minimise or omit these. In addition, as can be seen in the BIM Summary Appendix B we have distinguished between those activities we measured (verified) and those where we were reliant on the service provider for information (non-verification). Therefore we are confident that 51,232 beneficiaries received a net return of £20.667 million, while another 3118 we accept received over £2 million. Furthermore, we estimated that taken together the verified and non-verified results represent approximately 90% of financial inclusion interventions in the city3, though we have assumed, to reduce the weighting of this proportion, that these additional services are likely to be less efficient and have less benefit to users than the larger services reviewed.
In addition to downward estimating non-surveyed providers we also omitted a number of potential and latent measures, mainly because we were unable to arrive at a reliable financial conclusion. For example, the figures represent the activity in one year’s service and while we aggressively discounted for benefits received in the second and third, we took no account of longer-term or related benefits. Thus, if a provider has one customer per year, the BIM assumes that in the year under examination the new customer will receive the most value, while the clients from the previous two years will receive a proportionally lower return.
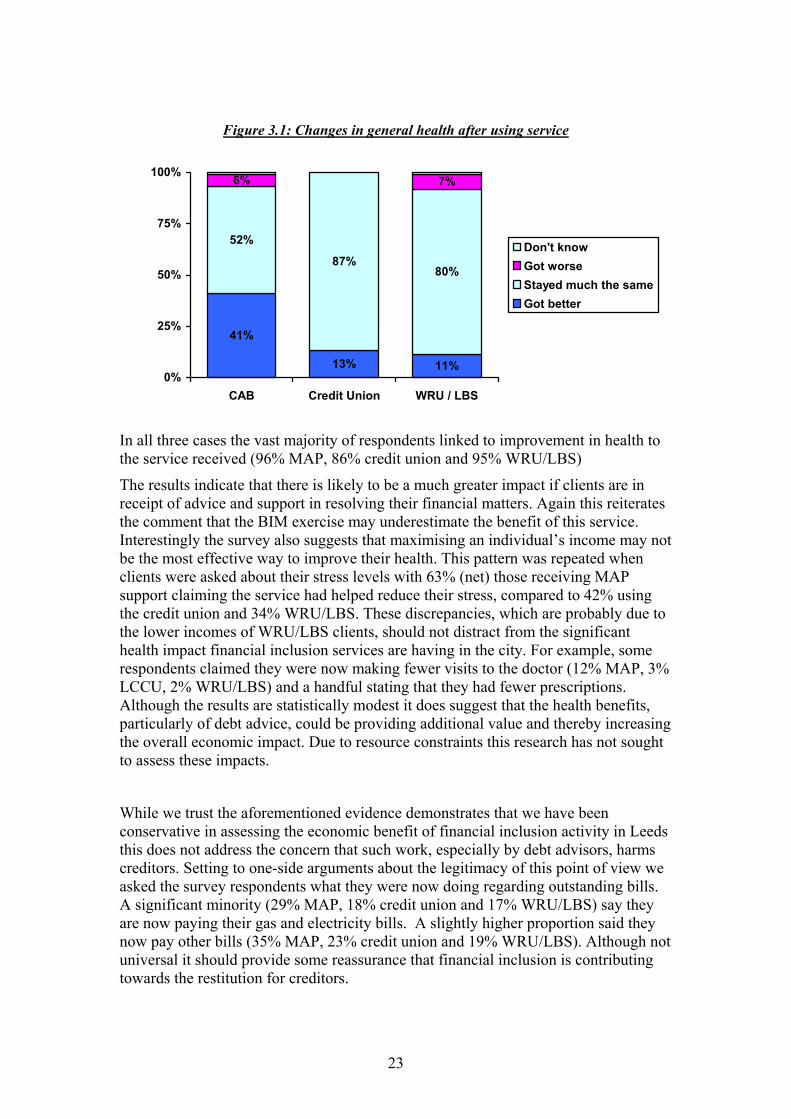
There are two other areas where we have erred on the side of caution to avoid over-inflating the final result: the benefit accrued through the work of general advisors at the Leeds MAP agencies and health related advantages. In both cases we found that it was impossible to accurately measure the impact with any degree of confidence within the framework of this project. General advisors provide support on a broad range of topics, much of which probably has a financial effect, but to properly assess this we needed to conduct a large-scale survey of the clients along with a forensic review of their files. In addition, the generalist service is open to all and is not exclusively aimed at the financially excluded. Given the resource constraints we chose to concentrate on provision that was targeted at those most in need. Consequently, the BIM results for Leeds MAP cover only part of the service offered and therefore these agencies total net benefit is likely to be much higher than that presented. Although the BIM includes a non-verified BIM for a service operated in conjunction with the NHS no financial account is taken of the health benefits linked to the financial inclusion activity throughout the city. Moreover, no calculation is made of any other indirect benefit. This is a legitimate area of study for a future piece of work. With regards to health benefits the initial survey did ask a number of health related questions. As can be see in figure 3.1 a significant minority of respondents believe using one of the listed services has improved their general health
3 Figure arrived at after discussions with Leeds City Council
23
Figure 3.1: Changes in general health after using service
41%
13% 11%
52%
87%80%
6% 7%
0%
25%
50%
75%
100%
CAB Credit Union WRU / LBS
Don't knowGot worseStayed much the sameGot better
In all three cases the vast majority of respondents linked to improvement in health to the service received (96% MAP, 86% credit union and 95% WRU/LBS)
The results indicate that there is likely to be a much greater impact if clients are in receipt of advice and support in resolving their financial matters. Again this reiterates the comment that the BIM exercise may underestimate the benefit of this service. Interestingly the survey also suggests that maximising an individual’s income may not be the most effective way to improve their health. This pattern was repeated when clients were asked about their stress levels with 63% (net) those receiving MAP support claiming the service had helped reduce their stress, compared to 42% using the credit union and 34% WRU/LBS. These discrepancies, which are probably due to the lower incomes of WRU/LBS clients, should not distract from the significant health impact financial inclusion services are having in the city. For example, some respondents claimed they were now making fewer visits to the doctor (12% MAP, 3% LCCU, 2% WRU/LBS) and a handful stating that they had fewer prescriptions. Although the results are statistically modest it does suggest that the health benefits, particularly of debt advice, could be providing additional value and thereby increasing the overall economic impact. Due to resource constraints this research has not sought to assess these impacts.
While we trust the aforementioned evidence demonstrates that we have been conservative in assessing the economic benefit of financial inclusion activity in Leeds this does not address the concern that such work, especially by debt advisors, harms creditors. Setting to one-side arguments about the legitimacy of this point of view we asked the survey respondents what they were now doing regarding outstanding bills. A significant minority (29% MAP, 18% credit union and 17% WRU/LBS) say they are now paying their gas and electricity bills. A slightly higher proportion said they now pay other bills (35% MAP, 23% credit union and 19% WRU/LBS). Although not universal it should provide some reassurance that financial inclusion is contributing towards the restitution for creditors.
24
Another criticism of financial inclusion work is that it does not change long-standing behaviour, with the same clients repeating the same mistakes. It is not our place to comment on the sociology of society in which credit can be both extended with minimal oversight, or indeed where users can access money which they have no possibility, or sometimes desire, to repay. Pleasingly, the survey findings found that over half of MAP (55%) and credit union (59%) respondents now found it easier to manage their money, while smaller percentages (16% MAP, 11% WRU/LBS) stated that they now saved a bit, though this rose to 41% among credit union clients.
In summary, we believe the research has produced a prudent assessment of the net benefit of financial inclusion activity in Leeds, while the survey has shown that some of the concerns about this type of support have not fully been borne out. This is not to say that progress made or that financial inclusion services in Leeds are perfect, there is much to improve and the scale of the problem requires further effort, but it does make a demonstrable net economic benefit to the city.
25
4. Economic impact of financial inclusion interventions in Leeds
4.1. Introduction In the previous chapter we detailed the operating costs of the financial inclusion interventions under study and quantified the increase in disposable income for users of the different programmes. We now turn to how the additional increase in disposable income is spent and how this affects the local economy as they spend money on local suppliers and households (labour) who in turn spend part of that income in the local economy.
It is important to note that a distinction is made throughout the chapter between the local (i.e. Leeds) and the regional economy (i.e. the Yorkshire and Humber region). The estimates for the increase in income and expenditure resulting from financial inclusion interventions are for the local economy, in other words, the economy of Leeds. However, the ripple effects of this expenditure across different industries are estimated on a regional level (i.e. for the Yorkshire and Humber region). This is because we rely on an input-output table for Yorkshire and Humber as opposed to one for Leeds.
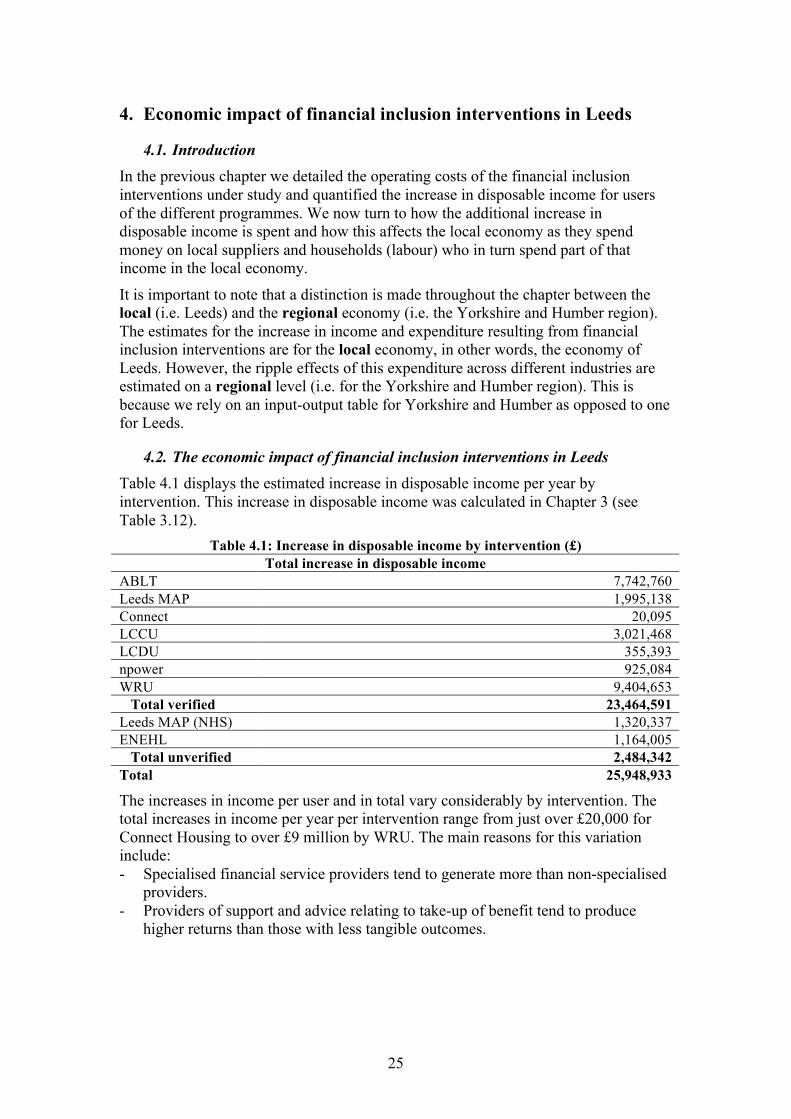
4.2. The economic impact of financial inclusion interventions in Leeds Table 4.1 displays the estimated increase in disposable income per year by intervention. This increase in disposable income was calculated in Chapter 3 (see Table 3.12).
Table 4.1: Increase in disposable income by intervention (£) Total increase in disposable income ABLT 7,742,760 Leeds MAP 1,995,138 Connect 20,095 LCCU 3,021,468 LCDU 355,393 npower 925,084 WRU 9,404,653
Total verified 23,464,591 Leeds MAP (NHS) 1,320,337 ENEHL 1,164,005
Total unverified 2,484,342 Total 25,948,933
The increases in income per user and in total vary considerably by intervention. The total increases in income per year per intervention range from just over £20,000 for Connect Housing to over £9 million by WRU. The main reasons for this variation include: - Specialised financial service providers tend to generate more than non-specialised
providers. - Providers of support and advice relating to take-up of benefit tend to produce
higher returns than those with less tangible outcomes.
26
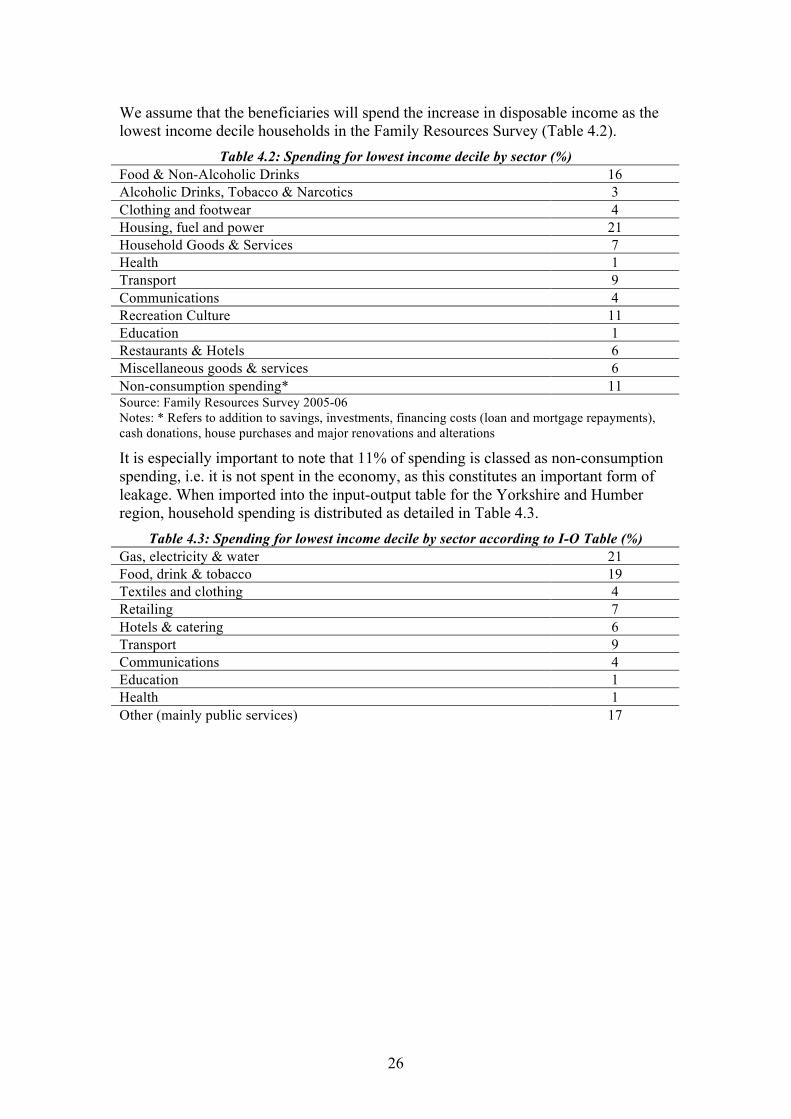
We assume that the beneficiaries will spend the increase in disposable income as the lowest income decile households in the Family Resources Survey (Table 4.2).
Table 4.2: Spending for lowest income decile by sector (%) Food & Non-Alcoholic Drinks 16 Alcoholic Drinks, Tobacco & Narcotics 3 Clothing and footwear 4 Housing, fuel and power 21 Household Goods & Services 7 Health 1 Transport 9 Communications 4 Recreation Culture 11 Education 1 Restaurants & Hotels 6 Miscellaneous goods & services 6 Non-consumption spending* 11 Source: Family Resources Survey 2005-06 Notes: * Refers to addition to savings, investments, financing costs (loan and mortgage repayments), cash donations, house purchases and major renovations and alterations
It is especially important to note that 11% of spending is classed as non-consumption spending, i.e. it is not spent in the economy, as this constitutes an important form of leakage. When imported into the input-output table for the Yorkshire and Humber region, household spending is distributed as detailed in Table 4.3.
Table 4.3: Spending for lowest income decile by sector according to I-O Table (%) Gas, electricity & water 21 Food, drink & tobacco 19 Textiles and clothing 4 Retailing 7 Hotels & catering 6 Transport 9 Communications 4 Education 1 Health 1 Other (mainly public services) 17
27
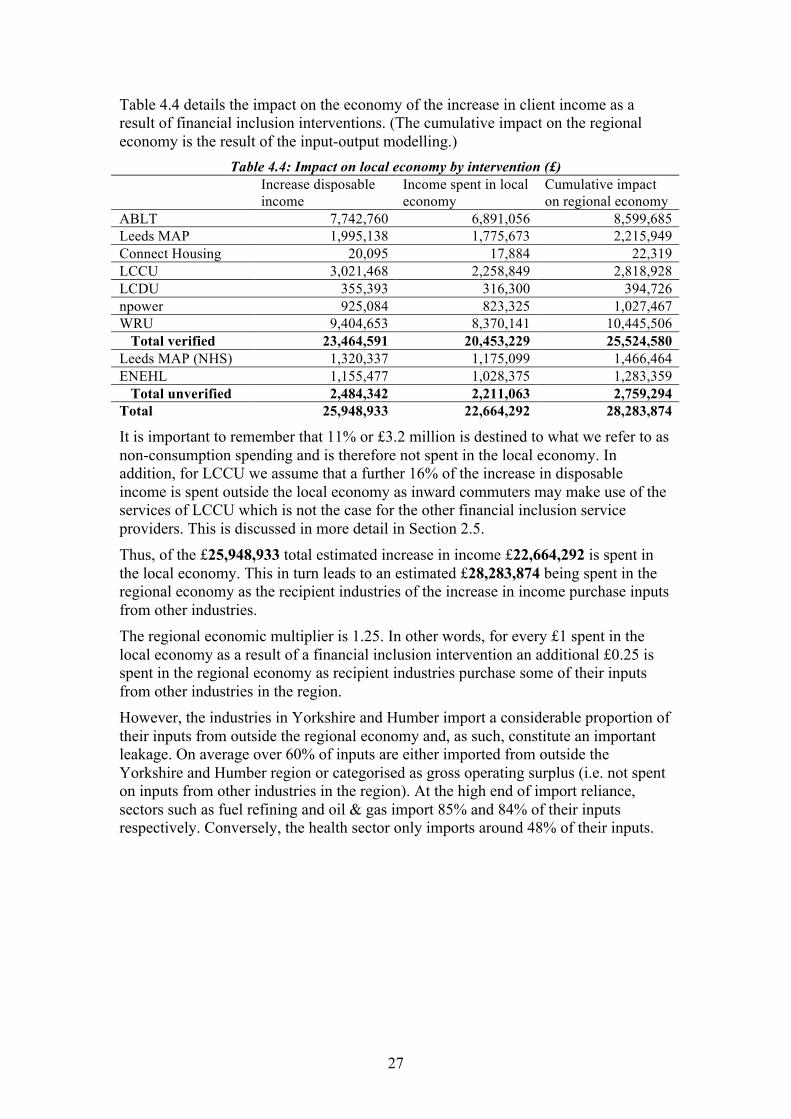
Table 4.4 details the impact on the economy of the increase in client income as a result of financial inclusion interventions. (The cumulative impact on the regional economy is the result of the input-output modelling.)
Table 4.4: Impact on local economy by intervention (£) Increase disposable
income Income spent in local economy
Cumulative impact on regional economy
ABLT 7,742,760 6,891,056 8,599,685 Leeds MAP 1,995,138 1,775,673 2,215,949 Connect Housing 20,095 17,884 22,319 LCCU 3,021,468 2,258,849 2,818,928 LCDU 355,393 316,300 394,726 npower 925,084 823,325 1,027,467 WRU 9,404,653 8,370,141 10,445,506
Total verified 23,464,591 20,453,229 25,524,580 Leeds MAP (NHS) 1,320,337 1,175,099 1,466,464 ENEHL 1,155,477 1,028,375 1,283,359
Total unverified 2,484,342 2,211,063 2,759,294 Total 25,948,933 22,664,292 28,283,874
It is important to remember that 11% or £3.2 million is destined to what we refer to as non-consumption spending and is therefore not spent in the local economy. In addition, for LCCU we assume that a further 16% of the increase in disposable income is spent outside the local economy as inward commuters may make use of the services of LCCU which is not the case for the other financial inclusion service providers. This is discussed in more detail in Section 2.5. Thus, of the £25,948,933 total estimated increase in income £22,664,292 is spent in the local economy. This in turn leads to an estimated £28,283,874 being spent in the regional economy as the recipient industries of the increase in income purchase inputs from other industries. The regional economic multiplier is 1.25. In other words, for every £1 spent in the local economy as a result of a financial inclusion intervention an additional £0.25 is spent in the regional economy as recipient industries purchase some of their inputs from other industries in the region. However, the industries in Yorkshire and Humber import a considerable proportion of their inputs from outside the regional economy and, as such, constitute an important leakage. On average over 60% of inputs are either imported from outside the Yorkshire and Humber region or categorised as gross operating surplus (i.e. not spent on inputs from other industries in the region). At the high end of import reliance, sectors such as fuel refining and oil & gas import 85% and 84% of their inputs respectively. Conversely, the health sector only imports around 48% of their inputs.

28
Table 4.5 displays the return on every £1 of investment (operating costs) by intervention in the regional economy.
Table 4.5: Return on every £1 invested by intervention Cumulative impact
on local economy Operating costs Return on £1
invested ABLT 8,599,685 673,577 12.8 Leeds MAP 2,215,949 808,543 2.7 Connect Housing 22,319 17,863 1.2 LCCU 2,818,928 312,500 9.0 LCDU 394,726 88,335 4.5 npower 1,027,467 67,192 15.3 WRU 10,445,506 847,394 12.3 Leeds FI Team NA 113,601 NA
Total verified 25,524,580 2,929,005 8.3 Leeds MAP (NHS) 1,466,464 236,297 6.2 ENEHL 1,292,830 184,660 7.0
Total unverified 2,759,294 420,957 6.6 Total 28,283,874 3,349,962 8.4
On average every £1 invested in financial inclusion activity generates £8.40 of spending by individuals and industries in the regional economy. The extra spending by individuals and industries in the regional economy generated for every £1 invested vary from £1.20 to £15.00 for the different interventions. The reason for this is that the financial inclusion interventions studied generate different levels of increased disposable income
29
5. Reflections and Concluding Comments Introduction Since this study began the greatest financial crisis since 1929-1933 (Barrell and Davis, 2008) and “the worst recession since the Second World War” (Kirby and Barrell, 2009, p. 42) are underway. The credit crunch, rising prices for raw materials, energy and other inputs and falling prices for output brought an end to an unprecedented 63 quarters of growth in the first quarter of 2008 (Kirby et al, 2008). The crisis has had a profound effect on households in and the economies in which they reside. Unemployment has increased considerably since the spring of 2008 and the National Institute of Economic and Social Research projects that unemployment will peak at 9.3%, or just below 3 million, in the second quarter of 2011 (Kirby and Barrell, 2009).
While the focus has been on the macro-economic impact they have had and will continue to have a profound affect on the citizens of Leeds, particularly the financially excluded. For example, the drying-up of the credit market has led to increased interest rates being charge by Provident (from 186% to 272% APR) and the other moneylenders. This means that it will take much longer for clients to repay their loans, which by extension entrenches their dependence on these providers of credit, with the knock-on effect on families and local businesses.
In addition rising living costs, especially fuel costs, are putting increasing strain on already stretched household finances. This is especially true for the financially excluded, who tend to have more tenuous links to the labour market and who pay more for services and utilities. As unemployment rises and disposable incomes decrease, local economies contract due to a reduction in demand for local goods and services.
Given that financial inclusion interventions aim to increase the disposable income of their users, it seems timely in the context of the current economic crisis to take into account the wider effects of these interventions on the local economy. This research project developed and applied a methodology to assess and track the impact of debt advice, benefits take-up and affordable credit in order to establish the economic and regeneration impact that this work produces.
The methodology we applied consisted of: a user survey and an analysis of performance management information provided by the financial inclusion service providers. This was used to quantify the increase in disposable income resulting from the intervention and; using an input-output table for the Yorkshire and Humber region to assess the wider economic impact of this increase in income on the regional economy.
Costs and benefits of financial inclusion interventions In total, we estimate that financial inclusion interventions in Leeds generate an increase in disposable income among its users of nearly £26 million per year. The financial inclusion service providers achieve this by providing access to affordable credit, increased benefit up-take, reduced financing costs through debt advice and similar ways. In total operating costs of the interventions we looked at is around £3.3 million.
30
The impact of financial inclusion interventions on the economy of Leeds Relying on data from the Family Resources Survey (FRS), we estimate that financial inclusion service users spend over £22 million in the City of Leeds. In turn, we used an input-output table for the Yorkshire and Humber region to estimate that this has a cumulative impact on the regional economy of over £28 million in a year. In other words, for every £1 spent in the local economy by financial inclusion service users, an additional £0.25 of spending in the regional economy is generated. This cumulative impact is generated as the firms providing the goods and services to the financial inclusion service users, purchase goods and services from other firms in the region who in turn purchase goods and services from yet other companies in the region.
If we take into account the increase in disposable income of users as a result of the intervention and the effect this has on local businesses and industry, this means that for every £1 invested in financial inclusion in Leeds, £8.40 is generated for the regional economy.
Final Reflections We were not asked to produce a list of recommendations, that is a task for Leeds City Council and its partners, but there are a number of factors that have emerged during the research that should be considered.
First, an important disclaimer concerning the use of the model in guiding the direction of financial inclusion activities in the city relates to the importance of context. In this study we have estimated that services aimed at increasing benefit up-take are more likely to produce higher sums than say weaning people off home credit or financial education. However, that does not mean that increasing benefit uptake is more important or worthwhile than the latter type of interventions. By way of example, there is less point in increasing income through benefits, if the result of that increasing income is used to service debts. Similarly, helping to reduce and manage someone’s debts will not be long term effective if the individual does not have access to more affordable forms of credit and is forced back to the doorstep lender. In other words it is important to not let financial inclusion policy be guided by a single indicator, but take a broader view of importance and effectiveness.
Second, most of these interventions involve public expenditure and it may be that other priorities deliver a better return for the taxpayer. Although we would argue that few will have such a direct and immediate impact. Connected to this the credit union and other loan based providers can, over time, source their funding out with the state. This differs from revenue intensive providers that are reliant on some external grant funding (though this could be through a levy charged on the financial sector under the polluter pays principle). Also, some strategies require the active involvement of national players such as npower. Success with these partnerships will require strong compacts, clear deliverables and a benefit for the external party. Finally, this research has not examined the benefit of financial education. Not only is it difficult to isolate something that has a long-term lag effect, but the research about its effectiveness is divided. Bluntly put no education system can constrain a cultural propensity for borrowing beyond a person’s means, if it has to operate against a legal system that encourages and enables the flourishing of such a culture (i.e. no cap on interest rates, no Community Reinvestment Act and overly complex consumer credit agreements that confuses rather than informs the borrower). The research has shown that there is much a city such as Leeds can do to alleviate the problem and improve
31
the economic benefit; a solution requires national and, probably, international leadership.
Recommendations regarding the methodology
The methodology presented here may constitute a useful tool for practitioners, policy-makers and supporters of financial inclusion services and their providers. It enables practitioners to review and enhance their activities, policy-makers to make sense of how these activities affect the citizens and communities they work with, and supporters to understand value-for-money associated with their investments.
The methodology could be improved upon in two salient ways: - Strengthen data collection and monitoring processes: The results of the modelling are
only as reliable as the data used to estimate the increases in disposable income resulting from interventions. Thus there is a strong case for investing in data collection and monitoring mechanisms in the organisations providing financial inclusion services.
- Consider developing input-output data for city: A challenge for cities in evaluating the wider economic effects of interventions is the lack of local input-output data. In this study we relied on regional-level input-output data. City economic development departments may want to investigate the possibility of developing such data. This would help provide a more accurate assessment of the economic benefit to the city.
32
6. Bibliography Archibald, G. C. (1967). Regional multiplier effects in the U.K, Oxford Economic Papers 19(1), 22-45 Armstrong, H. and Taylor, J. (2000). Regional economics and policy. (3rd edition). Oxford: Blackwell Publishing. Barrell, R. and Davis, E. P. (2008). The evolution of the financial crisis of 2007-8, National Institute Economic Review 206, 5-14. Bleaney et al (1992). What does a University add to its local economy?, Applied Economics 24, 305-311. Conaty, P., Dayson, K., Marchant, B. and Paterson, B. (2008). Financial inclusion in social housing – Policy into practice. London: National Housing Federation. Ekos Consulting (2006a). West Yorkshire Strategic Economic Assessment – Introduction and Overview. September 2006. Ekos Consulting (2006b). West Yorkshire Strategic Economic Assessment – Leeds District Summary. September 2006. Fraser of Allander Institute (2005). The Effect of Citizens Advice Bureaux on the Glasgow economy – a report to Business Gateway Glasgow from the Fraser of Allander Institute. March 2005. Kirby et al. (2008). Prospects for the UK economy, National Institute Economic Review 206, 101-118. Kirby, S. and Barrell, R. (2009). Prospects for the UK economy, National Institute Economic Review 209, 42-59. Miernyk, W. H. (1965). The Elements of Input-Output Analysis. New York: Random House. Sacks, J. (2002). The Money Trail – Measuring your impact on the local economy using LM3. London: New Economics Foundation. Yan, C. (1969). Introduction to Input-Output Economics. New York: Holt, Rinehart and Winston. Yorkshire and the Humber Rural Observatory (2006). A Rural Evidence Base for Yorkshire and The Humber. Report prepared by the Rural Observatory.

For further information:
City DevelopmentLeeds City CouncilThe Leonardo Building2 Rossington StreetLeedsLS2 8HD
Dave RobertsTel: 0113 247 4724
Joanna RowlandsTel: 0113 247 5760
www.leeds.gov.uk/fi