financial management 1 (fm101) - imm …imm-gsm.s3.amazonaws.com/2014/docs/semester2/learner...
TRANSCRIPT

IMM GSM© Page 1 of 141 FM101
Financial Management 1 (FM101)
The copyright of all IMM Graduate School of Marketing material is held by the IMM
GSM. No publications may be reproduced without prior written permission from the
IMM GSM.
November 2010

IMM GSM© Page 2 of 141 FM101
Table of contents
Section A
1. Word of welcome
2. How to use this guide
3. The overall purpose of the subject
4. Pre-knowledge
5. The relationship with other subjects
6. The NQF level and number of credits
7. Prescribed textbook and resources required
8. Curriculum
9. Specific learning outcomes
10. Critical Cross-field Outcomes
11. Assessment details
12. Time-line
4
5
6
7
7
8
8
10
11
12
14
15
Section B
Study Unit 1: Basic accounting concepts and the accounting
equation
1. The nature and roles of accounting and finance
2. Users of accounting information
3. Forms of business ownership
4. Financial and management accounting
5. Financial accounting concepts and terminology
6. The accounting equation
Study Unit 2: Basic accounting concepts and financial statements
1. Basic accounting
2. Company financial statements
19
20
21
23
29
31
36
42
43
62

IMM GSM© Page 3 of 141 FM101
Study Unit 3: Determine the selling price of merchandise
1. Value added tax (VAT)
2. Determining selling prices
Study Unit 4: Cost classification and terminology
1. Introduction
2. Cost classification in relation to the product or period
3. Cost classification in relation to volume of production
4. Cost classification for control or evaluation
5. Cost classification for decision making
Study Unit 5: Materials
1. Classification of materials
2. Stock control
3. Stock valuation methods
Study Unit 6: Labour, overheads costing
1. Classification of labour
2. Overheads
3. Job costing (absorption costing)
4. Marginal costing
Study Unit 7: Budgetary control and sales variance
1. Operational budgets
2. Flexible budgets
3. Cash budgets
4. Sales variances
Bibliography
84
85
91
97
98
98
99
101
101
106
107
108
113
117
118
118
119
123
127
128
130
133
135
141
IMM GSM© Page 4 of 141 FM101
Section A
1. Word of welcome
Welcome to financial management, a central part of the management function
in the firm. Financial management addresses accounting and finance concepts
relevant to all marketers, regardless of the extent of their involvement in the
direct financial affairs of the firm. Decisions to invest in products or markets or
to sell particular products depend to a great extent on the quality of information
provided by the accounting and finance function.
In this learner guide you will find a structured and integrated schedule of
learning material, tutorial notes, time-lines, self-assessment questions and one
assignment. In order to assist you in planning and managing your studies, the
learner guide has been structured according to:
an organisational component (Section A), and
a learning component (Section B).
The purpose of the organisational component is, amongst other things, to
orientate you towards financial management and to inform you about
administrative issues, whilst the purpose of the learning component is to
structure the syllabus in terms of manageable study units. The learning
component will explain what topics are covered, in how much depth, where to
find relevant information pertaining to the subject and ultimately help you to
study the subject as realistically and practically as possible.
To ensure you get the maximum benefit from the study time you have available
it is recommended that you work through the learning guide. This will help you
identify the time you will need to complete the programme and by doing this you
will be able to draw up a detailed and workable study schedule.
Everyone connected with marketing should be a little ‘streetwise’ about
accounting and finance because financial decisions influence every aspect of

IMM GSM© Page 5 of 141 FM101
business operations. Financial management is a fascinating and enjoyable
subject and it provides frameworks and techniques you will be able to apply in
your day-to-day marketing work.
Good luck and enjoy your studying.
2. How to use this guide
We aim to make you a confident user of financial and management accounting
techniques. The most effective way to achieve this will be to ensure that you
understand and enjoy the module.
The learner guide is especially designed for a student who studies at a
distance. The guide will provide an overview of the total curriculum and will
indicate the learning outcomes, which are essentially the core of this guide. It
will provide you with each major topic that has to be covered, along with the
learning outcomes for each topic, which are systematically explained. The
guide will also indicate how the learning material must be prepared for
examination.
The learner guide should be studied in conjunction with the textbook and does
not replace the textbook.
At the end of each study unit you will find some typical examples of examination
questions which should be used for self-evaluation.
The following icons appear in all of the learning guides of the IMM Graduate
School of Marketing:

IMM GSM© Page 6 of 141 FM101
indicates learning outcomes.
indicates the sections in the prescribed textbook that you need
to study.
indicates the self-evaluation questions.
3. The overall purpose of the subject
The fundamental aim of this course is to equip you with a thorough
understanding of important financial concepts. These concepts are important
and are applied to and integrated with other areas of learning within the
marketing field of study.
The overall course objectives for Financial Management 1 are to develop
financial literacy on a theoretical and practical level, by
explaining accounting concepts and terminology,
determining selling price of merchandise,
classifying costs into various categories,
demonstrating knowledge of concepts related to materials management,
demonstrating knowledge of concepts related to labour, overheads and
job costing, and
demonstrating an understanding of budgets and budgetary control.

IMM GSM© Page 7 of 141 FM101
4. Pre-knowledge
It is essential that you are competent in mathematics at NQF level four. If you
are not confident in your mathematical abilities at this level, it is strongly
recommended that you improve or refresh your basic mathematical knowledge
and skills. There are a number of firms offering short skills programmes in
mathematical literacy.
You should know or be able to do the following:
Know the order of mathematical operations
Work with formulas
Calculate ratios
Calculate percentages
Construct, read and interpret graphs and charts.
We will provide you with brief explanations in your learner guide where it is
deemed necessary. It is, however, not possible to create a comprehensive
mathematical guide within this text.
You can also refer to the following book related to business calculations:
Zidel, D. 2004. Basic Business Calculations. Johannesburg: Penguin Books.
An ability to use spreadsheets, such as MS Excel, to do financial calculations
and create charts and graphs is an added advantage.
5. The relationship with other subjects
Financial Management I should not be seen as an entity on its own, but in the
context of the diploma/degree as a whole, since a number of concepts are also
dealt with in other courses.

IMM GSM© Page 8 of 141 FM101
This course covers fundamental financial concepts that you are required to
know on a theoretical and practical level. The terminology and other topics
included are integrated with other IMM subjects, which in turn, help you to
identify and recognise your prior learning.
Finance as a topic can be boring if you don’t understand the concepts. It can
be, however, an interesting topic or course when being studied in the marketing
context because marketing strategy affects the financial performance of the firm
by generating sales and incurring costs.
6. The NQF level and number of credits
This module forms a compulsory module for the Diploma in Marketing
Management and BBA degree in Marketing Management.
In terms of the new National Qualifications Framework (NQF) it is designed as a
20-credit module offered on NQF level 5.
The IMM Graduate School of Marketing regards Financial Management I as a
first year subject.
7. Prescribed textbook and resources required
The prescribed textbook for this module is:
Cloete, M., and Marimuthu, F. 2008. Basic Accounting for Non-
Accountants. Pretoria: Van Schaik.
The textbook is written in a clear and systematic manner. Always start your
studies by consulting the learner guide and then study the relevant sections in
the prescribed textbook. It is unlikely that you will pass this module if you have
only consulted the learner guide without studying the content of the textbook.
The following textbooks are also recommended:

IMM GSM© Page 9 of 141 FM101
Marx, J., de Swart, C., Beaumont Smith, M., and Erasmus, P. 2009.
Financial Management in Southern Africa. 3rd edn. Cape Town:
Pearson.
Pizzey, A. 1998. Finance and Accounting for Non-Specialist Students.
Harlow: Prentice-Hall.
Niemand, A., Meyer, L., Botes, V.L., and Van Vuuren, S.J. 2006.
Fundamentals of Cost and Management Accounting. Revised 5th edn.
Durban: LexisNexis.
We would also like to encourage you to make a habit of reading business and
financially orientated literature, magazines and newspapers such as:
1. Business Day
2. Business Report
3. Engineering News
4. Financial Mail
5. FinWeek
You can also subscribe to various newsletters published online by financial
institutions or financially orientated magazines and portals such as:
Financial Mail at http://fm.co.za/
Finance Week at http://www.fin24.co.za/FinWeek
The IMM Marketing Information Centre specialises in the provision of
information for your project and work related needs. They have
over 1500 marketing related books,
prescribed and recommended IMM textbooks,
a range of over 30 marketing and business related journals.

IMM GSM© Page 10 of 141 FM101
Calculators
You will need a basic calculator that is typically used at
schools and universities, similar to the one displayed in
the picture. It can perform a variety of functions,
including fraction calculations, percentage calculations,
scientific calculations and statistical calculations.
This type of calculator is adequate for the basic business
calculations that you will have to perform during this
course.
8. Curriculum
This section addresses the overall content of the module. The Financial
Management I curriculum is divided into seven study units. The seven study
units with the corresponding chapters in the prescribed textbook (Cloete &
Marimuthu 2008) are as follows:
Unit Description Relevant Chapters
1 Accounting concepts and terminology Chapters 1 to 4
2 Financial statements Chapter 5
3 Determine selling price of merchandise Chapters 4, 7
4 Cost classification Chapter 8
5 Material and stock management Chapter 9
6 Labour, overhead and job costing, marginal
costing
Chapters 10, 13
7 Budgets and budgetary control Chapters 11, 12

IMM GSM© Page 11 of 141 FM101
9. Specific learning outcomes
The aim of this course is to emphasise the need for financial literacy on the part
of the marketing specialists. This will be by developing your ability to interpret
financial reports, to apply basic financial techniques to marketing operations
and to understand the essential indicators of the firm’s financial position.
Study
Unit Description Learning Outcomes
1 Explain
accounting
concepts and
terminology
Define the purpose and users of accounting.
Classify items as assets, liabilities or owner’s
equity.
Show the effect of various transactions on the
basic accounting equation.
2 Reading
financial
statements
Describe the accounting cycle.
Explain what year-end adjustments are and its
impact on the financial statements.
Interpret an income statement and balance sheet.
3 Determine
selling price of
merchandise
Calculate cost of sales.
Explain VAT concepts and calculate VAT.
Calculate mark-ups on cost price and selling price.
Calculate selling price (inclusive and exclusive of
VAT).
4 Classify costs
into various
categories
Classify cost in relation to product or period.
Classify behaviour of cost in relation to volume of
production.
Classify cost for control or evaluation.
Classify relevant and non-relevant costs for
decision making.

IMM GSM© Page 12 of 141 FM101
5 Demonstrate
knowledge of
concepts
related to
materials
management
Distinguish between direct and indirect materials.
Describe stock control concepts, calculate stock
levels and EOQ.
Describe stock valuation methods and calculate
the value of closing inventories using FIFO and the
weighted average method.
6 Demonstrate
knowledge of
concepts
related to
labour
overheads
and job
costing
Distinguish between direct and indirect labour.
Identify overhead costs.
Calculate the cost of a product or a job.
Distinguish between marginal and absorption
costing.
7 Demonstrate
an
understanding
of budgets
and budgetary
control
Describe components of an operational budget.
Draft operational, flexible and cash budgets.
Calculate and interpret sales variances.
10. Critical cross-field outcomes
The critical cross-field outcomes, also known as transferable skills as identified
by the South African Qualifications Authority (SAQA), are essential for your
development as a student within the education and training system, regardless
of the specific area of learning. It is these outcomes that are deemed critical for
your development in the capacity of life-long learning.

IMM GSM© Page 13 of 141 FM101
The critical cross-field outcomes adopted by SAQA are as follows:
(1) Identify and solve problems in which responses display that responsible
decisions using critical and creative thinking have been made.
(2) Work effectively with others as a member of a team, group, organisation,
and community.
(3) Organise and manage oneself and one’s activities responsibly and
effectively.
(4) Collect, analyse, organise and critically evaluate information.
(5) Communicate effectively using visual, mathematical and/or language
skills in the modes of oral and/or written presentation.
(6) Use science and technology effectively and critically, showing
responsibility towards the environment and health of others.
(7) Demonstrate an understanding of the world as a set of related systems
by realising that problem solving contexts do not exist in isolation.
(8) Reflecting on and exploring a variety of strategies to learn more
effectively.
(9) Participating as responsible citizens in the life of local, national and
global communities.
(10) Being culturally and aesthetically sensitive across a range of social
contexts.
(11) Exploring education and career opportunities.
(12) Developing entrepreneurial opportunities.

IMM GSM© Page 14 of 141 FM101
The transferable skills identified in this course are as follows:
Taught Practised Assessed
Problem solving X X X
Working in teams
Self-management X X X
Information gathering/research
skills
X X X
Communication skills X X X
Analytical skills X X X
Learning strategies X X X
Responsible citizenship
Cultural sensitivity X
Career development X X
Entrepreneurship
11. Assessment details
There are two assessments involved in terms of the Financial Management 1
module:
Assignment: The assignment contributes 20% to the overall mark for the
module. Assignments will focus on selected chapters, and need to be
typed. Please ensure that you adhere to the general rules of the IMM
Graduate School of Marketing pertaining to the style and format of
assignments. You will be issued with a separate instruction in this
regard.
Examination: The exam incorporates all content covered in the workbook
and constitutes 80% of the final mark for the Financial Management 1
module. The duration of the examination is three hours and the paper
will count 100 marks. The examination paper will consist of multiple

IMM GSM© Page 15 of 141 FM101
choice and short question type answers, but the majority of the questions
will require an ability to perform calculations as set out in the practice
questions in this guide. Examination results are usually released within
six weeks of sitting the examination.
The final mark, consisting of an assignment mark and an examination mark, is
released in the form of a final percentage (mark out of 100). The grading
system is as follows:
Percentage Scale Description
75% or more Pass with Distinction
50% - 74% Pass
0% - 49% Fail
A timetable of the assessment programme for the semester, including dates for
the assignment to be submitted during the course of the year, is available in the
Calendar of Events for that year. Please refer to the current issue of the IMM
GSM Prospectus. This document and the Student Yearbook provide details of
the IMM GSM assessment policy.
12. Time-line
With distance education, it is very important that you track your progress
against the time-line. The following time-line can be used as a starting point to
set up your personal time-line.
Week Topic/study theme
1 Introduction to accounting, concepts and terminology
2 Accounting equation and accounting cycle
3 Accounting for stock, year-end adjustments
4 Year-end adjustments

IMM GSM© Page 16 of 141 FM101
5 Company financial statements
6 VAT, mark-up
7 Cost classification
8 Material and stock management
9 Stock valuation
10 Labour, overhead, job costing
11 Marginal costing
12 Budgets and budgetary control
13 Budgetary control and sales variances

IMM GSM© Page 17 of 141 FM101
SECTION B
Why do I need to know about finance and accounting?
“There is not a chief executive or financial director these days who will deny the vital
importance of establishing and strengthening the bond between the brand and its
users. The problem arises in the language used by marketing people to communicate
the value of those relationships at management forums…
“…It is the way marketing people try to communicate the complex ideas about the
sensitive work they do in creating bonds between brands and their users. This is the
language used to motivate an increase in marketing investment. I have frequently been
told that if we could only prepare analyses and schedules that support a request for a
budget increase in the same way the factory manager motivates money for a new
piece of machinery; we would have a smoother ride.
“But we persist in trying to communicate in ‘soft’ terms that confuse more than explain,
and which marginalises marketing rather than raising the standing of its practitioners to
where they belong, which is at the very front line of income generation. The
gatekeepers of the shareholders’ purse strings want to hear how the new branding
programme will affect the bottom line and what return it will achieve rather than be told
about the consumer psychology behind the campaign. And they want to hear it stated
in financial terms not the obtuse coded vernacular of the world of branding.”
Source: http://www.brandsandbranding-online.co.za/corporate-finance-101-for-marketers/
The effectiveness of marketing operations can be measured through the
application of various financial analysis activities. None of these analytical
activities can be performed if a person does not have a basic understanding of
accounting and finance fundamentals.

IMM GSM© Page 18 of 141 FM101
Most of these financial analyses fall into one of four financial activities as
explained below:
The financial situation analysis determines how well marketing activities are
doing. It involves the study of trends, comparative analyses, and assessment of
present financial strengths and limitations of the product, brand or business unit.
Financial information is used to evaluate alternatives as whether to introduce
new products, move into new markets, eliminate a product, expand the sales
force or change the distribution channel.
Financial planning involves the projection of sales, cost forecasts and budgets,
once it has been decided to implement a specific marketing action.
Financial control is about comparing actual results to planned results, with the
objective of keeping an unfavourable results gap as narrow as possible.
IMM GSM© Page 19 of 141 FM101
Study Unit 1: Basic accounting concepts and the accounting equation
This study unit covers the introduction to accounting, discusses financial
accounting concepts and terminology, and explains the accounting equation.
Mastering the accounting equation is critical in understanding this study unit and
creates the foundation of the remainder of this subject and for future studies in
financial management.
Specific Learning Outcomes
After studying this unit, you should be able to:
Define the purpose of accounting.
Identify the main users of accounting information.
Classify items as assets, liabilities or owner’s equity.
Show the effect of various transactions on the basic accounting equation.
.
1. The nature and roles of accounting and finance

IMM GSM© Page 20 of 141 FM101
Reading reference
Study Cloete & Marimuthu 2008: Chapter 1 – Definition of accounting.
Financial management addresses accounting and finance concepts relevant to
all marketers, regardless of the extent of their involvement in the financial
information and decisions in the business. Decisions to invest in products or
markets or to sell particular products all depend on the basis of information
provided by the accounting and finance function.
The main purpose of accounting is to provide users with financial information
that will assist them in making informed decisions.
Accounting is a system comprising the following elements:
Gathering financial information that has an effect on a specific business.
Analysing how the financial information will affect the business.
Recording the financial information through proper accounting
processes.
Reporting all financial information for a given period of time so that it can
be read and understood.
Interpreting the summarised information to allow users to make
informed decisions about the business.
You should now be able to master outcome 1.

IMM GSM© Page 21 of 141 FM101
2. Users of accounting information
Reading reference
Study Cloete & Marimuthu 2008: Chapter 1 – Users of accounting information,
and how useful is accounting information.
2.1 Identifying users of financial information
Financial decisions are influenced by several factors such as the realities of the
external environment, past strategies, management value systems, goals of the
executive management team and internal power relationships. Stakeholders
have expectations or demands, which can influence decisions depending on the
power of the stakeholder or groups of stakeholders. We can define a
stakeholder as an individual or group that can influence the firm’s objectives or
are affected by decisions made by the firm.
Stakeholders can be classified or grouped into two groups, namely internal and
external users of financial information:
Internal External
• Owners
• Managers
• Employees and their
representatives.
• Customers
• Competitors
• Lenders
• Government
• Suppliers
• Investment analysts.

IMM GSM© Page 22 of 141 FM101
2.2 The needs of users of financial information
Financial information should possess a number of qualities in order to fulfil the
needs of the users thereof. It should be relevant, reliable, provide means to do
comparisons with the past or across different businesses and it should be clear
so that users can understand it. In addition to these qualities, financial
information should also achieve a threshold of materiality or significance,
meaning that it should only be included within reports if it does not clutter them
up or interfere with the user’s ability to interpret financial results.
The timely flow of information helps managers to compare actual performance
to planned performance. Accounting information helps owners of the business
to assess if the managers of the business are also pursuing the goal of wealth
maximisation.
The reasons for using accounting information by different users are set out in
the table below:
User Use
• Owners
• Managers
• Employees
• Customers
• Competitors
• Lenders
• Government
• Suppliers
• Investment
analysts
Determine profitability and financial viability.
Ensure business operates efficiently and solve problem
areas highlighted.
Determine if employer is able to provide stable
employment and remuneration.
Determine if business can provide products over long
period of time.
Competitor intelligence, to maintain competitive edge.
Determine if business can repay loans and interest.
Determine how much taxes and levies should be paid.
Determine if business can pay for goods purchased on
credit.
Determine if business would be good investment, and to
assess risk and return of an investment in business.
You should now be in a position to master outcome 2.

IMM GSM© Page 23 of 141 FM101
3. Forms of business ownership
Reading reference
Please read Cloete & Marimuthu 2008: Chapter 1 – Basic business forms in
South Africa.
No learning outcome is set for this section but regard the reading as important
background information.
An understanding of the different forms of business ownership is necessary as
the nature of ownership will in the first instance have an impact on the treatment
of owners’ claims, and secondly, the reporting and treatment of financial
information in the financial statements.
3.1 Forms of business ownership in South Africa
In South Africa you may find that businesses are operated as a:
Sole proprietary
Partnership
Close Corporation – Name followed by CC
Private company with limited liability – Name followed by (Pty) Ltd
Public company with limited liability – Name followed by Ltd
Important note:
The Companies Act was signed by the President on the 08th April 2009 and gazetted
in the Gazette No. 32121 (Notice 421). The Act comes into operation on a date still to
be fixed by the President by proclamation in the Gazette.
This Act affects Close Corporations, Private companies and Public companies as
mentioned above.

IMM GSM© Page 24 of 141 FM101
The new Companies Act has identified two types of companies to be
incorporated under the new act. A company can either be a profit company or a
non-profit company.
A profit company is defined as a company incorporated for the purpose of
financial gain for its shareholders.
A non-profit company is incorporated for public benefit and the income and
property are not distributable to its incorporators. A non-profit company may be
regarded as a successor to the previous Section 21 companies in the current
act.
Profit companies can be:
1) a state-owned company (SOC);
2) a private company (Proprietary Limited) if it is not state-owned and the
Memorandum on Incorporation prohibits it from offering its securities to
the public and restricts the transferability of its securities;
3) a personal liability company (Incorporated) if it meets the criteria for a
private company and the Memorandum of Incorporation states that it is a
personal liability company;
4) a public company (Limited) in any other case.
One of the effects of the new Companies Act of 2008 is the phasing out of close
corporations. No new close corporations may be formed once that Act comes
into operation. Existing close corporations can elect to continue to exist until
deregistered, dissolved or converted into a private company governed under the
new Companies Act. It will be possible for businesses to continue to run their
operations out of an existing close corporation if they so wish.
Another effect is that a private company will still be prohibited from offering its
shares to the public and the transferability of its shares will be restricted but, it
will no longer be subject to a limitation of 50 shareholders.

IMM GSM© Page 25 of 141 FM101
3.2 Distinguishing between forms of ownership
A sole proprietary dissolves upon the death or retirement of the proprietor. A
partnership must be dissolved upon the death or retirement of one of the
partners and a new partnership agreement has to be drawn up.
We will further distinguish between the forms of ownership on the basis of
liability for debts and capital formation.
Business
Form
Liability Capital
Sole
proprietary
Owner bears unlimited liability
for debts – may lose personal
assets.
Owner provides own capital or
borrows from financial institution.
Partnership Partners jointly and severally
liable for debt of business – may
lose personal assets.
Partners provide own capital or
borrow from financial institution.
Close
Corporation
Members’ liability limited to
amount of money invested in
business – may under certain
circumstances lose limited
liability.
Members provide own capital or
borrow from financial institution.
Private
company
Shareholders’ liability limited to
amount of capital invested in
shares.
Capital is raised by issuing
shares to owners (not public) or
borrowing from financial
institution.
Public
company
Shareholders’ liability limited to
amount of capital invested in
shares.
Capital is raised by issuing
shares to shareholders, or
borrowing from public through
debentures or borrowing from
financial institutions.

IMM GSM© Page 26 of 141 FM101
3.3 Accounting and legal requirements
We will summarise the differences in accounting requirements between different
forms of business ownership in South Africa.
Business
Form
Legal Financial
statements
Taxation
Sole
proprietary
Very little legal
requirements.
Not regulated. Owner pays tax
in personal
capacity, not as
business.
Partnership Very little legal formalities.
Partnership Agreement.
Not regulated. Partners pay
tax in personal
capacity, not as
business.
Close
Corporation
Founding Statement.
Certificate of Incorporation.
Association Agreement to
regulate relationship
between members.
Financial
statements
prepared but not
required to be
audited.
CC pays tax on
profits of
business – at
preferential
rates available
to CC below
certain
turnover.
Private
company
Memorandum of
Association and
Articles of Association.
Certificate of Incorporation.
Financial
statements
prepared but not
required to be
audited or lodged
with Registrar of
companies.
Company pays
tax on its
profits.
Public
company
Memorandum of
Association and
Articles of Association.
Certificate of Incorporation.
Prospectus.
Minimum subscription
fulfilled.
Certificate to Commence
Business.
Financial
statements audited
and lodged with
Registrar of
companies.
Company pays
tax on its
profits.

IMM GSM© Page 27 of 141 FM101
Transferring of ownership of shares in public companies (if they are members
and their shares are listed on the JSE) takes place at the JSE Securities
Exchange South Africa (‘the JSE’). The JSE was formally established on 8
November 1887 as a market-place for the shares of South Africa’s many mining
and financial companies.
3.4 Types of business activity
Please read Cloete & Marimuthu 2008: Chapter 1 – Types of business activity.
No outcome is set for this section but regard the reading as important
background information.
We can classify business types by various types of activities, including service
businesses, manufacturers, wholesalers and retailers.
Service businesses
These businesses provide services for which they charge fees. Typical
examples include attorneys, accountants, architects and information,
communication and technology (ICT) companies.
Manufacturers
Manufacturers buy raw materials that they then transform into finished products
which are sold to wholesalers and retailers.
Wholesalers
The term middleman is often associated with wholesalers, because they buy in
bulk from manufacturers and then supply the goods in smaller quantities to
retailers, or the public.

IMM GSM© Page 28 of 141 FM101
Retailers Retailers buy goods from the wholesalers or manufacturers and sell the goods
to the general public. It is also stated that retailers can be viewed as service
providers for reasons listed below:
Bring goods within reach of the consumer
Allow the consumer to buy on credit
Pay attention to the need of their consumers
Sell goods in small quantities
Make consumers aware of new products on the market
Offer convenience shopping.
The format of financial statements will vary by the type of business. For
instance, service businesses may have a category ‘Fees Collected’ instead of
‘Sales’. One also needs to consider Work-In-Progress as part of inventory in a
manufacturing environment, and that you will not find in a service business.
IMM GSM© Page 29 of 141 FM101
4. Financial and management accounting
Reading reference
Study Cloete & Marimuthu 2008: Chapter 1 – The accounting field.
Accounting accumulates data for reporting to external and internal users (with
different objectives).
Management accounting seeks to meet the need of the business managers in
the firm and financial accounting seeks to meet the needs of all the other users.
The major differences between the two types of accounting can be found in:
Nature of the reports produced
Level of detail provided in the reports
Regulatory requirements related to the format and timing of accounting
reports
Interval at which reports are prepared
Time horizon – historical or forward looking
Range and quality of information.
You should now be able to master outcome 2.

IMM GSM© Page 30 of 141 FM101
Self-assessment exercise
Now do Exercise 1 and Exercise 2 in Cloete & Marimuthu 2008: Chapter 1.
Solutions
Exercise 1
1. c
2. a
3. e
4. b
5. d
Exercise 2
2.1 d
2.2 b
2.3 d
2.4 d
2.5 c
2.6 c
2.7 c

IMM GSM© Page 31 of 141 FM101
5. Financial accounting concepts and terminology
Study reference
Study Cloete & Marimuthu 2008: Chapter 2.
Wealth of a business is measured through the measurement:
Assets – Liabilities = Owner’s equity
It is important to define the terms that will be used throughout this subject and in
subsequent studies in financial management.
Term Definition
Assets Resources controlled by an entity resulting from past events
out of which future economic benefits will flow.
OR
In financial accounting, assets are economic resources.
Anything tangible or intangible that is capable of being
owned or controlled to produce value and that is held to
have positive economic value is considered an asset.
Simply stated, assets represent ownership of value that can
be converted into cash (although cash itself is also
considered an asset).
Non-current assets An item of value with a lifespan of more than one year.
Property, plant and equipment
Financial assets (e.g. investments)
Intangible assets (e.g. patents, trade marks).
Current assets An item of value with a lifespan of less than one year.
Cash
Debtors
Stock.
Liabilities Present obligations resulting from past events, the
settlement of which leads to decreases in economic
benefits.

IMM GSM© Page 32 of 141 FM101
OR
In financial accounting, a liability is defined as an
obligation of a firm arising from past transactions or events,
the settlement of which may result in the transfer or use of
assets, provision of services or other yielding of economic
benefits in the future.
Non-current liabilities Obligations of the business which are payable over a period
of more than one year.
Long-term loan
Bond from bank over property.
Current liabilities Obligations of the business which are payable within one
year.
Bank overdraft
Creditors.
Owner’s equity Owner’s interest in the business and comprises capital
contribution less drawings, plus net profit, where:
Income – expenses = Net profit
Income Receipts by a business for normal operations.
Sales
Fees earned
Rent received
Interest received.
Expenses Amounts spent by a business during normal operations
(excluding capital expenses)
Rent paid
Interest paid
Advertising
Salaries.
We will return to a more comprehensive discussion of these terms later in this
unit.
IMM GSM© Page 33 of 141 FM101
Self-assessment exercise
Complete Exercise 1 and Exercise 2 in Cloete & Marimuthu 2008: Chapter 2.
You will now be able to master outcome 3

IMM GSM© Page 34 of 141 FM101
Solutions
Exercise 1
NCA CA NCL CL OE I E
a) Capital X
b) Delivery vehicle X
c) Weekly wages X
d) Sales X
e) Trading stock X
f) Mortgage loan X
g) Telephone account X
h) Debtors (accounts receivable) X
i) Computer X
j) Interest received X
k) Creditor (accounts payable) X
l) Interest paid X
m) Property X
n) Discount allowed X
o) Discount received X
p) Depreciation X
q) Stationery used X
r) Stationery unused (stationery on hand)
X
s) Bank overdraft X
t) Drawings X
u) Photostat machine X
v) Shop fittings X

IMM GSM© Page 35 of 141 FM101
Exercise 2
ASSET LIABILITY INCOME EXPENSE
a) The monthly rental paid for the shops
X
b) A loan raised from Bee Bank X
c) Amounts owed to Megacity by customers
X
d) Petty cash on hand. X
e) The stock of clothes on hand in each shop
X
f) Amounts owed by Megacity to its suppliers of stock
X
g) Warehouse owned by Megacity used for storing stock
X
h) Wages paid to the shop assistants
X
i) Receipts from customers for the sale of clothes
X
k) Cash at the bank X

IMM GSM© Page 36 of 141 FM101
6. The accounting equation
Study reference
Study Cloete & Marimuthu 2008: Chapter 3 – The basic accounting equation.
6.1 Basic accounting equation
The three main elements of accounting fit together as follows:
Assets = Owner’s equity + Liabilities
The right hand side of this equation represents all the money that is available to
the business in the long term from the owners and the outside providers of
funds to purchase assets (the left hand side of the equation).
This equation is the Basic Accounting Equation. (BAE)
Important!
Please work through illustrative examples 1, 2 and 3 in the textbook.
Self-assessment exercise
Now do Exercise 1 and Exercise 2 in Cloete & Marimuthu – Chapter 3
You should now be in a position to master outcome 4
IMM GSM© Page 37 of 141 FM101
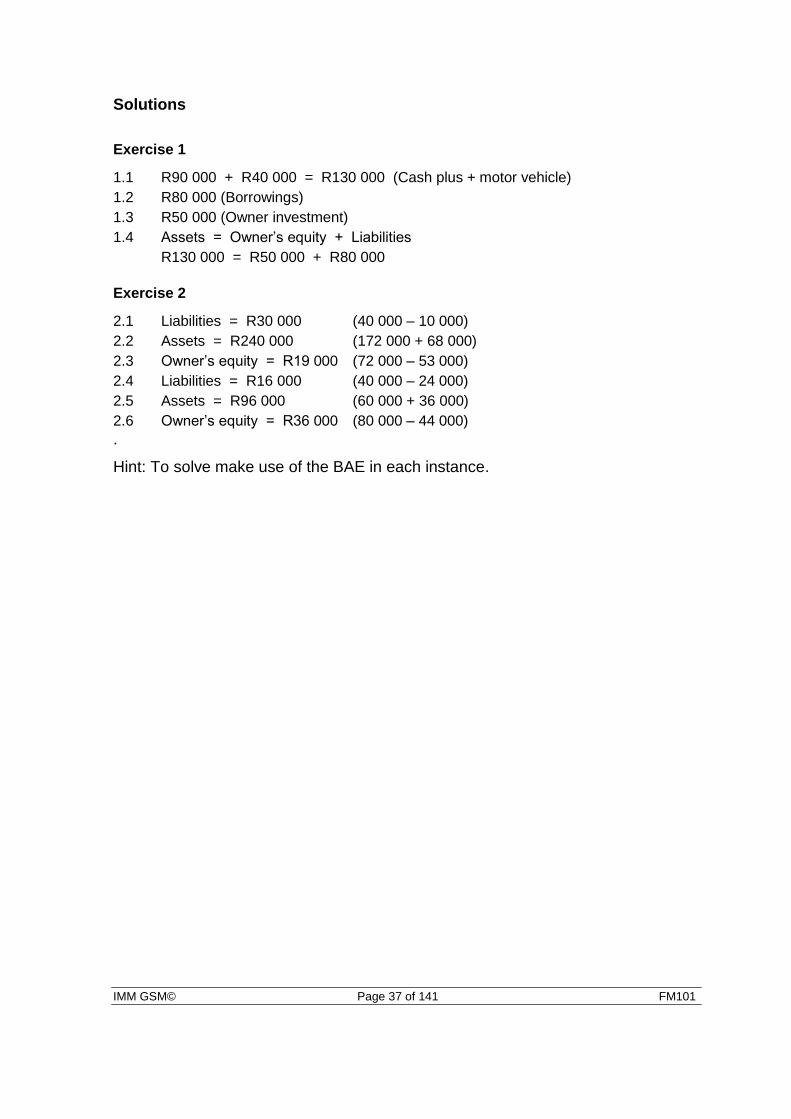
Solutions
Exercise 1
1.1 R90 000 + R40 000 = R130 000 (Cash plus + motor vehicle)
1.2 R80 000 (Borrowings)
1.3 R50 000 (Owner investment)
1.4 Assets = Owner’s equity + Liabilities
R130 000 = R50 000 + R80 000
Exercise 2
2.1 Liabilities = R30 000 (40 000 – 10 000)
2.2 Assets = R240 000 (172 000 + 68 000)
2.3 Owner’s equity = R19 000 (72 000 – 53 000)
2.4 Liabilities = R16 000 (40 000 – 24 000)
2.5 Assets = R96 000 (60 000 + 36 000)
2.6 Owner’s equity = R36 000 (80 000 – 44 000)
.
Hint: To solve make use of the BAE in each instance.
IMM GSM© Page 38 of 141 FM101
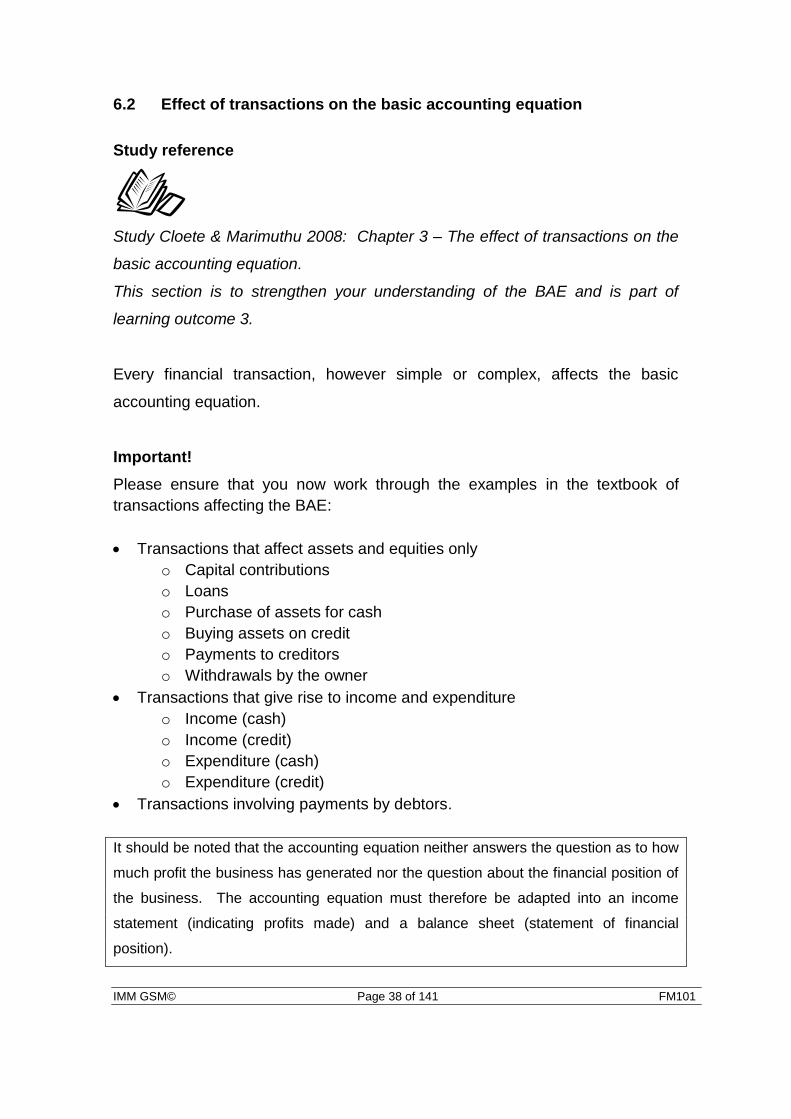
6.2 Effect of transactions on the basic accounting equation
Study reference
Study Cloete & Marimuthu 2008: Chapter 3 – The effect of transactions on the
basic accounting equation.
This section is to strengthen your understanding of the BAE and is part of
learning outcome 3.
Every financial transaction, however simple or complex, affects the basic
accounting equation.
Important!
Please ensure that you now work through the examples in the textbook of
transactions affecting the BAE:
Transactions that affect assets and equities only
o Capital contributions
o Loans
o Purchase of assets for cash
o Buying assets on credit
o Payments to creditors
o Withdrawals by the owner
Transactions that give rise to income and expenditure
o Income (cash)
o Income (credit)
o Expenditure (cash)
o Expenditure (credit)
Transactions involving payments by debtors.
It should be noted that the accounting equation neither answers the question as to how
much profit the business has generated nor the question about the financial position of
the business. The accounting equation must therefore be adapted into an income
statement (indicating profits made) and a balance sheet (statement of financial
position).

IMM GSM© Page 39 of 141 FM101
Self-assesment exercise
Now do Exercises 5, 6 and 7 in Cloete & Marimuthu 2008: Chapter 3.

IMM GSM© Page 40 of 141 FM101
Solutions
Exercise 5
DATE ASSETS = OWNERS EQUITY +
LIABILITIES
Vehicles Equipment Debtors Bank Capital/
drawings Income/expense
Loan Creditors
1 +15000 +15000
2 +60000 -6000 +54000
3 -2000 -2000
10 +15000 +15000
12 -500 -500
14 +20000 +20000
15 +10000 +10000
17 -3000 -3000
20 -800 +800
24 -1500 -1500
26 -8000 +8000
28 -250 -250
31 +75000 +75000
Exercise 6
DATE ASSETS = OWNERS EQUITY +
LIABILITIES
Vehicles Equipment Debtors Bank Capital/
drawings Income/expense
Loan Creditors
1 +2800 +2800
2 -110 -110
3 -1100 +1100
5 +6000 +6000
6 -200 -200
7 -8400 +8400
8 -1200 -1200
9 +4000 +4000
11 +2600 +2600
12 -1200 -1200
13 -300 -300

IMM GSM© Page 41 of 141 FM101
Exercise 7
DATE ASSETS = OWNER’S EQUITY +
LIABILITIES ACCOUNT
DEBIT ACCOUNT
CREDIT
1 +18 000 +18 000 Bank Loan
2 -100 -100 Loss on theft
of asset Equipment
3 +70 +70 Bank Loss on theft
of asset
4 +10 000 -10 000 Buildings Bank
5 -120 -120 Drawings Bank
6 +3 000 +3 000 Debtors Sales
7 -800 -800 Wages Bank
+20 050 +2 050 +18 000

IMM GSM© Page 42 of 141 FM101
Study Unit 2: Basic accounting concepts and financial statements
This study unit addresses basic accounting matters such as the conceptual
framework of basic accounting, the accounting cycle, year-end adjustments and
an introduction to company financial statements.
Mastering the year-end adjustments and an understanding of the components
of the respective financial statements is critical to read financial statements.
Specific learning outcomes
After you have studied this module you should be able to:
Describe the accounting cycle.
Explain what year-end adjustments are and its impact on the financial
statements.
Interpret an income statement and balance sheet.
IMM GSM© Page 43 of 141 FM101
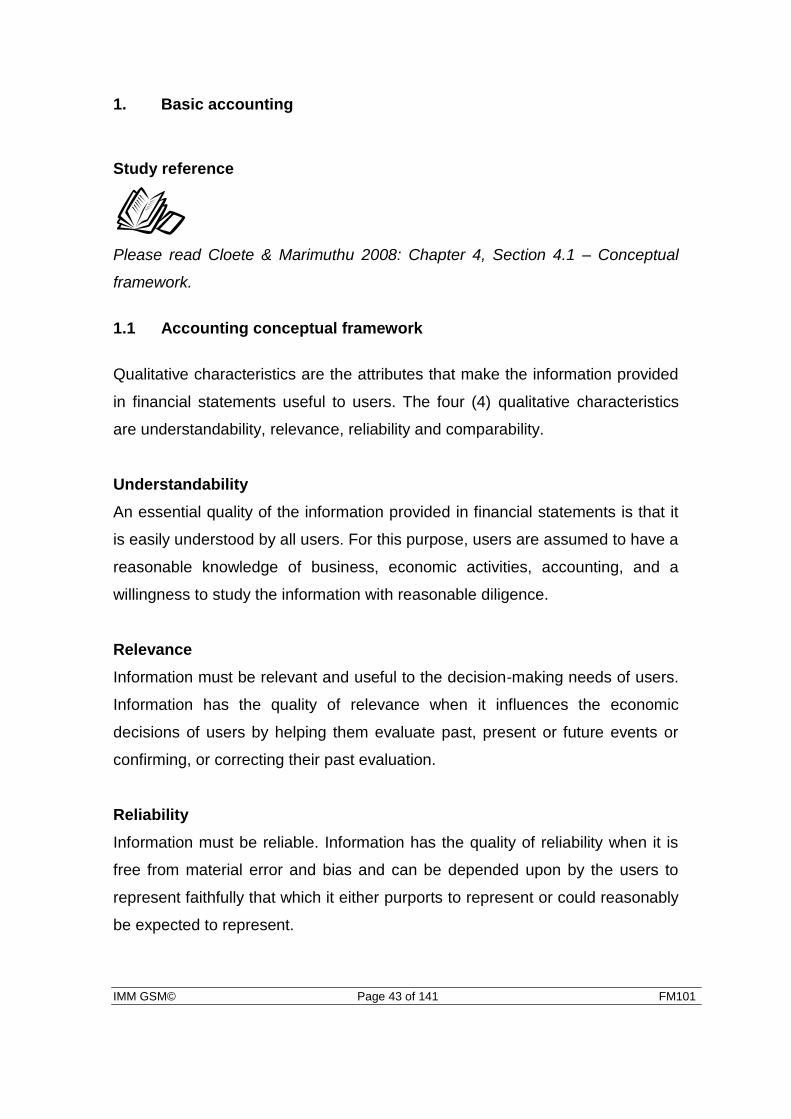
1. Basic accounting
Study reference
Please read Cloete & Marimuthu 2008: Chapter 4, Section 4.1 – Conceptual
framework.
1.1 Accounting conceptual framework
Qualitative characteristics are the attributes that make the information provided
in financial statements useful to users. The four (4) qualitative characteristics
are understandability, relevance, reliability and comparability.
Understandability
An essential quality of the information provided in financial statements is that it
is easily understood by all users. For this purpose, users are assumed to have a
reasonable knowledge of business, economic activities, accounting, and a
willingness to study the information with reasonable diligence.
Relevance
Information must be relevant and useful to the decision-making needs of users.
Information has the quality of relevance when it influences the economic
decisions of users by helping them evaluate past, present or future events or
confirming, or correcting their past evaluation.
Reliability
Information must be reliable. Information has the quality of reliability when it is
free from material error and bias and can be depended upon by the users to
represent faithfully that which it either purports to represent or could reasonably
be expected to represent.

IMM GSM© Page 44 of 141 FM101
Comparability
Users must be able to compare the financial statements of a firm through time,
in order to identify trends in its financial position and performance. Users must
also be able to compare the financial statements of different firms in order to
evaluate their relative financial position, performance and changes in their
financial position. Hence the measurement and display of the financial effect on
like transactions and other events must be carried out in a consistent way
throughout a firm and over time for that firm and in a consistent way for different
firms.
Accounting statements rest on four important principles which are so important
that a note to the accounts must warn users if this is not the case. These
principles are:
The going concern – it is assumed that a business is going to continue
its operations in the future.
The matching principal – cost and revenue are matched to reflect the
same time period, i.e., cost of materials or stock purchased will only be
reflected against revenue generated by such materials or stock. Any
materials or stock purchased and not yet used will be carried as a short-
term asset in the balance sheet. This principal is also known as the
‘accruals’ principal.
Prudence (conservatism) – until a deal has been concluded and
completed, profit cannot be counted and the lower asset value or profit
alternatives will be reflected in the financial statements.
Consistency – once a method has been chosen by the accountant to
treat accounting entries, it is essential that the same method is applied in
future years. This will ensure that statements can be compared over
time.

IMM GSM© Page 45 of 141 FM101
1.2 The accounting cycle Study reference
Study Cloete & Marimuthu 2008: Chapter 4, Section 4.2 – The accounting
cycle.
The accounting cycle is the series of steps that take place in order for financial
statements to be accurately and uniformly produced at the end of an accounting
period which is typically the length of one month, quarter of a year, or a whole
year. Below is a list of the steps you would take to complete the accounting
cycle, listed in the order that you would perform them, and with a brief summary
of each step.
1. A transaction occurs between the business and some other entity. This
transaction could be the revenue from the sale of a product or a payment to
another business for services.
2. A source document is required to substantiate the transaction.
3. Analyse the transaction and how it relates to the accounting balance sheet.
For example, determine which accounts are affected by the transaction and
how they are affected. Record the transaction to a journal such as a sales
journal. Journals are kept in chronological order and may be updated
continuously, daily, or however often it is necessary.
4. Record the transaction to the general ledger. Take all of your entries and
categorise them by the account.
5. Perform a trial balance. Debits and credits need to be equal at the end of an
accounting cycle, so calculate the entries to ensure they match.
6. Prepare adjustments. Just because entries are recognised, does not mean
the work has been performed. Revenue can only be recognised when the
work has been completed, so adjust the entries accordingly. The
adjustment can also be the result of accounting policies, such as provision
for bad debts or depreciation on assets.

IMM GSM© Page 46 of 141 FM101
7. Perform trial balance with adjustments. Take the adjustments from Step 6
and prepare a trial balance. If the debits and credits do not match, then you
need to adjust them to make sure they do match.
8. Perform closing entries using a general journal. Close the accounts in
preparation of the next accounting cycle. Revenues and expenses need to
be closed out, which means they need to have zero balances. Balances are
moved to the next cycle.
9. Prepare a final trial balance after all closing entries have been made
(summary of the closing entries in the general ledger).
10. Prepare financial statements. From the adjusted trial balance, these
corrected balances are used to prepare the financial statements.
11. Analyse and interpret information contained in the financial statements.
While the actual terminology, timeline, and other factors of the accounting cycle
vary, the above steps represent the general steps included universally in the
accounting cycle. In realistic scenarios, a streamlined process, aided by
computer programs and other devices, allows an accountant to combine some
of these steps and complete the process in less time and with less effort. For
example, often, a computer program allows steps one and two to be combined
and allows the steps to accurately appear on the journal or general ledger
almost instantaneously. Also, calculations performed by a computer or
calculator work to eliminate human errors.
Self-assessment exercise
Now do Exercise 1 in Cloete & Marimuthu 2008: Chapter 4.
After you have studied this section you should be able to master learning outcome 1.

IMM GSM© Page 47 of 141 FM101
Solution
Exercise 1
Shiloh Clothing Income statement for the year ended 28 February 20x2
Sales Less: Cost of sales
63 750 42 500
Gross profit for the year Add: Other income
Dividends received Rent income
30 7 200
21 250 7 230
Gross income for the year Less: Operating expenses
Advertising Bank charges Interest paid Electricity and water Licence Wages Stationery and postage Telephone
540 165
2 860 160 225
7 920 140 270
28 480 12 280
Net profit for the year 16 200

IMM GSM© Page 48 of 141 FM101
Shiloh Clothing Balance sheet as at 28 February 20x2
Notes Cost price Accumulated depreciation
Book value
Non-current assets Premises
Vehicles
Equipment
70 000 12 500 12 100
70 000 12 500 12 100
94 600 94 600
Investment Shares: JSE
850
850
Current assets Stock Accounts receivable Bank Cash float
13 250 1 500
21 750 250
36 750
TOTAL ASSETS 132 200
Equity & liabilities Owner’s equity
1
99 700
Non-current liabilities Loan: PBS (17% p.a.) Mortgage bond (15% p.a.)
8 000 10 000
18 000
Current liabilities Accounts payable
14 500 14 500
TOTAL EQUITY & LIABILITIES
132 200
Notes: 1) Statement of changes in equity
Capital R98 000 Add: Net profit R16 200 Less: Drawings R14 500
R99 700

IMM GSM© Page 49 of 141 FM101
1.3 Year-end adjustments Study reference
Study Cloete & Marimuthu 2008: Chapter 4, Section 4.4 – Year-end
adjustments, depreciation.
A number of adjustments can be made at year end, including:
Depreciation
Provision for doubtful debts
Prepaid expenses
Accrued expenses
Accrued income
Income received in advance/prepaid income.
1.3.1 Depreciation
The benefits that a firm obtains from an asset extend over several years. The
life of production machinery may extend over many years, whereas a company-
owned motor car used by a salesman probably has a much shorter useful life.
By accepting that the life of a fixed asset is limited, the accounts of a firm need
to recognise the benefits of the fixed asset as it is ‘consumed’ over several
years. This ‘consumption’ of a fixed asset is referred to as depreciation.
A portion of the benefits of the fixed asset will be used up or consumed in each
accounting period of its life in order to generate revenue. To calculate profit for
a period, it is necessary to match expenses with the revenues they help earn.
In determining the expenses for a period, it is therefore important to include an
amount to represent the consumption of fixed assets during that period (that is,
depreciation).

IMM GSM© Page 50 of 141 FM101
The Receiver of Revenue (SARS) controls the rate at which depreciation may
be claimed in South Africa because it affects the profits, and consequently, the
amount of tax payable. The rate of depreciation for different types of assets is
published as schedules to Practice Notes. Special accelerated depreciation
rates may also be available as incentive to develop industries or regions.
The basics that underline depreciation are:
The asset should be used to generate income in the course of
conducting business.
The expense should be fairly allocated over the lifetime of the asset.
The asset should be fairly presented in the balance sheet, that is, at book
value.
Important!
Please ensure that you now work through the depreciation examples in the
textbook.
Self-assessment exercise
Now do Exercise 3 in Cloete & Marimuthu 2008: Chapter 4.

IMM GSM© Page 51 of 141 FM101
Solution
Exercise 3
TKZ Stores journal entry as at 30 June – Vehicles
Debit Credit
Depreciation Accumulated depreciation on vehicles
7 000 7 000
Workings R35 000 x 20% = 7 000 TKZ Stores journal entry as at 30 June – Furniture and fittings
Debit Credit
Depreciation Accumulated depreciation on furniture and fittings
5 355 5 355
Workings (R42 000 – 6 300) x 15% = 5 355 TKZ Stores income statement as at 30 June
Less: Operating expenses Depreciation (7 000 + 5 355) R12 355
TKZ Stores balance sheet as at 30 June Non-current assets
Cost Accumulated depreciation
Book value
Vehicles Furniture and fittings
35 000 42 000
25 000 (18 000 + 7 000)
11 655 (6 300 + 5 355)
10 000 30 345

IMM GSM© Page 52 of 141 FM101
1.3.2 Provision for doubtful debts Study reference
Study Cloete & Marimuthu 2008: Chapter 4 – Year-end adjustments, provision
for doubtful debts.
When sales are allowed on credit, the possibility exists that some of the debtors
will not pay their outstanding debt. It is prudent that some provision for doubtful
debt is created in order to give a more accurate report on the expected amount
of outstanding debt, including a provision for doubtful debt.
The amount provided for doubtful debt is estimated as a percentage of the total
amount of debt outstanding and is based on past experience and the economic
climate.
The following situations could arise that relate to the provision of bad debt:
Scenario Debit Credit
Write off a bad debt when a provision for bad debt does not exist
Bad debt acc.
(expense) increase
Debtors control acc.
(current asset) decrease
Create provision for doubtful debt
Bad debt acc.
(expense) increase
Provision for doubtful debt acc.
(negative asset) increase
Increase provision for doubtful debt
Bad debt acc.
(expense) increase
Provision for doubtful debt acc.
(negative asset) increase
Decrease provision for doubtful debt
Provision for doubtful debt acc.
(negative asset) decrease
Bad debt acc.
(expense) decrease
Write off a bad debt when provision for bad debt exists
Provision for doubtful debt acc.
(negative asset) decrease
Debtors control acc.
(current asset) decrease

IMM GSM© Page 53 of 141 FM101
Important!
Please ensure that you now work through the provision for doubtful debt
examples in the textbook.
Self-assessment exercise
Now do Exercise 4 in Cloete & Marimuthu 2008: Chapter 4.

IMM GSM© Page 54 of 141 FM101
Solution
Exercise 4
ZZ Traders journal entry as at 28 February – bad debts
Debit Credit
Bad debts
Debtors control
640
640
Write off bad debt
Debit Credit
Bad debts
Provision for doubtful debts
728
728
Adjust provision for doubtful debts to 5% of outstanding debtors
Outstanding debtors balance R 58 200 – 640 = R57 560
Provision for doubtful debts should be (57 560 x 5%) = R2 878
Currently the provision for doubtful debts is = R2 150
Therefore the provision must be increased by R728 in order to equal R2 878.
ZZ Traders income statement as at 28 February
Less: Operating Expenses
Bad Debts Expense (9 360 + 640 + 728) R10 728
ZZ Traders balance sheet as at 28 February
Current assets
Debtors (58 200 – 640) R57 560
Less: Provision for doubtful debts R2 878

IMM GSM© Page 55 of 141 FM101
1.3.3 Prepaid expenses Study reference
Study Cloete & Marimuthu 2008: Chapter 4 – Year-end adjustments, prepaid
expenses.
Prepaid expenses refer to payments made in one accounting period but are
only due in the following accounting period. The matching principle requires
that the amounts due in the following accounting period should be excluded
from the expense for the current accounting period.
Important!
Please ensure that you now work through the prepaid expenses examples in
the textbook.
Accrued expenses
Study Cloete & Marimuthu 2008: Chapter 4 – Year-end adjustments, accrued
expenses.
Accrued expenses refer to payments due in the current accounting period but
not yet paid. The matching principle requires that the amounts due in the
current accounting period should be written off against income in the current
accounting period.
Important!
Please ensure that you now work through the prepaid expenses examples in
the textbook.

IMM GSM© Page 56 of 141 FM101
1.3.4 Accrued income Study reference
Study Cloete & Marimuthu 2008: Chapter 4 – Year-end adjustments, accrued
income.
Accrued income refers to income earned in the current accounting period but
not yet received. The matching principle requires that the income earned in the
current year should be recorded in full in the current accounting period.
Important!
Please ensure that you now work through the prepaid expenses examples in
the textbook.
1.3.5 Income received in advance
Study Cloete & Marimuthu 2008: Chapter 4 – Year-end adjustments, income
received in advance.
Income received in advance refers to income earned in the current accounting
period but not yet received. The matching principle requires that the income
received in the current accounting period but only earned in the following
accounting period should be recorded in the following accounting period.
Important!
Please ensure that you now work through the prepaid expenses examples in
the textbook.
You should have mastered learning outcome 2 if you have studied the section and have attempted the exercises.

IMM GSM© Page 57 of 141 FM101
Self-assessment exercise
Now do Exercises 5, 6, 7and 8 in Cloete & Marimuthu 2008: Chapter 4.
Solution
Exercise 5
Purchases I/S Cost of sales Loan: ABC Bank B/S Current liab.
Prepaid income B/S Current liability
Depreciation (year)
I/S Expense
Debtors B/S Current asset Refreshments I/S Expense
Wages I/S Expense Equipment B/S Current asset
Rent paid I/S Expense Accumulated depreciation
B/S Non-current asset
Interest received I/S Income Drawings B/S Owner’s equity
Unused stationery
B/S Current asset Prepaid expenses B/S Current asset
Accrued income B/S Current asset Accrued expense B/S Current liability
IMM GSM© Page 58 of 141 FM101
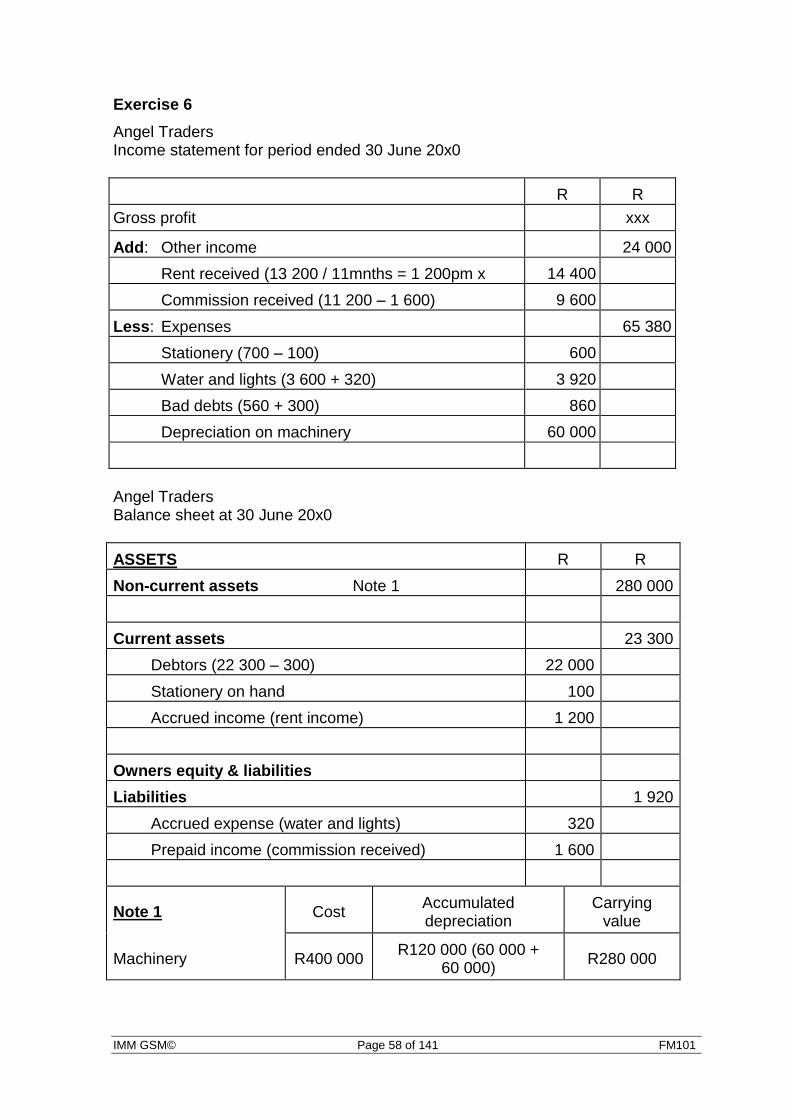
Exercise 6
Angel Traders Income statement for period ended 30 June 20x0
R R
Gross profit xxx
Add: Other income 24 000
Rent received (13 200 / 11mnths = 1 200pm x 12mnths
14 400
Commission received (11 200 – 1 600) 9 600
Less: Expenses 65 380
Stationery (700 – 100) 600
Water and lights (3 600 + 320) 3 920
Bad debts (560 + 300) 860
Depreciation on machinery 60 000
Angel Traders Balance sheet at 30 June 20x0
ASSETS R R
Non-current assets Note 1 280 000
Current assets 23 300
Debtors (22 300 – 300) 22 000
Stationery on hand 100
Accrued income (rent income) 1 200
Owners equity & liabilities
Liabilities 1 920
Accrued expense (water and lights) 320
Prepaid income (commission received) 1 600
Note 1 Cost Accumulated depreciation
Carrying value
Machinery R400 000 R120 000 (60 000 +
60 000) R280 000

IMM GSM© Page 59 of 141 FM101
Exercise 7
Hot Chicks Income statement for the year ended 28 February 20x3
Sales Less: Sales returns
564 369
5 729
Net sales Less: Cost of sales
Opening stock Add: Purchases Less: Purchases returns Add: Carriage on purchases
36 982 364 965 (2 984)
3 696
558 640 360 630
Goods available for sale Less: Closing stock
402 659 (42 029)
Gross profit Add: Other income
Rent received Discount received
13 200 3 690
198 010 16 890
Gross income for the year Less: Operating expenses
Carriage on sales Rates and taxes Salaries and wages Telephone Stationery Repairs Insurance Bad debts (1 365 + 1 065) Depreciation (2 290 + 14 600)
5 642 4 320
67 420 3 622 2 913
995 1 985 2 430
16 890
214 900 106 217
Net profit for the year 108 683

IMM GSM© Page 60 of 141 FM101
Exercise 8
Pretty Princess Delivery Services Income statement for year ended 31 December 20x1
R R
Income: Fees received 49 000
Less: Expenses 31 750
Spares used 10 000
Insurance expense 2 000
Salaries 6 000
Municipal costs 1 500
Rental paid 3 000
Depreciation on office equipment 1 500
Depreciation on delivery 7 000
Interest payable 750
Net income 17 250

IMM GSM© Page 61 of 141 FM101
Pretty Princess Delivery Services Balance sheet at 31 December 20x1
ASSETS R R
Non-current assets Note 1 13 500
Current assets 62 000
Stock of spares (15 000 – 10 000) 5 000
Debtors 20 000
Expenses prepaid (insurance) (3 000 – 2 000) 1 000
Bank 36 000
Total assets 75 500
OWNER’S EQUITY AND LIABILITIES
OWNER’S EQUITY Note 2 44 250
Liabilities
Current liabilities 31 250
Creditors 30 500
Accrued expense (interest) 750
75 500
Note 1 Cost Accumulated depreciation
Carrying value
R R R
Office equipment 5 000 1 500 3 500
Delivery vehicles 17 000 7 000 10 000
13 500
Note 2 Statement of changes in equity
Capital 30 000 Add: Net profit 17 250 Less: Drawings (3 000)
44 250
IMM GSM© Page 62 of 141 FM101
2. Company financial statements Study reference
Study Cloete & Marimuthu 2008: Chapter 5, Sections 5.1 and 5.2 – GAAP and
company terminology.
2.1 Generally Accepted Accounting Principles (GAAP)
International Accounting Standards (IAS) are set by the International
Accounting Standards Board (IASB) which is the main body of The International
Accounting Standards Committee (IASC), located in London, England. The
IASB is an independent accounting standard-setting body, consisting of 14
members from nine countries, including the United States.
When the IASB sets a brand new accounting standard, a number of countries
tend to adopt the standard, or at least interpret it, and fit it into their individual
country’s accounting standards. These standards, as set by each
particular country’s accounting standards board, will in turn influence what
becomes Generally Accepted Accounting Principles for each particular country.
The acronym ‘GAAP’ stands for Generally Accepted Accounting Principles.
The IASC does not set GAAP, nor does it have any legal authority over GAAP.
The IASC can be thought of as merely a very influential group of people who
love making up accounting rules. However, a lot of people actually do listen
to what the IASC and IASB have to say on matters of accounting.
The best way to think of GAAP is as a set of rules that accountants follow. Each
country has its own GAAP, but on the whole, there aren’t many differences
between countries – interpretations might vary from country to country, but
everyone tends to agree that a company can’t simply make up billions of dollars

IMM GSM© Page 63 of 141 FM101
worth of revenue and put it on its books. Every country, in turn, influences the
other countries that follow GAAP.
GAAP are imposed on companies so that investors have a minimum level of
consistency in the financial statements they use when analysing companies for
investment purposes. GAAP cover such things as revenue recognition, balance
sheet item classification and outstanding share measurements. Companies are
expected to follow GAAP rules when reporting their financial data via financial
statements.
That said, keep in mind that GAAP is only a set of standards. There is plenty of
room within GAAP for unscrupulous accountants to distort figures. So, even
when a company uses GAAP, you still need to scrutinise its financial
statements. By law all companies have to use GAAP when preparing financial
statements.
For reporting periods beginning on or after 1 January 2005, South African
statements of GAAP are fully aligned with International Financial Reporting
Standards (IFRS).
2.2 Company terminology
The main difference that distinguishes a company from other forms of
ownership is its limited liability, that is, the owner’s personal assets are
protected.
Four types of profit companies can be identified according to the Companies
Act, 2008:
1) a state-owned company (SOC);
2) a private company (Proprietary Limited) if it is not state-owned and the
Memorandum on Incorporation prohibits it from offering its securities to
the public and restricts the transferability of its securities;

IMM GSM© Page 64 of 141 FM101
3) a personal liability company (Incorporated) if it meets the criteria for a
private company and the Memorandum of Incorporation states that it is a
personal liability company;
4) a public company (Limited) in any other case.
Of these companies, it is only the public company that can sell shares to the
general public.
2.2.1 Share capital
A public company can issue shares, which is known as share capital. Currently,
if companies have par value shares, it means that the fixed value and amount of
issued shares is indicated in the memorandum of association. In the case of
companies with no par value shares, the memorandum of association only
indicates the amount of issued shares as these shares do not have a fixed
value.
A major change introduced by the new Companies Act (Act No.71 of 2008), is
that a share will no longer have a fixed or nominal value (‘par value shares’), but
will be fixed in number only (‘no par value shares’).
Authorised share capital
Authorised share capital is the total number of shares a company is authorised
to issue according to its Memorandum of Incorporation (previously
memorandum of association) and approved by the Commission (previously the
Registrar of Companies).
A company’s Memorandum of Incorporation must set out the classes of shares,
and the number of shares of each class, that the company is authorised to
issue.
Issued share capital
Companies do not issue all their shares – they retain some of their shares as a
reserve. The portion issued is called the issued share capital. Any unissued

IMM GSM© Page 65 of 141 FM101
shares can be issued later by the directors, subject to the rules set out in the
Memorandum of Incorporation.
Share premium
Previously if a share was sold at a premium, then the issue price will be the par
value plus an additional premium. So if a 1 cent nominal value share is issued
at R2.01, then the par value was 1 cent and the premium was R2.00 per share.
The company issuing the shares will receive R2.01 for each share issued.
Under the new Companies Act, 2008 shares will no longer have a par value and
the distinction between the par value and the share premium will fall away.
Types of shares
Shareholders of a company receive a share of the profits in the form of
dividends. Dividends are dependent on the type of share they have purchased
as well as the company’s dividend policy.
A company’s Memorandum of Incorporation must set out the classes of shares,
and with respect to each class of shares a distinguishing designation for that
class; and the preferences, rights, limitations and other terms associated with
that class.
2.2.2 Reserves
Reserves are profits retained in the business and can take various forms.
Non-distributable reserves
These reserves are non-trading profits that cannot be distributed to
shareholders and can for example arise from items such as revaluations of
assets and some foreign exchange movements.
Distributable reserves
Distributable reserves are trading profits that have not been paid out by the
company and may be distributed to shareholders at a later stage.

IMM GSM© Page 66 of 141 FM101
General reserves
Profits that have been retained by the company in order to purchase assets are
set aside under general reserves.
2.2.3 Profits, taxation, reserves and dividends
Companies are liable to pay tax as separate legal entities. Company tax is
payable on profit made during the course of business. Once taxation has been
calculated and provided for payment to the Receiver of Revenue, the remainder
of the profits can be divided between reserves, dividends and retained earnings.
Important!
Please ensure that you now work through Example 1 dealing with:
Provisional tax payments
Tax assessments
Interim dividends
Final dividends
Distribution of net profit earned.
Also work through Example 2 dealing with the preparation of financial
statements.
Self-assessment exercise
Now do Exercise 1 in Cloete & Marimuthu 2008: Chapter 5.
You should have mastered learning outcome 3 after you have studied the
text and have attempted the exercise.
IMM GSM© Page 67 of 141 FM101
Solution
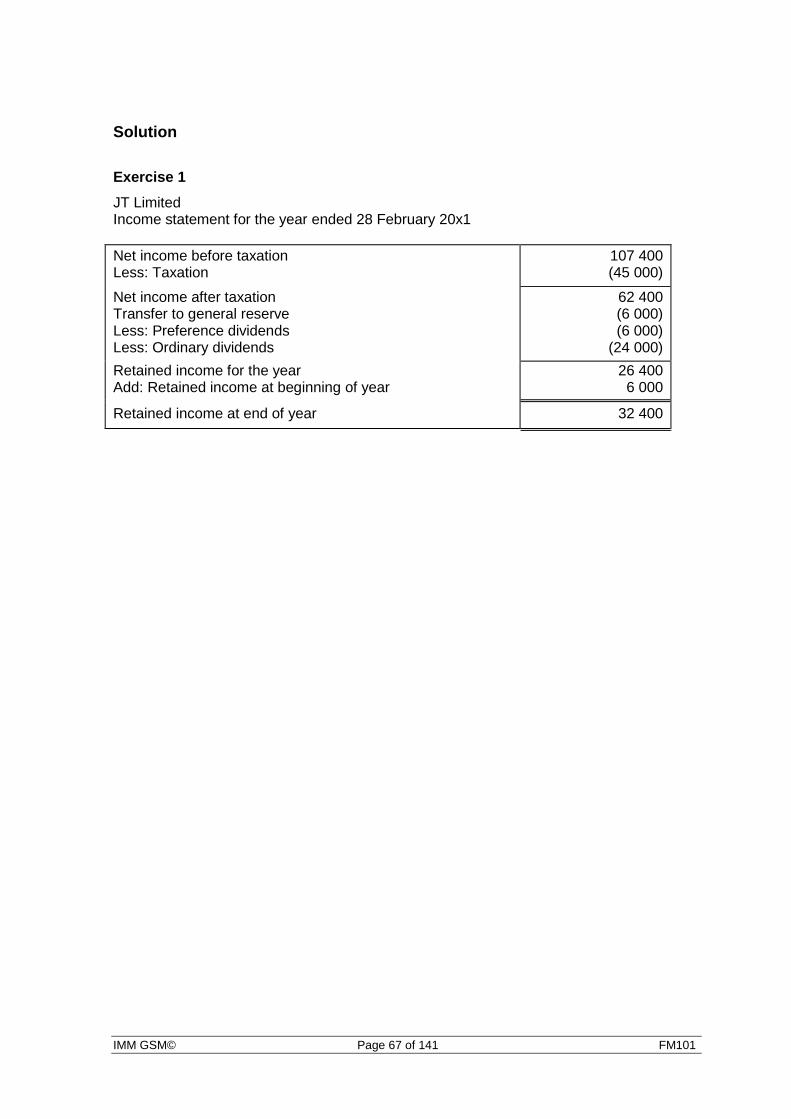
Exercise 1
JT Limited Income statement for the year ended 28 February 20x1
Net income before taxation Less: Taxation
107 400 (45 000)
Net income after taxation Transfer to general reserve Less: Preference dividends Less: Ordinary dividends
62 400 (6 000) (6 000)
(24 000)
Retained income for the year Add: Retained income at beginning of year
26 400 6 000
Retained income at end of year 32 400

IMM GSM© Page 68 of 141 FM101
JT Limited Balance sheet as at 28 February 20x1
Cost Accumulated depreciation
Book value
ASSETS
Non-current assets
Land & buildings 180 000 180 000
Motor vehicles 72 000 26 400 45 600
Equipment 62 400 19 200 43 200
314 400 45 600 268 800
Investment 63 600
Current assets 273 000
Stock 114 000
Debtors 159 000
TOTAL ASSETS 605 400
EQUITY & LIABILITIES
Shareholders’ equity
Issued share capital
Ordinary share capital 240 000
Preference share capital 60 000
General reserve (12 + 6) 18 000
Retained income 32 400
350 400
Non current liabilities 96 000
Long-term loan 96 000
Current liabilities 159 000
Creditors 84 000
Bank overdraft 18 000
Receiver of Revenue (45 - 18)
27 000
Shareholders for dividends (24 + 6)
30 000
TOTAL EQUITY & LIABILITIES 605 400
Note to the balance sheet Authorised share capital
300 000 ordinary shares at R1 each
300 000
70 000 10% preference shares at R1 each
70 000
370 000
IMM GSM© Page 69 of 141 FM101
2.3 Annual financial statements of public companies
This section together with the next section is intended to give you a complete
picture of annual financial statements of public companies. Please consider this
section as important reading material as it indicates the level of complexity that
accountants and users of financial statements sometimes have to deal with.
Financial statements of public companies have to be prepared according to
specific guidelines as determined by the Companies Act 71 of 2008, which
stipulates that annual financial statements are to be produced in the strict and
complicated international financial reporting standards (IFRS) and the
international auditing standards (IAS).
IFRS financial statements consist of:
A balance sheet
Income statement
Either a statement of changes in equity (SOCE) or a statement of
recognised income or expense (SORIE)
A cash flow statement
Notes, including a summary of the significant accounting policies.
Furthermore, annual financial statements of a public company must also
include:
An auditor’s report
A report by the directors with respect to the state of affairs, the business
and profit or loss of the company, or of the group of companies, if the
company is part of a group
The remuneration, and benefits received by each director, or individual
holding any prescribed office in the company.
The International Accounting Standards Board (IASB) issued an accounting
statement announcing changes to the titles of financial statements as they will
be used in International Financial Reporting Standards (IFRS):

IMM GSM© Page 70 of 141 FM101
‘Balance sheet’ will become ‘statement of financial position’
‘Income statement’ will become ‘statement of comprehensive income’
‘Cash flow statement’ will become ‘statement of cash flows’.
Entities are not required to use the new titles in their financial statements.
The CFA Institute is a global association of investment professionals
comprising the world’s largest association of investment professionals. With
over 100,000 members, and regional societies around the world, they are
dedicated to developing and promoting the highest educational, ethical, and
professional standards in the investment industry.
The CFA Institute’s Centre for Financial Market Integrity has developed a
comprehensive manual for practitioners interested in guidelines to assisting in
achieving best practice in Excellence in Corporate Reporting:
“A COMPREHENSIVE BUSINESS REPORTING MODEL: Financial Reporting for
Investors”
According to the publication mentioned above, “financial statements should be
reported from the perspective of the shareholder who bears the ultimate risk,
and with the shareholder’s best interests held paramount. Accordingly, they
state that financial statements should be fully transparent and report the fair
values of all assets, liabilities, exchanges, and transactions that could
potentially impact the investor and that all assets and liabilities should be
included in the balance sheet, with no hidden assets, hidden debt, or hidden
obligations.”
Source: http://www.cfainstitute.org/about/strategy/principles/Pages/index.aspx
The following model financial statements were published by Deloitte and are
available from http://www.iasplus.com/fs/fs.htm#2009ifrsmod.

IMM GSM© Page 71 of 141 FM101
2.3.1 Model income statement
International GAAP Holdings Limited
Consolidated statement of comprehensive income for the year ended 31 December 2009
Notes Year ended 31/12/09
Year ended 31/12/08
CU’000 CU’000 Continuing operations
Revenue 5 140,918 151,840 Cost of sales (87,897) (91,840)
Gross profit 53,021 60,000 Investment revenue 7 3,608 2,351 Other gains and losses 8 647 1,005 Distribution expenses (5,087) (4,600) Marketing expenses (3,305) (2,254) Occupancy expenses (2,128) (2,201) Administration expenses (11,001) (15,124) Finance costs 9 (4,418) (6,023) Other expenses (2,801) (2,612) Share of profits of associates 20 1,186 1,589 Gain recognised on disposal of interest in former associate 20 581 -
Profit before tax 30,303 32,131 Income tax expense 10 (11,564) (11,799)
Profit for the year from continuing operations 13 18,739 20,332 Discontinued operations Profit for the year from discontinued operations 11 8,310 9,995
PROFIT FOR THE YEAR 27,049 30,327
Other comprehensive income Exchange differences on translating foreign operations (39) 85 Net value gain on available-for-sale financial assets 66 57 Net value gain on cash flow hedges 39 20 Gain on revaluation of properties - 1,150 Share of other comprehensive income of associates - -
Other comprehensive income for the year, net of tax 66 1,312
TOTAL COMPREHENSIVE INCOME FOR THE YEAR 27,115 31,639
Profit attributable to: Owners of the Company 23,049 27,564 Non-controlling interests 4,000 2,763
27,049 30,327
Total comprehensive income attributable to: Owners of the Company 23,115 28,876 Non-controlling interests 4,000 2,763
27,115 31,639
continued...
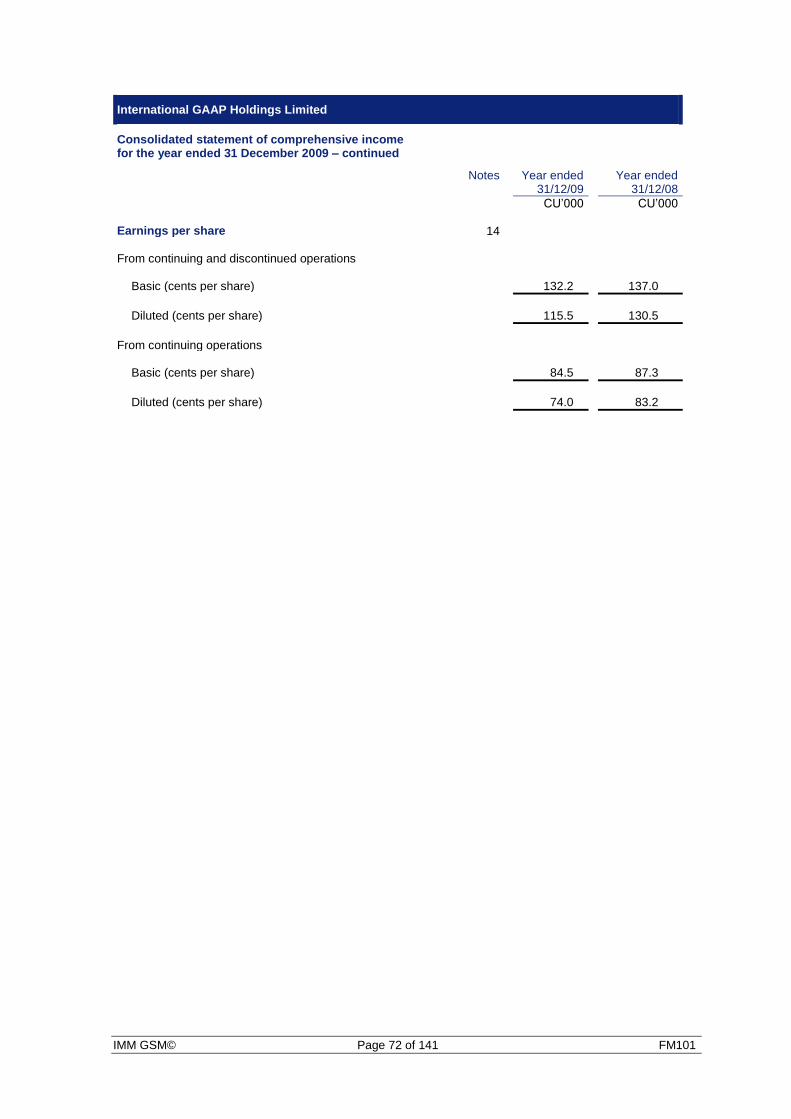
IMM GSM© Page 72 of 141 FM101
International GAAP Holdings Limited
Consolidated statement of comprehensive income for the year ended 31 December 2009 – continued
Notes Year ended 31/12/09
Year ended 31/12/08
CU’000 CU’000 Earnings per share 14 From continuing and discontinued operations Basic (cents per share) 132.2 137.0
Diluted (cents per share) 115.5 130.5
From continuing operations Basic (cents per share) 84.5 87.3
Diluted (cents per share) 74.0 83.2
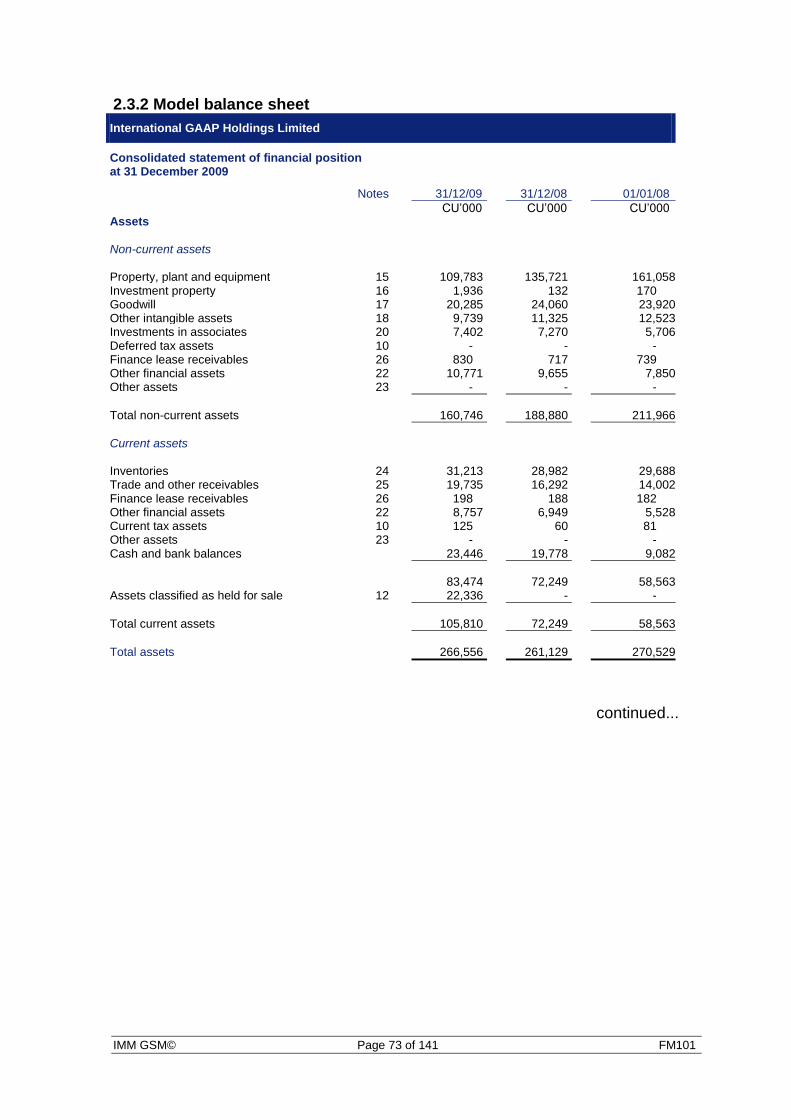
IMM GSM© Page 73 of 141 FM101
2.3.2 Model balance sheet
International GAAP Holdings Limited
Consolidated statement of financial position at 31 December 2009
Notes 31/12/09 31/12/08 01/01/08
CU’000 CU’000 CU’000 Assets Non-current assets
Property, plant and equipment 15 109,783 135,721 161,058 Investment property 16 1,936 132 170 Goodwill 17 20,285 24,060 23,920 Other intangible assets 18 9,739 11,325 12,523 Investments in associates 20 7,402 7,270 5,706 Deferred tax assets 10 - - - Finance lease receivables 26 830 717 739 Other financial assets 22 10,771 9,655 7,850 Other assets 23 - - -
Total non-current assets 160,746 188,880 211,966
Current assets Inventories 24 31,213 28,982 29,688 Trade and other receivables 25 19,735 16,292 14,002 Finance lease receivables 26 198 188 182 Other financial assets 22 8,757 6,949 5,528 Current tax assets 10 125 60 81 Other assets 23 - - - Cash and bank balances 23,446 19,778 9,082
83,474 72,249 58,563 Assets classified as held for sale 12 22,336 - -
Total current assets 105,810 72,249 58,563
Total assets 266,556 261,129 270,529
continued...
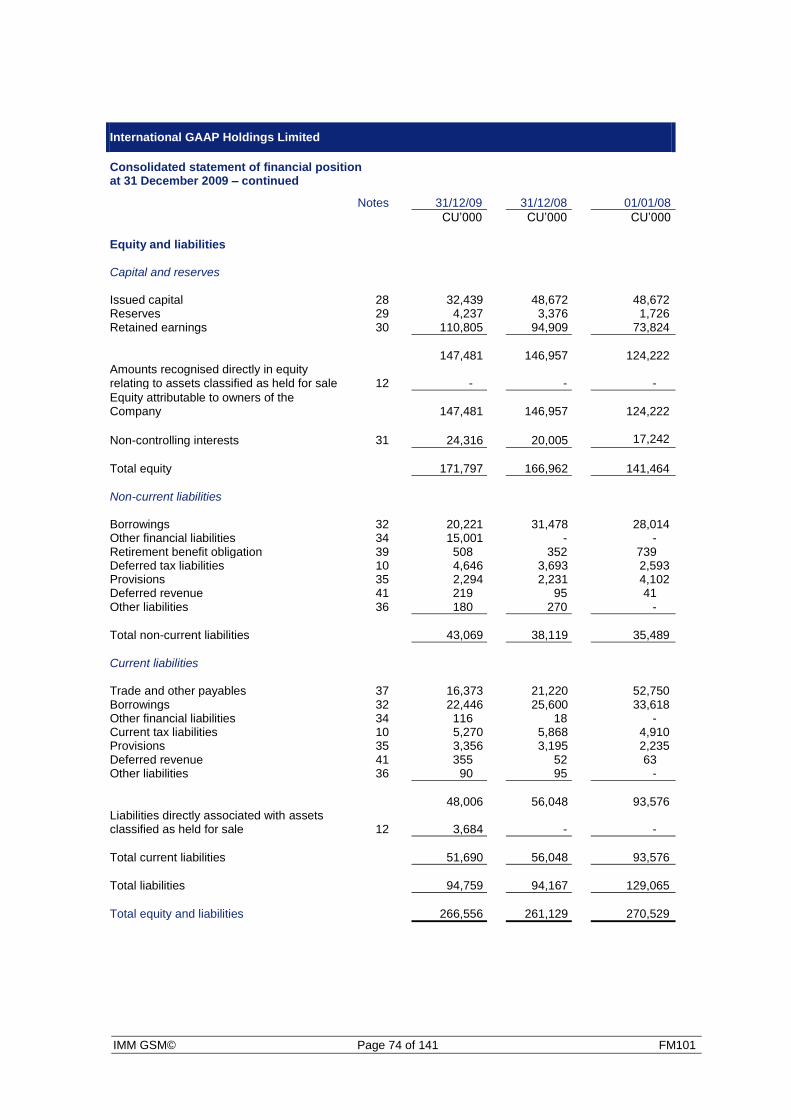
IMM GSM© Page 74 of 141 FM101
International GAAP Holdings Limited
Consolidated statement of financial position at 31 December 2009 – continued
Notes 31/12/09 31/12/08 01/01/08
CU’000 CU’000 CU’000 Equity and liabilities Capital and reserves Issued capital 28 32,439 48,672 48,672 Reserves 29 4,237 3,376 1,726 Retained earnings 30 110,805 94,909 73,824
147,481 146,957 124,222 Amounts recognised directly in equity relating to assets classified as held for sale 12 -
-
-
Equity attributable to owners of the Company 147,481
146,957
124,222
Non-controlling interests 31 24,316 20,005 17,242
Total equity 171,797 166,962 141,464
Non-current liabilities
Borrowings 32 20,221 31,478 28,014 Other financial liabilities 34 15,001 - - Retirement benefit obligation 39 508 352 739 Deferred tax liabilities 10 4,646 3,693 2,593 Provisions 35 2,294 2,231 4,102 Deferred revenue 41 219 95 41 Other liabilities 36 180 270 -
Total non-current liabilities 43,069 38,119 35,489
Current liabilities Trade and other payables 37 16,373 21,220 52,750 Borrowings 32 22,446 25,600 33,618 Other financial liabilities 34 116 18 - Current tax liabilities 10 5,270 5,868 4,910 Provisions 35 3,356 3,195 2,235 Deferred revenue 41 355 52 63 Other liabilities 36 90 95 -
48,006 56,048 93,576 Liabilities directly associated with assets classified as held for sale 12 3,684
-
-
Total current liabilities 51,690 56,048 93,576
Total liabilities 94,759 94,167 129,065
Total equity and liabilities 266,556 261,129 270,529

IMM GSM© Page 75 of 141 FM101
2.3.3 Model cash flow statement (direct method)
International GAAP Holdings Limited
Consolidated statement of cash flows for the year ended 31 December 2009
Notes Year ended 31/12/09
Year ended 31/12/08
CU’000 CU’000 Cash flows from operating activities Receipts from customers 211,032 214,487 Payments to suppliers and employees (165,666) (181,378)
Cash generated from operations 45,366 33,109 Interest paid (4,493) (6,106) Income taxes paid (13,848) (13,340)
Net cash generated by operating activities 27,025 13,663
Cash flows from investing activities Payments to acquire financial assets (3,163) (2,163) Proceeds on sale of financial assets 938 1,712 Interest received 2,315 1,313 Royalties and other investment income received 1,137 884 Dividends received from associates 30 25 Other dividends received 156 154 Amounts advanced to related parties (738) (4,311) Repayments by related parties 189 1,578 Payments for property, plant and equipment (22,932) (11,875) Proceeds from disposal of property, plant and equipment 11,462 21,245 Payments for investment property (10) (12) Proceeds from disposal of investment property - 58 Payments for intangible assets (6) (358) Net cash outflow on acquisition of subsidiaries 44 (477) - Net cash inflow on disposal of subsidiary 45 7,566 - Net cash inflow on disposal of associate 360 -
Net cash (used in)/generated by investing activities (3,173) 8,250
Cash flows from financing activities Proceeds from issue of equity shares 414 - Proceeds from issue of convertible notes 4,950 - Payment for share issue costs (6) - Payment for buy-back of shares (17,011) - Payment for share buy-back costs (277) - Proceeds from issue of redeemable preference shares 15,000 - Proceeds from issue of perpetual notes 2,500 - Payment for debt issue costs (595) - Proceeds from borrowings 17,122 26,798 Repayment of borrowings (37,761) (23,209) Proceeds from government loans 2,610 - Proceeds on disposal of partial interest in a subsidiary 213 - Dividends paid on redeemable preference shares (613) - Dividends paid to owners of the Company (6,635) (6,479)
Net cash used in financing activities (20,089) (2,890)
Net increase in cash and cash equivalents 3,763 19,023 Cash and cash equivalents at the beginning of the year 19,400 561 Effects of exchange rate changes on the balance of cash held in foreign currencies (80)
(184)
Cash and cash equivalents at the end of the year 46 23,083 19,400
2.4 Reading financial statements

IMM GSM© Page 76 of 141 FM101
In this section we will describe the financial statements with reference to the
model financial statements provided in the previous pages.
2.4.1 Income statement
The income statement measures the operating performance during a given
accounting period. It reflects the normal operating transactions, and includes
losses or gains on the disposal of assets and other non-recurring and
extraordinary events. Unlike the balance sheet, which shows the condition of a
firm at a specific point in time, the income statement measures the income over
a period.
Revenue is measured at the fair value of the consideration received or
receivable. Revenue is usually reduced for estimated customer returns,
rebates and other similar allowances.
Cost of Sales (C.O.S. for short) is the expense a company incurred in
order to manufacture, create, or buy inventory. It includes the purchase
price of the raw material as well as the expenses of turning it into a
product. The table that follows shows the cost of sales calculations for a
trading firm and a manufacturing firm, respectively.
Trading Company Manufacturing Company
Opening Stock
Plus Purchases
Plus Other Charges
(customs duty, freight, railage)
Less Closing Stock
Opening Stock
Plus Manufacturing Labour
Plus Raw Material
Plus Manufacturing Overhead
Less Closing Stock
Gross profit is the total revenue subtracted by the cost of generating
that revenue. It tells you how much money a business would have made

IMM GSM© Page 77 of 141 FM101
if it didn’t pay any other expenses such as salaries, general
administration expenses and income taxes.
Investment revenue comprises rental income earned through
investment properties and interest received earned through assets such
as bank deposits.
Other gains and losses arise from items such as:
Gain/(loss) on disposal of property, plant and equipment
Gain/(loss) on disposal of available-for-sale investments
Government grants received for staff retraining
Net foreign exchange gains/(losses)
Gain/(loss) arising on effective settlement of legal claims.
Distribution expenses are costs to the business when sending its
finished goods out to customers and may also include payroll costs
(salaries, commissions, and travel expenses of executives, salespeople
and employees), involved in sales.
Marketing expenses advertising expenses a company incurs in selling
the products or services.
Occupancy expenses include rent, depreciation and amortisation,
utilities, maintenance, insurance, rates and taxes, and other expenses of
premises occupied by the business.
Administration expenses consists of salaries paid to employees not
directly involved in the selling of the product, research and development
costs, and other miscellaneous charges that must be subtracted from the
company’s income.
Finance cost relates to interest paid on bank overdrafts, loans and
financial lease obligations.

IMM GSM© Page 78 of 141 FM101
Income tax represents the sum of the tax currently payable and deferred
tax. The tax currently payable is based on taxable profit for the year.
Taxable profit differs from profit as reported in the income statement
because of items of income or expense that are taxable or deductible in
other years and items that are never taxable or deductible.
2.4.2 Balance sheet
Assets
Assets are grouped into non-current assets and current assets.
Non-current assets are assets intended for continuing use over a period
longer than 12 months. Examples include:
Property, plant and equipment
Investments
Goodwill
Other intangible assets.
Intangible assets cannot be seen or touched and include items such as
goodwill, patents, brands and trade marks.
Goodwill in financial statements arises when a company is purchased for
more than the fair value of the identifiable assets of the company. The
difference between the purchase price and the sum of the fair value of
the net assets is by definition the value of the ‘goodwill’ of the purchased
company.
Although goodwill is technically an intangible asset, goodwill and
intangible assets are usually listed as separate items on a company’s
balance sheet.
The International Financial Reporting Standards (IFRS) require that all costs, both
tangible and intangible involved in the purchase of one company by another to be

IMM GSM© Page 79 of 141 FM101
reported. However, it is not easy to accurately value intangible assets such as brands.
In an article in Business Day, Dr. Roger Sinclair, Professor of marketing at the
Witwatersrand and MD of valuation firm BrandMetrics, wrote an article “Measuring
Value: when fair seems foul”, on the difficulty of valuing brands where he referred to the
Barclays-ABSA deal. Barclays Bank had to report the ABSA brand value in their
balance sheet, but at a value which Dr. Sinclair regards to be a very unrealistic
valuation. The ABSA brand was only valued at £172m or about R1,8bn as reported in
Barclays Bank annual financial statements, when ABSA earned R4.5bn in the year of
the takeover and had assets worth R80bn. He comments that “The notion of brands as
assets is very new to accountants and it will take some time for them to understand that
they differ drastically from what they are used to.”
Current assets are those that form part of the circulating capital of a
business. They are replaced frequently or converted into cash during the
course of trading. The most common current assets are:
Inventory (stock)
Trade receivables (debtors or account receivables)
Cash.
The inventory of a manufacturer is composed of three groups:
Raw materials to be used in the product
Partially finished goods in process of manufacture
Finished goods ready for shipment to customers.
The generally accepted method of valuation of the inventory is cost or
market, whichever is lower. This gives a conservative figure. Where this
method is used, the value for balance sheet purpose will be cost, or
perhaps less than cost if, as a result of deterioration, obsolescence,
decline in prices, or other factors, less than cost can be realised on the
inventory. Inventory valuation includes an allocation of production and
other expenses as well as the cost of materials.

IMM GSM© Page 80 of 141 FM101
Trade receivables represent the amount due from customers but not yet
collected. When goods due are shipped prior to collection, a receivable is
recorded. Customers are usually given 30, 60, or 90 days in which to pay.
Experience shows that some customers fail to pay their bills, either because of
financial difficulties or some catastrophic event befalling their business.
Therefore, in order to show the trade receivable item at a figure representing
expected receipts, the total is after a provision for doubtful accounts.
Cash represents notes and coins and money on deposit in the bank.
Prepaid expenses may arise for a situation such as this: During the
year, insurance premiums and advertising charges for the next year are
paid. Those insurance premiums and advertising service are as yet
unused at the balance sheet date, so there exists an unexpended item,
which will be used up over the next 12 months. If the advance payments
had not been made, the company would have more cash in the bank. So,
payments made in advance from which the company has not yet
received benefits, but for which it will receive benefits next year, are
listed among current assets as prepaid expenses.
Capital and reserves
Issued capital and reserves
Issued capital refers to the funds invested in the firm by the owners or
shareholders. This section of the balance sheet also shows any
reserves that have been retained in the firm. The reserves can be either
classified as distributable or non-distributable reserves. Distributable
reserves can be handed out to shareholders by way of dividend
payments.
Retained earnings
When a firm generates a profit, management has one of two choices:
they can either pay it out to shareholders as a cash dividend, or retain
the earnings and reinvest them in the business. When the executives
decide that earnings should be retained, they have to account for them

IMM GSM© Page 81 of 141 FM101
on the balance sheet under Shareholder Equity. This allows investors to
see how much money has been put into the business over the years.
Liabilities
Liabilities are debts owed to other parties. Non-current liabilities are
debts incurred by the firm that are not payable within the next 12 months
such as secured or unsecured loans.
Current liabilities are debt owed and payable within the next 12 months
such as accrued expenses, creditors and bank overdrafts. An accrued
expense is a debt that has been incurred or has accumulated over a
period of time and must be paid but has not yet been paid.
Contingent liabilities are debts that the firm may be faced with in future.
Examples of contingent liabilities include legal disputes, guarantees or
assets financed with residual values. These are revealed in the notes to
the balance sheet.
2.4.3 The cash flow statement
The cash flow statement forms part of the annual financial statements and tells
us where the cash came from went to and what happened to the balance sheet
for the period in question. Unlike the income statement that explains changes
in one balance sheet item only, i.e. retained earnings, the cash flow statement
explains the sources from which the firm acquired its funds and the uses to
which they were put.
The cash flow statement comprises four sections that can broadly be labelled
as
cash flows from operating activities,
cash utilised in investing activities,
cash flows from financing activities, and
cash and cash equivalent summation.

IMM GSM© Page 82 of 141 FM101
The current income statement and balance sheet for the current and previous
year is required for construction of the cash flow statement.
Cash from operating activities
Typically this section will reflect the income from normal trading activities such
as the trading profit plus depreciation (remember that depreciation is not a cash
expense). The net result of changes to working capital (current assets and
current liabilities) is also reflected in this section of the cash flow statement.
Finally other expenses such as dividend payments and taxation are subtracted
to arrive at the net cash flow from operating activities.
Cash utilised in investing activities
This section will reflect expenditure such as the replacement of properties,
fixtures, equipment and vehicles for the purpose of maintaining or expanding
the current level of activities in the firm. It may also reflect the proceeds on
disposal of properties, fixtures, equipment and vehicles.
Cash flows from financing activities
The firm is also funded by external sources. In this section changes to the
external sources of funds are reflected. It may include items such as the
redemption of preferential shares, buyback of shares, issuing of shares,
increasing or decreasing interest-bearing debt.
Cash and cash equivalent summation
The final section of the cash flow statement shows the net increase or decrease
in cash and cash equivalents for the current year. The cash and cash
equivalents balance from the previous year are added to this number to arrive
at the cash and cash equivalent for the current year.

IMM GSM© Page 83 of 141 FM101
Important!
Buy a newspaper that normally publishes financial news and locate the annual
financial statements of a company of your choice (preferably a retailing
business). Now practice your skill to read the financial statements.
You could also find the annual financial statements for a listed company on the
company website – usually under the heading ‘Investor relations’.
This concludes the section on the reading of financial statements and the study
unit on accounting concepts and terminology.

IMM GSM© Page 84 of 141 FM101
Study Unit 3: Determine the selling price of merchandise
This study unit addresses the concept value added tax, and the calculation of
selling price of merchandise (inclusive and exclusive of VAT) using mark-up on
cost and selling price.
Mastering VAT calculations and mark-up is critical to ensure accurate
calculation of selling prices.
Specific learning outcomes
After studying this unit, you should be able to:
Calculate cost of sales.
Explain VAT concepts and calculate VAT.
Calculate mark-ups on cost price and selling price.
Calculate selling price (inclusive and exclusive of VAT).
Study reference

IMM GSM© Page 85 of 141 FM101
Study Cloete & Marimuthu 2008: Chapter 7 – Value added tax.
1. Value added tax
1.1 Introduction
Value-added tax (more commonly known by its abbreviation, VAT) is an indirect
tax levied by vendors on the supply of goods or services. Vendors, who are
registered for VAT, are generally obliged to charge and collect VAT on taxable
supplies from their customers or clients on behalf of SARS.
VAT is levied and accounted for at the prescribed rate, which is presently 14%
(standard rate), and is ultimately paid by the final consumers of goods and
services. For certain goods and services, a special rate of 0% VAT (zero rate) is
applied, while a limited range of goods and services are exempt. VAT is also
levied on the importation of goods and services.
VAT is only charged on taxable supplies made by a vendor. Taxable supplies
include supplies for which VAT is charged at either the standard rate or zero
rate, but does not include:
Salaries and wages
Hobbies or any private recreational pursuit (unless the hobby becomes a
business)
Private sale of personal or domestic items
Exempt supplies (see section further on in this study unit).
1.2 Vendors
When a business is registered as a vendor, it means two things:
The vendor must collect VAT from customers and pay this VAT to SARS.

IMM GSM© Page 86 of 141 FM101
The vendor can claim back any VAT that is paid on anything bought for
the business.
If the turnover (the total of all the sales, without subtracting the costs) of a
business is more than R1,000,000 per year, then the business must be
registered as a vendor by completing VAT101 and VAT127. When you start a
business and you think the turnover will be more than R1m, then you have to
register as a vendor.
If the turnover of the business is less than R1m per year, the owner can choose
to register or not if taxable supplies of more than R50,000 per year is made. If
you register, this is called voluntary registration. It takes a lot of effort and work
to pay VAT to SARS regularly and to keep all the records the SARS wants a
vendor to have. If you don’t have to register, it is only a good idea to register if
the business buys lots of things from suppliers and can claim back VAT to
reduce the amount of VAT you owe SARS.
If the business is a sole trader or a partnership, the owners must register in their
own names. If the business is a CC or a company, the owners must register in
the name of the business.
1.3 Types of supply
Supplies fall into two categories:
Taxable supplies (standard rate and zero rate)
Exempt supplies.
1.3.1 Taxable supplies
Standard rate
Standard rated supplies are taxed at the rate of 14%.
Zero-rate

IMM GSM© Page 87 of 141 FM101
Zero-rated supplies of goods and services are subject to VAT at the rate of zero
percent. Vendors who make zero rated supplies may recover related input tax
unless it is specifically prohibited. The application of the zero rate to any
transaction must be supported by documentation acceptable to SARS.
Zero-rated supplies include:
Exports
Goods rented out for use outside South Africa
Going concern sales
International transport of goods and/or passengers
Services relating to foreign land
Processing and repairing imported goods which are to be re-exported
Services rendered physically outside South Africa
Certain services rendered to non-residents
The sale of maize meal, bread, milk, fresh fruit and vegetables, rice,
vegetable oil, eggs, legumes and certain other specified basic foodstuffs
Certain gold coins, including Kruger Rands
Gold supplied to the SA Reserve Bank, SA Mint or to any registered
bank.
1.3.2 Exempt supplies
Exempt supplies are supplies of goods or services on which VAT is not
chargeable at either the standard rate or the zero rate and does not form part of
taxable turnover. If a business makes only exempt supplies, it cannot register
as a vendor for VAT purposes. Accordingly, VAT incurred on any expenses in
order to make exempt supplies may not be claimed as input tax.
Exempt supplies include the following:
Financial services (interest, life insurance, medical schemes, provident,
pension and retirement annuity funds)
Donated goods or services sold by non-profit bodies (e.g. church
bazaars)

IMM GSM© Page 88 of 141 FM101
Renting a dwelling for use as a private home (but not holiday
accommodation)
Passenger transport in South Africa by taxi, bus, or train
Educational services (crèches, primary and secondary schools,
universities, and other institutions registered under an educational Act).
1.4 Paying VAT
1.4.1 Input tax
A vendor can claim back any VAT that is paid on anything bought for the
business. The VAT which the vendor can claim back is called an input credit
and it means tax charged and payable by
a supplier on the supply of goods or services made by that supplier to a
vendor, or
the vendor on the importation of goods, or
a vendor on excise duty in certain circumstances.
The notional input tax paid by a vendor in respect of second-hand and
repossessed goods (see ‘Notional input tax’ below).
‘Notional input tax’ may be claimed by a vendor in certain circumstances, that
is, he/she may claim an amount of input tax which he/she has not actually paid
to the supplier. This applies in respect of
Second-hand goods acquired by the vendor from a non-registered
vendor for the purpose of making a taxable supply, and
goods repossessed by the vendor under an instalment credit agreement.
1.4.2 Output tax
The VAT that is charged by a vendor to customers is called output tax. Output
tax is the tax charged in respect of the supply of goods and services by a
vendor, a supply deemed to have been made during the tax period. For
example, the following transactions are deemed to be supplies for the purposes
of VAT:

IMM GSM© Page 89 of 141 FM101
where goods have been removed from stock for private consumption,
where payment has been received from the State in respect of a taxable
supply of goods and services,
receipt of an indemnity payment under a contract of insurance,
provision of certain fringe benefits, and
certain other adjustments that is, bad debts recovered debit and credit
notes.
1.4.3 VAT payable/refund
Output tax less the input tax in a particular tax period equals the amount
payable/refundable to/by SARS.
Example:
A canning factory buys pineapple pieces from a farmer (registered for
VAT) for R1.14 (including 14c VAT). The factory sells the tin of pineapple
pieces to a supermarket for R2.00 (excluding VAT), and charges VAT of
28c (R2.00 x 14%) on the sale. The total selling price would thus be
R2.28. The 28c VAT is the supermarket’s input tax and the canning
factory’s output tax. The supermarket sells the tin of pineapple pieces to
the customer (not registered for VAT) for R3.42 inclusive of VAT (R3.00
+ 0.42c VAT). The 42c VAT is the supermarket’s output tax. There is no
input tax on the 42c as the customer is not a vendor.
Important!
Please ensure that you now work through illustrative examples 1 and 2.

IMM GSM© Page 90 of 141 FM101
Registration threshold
The registration threshold is amended from time to time. At the time of writing
this learner guide the values in the table were applicable.
Total value of taxable supplies for any 12 month period
Compulsory R1 million (previously R300 000)
Voluntary – 1 March 2010 R50 000 (previously R20 000)
Paying VAT to SARS
If you are registered as a VAT vendor you will have to pay the VAT over to
SARS every few months depending on the category that the business falls into.
Frequency of returns
Months Total value of taxable supplies for any 12 month period
Bi-monthly Up to R29 999 999
Monthly From R30 million
4 monthly Up to R1.5 million (only for small businesses)
6 monthly Up to R1.5 million (only for farming businesses)
Annually Only for inter group letting or administration company or trust fund.

IMM GSM© Page 91 of 141 FM101
2. Determining selling prices
Study reference
Study Cloete & Marimuthu 2008: Chapter 4.3 – Retailers.
2.1 Retailers
Retailers buy products from wholesalers and sell to consumers to make a profit.
A profit is made by adding a mark-up to the cost of the product. The selling
price includes this mark-up and should be high enough to cover the amount
paid for the product plus business expenses plus a profit.
Cost price R1,000
+ Mark-up R 250
= Selling price R1,250
2.2 Accounting for stock
The products purchased for resale are called trading stock. The way in which
trading stock is controlled and accounted for is very important to the profitability
of the business.
In a retailing business stock is accounted for by using either the perpetual or
periodic method.
2.2.1 Perpetual method
According to the perpetual method the selling price and the cost price are
known for each item sold. It is therefore easy to work out how profitable each
item is by matching selling price to cost price of the good.

IMM GSM© Page 92 of 141 FM101
The amount of mark-up (the amount by which the selling price exceeds the cost
price) is known as gross profit.
Gross profit = selling price less cost price
2.2.2 Periodic method
Firms that trade in large volume of goods may find the perpetual method
unpractical and will rather adopt the periodic method.
As long as the retailer sells all his stock, the calculation of gross profit is the
same as in the perpetual method. With the periodic method the retailer will
calculate the cost price of goods sold by using the formula:
Cost of sales = opening stock plus purchases less closing stock
Periodic physical stock take will be required under this method.
Under the periodic method various items affect the purchases account:
Carriage on purchases
Railage in, freight in
Cost of transporting goods purchased to the
business premises. It increases the value of
purchases.
Purchases returns
Returns outwards
Goods returned to the supplier. It decreases the
value of purchases.
Customs/import duties Cost of bringing goods into the country. It increases
the value of purchases.
Under the periodic method sales returns affect the sales account:
Sales returns
Returns inwards
Goods returned by the clients. It decreases the
value of sales.
The sales account is unaffected by:
Carriage on sales
Railage out, freight out
Cost of transporting goods sold to the client. It is
treated as a normal operating expense.

IMM GSM© Page 93 of 141 FM101
Important!
Please ensure that you now work through Example 3, Chapter 4, in the
textbook.
You should now understand how the cost price of the product is determined.

IMM GSM© Page 94 of 141 FM101
2.3 Mark-up on cost price
Study reference
Study Cloete & Marimuthu 2008: Chapter 7, Section 7.5 – Mark-up.
2.3.1 Percentage mark-up on cost price
Turning a profit is paramount when running a business. In order to make a
profit, you need to calculate a mark-up on the price you are going to charge for
goods or services. Determine what price mark-up to charge for your product or
service by following these steps.
Step 1 Determine your product/service cost. How much did it cost you?
The cost includes the price paid for an item or materials plus carriage
on purchases, plus customs/import duties plus the labour required for
processing less purchases returned. Additional expenditures, such as
breakage or spoilage, may also be counted as part of cost.
As an example, let’s assume the product cost is R1.40.
Step 2 Determine the percentage mark-up you wish to apply. Research your
industry to apply a mark-up that will be competitive. In this example,
we will use 30 percent.
Step 3 Convert the percentage mark-up to a decimal. In this case, a 30
percent mark-up would translate to 0.30 (30 divided by 100).
Step 4 Subtract the decimal in STEP 3 from 1. In this example, 1 minus 0.30
equals 0.70.
Step 5 Compute the total selling price by taking the cost from STEP 1 and
dividing it by the result from STEP 4. In this example, R1.40 is divided
by 0.70. The result is R2.00, which should be the total selling price.
Step 6 Calculate the price mark-up by subtracting the product cost from the
selling price. In this example, the R2.00 selling price minus the R1.40
product cost gives you a price mark-up of R0.60.

IMM GSM© Page 95 of 141 FM101
2.3.2 Impact of VAT
VAT must be excluded from mark-up calculations to ensure that goods are not
overpriced. ‘Marked price’ refers to the price including VAT and the term
‘selling price’ refers to the amount which is received excluding VAT.
Cost price Mark-up Selling price VAT @ 14% Marked price
R100 R10 R110 R15.40 R125.40
100% 10% 110%
100% 14% 114%
Reminder: Sales (turnover) is reported in the income statement excluding VAT.
Self-assessment exercise
Now do Exercises 1, 3 and 5 in Cloete & Marimuthu 2008: Chapter 7.
You should now be able to master learning outcome 3 as well as 4.

IMM GSM© Page 96 of 141 FM101
Solutions
Exercise 1
Vat = 14/100 x R900 = R126 Marked price (Vat inclusive) = R900 + R126 = R1 026 Or using formula = 114 / 100 x R900 = R1 026
Exercise 3
a) Cost price = 100% / 140% x R1260 = R900
(Mark up is on cost price, therefore cost is 100% and selling price is 140%)
b) Selling price = 100% / 60% x R640 = R1 067
(Mark up is on selling price, i.e. gross margin, therefore selling price is 100% and cost is 60%.)
c) Mark up % = R845 – R650 x 100 R650 1
= 30%
Exercise 5
Cost price % mark up Selling price
R100 50% on selling price R200
R150 40% on cost price R210
R280 30% (R84) R364

IMM GSM© Page 97 of 141 FM101
Study Unit 4: Cost classification and terminology
This study unit addresses the classification of costs into their various
categories.
Mastering cost classification is important as you will require this knowledge to
make cost control and pricing decisions.
Specific learning outcomes
After studying this unit, you should be able to:
Classify cost in relation to product or period.
Classify behaviour of cost in relation to volume of production.
Classify cost for control or evaluation.
Classify relevant and non-relevant costs for decision making.

IMM GSM© Page 98 of 141 FM101
1. Introduction
In financial accounting, costs and expenses are used interchangeably. In
managerial accounting, costs differ from expenses. An asset is a cost. As
future economic benefit of an asset decreases, the original cost of the asset
expires and the cost becomes an expense. Expenses are matched with
revenues on the income statement. A good example for understanding a cost
and expense would be a fixed asset. When it is purchased, it is a cost to an
entity and is shown on the balance sheet. When the fixed asset is used, it is
depreciated and a portion of the cost becomes a depreciation expense, which is
included in the income statement and matched with the revenue generated
during the period.
Study reference
Please read Cloete & Marimuthu 2008: Chapter 8 – Cost classification and
terminology.
2. Cost classification in relation to the product or period
The classification of costs and expenses begins by relating them to the different
phases in a business’s operation. In a manufacturing firm, total operating costs
consists of manufacturing costs and non-manufacturing costs.
2.1 Manufacturing costs
During the manufacture of products, we incur direct materials cost, direct labour
costs and manufacturing overheads (comprising indirect labour and indirect
materials). We can classify direct labour and direct material jointly as prime
cost. We can also classify direct labour and manufacturing cost as conversion
cost.
2.2 Non-manufacturing costs

IMM GSM© Page 99 of 141 FM101
Costs associated with an accounting period rather than with a specific product
can be classified as non-manufacturing costs, such as marketing expenses and
administrative expenses.
3. Cost classification in relation to volume of production
Some costs change in proportion to units produced, some only slightly react to
changes in production, and others don’t change at all. The factors impacting
changes in costs are cost drivers and are discussed below.
3.1 Fixed costs
Fixed costs are costs that do not vary as volume varies and include
depreciation on plant and equipment (if it is allocated on a straight line basis),
rentals, salaries of administration staff and general office expenses.
Important!
Please ensure that you now work through the fixed cost illustrative example in
the textbook.

IMM GSM© Page 100 of 141 FM101
Although the total fixed cost remains the same as the number of units produced
changes, the fixed cost per unit changes. The more units are produced, the less
the fixed cost per unit is.
3.2 Variable costs
Variable costs are costs that vary in explicit relation to changes in volume; such
material used in production, manufacturing labour costs and delivery expenses
and sales commission.

IMM GSM© Page 101 of 141 FM101
Important!
Please ensure that you now work through the variable cost illustrative example
in the textbook.
3.3 Semi-variable, semi-fixed or mixed costs
These costs contain both a fixed and a variable portion. The fixed portion is the
basic charge for having a service ready and obtainable, e.g. telephone rental
charge. The variable portion represents the charges made for the actual use of
the service, e.g. the call charges.
Important!
Please ensure that you now work through the semi-variable cost illustrative
example in the textbook.
4. Cost classification for control or evaluation
Some costs are not controllable by a manager and should therefore not form
part of his/her performance evaluation. The criteria for judging this should be
whether the manager has power to authorise or allow a particular cost, in which
case it is regarded as a controllable cost.
5. Cost classification for decision making
Decision making among various alternatives or actions should be based on
costs and revenue that are relevant to the choice.
5.1 Relevant costs
The costs which should be used for decision making are often referred to as
‘relevant costs’. CIMA defines relevant costs as ‘costs appropriate to aiding the
making of specific management decisions’.
To affect a decision a cost must be:

IMM GSM© Page 102 of 141 FM101
a) Future oriented: Past costs are irrelevant, as we cannot affect them
by current decisions and they are common to all alternatives that we
may choose.
b) Differential/Incremental: Meaning expenditure which will be incurred
or avoided as a result of making a decision. Any costs which would
be incurred whether or not the decision is made are not said to be
incremental to the decision.
c) Cash flow: Expenses such as depreciation are not cash flows and are
therefore not relevant. Similarly, the book value of existing equipment
is irrelevant, but the disposal value is relevant.
Other terms:
d) Opportunity costs: Value of potential benefit that is lost or sacrificed
when one course of action is chosen above another.
e) Common costs: Costs which will be identical for all alternatives are
irrelevant, e.g. rent or rates on a factory would be incurred whatever
products are produced.
f) Sunk costs: Another name for past costs, which are always irrelevant,
e.g. dedicated fixed assets, development costs already incurred.
g) Committed costs: A future cash outflow that will be incurred anyway,
whatever decision is taken now, e.g. contracts already entered into
which cannot be altered.
All costs are considered as avoidable except sunk costs and future costs that
do not differ between alternatives.
Important!
Please ensure that you now work through the illustrative examples in the
textbook.

IMM GSM© Page 103 of 141 FM101
Self-assessment exercise
Now do Exercises 1, 2 and 3 in Cloete & Marimuthu 2008: Chapter 8.
You should now be able to master the learning outcomes for this unit.

IMM GSM© Page 104 of 141 FM101
Solutions
Exercise 1
1.1 Raw materials used to manufacture products (product / direct materials) 1.2 Wages of workers who handle material during the production process
(product / direct labour) 1.3 Advertising costs (period / marketing or selling) 1.4 Depreciation of a vehicle used by the managing director (period / admin) 1.5 The production manager’s salary (product / man. overheads) 1.6 Lease payments on manufacturing equipment (product / man.
overheads) 1.7 Lease payments on vehicles used by sales personnel (period / marketing
or selling) 1.8 Depreciation on manufacturing equipment (product / man. overheads) 1.9 Rent on factory building (product / man. overheads) 1.10 Cleaning material used by production workers (product / man.
overheads)
Exercise 2
2.1 Prime cost = D/M + D/L = 100 000 + 150 000 = 250 000
2.2 Conversion cost = D/L + M/O = 150 000 + 75 000 = 225 000
2.3 Product cost = 100 000 + 150 000 + 75 000 = 325 000
2.4 Period cost = 120 000
2.5 Total variable cost = (40% x 75 000) + (70% x 120 000) = 114 000
2.6 Total fixed cost = (60% x 75 000) + (30% x 120 000) = 81 000

IMM GSM© Page 105 of 141 FM101
Exercise 3
Cost behaviour
Cost Variable Fixed Mixed
3.1 Leather used to manufacture basketballs X
3.2 Cleaning material used in the factory X
3.3 Wages of assembly line workers paid per hour
X
3.4 Salary of factory supervisor X
3.5 Depreciation on factory plant and machinery X
3.6 Electrical costs of running machinery X
3.7 Rental of factory building X
3.8 Rates and taxes on factory building X
3.9 Manufacturing equipment leased at a flat rate per month plus an additional cost based on the number of hours that the machine is operated during the month
X
3.10 Telephone costs (including line rental) X
3.11 X- ray film used in a medical centre. X
3.12 Buns used to make hamburgers at a fast food outlet.
X
3.13 Maintenance of plant and machinery charged at a flat rate per month plus an addition cost based on the number of maintenance hours worked.
X
3.14 Shipping costs of a manufacturer where no monthly contract exists, i.e. the manufacturer is charged per product shipped.
X
3.15 Advertising for a retailer where a monthly contract exists.
X
3.16 Commission paid to sales personnel. X
3.17 Insurance on office building. X
IMM GSM© Page 106 of 141 FM101
Study Unit 5: Materials
This study unit addresses the management of materials. After completion of
this unit you will be able to identify direct and indirect materials. You should be
able to demonstrate knowledge of the various stock control methodologies and
should be able to calculate the economic order quantity and value of stock
using FIFO and the weighted average method of stock valuation.
Mastering material management is important as you will require this knowledge
to minimise cost of materials which is a crucial component of the pricing of the
firm’s products.
Specific learning outcomes
After studying this unit, you should be able to:
Distinguish between direct and indirect materials.
Describe stock control concepts, calculate stock levels and EOQ.
Describe stock valuation methods and calculate the value of closing
inventories using FIFO and the weighted average method.

IMM GSM© Page 107 of 141 FM101
1. Classification of materials Study reference
Study Cloete & Marimuthu 2008: Chapter 9, Section 9.1 – Classification of
materials.
1.1 Direct material
Raw material converted into a finished product through a manufacturing
process is classified as direct material. Direct materials can easily be seen in
the final product:
Steel -> Motor car
Wood -> Furniture.
1.2 Indirect material
Material used in the conversion process that contributes to the finished product
through a manufacturing process is classified as indirect material. Indirect
materials cannot be easily seen in the final product:
Chemicals added to iron ore for manufacture of steel - > Steel -> Motor car
Glue used to bind wood -> Furniture.
1.3 Work-in-progress
Raw material that has been partially converted into a finished good, e.g.
furniture partially fitted together, must be classified as work-in-progress. It must
also be noted that work-in-progress is a combination of three cost elements,
namely material, labour and overhead costs.
1.4 Finished goods
Products that have passed through the entire process of manufacturing and are
ready for sale are classified as finished goods.

IMM GSM© Page 108 of 141 FM101
1.5 Stock
Stock is the sum total of all indirect material, direct material, work-in-progress
and finished goods that the enterprise has at any given point in time.
2. Stock control Study reference
Please read Cloete & Marimuthu 2008: Chapter 9, Section 9.2.
2.1 Introduction
Although the authors of the prescribed text use the term stock, the term
inventory is also used in financial terms.
Inventory depends heavily on sales and can be classified as raw materials,
work-in-progress and finished goods. Inventory management is a difficult task
and errors in establishment of inventory levels can lead to a loss of sales or
excessive carrying costs.
Inventory management centres on the balancing of costs that increase with
larger inventory holdings (storage and security) and a set of costs that decline
with larger holdings (ordering costs, lost sales prevented). Good inventory
management will result in relatively high inventory turnover, low write-off of
obsolete or deteriorated inventories, and fewer lost sales due to stock-outs.
This in turn will contribute to a high profit margin and return on investment.
The investment in inventory (stock) for most manufacturing firms can be
substantial and therefore requires a systematic approach for control purposes.
A stock control system should consider:
IMM GSM© Page 109 of 141 FM101
Stock level recording and monitoring
Forecasting future demand
Quantity and timing of stock orders.
The main objective is to minimise total costs associated with stock. These
costs are classified into three groups, namely:
Carrying costs
Ordering costs
Stock-out costs.
2.2 Carrying costs
Carrying costs are those costs associated with the storage of the stock and
include:
Storage charges (rent, heating and lighting, air-conditioning and
refrigeration)
Staffing costs of stores personnel
Equipment and maintenance
Security and insurance charges
Cost associated with stock taking, recording and auditing
Handling charges
Obsolescence (items no longer required) and deterioration (e.g.
corrosion)
Theft, evaporation and vermin damage (rats and other pests)
Interest on capital invested in stock.
2.3 Ordering costs
Ordering costs are those costs associated with the obtaining the stock and
include:
Administrative costs of purchasing the stock
Transportation costs.

IMM GSM© Page 110 of 141 FM101
2.4 Stock-out costs
Stock-out costs are those costs associated with not having sufficient stock to
meet the customer’s needs. These costs are intangible and include:
Loss of contribution and profit as customer will now buy from competitor
Loss of future sales can occur if frequent stock outs are experienced, as
customer will direct purchasing power to other suppliers in future
Cost of stoppages in production in the case of manufacturing firms
Extra cost to meet urgent small orders.
2.5 Lead time
The time taken from when an order is placed with supplier until it arrives on the
firm’s premises is known as lead time.
2.6 Economic order quantity
In order to provide inventories at the lowest cost, it is important to determine the
optimal inventory level. A commonly used approach to determine the optimal
order level is based on the economic ordering quantity (EOQ) model. The
equation for the EOQ is:
Important!
Please ensure that you now work through the EOQ illustrative example in the
textbook.
2.7 Reorder level (ROL)
The ROL is the level of stock at which a replenishment order should be placed.
The reorder level depends on the lead time and the usage during the lead time.
IMM GSM© Page 111 of 141 FM101
It allows for the worst situation to occur without the danger of running out of
stock, e.g. maximum usage of stock at time where supplier takes maximum time
to deliver.
The order point is simply calculated as follows:
Order point = Usage x lead-time
Both components are expressed in the same time frame, e.g. days or weeks as
applicable.
2.8 Minimum stock level (MinSL)
An additional factor to be considered in determining the inventory level is the
concept of the minimum or safety stock. The safety stock acts as buffer for
delays in delivery as well as increases above the average sales rate per week
caused by seasonal demand or promotional activities.
2.9 Maximum stock level (MaxSL)
MaxSL is the maximum level of stock for which storage space would be
required.
2.10 Average stock level (AveSL)
The average units in stock reflect the average stockholding for a year. It can be
calculated as follows:
Average units in stock = EOQ/2 + Safety stock
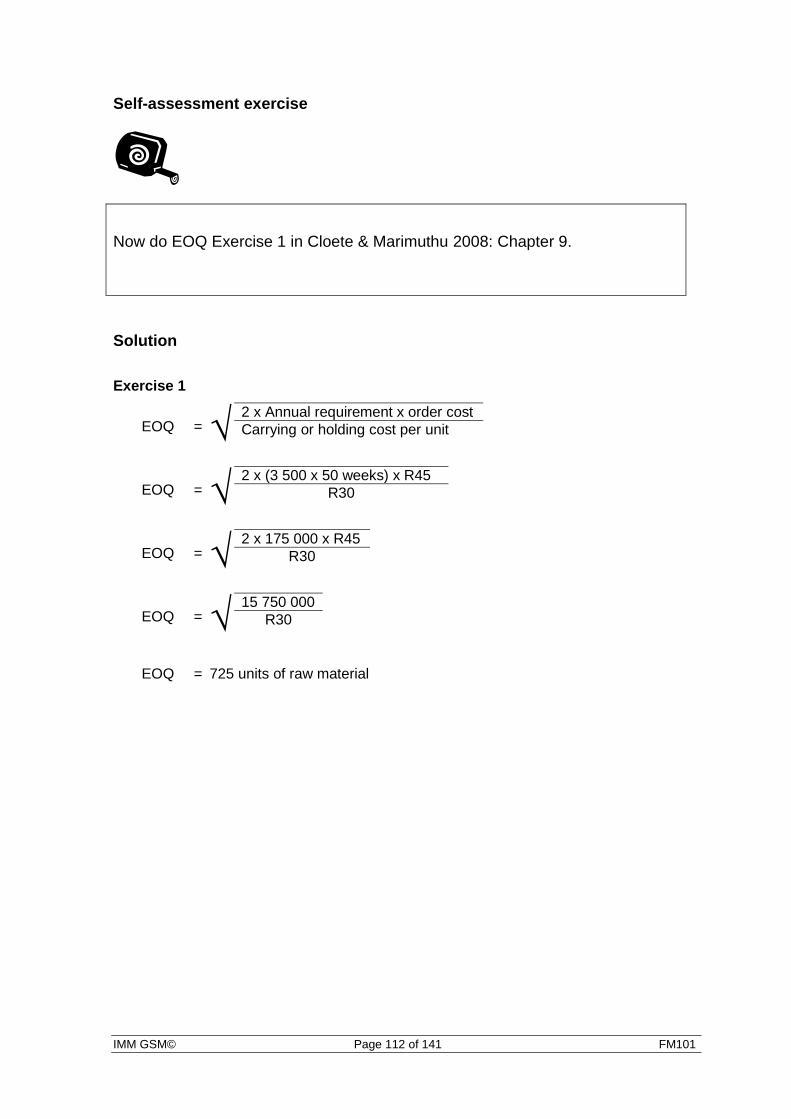
IMM GSM© Page 112 of 141 FM101
Self-assessment exercise
Now do EOQ Exercise 1 in Cloete & Marimuthu 2008: Chapter 9.
Solution
Exercise 1
EOQ = √ 2 x Annual requirement x order cost
Carrying or holding cost per unit
EOQ = √ 2 x (3 500 x 50 weeks) x R45
R30
EOQ = √ 2 x 175 000 x R45
R30
EOQ = √ 15 750 000
R30
EOQ = 725 units of raw material

IMM GSM© Page 113 of 141 FM101
3. Stock valuation methods
Study reference
Study Cloete & Marimuthu 2008: Chapter 9, Section 9.3 – Stock valuation
methods.
3.1 Introduction
The value of stock on hand at the end of a given period can be calculated using
a variety of methods including:
First-in-First-Out method (FIFO)
Weighted average method
Standard price method
Market price method
Replacement value method
Increased amount method
3.1.1 First-in-First-Out method (FIFO)
According to the FIFO method, material purchased first is used first, i.e. oldest
stock is issued first at the price at which it was originally purchased. The result
is that stock on hand will be valued at the cost of stock more recently
purchased.
3.1.2 Weighted average method
According to this method, material purchased is added to that already in stock.
An average price must be determined after each purchase by dividing cost of
total stock on hand by number of units on hand.

IMM GSM© Page 114 of 141 FM101
Important!
Please ensure that you now work through the stock valuation illustrative
example in the textbook.
Self-assessment exercise
Now do stock valuation Exercises 1 and 2 in Cloete & Marimuthu 2008: Chapter
9.
You should now be able to master the learning outcomes for this unit.
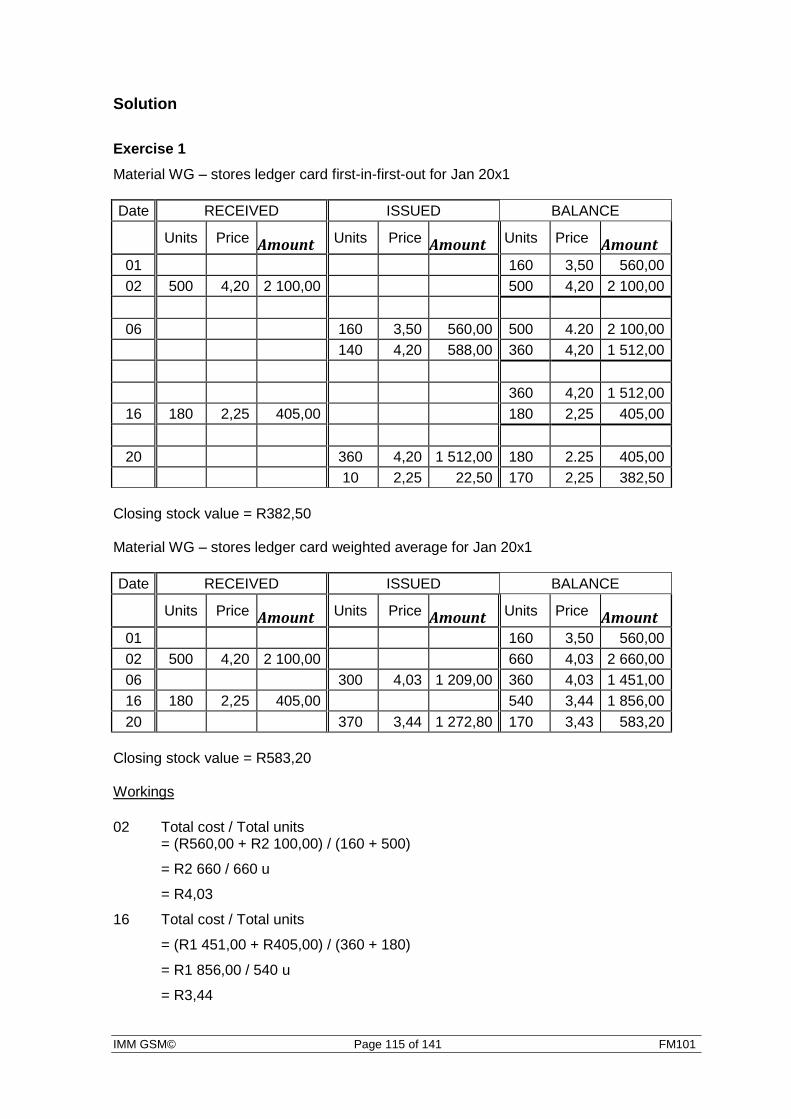
IMM GSM© Page 115 of 141 FM101
Solution
Exercise 1
Material WG – stores ledger card first-in-first-out for Jan 20x1
Date RECEIVED ISSUED BALANCE
Units Price Amount Units Price Amount Units Price Amount
01 160 3,50 560,00
02 500 4,20 2 100,00 500 4,20 2 100,00
06 160 3,50 560,00 500 4.20 2 100,00
140 4,20 588,00 360 4,20 1 512,00
360 4,20 1 512,00
16 180 2,25 405,00 180 2,25 405,00
20 360 4,20 1 512,00 180 2.25 405,00
10 2,25 22,50 170 2,25 382,50
Closing stock value = R382,50 Material WG – stores ledger card weighted average for Jan 20x1
Date RECEIVED ISSUED BALANCE
Units Price Amount Units Price Amount Units Price Amount
01 160 3,50 560,00
02 500 4,20 2 100,00 660 4,03 2 660,00
06 300 4,03 1 209,00 360 4,03 1 451,00
16 180 2,25 405,00 540 3,44 1 856,00
20 370 3,44 1 272,80 170 3,43 583,20
Closing stock value = R583,20 Workings
02 Total cost / Total units = (R560,00 + R2 100,00) / (160 + 500)
= R2 660 / 660 u
= R4,03
16 Total cost / Total units
= (R1 451,00 + R405,00) / (360 + 180)
= R1 856,00 / 540 u
= R3,44

IMM GSM© Page 116 of 141 FM101
Exercise 2
Retailers Ltd stock item XXX – stores ledger card first-in-first-out for April 20x1
Date RECEIVED ISSUED BALANCE
Units Price Amount Units Price Amount Units Price Amount 01 30 50 1 500,00
02 10 50 500,00 20 50 1 000,00
07 20 75 1 500,00 20 75 1 500,00
15 40 100 4 000,00 40 100 4 000,00
20 20 50 1 000,00
20 75 1 500,00
15 100 1 500,00 25 100 2 500,00
25 45 125 5 625,00 45 125 5 625,00
30 12 100 1 200,00 13 100 1 300,00
45 125 5 625,00
Cost of sales = R500 + R1 000 + R1 500 + R1 500 + R1 200
= R5 700 Gross Profit = 20/100 x R5 700
= R1 140 Retailers Ltd stock item XXX – stores ledger card weighted average for April 20x1
Date RECEIVED ISSUED BALANCE
Units Price Amount Units Price Amount Units Price Amount
01 30 50,00 1 500,00
02 10 50,00 500,00 20 50,00 1 000,00
07 20 75 1 500,00 40 62,50 2 500,00
15 40 100 4 000,00 80 81,25 6 500,00
20 55 81,25 4 468,75 25 81,25 2 031,25
25 45 125 5 625,00 70 109,38 7 656,25
30 12 109,38 1 312,56 58 109,38 6 343,69
Closing stock value = R5 801,38 Workings: 07 Total cost / total units 15 Total cost / total units
= (R1 000 + R1 500) / (20 + 20) = (R2 500 + R4 000) / (40 + 40) = R2 500 / 40 = R6 500 / 80 = R62,50 = R81,25
25 Total cost / total units = (R2 031,25 + R5 625) / (25 + 45) = R7 656,25 / 70
= R109,38

IMM GSM© Page 117 of 141 FM101
Study Unit 6: Labour, overheads and job costing
This study unit addresses the management of labour, overheads and
calculating the cost of a product or a job. After completion of this unit you will
be able to distinguish between direct and indirect labour, and calculate
overhead absorption rates. You should also be able to distinguish between
marginal and absorption costing and be able to apply marginal costing to typical
short-run decisions.
Mastering these concepts is important as you will require this knowledge to
ensure accurate pricing of the firm’s products.
Specific learning outcomes
After studying this unit, you should be able to:
Distinguish between direct and indirect labour.
Identify overhead costs.
Calculate the cost of a product or a job.
Distinguish between marginal and absorption costing.

IMM GSM© Page 118 of 141 FM101
1. Classification of labour Study reference
Study Cloete & Marimuthu 2008: Chapter 10 – Classification of labour.
Labour is the physical and/or mental effort used to manufacture a product or to
produce a service. Labour can be classified as direct or indirect labour.
1.1 Direct labour
Direct labour is the effort of personnel creating a product (such as assembly-line
workers) and can be physically traced to the creation of the product.
1.2 Indirect labour
Supervisory staff and maintenance staff’s labour in a production environment
cannot be physically traced to a specific product and is therefore regarded as
indirect labour.
2. Overheads
In a manufacturing environment all costs other than direct materials and direct
labour are regarded as overhead costs and this is organised into three
categories, namely indirect materials, indirect labour and other manufacturing
overheads.
Various examples are provided to explain these three categories of overhead
costs.

IMM GSM© Page 119 of 141 FM101
3. Job costing (absorption costing)
Industries where different products, jobs or batches use the same
manufacturing facility use job costing systems. Typical examples include
printing, shop fitting, furniture manufacturing and so on.
Typically these enterprises must provide quotations for jobs before the job is
started and therefore an estimate of overhead costs must be determined to
ensure that all costs (including direct material and direct labour) are recovered.
Steps involved in job costing
Step 1 – Calculate the overhead absorption rate (OAR)
The calculation of the OAR is dependent on the labour intensity vs. capital
intensity of the business. In a capital intensive business it would be appropriate
to use machine hours to allocate the overhead costs. In a labour intensive
business it would be appropriate to use labour hours or labour cost to allocate
overhead costs.
Some common OAR methods are:
Materials cost basis
Units of production
Machine hours basis
Direct labour hours
Direct labour cost.
At the time of providing the quote the actual costs will not be available and it is
for this reason that the appropriate budgeted elements will be used to determine
the allocation.
Step 2 – Calculate the cost price of the job
The cost of the job is the total of the following elements:
IMM GSM© Page 120 of 141 FM101
Total job cost = Direct material + Direct labour + Overheads (applied to the
job)
Step 3 – Calculate the selling price of the job
The selling price is:
Total job cost + Mark-up = Selling price
Step 4 – Determine if overheads were over or under applied
At the end of the financial year applied overheads and actual overheads are
totalled to determine if there was an over or under allocation of overhead costs.
If applied overheads exceed actual overheads, it means that overheads were
over applied. If it was over applied it means that customers were paying too
much for overheads. It then also means that the selling price was inflated
(leading to higher profit for the business). The opposite may also hold true.
Important!
Please ensure that you now work through the job costing illustrative example in
the textbook.
Self-assessment exercise
Now do job costing Exercises 1 and 2 in Cloete & Marimuthu 2008: Chapter 10.

IMM GSM© Page 121 of 141 FM101
Solution
Exercise 1
1.1 Budgeted overhead = 5 714 724
Budgeted units of production 2 745 000
= R 2,08 per unit of production
1.2 Budgeted overhead x 100 = 5 714 724 x 100
Budgeted direct materials cost 4 505 094
= 126,85% of direct materials cost
1.3 Budgeted overheads = 5 714 724
Budgeted machine hours 515 450
= R 11,09 per machine hour
1.4 Budgeted overhead = 5 714 724
Budgeted direct labour hours 1 342 000
= R 4,26 per direct labour hour
1.5 Budgeted overhead x 100 = 5 714 724 x 100
Budgeted direct labour cost 5 160 112
= 110,75% of direct labour cost

IMM GSM© Page 122 of 141 FM101
Exercise 2
OAR = Budgeted overhead = R960 000
Budgeted machine hours 600 000
= R1,60 per machine hour
Overheads applied to Job 6815 are: - R1,60 x 6000 machine hrs = R9 600
2.1
Total cost of Job 6815
Direct materials 24 000
Add: Direct labour 10 000
Prime cost 34 000
Add: Applied overheads (R1,60 X 6000) 9 600
Total cost 43 600
2.2
The mark up should be sufficient to
a) cover the cost of the job as well as
b) make a profit.

IMM GSM© Page 123 of 141 FM101
4. Marginal costing Study reference
Study Cloete & Marimuthu 2008: Chapter 13 – Marginal costing.
(Please note learning outcome 4 is now applicable)
4.1 Introduction
Marginal costing is also known as direct or variable costing. Under the
absorption costing method, both the fixed and variable costs are included in the
unit costs. The marginal costing method only includes the variable cost in the
unit cost of a product.
Important!
Please ensure that you now work through the income statements according to
the marginal and absorption costing illustrative example in the textbook.
4.2 Decisions using marginal costing
Three types of decisions can be made using marginal costing, namely:
1. Special order decisions
2. Dropping a product or department
3. Key factor/limiting factor decisions.
Any decision made using the marginal costing approach must provide a positive
contribution to be acceptable.
4.2.1 Special order decisions
From time to time a business may find that it has spare capacity and it is offered
a special order, below normal prices, which will take up the unused capacity.

IMM GSM© Page 124 of 141 FM101
The decision is based on whether or not the special order will provide a
contribution towards the fixed costs.
Important!
Please ensure that you now work through the special order illustrative example
in the textbook.
4.2.2 Dropping a product or department
A business may be under the impression that a product or department is
unprofitable. A consideration to drop the product or department can be made
using the marginal costing approach.
Important!
Please ensure that you now work through the illustrative example in the
textbook.
4.2.3 Choice of product where a limiting factor is present
A business may be able to produce a range of products but experience a
shortage of either materials or labour. A decision as to which product should be
produced can be made using the marginal costing approach.
Important!
Please ensure that you now work through the illustrative example in the
textbook.
Self-assessment exercise
Now do Exercises 1, 2 and 3 in Cloete & Marimuthu 2008: Chapter 13.
You should now be able to master the learning outcomes for this unit.
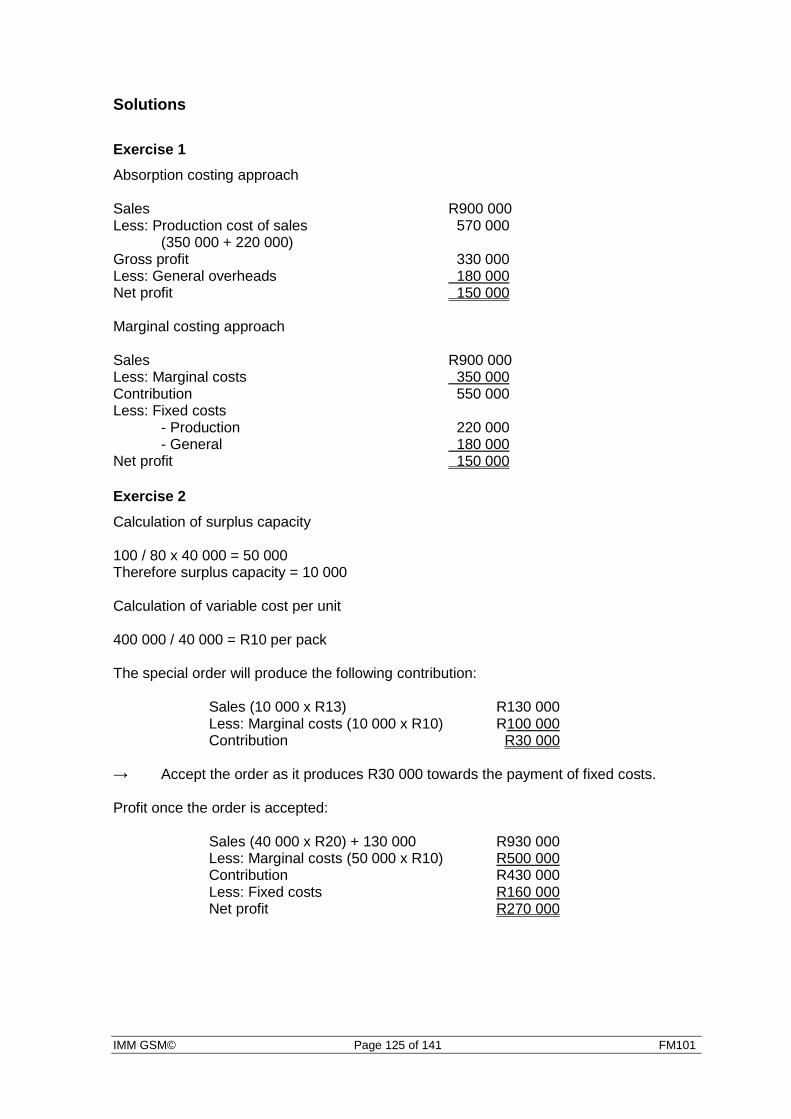
IMM GSM© Page 125 of 141 FM101
Solutions
Exercise 1
Absorption costing approach Sales R900 000 Less: Production cost of sales 570 000
(350 000 + 220 000) Gross profit 330 000 Less: General overheads 180 000 Net profit 150 000 Marginal costing approach Sales R900 000 Less: Marginal costs 350 000 Contribution 550 000 Less: Fixed costs
- Production 220 000 - General 180 000
Net profit 150 000
Exercise 2
Calculation of surplus capacity 100 / 80 x 40 000 = 50 000 Therefore surplus capacity = 10 000 Calculation of variable cost per unit 400 000 / 40 000 = R10 per pack The special order will produce the following contribution:
Sales (10 000 x R13) R130 000 Less: Marginal costs (10 000 x R10) R100 000 Contribution R30 000
→ Accept the order as it produces R30 000 towards the payment of fixed costs. Profit once the order is accepted:
Sales (40 000 x R20) + 130 000 R930 000 Less: Marginal costs (50 000 x R10) R500 000 Contribution R430 000 Less: Fixed costs R160 000 Net profit R270 000

IMM GSM© Page 126 of 141 FM101
Exercise 3
3.1
Pinetown Ballito Amanzimtoti
Budgeted ticket sales Less: Variable costs
3 200 000 2 000 000
2 400 000 1 620 000
1 600 000 1 380 000
Film hire Wages & salaries Variable overheads
1 000 000 600 000 400 000
800 000 500 000 320 000
780 000 320 000 280 000
Contribution Less: Fixed costs
1 200 000 600 000
780 000 480 000
220 000 420 000
Net profit/loss 600 000 300 000 (200 000)
3.2 No. The Amanzimtoti cinema should not be closed because it provides a positive
contribution of R220 000 towards the covering of the fixed costs.

IMM GSM© Page 127 of 141 FM101
Study Unit 7: Budgetary control and sales variance
This study unit addresses the control of budgets. Upon completion of this unit
you should be able to demonstrate an understanding of the master budget and
you should also be able to draft operational, flexible and cash budgets.
Mastering these concepts is important as you will be required to plan for your
department and then exercise control by having a sound understanding of
concepts covered in the previous units as well as new knowledge gained in his
unit.
Specific learning outcomes
After studying this unit, you should be able to:
Describe components of an operational budget.
Draft operational budgets.
Draft flexible budgets.
Draft cash budgets.
Calculate and interpret sales variances.

IMM GSM© Page 128 of 141 FM101
1. Operational budgets Study reference
Study Cloete & Marimuthu 2008: Chapter 11, Section 11.2 – Operational
budgets.
An operational budget is prepared for a specific department or cost centre. All
operational budgets are combined into the master budget which includes a
budgeted income statement and a budgeted balance sheet. The
interrelationship between budgets is illustrated in the textbook.
Operating budgets consist of smaller budgets, namely:
1. Sales budget (depends on sales forecast)
2. Production budget (based on sales budget)
3. Direct materials usage budget (based on production budget)
4. Direct materials purchases budget (based on usage and stock levels of
raw materials)
5. Inventory budget (informed by direct materials budgets, work-in-progress
and finished product budgets)
6. Direct labour budget (depends on production budget)
7. Manufacturing overheads budget (depends on production budget)
8. Sales and administrative budgets (informed by current structure as well
as planned new sales budget).
Important!
Please ensure that you now work through the operational budget illustrative
example in the textbook.

IMM GSM© Page 129 of 141 FM101
Self-assessment exercise
Now do operational budget Exercise 1 in Cloete & Marimuthu 2008: Chapter 11.

IMM GSM© Page 130 of 141 FM101
Solution
Exercise 1
Sales budget Widget
Projected sales units 10 000 Selling price per unit R100 Total sales R1 000 000
Production budget
Widget
Sales units 10 000 Add: ending inventory 880 Total required units 10 880 Less: opening inventory 800 Units to be produced 10 080
Raw material budget – Widget Material S Material O
Production requirement 10 080 10 080 Units of material required per widget 5 10
Raw material usage 50 400 100 800 Add: ending inventory 4 950 13 200
Total required raw material 55 350 114 000 Less: opening inventory 4 500 12 000
Units to be purchased 50 850 102 000 Unit cost per kg R3 R4 Total cost of raw material R152 550 R408 000
Labour budget Machinery Assembly
Production requirement 10 080 10 080 Required hours per unit 1 0.5 Total hours required 10 080 5 040 Rate per hour R6 R8 Total labour cost R60 480 R40 320
Closing stock of finished goods budget
Raw materials: S (5 x R3) R15,00 O (10 x R4) R40,00 Direct labour: Machinery (1 x R6) R6,00 Assembly (0,5 x R8) R4,00 #Overheads: Machinery (1 x R4,96) R4,96 Assembly (0,50 x R9,92) R4,96 Cost of one unit produced R74,92 Closing inventory – units 880 Value of closing finished goods R65 929,60
#Overhead calculation Machinery department OAR = Budgeted overheads / Budgeted labour hours
= R50 000 / 10 080hrs = R4,96

IMM GSM© Page 131 of 141 FM101
Assembly department OAR = Budgeted overheads / Budgeted labour hours
= R50 000 / 5040hrs = R9,92
2. Flexible budgets Study reference
Study Cloete & Marimuthu 2008: Chapter 11, Section 11.3 – Flexible budgets.
A flexible budget is designed to allow cost levels to be changed to suit the
actual level of activity and is therefore useful for planning and control. It does
require a thorough understanding of cost behaviour. Performance control
reports should be using the flexible budget approach to control costs.
Important!
Please ensure that you now work through the flexible budget and performance
reports illustrative example in the textbook.
Self-assessment exercise
Now do flexible budget Exercise 1 in Cloete & Marimuthu 2008: Chapter 11.
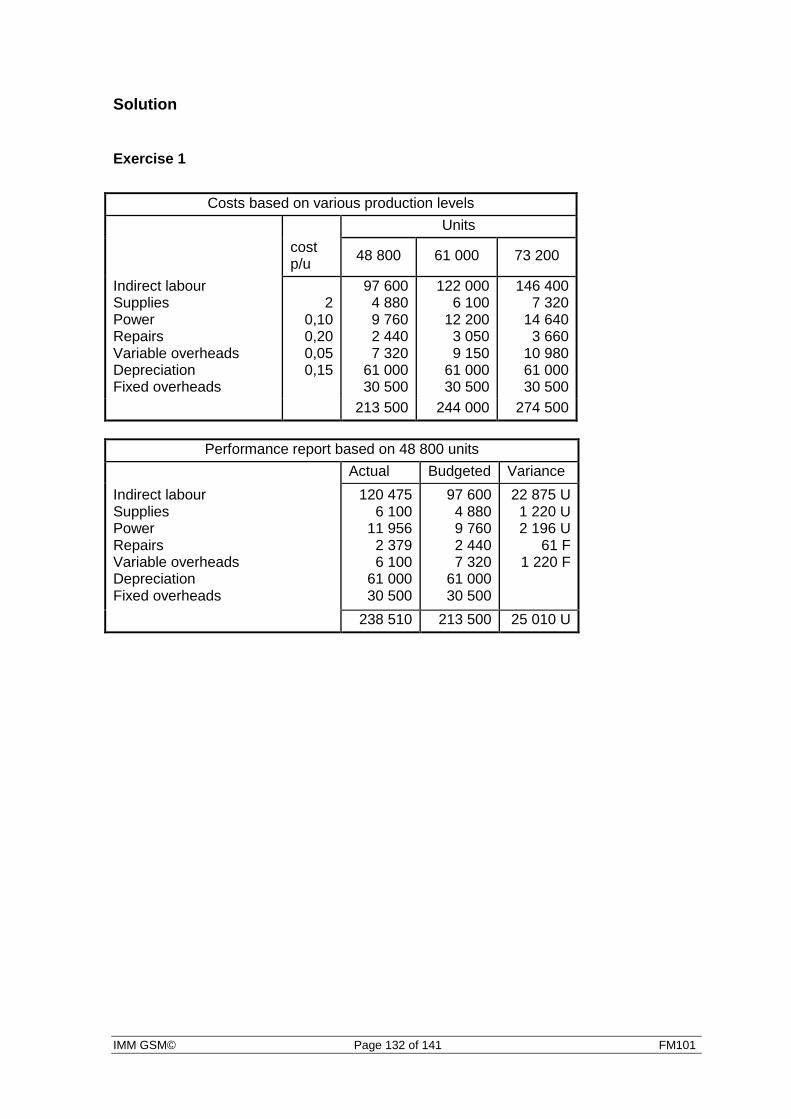
IMM GSM© Page 132 of 141 FM101
Solution
Exercise 1
Costs based on various production levels
Units
cost p/u
48 800 61 000 73 200
Indirect labour Supplies Power Repairs Variable overheads Depreciation Fixed overheads
2 0,10 0,20 0,05 0,15
97 600 4 880 9 760 2 440 7 320
61 000 30 500
122 000 6 100
12 200 3 050 9 150
61 000 30 500
146 400 7 320
14 640 3 660
10 980 61 000 30 500
213 500 244 000 274 500
Performance report based on 48 800 units
Actual Budgeted Variance
Indirect labour Supplies Power Repairs Variable overheads Depreciation Fixed overheads
120 475 6 100
11 956 2 379 6 100
61 000 30 500
97 600 4 880 9 760 2 440 7 320
61 000 30 500
22 875 U 1 220 U 2 196 U
61 F 1 220 F
238 510 213 500 25 010 U

IMM GSM© Page 133 of 141 FM101
3. Cash budgets Study reference
Study Cloete & Marimuthu 2008: Chapter 11, Section 11.3 – Cash budgets.
A cash budget is designed to help an enterprise to anticipate its future cash
needs. This is an extremely important exercise as one of the main reasons for
business failure is poor cash management.
The budget is constructed by translating all budgets into cash terms and shows
detailed inflows and outflows. The point is to establish when cash flow
restraints will be experienced and therefore give management the opportunity to
seek alternative sources of finance.
Provision for bad debts and depreciation are two non-cash items and should
therefore never appear in the cash budget.
A cash budget is constructed following the format:
Opening cash balance Rxxx
Add: Cash receipts Rxxx
Total cash available Rxxx
Less: cash payments Rxxx
Closing cash balance Rxxx
Important!
Please ensure that you now work through the cash budget illustrative example
in the textbook.

IMM GSM© Page 134 of 141 FM101
Self-assessment exercise
Now do cash budget Exercise 1 in Cloete & Marimuthu 2008: Chapter 11.

IMM GSM© Page 135 of 141 FM101
Solution
Exercise 1
Cash budget of EPC Company
SEPTEMBER OCTOBER
Opening balance 22 250 13 400
Add: Cash receipts 178 750 219 500
Debtors 158 750 219 500
Loan 20 000 nil
Less: Cash payments (187 600) (222 600)
Merchandise purchases 90 000 120 000
Salaries and wages 22 500 25 000
Advertising 65 000 72 500
Rent payments 4 500 4 500
Equipment purchased 5 000 nil
Interest on loan 600 600
Loan repayment nil nil
Closing balance 13 400 10 300
Analysis of cash collected from credit sales
SEPTEMBER
July (3% x R125 000) 3 750
August (70% x R150 000) 105 000
September (25% x R200 000) 50 000
158 750
OCTOBER
August (3% x R 50 000) 4 500
September (70% x R200 000) 140 000
October (25% x R300 000) 75 000
219 500

IMM GSM© Page 136 of 141 FM101
4. Sales variances
Study reference
Study Cloete & Marimuthu 2008: Chapter 12, Section 12.1 – Sales variances.
Sales variances are as important to control as production variances. A sales
variance can be the result of a variance in price or a variance in quantity sold.
The sales variance resulting from quantity sold may be resulting from a variance
in sales mix or variance in volume sold.
Sales price variance is calculated as the difference between actual price sold
and standard price per unit for the number of units sold and is expressed in the
formula:
(AP – SP) x AQ
Sales quantity variance is calculated as the difference between budgeted
number of units sold and actual number of units sold at the standard price per
unit and is expressed in the formula:
(AQ – SQ) x SP
Too many external factors play a role in variance of sales and full variance
analysis may be a fruitless exercise.
Important!
Please ensure that you now work through the sales variance illustrative
examples in the textbook.

IMM GSM© Page 137 of 141 FM101
Self-assessment exercise
Now do sales variance Exercises 1and 2 in Cloete & Marimuthu 2008: Chapter 12.
You should now be able to master the learning outcomes for this unit.
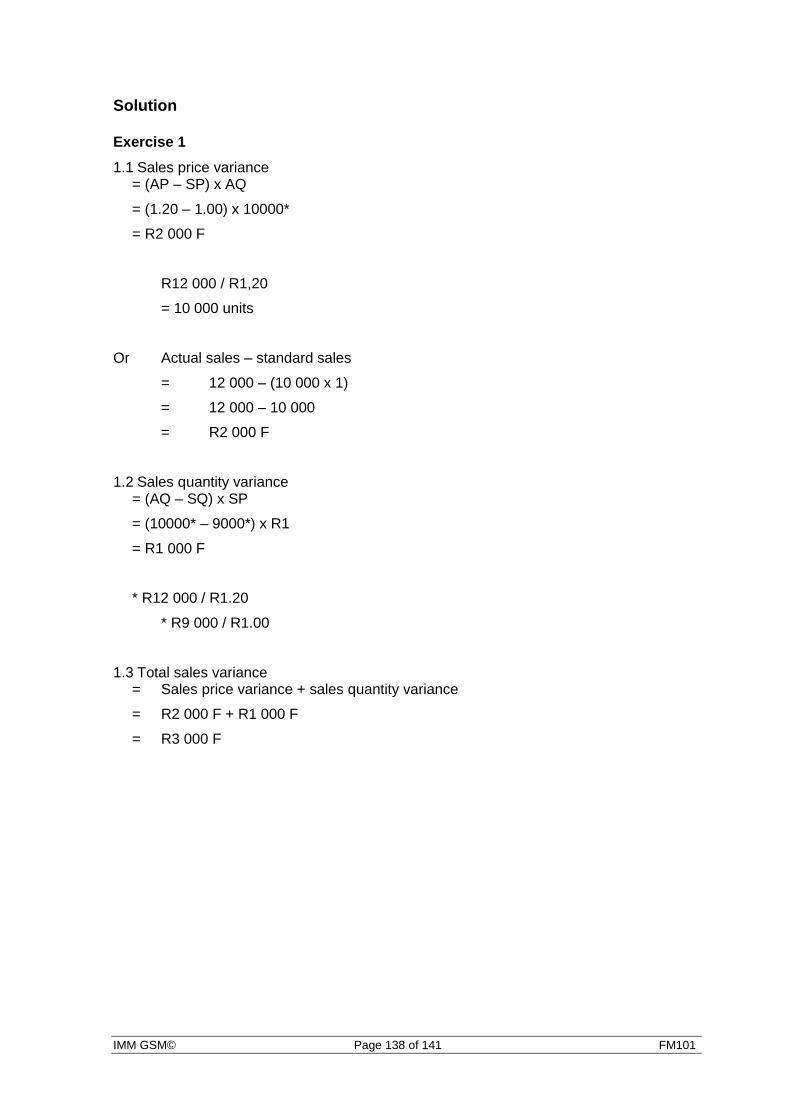
IMM GSM© Page 138 of 141 FM101
Solution
Exercise 1
1.1 Sales price variance = (AP – SP) x AQ
= (1.20 – 1.00) x 10000*
= R2 000 F
R12 000 / R1,20
= 10 000 units
Or Actual sales – standard sales
= 12 000 – (10 000 x 1)
= 12 000 – 10 000
= R2 000 F
1.2 Sales quantity variance = (AQ – SQ) x SP
= (10000* – 9000*) x R1
= R1 000 F
* R12 000 / R1.20
* R9 000 / R1.00
1.3 Total sales variance = Sales price variance + sales quantity variance
= R2 000 F + R1 000 F
= R3 000 F

IMM GSM© Page 139 of 141 FM101
Exercise 2
2.1 Sales price variance
(AP – SP) x AQ
Ras = (4.75 *– 4.80) x 18 000 = R 900 U
Som = (2.12*– 2.10) x 82 000 = R1 640 F
Total sales price variance = R 740 F
* R85 500 / 18 000u = R4.75
* R173 840 / 8 200u = R2.12
2.2 Sales quantity variance =
(AQ – SQ) x Standard gross profit per unit
Ras = (18 000 – 15 000) x 2.55 = R 7 650 F
Som= (82 000 – 75 000) x 0.99 = R 6 930 F
Total sales quantity variance = R14 580 F

IMM GSM© Page 140 of 141 FM101
Conclusion
Congratulations you have completed Financial Management 1. You have
worked through this guide and should now have mastered the basics of
financial accounting and cost and management accounting.
We wish you well in the examination and trust that you will find that the contents
of this learner guide provide useful practical application in your marketing
career.
IMM GSM© Page 141 of 141 FM101
Bibliography
Cloete, M. and Marimuthu, F. 2008. Basic Accounting for Non-
Accountants. Pretoria: Van Schaik.
De Beer, L. 2005. (n.d.) Accounting for accounting standards. [Online]
Available: http://www.saica.co.za/ [2005, January 20].
Duncan, F. 2005. South Africa has high standards of financial reporting.
[Online] Available: http://www.moneyweb.co.za/ [2005, January 20].
Zidel, D. 2004. Basic Business Calculations. Johannesburg: Penguin
Books.