financial market sophistication - world economic forum€¦ · how would you assess the level of...
TRANSCRIPT
3: Data Tables | Financial access
Rank CountRy/eConomy value 1 7
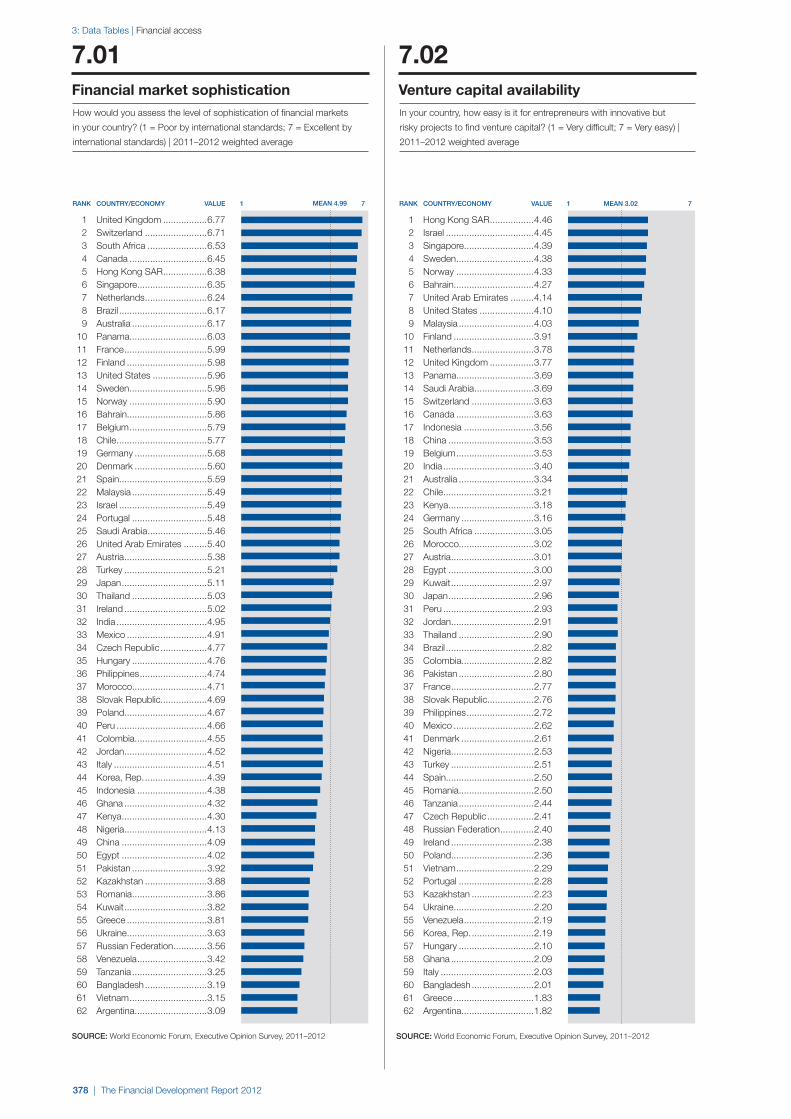
1 Hong Kong SAR .................4.46 2 Israel ..................................4.45 3 Singapore ...........................4.39 4 Sweden ..............................4.38 5 Norway ..............................4.33 6 Bahrain...............................4.27 7 United Arab Emirates .........4.14 8 United States .....................4.10 9 Malaysia .............................4.03 10 Finland ...............................3.91 11 Netherlands ........................3.78 12 United Kingdom .................3.77 13 Panama..............................3.69 14 Saudi Arabia .......................3.69 15 Switzerland ........................3.63 16 Canada ..............................3.63 17 Indonesia ...........................3.56 18 China .................................3.53 19 Belgium ..............................3.53 20 India ...................................3.40 21 Australia .............................3.34 22 Chile ...................................3.21 23 Kenya .................................3.18 24 Germany ............................3.16 25 South Africa .......................3.05 26 Morocco.............................3.02 27 Austria ................................3.01 28 Egypt .................................3.00 29 Kuwait ................................2.97 30 Japan .................................2.96 31 Peru ...................................2.93 32 Jordan ................................2.91 33 Thailand .............................2.90 34 Brazil ..................................2.82 35 Colombia............................2.82 36 Pakistan .............................2.80 37 France ................................2.77 38 Slovak Republic..................2.76 39 Philippines ..........................2.72 40 Mexico ...............................2.62 41 Denmark ............................2.61 42 Nigeria ................................2.53 43 Turkey ................................2.51 44 Spain..................................2.50 45 Romania .............................2.50 46 Tanzania .............................2.44 47 Czech Republic ..................2.41 48 Russian Federation .............2.40 49 Ireland ................................2.38 50 Poland................................2.36 51 Vietnam ..............................2.29 52 Portugal .............................2.28 53 Kazakhstan ........................2.23 54 Ukraine ...............................2.20 55 Venezuela ...........................2.19 56 Korea, Rep. ........................2.19 57 Hungary .............................2.10 58 Ghana ................................2.09 59 Italy ....................................2.03 60 Bangladesh ........................2.01 61 Greece ...............................1.83 62 Argentina ............................1.82
Rank CountRy/eConomy value 1 7
1 United Kingdom .................6.77 2 Switzerland ........................6.71 3 South Africa .......................6.53 4 Canada ..............................6.45 5 Hong Kong SAR .................6.38 6 Singapore ...........................6.35 7 Netherlands ........................6.24 8 Brazil ..................................6.17 9 Australia .............................6.17 10 Panama..............................6.03 11 France ................................5.99 12 Finland ...............................5.98 13 United States .....................5.96 14 Sweden ..............................5.96 15 Norway ..............................5.90 16 Bahrain...............................5.86 17 Belgium ..............................5.79 18 Chile ...................................5.77 19 Germany ............................5.68 20 Denmark ............................5.60 21 Spain..................................5.59 22 Malaysia .............................5.49 23 Israel ..................................5.49 24 Portugal .............................5.48 25 Saudi Arabia .......................5.46 26 United Arab Emirates .........5.40 27 Austria ................................5.38 28 Turkey ................................5.21 29 Japan .................................5.11 30 Thailand .............................5.03 31 Ireland ................................5.02 32 India ...................................4.95 33 Mexico ...............................4.91 34 Czech Republic ..................4.77 35 Hungary .............................4.76 36 Philippines ..........................4.74 37 Morocco.............................4.71 38 Slovak Republic..................4.69 39 Poland................................4.67 40 Peru ...................................4.66 41 Colombia............................4.55 42 Jordan ................................4.52 43 Italy ....................................4.51 44 Korea, Rep. ........................4.39 45 Indonesia ...........................4.38 46 Ghana ................................4.32 47 Kenya .................................4.30 48 Nigeria ................................4.13 49 China .................................4.09 50 Egypt .................................4.02 51 Pakistan .............................3.92 52 Kazakhstan ........................3.88 53 Romania .............................3.86 54 Kuwait ................................3.82 55 Greece ...............................3.81 56 Ukraine ...............................3.63 57 Russian Federation .............3.56 58 Venezuela ...........................3.42 59 Tanzania .............................3.25 60 Bangladesh ........................3.19 61 Vietnam ..............................3.15 62 Argentina ............................3.09
SouRCe: World Economic Forum, Executive Opinion Survey, 2011–2012 SouRCe: World Economic Forum, Executive Opinion Survey, 2011–2012
In your country, how easy is it for entrepreneurs with innovative but
risky projects to find venture capital? (1 = Very difficult; 7 = Very easy) |
2011–2012 weighted average
Venture capital availability
7.02
How would you assess the level of sophistication of financial markets
in your country? (1 = Poor by international standards; 7 = Excellent by
international standards) | 2011–2012 weighted average
Financial market sophistication
7.01
mean4.99 mean3.02
378 | The Financial Development Report 2012
3: Data Tables | Financial access
Rank CountRy/eConomy value 1 7
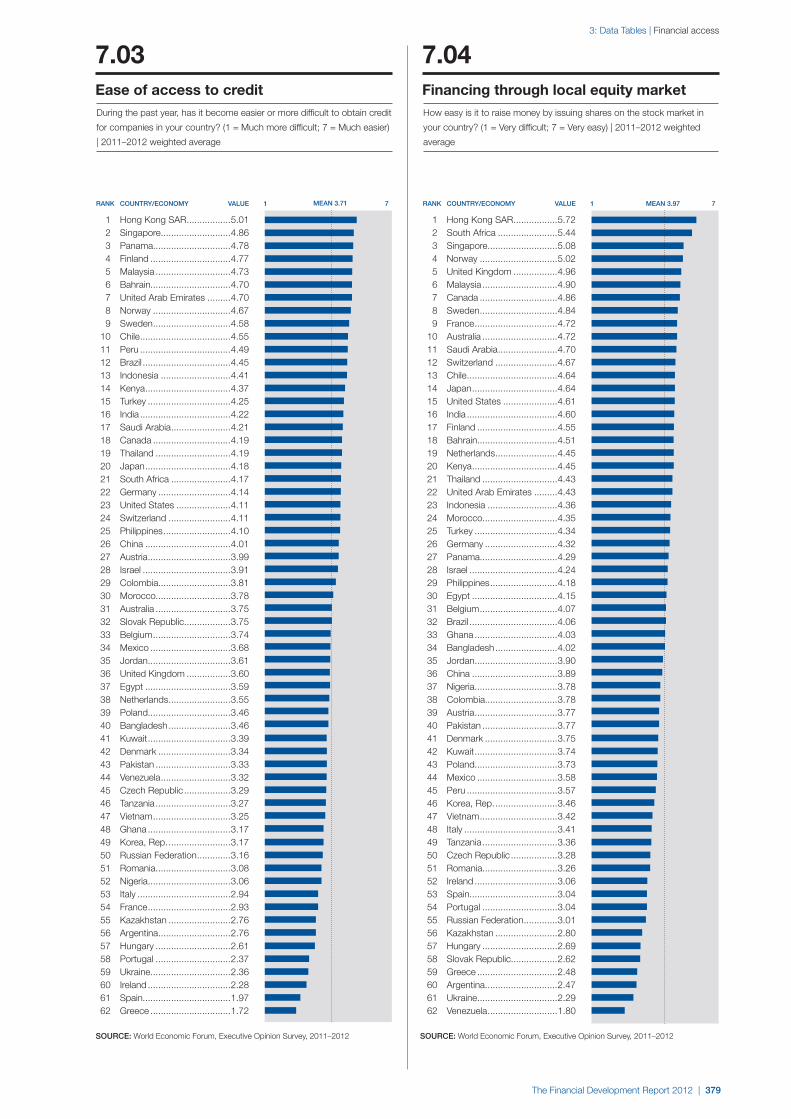
1 Hong Kong SAR .................5.01 2 Singapore ...........................4.86 3 Panama..............................4.78 4 Finland ...............................4.77 5 Malaysia .............................4.73 6 Bahrain...............................4.70 7 United Arab Emirates .........4.70 8 Norway ..............................4.67 9 Sweden ..............................4.58 10 Chile ...................................4.55 11 Peru ...................................4.49 12 Brazil ..................................4.45 13 Indonesia ...........................4.41 14 Kenya .................................4.37 15 Turkey ................................4.25 16 India ...................................4.22 17 Saudi Arabia .......................4.21 18 Canada ..............................4.19 19 Thailand .............................4.19 20 Japan .................................4.18 21 South Africa .......................4.17 22 Germany ............................4.14 23 United States .....................4.11 24 Switzerland ........................4.11 25 Philippines ..........................4.10 26 China .................................4.01 27 Austria ................................3.99 28 Israel ..................................3.91 29 Colombia............................3.81 30 Morocco.............................3.78 31 Australia .............................3.75 32 Slovak Republic..................3.75 33 Belgium ..............................3.74 34 Mexico ...............................3.68 35 Jordan ................................3.61 36 United Kingdom .................3.60 37 Egypt .................................3.59 38 Netherlands ........................3.55 39 Poland................................3.46 40 Bangladesh ........................3.46 41 Kuwait ................................3.39 42 Denmark ............................3.34 43 Pakistan .............................3.33 44 Venezuela ...........................3.32 45 Czech Republic ..................3.29 46 Tanzania .............................3.27 47 Vietnam ..............................3.25 48 Ghana ................................3.17 49 Korea, Rep. ........................3.17 50 Russian Federation .............3.16 51 Romania .............................3.08 52 Nigeria ................................3.06 53 Italy ....................................2.94 54 France ................................2.93 55 Kazakhstan ........................2.76 56 Argentina ............................2.76 57 Hungary .............................2.61 58 Portugal .............................2.37 59 Ukraine ...............................2.36 60 Ireland ................................2.28 61 Spain..................................1.97 62 Greece ...............................1.72
SouRCe: World Economic Forum, Executive Opinion Survey, 2011–2012SouRCe: World Economic Forum, Executive Opinion Survey, 2011–2012
Rank CountRy/eConomy value 1 7
1 Hong Kong SAR .................5.72 2 South Africa .......................5.44 3 Singapore ...........................5.08 4 Norway ..............................5.02 5 United Kingdom .................4.96 6 Malaysia .............................4.90 7 Canada ..............................4.86 8 Sweden ..............................4.84 9 France ................................4.72 10 Australia .............................4.72 11 Saudi Arabia .......................4.70 12 Switzerland ........................4.67 13 Chile ...................................4.64 14 Japan .................................4.64 15 United States .....................4.61 16 India ...................................4.60 17 Finland ...............................4.55 18 Bahrain...............................4.51 19 Netherlands ........................4.45 20 Kenya .................................4.45 21 Thailand .............................4.43 22 United Arab Emirates .........4.43 23 Indonesia ...........................4.36 24 Morocco.............................4.35 25 Turkey ................................4.34 26 Germany ............................4.32 27 Panama..............................4.29 28 Israel ..................................4.24 29 Philippines ..........................4.18 30 Egypt .................................4.15 31 Belgium ..............................4.07 32 Brazil ..................................4.06 33 Ghana ................................4.03 34 Bangladesh ........................4.02 35 Jordan ................................3.90 36 China .................................3.89 37 Nigeria ................................3.78 38 Colombia............................3.78 39 Austria ................................3.77 40 Pakistan .............................3.77 41 Denmark ............................3.75 42 Kuwait ................................3.74 43 Poland................................3.73 44 Mexico ...............................3.58 45 Peru ...................................3.57 46 Korea, Rep. ........................3.46 47 Vietnam ..............................3.42 48 Italy ....................................3.41 49 Tanzania .............................3.36 50 Czech Republic ..................3.28 51 Romania .............................3.26 52 Ireland ................................3.06 53 Spain..................................3.04 54 Portugal .............................3.04 55 Russian Federation .............3.01 56 Kazakhstan ........................2.80 57 Hungary .............................2.69 58 Slovak Republic..................2.62 59 Greece ...............................2.48 60 Argentina ............................2.47 61 Ukraine ...............................2.29 62 Venezuela ...........................1.80
How easy is it to raise money by issuing shares on the stock market in
your country? (1 = Very difficult; 7 = Very easy) | 2011–2012 weighted
average
Financing through local equity market
7.04
During the past year, has it become easier or more difficult to obtain credit
for companies in your country? (1 = Much more difficult; 7 = Much easier)
| 2011–2012 weighted average
Ease of access to credit
7.03
mean3.71 mean3.97
The Financial Development Report 2012 | 379
3: Data Tables | Financial access
Rank CountRy/eConomy value
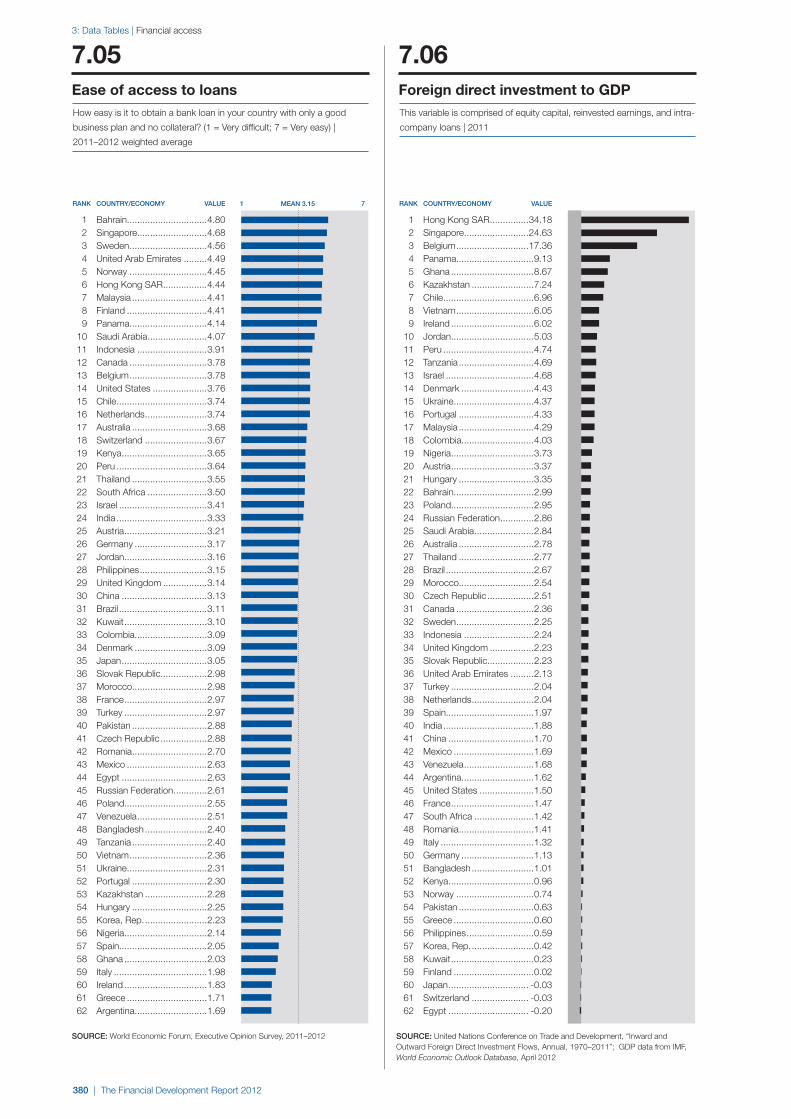
1 Hong Kong SAR ...............34.18 2 Singapore .........................24.63 3 Belgium ............................17.36 4 Panama..............................9.13 5 Ghana ................................8.67 6 Kazakhstan ........................7.24 7 Chile ...................................6.96 8 Vietnam ..............................6.05 9 Ireland ................................6.02 10 Jordan ................................5.03 11 Peru ...................................4.74 12 Tanzania .............................4.69 13 Israel ..................................4.68 14 Denmark ............................4.43 15 Ukraine ...............................4.37 16 Portugal .............................4.33 17 Malaysia .............................4.29 18 Colombia............................4.03 19 Nigeria ................................3.73 20 Austria ................................3.37 21 Hungary .............................3.35 22 Bahrain...............................2.99 23 Poland................................2.95 24 Russian Federation .............2.86 25 Saudi Arabia .......................2.84 26 Australia .............................2.78 27 Thailand .............................2.77 28 Brazil ..................................2.67 29 Morocco.............................2.54 30 Czech Republic ..................2.51 31 Canada ..............................2.36 32 Sweden ..............................2.25 33 Indonesia ...........................2.24 34 United Kingdom .................2.23 35 Slovak Republic..................2.23 36 United Arab Emirates .........2.13 37 Turkey ................................2.04 38 Netherlands ........................2.04 39 Spain..................................1.97 40 India ...................................1.88 41 China .................................1.70 42 Mexico ...............................1.69 43 Venezuela ...........................1.68 44 Argentina ............................1.62 45 United States .....................1.50 46 France ................................1.47 47 South Africa .......................1.42 48 Romania .............................1.41 49 Italy ....................................1.32 50 Germany ............................1.13 51 Bangladesh ........................1.01 52 Kenya .................................0.96 53 Norway ..............................0.74 54 Pakistan .............................0.63 55 Greece ...............................0.60 56 Philippines ..........................0.59 57 Korea, Rep. ........................0.42 58 Kuwait ................................0.23 59 Finland ...............................0.02 60 Japan ............................... -0.03 61 Switzerland ...................... -0.03 62 Egypt ............................... -0.20
SouRCe: United Nations Conference on Trade and Development, “Inward and Outward Foreign Direct Investment Flows, Annual, 1970–2011”; GDP data from IMF, World Economic Outlook Database, April 2012
This variable is comprised of equity capital, reinvested earnings, and intra-
company loans | 2011
Foreign direct investment to GDP
7.06
How easy is it to obtain a bank loan in your country with only a good
business plan and no collateral? (1 = Very difficult; 7 = Very easy) |
2011–2012 weighted average
Ease of access to loans
7.05
SouRCe: World Economic Forum, Executive Opinion Survey, 2011–2012
Rank CountRy/eConomy value 1 7
1 Bahrain...............................4.80 2 Singapore ...........................4.68 3 Sweden ..............................4.56 4 United Arab Emirates .........4.49 5 Norway ..............................4.45 6 Hong Kong SAR .................4.44 7 Malaysia .............................4.41 8 Finland ...............................4.41 9 Panama..............................4.14 10 Saudi Arabia .......................4.07 11 Indonesia ...........................3.91 12 Canada ..............................3.78 13 Belgium ..............................3.78 14 United States .....................3.76 15 Chile ...................................3.74 16 Netherlands ........................3.74 17 Australia .............................3.68 18 Switzerland ........................3.67 19 Kenya .................................3.65 20 Peru ...................................3.64 21 Thailand .............................3.55 22 South Africa .......................3.50 23 Israel ..................................3.41 24 India ...................................3.33 25 Austria ................................3.21 26 Germany ............................3.17 27 Jordan ................................3.16 28 Philippines ..........................3.15 29 United Kingdom .................3.14 30 China .................................3.13 31 Brazil ..................................3.11 32 Kuwait ................................3.10 33 Colombia............................3.09 34 Denmark ............................3.09 35 Japan .................................3.05 36 Slovak Republic..................2.98 37 Morocco.............................2.98 38 France ................................2.97 39 Turkey ................................2.97 40 Pakistan .............................2.88 41 Czech Republic ..................2.88 42 Romania .............................2.70 43 Mexico ...............................2.63 44 Egypt .................................2.63 45 Russian Federation .............2.61 46 Poland................................2.55 47 Venezuela ...........................2.51 48 Bangladesh ........................2.40 49 Tanzania .............................2.40 50 Vietnam ..............................2.36 51 Ukraine ...............................2.31 52 Portugal .............................2.30 53 Kazakhstan ........................2.28 54 Hungary .............................2.25 55 Korea, Rep. ........................2.23 56 Nigeria ................................2.14 57 Spain..................................2.05 58 Ghana ................................2.03 59 Italy ....................................1.98 60 Ireland ................................1.83 61 Greece ...............................1.71 62 Argentina ............................1.69
mean3.15
380 | The Financial Development Report 2012
3: Data Tables | Financial access
Rank CountRy/eConomy value
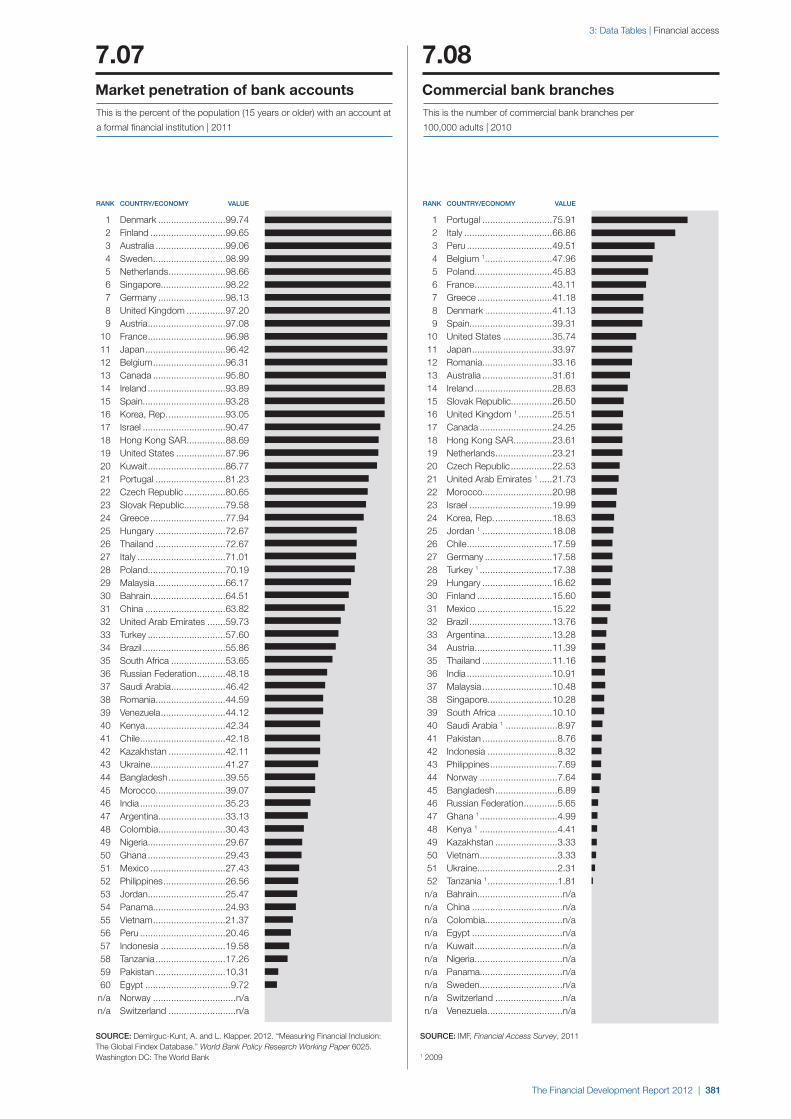
1 Portugal ...........................75.91 2 Italy ..................................66.86 3 Peru .................................49.51 4 Belgium 1 ..........................47.96 5 Poland..............................45.83 6 France ..............................43.11 7 Greece .............................41.18 8 Denmark ..........................41.13 9 Spain................................39.31 10 United States ...................35.74 11 Japan ...............................33.97 12 Romania ...........................33.16 13 Australia ...........................31.61 14 Ireland ..............................28.63 15 Slovak Republic................26.50 16 United Kingdom 1 .............25.51 17 Canada ............................24.25 18 Hong Kong SAR ...............23.61 19 Netherlands ......................23.21 20 Czech Republic ................22.53 21 United Arab Emirates 1 .....21.73 22 Morocco...........................20.98 23 Israel ................................19.99 24 Korea, Rep. ......................18.63 25 Jordan 1 ...........................18.08 26 Chile .................................17.59 27 Germany ..........................17.58 28 Turkey 1 ............................17.38 29 Hungary ...........................16.62 30 Finland .............................15.60 31 Mexico .............................15.22 32 Brazil ................................13.76 33 Argentina ..........................13.28 34 Austria ..............................11.39 35 Thailand ...........................11.16 36 India .................................10.91 37 Malaysia ...........................10.48 38 Singapore .........................10.28 39 South Africa .....................10.10 40 Saudi Arabia 1 ....................8.97 41 Pakistan .............................8.76 42 Indonesia ...........................8.32 43 Philippines ..........................7.69 44 Norway ..............................7.64 45 Bangladesh ........................6.89 46 Russian Federation .............5.65 47 Ghana 1 ..............................4.99 48 Kenya 1 ..............................4.41 49 Kazakhstan ........................3.33 50 Vietnam ..............................3.33 51 Ukraine ...............................2.31 52 Tanzania 1 ...........................1.81 n/a Bahrain.................................n/a n/a China ...................................n/a n/a Colombia..............................n/a n/a Egypt ...................................n/a n/a Kuwait ..................................n/a n/a Nigeria ..................................n/a n/a Panama................................n/a n/a Sweden ................................n/a n/a Switzerland ..........................n/a n/a Venezuela .............................n/a
Rank CountRy/eConomy value
1 Denmark ..........................99.74 2 Finland .............................99.65 3 Australia ...........................99.06 4 Sweden ............................98.99 5 Netherlands ......................98.66 6 Singapore .........................98.22 7 Germany ..........................98.13 8 United Kingdom ...............97.20 9 Austria ..............................97.08 10 France ..............................96.98 11 Japan ...............................96.42 12 Belgium ............................96.31 13 Canada ............................95.80 14 Ireland ..............................93.89 15 Spain................................93.28 16 Korea, Rep. ......................93.05 17 Israel ................................90.47 18 Hong Kong SAR ...............88.69 19 United States ...................87.96 20 Kuwait ..............................86.77 21 Portugal ...........................81.23 22 Czech Republic ................80.65 23 Slovak Republic................79.58 24 Greece .............................77.94 25 Hungary ...........................72.67 26 Thailand ...........................72.67 27 Italy ..................................71.01 28 Poland..............................70.19 29 Malaysia ...........................66.17 30 Bahrain.............................64.51 31 China ...............................63.82 32 United Arab Emirates .......59.73 33 Turkey ..............................57.60 34 Brazil ................................55.86 35 South Africa .....................53.65 36 Russian Federation ...........48.18 37 Saudi Arabia .....................46.42 38 Romania ...........................44.59 39 Venezuela .........................44.12 40 Kenya ...............................42.34 41 Chile .................................42.18 42 Kazakhstan ......................42.11 43 Ukraine .............................41.27 44 Bangladesh ......................39.55 45 Morocco...........................39.07 46 India .................................35.23 47 Argentina ..........................33.13 48 Colombia..........................30.43 49 Nigeria ..............................29.67 50 Ghana ..............................29.43 51 Mexico .............................27.43 52 Philippines ........................26.56 53 Jordan ..............................25.47 54 Panama............................24.93 55 Vietnam ............................21.37 56 Peru .................................20.46 57 Indonesia .........................19.58 58 Tanzania ...........................17.26 59 Pakistan ...........................10.31 60 Egypt .................................9.72 n/a Norway ................................n/a n/a Switzerland ..........................n/a
SouRCe: IMF, Financial Access Survey, 2011
1 2009
SouRCe: Demirguc-Kunt, A. and L. Klapper. 2012. “Measuring Financial Inclusion: The Global Findex Database.” World Bank Policy Research Working Paper 6025. Washington DC: The World Bank
Commercial bank branches
7.08
This is the number of commercial bank branches per
100,000 adults | 2010
This is the percent of the population (15 years or older) with an account at
a formal financial institution | 2011
Market penetration of bank accounts
7.07
The Financial Development Report 2012 | 381
3: Data Tables | Financial access
Rank CountRy/eConomy value
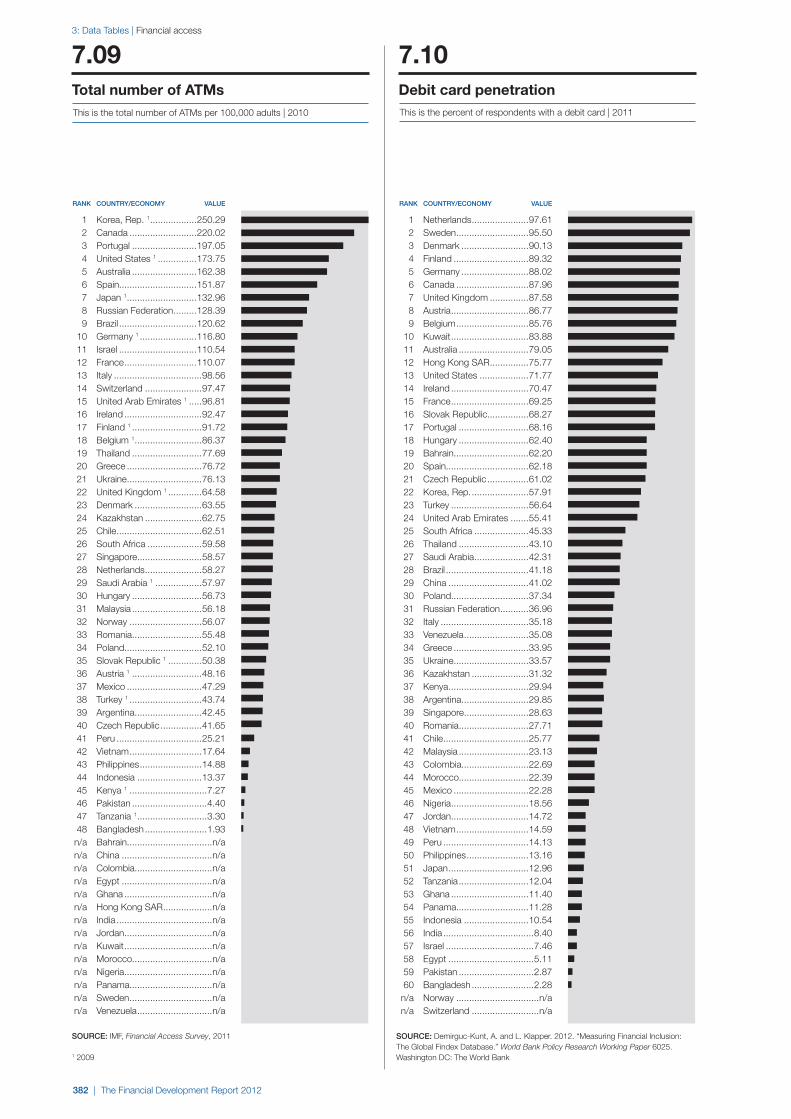
1 Netherlands ......................97.61 2 Sweden ............................95.50 3 Denmark ..........................90.13 4 Finland .............................89.32 5 Germany ..........................88.02 6 Canada ............................87.96 7 United Kingdom ...............87.58 8 Austria ..............................86.77 9 Belgium ............................85.76 10 Kuwait ..............................83.88 11 Australia ...........................79.05 12 Hong Kong SAR ...............75.77 13 United States ...................71.77 14 Ireland ..............................70.47 15 France ..............................69.25 16 Slovak Republic................68.27 17 Portugal ...........................68.16 18 Hungary ...........................62.40 19 Bahrain.............................62.20 20 Spain................................62.18 21 Czech Republic ................61.02 22 Korea, Rep. ......................57.91 23 Turkey ..............................56.64 24 United Arab Emirates .......55.41 25 South Africa .....................45.33 26 Thailand ...........................43.10 27 Saudi Arabia .....................42.31 28 Brazil ................................41.18 29 China ...............................41.02 30 Poland..............................37.34 31 Russian Federation ...........36.96 32 Italy ..................................35.18 33 Venezuela .........................35.08 34 Greece .............................33.95 35 Ukraine .............................33.57 36 Kazakhstan ......................31.32 37 Kenya ...............................29.94 38 Argentina ..........................29.85 39 Singapore .........................28.63 40 Romania ...........................27.71 41 Chile .................................25.77 42 Malaysia ...........................23.13 43 Colombia..........................22.69 44 Morocco...........................22.39 45 Mexico .............................22.28 46 Nigeria ..............................18.56 47 Jordan ..............................14.72 48 Vietnam ............................14.59 49 Peru .................................14.13 50 Philippines ........................13.16 51 Japan ...............................12.96 52 Tanzania ...........................12.04 53 Ghana ..............................11.40 54 Panama............................11.28 55 Indonesia .........................10.54 56 India ...................................8.40 57 Israel ..................................7.46 58 Egypt .................................5.11 59 Pakistan .............................2.87 60 Bangladesh ........................2.28 n/a Norway ................................n/a n/a Switzerland ..........................n/a
Rank CountRy/eConomy value
1 Korea, Rep. 1 ..................250.29 2 Canada ..........................220.02 3 Portugal .........................197.05 4 United States 1 ...............173.75 5 Australia .........................162.38 6 Spain..............................151.87 7 Japan 1 ...........................132.96 8 Russian Federation .........128.39 9 Brazil ..............................120.62 10 Germany 1 ......................116.80 11 Israel ..............................110.54 12 France ............................110.07 13 Italy ..................................98.56 14 Switzerland ......................97.47 15 United Arab Emirates 1 .....96.81 16 Ireland ..............................92.47 17 Finland 1 ...........................91.72 18 Belgium 1 ..........................86.37 19 Thailand ...........................77.69 20 Greece .............................76.72 21 Ukraine .............................76.13 22 United Kingdom 1 .............64.58 23 Denmark ..........................63.55 24 Kazakhstan ......................62.75 25 Chile .................................62.51 26 South Africa .....................59.58 27 Singapore .........................58.57 28 Netherlands ......................58.27 29 Saudi Arabia 1 ..................57.97 30 Hungary ...........................56.73 31 Malaysia ...........................56.18 32 Norway ............................56.07 33 Romania ...........................55.48 34 Poland..............................52.10 35 Slovak Republic 1 .............50.38 36 Austria 1 ...........................48.16 37 Mexico .............................47.29 38 Turkey 1 ............................43.74 39 Argentina ..........................42.45 40 Czech Republic ................41.65 41 Peru .................................25.21 42 Vietnam ............................17.64 43 Philippines ........................14.88 44 Indonesia .........................13.37 45 Kenya 1 ..............................7.27 46 Pakistan .............................4.40 47 Tanzania 1 ...........................3.30 48 Bangladesh ........................1.93 n/a Bahrain.................................n/a n/a China ...................................n/a n/a Colombia..............................n/a n/a Egypt ...................................n/a n/a Ghana ..................................n/a n/a Hong Kong SAR ...................n/a n/a India .....................................n/a n/a Jordan ..................................n/a n/a Kuwait ..................................n/a n/a Morocco...............................n/a n/a Nigeria ..................................n/a n/a Panama................................n/a n/a Sweden ................................n/a n/a Venezuela .............................n/a
SouRCe: Demirguc-Kunt, A. and L. Klapper. 2012. “Measuring Financial Inclusion: The Global Findex Database.” World Bank Policy Research Working Paper 6025. Washington DC: The World Bank
SouRCe: IMF, Financial Access Survey, 2011
1 2009
This is the percent of respondents with a debit card | 2011
Debit card penetration
7.10
This is the total number of ATMs per 100,000 adults | 2010
Total number of ATMs
7.09
382 | The Financial Development Report 2012
3: Data Tables | Financial access
Rank CountRy/eConomy value
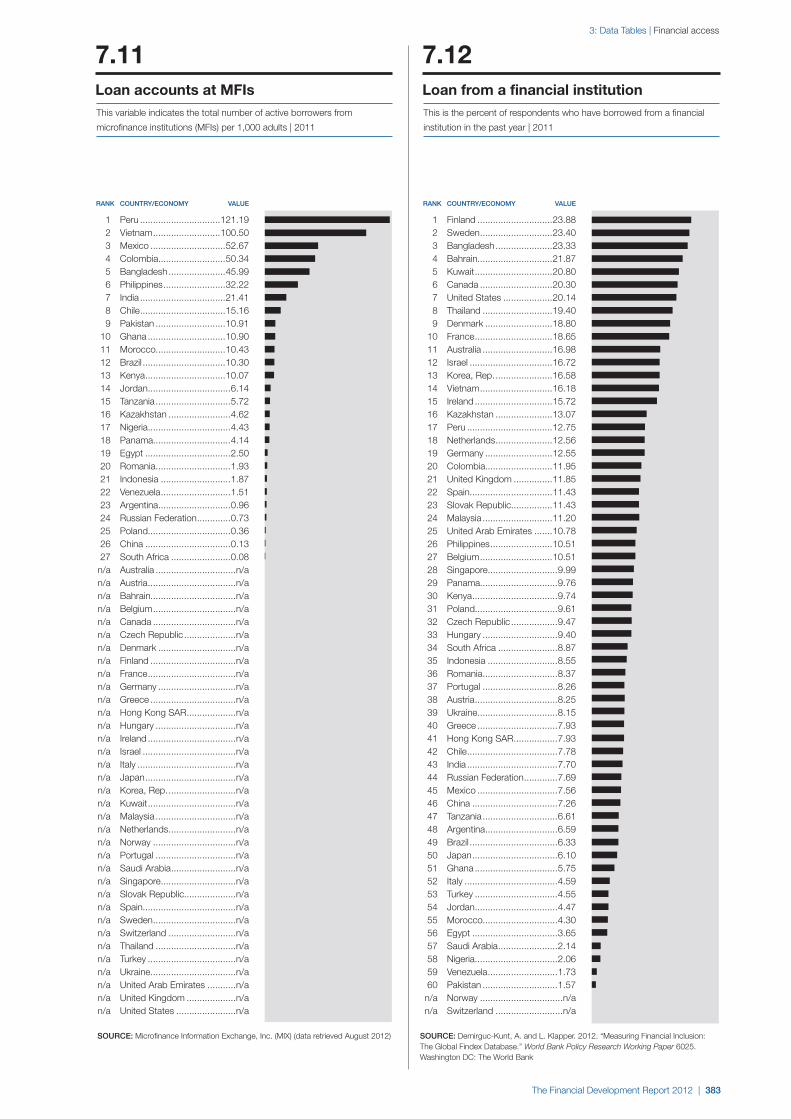
1 Finland .............................23.88 2 Sweden ............................23.40 3 Bangladesh ......................23.33 4 Bahrain.............................21.87 5 Kuwait ..............................20.80 6 Canada ............................20.30 7 United States ...................20.14 8 Thailand ...........................19.40 9 Denmark ..........................18.80 10 France ..............................18.65 11 Australia ...........................16.98 12 Israel ................................16.72 13 Korea, Rep. ......................16.58 14 Vietnam ............................16.18 15 Ireland ..............................15.72 16 Kazakhstan ......................13.07 17 Peru .................................12.75 18 Netherlands ......................12.56 19 Germany ..........................12.55 20 Colombia..........................11.95 21 United Kingdom ...............11.85 22 Spain................................11.43 23 Slovak Republic................11.43 24 Malaysia ...........................11.20 25 United Arab Emirates .......10.78 26 Philippines ........................10.51 27 Belgium ............................10.51 28 Singapore ...........................9.99 29 Panama..............................9.76 30 Kenya .................................9.74 31 Poland................................9.61 32 Czech Republic ..................9.47 33 Hungary .............................9.40 34 South Africa .......................8.87 35 Indonesia ...........................8.55 36 Romania .............................8.37 37 Portugal .............................8.26 38 Austria ................................8.25 39 Ukraine ...............................8.15 40 Greece ...............................7.93 41 Hong Kong SAR .................7.93 42 Chile ...................................7.78 43 India ...................................7.70 44 Russian Federation .............7.69 45 Mexico ...............................7.56 46 China .................................7.26 47 Tanzania .............................6.61 48 Argentina ............................6.59 49 Brazil ..................................6.33 50 Japan .................................6.10 51 Ghana ................................5.75 52 Italy ....................................4.59 53 Turkey ................................4.55 54 Jordan ................................4.47 55 Morocco.............................4.30 56 Egypt .................................3.65 57 Saudi Arabia .......................2.14 58 Nigeria ................................2.06 59 Venezuela ...........................1.73 60 Pakistan .............................1.57 n/a Norway ................................n/a n/a Switzerland ..........................n/a
Rank CountRy/eConomy value
1 Peru ...............................121.19 2 Vietnam ..........................100.50 3 Mexico .............................52.67 4 Colombia..........................50.34 5 Bangladesh ......................45.99 6 Philippines ........................32.22 7 India .................................21.41 8 Chile .................................15.16 9 Pakistan ...........................10.91 10 Ghana ..............................10.90 11 Morocco...........................10.43 12 Brazil ................................10.30 13 Kenya ...............................10.07 14 Jordan ................................6.14 15 Tanzania .............................5.72 16 Kazakhstan ........................4.62 17 Nigeria ................................4.43 18 Panama..............................4.14 19 Egypt .................................2.50 20 Romania .............................1.93 21 Indonesia ...........................1.87 22 Venezuela ...........................1.51 23 Argentina ............................0.96 24 Russian Federation .............0.73 25 Poland................................0.36 26 China .................................0.13 27 South Africa .......................0.08 n/a Australia ...............................n/a n/a Austria ..................................n/a n/a Bahrain.................................n/a n/a Belgium ................................n/a n/a Canada ................................n/a n/a Czech Republic ....................n/a n/a Denmark ..............................n/a n/a Finland .................................n/a n/a France ..................................n/a n/a Germany ..............................n/a n/a Greece .................................n/a n/a Hong Kong SAR ...................n/a n/a Hungary ...............................n/a n/a Ireland ..................................n/a n/a Israel ....................................n/a n/a Italy ......................................n/a n/a Japan ...................................n/a n/a Korea, Rep. ..........................n/a n/a Kuwait ..................................n/a n/a Malaysia ...............................n/a n/a Netherlands ..........................n/a n/a Norway ................................n/a n/a Portugal ...............................n/a n/a Saudi Arabia .........................n/a n/a Singapore .............................n/a n/a Slovak Republic....................n/a n/a Spain....................................n/a n/a Sweden ................................n/a n/a Switzerland ..........................n/a n/a Thailand ...............................n/a n/a Turkey ..................................n/a n/a Ukraine .................................n/a n/a United Arab Emirates ...........n/a n/a United Kingdom ...................n/a n/a United States .......................n/a
This variable indicates the total number of active borrowers from
microfinance institutions (MFIs) per 1,000 adults | 2011
Loan accounts at MFIs
7.11
SouRCe: Demirguc-Kunt, A. and L. Klapper. 2012. “Measuring Financial Inclusion: The Global Findex Database.” World Bank Policy Research Working Paper 6025. Washington DC: The World Bank
This is the percent of respondents who have borrowed from a financial
institution in the past year | 2011
Loan from a financial institution
7.12
SouRCe: Microfinance Information Exchange, Inc. (MIX) (data retrieved August 2012)
The Financial Development Report 2012 | 383