financial performance report 2009 · susenas survei sosial ekonomi nasional national socio-economic...
TRANSCRIPT

FINANCIAL PERFORMANCE
REPORT 2009
Annual Review of Indonesian Education Sector Financing
January 2010
DRDRAFT – Indonesia Basic Education Program
Australia – Indonesia Basic Education Program
A joint initiative of the Australian and Indonesian Governments

Preface
Page ii
PREFACE
The Australia–Indonesia Partnership is a whole of government aid program encompassing
expenditure of around $2 billion over five years. This includes the $1 billion Australia Indonesia
Partnership for Reconstruction and Development (AIPRD), the single largest aid package in
Australia’s history, of which the Basic Education Program (BEP) is a key element.
The objective of BEP is improved equitable access to higher quality and better governed basic
education services, especially in targeted disadvantaged areas. Support is delivered through a
programmatic approach based on the three pillars of the government’s RENSTRA: improved access
through construction of junior secondary schools, improved quality and internal efficiency and
improved governance. For BEP, a fourth pillar is enhanced resource mobilisation, including policy
advice, research and sector monitoring.
Recognising the scale of the policy reform agenda being adopted by Government of Indonesia (GoI),
the Strategic Advisory Services (SAS) component of BEP has been designed primarily to advise on the
overall strategic direction of the BEP and to implement activities under pillar four. The contractor for
Strategic Advisory Services (CSAS) is also tasked with providing selected capacity building and
mentoring to key counterparts in MoNE and MoRA.
This is the third Annual Financial Performance Report. It has been prepared by a CSAS core team
member - Finance Performance Specialist, Mr. Adam Rorris with close collaboration and support
from the Ministry of Finance. The consultant acknowledges the support and advice of the many
people that contributed to the study. The document was reviewed by team leader Ms. Hetty
Cislowski. Data analysis support was provided by Mr. Ahmad Evandri undertook the task of collecting
the relevant electronic and paper records from districts.
The second part of this report is an executive summary of a report on the impact of the global
financial crisis on the Indonesian education system. The study was undertaken by Balitbang with
technical support from CSAS. The report itself was requested by National Parliament which was
concerned at the potential impact of the financial crisis on Indonesian schooling. CSAS funded a
national consultant (Ibu Ninasapti Triaswati) to assist with the design of the study. The study
identified districts and localities that were most likely to be affected by the crisis and examined local
expenditure patterns as well as impact on school retention rates and attendance. CSAS has produced
a summary version of that report in English which is available for general distribution.
The views and opinions expressed in this report are those of the CSAS Finance Performance
Specialist and do not necessarily reflect those of MoNE, MoRA, Bappenas or AusAID.
ABBREVIATIONS AND ACRONYMS
Acronym Bahasa Indonesia English
ACER Australian Council for Educational Research
ADB Bank Pembangunan Asia Asian Development Bank
APK Angka Partisipasi Kasar Gross Enrolment Rate
APM Angka Partisipasi Murni Net Enrolment Rate
AusAID Badan Australia untuk Pembangunan Internasional Australian Agency for International Development
AWP Rencana Kerja Tahunan Annual Work Plan
Balitbang Badan Penelitian dan Pengembangan Centre for Research and Development
Bappenas Badan Perencanaan Pembangunan Nasional National Development Planning Agency
BEP Program Pendidikan Dasar Australia-Indonesia Australia-Indonesia Basic Education Program
BOS Biaya Operasional Sekolah School Operational Fund
BOS Buku Biaya Operasional Sekolah Buku School Operation Funds for Textbooks
BSNP Badan Standar Nasional Pendidikan National Education Standards Board
CCR Rasio Kelas-Ruang Kelas Class-Classroom Ratio
CSAS Kontraktor untuk Layanan Kepenasehatan Strategis Contractor for Strategic Advisory Services
DG Direktorat Jendral Directorate General
EC Komisi Eropa European Commission
EFA Pendidikan untuk Semua Education for All
ESP Rencana Strategis Pendidikan Education Strategic Plan
ESWG Kelompok Kerja Sektor Pendidikan Education Sector Working Group
GDP Pendapatan Domestik Bruto Gross Domestic Product
GER Angka Pendaftaran Kasar Gross Enrolment Rate
GOI Pemerintah Indonesia Government of Indonesia
JSS Sekolah Menengah Pertama Junior Secondary School
KPI Indikator Kunci dari Kunci Key Performance Indicator
LAKIP Laporan Akuntabilitas Kinerja Publik Public Performance Accountability Report
MCPM Kontraktor Pelaksana untuk Pengelolaan Program Managing Contractor Program Management
MDA Kajian Tengah Dekade Mid-Decade Assessment
MoF Departemen Keuangan Ministry of Finance
MONE Departemen Pendidikan Nasional Ministry of National Education
MORA Departemen Agama Ministry of Religious Affairs
NER Angka Pendaftaran Murni Net Enrolment Rate
NFE Pendidikan Non-formal Non-Formal Education
PAM Matriks Aksi Kebijakan Policy Action Matrix
PCMU Unit Pengelola dan Koordinasi Program Program Coordination and Management Unit
PMPTK Peningkatan Mutu Pendidik dan Tenaga Kependidikan Quality Improvement of Teachers and Education
Personnel
PSC Komite Pengarah Program Program Steering Committee

Abbreviations and Acronyms
Page iv
Acronym Bahasa Indonesia English
PTP Matrix Matriks Sasaran dan Kinerja Program Program Targets and Performance Matrix
PUSLIT Pusat Penelitian Center for Research
PUSPENDIK Pusat Statistik Pendidikan Center for Education Statistics
Renstra Rencana Strategis Strategic Plan
Rp. Rupiah Rupiah
SCR Rasio Siswa Ruang Kelas Student Classroom Ratio
SD Sekolah Dasar Primary School
SIKD Sistem Informasi Keuangan Daerah Regional Finance Information system
SMP Sekolah Menengah Pertama Junior Secondary School
SMA Sekolah Menengah Atas Senior Secondary School
SWAP Pendekatan Sektor secara Luas Sector Wide Approach
SPI Indikator Kinerja Tambahan Supplementary Performance Indicator
STR Rasio Siswa Guru Student Teacher Ratio
SUSENAS Survei Sosial Ekonomi Nasional National Socio-Economic Survey
TA Bantuan Teknis Technical Assistance
ToR Kerangka Acuan Kerja Term of Reference
UN Perserikatan Bangsa-Bangsa United Nations
USAID Badan Amerika Serikat untuk Pembangunan
Internasional
United States Agency for International
Development

EXECUTIVE SUMMARY
Background
Indonesian district level expenditure patterns are increasingly important as districts have increased
responsibility for education management under the Indonesian government decentralisation policy.
Monitoring patterns of expenditure by districts will become an increasingly important role for the
Ministry of National Education and Ministry of Religious Affairs to ensure that national funding norms and
procedures are being implemented appropriately. Financial analysis of education allocations therefore
needs to have a district level disaggregation to assess the variability in fiscal capacity and actual
allocations for education resourcing.
The wide range of districts’ poverty status and the importance of education in lifting district populations
out of poverty also mean that vulnerable groups stand to benefit most from well targeted education
investment. Monitoring and evaluation of district level education financing provides the tools to do so.
The Financial Performance Report 2009 monitors and reports on trends in education financing in
Indonesia. This is the third Finance Performance Report produced by the Contractor for the AusAID
supported Strategic Advisory Services team. The report is intended for the use of high level government
officials and education sector technical experts and is updated annually. It provides succinct analysis and
is intended to be an accessible tool for operational planning. The objectives of the report are:
1. To identify trends in the quantum and distribution of education funding in relation to national policy
and school needs.
2. To monitor education sector and school resourcing from the standpoint of the key RENSTRA themes
of access, quality improvement and improved accountability.
3. To inform GoI and donors of the effectiveness and efficiency of current school funding mechanisms.
4. To support the capacity of GoI institutions to monitor and report on school financing.
Key Performance Indicators and Analysis
The report analysis is framed by a set of Key Performance Indicators (KPI). These KPI focus attention on
the main RENSTRA themes and government financial commitment to education. Most of these KPI are
reported on at a national level by the GoI as part of its international Education for All (EFA) reporting
obligations. An additional two (2) KPI have been nominated to guide analysis of district level
expenditures.
Supplementary Performance Indicators (SPI) are also presented in this report. They offer a more nuanced
perspective on financial performance of the education sector. The KPI and SPI are updated in each annual
Financial Performance Report with the latest available national and district data.
Each of the indicators proposed is described as being either a lead or lag indicator. Lag indicators are
summative in nature. They describe the current state of progress toward an expected outcome. Lead

Executive Summary
Page vi
indicators are those which capture the rate of movement towards an outcome or have a clear causal
relationship to a desired outcome.
A summary of the results and findings for each of the KPI and SPI is presented in table format as part of
this Executive Summary. This includes a summary assessment of the indicator result being positive,
negative or uneven. A `Positive’ result indicates it is supportive of RENSTRA objectives and BEP activities;
a ‘Negative’ result suggests it is contradictory to RENSTRA objectives and BEP activities; and an ‘Uneven’
result indicates large variation between districts.
This report has also benefited from the Enhanced Analytical Facility (EAF) which is a database and
warehousing initiative of CSAS. This has brought together education, finance and socio-economic data
sets from a very wide range of sources. Greater inter-relational analysis of these data sets and enhanced
visualisation capacity from new software adds power and improves readability of the report.
Key Findings
Continued growth in national public expenditure for education in Indonesia. There has been a broad
upward trend in public expenditure for education. Consistent funding increases have been attained in
nominal value terms for all years except for 2004. This is a very positive result for Indonesia during a year
that was marked by profound global economic uncertainty. The continued commitment of national and
sub-national governments to increase education expenditure is more impressive given that the 2009
budgets were framed in late 2008 when the financial crisis was unfolding.
The public expenditure for education (not accounting for price inflation) has increased nearly 500%
between 2001 and 2009. The nominal value of public expenditures for education increased from 42
trillion in 2001 to 207 trillion by 2009.
The real value of public expenditure for education has increased 250% during the period 2001- 2009. In
2001 constant prices, national education expenditures have increased from Rp. 42 trillion to Rp. 106
trillion in 2009.
Annual increases in national education expenditure have been uneven. The growth in education
expenditure has been uneven in both nominal value and real prices. Sharp increases in public expenditure
for education in the years 2003 and 2006 were followed by contractions in 2004 and 2008.
Government commitment to meet a 20% target for education expenditure share of national budget from 2009
onwards may reduce future unpredictability and volatility in education expenditure. The national expenditures for
education in 2009 reached Rp. 207 trillion which showed a very strong annual increase rising by more than Rp. 50
trillion in nominal value and more than Rp. 27 trillion in 2001 constant prices. By allocating the Rp.207 trillion to
education the government effectively met the constitutional target to allocate 20% of total national budget to
education. Future growth in national education expenditure should track the growth in the national budget. While
there may still be volatility linked to the economic cycle and government fiscal policy settings, adherence to a
proportional budget allocation for education should enhance the ability of the education sector to anticipate future
allocations and plan accordingly.
Salary shares of total education expenditure reduced from 84% in 2004 to 78% in 2007. This is a positive
result indicating more resources available for materials, maintenance and capital improvements.
However, there is little room for complacency in this respect. From 2008 onwards there will be a rapid
increase in salary expenditures due to the fiscal impact of remuneration for teachers attaining teacher

Executive Summary
Page vii
certification. Certified teachers will garner at least 100% of pay increases once they are certified. The
cumulative impact of these increases will act to severely cramp future increases in non-salary
expenditures. It will be increasingly important for districts and schools to ensure that non-salary
expenditures are effective and efficiently distributed.
Continued growth in education shares of district budgets. Average district level education expenditures
across Indonesia have increased from 27% of the total district budget (APBD) in 2006 to a 32% share in
2009. The growth in education share of district budgets is consistent for urban and rural areas as well BEP
and non-BEP districts. However, a negative finding is that the poorest districts committed on average 28%
of their budget in 2009 compared to all other district quintiles which spent on average more than 30%.
The lowest average share of budget allocation for education was found in Papua and Maluku island
groups. Both of these islands recorded less than 20% average share for education with little increase
during the period 2006-2009.
Poorest districts are growing their education budgets but not as fast as the other districts. Poorest
districts (bottom quintile) recorded a 15% growth in their 2009 education budget. This follows 19% and
13% annual growth between 2006-07 and 2007-08 budgets. The continued strong growth of education
budgets within the poorest districts is tempered by an even stronger all districts growth rate of 18% in
2009. The sharper growth rates of the richer districts indicates the poorest will have a harder job of
matching the education achievements of more economically developed districts.
District expenditures per student have grown over the four years with average per student allocations in
the poorest districts equal or higher than other quintiles. The relatively flat distribution of district
education funding per student across poverty quintiles is good in so far that it does not show greater per
student amounts being allocated in the richest districts. However, the limitation of the ‘flat line
achievement’ is that such a distribution across poverty groupings is not sufficient to promote more
equitable services and learning attainment across the country. This means per student funding increasing
significantly across poverty groupings from the richest to the poorest. Significant differences in unit costs
across islands reflect the impact of geography and sparsity of population on the cost of delivering
education. Calculation of district expenditure per public students shows Papua reaching Rp. 7.1 million in
2009 compared to the next highest Kalimantan (Rp. 4.7 million). Java has the lowest island expenditure per
public student (Rp. 2.5 million).
Critical Education Funding Status (CEFS) districts were identified that appear to be significantly below
average in their education financing approach. Eleven districts have(i)low expenditure per student (less
than Rp. 2.1 million), (ii) small education share of the district budget (less than 15%), and (iii) weak annual
growth in their education budget (less than 20%). Six of these critical districts are part of the Maluku
island grouping.
On average, districts in 2007 managed to spend nearly 100% of their planned education budgets. This
was a significant improvement in budget execution on 2006 where only 91% of funds were spent
nationally. However, while there is an overall improvement in budget execution, it was generally the
poorest quintile districts that were below average and spent just over 90% of their education budget. The
wealthiest districts spent more than their planned budget.
In 2009 BOS contributed funds directly to public schools equivalent to approximately 13% of total
district level education expenditure for public schools. BOS expenditures as a proportion of total district

Executive Summary
Page viii
level expenditure have grown since 2008 which reverses a previous trend for declining significance. BOS
grants offer great potential for funding innovative and securely resourced interventions at schools that
have an ongoing recurrent funding base. This allows school principals to plan around these allocations
instead of pursuing submission based models of grants.
Recommendations
1. Assess how the 20% policy target for public allocations to the education sector is met from national
and sub-national levels of government.
2. Undertake a study focused on the poorest districts (poverty quintile 5 districts) to examine why some
of these districts with high poverty rates are allocating significantly smaller share of resources for
education than the national average. Prepare options for a sector response (MoNE and MoRA) and/or
a whole of government response as may be required.
3. Undertake a detailed study of education financing and school provision in eleven districts that present
red-flags on the Critical Education Funding Status indicator (low expenditure per student, small
education share of district budget, weak education budget growth).
4. Maximise equity effects of additional school funding by concentrating expenditures in poorest quintile
districts which have the greatest need. Affordability of this approach is enhanced by the relatively
smaller numbers of students in the poorest quintile districts.
5. A study and policy dialogue with Dinas education offices is required to determine reasons for the
under-expenditure of annual education budgets focused on the poorest districts. The study should
propose options for improving the uptake of funds that can promote their efficient and effective use
for education purposes at the district level.
6. The future AusAID funded program from 2010 onwards may have a deeper engagement with building
school and district level capacity in education management. A key focus of this work could be to help
school principals better plan and manage their BOS funds and to help districts better monitor and
support the schools in their disbursement activities.
Data Resources
This report is based on expanded database for all years from 2007 onwards. This means there are some
variations from the results presented in the 2007 report. The report highlights any significant changes.
This report continues to provide a detailed analysis not only of national level expenditures but also of
expenditures at the district level. This analysis has been made possible through the collection of
disaggregated district expenditure data collected from the original budget papers prepared and
submitted by each district to the MoF. These records are the most authoritative district level account
available of actual budget allocations for a year and actual expenditures for the previous year. The initial
cooperative arrangement established by CSAS with the MoF in 2007 has continued into 2008 and 2009
and ideally will be consolidated in 2010-2014 under new program arrangements being agreed between
GOI, AusAID and EC.
Executive Summary
Page ix
The report is structured to enable comparisons with the results for 2006, 2007 and 2008. While time
series comparisons have been possible at a national level, multiple time series comparisons are being
established at the district level over a four year period.
In this report district level analysis for 2006 and 2007 is based on the final available set of data. The 2008
report was based on the fewer returns and did not include data on actual expenditures (realized budget).
The data analysis and interpretation has now been updated in the Financial Performance Report 2009.

Executive Summary
Page x
Table 1 Summary Findings – Financial Performance at National/District Levels
Indicator Description Gov’t Level/
Related Goal
Comment
KPI 1 Share of public
expenditure
Public expenditure on
education as
percentage of total public
expenditure
National
Gov’t commitment
Result = Positive
Significant growth in allocations as proportion of national expenditure since
2001 (12%) to 20% by 2009.
KPI 2 Share of GNP Public expenditure on
education as percentage of
GDP
National
Gov’t commitment
Result = Positive
Education expenditure as a percentage of GDP has risen from 2.1% in 2001 to
3.7% by 2009.
Small decline from 3.6% in 2007 to 3.1% in 2008. Future growth in public
allocations for education may become harder in the future.
KPI 3 Share of non-
salary resources
% share of education budget
spending on non-salary
costs.
National
Quality
Result = Positive
Salary related items consumed less of the education budget in 2007 (78%)
compared to 84% consumption in 2004.
KPI 4 National
commitment for non-
formal learning
Public expenditure on
literacy and NFE as
percentage of public
expenditure on education
National
Equity/access
Result= Negative
NFE expenditure is approximately 1% of total expenditure for education.
Key advantage of NFE is its cost-effectiveness; increased levels of investment
are needed to maximise possible economic and social returns.
KPI 5 Commitment to
Basic education
relative to national
wealth
Public recurrent expenditure
on basic education per pupil
as percentage of GNP per
capita
National
Equity/access
Result = Positive
In 2004 basic education accounts for approximately 70% of education
expenditure. More recent analysis of central level expenditures shows basic
education share to be maintaining high levels
KPI 6 District
commitment to
education
Education as % of total
public expenditures
District
Gov’t commitment
Equity/access
Result = Positive
Average district level education expenditures in Indonesia increased from
27% of total district budget in 2006 to 32% share in 2009.
KPI 7 Annual growth in
spending for the
poorest districts
Annual % change in public
expenditures for education in
lowest quintile districts
compared to national %
change in public expenditure
for education
District
Equity/access
Result = Uneven
Annual growth in 2009 education budgets of the poorest strong (15%) but
was outstripped by faster growth in richest districts (22%). The sharper
growth rates of the better off districts indicates the poorest will have a hard
job of catching up.
KPI 8 Average District
Expenditure per
student
Public expenditure from
APBD divided by total
number of school students
District
Gov’t commitment
Quality
Result = Positive
Strong growth in average expenditures per student across country. Poorest
quintile districts continue have amongst highest per student expenditure.
KPI 9 Actual education
expenditure as % of
planned expenditure
Realised APBD for
education as % of planned
APBD for education
District
Gov’t commitment
Result = Positive
Districts in 2007 managed to spend nearly 100% of their planned budget.
This was a significant improvement on 2006 where only 91% of funds were
spent nationally.
SPI 1 Relative growth
ratio of education
spending
Annual % growth in public
education expenditure as
ratio to % annual growth of
total public expenditure
District
Gov't commitment
Result = Positive
On average, education expenditure at the district level grew at double the
rate of aggregate spending in both rural and urban districts across Indonesia
in 2009.
SPI 2 Discretionary
school funds as % of
total school
expenditure
Estimated BOS expenditure
as % of total school
expenditure
District
Quality
Result = Positive
The BOS grants to district schools offer a vital source of discretionary funds
to schools. They provide an additional 13% of average of district level
expenditure directly to district run schools.
In 2009 BOS grants as a % of total district budget grew from the previous
year reflecting the increased value of the per capita grant.
* KPI – Key Performance Indicator, SPI – Supplementary Performance Indicator.

Table of Contents
PREFACE .......................................................................................................................................................... II
ABBREVIATIONS AND ACRONYMS ..................................................................................................................III
EXECUTIVE SUMMARY .................................................................................................................................... V
BACKGROUND ........................................................................................................................................................ V
KEY FINDINGS ........................................................................................................................................................ VI
RECOMMENDATIONS ............................................................................................................................................. VIII
I. INTRODUCTION ....................................................................................................................................... 3
A. OBJECTIVES OF THE FINANCIAL PERFORMANCE REPORT ......................................................................................... 3
B. SCOPE OF ANALYSIS ........................................................................................................................................ 3
C. APPROACH AND METHODOLOGY ....................................................................................................................... 4
D. REPORT STRUCTURE ........................................................................................................................................ 6
II. FINANCIAL PERFORMANCE – NATIONAL LEVEL ....................................................................................... 7
A. OVERVIEW AND NATIONAL DATA SOURCES ......................................................................................................... 7
B. TRENDS IN EDUCATION FUNDING....................................................................................................................... 8
III. TRENDS IN DISTRICT EDUCATION FUNDING .......................................................................................... 16
SPECIAL DISCUSSION THEME - THE GLOBAL FINANCIAL CRISIS AND INDONESIAN SCHOOLING ..................... 40
BACKGROUND ...................................................................................................................................................... 40
KEY FINDINGS ....................................................................................................................................................... 40
RECOMMENDATIONS ............................................................................................................................................. 43
IV. APPENDIX .............................................................................................................................................. 45
LIST OF TABLES
TABLE 1 SUMMARY FINDINGS – FINANCIAL PERFORMANCE AT NATIONAL/DISTRICT LEVELS ................................................. 1
TABLE 2 NATIONAL LEVEL EDUCATION FINANCING DATA 2001-2009 ............................................................................. 8
Deleted:
List of Figures
Page 2
LIST OF FIGURES
FIGURE 1: NATIONAL PUBLIC EXPENDITURE ON EDUCATION, RP. TRILLION 2001-2009 .................................................... 8
FIGURE 2: ANNUAL GROWTH IN EDUCATION EXPENDITURE(RP. TRILLION), 2001-2009 ................................................... 9
FIGURE 3: EDUCATION EXPENDITURE AS PROPORTION OF TOTAL NATIONAL PUBLIC EXPENDITURE, 2001-2008 ................. 10
FIGURE 4: EDUCATION EXPENDITURE AS PROPORTION OF GDP, 2001-2009 ............................................................... 12
FIGURE 5: AGGREGATE DISTRICT EXPENDITURE, YEARS 2004 AND 2007 ..................................................................... 13
FIGURE 6: EDUCATION EXPENDITURE BY SUB-SECTOR, 2004 ..................................................................................... 14
FIGURE 7: BASIC EDUCATION SHARE OF CENTRAL LEVEL EXPENDITURES FOR MONE AND MORA, 2006-2009................... 15
FIGURE 8: EDUCATION EXPENDITURE AS % OF TOTAL DISTRICT BUDGET (APBD 2006-2009) ......................................... 17
FIGURE 9: EDUCATION EXPENDITURE AS % OF TOTAL DISTRICT EXPENDITURE BY DISTRICTS ACCORDING TO POVERTY QUINTILE,
(APBD 2006-2009) ........................................................................................................................... 18
FIGURE 10: EDUCATION EXPENDITURE AS % OF TOTAL DISTRICT EXPENDITURE BY ISLAND GROUPING (APBD 2006-2009) .... 19
FIGURE 11: APBD EDUCATION EXPENDITURE AS % OF TOTAL DISTRICT EXPENDITURE IN BEP AND NON-BEP SUPPORTED
DISTRICTS (APBD 2006-2009) ............................................................................................................. 20
FIGURE 12: BEP DISTRICTS ONLY - EDUCATION EXPENDITURE AS % OF TOTAL DISTRICT EXPENDITURE BY DISTRICT POVERTY
QUINTILE (APBD 2006-2009) .............................................................................................................. 20
FIGURE 13: BEP DISTRICTS WITH LOW FINANCIAL SHARE FOR EDUCATION (LESS THAN 15% OF APBD EXPENDITURE) AND
EDUCATION EXPENDITURE PER STUDENT (RP. MILLION) 2009 ....................................................................... 21
FIGURE 14: ALL DISTRICTS WITH VERY LOW FINANCIAL SHARE FOR EDUCATION (LESS THAN 10% OF APBD EXPENDITURE) ....... 22
FIGURE 15: ANNUAL GROWTH IN APBD EDUCATION EXPENDITURE, 2007 -2009, BY POVERTY QUINTILE ........................... 23
FIGURE 16: ANNUAL GROWTH IN DISTRICT EDUCATION EXPENDITURE, (APBD 2007-2009) ............................................ 24
FIGURE 17: BEP AND NON-BEP SUPPORTED DISTRICTS, ANNUAL GROWTH IN APBD EDUCATION EXPENDITURE, 2007 -2009
24
FIGURE 18: BEP DISTRICTS ONLY - ANNUAL GROWTH IN DISTRICT EDUCATION EXPENDITURE, (APBD 2007-2010) ............. 25
FIGURE 19: AVERAGE DISTRICT EDUCATION EXPENDITURE PER ALL STUDENTS, (RP MILLIONS.) ........................................... 26
FIGURE 20: COMPARISON - EXPENDITURE PER ALL STUDENTS VS. EXPENDITURE PER PUBLIC STUDENTS, (RP. MILLIONS) ......... 27
FIGURE 21: AVERAGE APBD EDUCATION EXPENDITURE PER STUDENT (RP), BEP AND NON-BEP DISTRICTS ......................... 28
FIGURE 22: AVERAGE APBD EDUCATION EXPENDITURE PER STUDENT (RP), BY POVERTY QUINTILE DISTRICTS ...................... 28
FIGURE 23: AVERAGE APBD EDUCATION EXPENDITURE PER STUDENT (RP), BY ISLAND ..................................................... 29
FIGURE 24: CRITICAL EDUCATION FUNDING STATUS (CEFS) DISTRICTS – DISTRICTS WITH LOW GROWTH IN EDUCATION BUDGET,
LOW SHARE OF DISTRICT BUDGET AND LOW EXPENDITURE PER STUDENT (APBD2009) ...................................... 30
FIGURE 25: NUMBER OF STUDENTS AND AVERAGE APBD EDUCATION EXPENDITURE PER STUDENT (RP), 2009 BY QUINTILE .. 31
FIGURE 26: REALISED EDUCATION EXPENDITURE AS % OF PLANNED EXPENDITURE 2006 AND 2007 .................................. 32
FIGURE 27: REALISED EDUCATION EXPENDITURE AS % OF PLANNED EXPENDITURE 2006-07, BEP AND NON-BEP DISTRICTS .. 33
FIGURE 28: REALISED EDUCATION EXPENDITURE AS % OF PLANNED EXPENDITURE 200 AND 2007, BY POVERTY QUINTILE ..... 33
FIGURE 29: POOREST QUINTILE DISTRICTS THAT REALISED LESS THAN 90% OF EDUCATION BUDGET 2007 ........................... 34
FIGURE 30: ANNUAL EDUCATION EXPENDITURE GROWTH RATIO, (2006-2007, 2007-08, 2008-09) ............................... 35
FIGURE 31: EDUCATION EXPENDITURE GROWTH RATIO, BEP & NON-BEP SUPPORTED DISTRICTS (2006-07, 2007-08) ...... 36
FIGURE 32: EDUCATION EXPENDITURE GROWTH RATIO BY POVERTY QUINTILE, (2006-07, 2007-08), POVERTY QUINTILES ... 36
FIGURE 33: BOS GRANTS AS % OF EDUCATION & CULTURE BUDGET 2006-2008 ........................................................... 37
FIGURE 34: BEP AND NON-BEP DISTRICTS - BOS GRANTS AS % OF EDUCATION & CULTURE BUDGET 2006-2008, ............. 38
FIGURE 35: BOS GRANTS AS % OF EDUCATION & CULTURE BUDGET 2006, BY POVERTY QUINTILE .................................... 39
FIGURE 1: DISTRICT ENROLMENT DATA COLLECTED BY POVERTY QUINTILES STATUS OF DISTRICTS ..................................... 45
FIGURE 2: DISTRICT FINANCIAL DATA COLLECTED BY POVERTY QUINTILES STATUS OF DISTRICTS ....................................... 45

Page 3
I. INTRODUCTION
This is the third Finance Performance Report produced by the CSAS team. The report assesses
the trends in education funding at national and district level in Indonesia between 2006 and
2009.
Indonesian district level expenditure patterns are increasingly important as districts have
increased responsibility for education management under the Indonesian government
decentralisation policy. Monitoring patterns of expenditure by districts will become an
increasingly important role for the Ministry of National Education and Ministry of Religious Affairs
to ensure that national funding norms and procedures are being implemented appropriately.
Financial analysis of education allocations therefore needs to have a district level disaggregation
to assess the variability in fiscal capacity and actual allocations for education resourcing.
The wide range of districts’ poverty status and the importance of education in lifting district
populations out of poverty also mean that vulnerable groups stand to benefit most from well
targeted education investment. Monitoring and evaluation of district level education financing
provides the tools to do so.
It is for the attention of the Project Steering Committee, the senior level officials within relevant
GoI agencies and for AusAID as the donor agency.
A. Objectives of the Financial Performance Report
The objectives of the report are:
1. To identify trends in the quantum and distribution of education funding in relation to national
policy and school needs
2. To monitor education sector and school resourcing addressing the key RENSTRA themes of
access, quality improvement and improved accountability
3. To inform GoI and donors of the effectiveness and efficiency of current school funding
mechanisms
4. To support the capacity of GoI institutions to monitor and report on school financing
B. Scope of Analysis
District Level Disaggregation
The district level of government has an increasing importance in education provision under the
GoI decentralisation policy. Financial analysis of education allocations therefore needs to have a
district level disaggregation to assess the variability in fiscal capacity and actual allocations for
education resourcing.
Key Performance Indicators
The Key Performance Indicators (KPI) focus on the three main RENSTRA themes and government
financial commitment to education.

Introduction
Page 4
Two Supplementary Performance Indicators (SPI) sit below the KPI. The SPI offer a more nuanced
perspective across the three RENSTRA themes assessing education expenditure at a district level.
SPI have been chosen based on available data against the three RENSTRA themes.
Lead and Lag Indicators
Each of the indicators proposed are described as being either a lead or lag indicator1.
Lag indicators are summative in nature. They describe the current state of progress toward an
expected outcome. For example, a lag indicator measuring government financial commitment
towards education is the percentage of total public expenditure allocated towards education.
Lead indicators are those which capture the rate of movement towards an outcome or have a
clear causal relationship to a desired outcome. For example, a lead indicator of government
commitment towards financial commitment towards education might be annual percentage real
increase in the education share of total public expenditure.
Selection of Indicators
The indicators used have been drawn from a number of sources. One group of Key Performance
Indicators is used by GoI as part of its EFA reporting obligations.
Another set of indicators focuses mainly on the district level of analysis. These have been selected
to be of use for the Indonesian government and the Basic Education Program (BEP) in promoting
development of the basic education sector across Indonesia. These indicators can be of use at the
district level for planning and budgeting purposes.
C. Approach and Methodology
Phased Approach – Over 3 Years
The financial performance monitoring of the education sector by CSAS began in 2007. The annual
Financial Performance Report has built on each successive year as additional data becomes
available and as the indicators become better known. Financial performance monitoring begins
with what is available now and works towards future improvement.
Build On Existing Research – Enhanced Analytical Facility(EAF)
In 2007 the BEP funded the establishment of an education sector database. This database has
been the statistical platform used by CSAS to drive much of its financial and broader sector based
analysis. Since that time, the education sector related financial and non-financial data has
expanded and not all of this has been able to be incorporated within the BEP education sector
database. This reflects the large and complex nature of some of these records. The EAF is a data
warehouse facility that has collected the relevant and useful education related data from their
different sources. The data have been (i) collected, (ii) analyzed for their quality in terms of
completeness, validity and relation to other databases, and (iii) updated wherever possible.
1 Conceptually, “lead and lag indicators” have originated in the development of performance scorecards for use by
business analysts. They are adapted here for use within the education sector.

Introduction
Page 5
The EAF has helped to generate a more robust and incisive use of statistical data to inform and
support the analytical work of CSAS. The EAF software and hardware will be transferred to MoNE
in 2009. As part of the transfer, CSAS will provide MoNE with (i) a comprehensive technical and
users’ Manual that will include a description of the system, database design, code book (data
dictionary), (ii) a ‘how to’ guide on the use of the software, and (iii) provide training sessions for
GOI officials in the use of the facility and help develop plans to ensure the data can be maintained
and updated.
Data Sources and Collections: Financial Data
National level financial data -This report has been able to update some of the historical data
used in previous reports. Data for the period 2001-2005 remains unchanged but there have been
revisions for the period 2006-2008. The government compiled comprehensive multi-year data on
national and sub-national expenditures towards education in its submission to the Supreme Court
case on its legal obligation to allocate at least 20% of the national budget towards education
(Supreme Court Decision Number 13/PUU-VI/2008). This data has replaced the previous
estimates generated by the World Bank 2006 and 2007 and CSAS for 2008.
Detailed data for 2009 has been collected from Law 41 2008 on Budget Revenue and State
Expenditures (Undang-Undang Republik Indonesia Nomor 41 Tahun 2008 Tentang Anggaran
Pendapatan Dan Belanja Negara Tahun Anggaran 2009).
District level financial data has been collected from the Ministry of Finance (MoF) Regional
Financial Information System (SIKD). The SIKD collects in hard copy format the budget and actual
expenditures of all districts and provinces. CSAS arranged with the Officers of the SIKD section to
be given access to the available SIKD records. A painstaking process of manually sorting through
the paper financial records of all districts and provinces was undertaken. Near complete financial
records for all districts and provinces were obtained for 2007 and for approximately 78% of all
districts in 2006. Data collection for 2008 and 2009 has been direct from the electronic records
within the SIKD section of the MoF.
Data Sources and Collections: Non-Financial Data
Education: The student, teacher and school facilities data is derived from the statistical collection
of the Education Census conducted by MORA and MONE. This education data has been collected
and stored in the BEP Education Sector Database. This database has been built from available
government statistical collections and represents authoritative government sanctioned data. The
database includes population data collected from the Bureau of Central Statistics (BPS).
Poverty: Poverty is an important analytical filter for the Financial Performance Report. Financial
data analysis includes an examination of poverty by segregating districts into poverty quintiles.
This analysis is consistent with the analysis applied in the CSAS Annual Sector Monitoring Report.
The Poverty quintiles are based on the “P0” poverty scale developed by Survei Sosial Ekonomi
Nasional (SUSENAS). This scale captures the incidence of poverty (the proportion of people living
below the poverty line).
Incorporate Into Existing Reporting Systems
The Financial Performance Report indicators and analysis will be available to be used and
incorporated within existing mandatory reports of MONE and MORA.

Introduction
Page 6
The data underpinning most of the indicators at the district level is sourced from GoI statistical
collections. This should mean the indicators will be able to be reported within other regular
reports. At the district level, these indicators will be useful and could be incorporated within their
reporting systems.
D. Report Structure
Financial Performance - National Level
The Financial Performance Statement presents an analysis of the nationally available financial
performance indicators for education. These are presented according to the key RENSTRA themes
of Access, Quality and Governance/Accountability.
Financial Performance – District Level
Two additional Financial Performance KPIs and two SPIs have been identified for the district level
to assess district level allocations to basic education.
Special Discussion Themes
Each Financial Performance Report presents in more detail some particular themes or issues that
have been explored through specific research that has been commissioned by CSAS during the
year.
The second part of this report is an executive summary of a report on the impact of the global
financial crisis on the Indonesian education system. The study was undertaken by Balitbang with
technical support from CSAS. The report itself was requested by National Parliament which was
concerned at the potential impact of the financial crisis on Indonesian schooling. CSAS funded a
national consultant (Ibu Ninasapti Triaswati) to assist with the design of the study. The study
identified districts and localities that were most likely to be affected by the crisis and examined
local expenditure patterns as well as impact on school retention rates and attendance. CSAS has
produced a summary version of that report in English which is available for general distribution.

Financial Performance – National Level
Page 7
II. FINANCIAL PERFORMANCE – NATIONAL LEVEL
A. Overview and National Data Sources
Public funding for education in Indonesia is provided mostly by the central and provincial levels of
government with the provincial level providing a smaller share. National level analysis of
aggregate public expenditure is complicated because of these different sources of funding and
the subsidisation of salaries and services provided by the central level of government.
The national trends in the public financing of education are analysed in this section. Key
Performance Indicators (KPI) are identified for a macro level assessment of government
commitment towards education. Each KPI has been assigned a ranking that indicates (neutral,
positive, negative).
For the 2008 Financial Performance Report, the national level analysis was built from (i) the data
collected by the World Bank and presented in its publication Investing in Indonesia’s Education
(World Bank, 2007), (ii) the national budget data presented in the MoF publication DATA POKOK
APBN 2008 – 2009, and (iii) CSAS estimates of sub-national expenditures for the year 2008 based
on historical trends and the evidence of data collected from districts and provinces that have
supplied data for 2008.
This report has been able to update some of the historical data used in previous reports. Data for
the period 2001-2005 remains unchanged but there have been revisions for the period 2006-
2008. The government compiled comprehensive multi-year data on national and sub-national
expenditures towards education in its submission to the Supreme Court case on its legal
obligation to allocate at least 20% of the national budget towards education (Supreme Court
Decision Number 13/PUU-VI/2008). This data has replaced the previous estimates generated by
the World Bank 2006 and 2007 and CSAS for 2008.
Detailed data for 2009 has been collected from Law 41 2008 on Budget Revenue and State
Expenditures (Undang-Undang Republik Indonesia Nomor 41 Tahun 2008 Tentang Anggaran
Pendapatan Dan Belanja Negara Tahun Anggaran 2009)2.
2 From 2009 onwards compilation of the national indicators for education expenditure as a proportion of public
expenditure and of GDP will be more easily assembled. Each year the law approving the national budget (Tentang
Anggaran Pendapatan Dan Belanja Negara) will provide a detailed breakdown of national expenditures on education.
This breakdown will enable the government to show it is meeting its constitutional requirement of allocating at least
20% of the budget towards education.

Financial Performance – National Level
Page 8
Table 2 National Level Education Financing Data 2001-2009
Item 2001 2002 2003 2004 2005 2006 2007 2008 2009 *
National Education Exp. (Rp trillion) (1)
42.3 53.1 64.8 63.1 78.6 122.99 142.2 154 207.41
Annual Inflation Rate (2) (3) Base year
10.0% 5.1% 6.4% 17.1% 6.6% 6.6% 11.1% 0.2%
Real Education Exp. (Rp trillion 2001 prices)
42.3 47.8 55.4 50.4 52.1 76.1 82.2 79.2 106.4
Education Exp. as % of Total National Exp
12.0% 15.8% 16.0% 14.2% 13.9% 17.6% 18.9% 15.6% 20.0%
Education Exp. as % GDP
2.5% 2.8% 3.2% 2.8% 2.9% 3.7% 3.6% 3.1% 3.7%
Total National Exp (Rp trillion)
352.8 336.5 405.4 445.3 565.1 699.1 752.4 989.5 1037.1
GDP at Current Prices (4) (Rp
trillion) 1684.0 1897.8 2013.6 2273.1 2729.7 3339.2 3949.3 4954.0 5669.6
1. Financial data for 2005-2008 from (CC : Constitutional Court Decision PUU-13/2008) where Government of Indonesia provided a
detailed breakdown of expenditure allocations. Data for 2001-2004 collected by World Bank and presented in its publication
Investing in Indonesia's Education (WB, 2007).
2. Inflation data for 2001-2006 from BPS Key Indicators of Indonesia Table 5.2 Inflation Rate Year on Year 2002-2007 Statistic
http://dds.bps.go.id/eng/download_file/Booklet_indikatorkunci.pdf
3. Inflation rate for 2007-2009 from BPS Statistical Yearbook 2009 Table 12.5 Composite Inflation Rate 2006-2009
4. GDP at current prices from Bureau of Statistics 2001-2008, 2009 - CSAS estimate based on MoF initial estimates and projections
for growth in 2010
5. For 2009, education finance data is from Law No. 41 /2008: Government Budget for fiscal year 2009
B. Trends in Education Funding
Continued growth in national public expenditure for education in Indonesia. There has been a
broad upward trend in public expenditure for education. Consistent funding increases have been
attained in nominal value terms for all years except for 2004. When accounting for the eroding
impact of price inflation over time, the real increase in funding for education is more modest. The
periods 2003-2005 and 2007-2008 saw a virtual pause (or even a slight decline) in real education
expenditures. The year of 2005 was hit hard by a particularly high inflation rate of 17% that was
driven by the removal of the oil price subsidy. Expenditure continued to grow over the global
financial crisis period through 2009.
Figure 1: National Public Expenditure on Education, Rp. Trillion 2001-2009
2001 2002 2003 2004 2005 2006 2007 2008 2009
Nominal National Education Expenditures 42.3 53.1 64.8 63.1 78.6 123.0 142.2 154.0 207.4
National Education Expenditures (constant 2001 prices) 42.3 47.8 55.4 50.4 52.1 76.1 82.2 79.2 106.4
0.0
50.0
100.0
150.0
200.0
250.0
Total E
xpen
diture (Rp. T
rillion)
Financial Performance – National Level
Page 9
The public expenditure for education (not accounting for price inflation) has increased nearly
500% between 2001 and 2009. The nominal value of public expenditures for education increased
from 42 trillion in 2001 to 207 trillion by 2009.
The real value of public expenditure for education has increased 250% during the period 2001-
2009. In 2001 constant prices, national education expenditures have increased from Rp. 42
trillion to Rp. 106 trillion in 2009.
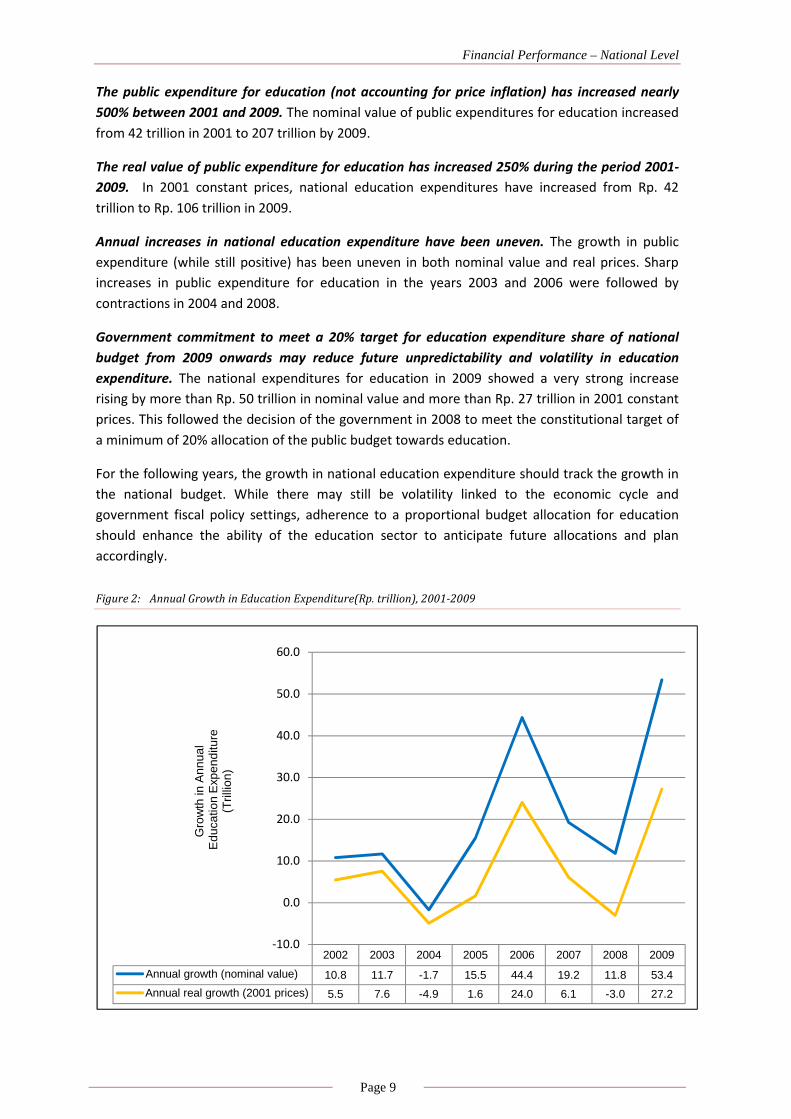
Annual increases in national education expenditure have been uneven. The growth in public
expenditure (while still positive) has been uneven in both nominal value and real prices. Sharp
increases in public expenditure for education in the years 2003 and 2006 were followed by
contractions in 2004 and 2008.
Government commitment to meet a 20% target for education expenditure share of national
budget from 2009 onwards may reduce future unpredictability and volatility in education
expenditure. The national expenditures for education in 2009 showed a very strong increase
rising by more than Rp. 50 trillion in nominal value and more than Rp. 27 trillion in 2001 constant
prices. This followed the decision of the government in 2008 to meet the constitutional target of
a minimum of 20% allocation of the public budget towards education.
For the following years, the growth in national education expenditure should track the growth in
the national budget. While there may still be volatility linked to the economic cycle and
government fiscal policy settings, adherence to a proportional budget allocation for education
should enhance the ability of the education sector to anticipate future allocations and plan
accordingly.
Figure 2: Annual Growth in Education Expenditure(Rp. trillion), 2001-2009
2002 2003 2004 2005 2006 2007 2008 2009
Annual growth (nominal value) 10.8 11.7 -1.7 15.5 44.4 19.2 11.8 53.4
Annual real growth (2001 prices) 5.5 7.6 -4.9 1.6 24.0 6.1 -3.0 27.2
-10.0
0.0
10.0
20.0
30.0
40.0
50.0
60.0
Gro
wth
in A
nnua
lE
duca
tion
Exp
endi
ture
(T
rillio
n)
Financial Performance – National Level
Page 10
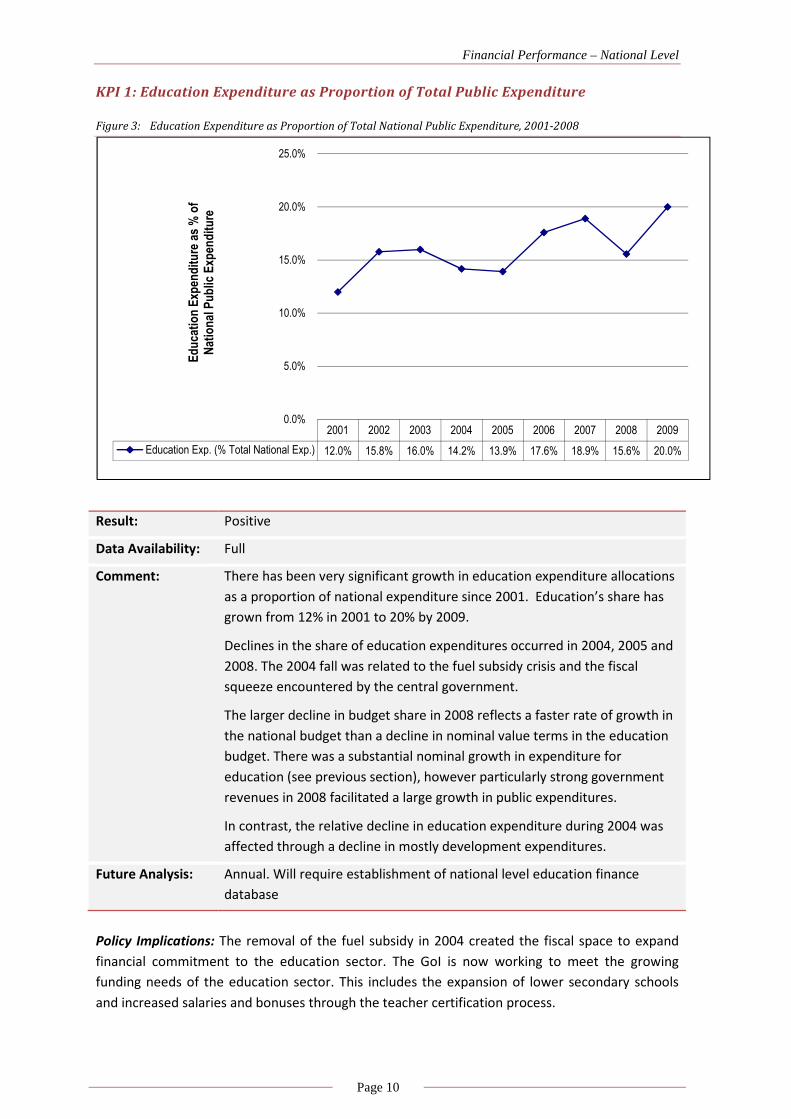
KPI 1: Education Expenditure as Proportion of Total Public Expenditure
Figure 3: Education Expenditure as Proportion of Total National Public Expenditure, 2001-2008
Result: Positive
Data Availability: Full
Comment: There has been very significant growth in education expenditure allocations
as a proportion of national expenditure since 2001. Education’s share has
grown from 12% in 2001 to 20% by 2009.
Declines in the share of education expenditures occurred in 2004, 2005 and
2008. The 2004 fall was related to the fuel subsidy crisis and the fiscal
squeeze encountered by the central government.
The larger decline in budget share in 2008 reflects a faster rate of growth in
the national budget than a decline in nominal value terms in the education
budget. There was a substantial nominal growth in expenditure for
education (see previous section), however particularly strong government
revenues in 2008 facilitated a large growth in public expenditures.
In contrast, the relative decline in education expenditure during 2004 was
affected through a decline in mostly development expenditures.
Future Analysis: Annual. Will require establishment of national level education finance
database
Policy Implications: The removal of the fuel subsidy in 2004 created the fiscal space to expand
financial commitment to the education sector. The GoI is now working to meet the growing
funding needs of the education sector. This includes the expansion of lower secondary schools
and increased salaries and bonuses through the teacher certification process.
2001 2002 2003 2004 2005 2006 2007 2008 2009
Education Exp. (% Total National Exp.) 12.0% 15.8% 16.0% 14.2% 13.9% 17.6% 18.9% 15.6% 20.0%
0.0%
5.0%
10.0%
15.0%
20.0%
25.0%
Educa
tion Exp
enditure as % of
National Public
Exp
enditure

Financial Performance – National Level
Page 11
A key policy announcement made by the GoI in 2008 concerned its funding targets for education.
The President of the Republic announced in 2008 that the government was committing itself to
increasing its share of expenditure so that the national level of education expenditure from all
levels of government would reach 20% of total public expenditures. While this has been a
constitutional requirement it is the first time any government has committed itself to actually
realizing the budget target.
Subsequent to this announcement the MoF released supplementary documentation in August
2008 to its initial planned budget papers. The supplement papers (Dokument Tambahan 2009)
showed how this 20% expenditure target was to be met. The initial target of the planned national
budget (RAPBN) was for central level education expenditures of about Rp. 77 trillion out of a total
Rp. 188 trillion. In order to meet the 20% target, central level expenditures for non-salary items
were to be supplemented by an additional Rp. 46 trillion in 2009. This would take total education
expenditure to Rp. 224 trillion and approximately 20% of total public expenditures of Rp 1,122
trillion (from all levels of government).
The final budget papers for 2009 revised downwards the total allocation for education to Rp 207
trillion in line with the forecasted slowdown in economic growth and government revenues. This
would still allow the government to meet the 20% target for education. This demonstrates that
even with such a tight funding policy commitment there can be considerable volatility in the
public allocations for the education sector.
The previous Annual Financial Performance Report questioned whether it would be possible for
the government to meet its 20% target if the global financial crisis morphed into a serious
economic crisis in 2009. This would have affected government revenues and also generated
stronger demand for other alternative expenditures (largely through household transfer
payments) that could provide a social safety net for households and communities.
The actual impact of the global financial crisis on the Indonesian economy in 2009 was milder
than expected - although impacts were felt more acutely in some areas directly linked to certain
export industries. The relatively light impact of the crisis meant there was a relatively mild impact
on government revenues alongside reduced welfare allocations to stabilize the most vulnerable
sections of society.
Recommendation: The government commitment to a 20% policy target for public allocations to
the education sector provides a strict resourcing benchmark that can be monitored on annual
basis. The enhanced detail of the financial data provided by the government in its annual budget
law can be further analysed to see how the 20% target is met from national and sub-national
levels of government.

Financial Performance – National Level
Page 12
KPI 2: Education Expenditure as Proportion of GDP
Figure 4: Education Expenditure as Proportion of GDP, 2001-2009
Policy Implications: Expressed as a percentage of GDP, future
growth in public allocations will become contingent on an
increase the public expenditures as a proportion of GDP.
Education expenditure as a percentage of GDP may decline if (i)
tight fiscal settings reduce public expenditures as a proportion
of GDP, and (ii) the government does not exceed the 20%
target for education as a proportion of total public
expenditure.
2001 2002 2003 2004 2005 2006 2007 2008 2009
National Education Exp. (% GDP)
2.5% 2.8% 3.2% 2.8% 2.9% 3.7% 3.6% 3.1% 3.7%
0.0%0.5%1.0%1.5%2.0%2.5%3.0%3.5%4.0%4.5%5.0%
Education Exp
enditure as
Percentage of GDP (%)
Result: Positive
Data Availability: Partial – CSAS estimates for 2009 GDP
Comment: This indicator captures the national public commitment towards education
in relation to the economic wealth being generated. By mapping education
expenditure with GDP it avoids comparison problems with other countries
(see table for UNESCO comparisons) which may have different sized public
sectors. The indicator is also useful for comparing expenditure trends in a
country which has altered the size of its public sector across time. Generally,
this indicator is used in tandem with education share of public expenditure.
In Indonesia, there has been significant growth in education expenditure as
a proportion of GDP. Education as a percentage of GDP rose from 2.5% in
2001 to 3.7% by 2009. In 2007 when the latest comparison figures are
available, Indonesian education expenditure as a share of GDP (3.6%) was
equal to the East Asia regional average.
This reflects growth in public revenues and the concomitant growth in
public expenditures. This effect is compounded by an increasing share of
public expenditures set aside for education which leads to the very strong
growth in education expenditure as a proportion of GDP between 2005 and
2009.
Future Analysis: Annual.
Indonesia 3.6
Malaysia 4.7
Singapore 3
Thailand 4
World75 4.9
Developing countries 4.5
EAP - East Asia 3.6

Financial Performance – National Level
Page 13
Source: Year 2004 - World Bank, Investing in Indonesia’s Education. Year 2007 – Ministry of Finance SIKD data
84% 78%
12%15%
4% 7%
0%
10%
20%
30%
40%
50%
60%
70%
80%
90%
100%
2004 2007
Operational
Capital
Salaries
KPI 3: Education Non-salary Expenditure as Share of Total Expenditure
Figure 5: Aggregate District Expenditure, Years 2004 and 2007
Result: Positive
Data Availability: Limited to 2004 and 2007 and only covering district level expenditures.
Breakdown of data is difficult because of their composition from three tiers
of government. The 2004 figures are derived from WB calculations of the
salary composition of routine expenditures.
Comment: School systems require a substantial share of non-salary related
expenditures to (i) provide a full range of resources (apart from teachers) to
schools, and (ii) maintain buildings and provide for additional capital and
equipment needs.
The available data show a significant improvement in nationwide district
allocations towards non-salary items (operational and capital). As a
proportion of total education expenditure at the district level (recurrent
plus capital) non-salary items increased from 16% in 2004 to 22% in 2007.
Salary shares of total education expenditure reduced from 84% in 2004 to
78% in 2007. However, salary shares may be higher than these figures
where a portion of operational expenditures may include salaries.
This is a positive trend towards a better balance in the resourcing of schools
by improved financing for the improvement of facilities and providing other
non-teaching resources to schools and districts.
Future Analysis: To be updated annually.
Policy Implications: There has been a significant improvement in the share of resources being
allocated for non-salary expenses within the education budget. Unfortunately there is little room
for complacency in this respect. From 2008 onwards there will be a rapid increase in salary
expenditures due to the fiscal impact of remuneration for teachers attaining teacher certification.
Certified teachers will garner at least 100% pay increases once they are certified. The cumulative
impact of these increases will act to severely cramp future increases in non-salary expenditures. It

Financial Performance – National Level
Page 14
Source: World Bank, Investing in Indonesia’s Education, 2007
will be increasingly important for districts and schools to ensure that non-salary expenditures are
effective and efficiently distributed.
KPI 4: Expenditure on Basic Education as % of All Education Expenditure &
KPI 5: Expenditure on Non Formal Education as % of All Education Expenditure
Figure 6: Education Expenditure by Sub-Sector, 2004
Result: Positive for Basic Education, Negative for Non Formal Education
Data Availability: National analysis limited to 2004. Breakdown of data is difficult because of
its composition from 3 tiers of government. Analysis of central level
expenditures for basic education is provided to give some idea of resourcing
trends since 2004.
Comment: Basic education accounts for approximately 70% of total funding, with
nearly 50% for pre-school and primary. Senior secondary will begin to make
a stronger resource claim in future as universalisation policy expands
access. Districts are carrying the bulk of expenditure for basic education and
therefore remain a key site for interventions. The central share is likely to
have increased since 2004 with the introduction of BOS grants that are paid
directly to schools.
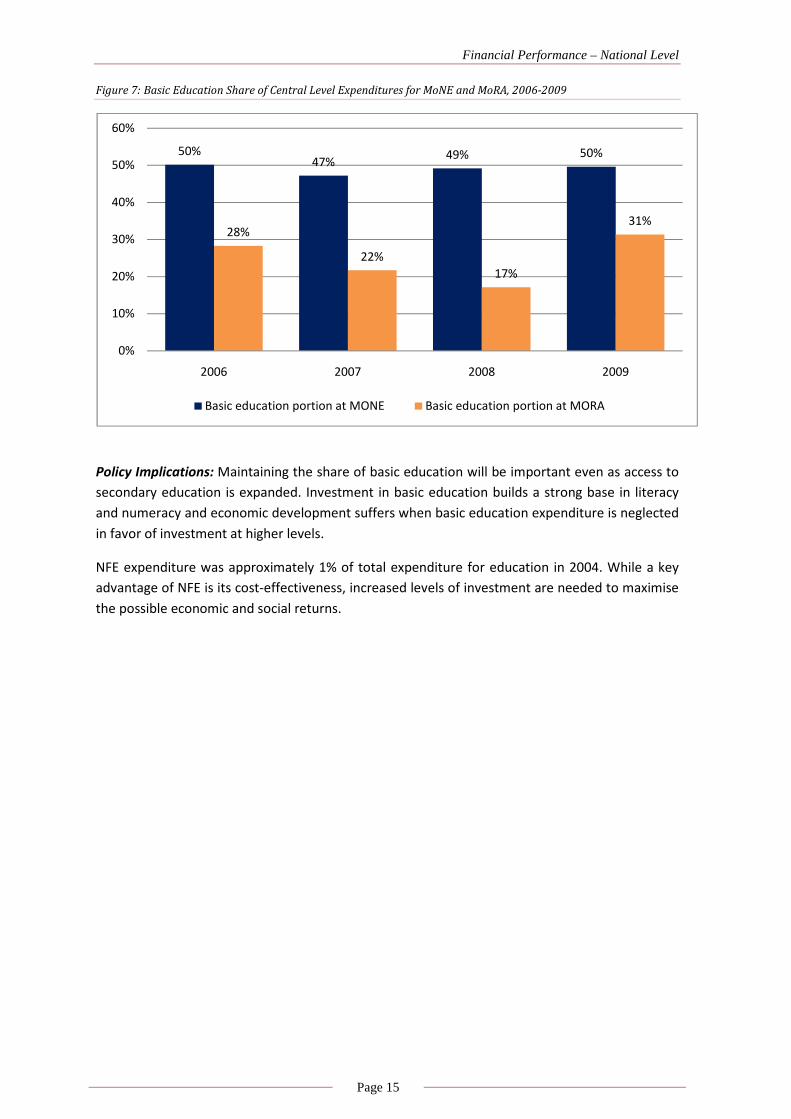
Analysis of central level expenditures for the period 2006-2009 shows
commitment to Basic Education is holding firm within MoNE at around 50%.
Within MoRA there was greater fluctuation with basic education dropping
to as low as 17% of education expenditure in 2008 before climbing again in
2009 to 31%. It is unclear what has been driving the fluctuations in basic
education share of MoRA expenditures.
Future Analysis: Uncertain. Current data collected at SIKD does not disaggregate between
levels of education expenditure at the district level. Liaison with MONE,
MORA, Bappenas and World Bank staff to see if periodic update is possible.
Financial Performance – National Level
Page 15
Figure 7: Basic Education Share of Central Level Expenditures for MoNE and MoRA, 2006-2009
Policy Implications: Maintaining the share of basic education will be important even as access to
secondary education is expanded. Investment in basic education builds a strong base in literacy
and numeracy and economic development suffers when basic education expenditure is neglected
in favor of investment at higher levels.
NFE expenditure was approximately 1% of total expenditure for education in 2004. While a key
advantage of NFE is its cost-effectiveness, increased levels of investment are needed to maximise
the possible economic and social returns.
50%47%
49% 50%
28%
22%
17%
31%
0%
10%
20%
30%
40%
50%
60%
2006 2007 2008 2009
Basic education portion at MONE Basic education portion at MORA

Trends in District Education Funding
Page 16
III. TRENDS IN DISTRICT EDUCATION FUNDING
Background
This section provides - comparisons of district level education expenditures for 2006-2009. The
year 2006 is a useful benchmark to identify the nature and extent of education spending at the
district level before the commencement of the BEP expenditures.
The district level analysis has been structured to enable comparisons in district expenditures
between (i) rural and urban districts, (ii) BEP and non-BEP districts, (ii) districts sorted into poverty
quintile rankings, (iv) provinces, and (v) island groups.
District level expenditure patterns are increasingly important as districts have increased
responsibility for education management under decentralisation. Monitoring patterns of
expenditure by districts will become an increasingly important role for MONE and MORA to
ensure that national funding norms and procedures are being implemented appropriately.
The wide range of districts’ poverty status and the importance of education in lifting district
populations out of poverty also mean that vulnerable groups stand to benefit most from well
targeted education investment. Monitoring and evaluation of district level education financing
provides the tools to do so.
Data availability
The Financial Performance Report 2009 presents the most complete data set for analysis since
this series commenced in 2006. The district level financial data presented here has been collected
by CSAS directly from the SIKD section of MoF. The SIKD collects in hard copy format the budget
and actual expenditures of all districts and provinces. CSAS arranged with the Officers of the SIKD
section to be given access to the available SIKD records. From 2008 financial onwards data have
been collected electronically from the MoF.
There has been a substantial addition of data for 2008 in particular, but also for 2007. A detailed
table in Annex 1 shows the status of data collected from all districts during the period 2006-09.
There have also been some changes in the poverty status of districts and these have been
updated for the 2008 and 2009 years. The additional data, along with data corrections and the
shift in poverty quintile status of some districts have caused minor changes in a few of the
indicators from previous reports .

Trends in District Education Funding
Page 17
KPI 6: District Financial Commitment to Education
Figure 8: Education Expenditure as % of Total District Budget (APBD 2006-2009)
Result: Positive
Data Quality and
Availability:
Financial data is for approximately 80% of all districts for 2006, and more
than 90% for subsequent years.
General
Comment:
Average district level education expenditures across Indonesia have
increased from 27% of the total district budget (APBD) in 2006 to a 32%
share in 2009.
The increased share of education expenditures at the district level
demonstrates that districts on average generally maintained their education
spending during the period 2006-2008. In 2009 there was a substantial
increase in the share of education spending from 29% in 2008 to 32% in
2009.
The growth in share of allocations towards education is consistent for urban
and rural areas.
While these averages show maintenance of financial commitment to
education, it does disguise some variation between districts. Comparison of
the fluctuations of individual districts may not be useful as their expenditure
may be significantly affected by one-off large annual investments.
A recent World Bank study found education share of district expenditure
declining from 38% in 2001 down to 34% by 2004. The 2006 data from this
study show a further decline down to 27%. But data from 2007, 2008 and

Trends in District Education Funding
Page 18
2009 show a consistent trend towards increases in the share of district
budgets being allocated towards education. This suggests the slide in
education expenditure has been effectively reversed.
BEP Districts: In 2006, BEP districts on average allocated 26% of their APBD for education
in 2006 compared to 27% share of other districts. By 2007 BEP districts had
kept their education expenditure to 26% which was below the average of
non-BEP districts (28%) but close to the average expenditure of districts
nationally.
While BEP districts increase their share of expenditure to 29% by 2009, the
non-BEP districts had also increased their share to 32%.
The updated data show both BEP and non-BEP districts’ growing their
education share of district budgets during the period 2006-2009.
Future Analysis: Annual update of 2009 data once available from MoF
Analysis of the education expenditure patterns of districts by their poverty quintile status shows
that the poorest districts have consistently committed the lowest proportion of their budget
towards education during the period 2006-2009. The poorest districts committed on average 28%
of their budget in 2009 compared to all other district quintiles which spent on average more than
30%. In comparison, the middle ranking districts (poverty quintiles 3 & 4) both spent more than
35% of their budget in 2009.
A positive indicator is that districts in all poverty quintiles have been increasing their average
allocation share for education between 2006 and 2009.
Figure 9: Education Expenditure as % of Total District Expenditure by Districts according to Poverty Quintile,
(APBD 2006-2009)

Trends in District Education Funding
Page 19
The lower average share of budget allocation for education could be due to a greater proportion
of students being enrolled in private schools in the eastern region of the country. Because private
schools do not have salaries paid by the district level of government (via a transfer of payments
from the central budget) this distorts the district per capita expenditure.
There is substantial variation between island groups in the average share of the district budget
allocated towards education. During the period 2006-2009 Java districts spent the highest
proportion of all island groups reaching 40% by 2009.
The lowest average share of budget allocation for education was found in Papua and Maluku
island groups. Both of these islands recorded less than 20% average share for education with little
increase during the period 2006-2009.
Figure 10: Education Expenditure as % of Total District Expenditure by Island Grouping (APBD 2006-2009)
BEP districts increased their share of expenditure for education to 29% in 2009 from 26% in 2006.
While this growth is positive and suggests sustained and slightly increasing commitment towards
education, it is below the growth in non-BEP districts which grew their education share from 27%
to 32%.

Trends in District Education Funding
Page 20
Figure 11: APBD Education Expenditure as % of Total district Expenditure in BEP and Non-BEP Supported Districts
(APBD 2006-2009)
A more detailed analysis of expenditure patterns in BEP districts by their poverty quintile ranking
reveals a positive story of sustained improvement in the poorest quintile districts. The poorest
BEP districts have increased their education share of expenditures from 22% in 2006 to 29% by
2009. The range of expenditure shares in BEP districts is now compressed to between 28%-31%.
Figure 12: BEP Districts Only - Education Expenditure as % of Total District Expenditure by District Poverty
Quintile (APBD 2006-2009)
While BEP districts have committed a share of their district budget that is broadly in line with the
national average, there are some BEP districts that have spent considerably less. Most of the
districts that report spending less than 15% of their budget on education are located on Maluku.

Trends in District Education Funding
Page 21
While some of the low figures may be due to poor reporting, the persistence of these low
allocations shares over a number of years suggest there are other factors involved.
In 2009 the national average per student expenditure was Rp. 2.1 million. The table below shows
that while Manggarai Timur district of Bali has a low education budget share (5%) it already has a
very high per student expenditure figure more than Rp. 10 million per year.
Other districts (particularly in Maluku) have lower than average per student expenditure figures
and their low education share should be verified and better understood.
Figure 13: BEP Districts with low financial share for education (less than 15% of APBD Expenditure) and education
expenditure per student (Rp. million) 2009
As well as BEP districts, there are 13 districts which (i) spent less than 15% of their 2009 budget
on education according to their submitted financial records to the MoF, and (ii) spent less than
the national average Rp. 2.1 million per student. It would be useful to understand why education
budget share is so low in these districts and to what extent they represent policy related or
demand side factors as well as possible misreporting to the MoF.

Trends in District Education Funding
Page 22
Figure 14: All Districts with very low financial share for education (less than 10% of APBD Expenditure)
Policy Implications:
Districts that have high poverty rates and are persistently allocating a significantly smaller share
of resources for education than the national average are at great disadvantage to the rest of the
country. This disadvantage is likely to be compounded each year as other, wealthier districts
spend higher amounts on education.
Recommendation:
MoNE should consider undertaking a detailed study focused on the poorest districts (poverty
quintile 5 districts) to examine why some of these districts with high poverty rates are allocating
significantly smaller share of resources for education than the national average.

Trends in District Education Funding
Page 23
KPI 7: Annual Growth in Education Spending for the Poorest Districts
Figure 15: Annual Growth in APBD Education Expenditure, 2007 -2009, by Poverty Quintile
Result: Uneven
Data Quality and
Availability:
As per KPI 6
General
Comment:
Poorest districts (bottom quintile) recorded a 15% growth in their 2009
education budget. This follows 19% and 13% annual growth between 2006-
07 and 2007-08 budgets. This is a positive result for the poorest districts and
is especially impressive give the relatively difficult and uncertain economic
environment of 2009 as a result of the global financial crisis.
The continued strong growth of education budgets within the poorest
districts is tempered by an even stronger all districts growth rate of 18% in
2009.
The sharper growth rate of the better off districts indicates the poorest will
have a harder job of catching with the progress of the more economically
developed districts.
Analysis of urban and rural districts shows average growth rates to be
converging in 2009 at 19% and 18% respectively. In previous years the
growth rate of the education budget in urban areas was more than 20% and
significantly higher than the average for rural districts.
BEP Districts: BEP districts showed strong positive commitment to education with 16%

Trends in District Education Funding
Page 24
annual growth in education funds in 2007-08 and 20% in 2008-09.
Non-BEP districts also displayed solid growth in their education
expenditures and they increased by 16% and 18% respectively for the years
2007-08 and 2008-09.
Future Analysis: Trend series can be updated beyond 2009-10.
The average growth rate of urban district education budgets declined in 2009 to 19% from
previous rates of 24% and 23% in 2007 and 2008. This may reflect some impact of the global
financial crisis. However the growth rate of rural districts lifted to 18% in 2009 from a previous
annual 14% growth rate in 2008 on previous education budgets.
Figure 16: Annual Growth in District Education Expenditure, (APBD 2007-2009)
Figure 17: BEP and Non-BEP Supported Districts, Annual Growth in APBD Education Expenditure, 2007 -2009
Detailed poverty quintile analysis of BEP districts shows that some of the strongest annual growth
rates in education expenditures were within the poorest districts which expanded their budgets

Trends in District Education Funding
Page 25
by 23% in 2009. This was considerably higher than the 18% national average growth rate. The
lowest 2009 growth rate within BEP districts (13%) was within the wealthiest quintile.
Figure 18: BEP Districts Only - Annual Growth in District Education Expenditure, (APBD 2007-2010)
Policy Implications: Growth in year to year education expenditure is strong across the country
and this is a positive result. Concern rests with the slower growth rate in the poorest quintile
districts as this means it will be more difficult for them to address the existing shortfall in
providing access as well as education standards and learning outcomes of students.

Trends in District Education Funding
Page 26
KPI 8: Average District Expenditure per Student
Figure 19: Average District Education Expenditure per all Students, (Rp millions.)
Result: Positive
Data Quality and
Availability:
As per KPI 6
General
Comment:
Average expenditure per student across the country grew strongly over the
four years.
Average per student expenditure has been consistently highest in rural
districts and reached Rp. 2.14 million per student in 2009. This compares
with Rp. 1.94 million per student in the urban areas.
Highest averages per student allocations are found in the poorest districts
(quintile 5) and quintile 2 where in 2009 they both average Rp. 2.2 million
per student. This compares with an average district allocation of Rp. 2.0
million in the richest districts.
The per student allocation is greatly affected by the sparsity of population.
More sparsely populated districts (such as those in the eastern region and
many of those in the poorest quintile districts) have higher average salary
costs. This is because of both lower student/teacher ratios and higher salary
related costs associated with remote area allowances.
BEP Districts: BEP districts have a higher than national average per student allocation
across all four years. The higher expenditure of BEP districts is related to the
fact that 90% of BEP districts are located in the Eastern region of the
country. Unit costs are higher in the eastern region due to sparsity factors.
Future Analysis: Annual update

Trends in District Education Funding
Page 27
A more nuanced analysis of per student education expenditure looks at district expenditures per
public MoNE school students. This provides a more accurate measure because districts are only
responsible for teacher salaries and other operational expenses of MoNE public schools. By
excluding private school students from per student calculations it is possible to remove the bias
of different rates of enrolment in private schools across districts.
The national average education expenditure per public students is Rp. 3 million per student with
urban districts (Rp. 3.2 million) overtaking rural districts (Rp. 2.9 million). Because there are
proportionately greater numbers of private school students in urban areas, this indicator reverses
the trend of the broader indicator expenditure per all students and shows urban areas to be
spending more than rural districts.
Figure 20: Comparison - Expenditure per All Students vs. Expenditure per Public Students, (Rp. millions)
BEP districts reflect a similar trend to other districts with steady increases in per student
expenditure across all years. BEP districts spent Rp. 2.5 million per all students compared to the
other districts average of Rp 2.0 million in 2009. Non-BEP districts are spending less per student,
but have a faster rate of spending growth.

Trends in District Education Funding
Page 28
Figure 21: Average APBD Education Expenditure per Student (Rp), BEP and Non-BEP Districts
Poverty quintile analysis of average expenditures per student shows a narrowing of the gap in
expenditures during the period 2006-2009. The poorest districts are very close to spending the
greatest amount per student and the richest districts spend the least per student. The poorest
districts are spending 7% more per student than the richest.
Figure 22: Average APBD Education Expenditure per Student (Rp), by Poverty Quintile Districts

Trends in District Education Funding
Page 29
Average expenditures per public student show the two richest quintile districts to be spending
more than Rp. 3 million. The poorest quintile districts spend just on 3 Rp million per public
student. The relatively high per public student expenditure in the poorest districts is a positive
indicator.
At the same districts in the far eastern regions of the country should have significantly higher
costs per student than districts in the western region because of the lower density of populations.
This has an impact on the unit cost of salaries (through the cost of allowances related to isolation)
and the lower student/teacher ratio that drives up the per student unit cost of teacher salaries.
Average expenditure per students across islands shows Papua (Rp. 4.7 million) and Kalimantan
(Rp. 3.7 million) to be the highest spending islands. Lowest expenditure by a considerable margin
is found on Java with Rp. 1.7 million per student.
Education expenditure per public student shows Papua reaching Rp. 7.1 million in 2009 compared
to the next highest Kalimantan (Rp. 4.7 million) and Java as the lowest island expenditure per
public student (Rp. 2.5 million).
Figure 23: Average APBD Education Expenditure per Student (Rp), by Island
Policy Implications:
Unit cost calculations are greatly affected by the sparsity of populations and care needs to be
taken when comparing districts. Care should be taken to compare like with like districts in order
to get a true feel for the district government commitment and possible impact on quality.
A Critical Education Funding Status (CEFS) diagnostic tool has been developed based on three Key
Performance Indicators from this District level analysis (KPI’s 6, 7, and 8). The CEFS diagnostic tool
identifies critical districts that have:

Trends in District Education Funding
Page 30
• low expenditure per student (less than Rp. 2.1 million)
• small education share of the district budget (less than 15%)
• weak annual growth in their education budget (less than 20%).
The table below highlights eleven districts meeting these criteria, with six of these critical districts
being part of the Maluku island grouping. The case of Kota Banda Aceh probably reflects
increased responsibilities being assumed by the provincial level of government.
Figure 24: Critical Education Funding Status (CEFS) Districts – Districts with low growth in education budget, low
share of district budget and low expenditure per student (APBD2009)
Reasonable distribution of public education funds should generally provide greater funding per
student to the poorest areas. This weighted distribution of government funds can enable the
poorest communities to overcome a financial inability to pay for services. It also helps to cover
the higher cost of servicing poor communities that are also in remote or difficult to reach areas.
The relatively flat distribution of district education funding per student across poverty quintiles is
good in so far that it does not show greater per student amounts being allocated in the richest
districts. This achievement should not be taken for granted. It reflects government policies that
have been successful in preventing a larger share of resources being sequestered by richer
districts.
The limitation of the ‘flat line achievement’ is that such a distribution across poverty groupings is
not sufficient to promote more equitable services and learning attainment across the country. To
achieve these types of outcomes, government will need to put an ‘equity slope’ in its funding
distribution. This means per student funding increasing significantly across poverty groupings
from the richest to the poorest.
One factor that can assist the government to achieve this sort of equity slope in funding is that
the poorest quintile of districts have a relatively small number of students (6.8 million) compared
to all of the other four quintiles. Focusing additional public expenditures on the poorest quintile
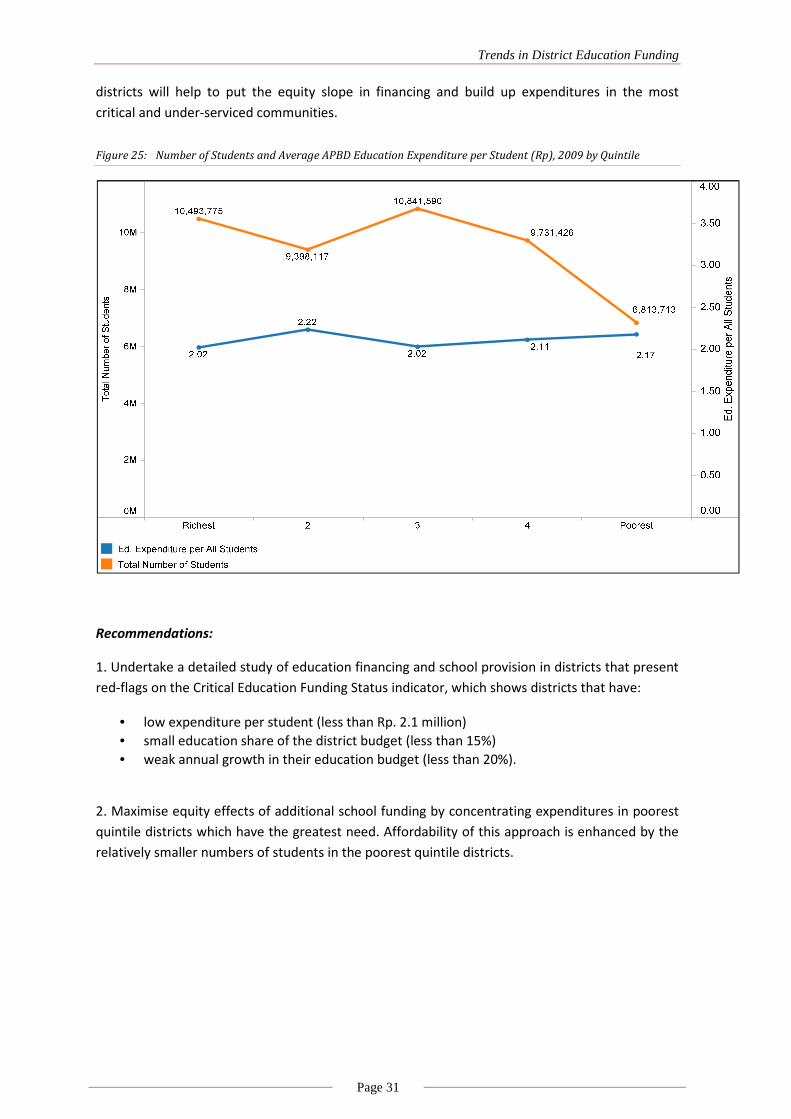
Trends in District Education Funding
Page 31
districts will help to put the equity slope in financing and build up expenditures in the most
critical and under-serviced communities.
Figure 25: Number of Students and Average APBD Education Expenditure per Student (Rp), 2009 by Quintile
Recommendations:
1. Undertake a detailed study of education financing and school provision in districts that present
red-flags on the Critical Education Funding Status indicator, which shows districts that have:
• low expenditure per student (less than Rp. 2.1 million)
• small education share of the district budget (less than 15%)
• weak annual growth in their education budget (less than 20%).
2. Maximise equity effects of additional school funding by concentrating expenditures in poorest
quintile districts which have the greatest need. Affordability of this approach is enhanced by the
relatively smaller numbers of students in the poorest quintile districts.

Trends in District Education Funding
Page 32
KPI 9: Actual district education expenditure as % of planned education expenditure
Figure 26: Realised Education Expenditure as % of Planned Expenditure 2006 and 2007
Result: Positive
Data Quality and
Availability:
Budget data for 2006 is from the ‘final revised budget’ documents and
reflect the final allocation. Revised budget data for 2007 was not available.
Data collected is from the ‘planned budget’ documents which reflect a bid
by the district education office for funds. This budget may then be revised
downwards in the ‘revised final budget’. The 2007 financial data is therefore
not from identical planning documents and may be responsible for an
upwards shift in percentage of budget realized as actual expenditure.
General
Comment:
Districts in 2007 managed to spend nearly 100% of their planned budget.
This was a significant improvement on 2006 where only 91% of funds were
spent nationally.
BEP Districts: The average BEP district increased its actual expenditure to 100% of
budgeted allocations in 2007. This was up from a 92% expenditure in 2006.
Non-BEP districts also increased their actual expenditure to nearly 100% of
budgeted allocations in 2007.
Future Analysis: Update 2008 data once collected.
Trend series to continue with realized budget data for 2007 to be collected

Trends in District Education Funding
Page 33
Figure 27: Realised Education Expenditure as % of Planned Expenditure 2006-07, BEP and Non-BEP districts
Poverty quintile analysis shows that the top two poverty quintile districts on average overspent
their planned education budget in 2007. The lowest average rate of realisation was with the
poorest quintile districts that only spent 91% of their planned budget.
Figure 28: Realised Education Expenditure as % of Planned Expenditure 2006 and 2007, by Poverty Quintile

Trends in District Education Funding
Page 34
Figure 29: Poorest Quintile Districts that realised less than 90% of Education Budget 2007
Policy Implications: Too many districts may be failing to expend their allocated annual education
budgets. The difficulty of the poorest districts in expending their budgets is of a particular
concern given the access and quality problems in these districts. The quantum of funds may not
be the greatest problem facing some districts, and/or there may be other problems related to
disbursement restrictions and reporting or planning requirements.
Recommendation: A study and policy dialogue with Dinas education offices is required to
determine reasons for the under-expenditure of annual education budgets focused on the
poorest districts. The study should propose options for improving the uptake of funds that can
promote their efficient and effective use for education purposes at the district level.

Trends in District Education Funding
Page 35
SPI 1: Growth Ratio of Education Spending
Figure 30: Annual Education Expenditure Growth Ratio, (2006-2007, 2007-08, 2008-09)
Meaning of
the Indicator:
This indicator expresses the annual growth in education expenditure as a ratio to the
annual growth of the district budget. The higher the ratio, the greater financial
commitment shown by the district in distributing funds to education.
A score greater than 1 means the education budget is growing at a faster rate than the
district budget as whole. A score less than one means it is growing at a slower rate than
the total district budget.
Result: Positive
Data Quality: As per KPI 6
General
Comment:
On average, education expenditure at the district level grew at double the rate of
aggregate spending in both rural and urban districts across Indonesia in 2009.
This was much faster than already strong education growth ratios for 2007-08 which
were 1.4 and 1.3 respectively for rural and urban districts.
The results for 2008-09 are particularly important as the global financial crisis came at a
point in the budget and planning cycle that could have upset expenditure patterns.
BEP Districts: The 2008-09 education expenditure growth ratio in BEP districts means the growth rate
of the education budget was 3.7 times faster than aggregate district public expenditures.
This compared with a weaker 2.4 growth ratio in the non-BEP districts.
This is a positive result and demonstrates that BEP districts continue to grow education
expenditure at a faster rate than general public expenditure.

Trends in District Education Funding
Page 36
Figure 31: Education Expenditure Growth Ratio, BEP & Non-BEP Supported Districts (2006-07, 2007-08)
Analysis by poverty quintile continues with an inverting trend where the poorest districts that had
the lowest growth ratio in 2007 (less than 1) by 2008-09 had the largest education growth rate
(4.6). This means they were growing their education expenditures during 2008-09 at a much
faster rate than aggregate spending – about 4.6 times faster. The richest districts had an almost
static education growth ration of 1.6 during the four year period.
For 2007-08, districts in poverty quintiles 2 and 4 record growth rates that are less than the
average growth rate of total district public expenditure for that year. In the poorest quintile,
growth in education expenditure was very low at 0.5 times of general public expenditure growth
in 2006-07. By 2008-09 the annual growth rate of the education budget in the poorest districts
was 4.5 times that of total public expenditure.
Figure 32: Education Expenditure Growth Ratio by Poverty Quintile, (2006-07, 2007-08), Poverty Quintiles
Policy Implications: The growth ratio indicator can be a powerful lead indicator of emerging
trends in financing of education. It is most useful at a highly aggregated level such national level
analysis or urban and rural analysis. It is less successful at an individual district or even poverty
quintiles, provinces and island groupings because it becomes highly sensitive when there is very

Trends in District Education Funding
Page 37
small growth in either the numerator (% growth in education spending) or the numerator (%
growth in aggregate spending).
SPI 2: Discretionary School Expenditure as Percentage of Total Education
Expenditure
Figure 33: BOS Grants as % of Education & Culture Budget 2006-2008
Meaning of the
Indicator:
Discretionary expenditure is a key variable at the school level to enable
schools to provide materials for classrooms and other activities.
Result: Positive
Data Quality: BOS grants are used as a proxy variable for discretionary expenditure. The
BOS funds are distributed directly to schools from the central government
via MoNE. Schools will also collect other funds from parents and/or the
district level of government. These other amounts are not reported on at a
national level. The BOS grants indicate the average minimum discretionary
funds available to schools.
This report (and the previous 2008 report) calculates BOS grants distributed
by the districts to public schools. They do not include BOS grants distributed
by MoRA to madrasah in the district. The2007 report calculated the value of
BOS grants distributed by the central government through MoRA and the
district to all schools/madrasah.

Trends in District Education Funding
Page 38
General
Comment:
The BOS grants distributed by districts provide a key source of discretionary
funds available to schools under their own management. They have injected
a dramatic new dimension to school resourcing. Direct payment to schools
minimizes the opportunities for leakage before the funds reach the school.
BOS grants offer great potential for funding innovative and securely
resourced interventions at schools that have an ongoing recurrent funding
base. This allows school principals to plan around these allocations instead
of pursuing submission based grant models.
In 2009 BOS contributed funds directly to public schools equivalent to
approximately 13% of total district level education expenditure for public
schools.
The significance of BOS expenditures as a proportion of total district level
expenditure has grown since 2008 which reverses a previous trend for
declining significance. The increasing importance of BOS reflects the big
annual jump in the value of the BOS grant in 2009. BOS grants for primary
level students rose from Rp. 276,000 per student in 2008 to Rp. 400,000 per
student. For junior secondary students, the BOS grant rose from Rp.354,500
per student in 2008 to Rp. 570,000 per student.
BEP Districts: BOS grants in BEP districts have increased from 10% of the education
budget in 2008 to 12% in 2009. This compares with non-BEP districts where
BOS grants amounted to 14% in 2009.
Future Analysis: Update with 2010 data
Figure 34: BEP and Non-BEP Districts - BOS Grants as % of Education & Culture Budget 2006-2008,
BOS grants as a percentage of total education expenditure are affected by the share of students
progressing to secondary education. The per capita BOS grants for junior secondary students are

Trends in District Education Funding
Page 39
35% higher in value than grants for primary students. Districts with higher proportionate
enrolment at secondary level have an increased proportionate weight in their BOS grants. As a
consequence, inter-poverty quintile comparisons are not accurate as they are distorted by
secondary level transition rates.
The significance of the BOS expenditures in comparison with total district expenditures declined
for districts across all poverty quintiles between 2007 and 2008. This reflected the expanding
outlays for education being made by the district levels of government during this period. However
by 2009 and with the impact of the increase in the size of the per capita grants, the BOS had again
risen in significance to 2006 levels.
Figure 35: BOS Grants as % of Education & Culture Budget 2006, by Poverty Quintile
Policy Implications: BOS grants provide a critical injection of funds at the school level. It is
important that these funds are utilised as effectively as possible. Their importance is even greater
in BEP districts where they stand as a greater than average proportion of total funds available to
education. Planning and management of BOS funds should be a key planning priority for schools
in BEP districts. Capacity building activities for principals and socialisation amongst parents are
two obvious intervention points.
Recommendation: The future AusAID funded program from 2010 onwards may have a deeper
engagement with building school and district level capacity in education management. A key
focus of this work could be to help school principals better plan and manage their BOS funds and
to help districts better monitor and support the schools in their disbursement activities.

Page 40
SPECIAL DISCUSSION THEME - THE GLOBAL FINANCIAL CRISIS AND INDONESIAN
SCHOOLING 3
Background
At the outset of the Global Financial Crisis (GFC), Indonesia’s commodity production centres were expected
to be hard hit by a reduction in export demand. The economy as a whole was expected to suffer, with a
substantial impact on national and regional budgets, including for education. In the Asian Financial Crisis,
Indonesia suffered badly, and enrolments in education dropped.
The report Indonesian Schools and the Global Financial Crisis 2009 studies the impact of the Global Financial
Crisis on education budgets and expenditure on schooling by districts and households in districts that contain
commodity production areas.
This analysis focuses on the GFC impact on basic and secondary education at the kabupaten/kota
(district/city administrative level), school and household (student/parents) level.
The study assesses the crisis impact at:
• district/city level, especially on education policy, funding and performance;
• school level, in terms of funding, school program, teacher motivation, student absence, drop out,
and student mobility; and
• household level in terms of occupation, income and expenditure, and ability to finance education.
District level: Export commodities likely to have been effected by the crisis were selected and regions
(province and kabupaten/kota) which are production centers for these commodities were surveyed to assess
impact of the crisis.
Education: Junior secondary school (SMP) was surveyed for basic education and senior / vocational
secondary school (SMA/SMK) for secondary education level. Elementary schools (SD) were not surveyed as
the education cost for SD is generally affordable and many kabupaten/kota had implemented free basic
education at SD level.
The study also formulates an alternative strategy to further improve the education system’s ability to
respond to crisis .
Key Findings
The Global Financial Crisis (GFC) reverberated around the world in the latter part of 2008. With the 1998
Asian Financial Crisis in mind, many feared that the impact on education in Indonesia would be substantial.
3 This section reproduces the executive summary of the English version report report Indonesian Schools and the Global Financial
Crisis 2009. CSAS has produced this abridged report based on the report Impact Study of the Global Financial Crisis on Education
(Pengkajian Pendanaan Pendidikan Secara Masal Studi Dampak Krisis Keuangan Global Terhadap Pendidikan, 2009) that was
produced by Balitbang within MoNE. The English abridged report reproduces the district level analysis and broad conclusions and
recommendations of the original report. The abridged report has updated the national level analysis on the impact of the crisis on
the national economy and the national education budget based on more recent data. A full copy of the English abridged version of
the report can be obtained from CSAS. The full report in Bahasa Indonesia has been published by Balitbang.

Special Discussion Theme - The Global Financial Crisis and Indonesian Schooling
Page 41
Given the significance of exports, the economy was expected to shrink, resulting in fewer funds available for
public investments such as in education.
An increase in the poverty rate was expected to reduce the ability of households to provide education
expenditure, including tuition fees, transport to school, school supplies and uniforms.
The economic crisis impact in 1997/1998 on basic education was studied by Balitbang Depdikbud jointly with
the World Bank. Surveying 600 schools the main findings were:
• Social Safety Net Insurance programs in the education sector (in the form of scholarships and
operational grants for schools) are useful to anticipate economic crisis impact, especially for poor
parents and schools.
• The survey results indicated an overall drop of 1.6% in total students although several groups and
regions specifically at junior secondary school (SLTP) level were more badly affected (Balitbang
Depdikbud and World Bank, 1999).
After the 1997–98 crisis, Indonesia developed systems and instruments in programs to cope with and lessen
the impact on people’s welfare, especially the poor. An education safety net was built initially consisting of
scholarship programs directed to the poor, but which was extended by the implementation of free basic
education over the last few years.
In 2009 Indonesia fared well through the GFC. The GDP continued to grow, as did national expenditures. The
government kept to its constitutional commitment made during the high growth period in 2008 of expending
20 percent of national public expenditure on education. Education expenditure also increased in 2009, from
Rp. 154 trillion to Rp. 207 trillion. Education as a percentage of total national expenditure increased from
15.6 percent to 20 percent.
Some commodity production areas suffered from the downturn, while others experienced pre-existing
problems including a reduction in the availability of raw materials.
• Plywood industry: Kota Samarinda and Kota Jambi experienced an ongoing decline due to lack of
raw materials. The global crisis accentuated the staff redundancies.
• Palm Plantation: Pelalawan, Siak, and Tanjung Jabung Barat experienced a drastic drop in whole
palm coconut prices. The palm price decreased from Rp. 2,000 per kilo to Rp. 300 per kilo (85
percent) over 2008.
• Rubber plantation: Siak, Pelalawan, and Tanjabar experienced a similar decline in rubber gum
price, decreasing 75 percent over 2008.
• Pulp and paper industry: Siak and Tanjabar experienced a drop in export demands, causing
production to reduce with major layoffs in late 2008. Many returned home or sought employment
elsewhere. Some remained in other employment, such as motor bike drivers or other informal
sector jobs.
• Textile and garment industry: A drop in production in the textile and garment industry was
noticeable by March 2009, increasing redundancies.
• Furniture industry in Boyolali: furniture exports reduced due to the lack of overseas market orders.
Special Discussion Theme - The Global Financial Crisis and Indonesian Schooling
Page 42
• Car spare part industry: Car spare part industry centers such as Tangerang industry zone did not
experience significant production fluctuations.
Regional budgets showed an increase in 2009. Regional Own Revenue (PAD) trends varied in surveyed
districts/cities. Some regions received higher PAD in 2009 compared to 2008, and some lower. Most
experienced an increase in revenue. Unlike the revenue component, regional expenditure in all sample areas
increased. The increases were in both real and nominal terms. Inflation rates across the regions varied
considerably.
Due to the healthiness of regional budgets, the education budget for export commodity center
districts/cities was not particularly affected by the crisis, with district education budget nominal value
increasing consistently. When adjusted for inflation, the value of the increase was less significant.
The proportion of district funds spent on education also increased. Since 2005, Kota Jambi has allocated at
least 20% of APBD budget to education spending. In 2009, Jambi education budget accounted for 36% of the
APBD. In Kota Depok, the 2009 education budget increased 25 percent from 2008 and accounted for
approximately 31 percent of the total APBD in 2009.
All districts had implemented the free basic education policy, which prohibits the charging of tuition fees at
public primary and lower secondary schools.
As these schools were in some of the areas worst affected by the crisis, enrolments have proved to be
resilient. The average total students in August 2008 (beginning of school year 2008/2009) and June 2009
(end of school term) for sample schools showed a drop of 1.5 percent.
The biggest drop was in Grade 3 (of lower secondary school – year 8 of schooling). Student numbers in Grade
3 decreased by 4.3 percent between August 2008 and June 2009. In the first year of secondary schooling
(Grade 1), numbers decreased by 2 percent, and increased by 0.5 percent in Grade 2.
None of the districts/cities located within Indonesia’s export commodity centers had specific policies to
anticipate the global financial crisis impact. However, pre-existing policies, including free basic education
prohibiting tuition fees at public lower secondary schools, and policies of scholarships to assist poor students
stood the test of the crisis.
The range of programs to reduce the cost of basic education for households and the support supported at
district level ranged from support focused on public basic education to support for students at private
schools.
The free education policies ensured that poor families had an option of free education for their children’s
education, and scholarship programs increased their scope to cover more children in many districts as more
families experienced difficult economic conditions.
Overall, many parents increased their income over the period. However, many families were experiencing
poor economic conditions before the crisis. These and other families’ experienced further difficulties through
job layoffs and income cuts which then affected their ability to finance education costs. Many workers and
families returned to their original or home districts after layoffs, or stayed and worked in the informal sector.

Special Discussion Theme - The Global Financial Crisis and Indonesian Schooling
Page 43
Irregular income for informal sector workers impacts on their ability to pay tuition fees. Parents in formal
sector employment could generally pay tuition fees however in the event of a redundancy, all household
income is for basic food and housing, leaving little left over for school fees or uniforms.
The average household spending per month during the crisis varied little, increasing only by Rp. 15,000.
Household education expenditure showed a drop in the periods Jan-June 2009 compared to July-Dec 2008.
The average expenditure for education in Jan-June 2009 was Rp. 430,298 which is 22 percent less than Rp.
525,331 spent in June-Dec 2008. Families reported spending less on uniforms, books and transport.
The impact on families with children in public basic education was minimal because of existing free
education policies implemented by districts/cities prohibiting schools from charging tuition fees. The free
education policy implementation has been accompanied by a television campaign to raise community
awareness. As a result, many families are unwilling to pay for tuition fees at basic education level. This
curtails the ability of schools to continue to charge tuition fees.
The BOS program which provides the school operational funding underpinning free basic education and
BKM/BKSM program for secondary schools have provided essential support for students from poor families
to maintain their education. Some districts supplemented BOS for schools with additional payments from the
regional budget. Some schools experienced difficulties when disbursement of operational funding from the
district was delayed.
Poor families with children in private schools, including private secondary vocational schools (SMKs) still pay
tuition fees. Private schools experienced some increase in drop outs, mainly during the first stages of class.
Public secondary schools (SMAs) also levy tuition fees so poor students without scholarships face the same
problem. For them school fees are still a liability. The existing scholarship programs increased their coverage
in 2009 indicating that system capacity to deal with the impact of crisis.
Outstanding tuition fee payments are an ongoing fact for most private schools and for public senior
secondary schools. The crisis increased the number of outstanding fees. At school level during the last six
months of 2008, some schools fees were overdue especially in private schools within the export commodity
centers affected by the global crisis (i.e. palm, rubber plantation, and paper). However, in early 2009 the
conditions improved with an increase in export commodity prices. Outstanding fees reduced in number in
the first half of 2009.
Recommendations
Current education mass funding programs among them via BOS, Regional BOS and scholarship programs
enable poor parents to enroll their children and maintain them in school. These programs have been proven
effective to help reduce educational costs, especially at basic education level. Therefore, although export
commodity centers regions were affected by the global crisis, education provision through schooling was not
disrupted. Enrolments in public basic education from poor families remained stable. In general, families did
not remove their children from public secondary schools as education costs are not financed by the
government.
School income at basic education level has not been significantly affected by the global crisis because
necessary operational costs are already provided by the government. However, this is not the case for

Special Discussion Theme - The Global Financial Crisis and Indonesian Schooling
Page 44
secondary schools, especially private schools, because their funding sources originate from parents. The
global crisis impacted family income, with many parents unemployed this affected school income.
Several policy alternatives are recommended to improve the response to crisis:
1. The government and regional government must have an emergency fund within a social aid
allocation or other allocation to respond to sudden/unpredicted education obstacles. Not only can
this fund be used to respond to global crisis, but also other problems/disasters such as floods,
earthquake, fires, etc.
2. Given limited government budget ability, budget allocation policy must be effective and efficient.
Because there will always be a tradeoff between equity and efficiency aspect during the budget
allocation, budget allocation policy must emphasize a set target. For that, sharing funds between
central, province and Kabupaten/Kota is a must.
For example, when allocating BOS for basic education at Central level, in order to improve budget
efficiency and effectiveness, the regional government should already be able to calculate the ability
of BOS budget to cover the education minimum requirement needs in their respective region. This
minimum standard must already be set at each education level. Thus, the amount of budget
allocation for education levels can be considered based on the gap between actual conditions
against the standards. The education level with the largest gap should be given higher budget
allocation. This must be considered by each government level, not only regional government at
Kabupaten/Kota, but also at provincial and central level.
3. The central government has budgeted education investment and operational costs to reduce
household education costs. Operational costs are covered via the BOS program and some regions
supplement this with BOS assistance (regional BOS). To further reduce household costs, the
government extended scholarships. Coordination to determine budget allocation priority and targets
is necessary to allocate overall budget for three budget components. Budget allocation priority
mapping is important for the three budget types in each region, so the budget allocation can achieve
a realistic target.

Appendix
Page 45
IV. APPENDIX
Districts Supplying Data 2006-2009
Figure 1: District Enrolment Data collected by Poverty Quintiles Status of Districts
2006 2007 2008 2009
Poverty
Quintile
Number
of
Districts
Districts
with
Enrolment
Data
Number
of
Districts
Districts
with
Enrolment
Data
Number
of
Districts
Districts
with
Enrolment
Data
Number
of
Districts
Districts
with
Enrolment
Data
1 89 89 91 91 93 92 96 92
2 88 88 89 89 91 90 98 90
3 88 88 85 85 95 89 96 89
4 88 88 88 88 91 90 94 90
5 87 87 87 87 95 91 111 91
Total 440 440 440 440 465 452 495 452
Figure 2: District Financial Data collected by Poverty Quintiles Status of Districts
2006 2007 2008 2009
Poverty
Quintile
Total
Number
of
Districts
Districts
with
Financial
Data
Total
Number
of
Districts
Districts
with
Financial
Data
Total
Number
of
Districts
Districts
with
Financial
Data
Total
Number
of
Districts
Districts
with
Financial
Data
1 89 75 91 85 93 85 96 90
2 88 67 89 88 91 90 98 95
3 88 69 85 82 95 90 96 95
4 88 66 88 84 91 91 94 93
5 87 66 87 81 95 93 111 104
Total 440 343 440 420 465 449 495 477

Appendix
Page 46
i. Districts Supplying Data 2006-2009 (full list)
(1= data available, 0= no data available, x= district did not exist)
Island
Province
District
2006 2007 2008 2009
Financial Data
Enrolment Data
Financial Data
Enrolment Data
Financial Data
Enrolment Data
Financial Data
Enrolment Data
Sumatera NAD Aceh Barat 1 1 1 1 1 1 1 1
Aceh Barat Daya 0 1 1 1 1 1 1 1
Aceh Besar 1 1 1 1 1 1 1 1
Aceh Jaya 0 1 1 1 1 1 1 1
Aceh Selatan 1 1 1 1 1 1 1 1
Aceh Singkil 0 1 0 1 1 1 1 1
Aceh Tamiang 0 1 1 1 1 1 1 1
Aceh Tengah 1 1 1 1 1 1 1 1
Aceh Tenggara 0 1 1 1 1 1 1 1
Aceh Timur 1 1 1 1 1 1 1 1
Aceh Utara 0 1 1 1 1 1 1 1
Bener Meriah 1 1 0 1 1 1 1 1
Bireuen 1 1 1 1 1 1 1 1
Gayo Lues 1 1 1 1 1 1 1 1
Kota Banda Aceh 1 1 1 1 1 1 1 1
Kota Langsa 0 1 1 1 1 1 1 1
Kota Lhokseumawe 1 1 1 1 1 1 1 1
Kota Sabang 1 1 1 1 1 1 1 1
Kota Subulussalam x x x x 1 0 1 0
Nagan Raya 1 1 0 1 1 1 1 1
Pidie 0 1 0 1 1 1 1 1
Pidie Jaya x x x x 1 0 1 0
Simeulue 1 1 1 1 1 1 1 1
Sumatera Utara
Asahan 0 1 1 1 1 1 1 1
Batu Bara x x x x 1 0 1 0
Dairi 0 1 1 1 1 1 1 1
Deli Serdang 1 1 1 1 1 1 1 1
Humbang Hasundutan
1 1 1 1 1 1 1 1
Karo 1 1 1 1 1 1 1 1
Kota Binjai 1 1 1 1 1 1 1 1
Kota Medan 0 1 1 1 1 1 1 1
Kota Padang Sidempuan
0 1 1 1 1 1 1 1
Kota Pematang Siantar
1 1 1 1 1 1 1 1
Kota Sibolga 0 1 1 1 1 1 1 1
Kota Tanjung Balai 1 1 1 1 1 1 1 1
Kota Tebing Tinggi 1 1 1 1 1 1 1 1
Labuhan Batu 1 1 1 1 1 1 1 1
Labuhanbatu Selatan
x x x x x x 1 0
Labuhanbatu Utara x x x x x x 1 0
Langkat 1 1 1 1 1 1 1 1
Mandailing Natal 0 1 1 1 1 1 1 1
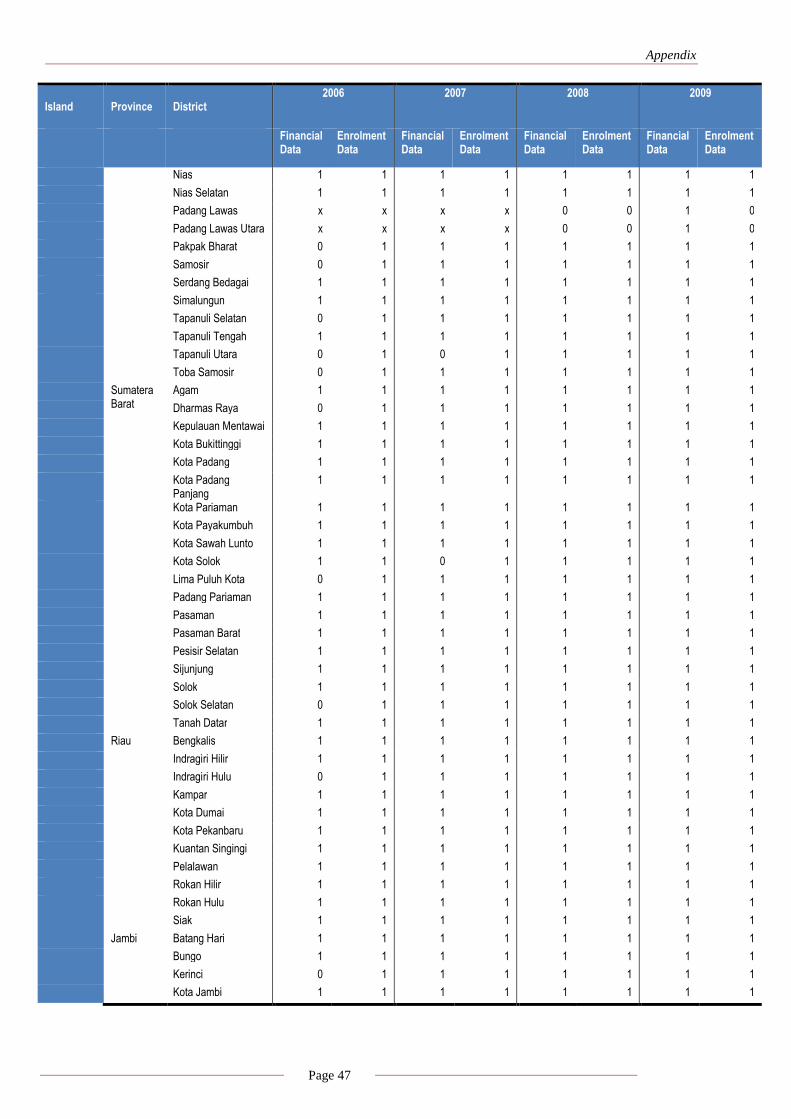
Appendix
Page 47
Island
Province
District
2006 2007 2008 2009
Financial Data
Enrolment Data
Financial Data
Enrolment Data
Financial Data
Enrolment Data
Financial Data
Enrolment Data
Nias 1 1 1 1 1 1 1 1
Nias Selatan 1 1 1 1 1 1 1 1
Padang Lawas x x x x 0 0 1 0
Padang Lawas Utara x x x x 0 0 1 0
Pakpak Bharat 0 1 1 1 1 1 1 1
Samosir 0 1 1 1 1 1 1 1
Serdang Bedagai 1 1 1 1 1 1 1 1
Simalungun 1 1 1 1 1 1 1 1
Tapanuli Selatan 0 1 1 1 1 1 1 1
Tapanuli Tengah 1 1 1 1 1 1 1 1
Tapanuli Utara 0 1 0 1 1 1 1 1
Toba Samosir 0 1 1 1 1 1 1 1
Sumatera Barat
Agam 1 1 1 1 1 1 1 1
Dharmas Raya 0 1 1 1 1 1 1 1
Kepulauan Mentawai 1 1 1 1 1 1 1 1
Kota Bukittinggi 1 1 1 1 1 1 1 1
Kota Padang 1 1 1 1 1 1 1 1
Kota Padang Panjang
1 1 1 1 1 1 1 1
Kota Pariaman 1 1 1 1 1 1 1 1
Kota Payakumbuh 1 1 1 1 1 1 1 1
Kota Sawah Lunto 1 1 1 1 1 1 1 1
Kota Solok 1 1 0 1 1 1 1 1
Lima Puluh Kota 0 1 1 1 1 1 1 1
Padang Pariaman 1 1 1 1 1 1 1 1
Pasaman 1 1 1 1 1 1 1 1
Pasaman Barat 1 1 1 1 1 1 1 1
Pesisir Selatan 1 1 1 1 1 1 1 1
Sijunjung 1 1 1 1 1 1 1 1
Solok 1 1 1 1 1 1 1 1
Solok Selatan 0 1 1 1 1 1 1 1
Tanah Datar 1 1 1 1 1 1 1 1
Riau Bengkalis 1 1 1 1 1 1 1 1
Indragiri Hilir 1 1 1 1 1 1 1 1
Indragiri Hulu 0 1 1 1 1 1 1 1
Kampar 1 1 1 1 1 1 1 1
Kota Dumai 1 1 1 1 1 1 1 1
Kota Pekanbaru 1 1 1 1 1 1 1 1
Kuantan Singingi 1 1 1 1 1 1 1 1
Pelalawan 1 1 1 1 1 1 1 1
Rokan Hilir 1 1 1 1 1 1 1 1
Rokan Hulu 1 1 1 1 1 1 1 1
Siak 1 1 1 1 1 1 1 1
Jambi Batang Hari 1 1 1 1 1 1 1 1
Bungo 1 1 1 1 1 1 1 1
Kerinci 0 1 1 1 1 1 1 1
Kota Jambi 1 1 1 1 1 1 1 1

Appendix
Page 48
Island
Province
District
2006 2007 2008 2009
Financial Data
Enrolment Data
Financial Data
Enrolment Data
Financial Data
Enrolment Data
Financial Data
Enrolment Data
Kota Sungai Penuh x x x x x x 1 0
Merangin 1 1 1 1 1 1 1 1
Muaro Jambi 1 1 1 1 0 1 1 1
Sarolangun 1 1 1 1 1 1 1 1
Tanjung Jabung Barat
1 1 1 1 1 1 1 1
Tanjung Jabung Timur
0 1 1 1 1 1 1 1
Tebo 0 1 1 1 1 1 1 1
Bengkulu Bengkulu Selatan 1 1 0 1 1 1 1 1
Bengkulu Tengah x x x x x x 1 0
Bengkulu Utara 0 1 1 1 1 1 1 1
Kaur 1 1 1 1 1 1 1 1
Kepahiang 1 1 1 1 1 1 1 1
Kota Bengkulu 1 1 1 1 1 1 1 1
Lebong 1 1 1 1 1 1 1 1
Mukomuko 0 1 1 1 1 1 1 1
Rejang Lebong 1 1 1 1 1 1 1 1
Seluma 1 1 1 1 1 1 1 1
Sumatera Selatan
Banyu Asin 1 1 1 1 1 1 1 1
Empat Lawang x x x x 1 1 1 1
Kota Lubuklinggau 1 1 1 1 1 1 1 1
Kota Pagar Alam 0 1 1 1 1 1 1 1
Kota Palembang 1 1 1 1 1 1 1 1
Kota Prabumulih 1 1 1 1 1 1 1 1
Lahat 1 1 1 1 1 1 1 1
Muara Enim 1 1 1 1 1 1 1 1
Musi Banyuasin 1 1 1 1 1 1 1 1
Musi Rawas 1 1 1 1 1 1 1 1
Ogan Ilir 1 1 1 1 1 1 1 1
Ogan Komering Ilir 1 1 1 1 1 1 1 1
Ogan Komering Ulu 1 1 1 1 1 1 1 1
Ogan Komering Ulu Selatan
1 1 1 1 1 1 1 1
Ogan Komering Ulu Timur
1 1 1 1 1 1 1 1
Lampung Kota Bandar Lampung
1 1 1 1 1 1 1 1
Kota Metro 1 1 1 1 1 1 1 1
Lampung Barat 1 1 1 1 1 1 1 1
Lampung Selatan 1 1 1 1 1 1 1 1
Lampung Tengah 1 1 1 1 1 1 1 1
Lampung Timur 1 1 1 1 1 1 1 1
Lampung Utara 1 1 1 1 1 1 1 1
Pesawaran x x x x 0 0 1 0
Tanggamus 1 1 1 1 1 1 1 1
Tulangbawang 0 1 1 1 1 1 1 1
Way Kanan 1 1 1 1 1 1 1 1
Bangka Bangka 1 1 1 1 1 1 1 1
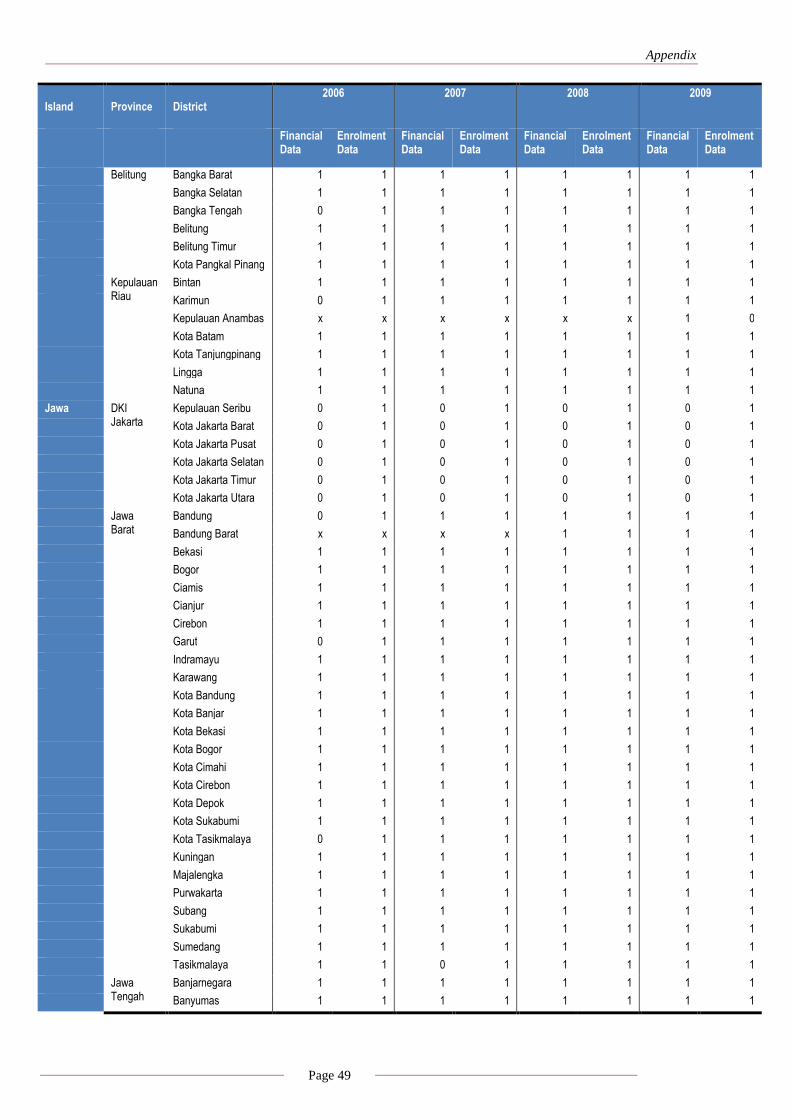
Appendix
Page 49
Island
Province
District
2006 2007 2008 2009
Financial Data
Enrolment Data
Financial Data
Enrolment Data
Financial Data
Enrolment Data
Financial Data
Enrolment Data
Belitung Bangka Barat 1 1 1 1 1 1 1 1
Bangka Selatan 1 1 1 1 1 1 1 1
Bangka Tengah 0 1 1 1 1 1 1 1
Belitung 1 1 1 1 1 1 1 1
Belitung Timur 1 1 1 1 1 1 1 1
Kota Pangkal Pinang 1 1 1 1 1 1 1 1
Kepulauan Riau
Bintan 1 1 1 1 1 1 1 1
Karimun 0 1 1 1 1 1 1 1
Kepulauan Anambas x x x x x x 1 0
Kota Batam 1 1 1 1 1 1 1 1
Kota Tanjungpinang 1 1 1 1 1 1 1 1
Lingga 1 1 1 1 1 1 1 1
Natuna 1 1 1 1 1 1 1 1
Jawa DKI Jakarta
Kepulauan Seribu 0 1 0 1 0 1 0 1
Kota Jakarta Barat 0 1 0 1 0 1 0 1
Kota Jakarta Pusat 0 1 0 1 0 1 0 1
Kota Jakarta Selatan 0 1 0 1 0 1 0 1
Kota Jakarta Timur 0 1 0 1 0 1 0 1
Kota Jakarta Utara 0 1 0 1 0 1 0 1
Jawa Barat
Bandung 0 1 1 1 1 1 1 1
Bandung Barat x x x x 1 1 1 1
Bekasi 1 1 1 1 1 1 1 1
Bogor 1 1 1 1 1 1 1 1
Ciamis 1 1 1 1 1 1 1 1
Cianjur 1 1 1 1 1 1 1 1
Cirebon 1 1 1 1 1 1 1 1
Garut 0 1 1 1 1 1 1 1
Indramayu 1 1 1 1 1 1 1 1
Karawang 1 1 1 1 1 1 1 1
Kota Bandung 1 1 1 1 1 1 1 1
Kota Banjar 1 1 1 1 1 1 1 1
Kota Bekasi 1 1 1 1 1 1 1 1
Kota Bogor 1 1 1 1 1 1 1 1
Kota Cimahi 1 1 1 1 1 1 1 1
Kota Cirebon 1 1 1 1 1 1 1 1
Kota Depok 1 1 1 1 1 1 1 1
Kota Sukabumi 1 1 1 1 1 1 1 1
Kota Tasikmalaya 0 1 1 1 1 1 1 1
Kuningan 1 1 1 1 1 1 1 1
Majalengka 1 1 1 1 1 1 1 1
Purwakarta 1 1 1 1 1 1 1 1
Subang 1 1 1 1 1 1 1 1
Sukabumi 1 1 1 1 1 1 1 1
Sumedang 1 1 1 1 1 1 1 1
Tasikmalaya 1 1 0 1 1 1 1 1
Jawa Tengah
Banjarnegara 1 1 1 1 1 1 1 1
Banyumas 1 1 1 1 1 1 1 1

Appendix
Page 50
Island
Province
District
2006 2007 2008 2009
Financial Data
Enrolment Data
Financial Data
Enrolment Data
Financial Data
Enrolment Data
Financial Data
Enrolment Data
Batang 1 1 1 1 1 1 1 1
Blora 1 1 1 1 1 1 1 1
Boyolali 1 1 1 1 1 1 1 1
Brebes 1 1 1 1 1 1 1 1
Cilacap 1 1 1 1 1 1 1 1
Demak 1 1 1 1 1 1 1 1
Grobogan 1 1 1 1 1 1 1 1
Jepara 1 1 1 1 1 1 1 1
Karanganyar 1 1 1 1 1 1 1 1
Kebumen 1 1 1 1 1 1 1 1
Kendal 0 1 1 1 1 1 1 1
Klaten 1 1 1 1 1 1 1 1
Kota Magelang 1 1 1 1 1 1 1 1
Kota Pekalongan 1 1 1 1 1 1 1 1
Kota Salatiga 1 1 1 1 1 1 1 1
Kota Semarang 0 1 1 1 1 1 1 1
Kota Surakarta 1 1 1 1 1 1 1 1
Kota Tegal 1 1 1 1 1 1 1 1
Kudus 1 1 1 1 1 1 1 1
Magelang 1 1 1 1 1 1 1 1
Pati 1 1 1 1 1 1 1 1
Pekalongan 1 1 1 1 1 1 1 1
Pemalang 0 1 1 1 1 1 1 1
Purbalingga 1 1 1 1 1 1 1 1
Purworejo 1 1 1 1 1 1 1 1
Rembang 0 1 1 1 1 1 1 1
Semarang 1 1 1 1 1 1 1 1
Sragen 1 1 1 1 1 1 1 1
Sukoharjo 1 1 1 1 1 1 1 1
Tegal 1 1 1 1 1 1 1 1
Temanggung 1 1 1 1 1 1 1 1
Wonogiri 1 1 1 1 1 1 1 1
Wonosobo 1 1 1 1 1 1 1 1
DI Yogyakarta
Bantul 1 1 1 1 1 1 1 1
Gunung Kidul 1 1 1 1 1 1 1 1
Kota Yogyakarta 1 1 1 1 1 1 1 1
Kulon Progo 1 1 1 1 1 1 1 1
Sleman 1 1 1 1 1 1 1 1
Jawa Timur
Bangkalan 0 1 1 1 1 1 1 1
Banyuwangi 0 1 1 1 1 1 1 1
Blitar 1 1 1 1 1 1 1 1
Bojonegoro 0 1 1 1 1 1 1 1
Bondowoso 1 1 1 1 1 1 1 1
Gresik 1 1 1 1 1 1 1 1
Jember 0 1 1 1 1 1 1 1
Jombang 1 1 1 1 1 1 1 1
Kediri 0 1 1 1 1 1 1 1

Appendix
Page 51
Island
Province
District
2006 2007 2008 2009
Financial Data
Enrolment Data
Financial Data
Enrolment Data
Financial Data
Enrolment Data
Financial Data
Enrolment Data
Kota Batu 1 1 1 1 1 1 1 1
Kota Blitar 1 1 1 1 1 1 1 1
Kota Kediri 1 1 1 1 1 1 1 1
Kota Madiun 1 1 1 1 1 1 1 1
Kota Malang 1 1 1 1 1 1 1 1
Kota Mojokerto 1 1 1 1 1 1 1 1
Kota Pasuruan 0 1 1 1 1 1 1 1
Kota Probolinggo 1 1 1 1 1 1 1 1
Kota Surabaya 1 1 1 1 1 1 1 1
Lamongan 1 1 1 1 1 1 1 1
Lumajang 1 1 1 1 1 1 1 1
Madiun 0 1 1 1 1 1 1 1
Magetan 1 1 1 1 1 1 1 1
Malang 1 1 1 1 1 1 1 1
Mojokerto 1 1 1 1 1 1 1 1
Nganjuk 1 1 1 1 1 1 1 1
Ngawi 1 1 1 1 1 1 1 1
Pacitan 1 1 1 1 1 1 1 1
Pamekasan 1 1 1 1 1 1 1 1
Pasuruan 0 1 1 1 1 1 1 1
Ponorogo 1 1 0 1 1 1 1 1
Probolinggo 1 1 1 1 1 1 1 1
Sampang 1 1 1 1 1 1 1 1
Sidoarjo 1 1 1 1 1 1 1 1
Situbondo 1 1 1 1 1 1 1 1
Sumenep 0 1 1 1 1 1 1 1
Trenggalek 1 1 1 1 1 1 1 1
Tuban 1 1 1 1 1 1 1 1
Tulungagung 1 1 1 1 1 1 1 1
Banten Kota Cilegon 0 1 1 1 1 1 1 1
Kota Serang x x x x 0 0 1 0
Kota Tangerang 1 1 1 1 1 1 1 1
Lebak 0 1 1 1 1 1 1 1
Pandeglang 1 1 1 1 1 1 1 1
Serang 1 1 1 1 1 1 1 1
Tangerang 1 1 1 1 1 1 1 1
Bali dan Nusa Tenggara
Bali Badung 1 1 1 1 1 1 1 1
Bangli 1 1 1 1 1 1 1 1
Buleleng 1 1 1 1 1 1 1 1
Gianyar 1 1 1 1 1 1 1 1
Jembrana 1 1 1 1 1 1 1 1
Karang Asem 1 1 1 1 1 1 1 1
Klungkung 1 1 1 1 1 1 1 1
Kota Denpasar 1 1 1 1 1 1 1 1
Tabanan 1 1 1 1 1 1 1 1
NTB Bima 1 1 1 1 1 1 1 1
Dompu 1 1 1 1 1 1 1 1

Appendix
Page 52
Island
Province
District
2006 2007 2008 2009
Financial Data
Enrolment Data
Financial Data
Enrolment Data
Financial Data
Enrolment Data
Financial Data
Enrolment Data
Kota Bima 0 1 1 1 1 1 1 1
Kota Mataram 1 1 1 1 1 1 1 1
Lombok Barat 1 1 1 1 1 1 1 1
Lombok Tengah 1 1 1 1 1 1 1 1
Lombok Timur 1 1 1 1 1 1 1 1
Lombok Utara x x x x x x 1 0
Sumbawa 1 1 1 1 1 1 1 1
Sumbawa Barat 1 1 1 1 1 1 1 1
NTT Alor 1 1 1 1 1 1 1 1
Belu 1 1 0 1 1 1 1 1
Ende 1 1 0 1 1 1 1 1
Flores Timur 1 1 1 1 1 1 1 1
Kota Kupang 1 1 1 1 1 1 1 1
Kupang 1 1 1 1 1 1 1 1
Lembata 1 1 1 1 1 1 1 1
Manggarai 1 1 1 1 1 1 1 1
Manggarai Barat 1 1 0 1 1 1 1 1
Manggarai Timur x x x x 0 1 1 1
Nagekeo x x x x 1 1 1 1
Ngada 1 1 1 1 1 1 1 1
Rote Ndao 1 1 1 1 1 1 1 1
Sikka 1 1 1 1 1 1 1 1
Sumba Barat 1 1 1 1 1 1 1 1
Sumba Barat Daya x x x x 1 1 1 1
Sumba Tengah x x x x 1 1 1 1
Sumba Timur 1 1 1 1 1 1 1 1
Timor Tengah Selatan
1 1 1 1 1 1 1 1
Timor Tengah Utara 1 1 1 1 1 1 1 1
Kalimantan
Kalimantan Barat
Bengkayang 1 1 1 1 1 1 1 1
Kapuas Hulu 1 1 1 1 1 1 1 1
Kayong Utara x x x x 1 0 1 0
Ketapang 1 1 1 1 1 1 1 1
Kota Pontianak 1 1 1 1 1 1 1 1
Kota Singkawang 0 1 1 1 1 1 1 1
Kubu Raya x x x x 0 1 1 1
Landak 1 1 1 1 1 1 1 1
Melawi 1 1 1 1 1 1 1 1
Pontianak 1 1 1 1 1 1 1 1
Sambas 1 1 1 1 1 1 1 1
Sanggau 1 1 1 1 1 1 1 1
Sekadau 1 1 0 1 1 1 1 1
Sintang 1 1 1 1 1 1 1 1
Kalimantan Tengah
Barito Selatan 1 1 1 1 0 1 1 1
Barito Timur 1 1 1 1 1 1 1 1
Barito Utara 1 1 1 1 1 1 1 1
Gunung Mas 0 1 1 1 1 1 1 1

Appendix
Page 53
Island
Province
District
2006 2007 2008 2009
Financial Data
Enrolment Data
Financial Data
Enrolment Data
Financial Data
Enrolment Data
Financial Data
Enrolment Data
Kapuas 0 1 1 1 1 1 1 1
Katingan 0 1 1 1 1 1 1 1
Kota Palangka Raya 1 1 1 1 1 1 1 1
Kotawaringin Barat 1 1 1 1 1 1 1 1
Kotawaringin Timur 1 1 1 1 1 1 1 1
Lamandau 1 1 1 1 1 1 1 1
Murung Raya 0 1 1 1 1 1 1 1
Pulang Pisau 0 1 1 1 1 1 1 1
Seruyan 1 1 1 1 1 1 1 1
Sukamara 1 1 1 1 1 1 1 1
Kalimantan Selatan
Balangan 1 1 1 1 1 1 1 1
Banjar 1 1 1 1 1 1 1 1
Barito Kuala 1 1 1 1 1 1 1 1
Hulu Sungai Selatan 1 1 1 1 1 1 1 1
Hulu Sungai Tengah 1 1 1 1 1 1 1 1
Hulu Sungai Utara 1 1 1 1 1 1 1 1
Kota Banjarbaru 1 1 1 1 1 1 1 1
Kota Banjarmasin 1 1 1 1 1 1 1 1
Kotabaru 1 1 1 1 1 1 1 1
Tabalong 1 1 1 1 1 1 1 1
Tanah Bumbu 1 1 1 1 1 1 1 1
Tanah Laut 1 1 1 1 1 1 1 1
Tapin 1 1 1 1 1 1 1 1
Kalimantan Timur
Berau 1 1 1 1 1 1 1 1
Bulungan 1 1 1 1 1 1 1 1
Kota Balikpapan 1 1 1 1 1 1 1 1
Kota Bontang 0 1 1 1 1 1 1 1
Kota Samarinda 1 1 1 1 1 1 1 1
Kota Tarakan 0 1 1 1 1 1 1 1
Kutai Barat 0 1 1 1 1 1 1 1
Kutai Kartanegara 0 1 1 1 1 1 1 1
Kutai Timur 0 1 1 1 1 1 1 1
Malinau 1 1 1 1 1 1 1 1
Nunukan 1 1 1 1 1 1 1 1
Pasir 1 1 1 1 1 1 1 1
Penajam Paser Utara
1 1 1 1 1 1 1 1
Tana Tidung x x x x 0 0 1 0
Sulawesi Sulawesi Utara
Bolaang Mongondow 1 1 1 1 1 1 1 1
Bolaang Mongondow Selatan
x x x x x x 1 0
Bolaang Mongondow Timur
x x x x x x 1 0
Bolaang Mongondow Utara
x x x x 1 1 1 1
Kepulauan Sangihe 0 1 1 1 1 1 1 1
Kepulauan Talaud 1 1 1 1 1 1 1 1
Kota Bitung 1 1 1 1 1 1 1 1
Kota Kotamobagu x x x x 1 1 1 1

Appendix
Page 54
Island
Province
District
2006 2007 2008 2009
Financial Data
Enrolment Data
Financial Data
Enrolment Data
Financial Data
Enrolment Data
Financial Data
Enrolment Data
Kota Manado 0 1 1 1 1 1 1 1
Kota Tomohon 1 1 1 1 1 1 1 1
Minahasa 1 1 1 1 1 1 1 1
Minahasa Selatan 0 1 1 1 1 1 1 1
Minahasa Tenggara x x x x 1 1 1 1
Minahasa Utara 1 1 1 1 1 1 1 1
Siau Tagulandang Biaro
x x x x 1 0 1 0
Sulawesi Tengah
Banggai 1 1 1 1 1 1 1 1
Banggai Kepulauan 1 1 1 1 1 1 1 1
Buol 1 1 1 1 1 1 1 1
Donggala 0 1 1 1 1 1 1 1
Kota Palu 1 1 1 1 1 1 1 1
Morowali 1 1 1 1 1 1 1 1
Parigi Moutong 0 1 1 1 1 1 1 1
Poso 1 1 1 1 1 1 1 1
Sigi x x x x x x 1 0
Tojo Una-Una 1 1 1 1 1 1 1 1
Toli-Toli 1 1 1 1 1 1 1 1
Sulawesi Selatan
Bantaeng 1 1 1 1 1 1 1 1
Barru 1 1 1 1 1 1 1 1
Bone 1 1 1 1 1 1 1 1
Bulukumba 1 1 1 1 1 1 1 1
Enrekang 1 1 1 1 1 1 1 1
Gowa 1 1 1 1 1 1 1 1
Jeneponto 1 1 1 1 1 1 1 1
Kepulauan Selayar 1 1 1 1 1 1 1 1
Kota Makassar 1 1 1 1 1 1 1 1
Kota Palopo 1 1 1 1 1 1 1 1
Kota Pare-Pare 1 1 1 1 1 1 1 1
Luwu 1 1 1 1 1 1 1 1
Luwu Timur 1 1 1 1 1 1 1 1
Luwu Utara 1 1 1 1 1 1 1 1
Maros 0 1 1 1 1 1 1 1
Pangkajene dan Kepulauan
1 1 1 1 1 1 1 1
Pinrang 1 1 1 1 1 1 1 1
Sidenreng Rappang 1 1 1 1 1 1 1 1
Sinjai 1 1 1 1 1 1 1 1
Soppeng 1 1 1 1 1 1 1 1
Takalar 1 1 1 1 1 1 1 1
Tana Toraja 1 1 1 1 1 1 1 1
Toraja Utara x x x x x x 1 0
Wajo 1 1 1 1 1 1 1 1
Sulawesi Tenggara
Bombana 0 1 1 1 1 1 1 1
Buton 1 1 1 1 1 1 1 1
Buton Utara x x x x 1 0 1 0
Kolaka 1 1 1 1 1 1 1 1

Appendix
Page 55
Island
Province
District
2006 2007 2008 2009
Financial Data
Enrolment Data
Financial Data
Enrolment Data
Financial Data
Enrolment Data
Financial Data
Enrolment Data
Kolaka Utara 1 1 1 1 1 1 1 1
Konawe 0 1 1 1 1 1 1 1
Konawe Selatan 0 1 1 1 1 1 1 1
Konawe Utara x x x x 1 1 1 1
Kota Bau-Bau 1 1 1 1 1 1 1 1
Kota Kendari 1 1 1 1 1 1 1 1
Muna 1 1 1 1 1 1 1 1
Wakatobi 0 1 1 1 1 1 1 1
Gorontalo Boalemo 1 1 1 1 1 1 1 1
Bone Bolango 0 1 1 1 1 1 1 1
Gorontalo 1 1 1 1 1 1 1 1
Gorontalo Utara x x x x 1 1 1 1
Kota Gorontalo 1 1 1 1 1 1 1 1
Pohuwato 1 1 1 1 1 1 1 1
Sulawesi Barat
Majene 1 1 1 1 1 1 1 1
Mamasa 0 1 1 1 1 1 1 1
Mamuju 0 1 1 1 1 1 1 1
Mamuju Utara 1 1 1 1 1 1 1 1
Polewali Mandar 1 1 1 1 1 1 1 1
Maluku Maluku Buru 1 1 1 1 1 1 1 1
Buru Selatan x x x x x x 1 0
Kepulauan Aru 0 1 1 1 1 1 1 1
Kota Ambon 1 1 1 1 1 1 1 1
Kota Tual x x x x 0 0 1 0
Maluku Barat Daya x x x x x x 1 0
Maluku Tengah 1 1 1 1 1 1 1 1
Maluku Tenggara 0 1 1 1 1 1 1 1
Maluku Tenggara Barat
1 1 1 1 1 1 1 1
Seram Bagian Barat 1 1 1 1 1 1 1 1
Seram Bagian Timur 1 1 1 1 1 1 1 1
Maluku Utara
Halmahera Barat 1 1 1 1 1 1 1 1
Halmahera Selatan 1 1 1 1 1 1 1 1
Halmahera Tengah 1 1 1 1 1 1 1 1
Halmahera Timur 0 1 1 1 1 1 1 1
Halmahera Utara 1 1 1 1 1 1 1 1
Kepulauan Sula 0 1 1 1 1 1 1 1
Kota Ternate 1 1 1 1 1 1 1 1
Kota Tidore Kepulauan
1 1 1 1 1 1 1 1
Papua Papua Barat
Fakfak 1 1 1 1 1 1 1 1
Kaimana 1 1 1 1 1 1 1 1
Kota Sorong 1 1 1 1 1 1 1 1
Manokwari 1 1 1 1 1 1 1 1
Raja Ampat 1 1 1 1 1 1 1 1
Sorong 1 1 1 1 1 1 1 1
Sorong Selatan 1 1 1 1 1 1 1 1
Teluk Bintuni 0 1 1 1 1 1 1 1

Appendix
Page 56
Island
Province
District
2006 2007 2008 2009
Financial Data
Enrolment Data
Financial Data
Enrolment Data
Financial Data
Enrolment Data
Financial Data
Enrolment Data
Teluk Wondama 0 1 1 1 1 1 1 1
Papua Asmat 0 1 1 1 1 1 1 1
Biak Numfor 0 1 1 1 1 1 1 1
Boven Digoel 1 1 1 1 1 1 1 1
Dogiyai x x x x x x 1 0
Jayapura 1 1 1 1 1 1 1 1
Jayawijaya 1 1 1 1 1 1 1 1
Keerom 1 1 1 1 1 1 1 1
Kepulauan Yapen 0 1 1 1 1 1 1 1
Kota Jayapura 1 1 1 1 1 1 1 1
Lanny Jaya x x x x x x 1 0
Mamberamo Raya x x x x 1 0 1 0
Mamberamo Tengah x x x x x x 1 0
Mappi 0 1 1 1 1 1 1 1
Merauke 1 1 1 1 1 1 1 1
Mimika 0 1 1 1 1 1 1 1
Nabire 1 1 1 1 1 1 1 1
Nduga x x x x x x 1 0
Paniai 0 1 1 1 1 1 1 1
Pegunungan Bintang 1 1 1 1 1 1 1 1
Puncak x x x x x x 1 0
Puncak Jaya 1 1 1 1 1 1 1 1
Sarmi 0 1 1 1 1 1 1 1
Supiori 1 1 1 1 1 1 1 1
Tolikara 0 1 1 1 1 1 1 1
Waropen 0 1 1 1 1 1 1 1
Yahukimo 0 1 0 1 1 1 1 1
Yalimo x x x x x x 1 0

Appendix
Page 57
ii. Province Summary – Number of Districts Providing Enrolment Data
Province
2006 2007 2008
Total Number
of Districts
Districts with
Enrolment Data
Total Number
of Districts
Districts with
Enrolment Data
Total Number
of Districts
Districts with
Enrolment Data
Nanggroe Aceh Darussalam 21 21 21 21 23 21
Sumatera Utara 25 25 25 25 28 25
Sumatera Barat 19 19 19 19 19 19
Riau 11 11 11 11 11 11
Jambi 10 10 10 10 10 10
Sumatera Selatan 14 14 14 14 15 15
Bengkulu 9 9 9 9 9 9
Lampung 10 10 10 10 11 10
Kepulauan Bangka Belitung 7 7 7 7 7 7
Kepulauan Riau 6 6 6 6 6 6
DKI Jakarta 6 6 6 6 6 6
Jawa Barat 25 25 25 25 26 26
Jawa Tengah 35 35 35 35 35 35
DI Yogyakarta 5 5 5 5 5 5
Jawa Timur 38 38 38 38 38 38
Banten 6 6 6 6 7 6
Bali 9 9 9 9 9 9
Nusa Tenggara Barat 9 9 9 9 9 9
Nusa Tenggara Timur 16 16 16 16 20 20
Kalimantan Barat 12 12 12 12 14 13
Kalimantan Tengah 14 14 14 14 14 14
Kalimantan Selatan 13 13 13 13 13 13
Kalimantan Timur 13 13 13 13 14 13
Sulawesi Utara 9 9 9 9 13 12
Sulawesi Tengah 10 10 10 10 10 10
Sulawesi Selatan 23 23 23 23 23 23
Sulawesi Tenggara 10 10 10 10 12 11
Province Gorontalo 5 5 5 5 6 6
Sulawesi Barat 5 5 5 5 5 5
Maluku 8 8 8 8 9 8
Maluku Utara 8 8 8 8 8 8
Papua Barat 9 9 9 9 9 9
Papua 20 20 20 20 21 20
Total 440 440 440 440 465 452
2009 enrolment estimates are based on the latest available enrolment data available

Appendix
Page 58
i. Province Summary – Number of Districts Providing Financial Data
Province 2006 2007 2008 2009
Province Total
Number
of
Districts
Districts
with
Financial
Data
Total
Number
of
Districts
Districts
with
Financial
Data
Total
Number
of
Districts
Districts
with
Financial
Data
Total
Number
of
Districts
Districts
with
Financial
Data
Nanggroe Aceh Darussalam 21 13 21 17 23 23 23 23
Sumatera Utara 25 14 25 24 28 26 33 30
Sumatera Barat 19 16 19 18 19 19 19 19
Riau 11 10 11 11 11 11 11 11
Jambi 10 7 10 10 10 9 11 11
Sumatera Selatan 14 13 14 14 15 15 15 15
Bengkulu 9 7 9 8 9 9 10 10
Lampung 10 9 10 10 11 10 14 11
Kepulauan Bangka Belitung 7 6 7 7 7 7 7 7
Kepulauan Riau 6 5 6 6 6 6 7 7
DKI Jakarta 6 0 6 0 6 0 6 0
Jawa Barat 25 22 25 24 26 26 26 26
Jawa Tengah 35 31 35 35 35 35 35 35
DI Yogyakarta 5 5 5 5 5 5 5 5
Jawa Timur 38 29 38 37 38 38 38 38
Banten 6 4 6 6 7 6 8 7
Bali 9 9 9 9 9 9 9 9
Nusa Tenggara Barat 9 8 9 9 9 9 10 10
Nusa Tenggara Timur 16 16 16 13 20 19 21 20
Kalimantan Barat 12 11 12 11 14 13 14 14
Kalimantan Tengah 14 9 14 14 14 13 14 14
Kalimantan Selatan 13 13 13 13 13 13 13 13
Kalimantan Timur 13 8 13 13 14 13 14 14
Sulawesi Utara 9 6 9 9 13 13 15 15
Sulawesi Tengah 10 8 10 10 10 10 11 11
Sulawesi Selatan 23 22 23 23 23 23 24 24
Sulawesi Tenggara 10 6 10 10 12 12 12 12
Province Gorontalo 5 4 5 5 6 6 6 6
Sulawesi Barat 5 3 5 5 5 5 5 5
Maluku 8 6 8 8 9 8 11 11
Maluku Utara 8 6 8 8 8 8 9 8
Papua Barat 9 7 9 9 9 9 10 9
Papua 20 10 20 19 21 21 29 27
Total 440 343 440 420 465 449 495 477