financial pillar 23 may 2013 – thursday morning session docs/studyresources/qp f3 may...financial...
TRANSCRIPT

DO NOT OPEN THIS QUESTION PAPER UNTIL YOU ARE TOLD TO DO SO.
� The Chartered Institute of Management Accountants 2013
F3
–F
inan
cial
Str
ateg
y
Financial Pillar
F3 – Financial Strategy
23 May 2013 – Thursday Morning Session
Instructions to candidates
You are allowed three hours to answer this question paper.
You are allowed 20 minutes reading time before the examination beginsduring which you should read the question paper and, if you wish, highlight and/or make notes on the question paper. However, you will not be allowed, under any circumstances, to open the answer book and start writing or use your calculator during this reading time.
You are strongly advised to carefully read ALL the question requirements before attempting the question concerned (that is all parts and/or sub-questions).
ALL answers must be written in the answer book. Answers written on the question paper will not be submitted for marking.
You should show all workings as marks are available for the method you use.
The pre-seen case study material is included in this question paper on pages 2 to 7. The unseen case study material, specific to this examination, is provided on pages 8 and 9.
Answer the compulsory question in Section A on page 11. This page is detachable for ease of reference.
Answer TWO of the three questions in Section B on pages 14 to 19.
Maths tables and formulae are provided on pages 21 to 25.
The list of verbs as published in the syllabus is given for reference on page 27.
Write your candidate number, the paper number and examination subject title in the spaces provided on the front of the answer book. Also write your contact ID and name in the space provided in the right hand margin and seal to close.
Tick the appropriate boxes on the front of the answer book to indicate which questions you have answered.
TURN OVER
May 2013 2 Financial Strategy
Pre-seen case study
BackgroundCountry T is a small landlocked European country which is outside the eurozone. Its currency is T$ which currently exchanges at GBP/T$ 1.5000 and EUR/T$ 1.2500, (that is, GBP 1 = T$ 1.5000 and EUR 1 = T$ 1.2500).
Unlike many other countries, Country T has a nationalised railway system known as T Railways.Before the system was nationalised two separate companies operated the railways.
The growth of road haulage transport and the increasing number of passengers wanting to travel by rail meant that by 1970 fare paying passengers replaced freight transport as the railway companies’ main source of income. In 1975 Country T’s Government took the view that the two railway companies were not operating in the public interest and they were nationalised; that is taken into public ownership. The Government bought out the two railway companies and established T Railways.
As the transport infrastructure developed, diesel trains gradually replaced steam trains and electric powered trains are now replacing the diesel trains as T Railways carries out electrification of its network.
In 1975, the Board of T Railways formed wholly owned subsidiaries which operated at arm's length from the Board. For example, it formed T Railways Engineering which was responsible for all the engineering works on the T Railways network. The T Railways Board retained a number of functions itself such as responsibility for the T Railways Transport Police Service and T Railways Property.However, this led to much duplication of resources and so in 1998 T Railways adopted a new management structure with T Railways as the holding company for three subsidiary companies as follows:
� T City-Link (TCL) to run passenger rail services.� T Freight Railways (TFR) to run freight services.� T Property and Track Services (TPTS) to manage the track, property, transport police and
related services.
This structure still exists today with T Railways’ corporate governance undertaken by the T Railways Board.
The activities of T RailwaysFurther details on the activities of each of the three subsidiary companies owned by T Railways is provided below.
TCL:TCL is responsible for all passenger rail services within Country T and operates on average 1,800 passenger train services per day between Monday and Saturday with fewer services on Sundays.The services offered are between all towns and cities within Country T which are connected to the railway network. In addition, some of TCL’s services cross national borders enabling travel from Country T to other countries, some of which are in the eurozone. It also provides some services to remote country locations which originally were not accessible by road. Recent improvements in the road network have resulted in some of these country lines being discontinued by T Railways asdemand for the railway service has diminished. Most of TCL’s locomotives are now electric as the lines between the major cities within Country T have already been electrified.
TFR:TFR is solely concerned with railway haulage of freight. In this context, freight is defined as goods transported in bulk, for example, coal, petroleum, industrial products such as steel and concrete, cars and, increasingly, retail goods for supermarkets and large retail shops. TFR does not offer any passenger services. It hauls freight right across the network within Country T and across national borders into other countries, some of which are situated within the eurozone.Most of TFR’s trains are old diesel locomotives but it has recently invested in a number of electric trains which are less harmful to the environment. On average, TFR operates 600 freight services per day, including weekends but excluding national public holidays. In the year ended 31 December 2012, TFR provided 40% of T Railways’ total revenue and its share of the freight haulage market in Country

Financial Strategy 3 May 2013
T was approximately 10%. Freight carried by road accounts for approximately 80% of the total freight haulage market in Country T. In the last 15 years, total freight carried by rail has increased by about 25% due to increased congestion on T’s roads. T’s Government considers that road congestion has had a major adverse impact upon the country’s productivity.
TPTS:TPTS replaced T Railways Property and has responsibility for all other services including maintenance and upgrade of track and all of T Railways’ property. It operates 200 railway stations, rents space out within the stations for retail purposes as well as running some of its own cafes. TPTS also operates 11 maintenance depots.
T Railways’ organisational structureA strong bureaucratic culture has developed over time within T Railways. The T Railways Board uses a classical rational planning system in which strategic planning decisions are made in a regularised and formal way.
The Chairman of the T Railways Board reports to senior civil servants in T Government’s Ministry of Transport. Ownership of T Railways rests entirely with the Government. There is a formal annual meeting with senior Government officials at which the financial statements of T Railways are approved. There are also occasional meetings between members of T Railways Board and Government officials, particularly when Country T’s Minister of Transport needs to present information on railway transport to Country T’s parliament.
Rail regulatorCountry T now has a rail regulatory organisation whose senior staff are appointed by the Government.The Rail Regulator is empowered to make recommendations directly to the Minister of Transport in respect of all issues relating to the operation of T Railways. The role of the Rail Regulator is to ensure that the railway service is delivered in Country T in a safe and efficient manner. It aims to help the T Railways Board meet future challenges in the provision of an efficient railway service which provides high levels of satisfaction to all rail users and the improvement of safety for staff and passengers. In essence, the Rail Regulator provides an independent review of T Railways’ activities. Mindful of the need to show that T Railways fullyrecognises the role of the Rail Regulator, the Chairman of the T Railways Board recently said that:
“T Railways is committed to providing an excellent service to its customers and work is ongoing toimprove our time keeping. Investment in improving railway stations is continuing and accessibility to railway services is increasing with new car parks being built at many stations in the network. Other service amenities are being improved such as better access ramps for disabled customers and the levelling of the height of platforms at many stations so that customers can access and alight from trains without having to a take a large step up or down to the platform. This will reduce the incidence of accidents which occur at stations where the platform infrastructure was developed for a bygone era of railway carriages.”
Monitoring the levels of carbon dioxide emissions from rail transport is also an important area of work for the Rail Regulator. (See the section headed “Environmental considerations”.)
T Railways’ strategic objectives T Railways’ overall strategic goal is to deliver efficient, cost effective, safe and reliable rail services to help facilitate the Government’s vision of sustained economic growth and the reduction of carbon emissions in the country as a whole. The T Railways Board has set two strategic objectives, following consultation with its stakeholder groups which are:
(i) To deliver reliable, safe and punctual rail services to customers efficiently and cost effectively thereby helping to achieve economic growth in Country T by reducing congestion on its roads;
(ii) To continually reduce its level of carbon emissions to help provide an environmentally friendly transport infrastructure.
May 2013 4 Financial Strategy
Financial objectives for T RailwaysThe Government’s aim and the T Railways Board’s main financial objectives are that:
(i) T Railways should at least cover its operating costs from the revenue it earns;
(ii) T Railways should provide value for money.
Financial data for T RailwaysThe Government requires T Railways to prepare its accounts according to internationally recognised accounting principles so that it can show how it is performing in a commercial environment. The policy of the T Railways Board is not to re-value its non-current assets. Extracts from the latest set of financial statements according to internationally recognised accounting principles are shown in Appendix 1.
The revenue earned and operating costs of the three subsidiaries for the year ended 31 December 2012 are shown below:
RevenueT$ million
Operating costsT$ million
TCL 680 630TFR 516 494TPTS 95 80
Notes:(i) The total head office operating costs of the T Railways Board are allocated and apportioned
to the three subsidiaries. (ii) The total operating costs of TPTS was T$842 million in 2012 after the allocation and
apportionment of head office operating costs referred to in note (i). All of these costs except for the T$80 million which relate to the revenue earning activities of TPTS, were allocated and apportioned to the other two subsidiaries.
Financing T RailwaysThe Government of Country T invested T$100 million when it formed T Railways in 1975. This is the only “share” capital that has ever been invested in T Railways. The financing model which has developed is that T Railways costs are guaranteed. This means that any overall operating deficit T Railways incurs on an annual basis is recovered by the T Railways Board through additional Government revenue funding.
Recognising that T Railways would need large amounts of funding to upgrade its infrastructure, the Government initially provided loans to cover capital expenditure. The loan facility was established to emphasise that any Government funding is a liability of T Railways and that T Railways must pay interest on the loan. The intention is that T Railways will also pay back the full amount of the Government loans in due course. The Government loans have no fixed repayment dates and are made to T Railways at a fixed rate of interest of 4% per year. This was the only source of capital funding for T Railways at its formation. However, following Government approval, the T Railways Board is now seeking to widen its sources of finance by, for example, obtaining loans from the banking and commercial sectors.
Key Performance Indicators (KPIs)In order to plan their activities to meet T Railways’ strategic objectives, its three subsidiaries operate a traditional accounting-led approach to strategic planning and management. All of the strategic planning and management activities of the three subsidiary companies are based upon meeting T Railways’ strategic objectives. A number of Key Performance Indicators have emerged to evaluate T Railways’ overall performance in achieving its strategic objectives.
Financial Strategy 5 May 2013
Examples of KPIs relating to TCL:
� The results of the national customer survey of all forms of public transport in Country T.� The number of customer complaints received. These are reported on T Railways’ website
every three months for the previous quarter.
Examples of KPIs relating to TFR:
� Train capacity utilisation, which measures the actual train load capacity utilised per journey against the total available load capacity for that journey.
� The number of trains arriving at their destination on time, measured as a percentage of total journeys made.
� Carbon emissions generated. The analysis of carbon emissions in freight transport is expressed in carbon dioxide emissions as a ratio of tonne per kilometre. That is, kilograms of carbon dioxide divided by weight transported multiplied by the distance travelled.
Examples of KPIs relating to TPTS:
� Number of delays per month to services due to signalling failure.� Number of complaints per month relating to station cleanliness.
There are also KPIs relating to safety issues which are shown below under the heading of Health and Safety.
Health and safetyT Railways concentrates a great deal of effort on the management of particular risks such as Signals Passed at Danger (SPAD) and customer and staff injuries. T Railways has a Safety Committee which meets regularly and monitors performance against its annual safety targets which have been agreed with the Ministry of Transport. Examples of the KPIs specifically relating to safety which are used by T Railways are:
� The number of customer movement accidents per million passenger kilometres, for example accidents caused due to the motion of trains.
� The number of customer non-movement accidents per million passenger journeys, for example slips and falls while on T Railways’ property.
� The number of accidents or injuries sustained by staff per million kilometres travelled.
The KPIs relating to safety issues are reported in T Railways’ annual report which accompanies its financial statements.
Environmental considerationsThe transport industry’s carbon emissions are responsible for between 20% and 25% of all carbon emissions in Country T. In response to initiatives developed by the Rail Regulator, T Railways is increasing its efforts to reduce its levels of carbon emissions. T Railways is committed to reducing its carbon emissions by a third between now and 2015. In addition, all TCL and TFR drivers receive eco-driving training on an ongoing basis. (Eco-driving is driving in a manner that minimises fuel consumption.) TPTS is progressing work on making stations and depots energy efficient by improving lighting and heating systems including the use of intelligent lighting which automatically increases or decreases light output depending on the amount of natural light feeding into the sensors.
All three subsidiaries are keen to reduce waste and to increase the amount of waste they recycle. Each subsidiary is committed to helping to meet an overall target set by the T Railways Board of recycling 85% of T Railways’ total waste by 2015.
May 2013 6 Financial Strategy
Development of T RailwaysThe T Railways Board is constantly seeking ways of generating additional sources of revenue. Consideration is being given to a number of possible initiatives. Some ideas under consideration include:
� structural changes such as splitting T Railways up into its constituent parts and running the three subsidiaries as completely separate entities;
� expansion of the network;� diversifying the portfolio through operating other forms of transport;� outsourcing some or all of the current provision of passenger, freight, track, property or retail
related services or privatising parts of the business.
The Government has considered privatising the whole of T Railways but so far has been wary of the British experience where ownership and operation of the rail network became very fragmented after privatisation and operations were split across more than 100 companies. However, possible privatisation of T Railways continues to be discussed within Government and Country T’s Prime Minister has never ruled it out.
Financial Strategy 7 May 2013
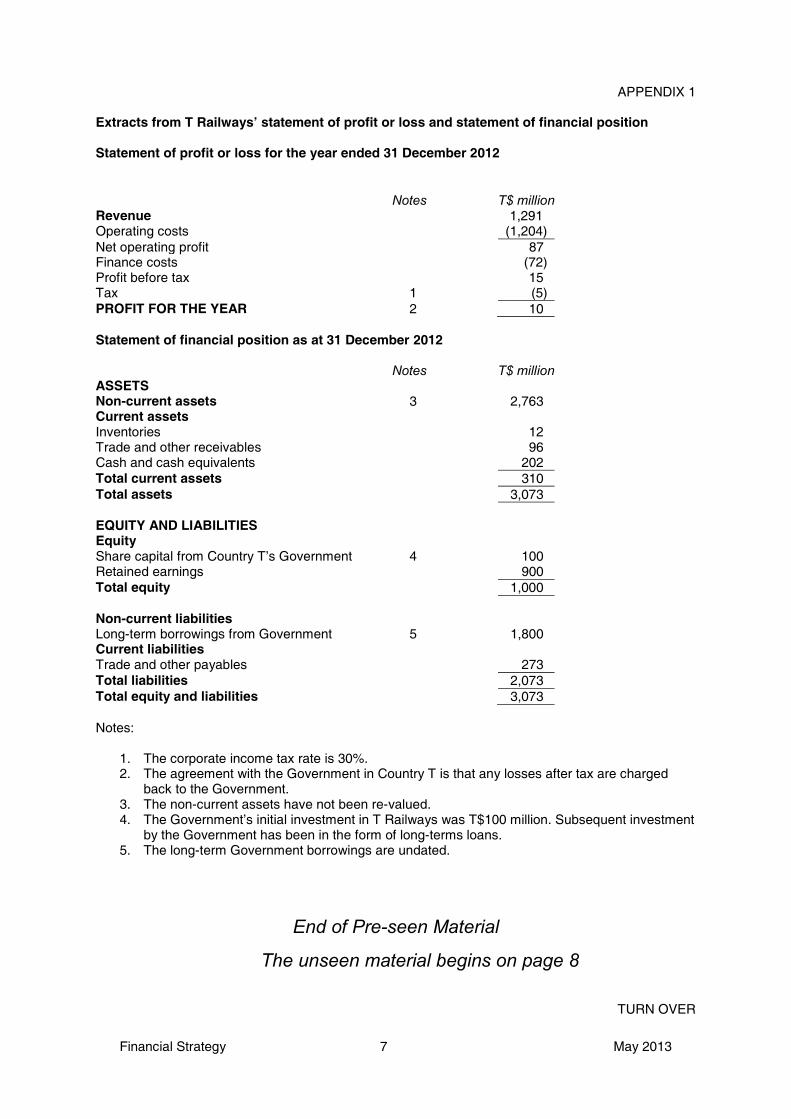
APPENDIX 1
Extracts from T Railways’ statement of profit or loss and statement of financial position
Statement of profit or loss for the year ended 31 December 2012
Notes T$ millionRevenue 1,291Operating costs (1,204)Net operating profit 87Finance costs (72)Profit before tax 15Tax 1 (5)PROFIT FOR THE YEAR 2 10
Statement of financial position as at 31 December 2012
Notes T$ millionASSETSNon-current assets 3 2,763Current assetsInventories 12Trade and other receivables 96Cash and cash equivalents 202Total current assets 310Total assets 3,073
EQUITY AND LIABILITIESEquityShare capital from Country T’s Government 4 100Retained earnings 900Total equity 1,000
Non-current liabilitiesLong-term borrowings from Government 5 1,800Current liabilitiesTrade and other payables 273Total liabilities 2,073Total equity and liabilities 3,073
Notes:
1. The corporate income tax rate is 30%.2. The agreement with the Government in Country T is that any losses after tax are charged
back to the Government.3. The non-current assets have not been re-valued.4. The Government’s initial investment in T Railways was T$100 million. Subsequent investment
by the Government has been in the form of long-terms loans. 5. The long-term Government borrowings are undated.
End of Pre-seen Material
The unseen material begins on page 8
TURN OVER
May 2013 8 Financial Strategy
SECTION A – 50 MARKS
[You are advised to spend no longer than 90 minutes on this question.]
ANSWER THIS QUESTION. THE QUESTION REQUIREMENTS ARE ON PAGE 11, WHICH IS DETACHABLE FOR EASE OF REFERENCE
Question One
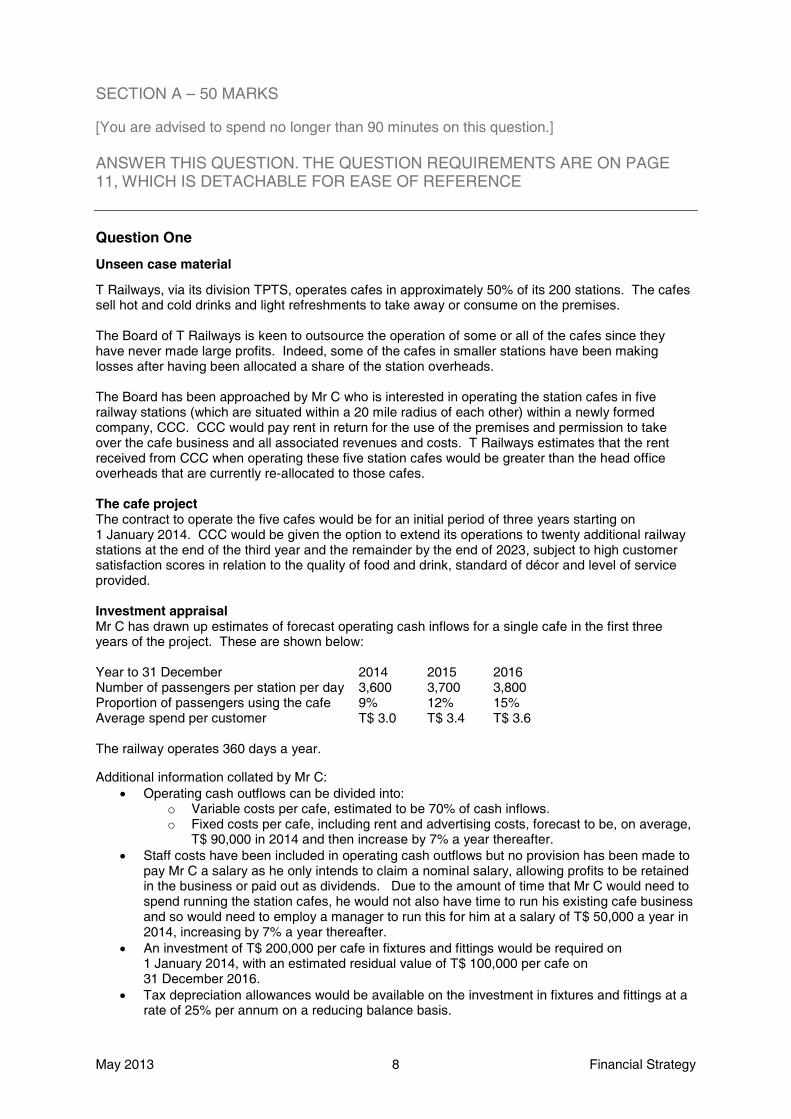
Unseen case material
T Railways, via its division TPTS, operates cafes in approximately 50% of its 200 stations. The cafes sell hot and cold drinks and light refreshments to take away or consume on the premises.
The Board of T Railways is keen to outsource the operation of some or all of the cafes since theyhave never made large profits. Indeed, some of the cafes in smaller stations have been making losses after having been allocated a share of the station overheads.
The Board has been approached by Mr C who is interested in operating the station cafes in fiverailway stations (which are situated within a 20 mile radius of each other) within a newly formed company, CCC. CCC would pay rent in return for the use of the premises and permission to take over the cafe business and all associated revenues and costs. T Railways estimates that the rent received from CCC when operating these five station cafes would be greater than the head office overheads that are currently re-allocated to those cafes.
The cafe projectThe contract to operate the five cafes would be for an initial period of three years starting on 1 January 2014. CCC would be given the option to extend its operations to twenty additional railwaystations at the end of the third year and the remainder by the end of 2023, subject to high customer satisfaction scores in relation to the quality of food and drink, standard of décor and level of service provided.
Investment appraisalMr C has drawn up estimates of forecast operating cash inflows for a single cafe in the first threeyears of the project. These are shown below:
Year to 31 December 2014 2015 2016Number of passengers per station per day 3,600 3,700 3,800Proportion of passengers using the cafe 9% 12% 15%Average spend per customer T$ 3.0 T$ 3.4 T$ 3.6
The railway operates 360 days a year.
Additional information collated by Mr C:� Operating cash outflows can be divided into:
o Variable costs per cafe, estimated to be 70% of cash inflows. o Fixed costs per cafe, including rent and advertising costs, forecast to be, on average,
T$ 90,000 in 2014 and then increase by 7% a year thereafter.� Staff costs have been included in operating cash outflows but no provision has been made to
pay Mr C a salary as he only intends to claim a nominal salary, allowing profits to be retained in the business or paid out as dividends. Due to the amount of time that Mr C would need to spend running the station cafes, he would not also have time to run his existing cafe business and so would need to employ a manager to run this for him at a salary of T$ 50,000 a year in 2014, increasing by 7% a year thereafter.
� An investment of T$ 200,000 per cafe in fixtures and fittings would be required on 1 January 2014, with an estimated residual value of T$ 100,000 per cafe on 31 December 2016.
� Tax depreciation allowances would be available on the investment in fixtures and fittings at a rate of 25% per annum on a reducing balance basis.
Financial Strategy 9 May 2013
� Corporate income tax would be charged at 30% of taxable profits and would be payable at the end of the year in which the taxable profit arises.
� All revenues and costs should be assumed to be cash flows and arise at the end of the year unless otherwise stated.
� The risk free rate is 3% and the market premium is 5%.� A national chain of cafes that is 100% equity financed has a published equity beta of 1.28.
Mr C intends to use this information to calculate a cost of equity for CCC.
Financing the projectMr C is planning to finance the project 50% from his own savings and 50% from a fixed term bank loan. He estimates that a bank would charge interest of 5.7% a year on a loan, implying a debt beta for CCC of 0.54. However, Mr C has not yet applied to the bank for a loan. If the bank is not willing to provide funding, Mr C has sufficient personal resources to be able to finance the initial stage, that is, the investment in the first five cafes.
T RailwaysExtracts from T Railways’ statement of profit or loss and statement of financial position are found on page 7 of the pre-seen material. T Railways’ strategic and financial objectives are given on pages 3 and 4 of the pre-seen material.
The requirement for question one is on page 11
TURN OVER

May 2013 10 Financial Strategy
This page is blank

Financial Strategy 11 May 2013
(Total for Section A = 50 marks)
End of Section A
Section B begins on page 14
TURN OVER
Required:
(a) Advise T Railways of:
� The ways in which the financial objectives of a private enterprise such as CCC are likely to differ from those of T Railways.
� The potential benefits and risks for T Railways of allowing CCC to operate thestation cafes.
(9 marks)
(b) Assume you are a management consultant reporting to Mr C. Write a report in which you:
(i) Calculate the following measures in respect of the proposed investment by CCC in five cafes for the initial three year contract as at 1 January 2014:
� Net Present Value (NPV)� Internal Rate of Return (IRR)� Payback
Your answer to this section should assume that bank finance is available and should ignore real options.
(19 marks)
(ii) Evaluate the potential financial benefit of the project to Mr C. Your answer should consider your results in (b)(i), real options and other relevant factors.
(12 marks)
(iii) Advise Mr C on the challenges that CCC might face in obtaining a bank loan to finance the project.
(7 marks)
Additional marks available for structure and presentation: (3 marks)
(Total for Question One = 50 marks)

May 2013 12 Financial Strategy
This page is blank

Financial Strategy 13 May 2013
This page is blank
TURN OVER
May 2013 14 Financial Strategy
SECTION B – 50 MARKS
[You are advised to spend no longer than 45 minutes on each question in this section.]
ANSWER TWO OF THE THREE QUESTIONS
Question Two
PPP is a quoted company which specialises in metal-working using machines for forging metal. One of the machines is due to be replaced on 30 June 2013, the last day of PPP’s current financial year.An investment appraisal exercise has recently been completed which confirmed that it is financially beneficial to replace the machine at this point. PPP is now considering how best to finance the acquisition of the replacement machine. PPP is already highly geared.
Two possible vendors have been identified. Both vendors have offered the same price if the machine is purchased outright. However, one of the vendors has offered to structure the transaction in the form of a finance lease at an attractive implied interest rate.
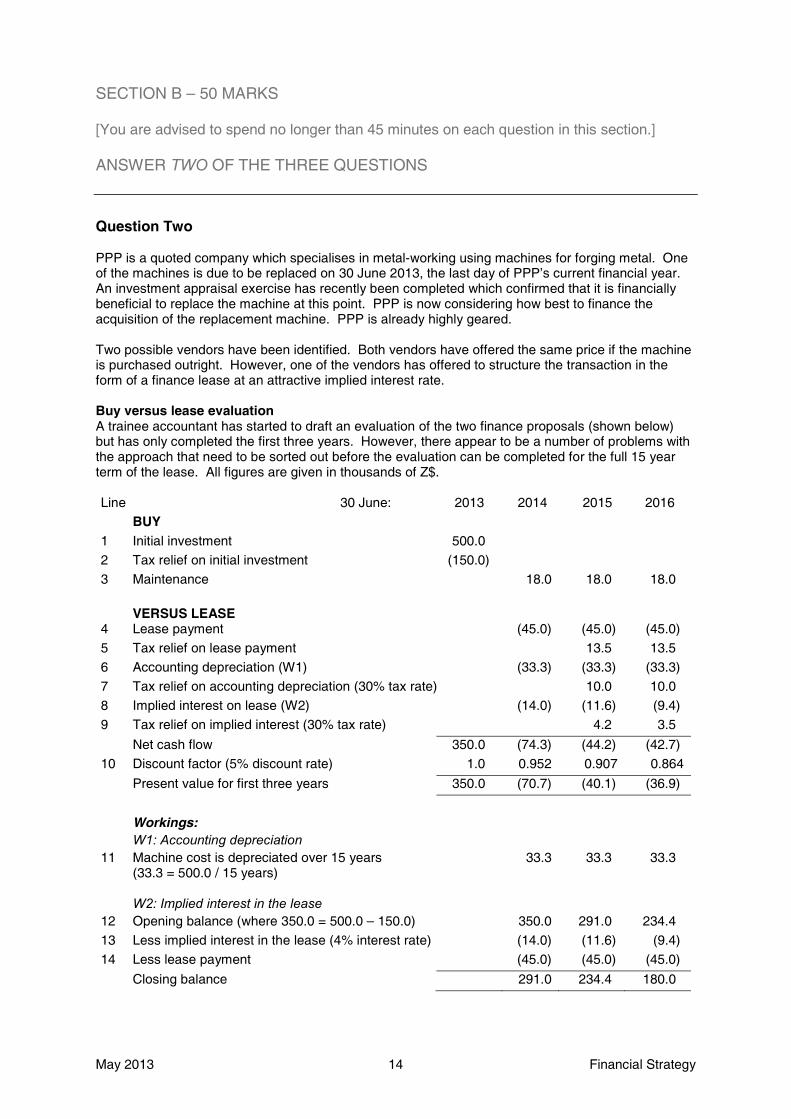
Buy versus lease evaluationA trainee accountant has started to draft an evaluation of the two finance proposals (shown below)but has only completed the first three years. However, there appear to be a number of problems withthe approach that need to be sorted out before the evaluation can be completed for the full 15 year term of the lease. All figures are given in thousands of Z$.
Line 30 June: 2013 2014 2015 2016BUY
1 Initial investment 500.0
2 Tax relief on initial investment (150.0)
3 Maintenance 18.0 18.0 18.0
VERSUS LEASE4 Lease payment (45.0) (45.0) (45.0)
5 Tax relief on lease payment 13.5 13.5
6 Accounting depreciation (W1) (33.3) (33.3) (33.3)
7 Tax relief on accounting depreciation (30% tax rate) 10.0 10.0
8 Implied interest on lease (W2) (14.0) (11.6) (9.4)
9 Tax relief on implied interest (30% tax rate) 4.2 3.5
Net cash flow 350.0 (74.3) (44.2) (42.7)
10 Discount factor (5% discount rate) 1.0 0.952 0.907 0.864
Present value for first three years 350.0 (70.7) (40.1) (36.9)
Workings: W1: Accounting depreciation
11 Machine cost is depreciated over 15 years (33.3 = 500.0 / 15 years)
33.3 33.3 33.3
W2: Implied interest in the lease12 Opening balance (where 350.0 = 500.0 – 150.0) 350.0 291.0 234.4
13 Less implied interest in the lease (4% interest rate) (14.0) (11.6) (9.4)
14 Less lease payment (45.0) (45.0) (45.0)
Closing balance 291.0 234.4 180.0

Financial Strategy 15 May 2013
Additional informationIf the machine were purchased outright:
� Fixed rate bank borrowings would be available for the full initial investment of Z$ 500,000 on 30 June 2013 at an interest rate of 5%.
� PPP would account for depreciation on the capital expenditure required to buy the new machine on a straight line basis over its estimated 15 years of useful life.
If leased under a finance lease arrangement:� The annual lease payment would be Z$ 45,000, with the first payment due on 30 June 2014.� Ownership of the machine would revert to the leasing company at the end of the lease period.
Whether leased or purchased outright:� Maintenance would remain the responsibility of PPP and would be of the order of Z$ 18,000
per annum.� Except for the initial investment, all cash flows should be assumed to arise at the end of the
year to which they relate.
Tax regime applicable to PPP:� PPP pays corporate income tax at a rate of 30%, payable annually at the end of the year
following that in which the tax charge or tax saving arises. � If the machine is purchased outright, PPP would be able to claim 100% tax depreciation
allowances in the financial year in which the expenditure is incurred.� If acquired under a finance lease, both accounting depreciation and the implied interest
charge would be tax deductible.� Assume that PPP has sufficient taxable profits to benefit from any tax savings arising.
TURN OVER
Required:
(a) Demonstrate that the implied interest in the lease is 4%. (3 marks)
(b) (i) Identify, from the numbered lines of data in the buy versus lease evaluation provided:� FOUR lines that should not have been included in the evaluation.� FOUR lines that contain an error.
(8 marks)
(ii) Advise the trainee accountant how the lines of data identified in (b)(i) as containing an error should be corrected.(You do not need to provide a full restatement of the evaluation.)
(7 marks)
(c) Advise PPP what factors are likely to influence the choice between the finance lease and bank borrowings to finance the acquisition of the new machine.
(7 marks)
(Total for Question Two = 25 marks)
A REPORT FORMAT IS NOT REQUIRED FOR THIS QUESTION

May 2013 16 Financial Strategy
Question Three
Company BBB is one of Country B’s largest house-builders. In 2012, BBB sold over 9,000 houses,ranging from apartment buildings to individual family houses.
Customer satisfaction is considered key to the future success of the business and the company invests considerable resources in planning and delivering new homes to match customer demand. Customer demand depends heavily on property prices and on both the availability and affordability of mortgage finance.
Up-front costs for BBB are considerable. Substantial capital investment is needed between purchasing the land for development and receiving payment for the houses. BBB therefore requires considerable borrowings and equity funding to support its operations.
Over the last ten years, house prices have risen steadily and the house-building industry has generally performed well. This has enabled BBB to reduce its dependence on debt finance.
There has, however, been some discussion amongst Board members regarding the capital structure of the company. Indeed, management consultants employed to review the company’s financial management have recently recommended that BBB increase its gearing to a more efficient level.This would decrease the weighted average cost of capital (WACC) and hence increase company value.
The consultants have undertaken a full review of historical financial data for both BBB and the wider house-building industry and have estimated that the theoretical gearing level (debt to debt plus equity) at which WACC is minimised is around 60% for BBB.
There has been some extensive debate by the Board concerning the consultants’ advice. TheFinance Director, in particular, is very concerned about increasing gearing at all in the increasingly uncertain economic climate where interest rates are forecast to rise and banks are reluctant to provide companies with new funding.
Financial data for BBBBBB has 150 million ordinary B$1 shares in issue (where B$ is the currency in Country B). The shares are currently trading at B$12.83 per share. The cost of equity is estimated to be 8%.
BBB also has the following debt finance:� B$300 million floating rate bank loan maturing in 8 years’ time with annual interest set at
12 month interbank rates plus 2%. The 12 month interbank rate is currently 3% per annum.� B$500 million of bonds currently trading at B$105 and a yield of 5%.
BBB pays corporate income tax at a rate of 33% on taxable profits.

Financial Strategy 17 May 2013
TURN OVER
Required:
(a) (i) Explain the relationship between WACC and entity value.(3 marks)
(ii) Calculate BBB’s current:� Gearing (based on market values and measured as debt/debt+equity).� WACC.
(5 marks)
(iii) Calculate, using Modigliani and Miller’s (MM’s) theory with tax, the theoretical reduction in BBB’s WACC if gearing were to be increased to 60%.
(6 marks)
(b) Evaluate the Finance Director’s stated opinion that BBB’s gearing should not be increased in the current economic climate. Your answer should take into account:
� The risk profile of BBB.� Practical considerations affecting the optimum choice of gearing.
(11 marks)
(Total for Question Three = 25 marks)
A REPORT FORMAT IS NOT REQUIRED FOR THIS QUESTION

May 2013 18 Financial Strategy
Question Four
NN is an international sports clothing and footwear manufacturer listed on a stock exchange in the USA. NN owns various sports brand names and arranges for sports clothing products bearing these brand names to be manufactured by companies in the Far East. NN then distributes and sells theproducts through wholesale and retail outlets worldwide.
NN’s high-tech brands, N1, N2 and N3, are the only brands that are sold in its expensive high profile main stores in London, Paris, New York and Tokyo. As well as the high-tech brands, NN also owns brand N4, a low-tech and low cost brand that was acquired in 2007.
Brand N4In the first full year after N4 was acquired, N4 generated total revenue of USD 246 million. Despite investment and marketing campaigns, N4 has failed to show consistent growth in revenue and profitsince it was acquired. Indeed, in the year ended 31 March 2013, annual revenues for N4 were lower than 2007 levels, at just USD 190 million, and N4 reported an after tax loss of USD 41 million after charging central overheads of USD 21 million. NN expects this level of loss to continue for the foreseeable future.
Potential sale of N4 to QQAt the start of 2013, NN announced that it was interested in selling the N4 brand name. Company QQimmediately expressed an interest in buying it.
QQ operates in a different type of market to NN. The brands that QQ owns are mostly at the low costend of the sports clothing market and are marketed through less prestigious retail outlets such as hypermarket stores in cheaper out of town locations. These low price stores focus on selling large quantities of low cost goods at the lowest possible price. The stores favoured by QQ keep costs low by spending less on display and marketing and being located in cheaper out-of-town areas. Their customer base largely comprises lower income families but the stores also attract higher earners who are looking for goods at a bargain price.
QQ focuses on minimising costs, including less spent on advertising and promotion than NN. It has a few dedicated stores but does not maintain high profile stores in key capital cities.
QQ’s valuation of N4The directors of QQ have conservatively estimated that, under QQ’s cost structure and management,N4 can be expected to generate free cash flow of USD 22 million per annum, based on zero growth in real terms.
Financial data for both NN and QQ as at close of business on 30 April 2013NN position:
� 6,000 million ordinary USD 0.50 (nominal) shares in issue.� Estimated ‘real’ weighted average cost of capital (WACC) of 8%.� Gearing of 40% (debt/debt plus equity, market values).
QQ position:� 1,800 million ordinary USD 1.00 (nominal) shares in issue. � Estimated ‘real’ WACC of 6%.� Gearing of 50% (debt/debt plus equity, market values).
The issued share capital for both NN and QQ remained unchanged on 1 May 2013.
Details of the sale of N4After a period of negotiation and due diligence, QQ submitted an offer to NN on 1 May 2013 to purchase N4 at an offer price of USD 150 million. By prior arrangement, this offer was accepted on the same day. Details of the sale were immediately released into the public domain, including the price agreed.
On that same day, 1 May 2013, the day that the offer became public, NN’s shares moved up 6 cents in New York, closing at USD 87.23 per share, and QQ’s shares gained 1.5%, closing at USD 15.53per share.
Financial Strategy 19 May 2013
Mr Q’s queriesMr Q is a newly appointed non-executive director of QQ and he has expressed some concerns about the proposed purchase of N4 which the Finance Director of QQ needs to address. These concerns are listed below:
1. How is it possible that the share price of both QQ and NN increased on the day that the sale was announced?
2. How can QQ expect to generate higher profits from N4 than NN was able to? 3. What courses of action are open to QQ if it fails to generate sufficient returns from N4?
(Total for Section B = 50 marks)
End of Question Paper
Maths tables and formulae are on pages 21 to 25
Required:
(a) (i) Calculate the value of N4 from the viewpoint of both NN and QQ based on discounted cash flow (DCF) analysis as at 1 May 2013.
(4 marks)
(ii) Evaluate the market’s reaction to the proposed sale of N4 AND how this compares to your results in (a)(i) above. Your answer should include a calculation of the increase in market capitalisation for both NN and QQ on 1 May 2013.
(9 marks)
(b) Produce a response to Mr Q, assuming you are the Finance Director of QQ, in which you address each of Mr Q’s three concerns.
(12 marks)
(Total for Question Four = 25 marks)
A REPORT FORMAT IS NOT REQUIRED FOR THIS QUESTION

May 2013 20 Financial Strategy
This page is blank
Financial Strategy 21 May 2013
MATHS TABLES AND FORMULAE
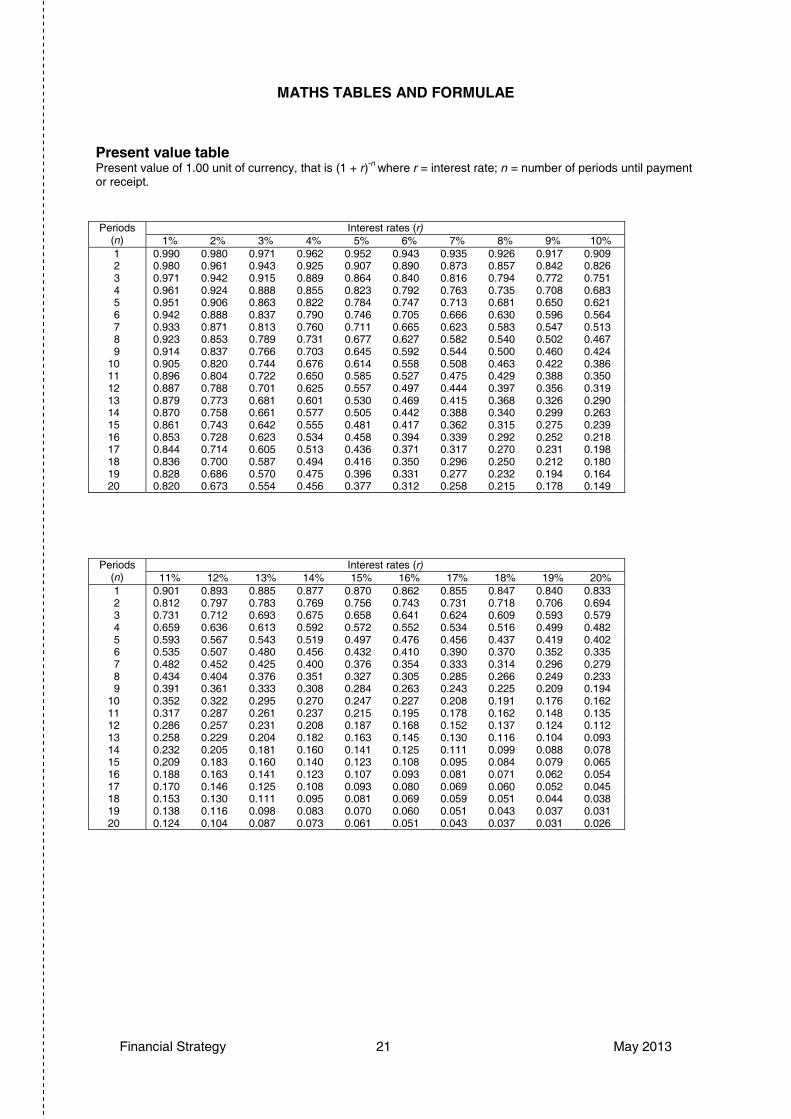
Present value tablePresent value of 1.00 unit of currency, that is (1 + r)-n where r = interest rate; n = number of periods until payment or receipt.
Periods(n)
Interest rates (r)1% 2% 3% 4% 5% 6% 7% 8% 9% 10%
1 0.990 0.980 0.971 0.962 0.952 0.943 0.935 0.926 0.917 0.9092 0.980 0.961 0.943 0.925 0.907 0.890 0.873 0.857 0.842 0.8263 0.971 0.942 0.915 0.889 0.864 0.840 0.816 0.794 0.772 0.7514 0.961 0.924 0.888 0.855 0.823 0.792 0.763 0.735 0.708 0.6835 0.951 0.906 0.863 0.822 0.784 0.747 0.713 0.681 0.650 0.6216 0.942 0.888 0.837 0.790 0.746 0.705 0.666 0.630 0.596 0.5647 0.933 0.871 0.813 0.760 0.711 0.665 0.623 0.583 0.547 0.5138 0.923 0.853 0.789 0.731 0.677 0.627 0.582 0.540 0.502 0.4679 0.914 0.837 0.766 0.703 0.645 0.592 0.544 0.500 0.460 0.424
10 0.905 0.820 0.744 0.676 0.614 0.558 0.508 0.463 0.422 0.38611 0.896 0.804 0.722 0.650 0.585 0.527 0.475 0.429 0.388 0.35012 0.887 0.788 0.701 0.625 0.557 0.497 0.444 0.397 0.356 0.31913 0.879 0.773 0.681 0.601 0.530 0.469 0.415 0.368 0.326 0.29014 0.870 0.758 0.661 0.577 0.505 0.442 0.388 0.340 0.299 0.26315 0.861 0.743 0.642 0.555 0.481 0.417 0.362 0.315 0.275 0.23916 0.853 0.728 0.623 0.534 0.458 0.394 0.339 0.292 0.252 0.21817 0.844 0.714 0.605 0.513 0.436 0.371 0.317 0.270 0.231 0.19818 0.836 0.700 0.587 0.494 0.416 0.350 0.296 0.250 0.212 0.18019 0.828 0.686 0.570 0.475 0.396 0.331 0.277 0.232 0.194 0.16420 0.820 0.673 0.554 0.456 0.377 0.312 0.258 0.215 0.178 0.149
Periods(n)
Interest rates (r)11% 12% 13% 14% 15% 16% 17% 18% 19% 20%
1 0.901 0.893 0.885 0.877 0.870 0.862 0.855 0.847 0.840 0.8332 0.812 0.797 0.783 0.769 0.756 0.743 0.731 0.718 0.706 0.6943 0.731 0.712 0.693 0.675 0.658 0.641 0.624 0.609 0.593 0.5794 0.659 0.636 0.613 0.592 0.572 0.552 0.534 0.516 0.499 0.4825 0.593 0.567 0.543 0.519 0.497 0.476 0.456 0.437 0.419 0.4026 0.535 0.507 0.480 0.456 0.432 0.410 0.390 0.370 0.352 0.3357 0.482 0.452 0.425 0.400 0.376 0.354 0.333 0.314 0.296 0.2798 0.434 0.404 0.376 0.351 0.327 0.305 0.285 0.266 0.249 0.2339 0.391 0.361 0.333 0.308 0.284 0.263 0.243 0.225 0.209 0.194
10 0.352 0.322 0.295 0.270 0.247 0.227 0.208 0.191 0.176 0.16211 0.317 0.287 0.261 0.237 0.215 0.195 0.178 0.162 0.148 0.13512 0.286 0.257 0.231 0.208 0.187 0.168 0.152 0.137 0.124 0.11213 0.258 0.229 0.204 0.182 0.163 0.145 0.130 0.116 0.104 0.09314 0.232 0.205 0.181 0.160 0.141 0.125 0.111 0.099 0.088 0.07815 0.209 0.183 0.160 0.140 0.123 0.108 0.095 0.084 0.079 0.06516 0.188 0.163 0.141 0.123 0.107 0.093 0.081 0.071 0.062 0.05417 0.170 0.146 0.125 0.108 0.093 0.080 0.069 0.060 0.052 0.04518 0.153 0.130 0.111 0.095 0.081 0.069 0.059 0.051 0.044 0.03819 0.138 0.116 0.098 0.083 0.070 0.060 0.051 0.043 0.037 0.03120 0.124 0.104 0.087 0.073 0.061 0.051 0.043 0.037 0.031 0.026
May 2013 22 Financial Strategy
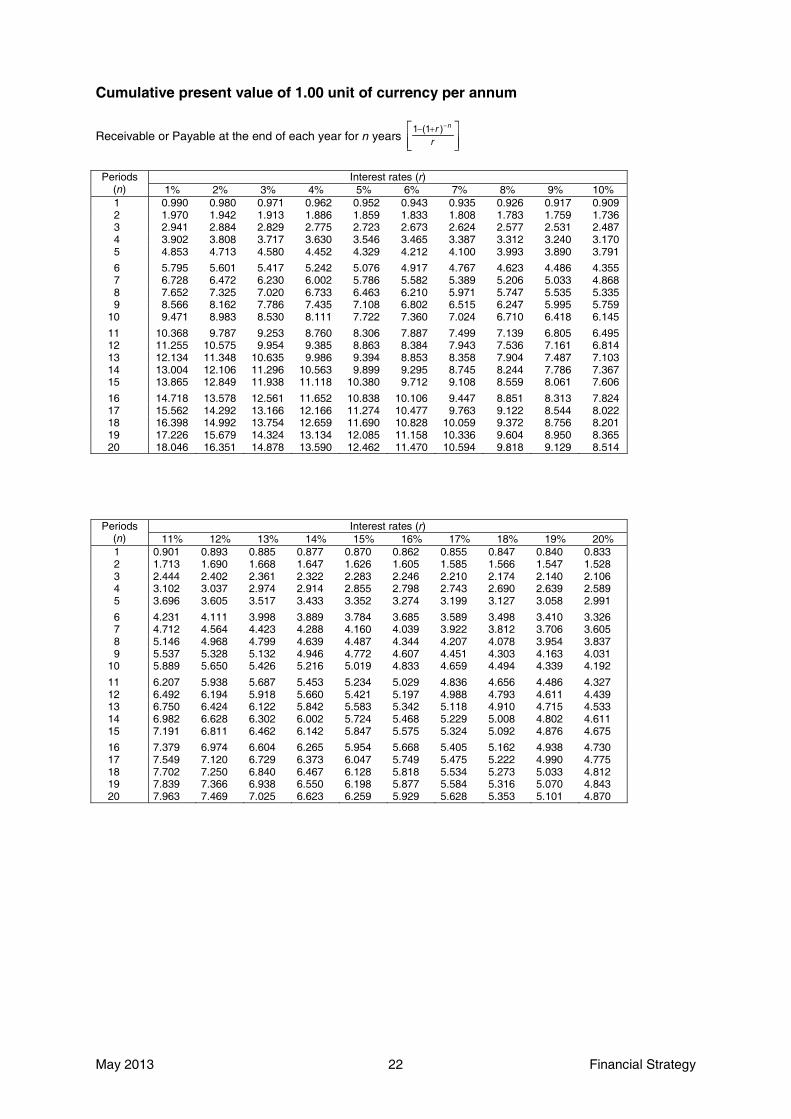
Cumulative present value of 1.00 unit of currency per annum
Receivable or Payable at the end of each year for n years
Periods(n)
Interest rates (r)1% 2% 3% 4% 5% 6% 7% 8% 9% 10%
1 0.990 0.980 0.971 0.962 0.952 0.943 0.935 0.926 0.917 0.9092 1.970 1.942 1.913 1.886 1.859 1.833 1.808 1.783 1.759 1.7363 2.941 2.884 2.829 2.775 2.723 2.673 2.624 2.577 2.531 2.4874 3.902 3.808 3.717 3.630 3.546 3.465 3.387 3.312 3.240 3.1705 4.853 4.713 4.580 4.452 4.329 4.212 4.100 3.993 3.890 3.791
6 5.795 5.601 5.417 5.242 5.076 4.917 4.767 4.623 4.486 4.3557 6.728 6.472 6.230 6.002 5.786 5.582 5.389 5.206 5.033 4.8688 7.652 7.325 7.020 6.733 6.463 6.210 5.971 5.747 5.535 5.3359 8.566 8.162 7.786 7.435 7.108 6.802 6.515 6.247 5.995 5.759
10 9.471 8.983 8.530 8.111 7.722 7.360 7.024 6.710 6.418 6.145
11 10.368 9.787 9.253 8.760 8.306 7.887 7.499 7.139 6.805 6.49512 11.255 10.575 9.954 9.385 8.863 8.384 7.943 7.536 7.161 6.81413 12.134 11.348 10.635 9.986 9.394 8.853 8.358 7.904 7.487 7.10314 13.004 12.106 11.296 10.563 9.899 9.295 8.745 8.244 7.786 7.36715 13.865 12.849 11.938 11.118 10.380 9.712 9.108 8.559 8.061 7.606
16 14.718 13.578 12.561 11.652 10.838 10.106 9.447 8.851 8.313 7.82417 15.562 14.292 13.166 12.166 11.274 10.477 9.763 9.122 8.544 8.02218 16.398 14.992 13.754 12.659 11.690 10.828 10.059 9.372 8.756 8.20119 17.226 15.679 14.324 13.134 12.085 11.158 10.336 9.604 8.950 8.36520 18.046 16.351 14.878 13.590 12.462 11.470 10.594 9.818 9.129 8.514
Periods(n)
Interest rates (r)11% 12% 13% 14% 15% 16% 17% 18% 19% 20%
1 0.901 0.893 0.885 0.877 0.870 0.862 0.855 0.847 0.840 0.8332 1.713 1.690 1.668 1.647 1.626 1.605 1.585 1.566 1.547 1.5283 2.444 2.402 2.361 2.322 2.283 2.246 2.210 2.174 2.140 2.1064 3.102 3.037 2.974 2.914 2.855 2.798 2.743 2.690 2.639 2.5895 3.696 3.605 3.517 3.433 3.352 3.274 3.199 3.127 3.058 2.991
6 4.231 4.111 3.998 3.889 3.784 3.685 3.589 3.498 3.410 3.3267 4.712 4.564 4.423 4.288 4.160 4.039 3.922 3.812 3.706 3.6058 5.146 4.968 4.799 4.639 4.487 4.344 4.207 4.078 3.954 3.8379 5.537 5.328 5.132 4.946 4.772 4.607 4.451 4.303 4.163 4.031
10 5.889 5.650 5.426 5.216 5.019 4.833 4.659 4.494 4.339 4.192
11 6.207 5.938 5.687 5.453 5.234 5.029 4.836 4.656 4.486 4.32712 6.492 6.194 5.918 5.660 5.421 5.197 4.988 4.793 4.611 4.43913 6.750 6.424 6.122 5.842 5.583 5.342 5.118 4.910 4.715 4.53314 6.982 6.628 6.302 6.002 5.724 5.468 5.229 5.008 4.802 4.61115 7.191 6.811 6.462 6.142 5.847 5.575 5.324 5.092 4.876 4.675
16 7.379 6.974 6.604 6.265 5.954 5.668 5.405 5.162 4.938 4.73017 7.549 7.120 6.729 6.373 6.047 5.749 5.475 5.222 4.990 4.77518 7.702 7.250 6.840 6.467 6.128 5.818 5.534 5.273 5.033 4.81219 7.839 7.366 6.938 6.550 6.198 5.877 5.584 5.316 5.070 4.84320 7.963 7.469 7.025 6.623 6.259 5.929 5.628 5.353 5.101 4.870
���
�� �
rr n)(11
Financial Strategy 23 May 2013
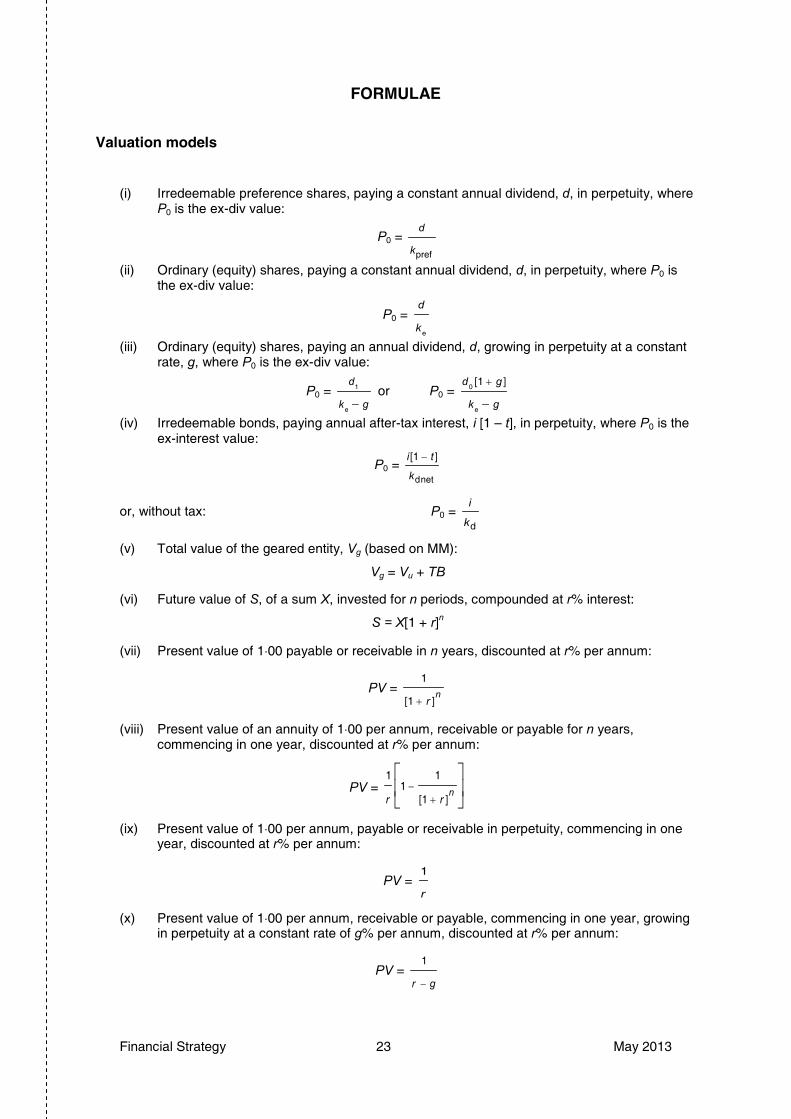
FORMULAE
Valuation models
(i) Irredeemable preference shares, paying a constant annual dividend, d, in perpetuity, where P0 is the ex-div value:
P0 =
(ii) Ordinary (equity) shares, paying a constant annual dividend, d, in perpetuity, where P0 is the ex-div value:
P0 =
(iii) Ordinary (equity) shares, paying an annual dividend, d, growing in perpetuity at a constant rate, g, where P0 is the ex-div value:
P0 =gk
d
e
1 or P0 =gk
gd
�
e
0][1
(iv) Irredeemable bonds, paying annual after-tax interest, i [1 – t], in perpetuity, where P0 is the ex-interest value:
P0 =
or, without tax: P0 =dk
i
(v) Total value of the geared entity, Vg (based on MM):
Vg = Vu + TB
(vi) Future value of S, of a sum X, invested for n periods, compounded at r% interest:
S = X[1 + r]n
(vii) Present value of 1�00 payable or receivable in n years, discounted at r% per annum:
PV =
(viii) Present value of an annuity of 1�00 per annum, receivable or payable for n years, commencing in one year, discounted at r% per annum:
PV =
(ix) Present value of 1�00 per annum, payable or receivable in perpetuity, commencing in one year, discounted at r% per annum:
PV =
(x) Present value of 1�00 per annum, receivable or payable, commencing in one year, growing in perpetuity at a constant rate of g% per annum, discounted at r% per annum:
PV =
prefk
d
ek
d
netd
][1
k
ti
nr ][1
1
�
��
���
�
nrr ][1
11
1
r
1
gr
1

May 2013 24 Financial Strategy
Cost of capital
(i) Cost of irredeemable preference shares, paying an annual dividend, d, in perpetuity, and having a current ex-div price P0:
kpref =
(ii) Cost of irredeemable bonds, paying annual net interest, i [1 – t], and having a current ex-interest price P0:
kd net =
(iii) Cost of ordinary (equity) shares, paying an annual dividend, d, in perpetuity, and having a current ex-div price P0:
ke =
(iv) Cost of ordinary (equity) shares, having a current ex-div price, P0, having just paid a dividend, d0, with the dividend growing in perpetuity by a constant g% per annum:
ke = gP
d�
0
1 or ke = gP
gd�
�
0
0]1[
(v) Cost of ordinary (equity) shares, using the CAPM:
ke = Rf + [Rm – Rf]ß
(vi) Cost of ordinary (equity) share capital in a geared entity :
keg = keu + [keu – kd]
(vii) Weighted average cost of capital, k0 or WACC
WACC = ke ��
���
��
���
�
��
DE
D
DE
E
VV
Vt
VV
Vdk ][1
(viii) Adjusted cost of capital (MM formula):
Kadj = keu [1 – tL] or r* = r[1 – T*L]
(ix) Ungear ß:
ßu = ßg ��
���
� ][1 tVV
V
DE
E + ßd ��
���
� ][1
][1
tVV
tV
DE
D
(x) Regear ß:
ßg = ßu + [ßu – ßd]E
DV
tV ][1
(xi) Adjusted discount rate to use in international capital budgeting (International Fisher effect)
A$/B$rateSpot
timemonths'12inA$/B$ratespot Future
A$ratediscount annual1
B$ratediscount annual1
�
�
where A$/B$ is the number of B$ to each A$
0P
d
0P
ti ][1
0P
d
E
DV
tV ][1

Financial Strategy 25 May 2013
Other formulae
(i) Expectations theory:
Future spot rate A$/B$ = Spot rate A$/B$ x rateinterestnominal1
rateinterestnominal1
countryA
countryB
�
�
where:
A$/B$ is the number of B$ to each A$, and
A$ is the currency of country A and B$ is the currency of country B
(ii) Purchasing power parity (law of one price):
Future spot rate A$B$ = Spot rate A$/B$ x
(iii) Link between nominal (money) and real interest rates:
[1 + nominal (money) rate] = [1 + real interest rate][1 + inflation rate]
(iv) Equivalent annual cost:
Equivalent annual cost =
(v) Theoretical ex-rights price:
TERP = 1
1
�N[(N x cum rights price) + issue price]
(vi) Value of a right:
N
priceissuepricerightsexlTheoretica
where N = number of rights required to buy one share.
rateinflation1
rateinflation1
countryA
countryB
�
�
factorannuityyear
yearsovercostsof
n
nPV

May 2013 26 Financial Strategy
This page is blank
Financial Strategy 27 May 2013
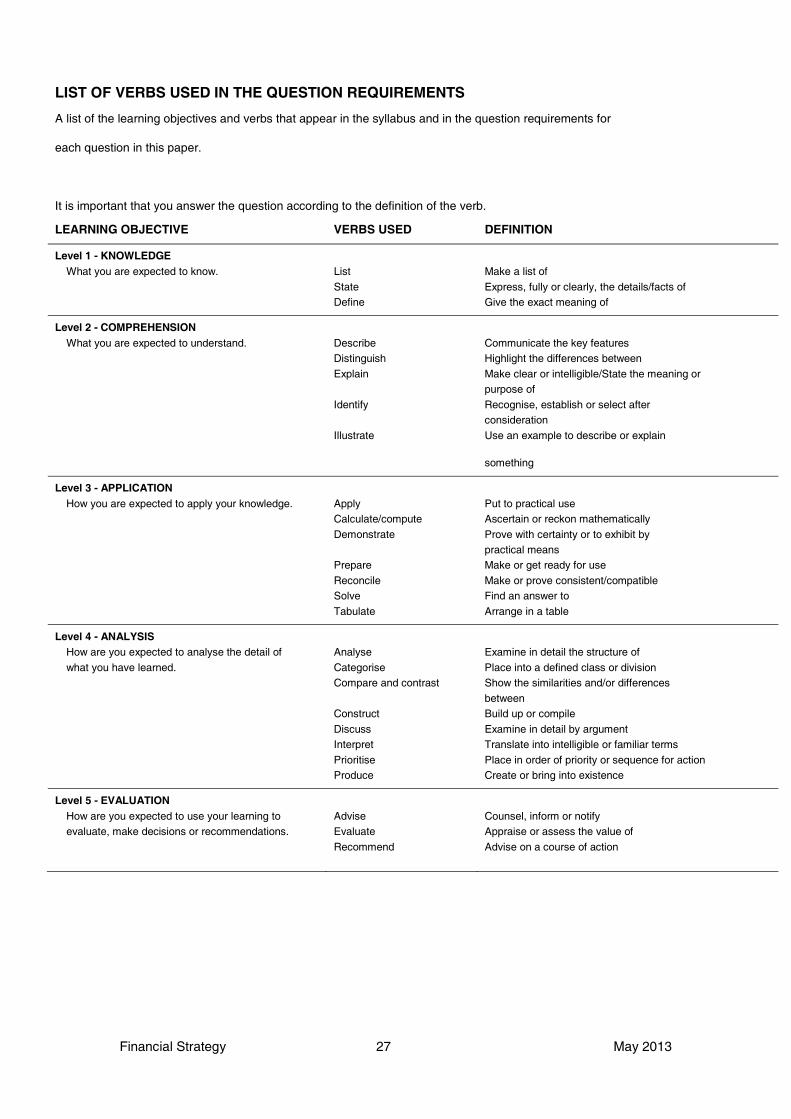
LIST OF VERBS USED IN THE QUESTION REQUIREMENTS
A list of the learning objectives and verbs that appear in the syllabus and in the question requirements for
each question in this paper.
It is important that you answer the question according to the definition of the verb.
LEARNING OBJECTIVE VERBS USED DEFINITION
Level 1 - KNOWLEDGEWhat you are expected to know. List Make a list of
State Express, fully or clearly, the details/facts ofDefine Give the exact meaning of
Level 2 - COMPREHENSIONWhat you are expected to understand. Describe Communicate the key features
Distinguish Highlight the differences between
Explain Make clear or intelligible/State the meaning or purpose of
Identify Recognise, establish or select afterconsideration
Illustrate Use an example to describe or explain
something
Level 3 - APPLICATIONHow you are expected to apply your knowledge. Apply
Calculate/computePut to practical useAscertain or reckon mathematically
Demonstrate Prove with certainty or to exhibit bypractical means
Prepare Make or get ready for use
Reconcile Make or prove consistent/compatibleSolve Find an answer to
Tabulate Arrange in a table
Level 4 - ANALYSISHow are you expected to analyse the detail of
what you have learned.
Analyse
Categorise
Examine in detail the structure of
Place into a defined class or divisionCompare and contrast Show the similarities and/or differences
betweenConstruct Build up or compile
Discuss Examine in detail by argumentInterpret
Prioritise
Translate into intelligible or familiar terms
Place in order of priority or sequence for actionProduce Create or bring into existence
Level 5 - EVALUATIONHow are you expected to use your learning toevaluate, make decisions or recommendations.
AdviseEvaluate
Recommend
Counsel, inform or notifyAppraise or assess the value of
Advise on a course of action
May 2013 28 Financial Strategy
Financial Pillar
Strategic Level Paper
F3 – Financial Strategy
May 2013
Thursday Morning Session