financial statementsmicrosites.caltex.com.au/.../financial-statements.pdfannual report 2016 75...
TRANSCRIPT
75ANNUAL REPORT 2016
Contents Primary statements Consolidated income statement
Consolidated statement of comprehensive income
Consolidated balance sheet
Consolidated statement of changes in equity
Consolidated cash flow statement
Notes to the financial statementsA Basis of preparation
B Results for the yearB1 Revenue and other income
B2 Costs and expenses
B3 Segment reporting
B4 Earnings per share
B5 Dividends
C Operating assets and liabilitiesC1 Receivables
C2 Inventories
C3 Intangibles
C4 Property, plant and equipment
C5 Payables
C6 Provisions
C7 Employee benefits
D Capital, funding and risk managementD1 Interest bearing liabilities
D2 Risk management
D3 Capital management
D4 Fair value of financial assets and liabilities
D5 Issued capital
E Taxation E1 Income tax expense
E2 Deferred tax
F Group structureF1 Controlled entities
F2 Business combinations
F3 Equity accounted investees
F4 Joint venture operations
F5 Parent entity disclosures
G Other informationG1 Commitments
G2 Contingent liabilities
G3 Related party disclosures
G4 Key management personnel
G5 Notes to the cash flow statement
G6 Auditor remuneration
G7 Net tangible assets per share
G8 New standards and interpretations not yet adopted
G9 Events subsequent to the end of the year
FINANCIAL STATEMENTS
76 CALTEX AUSTRALIA
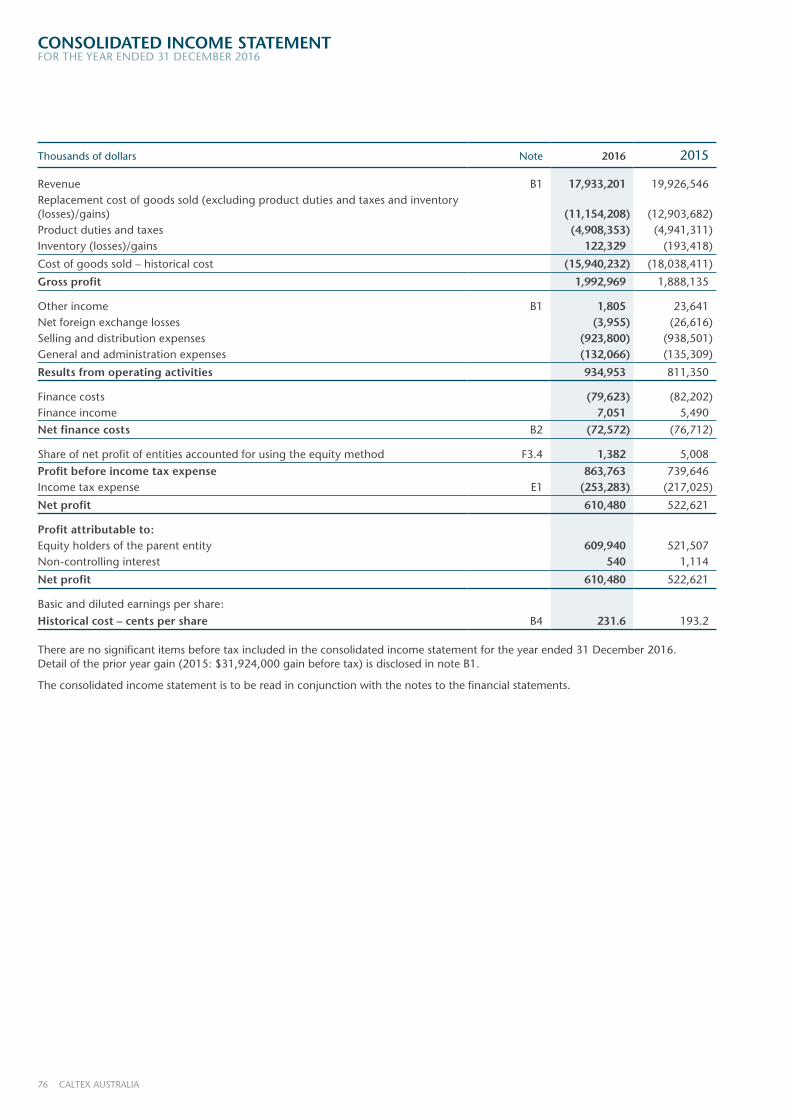
CONSOLIDATED INCOME STATEMENTFOR THE YEAR ENDED 31 DECEMBER 2016
Thousands of dollars Note 2016 2015
Revenue B1 17,933,201 19,926,546Replacement cost of goods sold (excluding product duties and taxes and inventory (losses)/gains) (11,154,208) (12,903,682)Product duties and taxes (4,908,353) (4,941,311)Inventory (losses)/gains 122,329 (193,418)
Cost of goods sold – historical cost (15,940,232) (18,038,411)
Gross profit 1,992,969 1,888,135
Other income B1 1,805 23,641Net foreign exchange losses (3,955) (26,616)Selling and distribution expenses (923,800) (938,501)General and administration expenses (132,066) (135,309)
Results from operating activities 934,953 811,350
Finance costs (79,623) (82,202)Finance income 7,051 5,490
Net finance costs B2 (72,572) (76,712)
Share of net profit of entities accounted for using the equity method F3.4 1,382 5,008
Profit before income tax expense 863,763 739,646Income tax expense E1 (253,283) (217,025)
Net profit 610,480 522,621
Profit attributable to:Equity holders of the parent entity 609,940 521,507Non-controlling interest 540 1,114
Net profit 610,480 522,621
Basic and diluted earnings per share:
Historical cost – cents per share B4 231.6 193.2
There are no significant items before tax included in the consolidated income statement for the year ended 31 December 2016. Detail of the prior year gain (2015: $31,924,000 gain before tax) is disclosed in note B1.
The consolidated income statement is to be read in conjunction with the notes to the financial statements.
77ANNUAL REPORT 2016
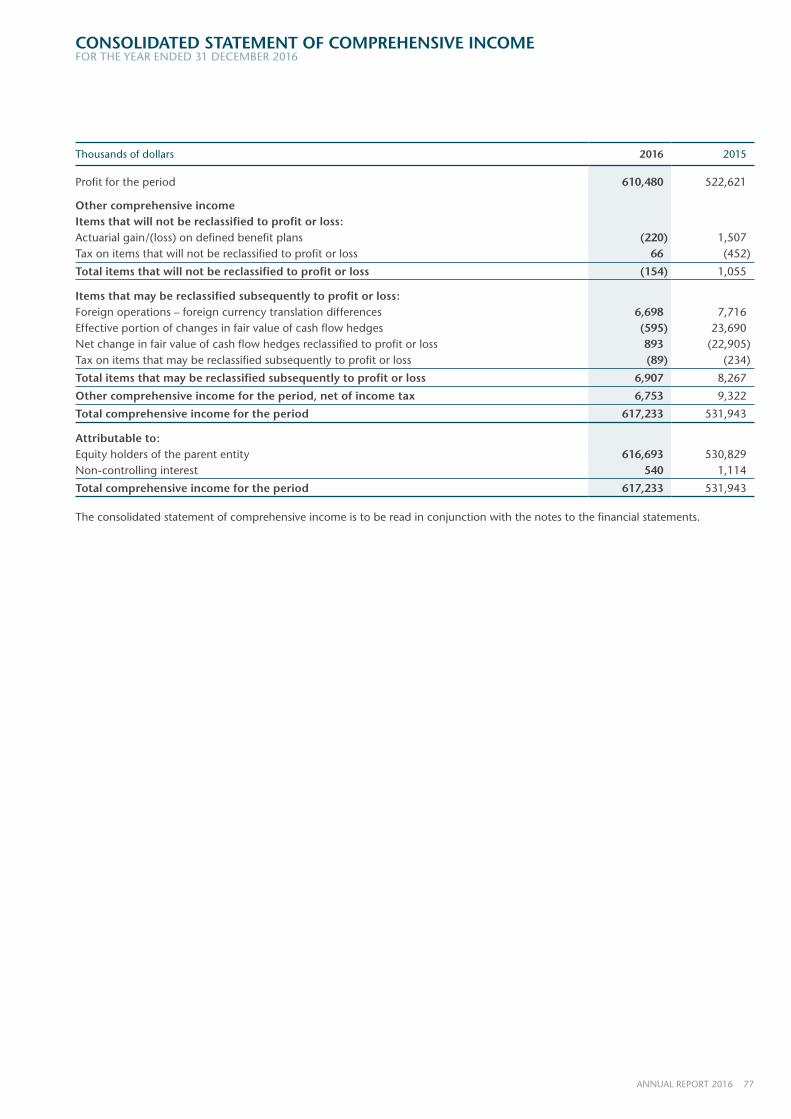
CONSOLIDATED STATEMENT OF COMPREHENSIVE INCOMEFOR THE YEAR ENDED 31 DECEMBER 2016
Thousands of dollars 2016 2015
Profit for the period 610,480 522,621
Other comprehensive incomeItems that will not be reclassified to profit or loss:Actuarial gain/(loss) on defined benefit plans (220) 1,507Tax on items that will not be reclassified to profit or loss 66 (452)
Total items that will not be reclassified to profit or loss (154) 1,055
Items that may be reclassified subsequently to profit or loss:Foreign operations – foreign currency translation differences 6,698 7,716Effective portion of changes in fair value of cash flow hedges (595) 23,690Net change in fair value of cash flow hedges reclassified to profit or loss 893 (22,905)Tax on items that may be reclassified subsequently to profit or loss (89) (234)
Total items that may be reclassified subsequently to profit or loss 6,907 8,267
Other comprehensive income for the period, net of income tax 6,753 9,322
Total comprehensive income for the period 617,233 531,943
Attributable to:Equity holders of the parent entity 616,693 530,829Non-controlling interest 540 1,114
Total comprehensive income for the period 617,233 531,943
The consolidated statement of comprehensive income is to be read in conjunction with the notes to the financial statements.
78 CALTEX AUSTRALIA
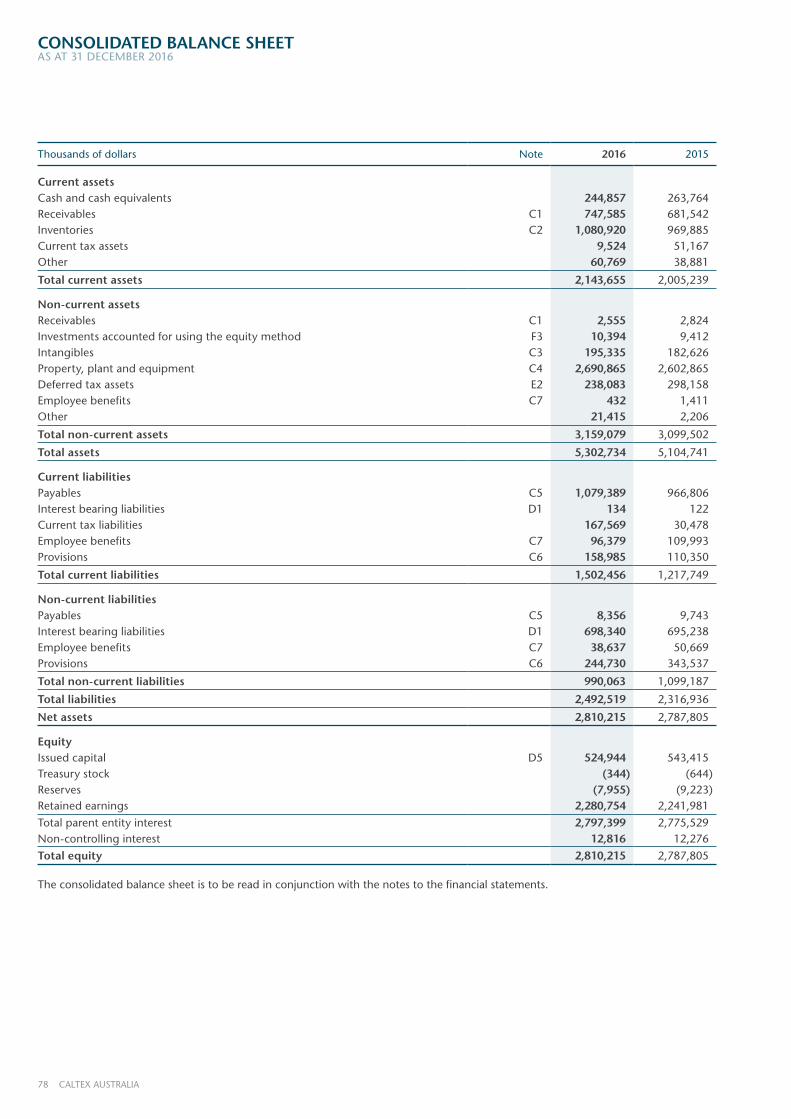
CONSOLIDATED BALANCE SHEETAS AT 31 DECEMBER 2016
Thousands of dollars Note 2016 2015
Current assetsCash and cash equivalents 244,857 263,764Receivables C1 747,585 681,542Inventories C2 1,080,920 969,885Current tax assets 9,524 51,167Other 60,769 38,881
Total current assets 2,143,655 2,005,239
Non-current assetsReceivables C1 2,555 2,824Investments accounted for using the equity method F3 10,394 9,412Intangibles C3 195,335 182,626Property, plant and equipment C4 2,690,865 2,602,865Deferred tax assets E2 238,083 298,158Employee benefits C7 432 1,411Other 21,415 2,206
Total non-current assets 3,159,079 3,099,502
Total assets 5,302,734 5,104,741
Current liabilitiesPayables C5 1,079,389 966,806Interest bearing liabilities D1 134 122Current tax liabilities 167,569 30,478Employee benefits C7 96,379 109,993Provisions C6 158,985 110,350
Total current liabilities 1,502,456 1,217,749
Non-current liabilitiesPayables C5 8,356 9,743Interest bearing liabilities D1 698,340 695,238Employee benefits C7 38,637 50,669Provisions C6 244,730 343,537
Total non-current liabilities 990,063 1,099,187
Total liabilities 2,492,519 2,316,936
Net assets 2,810,215 2,787,805
EquityIssued capital D5 524,944 543,415Treasury stock (344) (644)Reserves (7,955) (9,223)Retained earnings 2,280,754 2,241,981
Total parent entity interest 2,797,399 2,775,529Non-controlling interest 12,816 12,276
Total equity 2,810,215 2,787,805
The consolidated balance sheet is to be read in conjunction with the notes to the financial statements.
79ANNUAL REPORT 2016
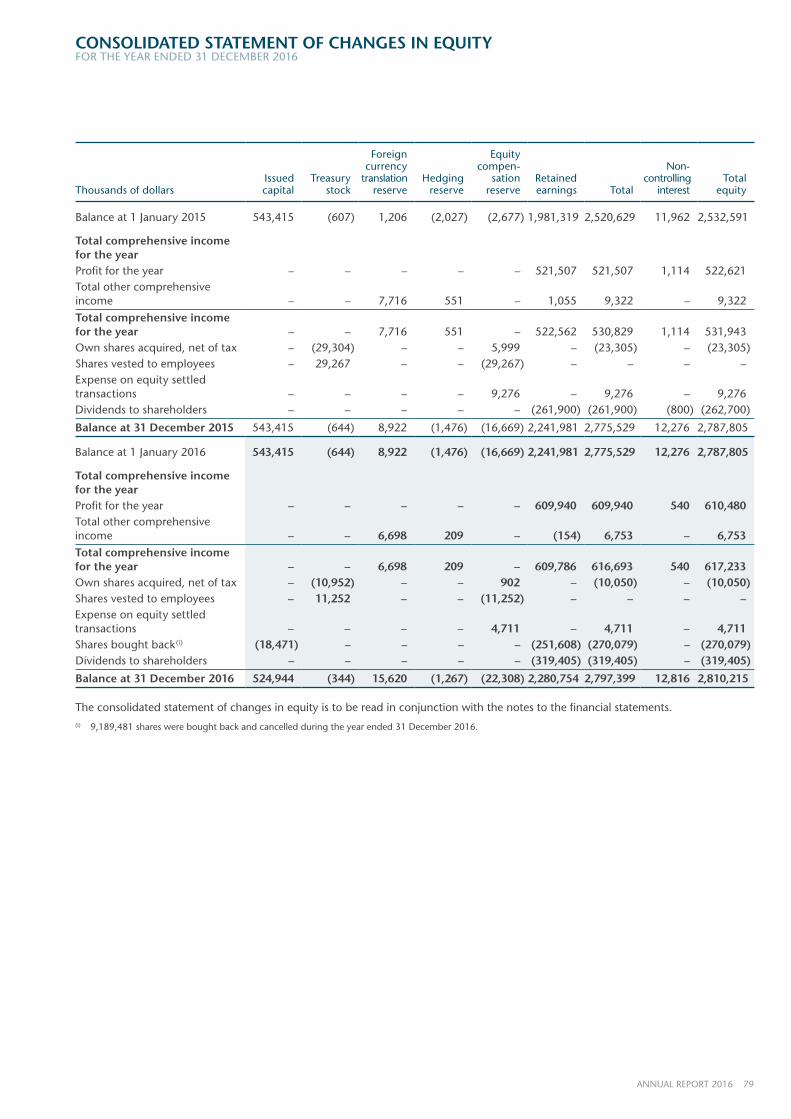
CONSOLIDATED STATEMENT OF CHANGES IN EQUITYFOR THE YEAR ENDED 31 DECEMBER 2016
Thousands of dollarsIssued
capitalTreasury
stock
Foreign currency
translation reserve
Hedging reserve
Equity compen-
sation reserve
Retained earnings Total
Non- controlling
interest Total
equity
Balance at 1 January 2015 543,415 (607) 1,206 (2,027) (2,677) 1,981,319 2,520,629 11,962 2,532,591
Total comprehensive income for the year Profit for the year – – – – – 521,507 521,507 1,114 522,621Total other comprehensive income – – 7,716 551 – 1,055 9,322 – 9,322
Total comprehensive income for the year – – 7,716 551 – 522,562 530,829 1,114 531,943Own shares acquired, net of tax – (29,304) – – 5,999 – (23,305) – (23,305)Shares vested to employees – 29,267 – – (29,267) – – – –Expense on equity settled transactions – – – – 9,276 – 9,276 – 9,276Dividends to shareholders – – – – – (261,900) (261,900) (800) (262,700)
Balance at 31 December 2015 543,415 (644) 8,922 (1,476) (16,669) 2,241,981 2,775,529 12,276 2,787,805
Balance at 1 January 2016 543,415 (644) 8,922 (1,476) (16,669) 2,241,981 2,775,529 12,276 2,787,805
Total comprehensive income for the year Profit for the year – – – – – 609,940 609,940 540 610,480Total other comprehensive income – – 6,698 209 – (154) 6,753 – 6,753Total comprehensive income for the year – – 6,698 209 – 609,786 616,693 540 617,233Own shares acquired, net of tax – (10,952) – – 902 – (10,050) – (10,050)Shares vested to employees – 11,252 – – (11,252) – – – –Expense on equity settled transactions – – – – 4,711 – 4,711 – 4,711Shares bought back(i) (18,471) – – – – (251,608) (270,079) – (270,079)Dividends to shareholders – – – – – (319,405) (319,405) – (319,405)
Balance at 31 December 2016 524,944 (344) 15,620 (1,267) (22,308) 2,280,754 2,797,399 12,816 2,810,215
The consolidated statement of changes in equity is to be read in conjunction with the notes to the financial statements.(i) 9,189,481 shares were bought back and cancelled during the year ended 31 December 2016.
80 CALTEX AUSTRALIA
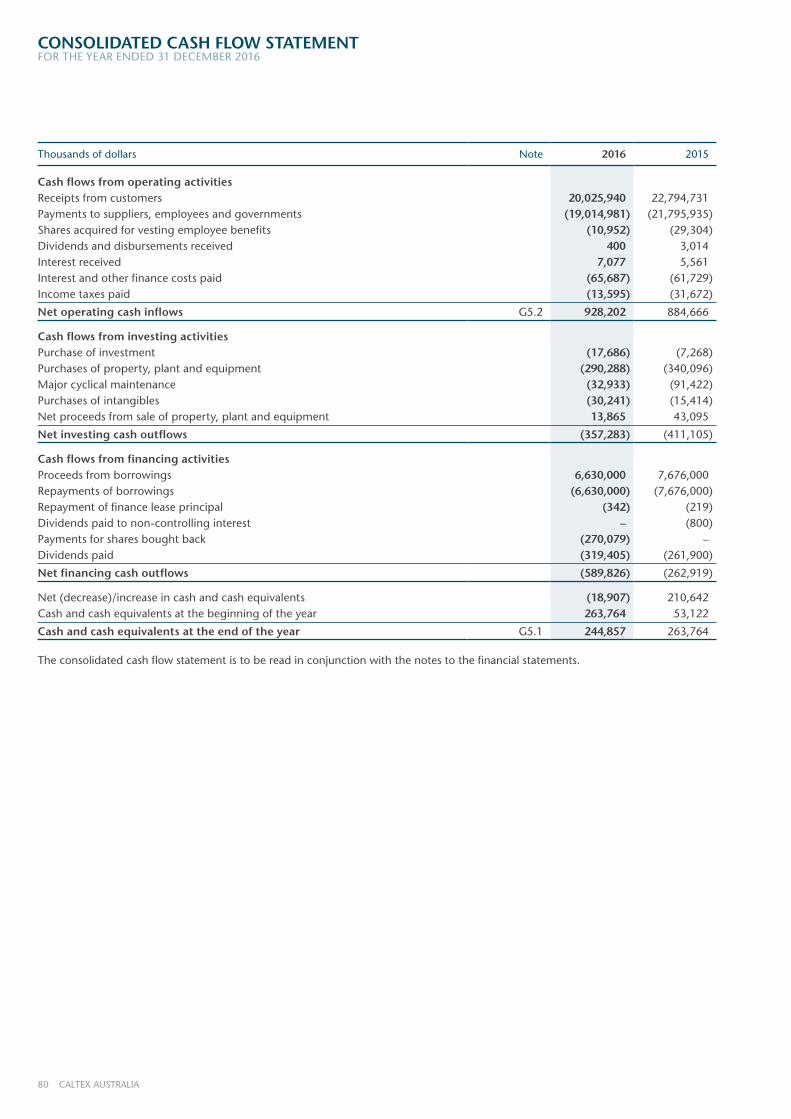
CONSOLIDATED CASH FLOW STATEMENTFOR THE YEAR ENDED 31 DECEMBER 2016
Thousands of dollars Note 2016 2015
Cash flows from operating activities Receipts from customers 20,025,940 22,794,731Payments to suppliers, employees and governments (19,014,981) (21,795,935)Shares acquired for vesting employee benefits (10,952) (29,304)Dividends and disbursements received 400 3,014Interest received 7,077 5,561Interest and other finance costs paid (65,687) (61,729)Income taxes paid (13,595) (31,672)
Net operating cash inflows G5.2 928,202 884,666
Cash flows from investing activitiesPurchase of investment (17,686) (7,268)Purchases of property, plant and equipment (290,288) (340,096)Major cyclical maintenance (32,933) (91,422)Purchases of intangibles (30,241) (15,414)Net proceeds from sale of property, plant and equipment 13,865 43,095
Net investing cash outflows (357,283) (411,105)
Cash flows from financing activitiesProceeds from borrowings 6,630,000 7,676,000Repayments of borrowings (6,630,000) (7,676,000)Repayment of finance lease principal (342) (219)Dividends paid to non-controlling interest – (800)Payments for shares bought back (270,079) –Dividends paid (319,405) (261,900)
Net financing cash outflows (589,826) (262,919)
Net (decrease)/increase in cash and cash equivalents (18,907) 210,642Cash and cash equivalents at the beginning of the year 263,764 53,122
Cash and cash equivalents at the end of the year G5.1 244,857 263,764
The consolidated cash flow statement is to be read in conjunction with the notes to the financial statements.
81ANNUAL REPORT 2016
NOTES TO THE FINANCIAL STATEMENTSA BASIS OF PREPARATIONFOR THE YEAR ENDED 31 DECEMBER 2016
Caltex Australia Limited (Caltex or company) is a company limited by shares, incorporated and domiciled in Australia. The shares of Caltex are publicly traded on the Australian Securities Exchange (ASX: CTX). The consolidated financial statements for the year ended 31 December 2016 comprise the company and its controlled entities (together referred to as the Caltex Group) and the Caltex Group’s interest in associates and jointly controlled entities. The Caltex Group is a for-profit entity and is primarily involved in the purchase, refining, distribution and marketing of petroleum products and the operation of convenience stores.
The consolidated financial statements were approved by the Caltex Board on 21 February 2017.
The financial report has been prepared as a general purpose financial report and complies with the requirements of the Corporations Act and Australian Accounting Standards (AASBs). The consolidated financial report also complies with International Financial Reporting Standards (IFRSs) adopted by the International Accounting Standards Board (IASB).
The consolidated financial report is prepared on the historical cost basis, except for derivative financial instruments which are measured at fair value, and the defined benefit liability which is recognised as the net total of the plan assets, plus unrecognised past service cost less the present value of the defined benefit obligation.
The consolidated financial report is presented in Australian dollars, which is the Caltex Group’s functional currency.
The company is of a kind referred to in ASIC Class Order 2016/191 dated 24 March 2016. In accordance with that Class Order, amounts in the consolidated financial report and Directors’ Report have been rounded to the nearest thousand dollars, unless otherwise stated.
The Caltex Group has adopted all the mandatory amended Accounting Standards issued that are relevant to its operations and effective for the current reporting period.
A number of new standards, amendments to standards and interpretations effective for annual periods beginning after 1 January 2017 have not been applied in preparing these consolidated financial statements. Refer to note G8.
The preparation of a consolidated financial report in conformity with AASBs requires management to make judgements, estimates and assumptions that affect the application of policies and reported amounts of assets and liabilities, income and expenses. The estimates and associated assumptions are based on historical experience and various other factors that are believed to be reasonable under the circumstances, the results of which form the basis of making the judgements about carrying values of assets and liabilities that are not readily apparent from other sources. Actual results may differ from these estimates. These accounting policies have been consistently applied by each entity in the Caltex Group.
The estimates and underlying assumptions are reviewed on an ongoing basis. Revisions to accounting estimates are recognised in the period in which the estimate is revised and future periods if the revision affects both current and future periods.
Judgements made by management in the application of AASBs that have a significant effect on the consolidated financial report and estimates with a significant risk of material adjustment in the future financial years are found in the following notes:
• information about the assumptions and the risk factors relating to impairment is described in notes C1 (receivables), C3 (intangibles) and C4 (property, plant and equipment)
• note D2 provides an explanation of the foreign exchange, interest rate and commodity price exposures of the Group and the risk in relation to foreign exchange, interest rate and commodity price movements
• note C6 provides key sources of estimation, uncertainty and assumptions used in regard to estimation of provisions and
• note E1 provides information around the extent to which earnings from the Group’s Singaporean entities would be subject to income tax in Australia.
82 CALTEX AUSTRALIA
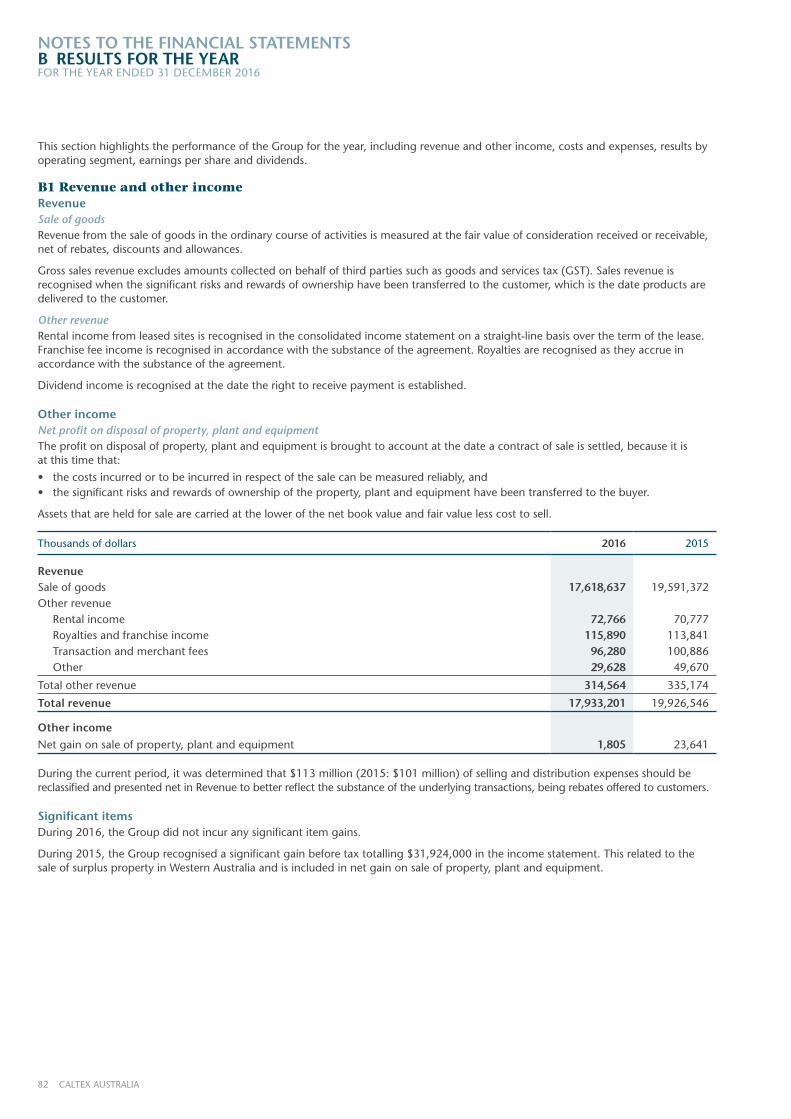
NOTES TO THE FINANCIAL STATEMENTSB RESULTS FOR THE YEARFOR THE YEAR ENDED 31 DECEMBER 2016
This section highlights the performance of the Group for the year, including revenue and other income, costs and expenses, results by operating segment, earnings per share and dividends.
B1 Revenue and other incomeRevenueSale of goodsRevenue from the sale of goods in the ordinary course of activities is measured at the fair value of consideration received or receivable, net of rebates, discounts and allowances.
Gross sales revenue excludes amounts collected on behalf of third parties such as goods and services tax (GST). Sales revenue is recognised when the significant risks and rewards of ownership have been transferred to the customer, which is the date products are delivered to the customer.
Other revenueRental income from leased sites is recognised in the consolidated income statement on a straight-line basis over the term of the lease. Franchise fee income is recognised in accordance with the substance of the agreement. Royalties are recognised as they accrue in accordance with the substance of the agreement.
Dividend income is recognised at the date the right to receive payment is established.
Other incomeNet profit on disposal of property, plant and equipmentThe profit on disposal of property, plant and equipment is brought to account at the date a contract of sale is settled, because it is at this time that:
• the costs incurred or to be incurred in respect of the sale can be measured reliably, and• the significant risks and rewards of ownership of the property, plant and equipment have been transferred to the buyer.
Assets that are held for sale are carried at the lower of the net book value and fair value less cost to sell.
Thousands of dollars 2016 2015
RevenueSale of goods 17,618,637 19,591,372Other revenue Rental income 72,766 70,777 Royalties and franchise income 115,890 113,841 Transaction and merchant fees 96,280 100,886 Other 29,628 49,670
Total other revenue 314,564 335,174
Total revenue 17,933,201 19,926,546
Other incomeNet gain on sale of property, plant and equipment 1,805 23,641
During the current period, it was determined that $113 million (2015: $101 million) of selling and distribution expenses should be reclassified and presented net in Revenue to better reflect the substance of the underlying transactions, being rebates offered to customers.
Significant itemsDuring 2016, the Group did not incur any significant item gains.
During 2015, the Group recognised a significant gain before tax totalling $31,924,000 in the income statement. This related to the sale of surplus property in Western Australia and is included in net gain on sale of property, plant and equipment.
83ANNUAL REPORT 2016
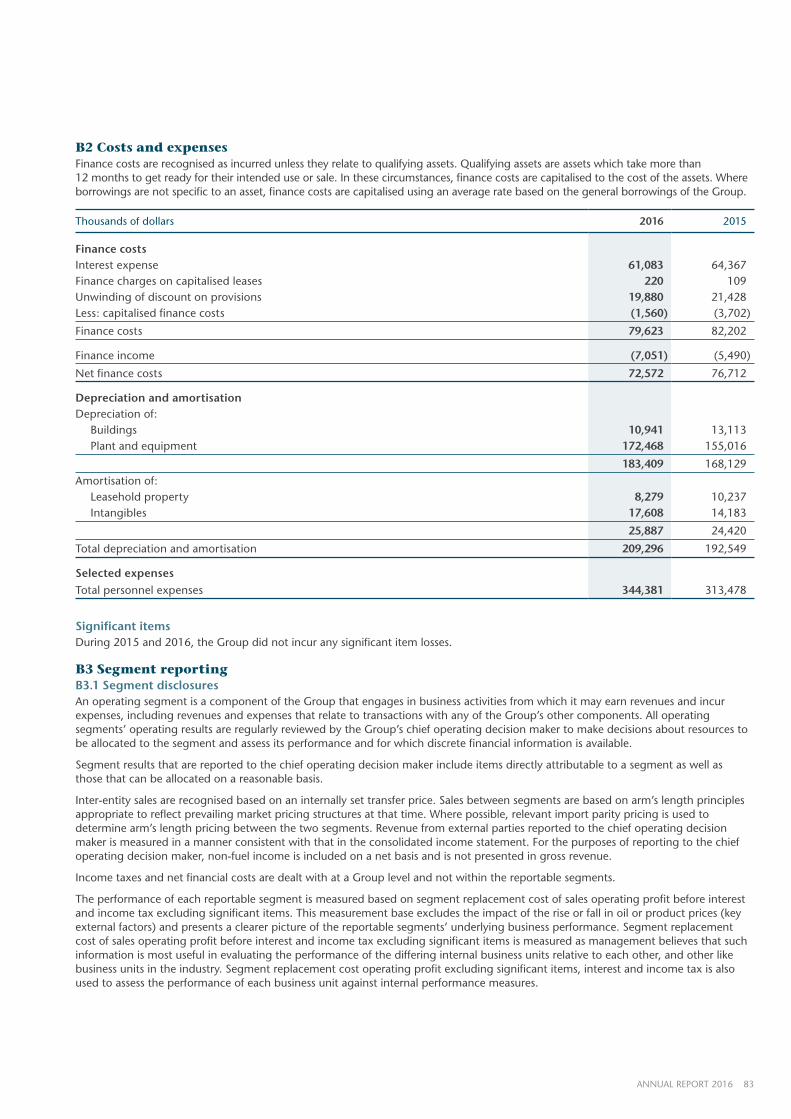
B2 Costs and expensesFinance costs are recognised as incurred unless they relate to qualifying assets. Qualifying assets are assets which take more than 12 months to get ready for their intended use or sale. In these circumstances, finance costs are capitalised to the cost of the assets. Where borrowings are not specific to an asset, finance costs are capitalised using an average rate based on the general borrowings of the Group.
Thousands of dollars 2016 2015
Finance costs Interest expense 61,083 64,367Finance charges on capitalised leases 220 109Unwinding of discount on provisions 19,880 21,428Less: capitalised finance costs (1,560) (3,702)
Finance costs 79,623 82,202
Finance income (7,051) (5,490)
Net finance costs 72,572 76,712
Depreciation and amortisationDepreciation of: Buildings 10,941 13,113 Plant and equipment 172,468 155,016
183,409 168,129
Amortisation of: Leasehold property 8,279 10,237 Intangibles 17,608 14,183
25,887 24,420
Total depreciation and amortisation 209,296 192,549
Selected expensesTotal personnel expenses 344,381 313,478
Significant itemsDuring 2015 and 2016, the Group did not incur any significant item losses.
B3 Segment reportingB3.1 Segment disclosuresAn operating segment is a component of the Group that engages in business activities from which it may earn revenues and incur expenses, including revenues and expenses that relate to transactions with any of the Group’s other components. All operating segments’ operating results are regularly reviewed by the Group’s chief operating decision maker to make decisions about resources to be allocated to the segment and assess its performance and for which discrete financial information is available.
Segment results that are reported to the chief operating decision maker include items directly attributable to a segment as well as those that can be allocated on a reasonable basis.
Inter-entity sales are recognised based on an internally set transfer price. Sales between segments are based on arm’s length principles appropriate to reflect prevailing market pricing structures at that time. Where possible, relevant import parity pricing is used to determine arm’s length pricing between the two segments. Revenue from external parties reported to the chief operating decision maker is measured in a manner consistent with that in the consolidated income statement. For the purposes of reporting to the chief operating decision maker, non-fuel income is included on a net basis and is not presented in gross revenue.
Income taxes and net financial costs are dealt with at a Group level and not within the reportable segments.
The performance of each reportable segment is measured based on segment replacement cost of sales operating profit before interest and income tax excluding significant items. This measurement base excludes the impact of the rise or fall in oil or product prices (key external factors) and presents a clearer picture of the reportable segments’ underlying business performance. Segment replacement cost of sales operating profit before interest and income tax excluding significant items is measured as management believes that such information is most useful in evaluating the performance of the differing internal business units relative to each other, and other like business units in the industry. Segment replacement cost operating profit excluding significant items, interest and income tax is also used to assess the performance of each business unit against internal performance measures.
84 CALTEX AUSTRALIA
NOTES TO THE FINANCIAL STATEMENTSB RESULTS FOR THE YEARFOR THE YEAR ENDED 31 DECEMBER 2016
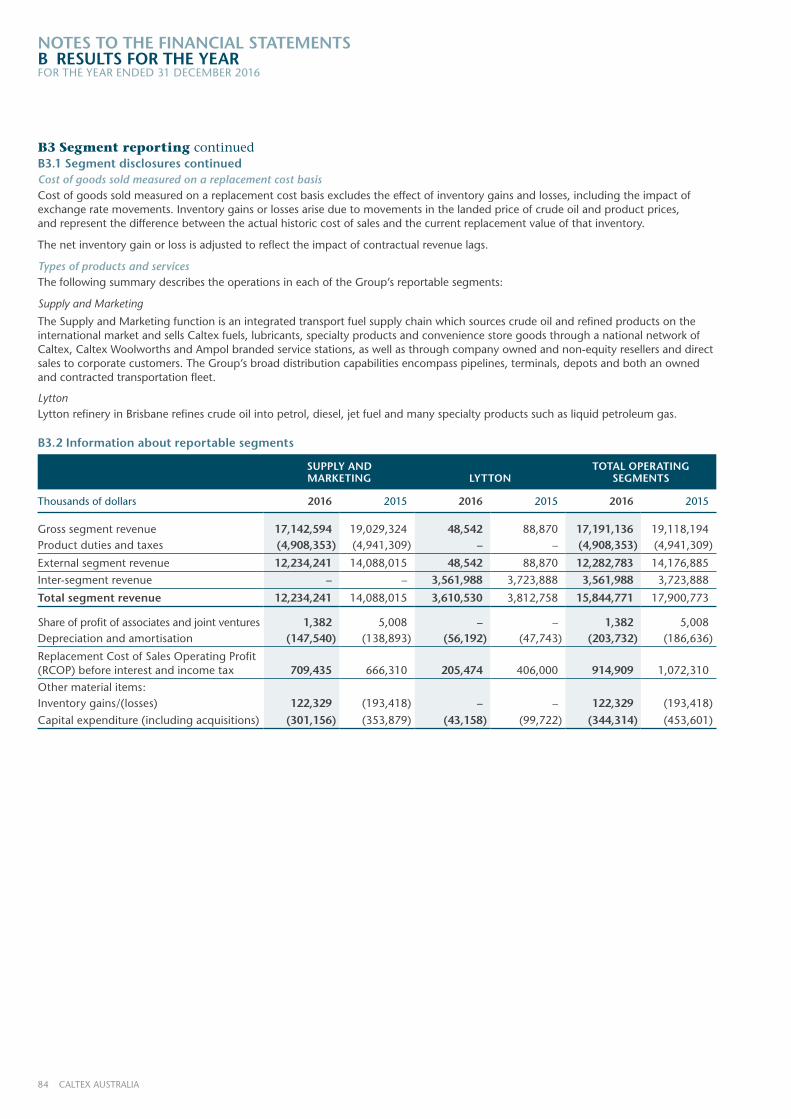
B3 Segment reporting continuedB3.1 Segment disclosures continuedCost of goods sold measured on a replacement cost basisCost of goods sold measured on a replacement cost basis excludes the effect of inventory gains and losses, including the impact of exchange rate movements. Inventory gains or losses arise due to movements in the landed price of crude oil and product prices, and represent the difference between the actual historic cost of sales and the current replacement value of that inventory.
The net inventory gain or loss is adjusted to reflect the impact of contractual revenue lags.
Types of products and servicesThe following summary describes the operations in each of the Group’s reportable segments:
Supply and Marketing
The Supply and Marketing function is an integrated transport fuel supply chain which sources crude oil and refined products on the international market and sells Caltex fuels, lubricants, specialty products and convenience store goods through a national network of Caltex, Caltex Woolworths and Ampol branded service stations, as well as through company owned and non-equity resellers and direct sales to corporate customers. The Group’s broad distribution capabilities encompass pipelines, terminals, depots and both an owned and contracted transportation fleet.
LyttonLytton refinery in Brisbane refines crude oil into petrol, diesel, jet fuel and many specialty products such as liquid petroleum gas.
B3.2 Information about reportable segments
SUPPLY AND MARKETING LYTTON
TOTAL OPERATING SEGMENTS
Thousands of dollars 2016 2015 2016 2015 2016 2015
Gross segment revenue 17,142,594 19,029,324 48,542 88,870 17,191,136 19,118,194Product duties and taxes (4,908,353) (4,941,309) – – (4,908,353) (4,941,309)
External segment revenue 12,234,241 14,088,015 48,542 88,870 12,282,783 14,176,885
Inter-segment revenue – – 3,561,988 3,723,888 3,561,988 3,723,888
Total segment revenue 12,234,241 14,088,015 3,610,530 3,812,758 15,844,771 17,900,773
Share of profit of associates and joint ventures 1,382 5,008 – – 1,382 5,008Depreciation and amortisation (147,540) (138,893) (56,192) (47,743) (203,732) (186,636)
Replacement Cost of Sales Operating Profit (RCOP) before interest and income tax 709,435 666,310 205,474 406,000 914,909 1,072,310
Other material items:Inventory gains/(losses) 122,329 (193,418) – – 122,329 (193,418)
Capital expenditure (including acquisitions) (301,156) (353,879) (43,158) (99,722) (344,314) (453,601)
85ANNUAL REPORT 2016
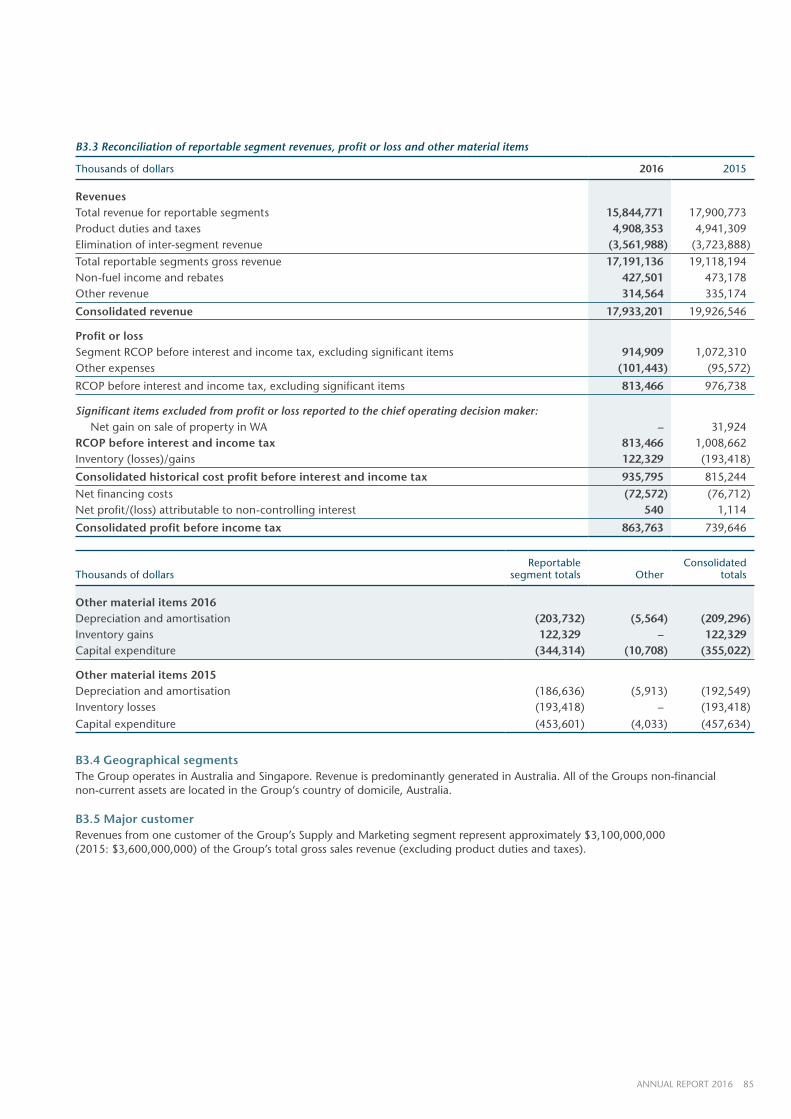
B3.3 Reconciliation of reportable segment revenues, profit or loss and other material items
Thousands of dollars 2016 2015
Revenues Total revenue for reportable segments 15,844,771 17,900,773Product duties and taxes 4,908,353 4,941,309Elimination of inter-segment revenue (3,561,988) (3,723,888)
Total reportable segments gross revenue 17,191,136 19,118,194Non-fuel income and rebates 427,501 473,178Other revenue 314,564 335,174
Consolidated revenue 17,933,201 19,926,546
Profit or lossSegment RCOP before interest and income tax, excluding significant items 914,909 1,072,310Other expenses (101,443) (95,572)
RCOP before interest and income tax, excluding significant items 813,466 976,738
Significant items excluded from profit or loss reported to the chief operating decision maker: Net gain on sale of property in WA – 31,924RCOP before interest and income tax 813,466 1,008,662Inventory (losses)/gains 122,329 (193,418)
Consolidated historical cost profit before interest and income tax 935,795 815,244
Net financing costs (72,572) (76,712)Net profit/(loss) attributable to non-controlling interest 540 1,114
Consolidated profit before income tax 863,763 739,646
Thousands of dollarsReportable
segment totals OtherConsolidated
totals
Other material items 2016Depreciation and amortisation (203,732) (5,564) (209,296)Inventory gains 122,329 – 122,329Capital expenditure (344,314) (10,708) (355,022)
Other material items 2015Depreciation and amortisation (186,636) (5,913) (192,549)Inventory losses (193,418) – (193,418)
Capital expenditure (453,601) (4,033) (457,634)
B3.4 Geographical segmentsThe Group operates in Australia and Singapore. Revenue is predominantly generated in Australia. All of the Groups non-financial non-current assets are located in the Group’s country of domicile, Australia.
B3.5 Major customerRevenues from one customer of the Group’s Supply and Marketing segment represent approximately $3,100,000,000 (2015: $3,600,000,000) of the Group’s total gross sales revenue (excluding product duties and taxes).
86 CALTEX AUSTRALIA
NOTES TO THE FINANCIAL STATEMENTSB RESULTS FOR THE YEARFOR THE YEAR ENDED 31 DECEMBER 2016
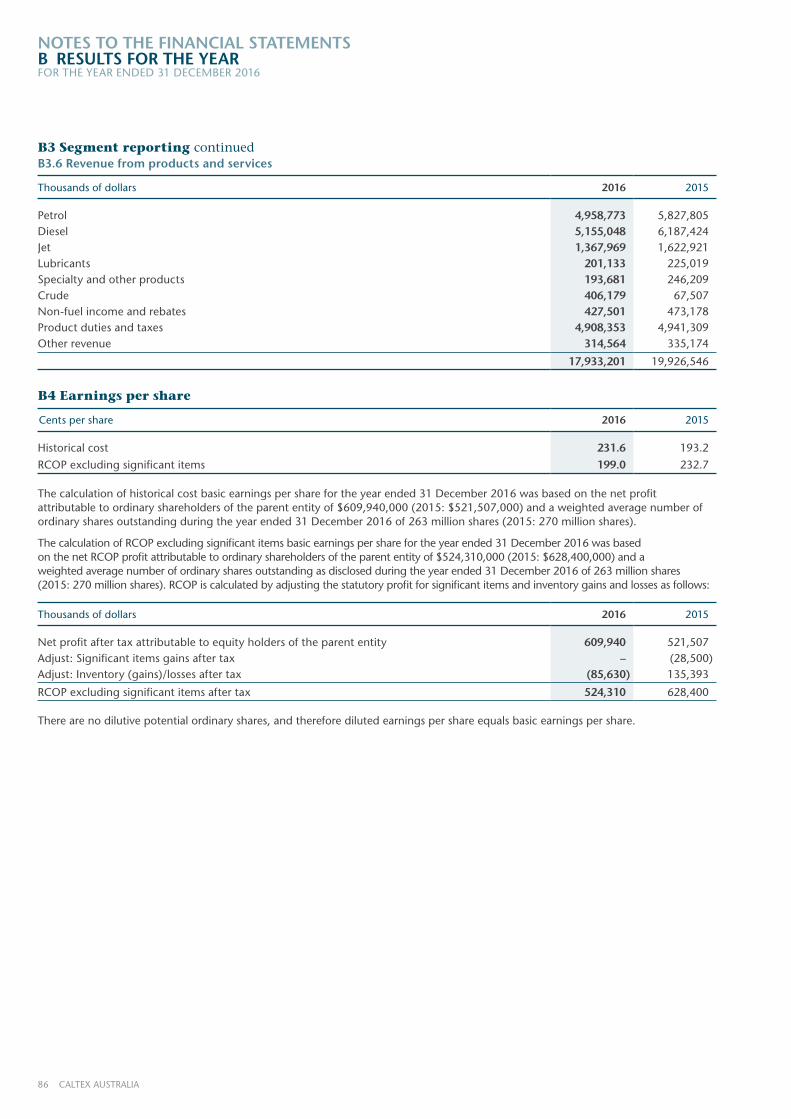
B3 Segment reporting continuedB3.6 Revenue from products and services
Thousands of dollars 2016 2015
Petrol 4,958,773 5,827,805Diesel 5,155,048 6,187,424Jet 1,367,969 1,622,921Lubricants 201,133 225,019Specialty and other products 193,681 246,209Crude 406,179 67,507Non-fuel income and rebates 427,501 473,178Product duties and taxes 4,908,353 4,941,309Other revenue 314,564 335,174
17,933,201 19,926,546
B4 Earnings per share
Cents per share 2016 2015
Historical cost 231.6 193.2
RCOP excluding significant items 199.0 232.7
The calculation of historical cost basic earnings per share for the year ended 31 December 2016 was based on the net profit attributable to ordinary shareholders of the parent entity of $609,940,000 (2015: $521,507,000) and a weighted average number of ordinary shares outstanding during the year ended 31 December 2016 of 263 million shares (2015: 270 million shares).
The calculation of RCOP excluding significant items basic earnings per share for the year ended 31 December 2016 was based on the net RCOP profit attributable to ordinary shareholders of the parent entity of $524,310,000 (2015: $628,400,000) and a weighted average number of ordinary shares outstanding as disclosed during the year ended 31 December 2016 of 263 million shares (2015: 270 million shares). RCOP is calculated by adjusting the statutory profit for significant items and inventory gains and losses as follows:
Thousands of dollars 2016 2015
Net profit after tax attributable to equity holders of the parent entity 609,940 521,507Adjust: Significant items gains after tax – (28,500)Adjust: Inventory (gains)/losses after tax (85,630) 135,393
RCOP excluding significant items after tax 524,310 628,400
There are no dilutive potential ordinary shares, and therefore diluted earnings per share equals basic earnings per share.
87ANNUAL REPORT 2016
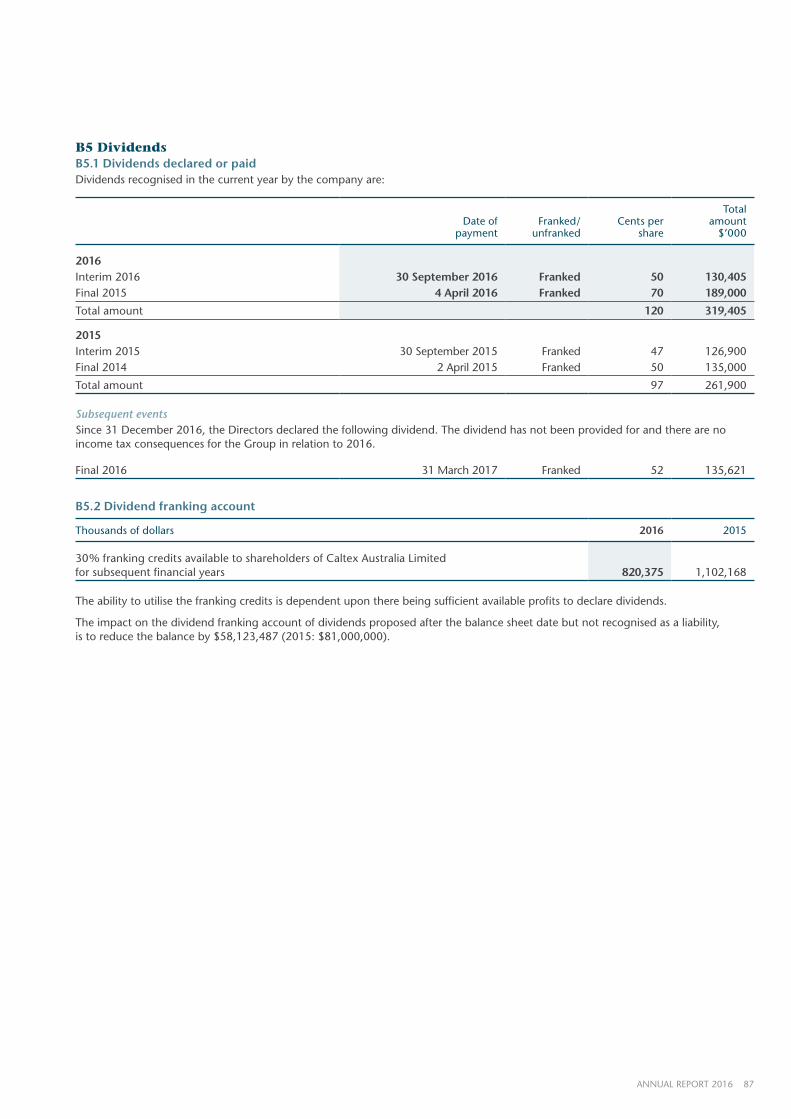
B5 DividendsB5.1 Dividends declared or paidDividends recognised in the current year by the company are:
Date ofpayment
Franked/unfranked
Cents per share
Total amount
$’000
2016Interim 2016 30 September 2016 Franked 50 130,405Final 2015 4 April 2016 Franked 70 189,000
Total amount 120 319,405
2015Interim 2015 30 September 2015 Franked 47 126,900Final 2014 2 April 2015 Franked 50 135,000
Total amount 97 261,900
Subsequent eventsSince 31 December 2016, the Directors declared the following dividend. The dividend has not been provided for and there are no income tax consequences for the Group in relation to 2016.
Final 2016 31 March 2017 Franked 52 135,621
B5.2 Dividend franking account
Thousands of dollars 2016 2015
30% franking credits available to shareholders of Caltex Australia Limited for subsequent financial years 820,375 1,102,168
The ability to utilise the franking credits is dependent upon there being sufficient available profits to declare dividends.
The impact on the dividend franking account of dividends proposed after the balance sheet date but not recognised as a liability, is to reduce the balance by $58,123,487 (2015: $81,000,000).
88 CALTEX AUSTRALIA
NOTES TO THE FINANCIAL STATEMENTSC OPERATING ASSETS AND LIABILITIESFOR THE YEAR ENDED 31 DECEMBER 2016
This section provides information on the assets used to generate the Group’s trading performance and the liabilities incurred as a result.
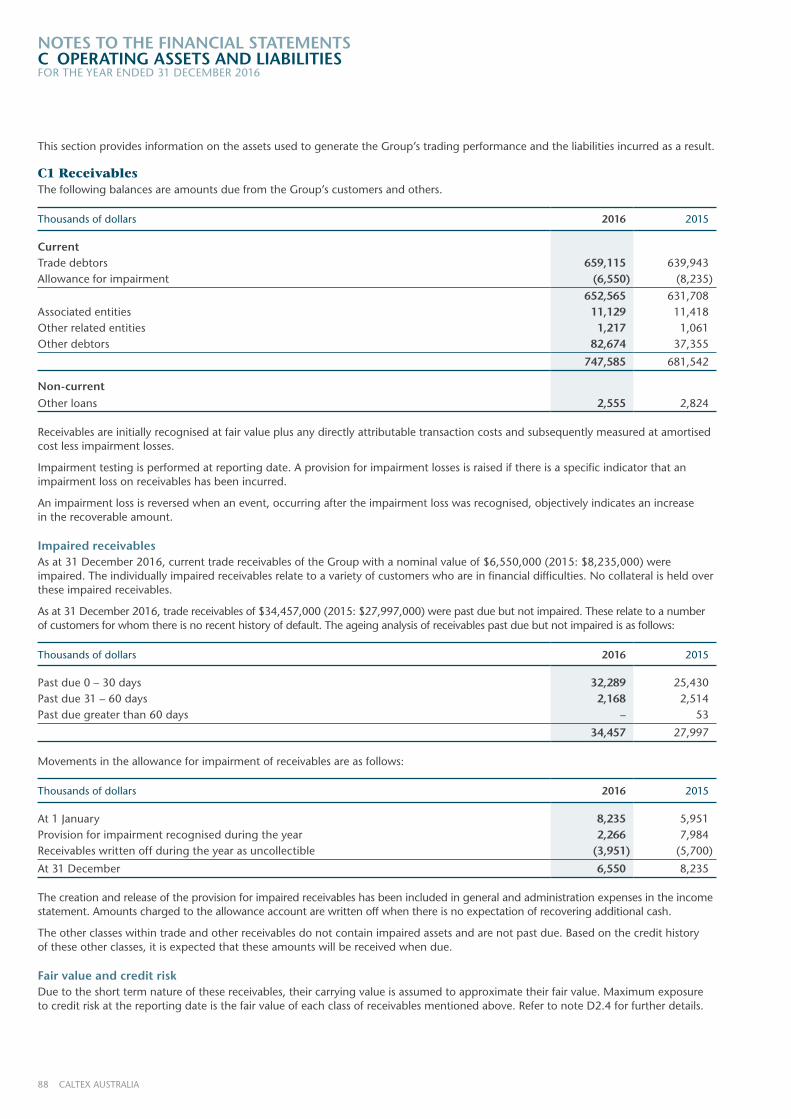
C1 ReceivablesThe following balances are amounts due from the Group’s customers and others.
Thousands of dollars 2016 2015
CurrentTrade debtors 659,115 639,943Allowance for impairment (6,550) (8,235)
652,565 631,708Associated entities 11,129 11,418Other related entities 1,217 1,061Other debtors 82,674 37,355
747,585 681,542
Non-currentOther loans 2,555 2,824
Receivables are initially recognised at fair value plus any directly attributable transaction costs and subsequently measured at amortised cost less impairment losses.
Impairment testing is performed at reporting date. A provision for impairment losses is raised if there is a specific indicator that an impairment loss on receivables has been incurred.
An impairment loss is reversed when an event, occurring after the impairment loss was recognised, objectively indicates an increase in the recoverable amount.
Impaired receivablesAs at 31 December 2016, current trade receivables of the Group with a nominal value of $6,550,000 (2015: $8,235,000) were impaired. The individually impaired receivables relate to a variety of customers who are in financial difficulties. No collateral is held over these impaired receivables.
As at 31 December 2016, trade receivables of $34,457,000 (2015: $27,997,000) were past due but not impaired. These relate to a number of customers for whom there is no recent history of default. The ageing analysis of receivables past due but not impaired is as follows:
Thousands of dollars 2016 2015
Past due 0 – 30 days 32,289 25,430Past due 31 – 60 days 2,168 2,514Past due greater than 60 days – 53
34,457 27,997
Movements in the allowance for impairment of receivables are as follows:
Thousands of dollars 2016 2015
At 1 January 8,235 5,951Provision for impairment recognised during the year 2,266 7,984Receivables written off during the year as uncollectible (3,951) (5,700)
At 31 December 6,550 8,235
The creation and release of the provision for impaired receivables has been included in general and administration expenses in the income statement. Amounts charged to the allowance account are written off when there is no expectation of recovering additional cash.
The other classes within trade and other receivables do not contain impaired assets and are not past due. Based on the credit history of these other classes, it is expected that these amounts will be received when due.
Fair value and credit riskDue to the short term nature of these receivables, their carrying value is assumed to approximate their fair value. Maximum exposure to credit risk at the reporting date is the fair value of each class of receivables mentioned above. Refer to note D2.4 for further details.
89ANNUAL REPORT 2016
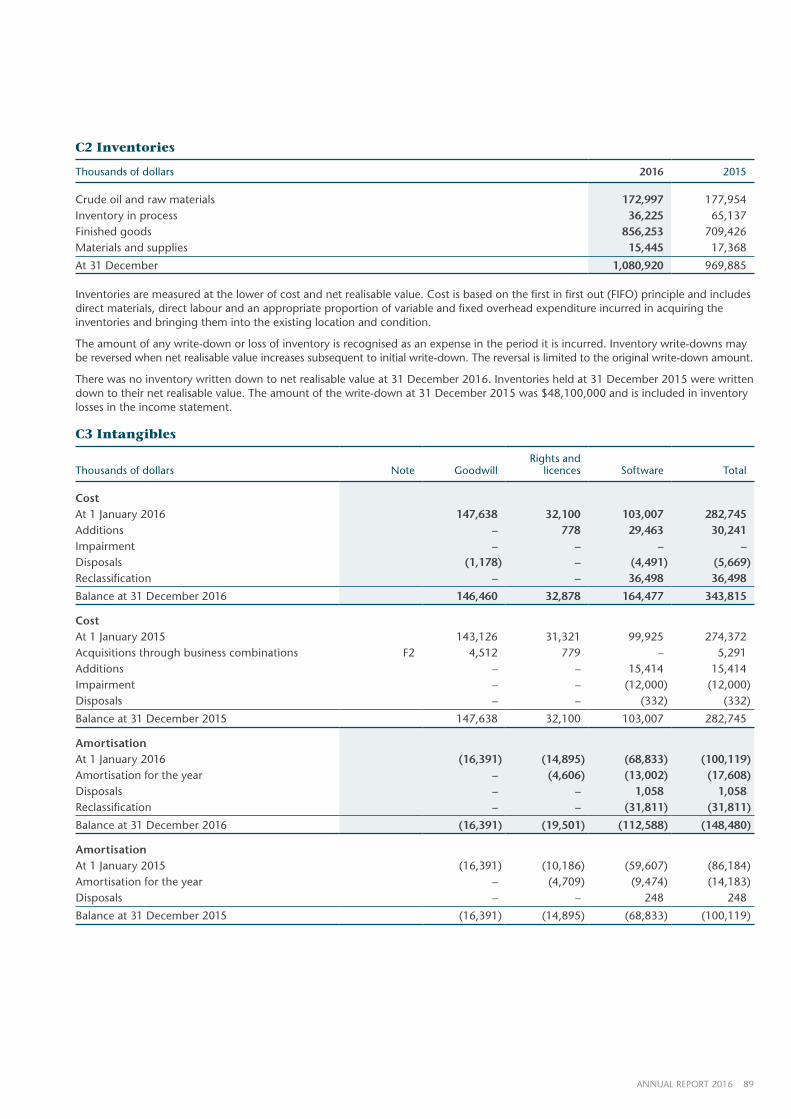
C2 Inventories
Thousands of dollars 2016 2015
Crude oil and raw materials 172,997 177,954Inventory in process 36,225 65,137Finished goods 856,253 709,426Materials and supplies 15,445 17,368
At 31 December 1,080,920 969,885
Inventories are measured at the lower of cost and net realisable value. Cost is based on the first in first out (FIFO) principle and includes direct materials, direct labour and an appropriate proportion of variable and fixed overhead expenditure incurred in acquiring the inventories and bringing them into the existing location and condition.
The amount of any write-down or loss of inventory is recognised as an expense in the period it is incurred. Inventory write-downs may be reversed when net realisable value increases subsequent to initial write-down. The reversal is limited to the original write-down amount.
There was no inventory written down to net realisable value at 31 December 2016. Inventories held at 31 December 2015 were written down to their net realisable value. The amount of the write-down at 31 December 2015 was $48,100,000 and is included in inventory losses in the income statement.
C3 Intangibles
Thousands of dollars Note Goodwill Rights and
licences Software Total
Cost At 1 January 2016 147,638 32,100 103,007 282,745Additions – 778 29,463 30,241Impairment – – – –Disposals (1,178) – (4,491) (5,669)Reclassification – – 36,498 36,498
Balance at 31 December 2016 146,460 32,878 164,477 343,815
Cost At 1 January 2015 143,126 31,321 99,925 274,372Acquisitions through business combinations F2 4,512 779 – 5,291Additions – – 15,414 15,414Impairment – – (12,000) (12,000)Disposals – – (332) (332)
Balance at 31 December 2015 147,638 32,100 103,007 282,745
AmortisationAt 1 January 2016 (16,391) (14,895) (68,833) (100,119)Amortisation for the year – (4,606) (13,002) (17,608)Disposals – – 1,058 1,058Reclassification – – (31,811) (31,811)
Balance at 31 December 2016 (16,391) (19,501) (112,588) (148,480)
AmortisationAt 1 January 2015 (16,391) (10,186) (59,607) (86,184)Amortisation for the year – (4,709) (9,474) (14,183)Disposals – – 248 248
Balance at 31 December 2015 (16,391) (14,895) (68,833) (100,119)
90 CALTEX AUSTRALIA
NOTES TO THE FINANCIAL STATEMENTSC OPERATING ASSETS AND LIABILITIESFOR THE YEAR ENDED 31 DECEMBER 2016
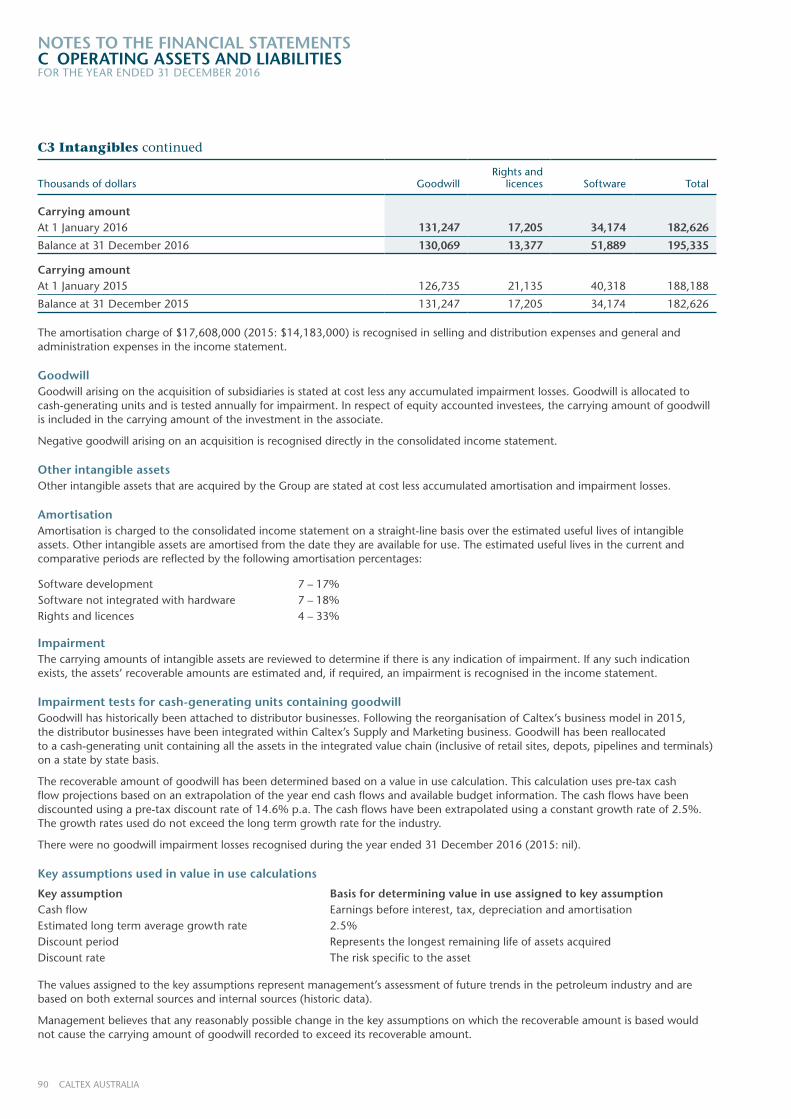
C3 Intangibles continued
Thousands of dollars Goodwill Rights and
licences Software Total
Carrying amountAt 1 January 2016 131,247 17,205 34,174 182,626
Balance at 31 December 2016 130,069 13,377 51,889 195,335
Carrying amountAt 1 January 2015 126,735 21,135 40,318 188,188
Balance at 31 December 2015 131,247 17,205 34,174 182,626
The amortisation charge of $17,608,000 (2015: $14,183,000) is recognised in selling and distribution expenses and general and administration expenses in the income statement.
GoodwillGoodwill arising on the acquisition of subsidiaries is stated at cost less any accumulated impairment losses. Goodwill is allocated to cash-generating units and is tested annually for impairment. In respect of equity accounted investees, the carrying amount of goodwill is included in the carrying amount of the investment in the associate.
Negative goodwill arising on an acquisition is recognised directly in the consolidated income statement.
Other intangible assetsOther intangible assets that are acquired by the Group are stated at cost less accumulated amortisation and impairment losses.
AmortisationAmortisation is charged to the consolidated income statement on a straight-line basis over the estimated useful lives of intangible assets. Other intangible assets are amortised from the date they are available for use. The estimated useful lives in the current and comparative periods are reflected by the following amortisation percentages:
Software development 7 – 17%Software not integrated with hardware 7 – 18%Rights and licences 4 – 33%
ImpairmentThe carrying amounts of intangible assets are reviewed to determine if there is any indication of impairment. If any such indication exists, the assets’ recoverable amounts are estimated and, if required, an impairment is recognised in the income statement.
Impairment tests for cash-generating units containing goodwillGoodwill has historically been attached to distributor businesses. Following the reorganisation of Caltex’s business model in 2015, the distributor businesses have been integrated within Caltex’s Supply and Marketing business. Goodwill has been reallocated to a cash-generating unit containing all the assets in the integrated value chain (inclusive of retail sites, depots, pipelines and terminals) on a state by state basis.
The recoverable amount of goodwill has been determined based on a value in use calculation. This calculation uses pre-tax cash flow projections based on an extrapolation of the year end cash flows and available budget information. The cash flows have been discounted using a pre-tax discount rate of 14.6% p.a. The cash flows have been extrapolated using a constant growth rate of 2.5%. The growth rates used do not exceed the long term growth rate for the industry.
There were no goodwill impairment losses recognised during the year ended 31 December 2016 (2015: nil).
Key assumptions used in value in use calculations
Key assumption Basis for determining value in use assigned to key assumptionCash flow Earnings before interest, tax, depreciation and amortisationEstimated long term average growth rate 2.5% Discount period Represents the longest remaining life of assets acquiredDiscount rate The risk specific to the asset
The values assigned to the key assumptions represent management’s assessment of future trends in the petroleum industry and are based on both external sources and internal sources (historic data).
Management believes that any reasonably possible change in the key assumptions on which the recoverable amount is based would not cause the carrying amount of goodwill recorded to exceed its recoverable amount.
91ANNUAL REPORT 2016
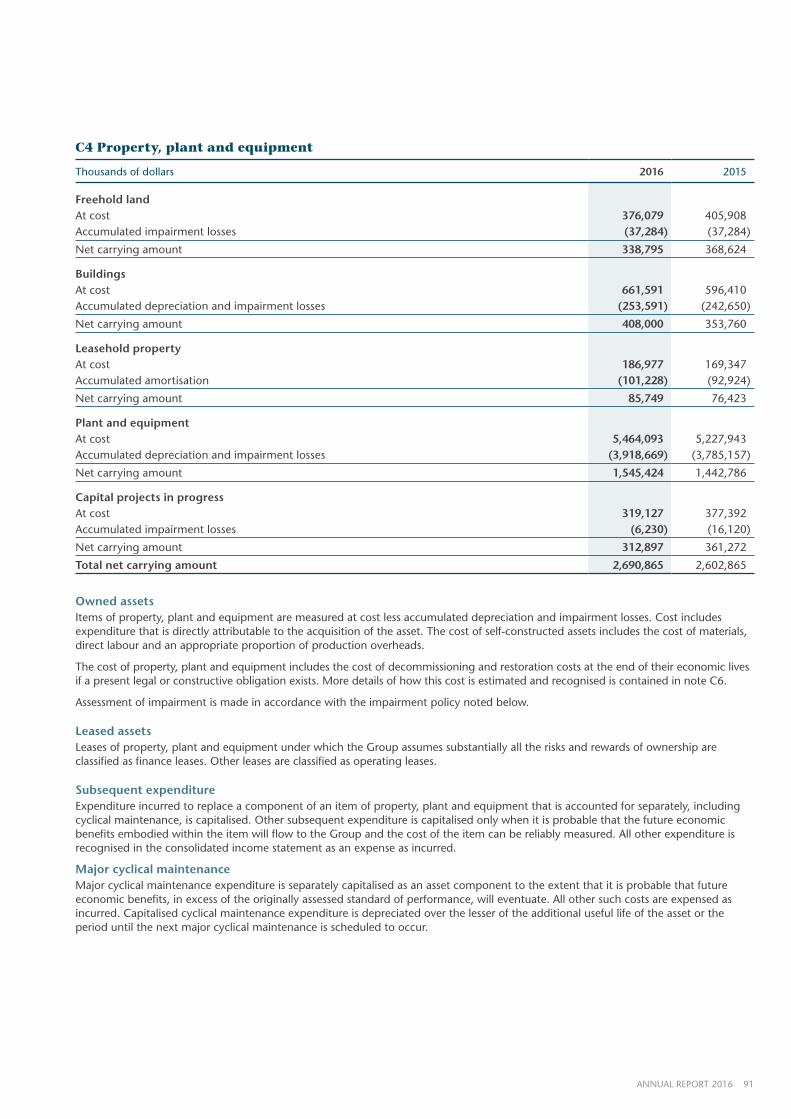
C4 Property, plant and equipment
Thousands of dollars 2016 2015
Freehold landAt cost 376,079 405,908Accumulated impairment losses (37,284) (37,284)
Net carrying amount 338,795 368,624
BuildingsAt cost 661,591 596,410Accumulated depreciation and impairment losses (253,591) (242,650)
Net carrying amount 408,000 353,760
Leasehold propertyAt cost 186,977 169,347Accumulated amortisation (101,228) (92,924)
Net carrying amount 85,749 76,423
Plant and equipmentAt cost 5,464,093 5,227,943Accumulated depreciation and impairment losses (3,918,669) (3,785,157)
Net carrying amount 1,545,424 1,442,786
Capital projects in progressAt cost 319,127 377,392Accumulated impairment losses (6,230) (16,120)
Net carrying amount 312,897 361,272
Total net carrying amount 2,690,865 2,602,865
Owned assetsItems of property, plant and equipment are measured at cost less accumulated depreciation and impairment losses. Cost includes expenditure that is directly attributable to the acquisition of the asset. The cost of self-constructed assets includes the cost of materials, direct labour and an appropriate proportion of production overheads.
The cost of property, plant and equipment includes the cost of decommissioning and restoration costs at the end of their economic lives if a present legal or constructive obligation exists. More details of how this cost is estimated and recognised is contained in note C6.
Assessment of impairment is made in accordance with the impairment policy noted below.
Leased assetsLeases of property, plant and equipment under which the Group assumes substantially all the risks and rewards of ownership are classified as finance leases. Other leases are classified as operating leases.
Subsequent expenditureExpenditure incurred to replace a component of an item of property, plant and equipment that is accounted for separately, including cyclical maintenance, is capitalised. Other subsequent expenditure is capitalised only when it is probable that the future economic benefits embodied within the item will flow to the Group and the cost of the item can be reliably measured. All other expenditure is recognised in the consolidated income statement as an expense as incurred.
Major cyclical maintenanceMajor cyclical maintenance expenditure is separately capitalised as an asset component to the extent that it is probable that future economic benefits, in excess of the originally assessed standard of performance, will eventuate. All other such costs are expensed as incurred. Capitalised cyclical maintenance expenditure is depreciated over the lesser of the additional useful life of the asset or the period until the next major cyclical maintenance is scheduled to occur.
92 CALTEX AUSTRALIA
NOTES TO THE FINANCIAL STATEMENTSC OPERATING ASSETS AND LIABILITIESFOR THE YEAR ENDED 31 DECEMBER 2016
C4 Property, plant and equipment continuedDepreciationItems of property, plant and equipment, including buildings and leasehold property but excluding freehold land, are depreciated using the straight-line method over their expected useful lives. Leasehold improvements are amortised over the shorter of the lease term or useful life.
The depreciation rates used, in the current and prior year, for each class of asset are as follows:
Freehold buildings 2%Leasehold property 2 – 10%Plant and equipment 3 – 25%Leased plant and equipment 3 – 25%
Assets are depreciated from the date of acquisition or, in respect of internally constructed assets, from the time an asset is completed and held ready for use.
ImpairmentThe carrying amounts of assets are reviewed to determine if there is any indication of impairment. If any such indication exists, these assets’ recoverable amounts are estimated and, if required, an impairment is recognised in the income statement. An impairment loss is reversed if there has been a change in the estimates used to determine the recoverable amount.
In assessing the carrying value of property, plant and equipment, management considers long term assumptions relating to key external factors including Singapore refiner margins, foreign exchange rates and crude oil prices; any changes in these assumptions can have a material impact on the carrying value.
Reconciliations of the carrying amounts for each class of property, plant and equipment are set out below:
Thousands of dollars 2016 2015
Freehold landCarrying amount at the beginning of the year 368,624 346,992Additions 29,362 22,537Acquisition through business combination – 380Disposals (4,913) (1,285)Reclassification (54,278) –
Carrying amount at the end of the year 338,795 368,624
BuildingsCarrying amount at the beginning of the year 353,760 326,480Additions 3,392 2,654Acquisition through business combination – –Disposals (6,160) (2,340)Transfers from capital projects in progress 67,949 40,079Depreciation (10,941) (13,113)
Carrying amount at the end of the year 408,000 353,760
Leasehold property Carrying amount at the beginning of the year 76,423 74,762Additions 3,704 2,604Disposals (4,057) (605)Transfers from capital projects in progress 17,958 9,899Amortisation (8,279) (10,237)
Carrying amount at the end of the year 85,749 76,423
93ANNUAL REPORT 2016
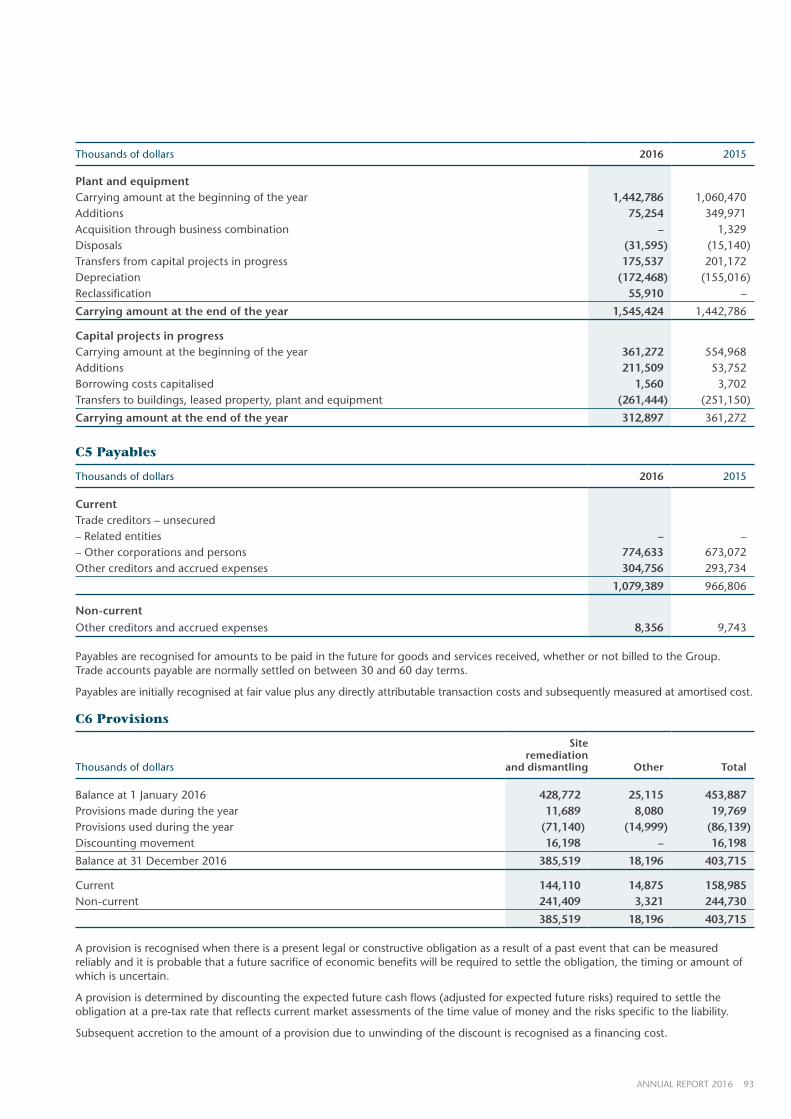
Thousands of dollars 2016 2015
Plant and equipment Carrying amount at the beginning of the year 1,442,786 1,060,470Additions 75,254 349,971Acquisition through business combination – 1,329Disposals (31,595) (15,140)Transfers from capital projects in progress 175,537 201,172Depreciation (172,468) (155,016)Reclassification 55,910 –
Carrying amount at the end of the year 1,545,424 1,442,786
Capital projects in progressCarrying amount at the beginning of the year 361,272 554,968Additions 211,509 53,752Borrowing costs capitalised 1,560 3,702Transfers to buildings, leased property, plant and equipment (261,444) (251,150)
Carrying amount at the end of the year 312,897 361,272
C5 Payables
Thousands of dollars 2016 2015
CurrentTrade creditors – unsecured– Related entities – –– Other corporations and persons 774,633 673,072Other creditors and accrued expenses 304,756 293,734
1,079,389 966,806
Non-currentOther creditors and accrued expenses 8,356 9,743
Payables are recognised for amounts to be paid in the future for goods and services received, whether or not billed to the Group. Trade accounts payable are normally settled on between 30 and 60 day terms.
Payables are initially recognised at fair value plus any directly attributable transaction costs and subsequently measured at amortised cost.
C6 Provisions
Thousands of dollars
Site remediation
and dismantling Other Total
Balance at 1 January 2016 428,772 25,115 453,887Provisions made during the year 11,689 8,080 19,769Provisions used during the year (71,140) (14,999) (86,139)Discounting movement 16,198 – 16,198
Balance at 31 December 2016 385,519 18,196 403,715
Current 144,110 14,875 158,985Non-current 241,409 3,321 244,730
385,519 18,196 403,715
A provision is recognised when there is a present legal or constructive obligation as a result of a past event that can be measured reliably and it is probable that a future sacrifice of economic benefits will be required to settle the obligation, the timing or amount of which is uncertain.
A provision is determined by discounting the expected future cash flows (adjusted for expected future risks) required to settle the obligation at a pre-tax rate that reflects current market assessments of the time value of money and the risks specific to the liability.
Subsequent accretion to the amount of a provision due to unwinding of the discount is recognised as a financing cost.
94 CALTEX AUSTRALIA
NOTES TO THE FINANCIAL STATEMENTSC OPERATING ASSETS AND LIABILITIESFOR THE YEAR ENDED 31 DECEMBER 2016
C6 Provisions continuedEstimates of the amount of an obligation are based on current legal and constructive obligations, technology and price levels. Actual outflows can differ from estimates due to changes in laws, regulations, public expectations, technology, prices and conditions and can take place many years in the future. The carrying amounts of provisions and liabilities are regularly reviewed and adjusted to take account of such change.
In general, the further in the future that a cash outflow for a liability is expected to occur, the greater the degree of uncertainty around the amount and timing of that cash outflow. Examples of cash outflows that are expected to occur a number of years in the future and, as a result, about which there is uncertainty of the amounts involved, include asset decommissioning and restoration obligations and employee pension obligations.
A change in the estimate of a recognised provision or liability would impact the consolidated income statement, with the exception of decommissioning and certain restoration costs that relate to the initial construction of an asset, which would be accounted for on a prospective basis.
Site remediation and dismantlingProvisions relating to current and future remediation activities are recognised as liabilities when a legal or constructive obligation arises.
The provision is the best estimate of the present value of the expenditure to settle the obligation at the reporting date. These costs are reviewed annually and any changes are reflected in the provision at the end of the reporting period through the consolidated income statement.
The ultimate cost of remediation is uncertain and cost estimates can vary in response to many factors, including changes to the relevant legal and environmental requirements, the emergence of new techniques or experience at other sites and uncertainty as to the remaining life of existing sites.
Costs for the future dismantling and removal of assets, and restoration of the site on which the assets are located, are provided for and capitalised upon initial construction of the asset, where an obligation to incur such costs arises. The present value of the expected future cash flows required to settle these obligations is capitalised and depreciated over the useful life of the asset.
Subsequent accretion to the amount of a provision due to unwinding of the discount is recognised as a finance cost. A change in estimate of the provision is added to or deducted from the cost of the related asset in the period of the change, to the extent that any amount of deduction does not exceed the carrying amount of the asset. Any deduction in excess of the carrying amount is recognised in the consolidated income statement immediately. If an adjustment results in an addition to the cost of the related asset, consideration will be given to whether an indication of impairment exists and the impairment policy will be applied.
DividendsA provision for dividends payable is recognised in the reporting period in which the dividends are declared, for the entire undistributed amount.
OtherOther includes legal, insurance and other provisions.
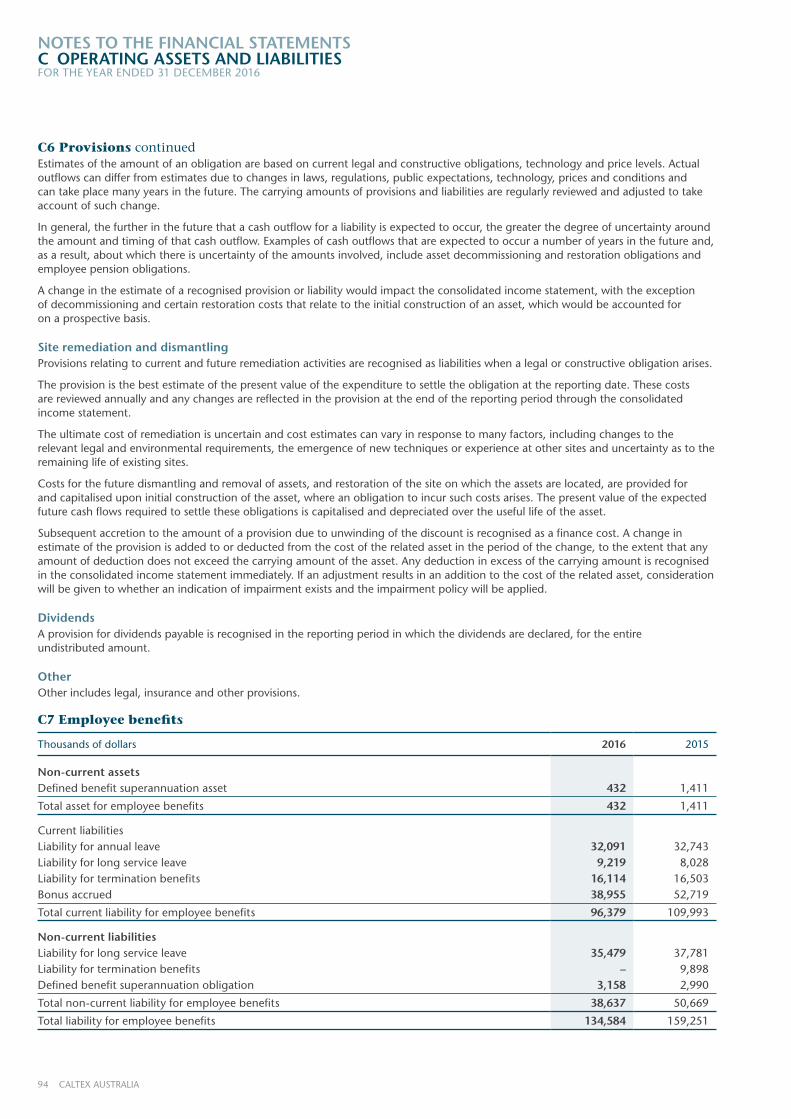
C7 Employee benefits
Thousands of dollars 2016 2015
Non-current assetsDefined benefit superannuation asset 432 1,411
Total asset for employee benefits 432 1,411
Current liabilitiesLiability for annual leave 32,091 32,743Liability for long service leave 9,219 8,028Liability for termination benefits 16,114 16,503Bonus accrued 38,955 52,719
Total current liability for employee benefits 96,379 109,993
Non-current liabilitiesLiability for long service leave 35,479 37,781Liability for termination benefits – 9,898Defined benefit superannuation obligation 3,158 2,990
Total non-current liability for employee benefits 38,637 50,669
Total liability for employee benefits 134,584 159,251
95ANNUAL REPORT 2016
NOTES TO THE FINANCIAL STATEMENTSD CAPITAL, FUNDING AND RISK MANAGEMENTFOR THE YEAR ENDED 31 DECEMBER 2016
This section focuses on the Group’s capital structure and related financing costs. This section also describes how the Group manages the capital and the financial risks it is exposed to as a result of its operating and financing activities.
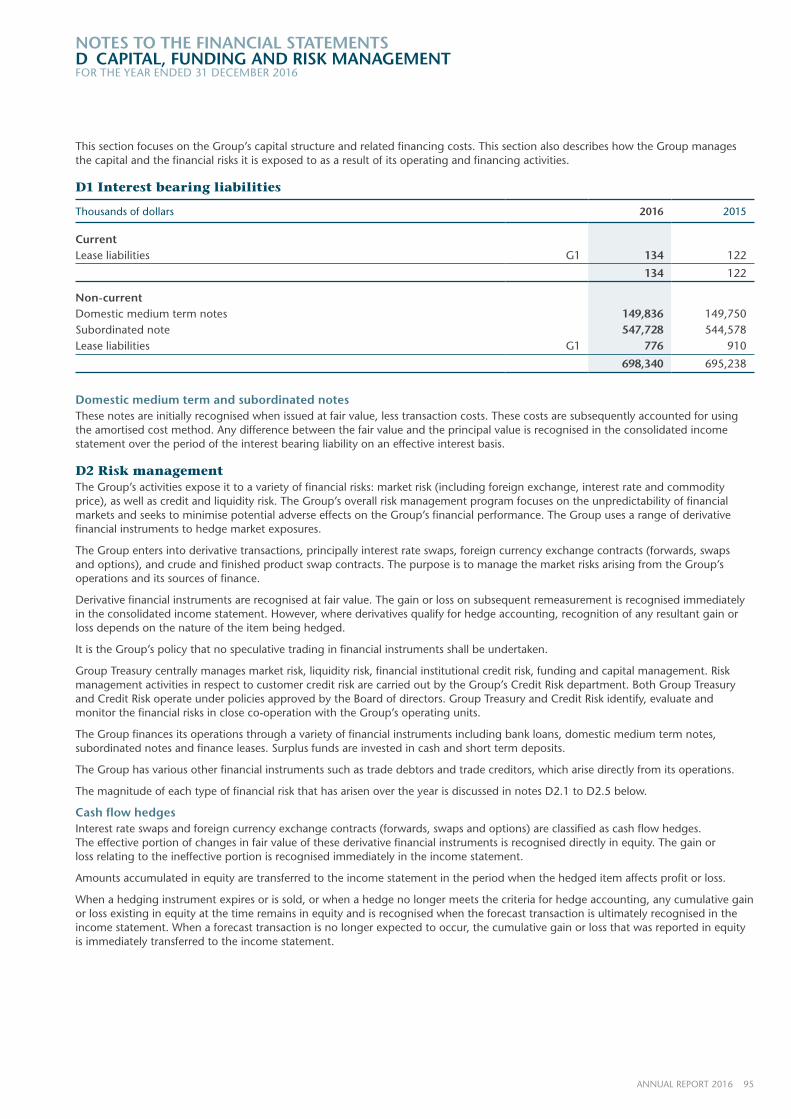
D1 Interest bearing liabilities
Thousands of dollars 2016 2015
CurrentLease liabilities G1 134 122
134 122
Non-currentDomestic medium term notes 149,836 149,750Subordinated note 547,728 544,578Lease liabilities G1 776 910
698,340 695,238
Domestic medium term and subordinated notesThese notes are initially recognised when issued at fair value, less transaction costs. These costs are subsequently accounted for using the amortised cost method. Any difference between the fair value and the principal value is recognised in the consolidated income statement over the period of the interest bearing liability on an effective interest basis.
D2 Risk managementThe Group’s activities expose it to a variety of financial risks: market risk (including foreign exchange, interest rate and commodity price), as well as credit and liquidity risk. The Group’s overall risk management program focuses on the unpredictability of financial markets and seeks to minimise potential adverse effects on the Group’s financial performance. The Group uses a range of derivative financial instruments to hedge market exposures.
The Group enters into derivative transactions, principally interest rate swaps, foreign currency exchange contracts (forwards, swaps and options), and crude and finished product swap contracts. The purpose is to manage the market risks arising from the Group’s operations and its sources of finance.
Derivative financial instruments are recognised at fair value. The gain or loss on subsequent remeasurement is recognised immediately in the consolidated income statement. However, where derivatives qualify for hedge accounting, recognition of any resultant gain or loss depends on the nature of the item being hedged.
It is the Group’s policy that no speculative trading in financial instruments shall be undertaken.
Group Treasury centrally manages market risk, liquidity risk, financial institutional credit risk, funding and capital management. Risk management activities in respect to customer credit risk are carried out by the Group’s Credit Risk department. Both Group Treasury and Credit Risk operate under policies approved by the Board of directors. Group Treasury and Credit Risk identify, evaluate and monitor the financial risks in close co-operation with the Group’s operating units.
The Group finances its operations through a variety of financial instruments including bank loans, domestic medium term notes, subordinated notes and finance leases. Surplus funds are invested in cash and short term deposits.
The Group has various other financial instruments such as trade debtors and trade creditors, which arise directly from its operations.
The magnitude of each type of financial risk that has arisen over the year is discussed in notes D2.1 to D2.5 below.
Cash flow hedgesInterest rate swaps and foreign currency exchange contracts (forwards, swaps and options) are classified as cash flow hedges. The effective portion of changes in fair value of these derivative financial instruments is recognised directly in equity. The gain or loss relating to the ineffective portion is recognised immediately in the income statement.
Amounts accumulated in equity are transferred to the income statement in the period when the hedged item affects profit or loss.
When a hedging instrument expires or is sold, or when a hedge no longer meets the criteria for hedge accounting, any cumulative gain or loss existing in equity at the time remains in equity and is recognised when the forecast transaction is ultimately recognised in the income statement. When a forecast transaction is no longer expected to occur, the cumulative gain or loss that was reported in equity is immediately transferred to the income statement.
96 CALTEX AUSTRALIA
NOTES TO THE FINANCIAL STATEMENTSD CAPITAL, FUNDING AND RISK MANAGEMENTFOR THE YEAR ENDED 31 DECEMBER 2016
D2 Risk management continuedD2.1 Interest rate riskInterest rate instrumentsThe Group enters into fixed interest rate instruments to manage cash flow risks associated with the interest rate volatility on borrowings that are floating. Interest rate instruments allow the Group to swap floating rate borrowings into fixed rates. Maturities of swap contracts are principally between one and four years.
At 31 December 2016, the fixed rates under these swap contracts varied from 2.5% p.a. to 3.4% p.a. (2015: 3.4% p.a. to 5.3% p.a.), a weighted average rate of 2.7% p.a. (2015: 4.6% p.a.).
The net fair value of interest rate swap contracts at 31 December 2016 was a $556,000 loss (2015: $1,640,000 loss).
Interest rate sensitivity analysisAt 31 December 2016, if interest rates had changed by -/+1% from the year end rates, with all other variables held constant, the impact on post-tax profit for the year for the Group and equity would have been:
2016 2015
Thousands of dollarsPost-tax
profitHedge
reservePost-tax
profit Hedge reserve
Interest rates decrease by 1% 2,100 (4,400) 2,000 (700)
Interest rates increase by 1% (2,100) 4,200 (2,000) 600
Interest rate risk exposureThe Group’s exposure to interest rate risk (after hedging) for classes of financial assets and liabilities are set out as follows:
Thousands of dollars 2016 2015
Financial assetsCash at bank and on hand 244,857 263,764
244,857 263,764
Financial liabilitiesVariable rate borrowingsSubordinated note D1 417,728 394,578Fixed interest rate – repricing dates:Twelve months or less D1 50,134 100,122One to five years D1 230,612 200,660
698,474 695,360
97ANNUAL REPORT 2016
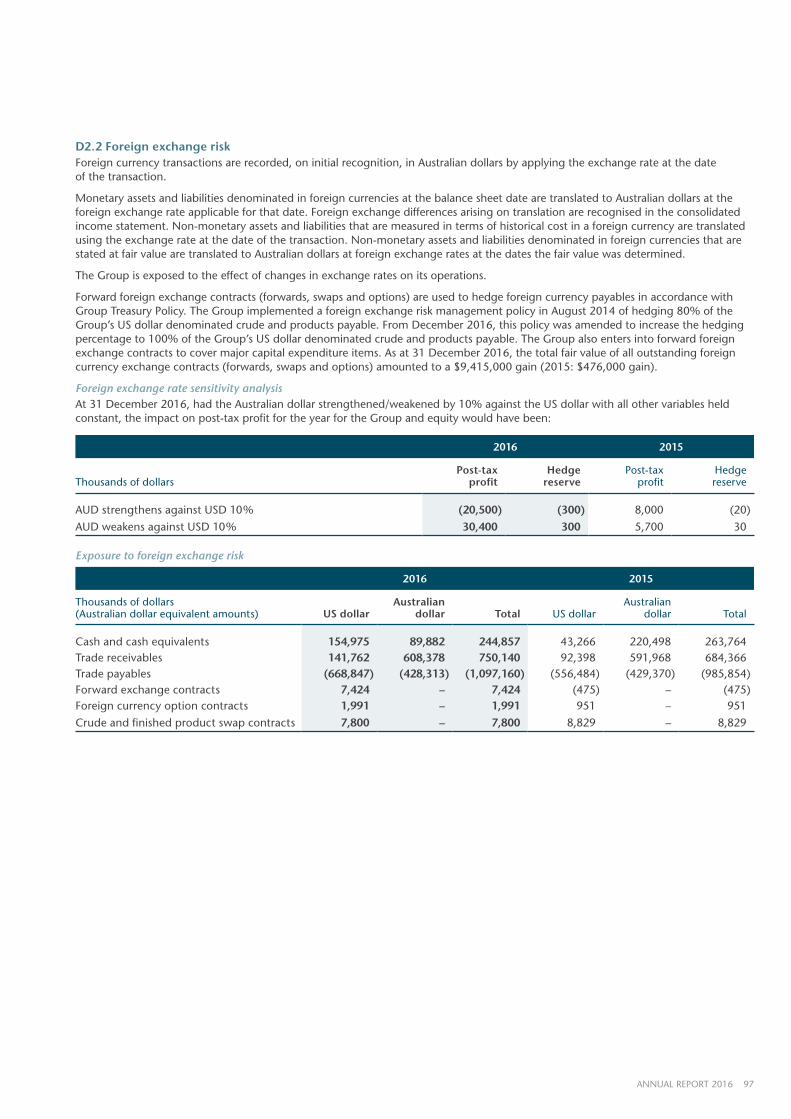
D2.2 Foreign exchange riskForeign currency transactions are recorded, on initial recognition, in Australian dollars by applying the exchange rate at the date of the transaction.
Monetary assets and liabilities denominated in foreign currencies at the balance sheet date are translated to Australian dollars at the foreign exchange rate applicable for that date. Foreign exchange differences arising on translation are recognised in the consolidated income statement. Non-monetary assets and liabilities that are measured in terms of historical cost in a foreign currency are translated using the exchange rate at the date of the transaction. Non-monetary assets and liabilities denominated in foreign currencies that are stated at fair value are translated to Australian dollars at foreign exchange rates at the dates the fair value was determined.
The Group is exposed to the effect of changes in exchange rates on its operations.
Forward foreign exchange contracts (forwards, swaps and options) are used to hedge foreign currency payables in accordance with Group Treasury Policy. The Group implemented a foreign exchange risk management policy in August 2014 of hedging 80% of the Group’s US dollar denominated crude and products payable. From December 2016, this policy was amended to increase the hedging percentage to 100% of the Group’s US dollar denominated crude and products payable. The Group also enters into forward foreign exchange contracts to cover major capital expenditure items. As at 31 December 2016, the total fair value of all outstanding foreign currency exchange contracts (forwards, swaps and options) amounted to a $9,415,000 gain (2015: $476,000 gain).
Foreign exchange rate sensitivity analysisAt 31 December 2016, had the Australian dollar strengthened/weakened by 10% against the US dollar with all other variables held constant, the impact on post-tax profit for the year for the Group and equity would have been:
2016 2015
Thousands of dollarsPost-tax
profitHedge
reservePost-tax
profit Hedge reserve
AUD strengthens against USD 10% (20,500) (300) 8,000 (20)
AUD weakens against USD 10% 30,400 300 5,700 30
Exposure to foreign exchange risk
2016 2015
Thousands of dollars(Australian dollar equivalent amounts) US dollar
Australian dollar Total US dollar
Australian dollar Total
Cash and cash equivalents 154,975 89,882 244,857 43,266 220,498 263,764Trade receivables 141,762 608,378 750,140 92,398 591,968 684,366Trade payables (668,847) (428,313) (1,097,160) (556,484) (429,370) (985,854)Forward exchange contracts 7,424 – 7,424 (475) – (475)Foreign currency option contracts 1,991 – 1,991 951 – 951
Crude and finished product swap contracts 7,800 – 7,800 8,829 – 8,829
98 CALTEX AUSTRALIA
NOTES TO THE FINANCIAL STATEMENTSD CAPITAL, FUNDING AND RISK MANAGEMENTFOR THE YEAR ENDED 31 DECEMBER 2016
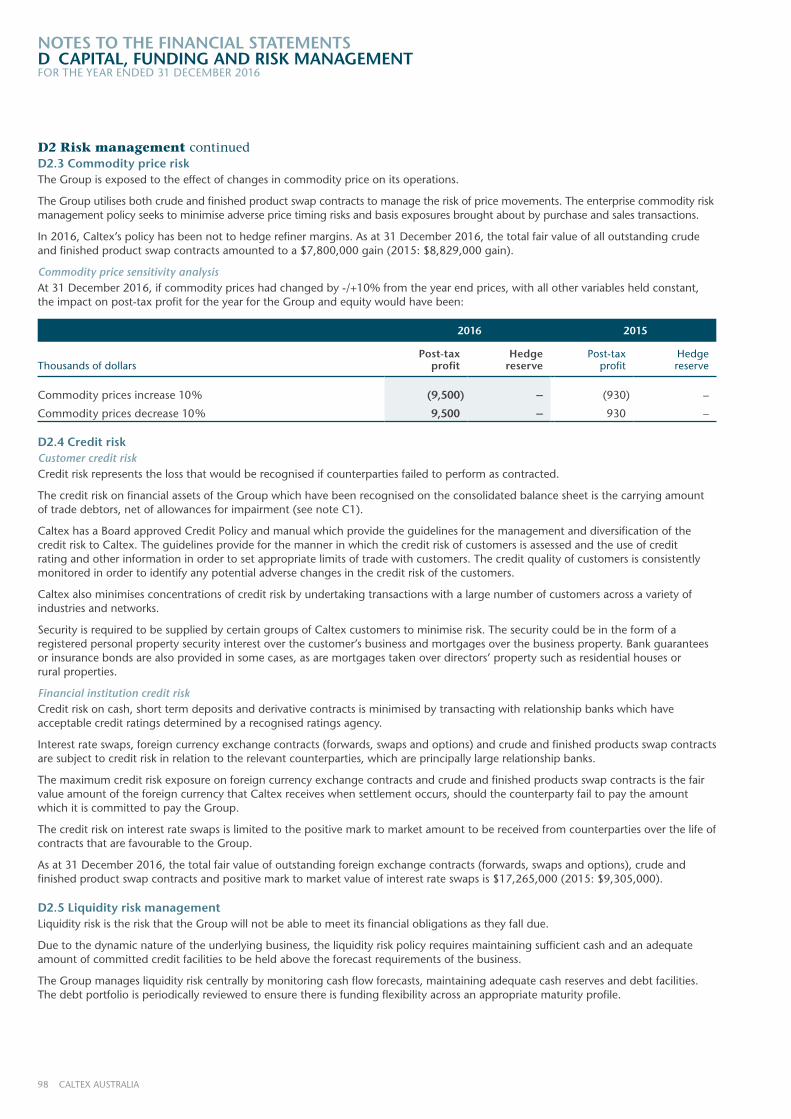
D2 Risk management continuedD2.3 Commodity price riskThe Group is exposed to the effect of changes in commodity price on its operations.
The Group utilises both crude and finished product swap contracts to manage the risk of price movements. The enterprise commodity risk management policy seeks to minimise adverse price timing risks and basis exposures brought about by purchase and sales transactions.
In 2016, Caltex’s policy has been not to hedge refiner margins. As at 31 December 2016, the total fair value of all outstanding crude and finished product swap contracts amounted to a $7,800,000 gain (2015: $8,829,000 gain).
Commodity price sensitivity analysisAt 31 December 2016, if commodity prices had changed by -/+10% from the year end prices, with all other variables held constant, the impact on post-tax profit for the year for the Group and equity would have been:
2016 2015
Thousands of dollarsPost-tax
profitHedge
reservePost-tax
profit Hedge reserve
Commodity prices increase 10% (9,500) – (930) –
Commodity prices decrease 10% 9,500 – 930 –
D2.4 Credit riskCustomer credit riskCredit risk represents the loss that would be recognised if counterparties failed to perform as contracted.
The credit risk on financial assets of the Group which have been recognised on the consolidated balance sheet is the carrying amount of trade debtors, net of allowances for impairment (see note C1).
Caltex has a Board approved Credit Policy and manual which provide the guidelines for the management and diversification of the credit risk to Caltex. The guidelines provide for the manner in which the credit risk of customers is assessed and the use of credit rating and other information in order to set appropriate limits of trade with customers. The credit quality of customers is consistently monitored in order to identify any potential adverse changes in the credit risk of the customers.
Caltex also minimises concentrations of credit risk by undertaking transactions with a large number of customers across a variety of industries and networks.
Security is required to be supplied by certain groups of Caltex customers to minimise risk. The security could be in the form of a registered personal property security interest over the customer’s business and mortgages over the business property. Bank guarantees or insurance bonds are also provided in some cases, as are mortgages taken over directors’ property such as residential houses or rural properties.
Financial institution credit riskCredit risk on cash, short term deposits and derivative contracts is minimised by transacting with relationship banks which have acceptable credit ratings determined by a recognised ratings agency.
Interest rate swaps, foreign currency exchange contracts (forwards, swaps and options) and crude and finished products swap contracts are subject to credit risk in relation to the relevant counterparties, which are principally large relationship banks.
The maximum credit risk exposure on foreign currency exchange contracts and crude and finished products swap contracts is the fair value amount of the foreign currency that Caltex receives when settlement occurs, should the counterparty fail to pay the amount which it is committed to pay the Group.
The credit risk on interest rate swaps is limited to the positive mark to market amount to be received from counterparties over the life of contracts that are favourable to the Group.
As at 31 December 2016, the total fair value of outstanding foreign exchange contracts (forwards, swaps and options), crude and finished product swap contracts and positive mark to market value of interest rate swaps is $17,265,000 (2015: $9,305,000).
D2.5 Liquidity risk managementLiquidity risk is the risk that the Group will not be able to meet its financial obligations as they fall due.
Due to the dynamic nature of the underlying business, the liquidity risk policy requires maintaining sufficient cash and an adequate amount of committed credit facilities to be held above the forecast requirements of the business.
The Group manages liquidity risk centrally by monitoring cash flow forecasts, maintaining adequate cash reserves and debt facilities. The debt portfolio is periodically reviewed to ensure there is funding flexibility across an appropriate maturity profile.
99ANNUAL REPORT 2016
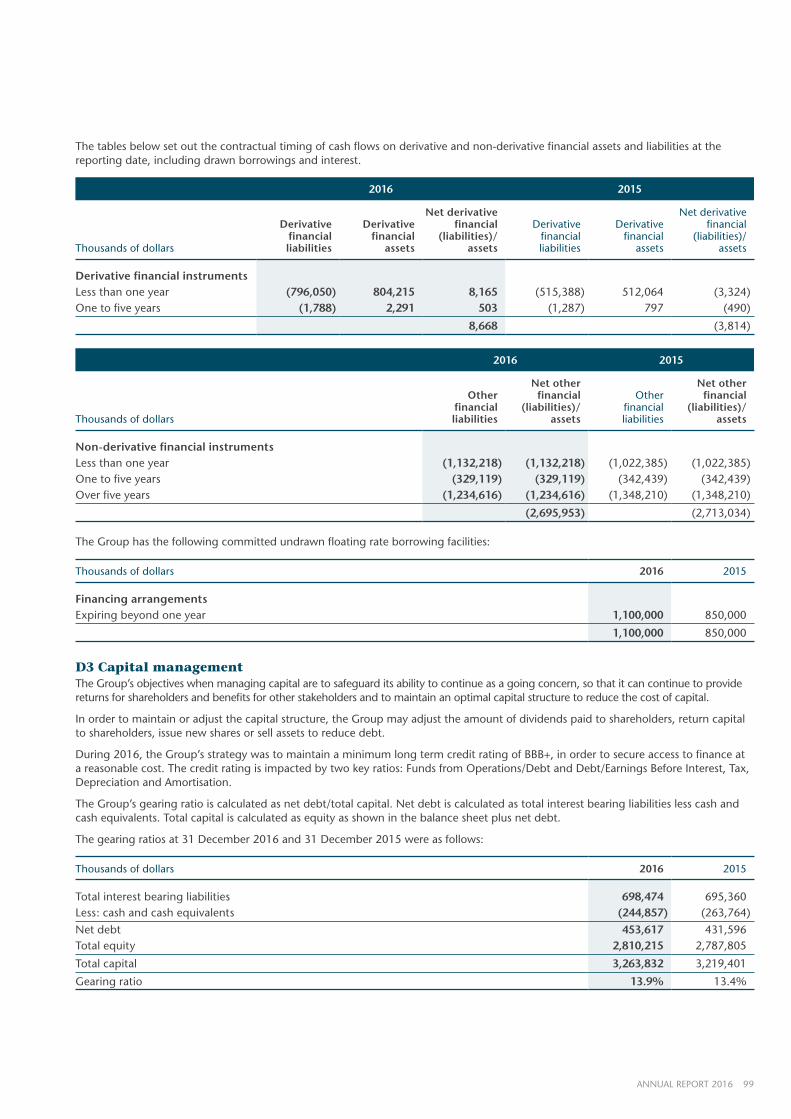
The tables below set out the contractual timing of cash flows on derivative and non-derivative financial assets and liabilities at the reporting date, including drawn borrowings and interest.
2016 2015
Thousands of dollars
Derivative financial liabilities
Derivative financial
assets
Net derivative financial
(liabilities)/ assets
Derivative financial liabilities
Derivative financial
assets
Net derivative financial
(liabilities)/ assets
Derivative financial instrumentsLess than one year (796,050) 804,215 8,165 (515,388) 512,064 (3,324)One to five years (1,788) 2,291 503 (1,287) 797 (490)
8,668 (3,814)
2016 2015
Thousands of dollars
Other financial
liabilities
Net other financial
(liabilities)/ assets
Other financial
liabilities
Net other financial
(liabilities)/ assets
Non-derivative financial instruments Less than one year (1,132,218) (1,132,218) (1,022,385) (1,022,385)One to five years (329,119) (329,119) (342,439) (342,439)Over five years (1,234,616) (1,234,616) (1,348,210) (1,348,210)
(2,695,953) (2,713,034)
The Group has the following committed undrawn floating rate borrowing facilities:
Thousands of dollars 2016 2015
Financing arrangementsExpiring beyond one year 1,100,000 850,000
1,100,000 850,000
D3 Capital managementThe Group’s objectives when managing capital are to safeguard its ability to continue as a going concern, so that it can continue to provide returns for shareholders and benefits for other stakeholders and to maintain an optimal capital structure to reduce the cost of capital.
In order to maintain or adjust the capital structure, the Group may adjust the amount of dividends paid to shareholders, return capital to shareholders, issue new shares or sell assets to reduce debt.
During 2016, the Group’s strategy was to maintain a minimum long term credit rating of BBB+, in order to secure access to finance at a reasonable cost. The credit rating is impacted by two key ratios: Funds from Operations/Debt and Debt/Earnings Before Interest, Tax, Depreciation and Amortisation.
The Group’s gearing ratio is calculated as net debt/total capital. Net debt is calculated as total interest bearing liabilities less cash and cash equivalents. Total capital is calculated as equity as shown in the balance sheet plus net debt.
The gearing ratios at 31 December 2016 and 31 December 2015 were as follows:
Thousands of dollars 2016 2015
Total interest bearing liabilities 698,474 695,360Less: cash and cash equivalents (244,857) (263,764)
Net debt 453,617 431,596Total equity 2,810,215 2,787,805
Total capital 3,263,832 3,219,401
Gearing ratio 13.9% 13.4%
100 CALTEX AUSTRALIA
NOTES TO THE FINANCIAL STATEMENTSD CAPITAL, FUNDING AND RISK MANAGEMENTFOR THE YEAR ENDED 31 DECEMBER 2016
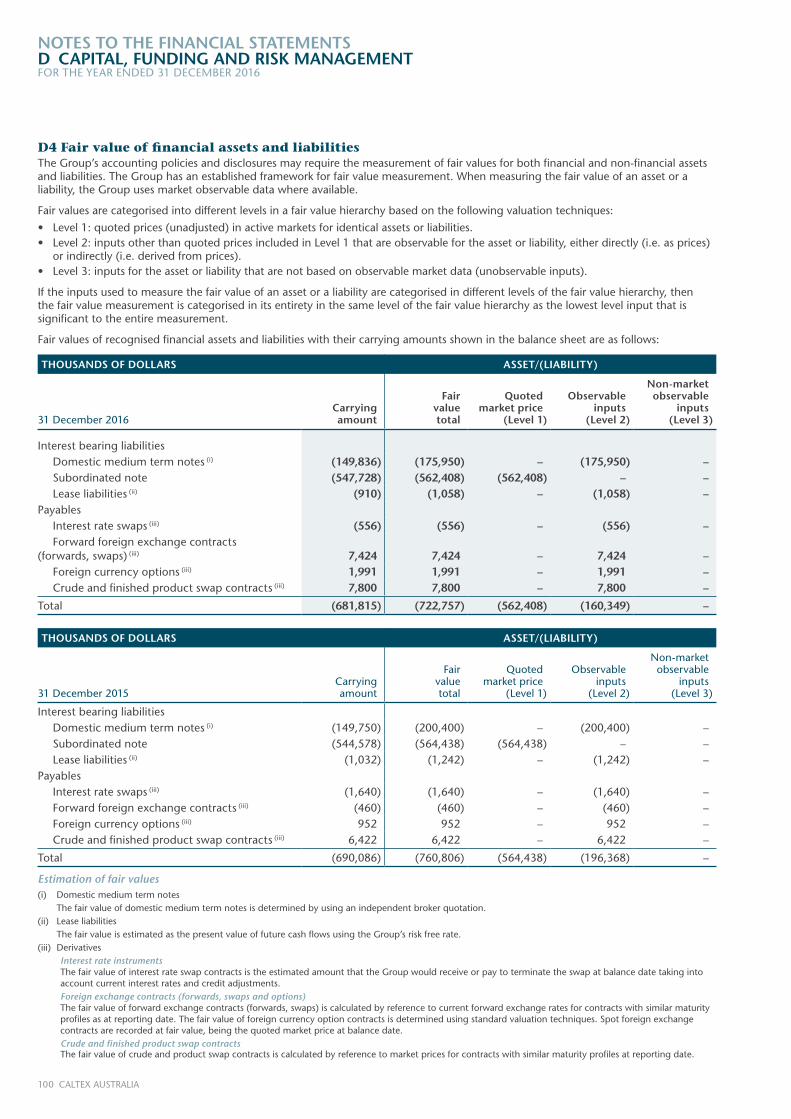
D4 Fair value of financial assets and liabilitiesThe Group’s accounting policies and disclosures may require the measurement of fair values for both financial and non-financial assets and liabilities. The Group has an established framework for fair value measurement. When measuring the fair value of an asset or a liability, the Group uses market observable data where available.
Fair values are categorised into different levels in a fair value hierarchy based on the following valuation techniques:
• Level 1: quoted prices (unadjusted) in active markets for identical assets or liabilities.• Level 2: inputs other than quoted prices included in Level 1 that are observable for the asset or liability, either directly (i.e. as prices)
or indirectly (i.e. derived from prices).• Level 3: inputs for the asset or liability that are not based on observable market data (unobservable inputs).
If the inputs used to measure the fair value of an asset or a liability are categorised in different levels of the fair value hierarchy, then the fair value measurement is categorised in its entirety in the same level of the fair value hierarchy as the lowest level input that is significant to the entire measurement.
Fair values of recognised financial assets and liabilities with their carrying amounts shown in the balance sheet are as follows:
THOUSANDS OF DOLLARS ASSET/(LIABILITY)
31 December 2016Carrying amount
Fair value total
Quoted market price
(Level 1)
Observable inputs
(Level 2)
Non-market observable
inputs(Level 3)
Interest bearing liabilities Domestic medium term notes (i) (149,836) (175,950) – (175,950) – Subordinated note (547,728) (562,408) (562,408) – – Lease liabilities (ii) (910) (1,058) – (1,058) –Payables Interest rate swaps (iii) (556) (556) – (556) – Forward foreign exchange contracts(forwards, swaps) (iii) 7,424 7,424 – 7,424 – Foreign currency options (iii) 1,991 1,991 – 1,991 – Crude and finished product swap contracts (iii) 7,800 7,800 – 7,800 –
Total (681,815) (722,757) (562,408) (160,349) –
THOUSANDS OF DOLLARS ASSET/(LIABILITY)
31 December 2015Carrying amount
Fair value total
Quoted market price
(Level 1)
Observable inputs
(Level 2)
Non-market observable
inputs(Level 3)
Interest bearing liabilities Domestic medium term notes (i) (149,750) (200,400) – (200,400) – Subordinated note (544,578) (564,438) (564,438) – – Lease liabilities (ii) (1,032) (1,242) – (1,242) –Payables Interest rate swaps (iii) (1,640) (1,640) – (1,640) – Forward foreign exchange contracts (iii) (460) (460) – (460) – Foreign currency options (iii) 952 952 – 952 – Crude and finished product swap contracts (iii) 6,422 6,422 – 6,422 –
Total (690,086) (760,806) (564,438) (196,368) –
Estimation of fair values(i) Domestic medium term notes The fair value of domestic medium term notes is determined by using an independent broker quotation.(ii) Lease liabilities The fair value is estimated as the present value of future cash flows using the Group’s risk free rate.(iii) Derivatives Interest rate instruments The fair value of interest rate swap contracts is the estimated amount that the Group would receive or pay to terminate the swap at balance date taking into
account current interest rates and credit adjustments. Foreign exchange contracts (forwards, swaps and options) The fair value of forward exchange contracts (forwards, swaps) is calculated by reference to current forward exchange rates for contracts with similar maturity
profiles as at reporting date. The fair value of foreign currency option contracts is determined using standard valuation techniques. Spot foreign exchange contracts are recorded at fair value, being the quoted market price at balance date.
Crude and finished product swap contracts The fair value of crude and product swap contracts is calculated by reference to market prices for contracts with similar maturity profiles at reporting date.
101ANNUAL REPORT 2016
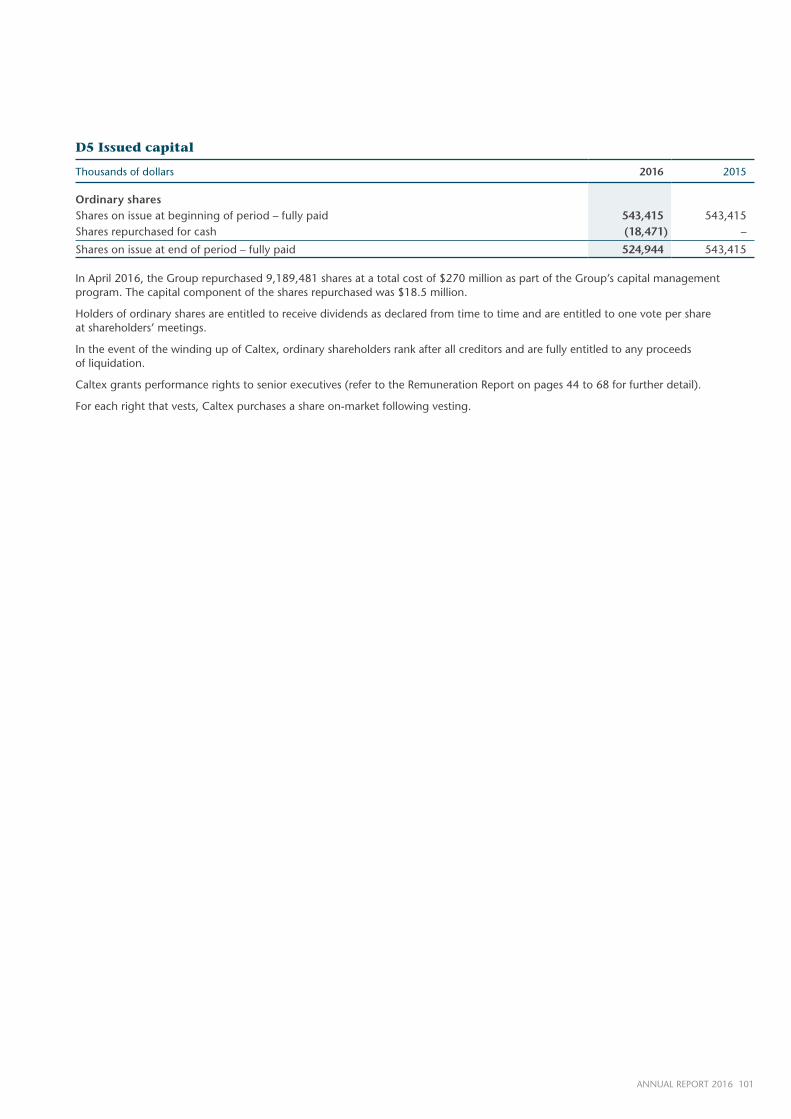
D5 Issued capital
Thousands of dollars 2016 2015
Ordinary shares Shares on issue at beginning of period – fully paid 543,415 543,415Shares repurchased for cash (18,471) –
Shares on issue at end of period – fully paid 524,944 543,415
In April 2016, the Group repurchased 9,189,481 shares at a total cost of $270 million as part of the Group’s capital management program. The capital component of the shares repurchased was $18.5 million.
Holders of ordinary shares are entitled to receive dividends as declared from time to time and are entitled to one vote per share at shareholders’ meetings.
In the event of the winding up of Caltex, ordinary shareholders rank after all creditors and are fully entitled to any proceeds of liquidation.
Caltex grants performance rights to senior executives (refer to the Remuneration Report on pages 44 to 68 for further detail).
For each right that vests, Caltex purchases a share on-market following vesting.
102 CALTEX AUSTRALIA
NOTES TO THE FINANCIAL STATEMENTSE TAXATIONFOR THE YEAR ENDED 31 DECEMBER 2016
This section provides details of the Group’s income tax expense, current tax provision and deferred tax balances and the Group’s tax accounting policies.
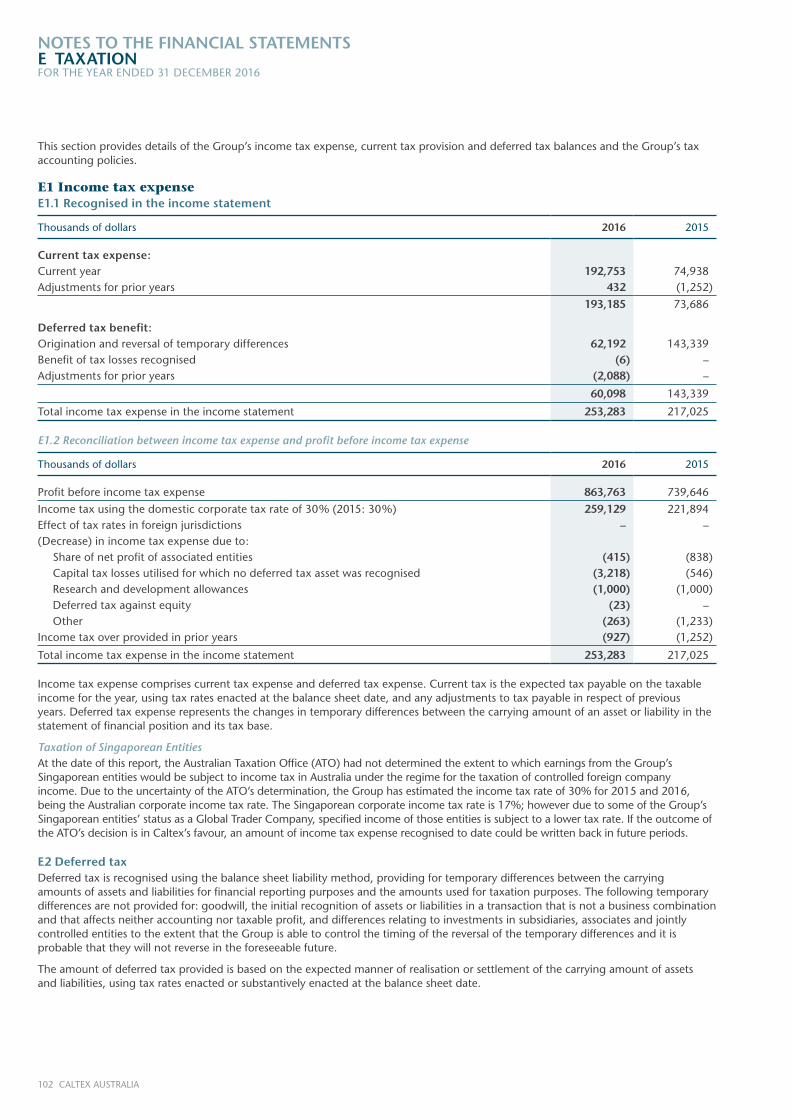
E1 Income tax expenseE1.1 Recognised in the income statement
Thousands of dollars 2016 2015
Current tax expense: Current year 192,753 74,938Adjustments for prior years 432 (1,252)
193,185 73,686
Deferred tax benefit: Origination and reversal of temporary differences 62,192 143,339Benefit of tax losses recognised (6) –Adjustments for prior years (2,088) –
60,098 143,339
Total income tax expense in the income statement 253,283 217,025
E1.2 Reconciliation between income tax expense and profit before income tax expense
Thousands of dollars 2016 2015
Profit before income tax expense 863,763 739,646
Income tax using the domestic corporate tax rate of 30% (2015: 30%) 259,129 221,894Effect of tax rates in foreign jurisdictions – –(Decrease) in income tax expense due to: Share of net profit of associated entities (415) (838) Capital tax losses utilised for which no deferred tax asset was recognised (3,218) (546) Research and development allowances (1,000) (1,000) Deferred tax against equity (23) – Other (263) (1,233)Income tax over provided in prior years (927) (1,252)
Total income tax expense in the income statement 253,283 217,025
Income tax expense comprises current tax expense and deferred tax expense. Current tax is the expected tax payable on the taxable income for the year, using tax rates enacted at the balance sheet date, and any adjustments to tax payable in respect of previous years. Deferred tax expense represents the changes in temporary differences between the carrying amount of an asset or liability in the statement of financial position and its tax base.
Taxation of Singaporean EntitiesAt the date of this report, the Australian Taxation Office (ATO) had not determined the extent to which earnings from the Group’s Singaporean entities would be subject to income tax in Australia under the regime for the taxation of controlled foreign company income. Due to the uncertainty of the ATO’s determination, the Group has estimated the income tax rate of 30% for 2015 and 2016, being the Australian corporate income tax rate. The Singaporean corporate income tax rate is 17%; however due to some of the Group’s Singaporean entities’ status as a Global Trader Company, specified income of those entities is subject to a lower tax rate. If the outcome of the ATO’s decision is in Caltex’s favour, an amount of income tax expense recognised to date could be written back in future periods.
E2 Deferred taxDeferred tax is recognised using the balance sheet liability method, providing for temporary differences between the carrying amounts of assets and liabilities for financial reporting purposes and the amounts used for taxation purposes. The following temporary differences are not provided for: goodwill, the initial recognition of assets or liabilities in a transaction that is not a business combination and that affects neither accounting nor taxable profit, and differences relating to investments in subsidiaries, associates and jointly controlled entities to the extent that the Group is able to control the timing of the reversal of the temporary differences and it is probable that they will not reverse in the foreseeable future.
The amount of deferred tax provided is based on the expected manner of realisation or settlement of the carrying amount of assets and liabilities, using tax rates enacted or substantively enacted at the balance sheet date.
103ANNUAL REPORT 2016
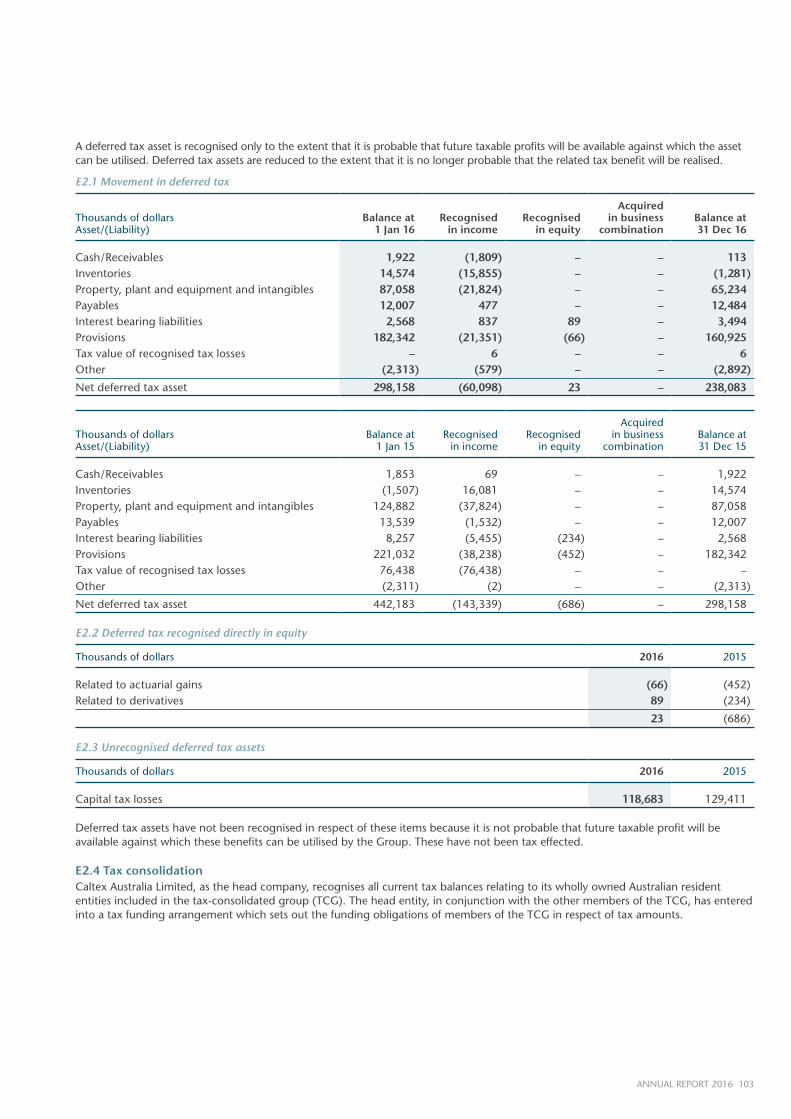
A deferred tax asset is recognised only to the extent that it is probable that future taxable profits will be available against which the asset can be utilised. Deferred tax assets are reduced to the extent that it is no longer probable that the related tax benefit will be realised.
E2.1 Movement in deferred tax
Thousands of dollarsAsset/(Liability)
Balance at1 Jan 16
Recognisedin income
Recognisedin equity
Acquired in business
combinationBalance at31 Dec 16
Cash/Receivables 1,922 (1,809) – – 113Inventories 14,574 (15,855) – – (1,281)Property, plant and equipment and intangibles 87,058 (21,824) – – 65,234Payables 12,007 477 – – 12,484Interest bearing liabilities 2,568 837 89 – 3,494Provisions 182,342 (21,351) (66) – 160,925Tax value of recognised tax losses – 6 – – 6Other (2,313) (579) – – (2,892)
Net deferred tax asset 298,158 (60,098) 23 – 238,083
Thousands of dollarsAsset/(Liability)
Balance at1 Jan 15
Recognisedin income
Recognisedin equity
Acquired in business
combinationBalance at31 Dec 15
Cash/Receivables 1,853 69 – – 1,922Inventories (1,507) 16,081 – – 14,574Property, plant and equipment and intangibles 124,882 (37,824) – – 87,058Payables 13,539 (1,532) – – 12,007Interest bearing liabilities 8,257 (5,455) (234) – 2,568Provisions 221,032 (38,238) (452) – 182,342Tax value of recognised tax losses 76,438 (76,438) – – –Other (2,311) (2) – – (2,313)
Net deferred tax asset 442,183 (143,339) (686) – 298,158
E2.2 Deferred tax recognised directly in equity
Thousands of dollars 2016 2015
Related to actuarial gains (66) (452)Related to derivatives 89 (234)
23 (686)
E2.3 Unrecognised deferred tax assets
Thousands of dollars 2016 2015
Capital tax losses 118,683 129,411
Deferred tax assets have not been recognised in respect of these items because it is not probable that future taxable profit will be available against which these benefits can be utilised by the Group. These have not been tax effected.
E2.4 Tax consolidationCaltex Australia Limited, as the head company, recognises all current tax balances relating to its wholly owned Australian resident entities included in the tax-consolidated group (TCG). The head entity, in conjunction with the other members of the TCG, has entered into a tax funding arrangement which sets out the funding obligations of members of the TCG in respect of tax amounts.
104 CALTEX AUSTRALIA
NOTES TO THE FINANCIAL STATEMENTSF GROUP STRUCTUREFOR THE YEAR ENDED 31 DECEMBER 2016
This section provides information on the Group’s structure and how this impacts the results of the Group as a whole, including details of joint arrangements, controlled entities, transactions with non-controlling interests and changes made to the Group structure during the year.
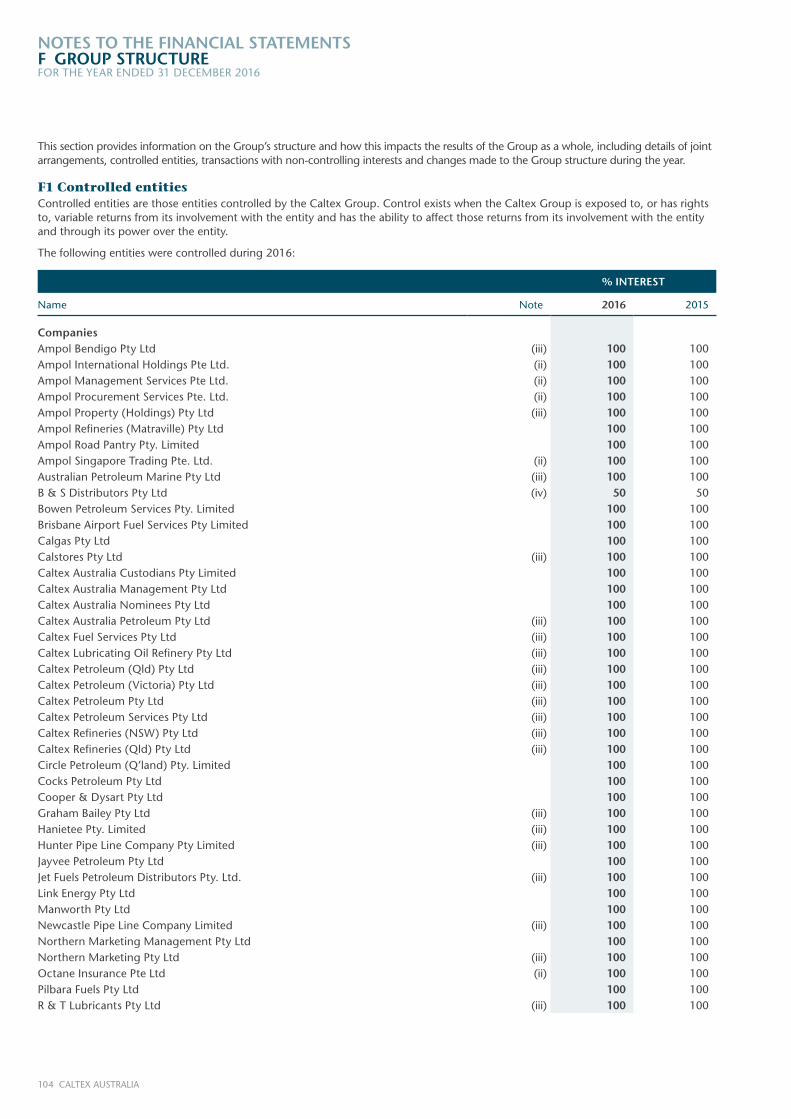
F1 Controlled entitiesControlled entities are those entities controlled by the Caltex Group. Control exists when the Caltex Group is exposed to, or has rights to, variable returns from its involvement with the entity and has the ability to affect those returns from its involvement with the entity and through its power over the entity.
The following entities were controlled during 2016:
% INTEREST
Name Note 2016 2015
CompaniesAmpol Bendigo Pty Ltd (iii) 100 100Ampol International Holdings Pte Ltd. (ii) 100 100Ampol Management Services Pte Ltd. (ii) 100 100Ampol Procurement Services Pte. Ltd. (ii) 100 100Ampol Property (Holdings) Pty Ltd (iii) 100 100Ampol Refineries (Matraville) Pty Ltd 100 100Ampol Road Pantry Pty. Limited 100 100Ampol Singapore Trading Pte. Ltd. (ii) 100 100Australian Petroleum Marine Pty Ltd (iii) 100 100B & S Distributors Pty Ltd (iv) 50 50Bowen Petroleum Services Pty. Limited 100 100Brisbane Airport Fuel Services Pty Limited 100 100Calgas Pty Ltd 100 100Calstores Pty Ltd (iii) 100 100Caltex Australia Custodians Pty Limited 100 100Caltex Australia Management Pty Ltd 100 100Caltex Australia Nominees Pty Ltd 100 100Caltex Australia Petroleum Pty Ltd (iii) 100 100Caltex Fuel Services Pty Ltd (iii) 100 100Caltex Lubricating Oil Refinery Pty Ltd (iii) 100 100Caltex Petroleum (Qld) Pty Ltd (iii) 100 100Caltex Petroleum (Victoria) Pty Ltd (iii) 100 100Caltex Petroleum Pty Ltd (iii) 100 100Caltex Petroleum Services Pty Ltd (iii) 100 100Caltex Refineries (NSW) Pty Ltd (iii) 100 100Caltex Refineries (Qld) Pty Ltd (iii) 100 100Circle Petroleum (Q’land) Pty. Limited 100 100Cocks Petroleum Pty Ltd 100 100Cooper & Dysart Pty Ltd 100 100Graham Bailey Pty Ltd (iii) 100 100Hanietee Pty. Limited (iii) 100 100Hunter Pipe Line Company Pty Limited (iii) 100 100Jayvee Petroleum Pty Ltd 100 100Jet Fuels Petroleum Distributors Pty. Ltd. (iii) 100 100Link Energy Pty Ltd 100 100Manworth Pty Ltd 100 100Newcastle Pipe Line Company Limited (iii) 100 100Northern Marketing Management Pty Ltd 100 100Northern Marketing Pty Ltd (iii) 100 100Octane Insurance Pte Ltd (ii) 100 100Pilbara Fuels Pty Ltd 100 100R & T Lubricants Pty Ltd (iii) 100 100
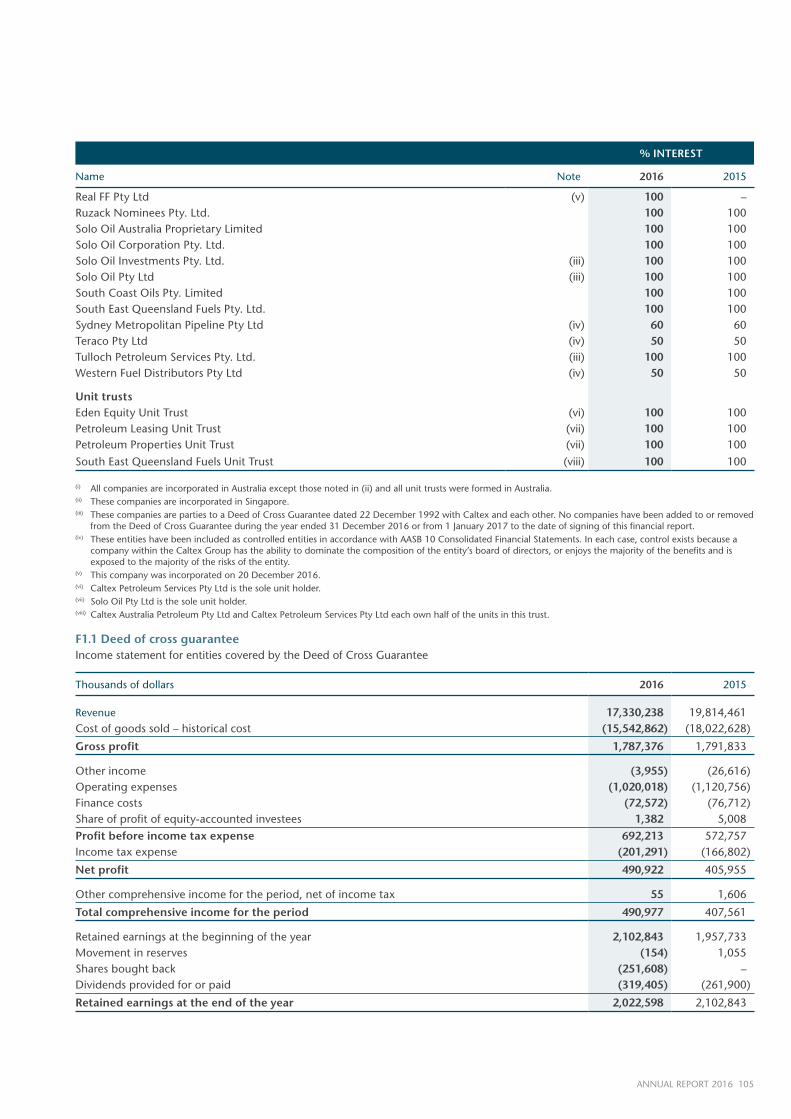
105ANNUAL REPORT 2016
% INTEREST
Name Note 2016 2015
Real FF Pty Ltd (v) 100 –Ruzack Nominees Pty. Ltd. 100 100Solo Oil Australia Proprietary Limited 100 100Solo Oil Corporation Pty. Ltd. 100 100Solo Oil Investments Pty. Ltd. (iii) 100 100Solo Oil Pty Ltd (iii) 100 100South Coast Oils Pty. Limited 100 100South East Queensland Fuels Pty. Ltd. 100 100Sydney Metropolitan Pipeline Pty Ltd (iv) 60 60Teraco Pty Ltd (iv) 50 50Tulloch Petroleum Services Pty. Ltd. (iii) 100 100Western Fuel Distributors Pty Ltd (iv) 50 50
Unit trustsEden Equity Unit Trust (vi) 100 100Petroleum Leasing Unit Trust (vii) 100 100Petroleum Properties Unit Trust (vii) 100 100
South East Queensland Fuels Unit Trust (viii) 100 100
(i) All companies are incorporated in Australia except those noted in (ii) and all unit trusts were formed in Australia.(ii) These companies are incorporated in Singapore.(iii) These companies are parties to a Deed of Cross Guarantee dated 22 December 1992 with Caltex and each other. No companies have been added to or removed
from the Deed of Cross Guarantee during the year ended 31 December 2016 or from 1 January 2017 to the date of signing of this financial report.(iv) These entities have been included as controlled entities in accordance with AASB 10 Consolidated Financial Statements. In each case, control exists because a
company within the Caltex Group has the ability to dominate the composition of the entity’s board of directors, or enjoys the majority of the benefits and is exposed to the majority of the risks of the entity.
(v) This company was incorporated on 20 December 2016.(vi) Caltex Petroleum Services Pty Ltd is the sole unit holder.(vii) Solo Oil Pty Ltd is the sole unit holder.(viii) Caltex Australia Petroleum Pty Ltd and Caltex Petroleum Services Pty Ltd each own half of the units in this trust.
F1.1 Deed of cross guaranteeIncome statement for entities covered by the Deed of Cross Guarantee
Thousands of dollars 2016 2015
Revenue 17,330,238 19,814,461Cost of goods sold – historical cost (15,542,862) (18,022,628)
Gross profit 1,787,376 1,791,833
Other income (3,955) (26,616)Operating expenses (1,020,018) (1,120,756)Finance costs (72,572) (76,712)Share of profit of equity-accounted investees 1,382 5,008
Profit before income tax expense 692,213 572,757Income tax expense (201,291) (166,802)
Net profit 490,922 405,955
Other comprehensive income for the period, net of income tax 55 1,606
Total comprehensive income for the period 490,977 407,561
Retained earnings at the beginning of the year 2,102,843 1,957,733Movement in reserves (154) 1,055Shares bought back (251,608) –Dividends provided for or paid (319,405) (261,900)
Retained earnings at the end of the year 2,022,598 2,102,843
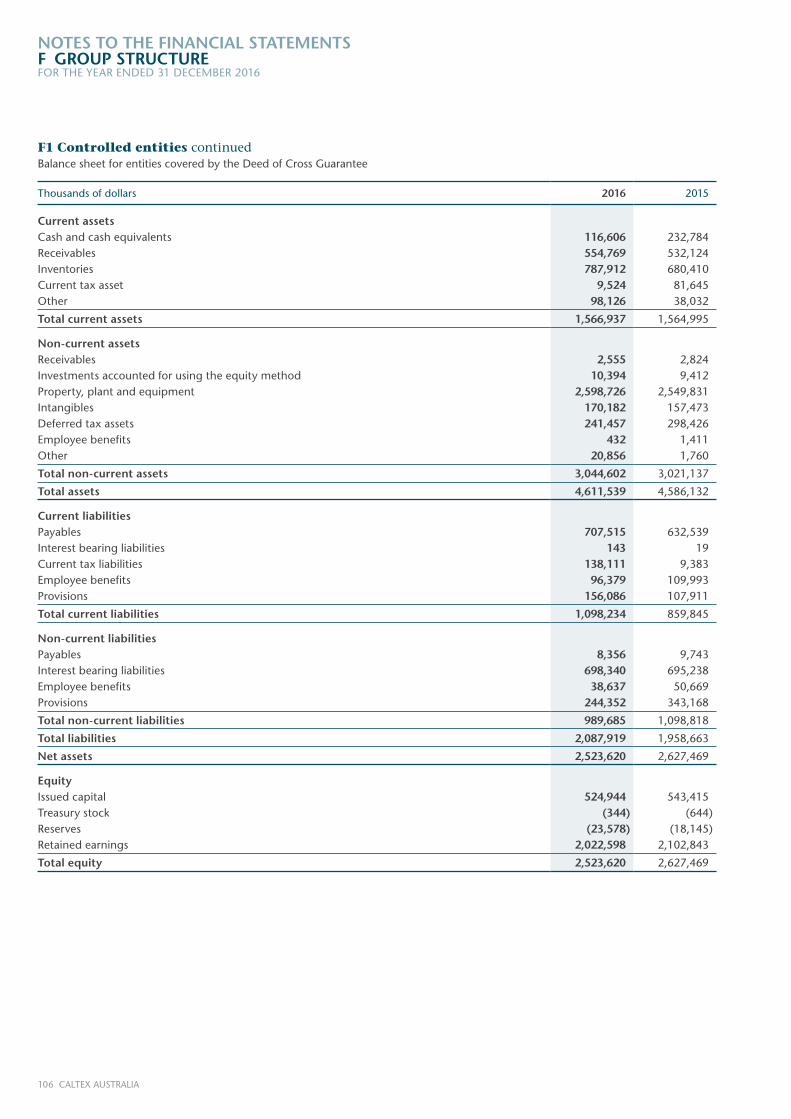
106 CALTEX AUSTRALIA
NOTES TO THE FINANCIAL STATEMENTSF GROUP STRUCTUREFOR THE YEAR ENDED 31 DECEMBER 2016
F1 Controlled entities continuedBalance sheet for entities covered by the Deed of Cross Guarantee
Thousands of dollars 2016 2015
Current assetsCash and cash equivalents 116,606 232,784Receivables 554,769 532,124Inventories 787,912 680,410Current tax asset 9,524 81,645Other 98,126 38,032
Total current assets 1,566,937 1,564,995
Non-current assetsReceivables 2,555 2,824Investments accounted for using the equity method 10,394 9,412Property, plant and equipment 2,598,726 2,549,831Intangibles 170,182 157,473Deferred tax assets 241,457 298,426Employee benefits 432 1,411Other 20,856 1,760
Total non-current assets 3,044,602 3,021,137
Total assets 4,611,539 4,586,132
Current liabilitiesPayables 707,515 632,539Interest bearing liabilities 143 19Current tax liabilities 138,111 9,383Employee benefits 96,379 109,993Provisions 156,086 107,911
Total current liabilities 1,098,234 859,845
Non-current liabilitiesPayables 8,356 9,743Interest bearing liabilities 698,340 695,238Employee benefits 38,637 50,669Provisions 244,352 343,168
Total non-current liabilities 989,685 1,098,818
Total liabilities 2,087,919 1,958,663
Net assets 2,523,620 2,627,469
EquityIssued capital 524,944 543,415Treasury stock (344) (644)Reserves (23,578) (18,145)Retained earnings 2,022,598 2,102,843
Total equity 2,523,620 2,627,469
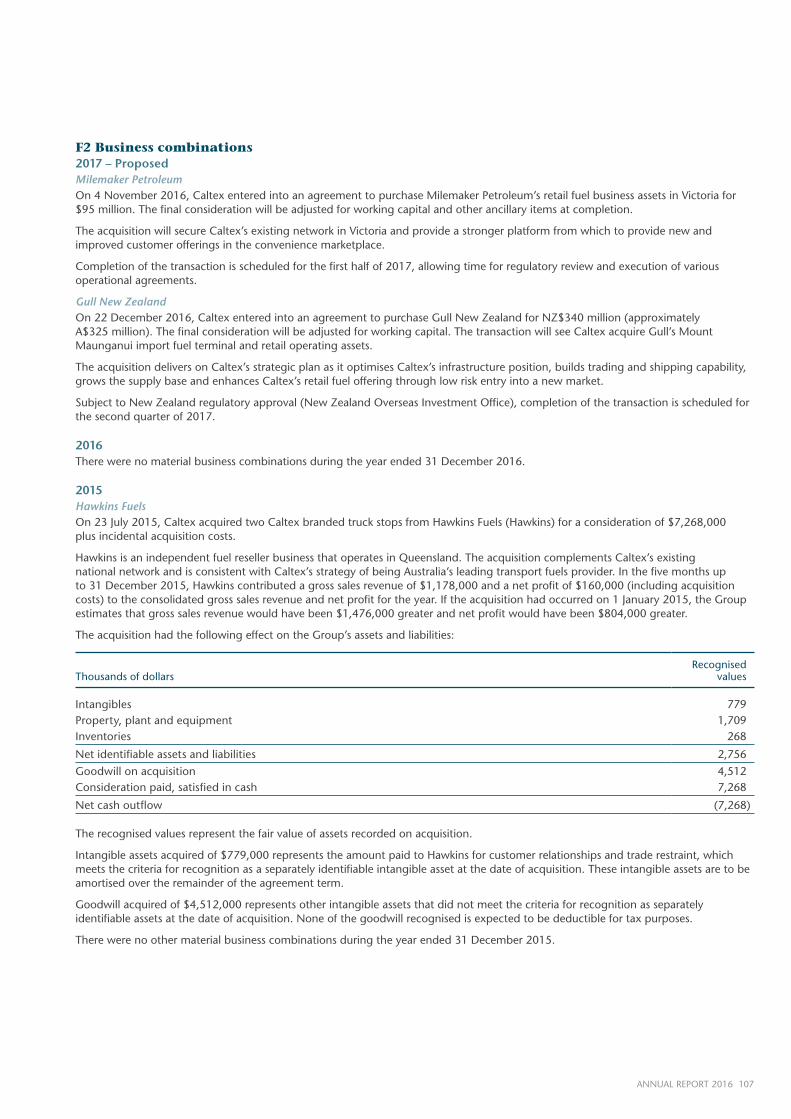
107ANNUAL REPORT 2016
F2 Business combinations2017 – ProposedMilemaker PetroleumOn 4 November 2016, Caltex entered into an agreement to purchase Milemaker Petroleum’s retail fuel business assets in Victoria for $95 million. The final consideration will be adjusted for working capital and other ancillary items at completion.
The acquisition will secure Caltex’s existing network in Victoria and provide a stronger platform from which to provide new and improved customer offerings in the convenience marketplace.
Completion of the transaction is scheduled for the first half of 2017, allowing time for regulatory review and execution of various operational agreements.
Gull New ZealandOn 22 December 2016, Caltex entered into an agreement to purchase Gull New Zealand for NZ$340 million (approximately A$325 million). The final consideration will be adjusted for working capital. The transaction will see Caltex acquire Gull’s Mount Maunganui import fuel terminal and retail operating assets.
The acquisition delivers on Caltex’s strategic plan as it optimises Caltex’s infrastructure position, builds trading and shipping capability, grows the supply base and enhances Caltex’s retail fuel offering through low risk entry into a new market.
Subject to New Zealand regulatory approval (New Zealand Overseas Investment Office), completion of the transaction is scheduled for the second quarter of 2017.
2016There were no material business combinations during the year ended 31 December 2016.
2015Hawkins FuelsOn 23 July 2015, Caltex acquired two Caltex branded truck stops from Hawkins Fuels (Hawkins) for a consideration of $7,268,000 plus incidental acquisition costs.
Hawkins is an independent fuel reseller business that operates in Queensland. The acquisition complements Caltex’s existing national network and is consistent with Caltex’s strategy of being Australia’s leading transport fuels provider. In the five months up to 31 December 2015, Hawkins contributed a gross sales revenue of $1,178,000 and a net profit of $160,000 (including acquisition costs) to the consolidated gross sales revenue and net profit for the year. If the acquisition had occurred on 1 January 2015, the Group estimates that gross sales revenue would have been $1,476,000 greater and net profit would have been $804,000 greater.
The acquisition had the following effect on the Group’s assets and liabilities:
Thousands of dollarsRecognised
values
Intangibles 779Property, plant and equipment 1,709Inventories 268
Net identifiable assets and liabilities 2,756
Goodwill on acquisition 4,512Consideration paid, satisfied in cash 7,268
Net cash outflow (7,268)
The recognised values represent the fair value of assets recorded on acquisition.
Intangible assets acquired of $779,000 represents the amount paid to Hawkins for customer relationships and trade restraint, which meets the criteria for recognition as a separately identifiable intangible asset at the date of acquisition. These intangible assets are to be amortised over the remainder of the agreement term.
Goodwill acquired of $4,512,000 represents other intangible assets that did not meet the criteria for recognition as separately identifiable assets at the date of acquisition. None of the goodwill recognised is expected to be deductible for tax purposes.
There were no other material business combinations during the year ended 31 December 2015.
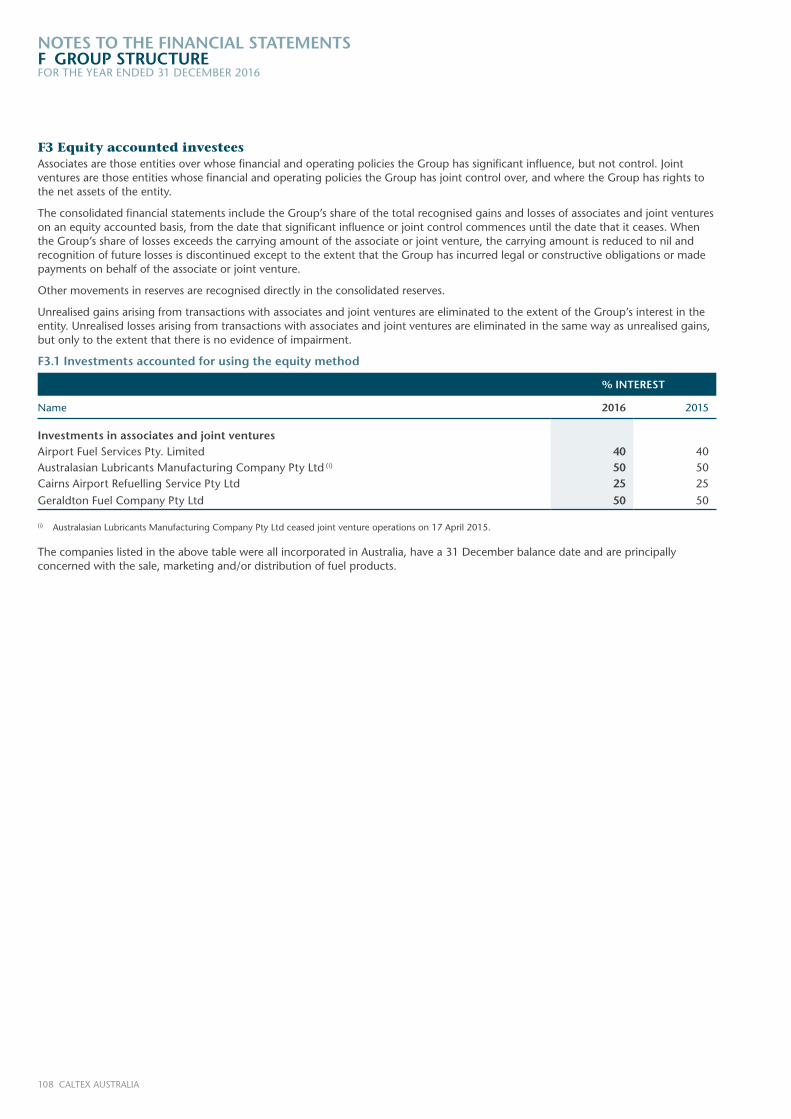
108 CALTEX AUSTRALIA
NOTES TO THE FINANCIAL STATEMENTSF GROUP STRUCTUREFOR THE YEAR ENDED 31 DECEMBER 2016
F3 Equity accounted investeesAssociates are those entities over whose financial and operating policies the Group has significant influence, but not control. Joint ventures are those entities whose financial and operating policies the Group has joint control over, and where the Group has rights to the net assets of the entity.
The consolidated financial statements include the Group’s share of the total recognised gains and losses of associates and joint ventures on an equity accounted basis, from the date that significant influence or joint control commences until the date that it ceases. When the Group’s share of losses exceeds the carrying amount of the associate or joint venture, the carrying amount is reduced to nil and recognition of future losses is discontinued except to the extent that the Group has incurred legal or constructive obligations or made payments on behalf of the associate or joint venture.
Other movements in reserves are recognised directly in the consolidated reserves.
Unrealised gains arising from transactions with associates and joint ventures are eliminated to the extent of the Group’s interest in the entity. Unrealised losses arising from transactions with associates and joint ventures are eliminated in the same way as unrealised gains, but only to the extent that there is no evidence of impairment.
F3.1 Investments accounted for using the equity method
% INTEREST
Name 2016 2015
Investments in associates and joint ventures Airport Fuel Services Pty. Limited 40 40Australasian Lubricants Manufacturing Company Pty Ltd (i) 50 50Cairns Airport Refuelling Service Pty Ltd 25 25
Geraldton Fuel Company Pty Ltd 50 50
(i) Australasian Lubricants Manufacturing Company Pty Ltd ceased joint venture operations on 17 April 2015.
The companies listed in the above table were all incorporated in Australia, have a 31 December balance date and are principally concerned with the sale, marketing and/or distribution of fuel products.
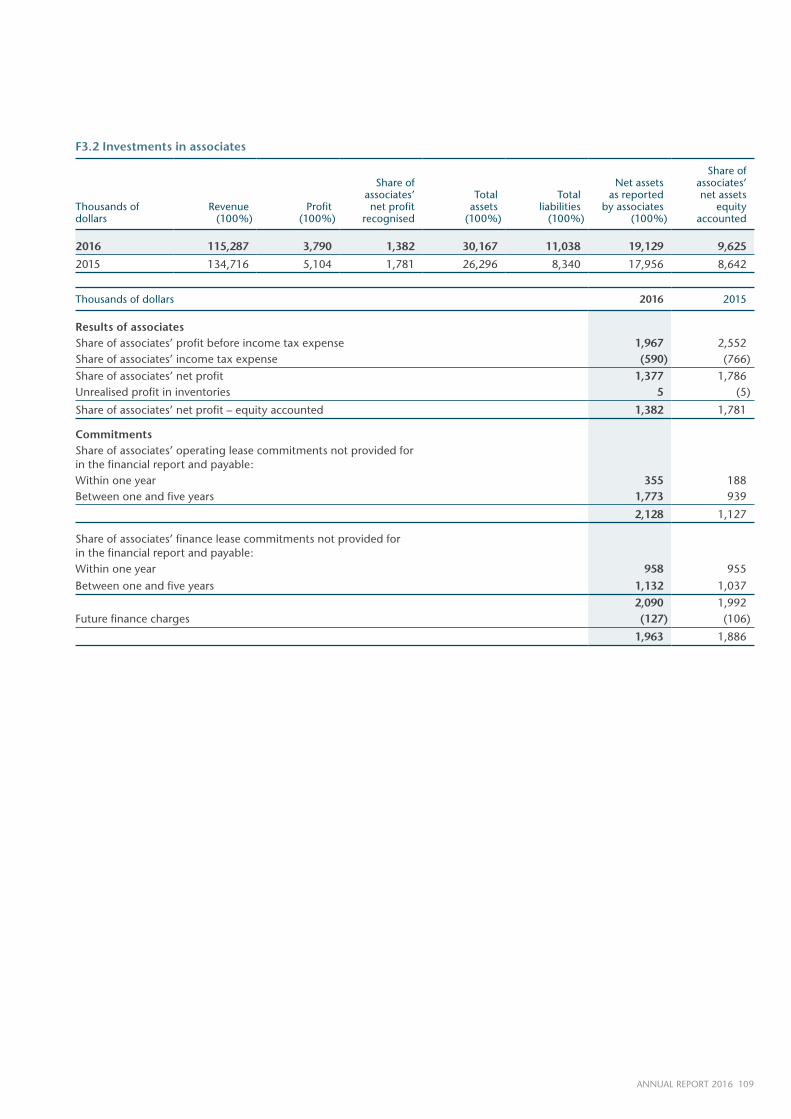
109ANNUAL REPORT 2016
F3.2 Investments in associates
Thousands of dollars
Revenue (100%)
Profit (100%)
Share of associates’ net profit
recognised
Total assets
(100%)
Total liabilities
(100%)
Net assets as reported
by associates (100%)
Share of associates’ net assets
equity accounted
2016 115,287 3,790 1,382 30,167 11,038 19,129 9,625
2015 134,716 5,104 1,781 26,296 8,340 17,956 8,642
Thousands of dollars 2016 2015
Results of associatesShare of associates’ profit before income tax expense 1,967 2,552Share of associates’ income tax expense (590) (766)
Share of associates’ net profit 1,377 1,786Unrealised profit in inventories 5 (5)
Share of associates’ net profit – equity accounted 1,382 1,781
Commitments Share of associates’ operating lease commitments not provided for in the financial report and payable:Within one year 355 188Between one and five years 1,773 939
2,128 1,127
Share of associates’ finance lease commitments not provided for in the financial report and payable:Within one year 958 955
Between one and five years 1,132 1,037
2,090 1,992Future finance charges (127) (106)
1,963 1,886
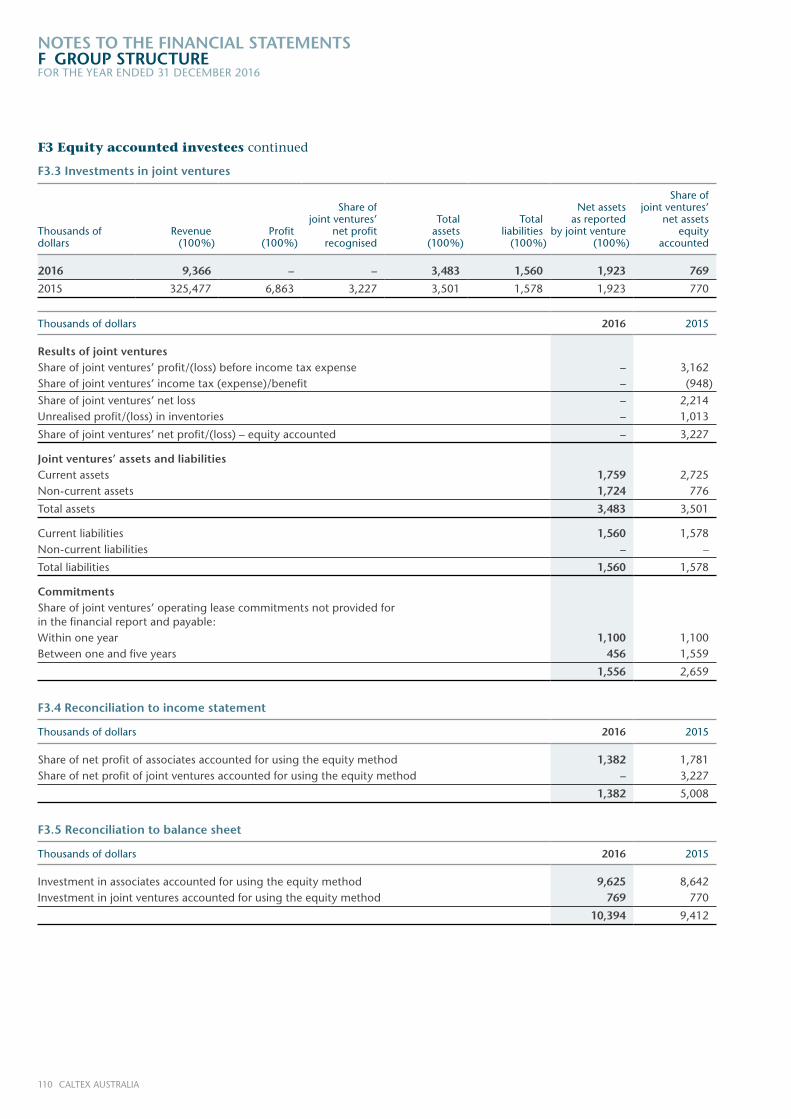
110 CALTEX AUSTRALIA
NOTES TO THE FINANCIAL STATEMENTSF GROUP STRUCTUREFOR THE YEAR ENDED 31 DECEMBER 2016
F3 Equity accounted investees continued
F3.3 Investments in joint ventures
Thousands of dollars
Revenue (100%)
Profit (100%)
Share of joint ventures’
net profit recognised
Total assets
(100%)
Totalliabilities
(100%)
Net assets as reported
by joint venture(100%)
Share ofjoint ventures’
net assetsequity
accounted
2016 9,366 – – 3,483 1,560 1,923 769
2015 325,477 6,863 3,227 3,501 1,578 1,923 770
Thousands of dollars 2016 2015
Results of joint venturesShare of joint ventures’ profit/(loss) before income tax expense – 3,162Share of joint ventures’ income tax (expense)/benefit – (948)
Share of joint ventures’ net loss – 2,214Unrealised profit/(loss) in inventories – 1,013
Share of joint ventures’ net profit/(loss) – equity accounted – 3,227
Joint ventures’ assets and liabilitiesCurrent assets 1,759 2,725Non-current assets 1,724 776
Total assets 3,483 3,501
Current liabilities 1,560 1,578Non-current liabilities – –
Total liabilities 1,560 1,578
Commitments Share of joint ventures’ operating lease commitments not provided for in the financial report and payable:Within one year 1,100 1,100Between one and five years 456 1,559
1,556 2,659
F3.4 Reconciliation to income statement
Thousands of dollars 2016 2015
Share of net profit of associates accounted for using the equity method 1,382 1,781Share of net profit of joint ventures accounted for using the equity method – 3,227
1,382 5,008
F3.5 Reconciliation to balance sheet
Thousands of dollars 2016 2015
Investment in associates accounted for using the equity method 9,625 8,642Investment in joint ventures accounted for using the equity method 769 770
10,394 9,412
111ANNUAL REPORT 2016
F4 Joint venture operationsJoint venture operations are those entities whose financial and operating policies the Group has joint control over, and where the Group has rights to the assets and obligations for the liabilities of the entity.
The interests of the Group in unincorporated joint operations are brought to account by recognising in its financial statements the assets it controls and the liabilities that it incurs, and the expenses it incurs and its share of income that it earns from the sale of goods or services by the joint operation.
The Group has joint interests in multiple Joint User Hydrant Installations (JUHIs), which are based at airports across Australia. The Group’s interest in the JUHIs ranges from 20% – 50%. The principal activity of the JUHIs is refuelling aircraft at the airports. For the year ended 31 December 2016, the contribution of the JUHIs to the operating profit of the Group was nil (2015: nil). Included in the assets and liabilities of the Group are the Group’s interests in the assets and liabilities employed in the joint venture operation:
Thousands of dollars 2016 2015
Non-current assetsPlant and equipment expenditure 62,085 59,318Less: accumulated depreciation (36,649) (34,769)
Total non-current assets 25,436 24,549
Total assets 25,436 24,549
F5 Parent entity disclosuresAs at, and throughout, the financial year ended 31 December 2016, the parent entity of the Group was Caltex Australia Limited.
Thousands of dollars 2016 2015
Result of the parent entityProfit for the period 719,277 234,857Other comprehensive income (213) 2,437
Total comprehensive income for the period 719,064 237,294
Financial position of parent entity at year endCurrent assets 35,162 81,394Total assets 1,964,100 2,009,036
Current liabilities 128,952 –Total liabilities 1,322,507 1,491,363
Total equity of the parent entity comprising:Issued capital 524,944 543,415Treasury stock (344) 5,355Reserves (23,490) (23,822)Retained earnings 140,483 (7,275)
Total equity 641,593 517,673
Parent entity guarantees in respect of the debts of its subsidiariesThe parent entity has entered into a Deed of Cross Guarantee with the effect that each company agrees to guarantee all of the debts (in full) of all companies that are parties to the deed subject to, and in accordance with, the terms set out in the deed.
Further details of the Deed of Cross Guarantee and the subsidiaries subject to the deed are disclosed in note F1.
112 CALTEX AUSTRALIA
NOTES TO THE FINANCIAL STATEMENTSG OTHER INFORMATIONFOR THE YEAR ENDED 31 DECEMBER 2016
This section includes other information to assist in understanding the financial performance and position of the Group, or items to be disclosed to comply with accounting standards and other pronouncements.
G1 CommitmentsG1.1 Capital expenditure
Thousands of dollars 2016 2015
Capital expenditure contracted but not provided for in the financial report and payable 35,624 25,564
G1.2 LeasesFinance leasesAssets of the Group acquired under finance leases are capitalised and included in property, plant and equipment at the lesser of fair value or present value of the minimum lease payments with a corresponding finance lease liability. Contingent rentals are written off as an expense of the period in which they are incurred. Capitalised lease assets are depreciated over the shorter of the lease term and their useful life.
Minimum lease payments are apportioned between the finance charge and the reduction of the outstanding liability. The finance charge components of lease payments are charged to the consolidated income statement to reflect a constant finance rate on the remaining balance of the liability for each accounting period.
2016 2015
Thousands of dollars
Minimum lease
payments Interest Principal
Minimum lease
payments Interest Principal
Within one year 219 85 134 219 97 122Between one and five years 889 113 776 1,109 199 910
1,108 198 910 1,328 296 1,032
The Group leases plant and equipment under finance leases expiring from one to four years. No contingent rentals were paid during the year (2015: nil).
Operating leasesPayments made under operating leases are charged against net profit or loss in equal instalments over the accounting period covered by the lease term, except where an alternative basis is more representative of the benefits to be derived from the leased property. Contingent rentals are recognised as an expense in the period in which they are incurred. Lease incentives received are recognised in the consolidated income statement as an integral part of the total lease expense on a straight-line basis over the lease term.
Thousands of dollars 2016 2015
Non-cancellable operating leases – Group as lessee Future minimum rentals payable: Within one year 127,466 130,117Between one and five years 430,119 412,000After five years 344,887 350,560
902,472 892,677
The Group holds operating leases expiring from one to 36 years. Leases generally provide the Group with a right of renewal at which time all terms are renegotiated. Lease payments comprise mainly a base amount; however, in a few cases, they include a base amount and incremental contingent rental. Contingent rentals are based on operating performance criteria. Contingent rentals of $478,760 were paid during the year (2015: $466,497).
The expense recognised in the income statement during the year in respect of operating leases is $167,980,000 (2015: $161,583,000).
There are no restrictions placed upon the Group by entering into these leases. Renewals are at the option of the specific entity that holds the lease.
113ANNUAL REPORT 2016
G1 Commitments continuedG1.2 Leases continued
Thousands of dollars 2016 2015
Non-cancellable operating leases – Group as lessor Future minimum rentals receivable: Within one year 6,557 68,870Between one and five years 178,233 128,296After five years 5,396 39,052
190,186 236,218
The Group has granted operating leases expiring from one to 15 years. Some of the leased properties have been sublet by the Group. The leases and subleases expire between 2017 and 2032.
Note B1 shows the rental income recognised in the income statement in respect of operating leases.
G2 Contingent liabilitiesDiscussed below are items where either it is not probable that the Group will have to make future payments or the amounts of the future payments are not able to be measured.
Legal and other claimsIn the ordinary course of business, the Group is involved as a plaintiff or defendant in legal proceedings. Where appropriate, Caltex takes legal advice. The Group does not consider that the outcome of any current proceedings is likely to have a material effect on its operations or financial position.
A liability has been recognised for any known losses expected to be incurred where such losses are capable of reliable measurement.
Bank guaranteesThe Group has granted indemnities to banks to cover bank guarantees given on behalf of controlled entities to a maximum exposure of $5,385,000 (2015: $4,671,000).
Deed of Cross Guarantee and class order reliefVarious companies in the Caltex Group are party to a Deed of Cross Guarantee dated 22 December 1992 with Caltex Australia Limited and each other pursuant to ASIC Class Order CO 98/1418 (“Deed”) (see note F1).
Under the Deed, each participating company agrees to guarantee in full all of the debts of all of the companies that are party to the Deed subject to, and in accordance with, the terms set out in the Deed.
114 CALTEX AUSTRALIA
NOTES TO THE FINANCIAL STATEMENTSG OTHER INFORMATIONFOR THE YEAR ENDED 31 DECEMBER 2016
G3 Related party disclosures2016Since Chevron Global Energy Inc. held a 50% interest in Caltex until 30 March 2015, there have been no related party transactions in the year ended 31 December 2016.
2015Until 30 March 2015, Chevron Global Energy Inc. held a 50% interest in Caltex. Transactions with the Chevron Group up until that point are summarised below.
The Caltex Group paid $1,019,000 to the Chevron Group for technical service fees. The Group received $1,250,000 for technical service fees from the Chevron Group. These fees are in the ordinary course of business and on normal commercial terms and conditions.
The Caltex Group paid $282,000 to the Chevron Group, including Iron Horse Insurance Company for insurance coverage. Dealings with Iron Horse Insurance Company are in the ordinary course of business and on normal commercial terms and conditions.
The Caltex Group purchased crude, other refinery feedstocks and petroleum products from the Chevron Group of $913,068,000. The Caltex Group sold crude, other refinery feedstocks and petroleum products to the Chevron Group of $73,791,000. These purchases and sales are in the ordinary course of business and on normal commercial terms and conditions.
The Chevron Group seconded one employee primarily to provide specialist expertise at Lytton refinery. The total cost borne by Caltex in respect of this secondee was $90,000 for one secondee. This cost includes salary and bonuses, allowances including relocation, and indirect payroll related expenses.
Caltex seconded three employees to various roles within the Chevron Group during 2015. The Chevron Group paid the salary and bonuses, allowances including relocation, and indirect payroll related expenses of these Caltex employees.
AssociatesThe Group sold petroleum products to associates totalling $98,320,000 (2015: $106,498,000). The Group received income from associates for rental income of $477,000 (2015: $155,000).
Details of associates are set out in note F3. Amounts receivable from associates are set out in note C1. Dividend and disbursement income from associates is $400,000 (2015: $800,000).
Caltex has interests in associates primarily for the marketing, sale and distribution of fuel products. Details of Caltex’s interests are set out in note F3.
Joint venturesCaltex has interests in joint ventures primarily for the marketing, sale and distribution of fuel products. There were no related party transactions with Caltex’s joint venture entities during 2016 (2015: nil). Details of Caltex’s interests are set out in notes F3 and F4.
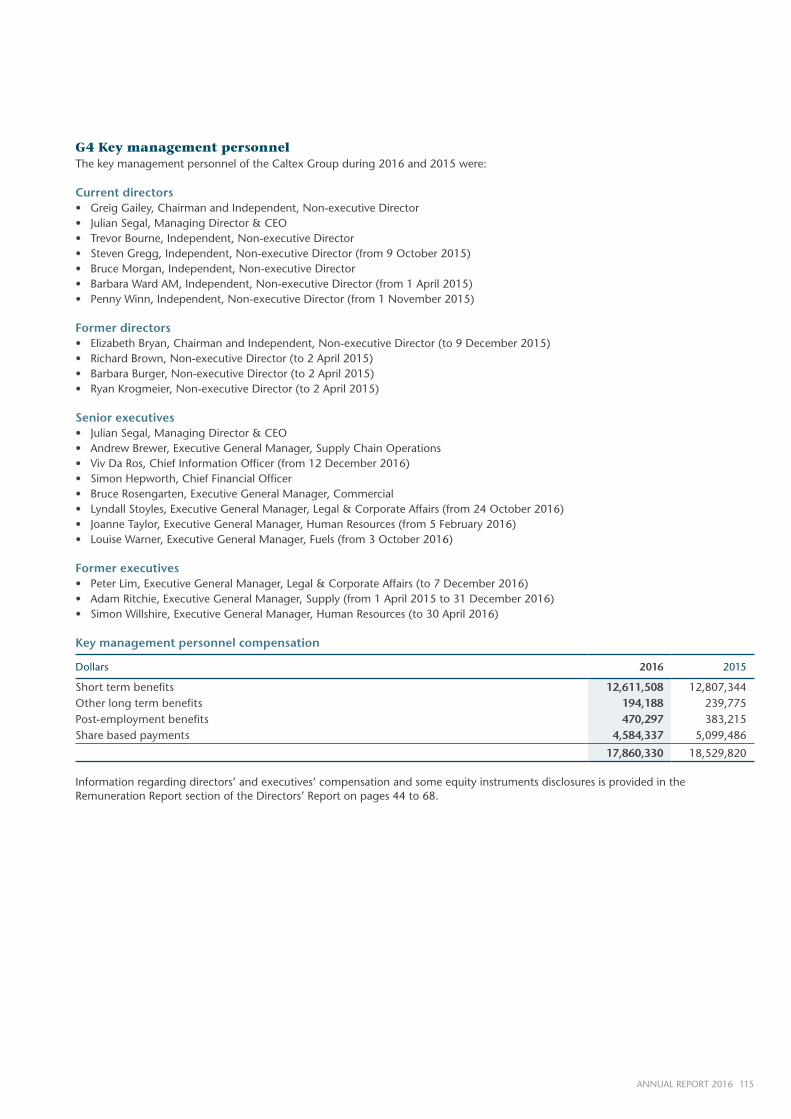
115ANNUAL REPORT 2016
G4 Key management personnelThe key management personnel of the Caltex Group during 2016 and 2015 were:
Current directors• Greig Gailey, Chairman and Independent, Non-executive Director• Julian Segal, Managing Director & CEO• Trevor Bourne, Independent, Non-executive Director• Steven Gregg, Independent, Non-executive Director (from 9 October 2015)• Bruce Morgan, Independent, Non-executive Director• Barbara Ward AM, Independent, Non-executive Director (from 1 April 2015)• Penny Winn, Independent, Non-executive Director (from 1 November 2015)
Former directors• Elizabeth Bryan, Chairman and Independent, Non-executive Director (to 9 December 2015)• Richard Brown, Non-executive Director (to 2 April 2015)• Barbara Burger, Non-executive Director (to 2 April 2015)• Ryan Krogmeier, Non-executive Director (to 2 April 2015)
Senior executives• Julian Segal, Managing Director & CEO• Andrew Brewer, Executive General Manager, Supply Chain Operations• Viv Da Ros, Chief Information Officer (from 12 December 2016)• Simon Hepworth, Chief Financial Officer• Bruce Rosengarten, Executive General Manager, Commercial• Lyndall Stoyles, Executive General Manager, Legal & Corporate Affairs (from 24 October 2016)• Joanne Taylor, Executive General Manager, Human Resources (from 5 February 2016)• Louise Warner, Executive General Manager, Fuels (from 3 October 2016)
Former executives• Peter Lim, Executive General Manager, Legal & Corporate Affairs (to 7 December 2016)• Adam Ritchie, Executive General Manager, Supply (from 1 April 2015 to 31 December 2016)• Simon Willshire, Executive General Manager, Human Resources (to 30 April 2016)
Key management personnel compensation
Dollars 2016 2015
Short term benefits 12,611,508 12,807,344Other long term benefits 194,188 239,775Post-employment benefits 470,297 383,215Share based payments 4,584,337 5,099,486
17,860,330 18,529,820
Information regarding directors’ and executives’ compensation and some equity instruments disclosures is provided in the Remuneration Report section of the Directors’ Report on pages 44 to 68.

116 CALTEX AUSTRALIA
NOTES TO THE FINANCIAL STATEMENTSG OTHER INFORMATIONFOR THE YEAR ENDED 31 DECEMBER 2016
G4 Key management personnel continuedPerformance rightsSince 1 January 2007, Senior Executives may receive performance rights under Caltex’s Equity Incentive Plan, based on the achievement of specific targets related to the performance of the Group. The measure of performance is Total Shareholder Returns (TSR) over a three year period relative to a comparator group.
OPENING BALANCE GRANTED VESTED DURING THE YEAR LAPSED DURING THE YEAR CLOSING BALANCE
Number of performance
rightsStartdate
Number of performance
rights
Fair value of performance
rights ($)
Distributiondate
Number of performance
rights
Weighted average fair valueper share
($)Lapsed
date
Number of performance
rights
Weighted average fair valueper share
($)
Number of performance
rights
Fair valueaggregate
($)
2016951,454 4 Apr 16 276,309 13.34 1 Apr 16 (333,821) 33.82 Q1 2016 (3,680) – 583,894 8,193,885426,798 4 Apr 16 184,206 30.68 Q2 2016 (132,914) – 206,708 4,375,595103,749 Q3 2016 (112,290) – 505,661 11,300,979
Q4 2016 (63,548) –
1,482,001 460,515 (333,821) (312,432) 1,296,263 23,870,459
20151,340,033 8 Apr 15 326,229 15.69 9 Jan 15 (16,859) 35.35 Q1 2015 (24,350) – 951,454 12,420,390
215,272 8 Apr 15 108,743 31.76 1 Apr 15 (746,052) 35.13 Q2 2015 (116,239) – 426,798 8,660,332462,806 Q3 2015 (45,909) – 103,749 3,295,068
Q4 2015 (21,673) –
2,018,111 434,972 (762,911) (208,171) 1,482,001 24,375,790
For information regarding the inputs used in the measurement of the fair values at each grant date, please refer to table 8 of the Remuneration Report on page 63 of the Directors’ Report.
G5 Notes to the cash flow statementG5.1 Reconciliation of cash and cash equivalentsCash and cash equivalents comprise cash balances and call deposits with an original maturity of three months or less. Bank overdrafts that are repayable on demand and form an integral part of the Group’s cash management are included as a component of cash and cash equivalents for the purpose of the consolidated cash flow statement.
For the purposes of the cash flow statement, cash and cash equivalents includes:
Thousands of dollars 2016 2015
Cash at bank 244,857 263,764
Total cash and cash equivalents 244,857 263,764
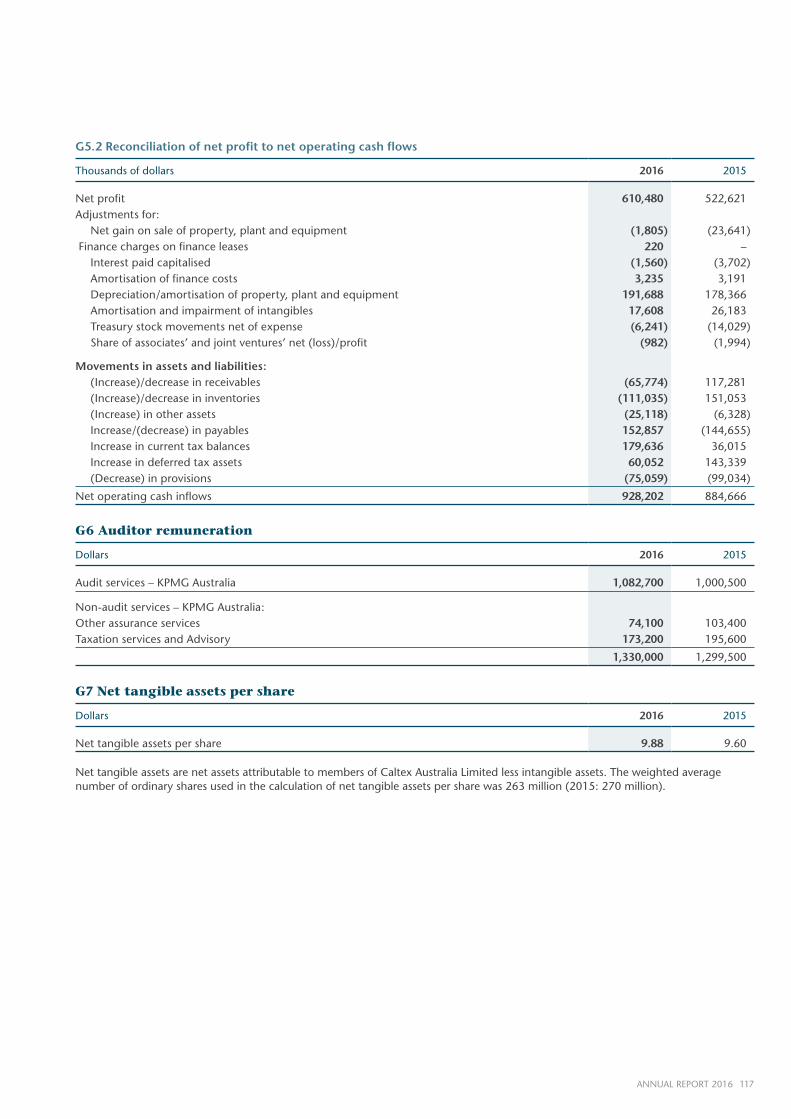
117ANNUAL REPORT 2016
G5.2 Reconciliation of net profit to net operating cash flows
Thousands of dollars 2016 2015
Net profit 610,480 522,621Adjustments for: Net gain on sale of property, plant and equipment (1,805) (23,641) Finance charges on finance leases 220 – Interest paid capitalised (1,560) (3,702) Amortisation of finance costs 3,235 3,191 Depreciation/amortisation of property, plant and equipment 191,688 178,366 Amortisation and impairment of intangibles 17,608 26,183 Treasury stock movements net of expense (6,241) (14,029) Share of associates’ and joint ventures’ net (loss)/profit (982) (1,994)
Movements in assets and liabilities: (Increase)/decrease in receivables (65,774) 117,281 (Increase)/decrease in inventories (111,035) 151,053 (Increase) in other assets (25,118) (6,328) Increase/(decrease) in payables 152,857 (144,655) Increase in current tax balances 179,636 36,015 Increase in deferred tax assets 60,052 143,339 (Decrease) in provisions (75,059) (99,034)
Net operating cash inflows 928,202 884,666
G6 Auditor remuneration
Dollars 2016 2015
Audit services – KPMG Australia 1,082,700 1,000,500
Non-audit services – KPMG Australia:Other assurance services 74,100 103,400Taxation services and Advisory 173,200 195,600
1,330,000 1,299,500
G7 Net tangible assets per share
Dollars 2016 2015
Net tangible assets per share 9.88 9.60
Net tangible assets are net assets attributable to members of Caltex Australia Limited less intangible assets. The weighted average number of ordinary shares used in the calculation of net tangible assets per share was 263 million (2015: 270 million).
118 CALTEX AUSTRALIA
NOTES TO THE FINANCIAL STATEMENTSG OTHER INFORMATIONFOR THE YEAR ENDED 31 DECEMBER 2016
G8 New standards and interpretations not yet adoptedA number of new standards, amendments to standards and interpretations are effective for annual periods beginning after 1 January 2017, and have not been applied in preparing these consolidated financial statements. None of these are expected to have a significant effect on the consolidated financial statements of the Group, except for:
• AASB 9 Financial Instruments, which becomes mandatory for the Group’s 2018 consolidated financial statements and could change the classification and measurement of financial assets and liabilities. The Group does not plan to adopt this standard early and the extent of the impact has not been determined. The actual impact of adopting AASB9 on the Group’s consolidated financial statements in 2018 is not known and cannot be reliably estimated because it will be dependent on the financial instruments that the Group holds and economic conditions at the time as well as accounting elections and judgments that it will make in the future. However, the Group has performed a preliminary assessment of the potential impact of adoption of AASB9 based on its positions as 31 December 2016 and hedging relationships designated during 2016 under AASB139 and does not expect the a significant impact on the financial statements as a result of adoption of this standard.
• AASB 15 Revenue from Contracts with Customers, which becomes mandatory for the Group’s 2018 consolidated financial statements and could change the basis for the recognition of revenue. The Group does not plan to adopt this standard early and the extent of the impact has not been determined. The Group has performed an initial assessment of the potential impact of the adoption of AASB15 on its consolidated financial statements. Based on this assessment, the Group does not expect significant differences in the timing or amount of revenue recognition. The Group plans to adopt AASB15 in its consolidated financial statements for the year ending 31 December 2018; however, the specific approach and practical expedients to be adopted have not yet been determined. The Group is currently in the process of finalising its detailed assessment of the impact resulting from the application of AASB15.
• IFRS 16 Leases, which becomes mandatory for the Group’s 2019 consolidated financial statements and requires that operating leases be recognised on the balance sheet. The Group does not plan to adopt this standard early and the extent of the impact has not been determined.
G9 Events subsequent to the end of the yearLate in 2016 Caltex announced the proposed acquisition of Milemaker Petroleum and Gull New Zealand. Additionally Woolworths announced the sale of it’s fuel business to BP, subject to regulatory approval. Caltex’s 3.5 billion litre fuel supply arrangement with Woolworths is linked to Woolworths’ continued ownership of the business. These three separate announcements did not impact the 2016 financial result for Caltex. They are however expected to have an impact in future periods. There were no other items, transactions or events of a material or unusual nature, that, in the opinion of the Board, are likely to significantly affect the operations of Caltex, the results of those operations or the state of affairs of the Group subsequent to 31 December 2016.