financial report 2017 - nomura-re-hd.co.jp · nomura real estate holdings, inc. 1 financial report...
TRANSCRIPT

Financial ReportFor the Year Ended March 31, 2017
2017Management’s Discussion and Analysis 1
Consolidated Balance Sheet 13
Consolidated Statement of Income 15
Consolidated Statement of Comprehensive Income 16
Consolidated Statement of Changes in Net Assets 17
Consolidated Statement of Cash Flows 18
Notes to Consolidated Financial Statements 19
Independent Auditors’ Report 53

Management’s Discussion and Analysis
Trends in the Real Estate Industry
The housing sales market was characterized by impressions that
sales prices were expensive due to persistently high construction
costs and intensified demand for the purchase of land, which led to
a buyer shift to the used-housing market, a drop in the rate of con-
tracts and adjustments in the number of supplied housing units in
the Tokyo metropolitan area.
Condominium sales in the Tokyo region decreased by 11.6%
year-on-year to 35,772 units in the calendar year 2016. The con-
tract number for the first month on newly marketed condominium
units in 2016 decreased by 5.7 percentage points year-on-year to
68.8% and it underperformed the benchmark of 70%.
In the office market, vacancy rates remain at a low level against
the backdrop of improvements in the employment environment and
corporate earnings despite the rise in large properties in the Tokyo
metropolitan area. In addition, the rent level continues to rise gradu-
ally, particularly in the central area of Tokyo.
The office building vacancy rate in the five wards of central
Tokyo declined by 0.74 percentage points as of March 31, 2017,
improving to 3.6%. Average rent levels in the five wards of central
Tokyo as of March 31, 2017 increased by ¥826 per tsubo to
¥18,730 compared to March 31, 2016.
In the real estate investment market, there is a continuing envi-
ronment of investment fund inflow backed by low interest rates.
Among J-REITs, there were a series of new listings on the market
and capital increases through public offerings, and assets under
management have solidly expanded as a result of an increase
in property acquisitions mainly comprising logistics facilities
and hotels.
Expected yields on A-class office buildings in the Marunouchi/
Otemachi area decreased by 0.1 percentage points year-on-year
to 3.6% as of March 31, 2017.
Analysis of Operating Results
In this business environment, the Nomura Real Estate Group
(the “Group”) posted the following consolidated performance for
the fiscal year under review: Operating revenue of ¥569,681 million,
which represents an increase of 0.0% year on year; operating profit
of ¥77,271 million, a decrease of 4.5%; ordinary profit of ¥68,952
million, a decrease of 5.1%; and profit attributable to owners of
parent of ¥47,005 million, a decrease of 0.4%.
This year our ROA ratio was 4.9% and our ROE ratio was
10.1%. They were lower than the fiscal year ended March 31,
2016, but they are still maintaining high levels.
Condominium Supply and Contract Rates in the Tokyo Metropolitan Area (calendar year)(units) (%)
35,722
68.8
2012 2013 2014 2015 20160
15,000
30,000
45,000
60,000
0
60
70
80
90
Vacancy Rates and Rent Levels in the Five Wards of Tokyo (as of March 31)(yen) (%)
18,730
3.6
2013 2014 2015 2016 20170
14,000
16,000
18,000
20,000
0
4.0
6.0
8.0
10.0
1,776.3
3.6
2013 2014 2015 2016 20170
400
800
1,200
1,600
2,000
0
1
2
3
4
5
Condominium Supply (left axis) Contract Rates (right axis)
Source: Real Estate Economic Institute Co., Ltd.
Rent Levels (left axis) Vacancy Rates (right axis)
Source: Miki Shoji Co., Ltd.
TSE REIT Index (left axis) Expected Yields (right axis)
Source: Changes in TSE REIT Index: BloombergChanges in Expected Yield: Japan Real Estate Institute “The Japanese Real Estate Investor Survey”* Expected yields for A-class office buildings in Marunouchi and Otemachi are shown
Operating Income (left axis) ROA (right axis)
*ROA = (Operating Income + Non-operating Income) / End-period Total Assets
Changes in TSE REIT Index (as of March 31) and Expected Yield* (as of April 1)(points) (%)
Changes in Operating Income and ROA*
(millions of yen) (%)
77,271
4.9
0
25,000
50,000
75,000
100,000
0
2
4
6
8
2012 2013 2014 2015 2016 2017
(CY)
(CY)
(Years ended March 31)(CY)
Nomura Real Estate Holdings, Inc. 1 Financial Report 2017 Nomura Real Estate Holdings, Inc. 2 Financial Report 2017

Operating Results by Segment
An overview of segment achievements is given below:
Operating revenue for each segment includes internal sales and
transfers among segments. Due to the rounding of fractions, total
figures may not match.
Concerning the summary of operating results by unit, Nomura
Real Estate Heating and Cooling Supply Co., Ltd., which had been
classified under the Leasing Unit, was transferred to the Property &
Facility Management Unit. In accordance with this change, the
figures for the previous fiscal year have been calculated under the
new classification.
Residential Development Unit
Operating revenue in the Residential Development Unit totaled
¥329,788 million, which represents a decrease of 1.4% year on
year, and operating profit totaled ¥27,787 million, a decrease of
12.9%, resulting in decreases in both revenue and operating profit
compared with the previous fiscal year.
This was mainly due to a decrease in the number of housing
unit sales recorded in the housing sales business.
In regard to housing sales, we posted the combined sales of
condominiums and detached houses of 5,567 units (a decrease
of 439 units year on year), including PROUD TOWER Tachikawa
(Tachikawa-shi, Tokyo) and PROUD CITY Tsukaguchi Mark Forest
(Amagasaki-shi, Hyogo), for condominiums, and PROUD SEASON
Sengawa Ryokukei no Machi (Chofu-shi, Tokyo) for detached houses.
As of the end of the fiscal year under review, the number of
completed housing inventories totaled 654 units (an increase of
305 units compared with the end of the previous fiscal year) and
the number of contracted but not recorded housing units totaled
2,779 units (a decrease of 714 units compared with the end of the
previous fiscal year).
The Company is actively engaging in the development business
in regional hub cities and overseas, including participation in proj-
ects in front of Shizuoka Station and Okayama Station and the
launch of housing sales businesses in Ho Chi Minh, Vietnam, and
Shenyang, China.
Leasing Unit
Operating revenue in the Leasing Unit totaled ¥115,010 million,
which represents an increase of 4.3% year on year, and operating
profit totaled ¥32,567 million, an increase of 2.7%, resulting in in-
creases in both revenue and operating profit compared with the
previous fiscal year.
This was mainly due to an increase in leasing revenue in the
Leasing Business due to an improvement in the vacancy rate, as
well as an increase in revenues from the sale of properties in the
property development business.
The vacancy rate as of the end of the fiscal year under review
has remained at a low level of 0.8% (a decrease of 1.4 percentage
points compared with the end of the previous fiscal year).
Construction of facilities including the Yokohama Nomura Build-
ing office building, the GEMS Kanda retail facility, and the Landport
Komaki logistics facility has been completed.
Investment Management Unit
Operating revenue in the Investment Management Unit totaled
¥9,663 million, which represents a decrease of 11.9% year on year,
and operating profit totaled ¥6,017 million, a decrease of 18.4%,
resulting in decreases in both revenue and operating profit com-
pared with the previous fiscal year.
This was mainly due to the posting of asset acquisition fees
associated with the merger of three listed REITs in the previous
fiscal year.
Assets under management increased due to the merger
between Nomura Real Estate Master Fund, Inc. and TOP REIT, Inc.
in September 2016 and totaled ¥1,260,064 million (an increase of
¥185,583 million compared with the end of the previous fiscal year)
as of the end of the fiscal year under review.
In addition, the Company conducted a replacement of assets
between Nomura Real Estate Development Co., Ltd. and Nomura
Real Estate Master Fund, Inc., representing 11 properties and a
transaction value of ¥60,855 million, in accordance with the Basic
Agreement on the Leasing Value Chain concluded in May 2015.
Property Brokerage & CRE Unit
Operating revenue in the Property Brokerage & CRE Unit totaled
¥34,820 million, which represents a decrease of 1.6% year on year,
and operating profit totaled ¥9,124 million, a decrease of 7.8%, re-
sulting in decreases in both revenue and operating profit compared
with the previous fiscal year.
This was mainly due to the booking of revenues from the sale
of properties in the previous fiscal year, while the number of trans-
actions and total transaction value in property brokerage increased.
In the retail business, we opened the following new branch stores:
Iidabashi Center (Chiyodaku, Tokyo) and Toyonaka Center (Toyona-
ka-shi, Osaka) in April 2016, Oizumi-gakuen Center (Nerima-ku,
Tokyo) in October 2016, and Ueno Center (Taito-ku, Tokyo) in
November 2016, and the total number of branch stores is 73.
In the wholesale business, operations had been conducted by
both the Corporate Real Estate Service Division of Nomura Real
Estate Development Co., Ltd. and the Asset Sales Division of
Nomura Real Estate Urban Net Co., Ltd. However, a reorganization
was implemented on October, 2016, integrating employees and
functions into the Corporate Real Estate Service Division of Nomura
Real Estate Development Co., Ltd.
Nomura Real Estate Holdings, Inc. 1 Financial Report 2017 Nomura Real Estate Holdings, Inc. 2 Financial Report 2017

Property & Facility Management Unit
Operating revenue in the Property & Facility Management Unit
totaled ¥95,765 million, which represents an increase of 4.6% year
on year, and operating profit totaled ¥6,939 million, an increase of
21.9%, resulting in increases in both revenue and operating profit
compared with the previous fiscal year.
This was mainly due to an increase in construction ordered for
large-scale repair work for condominiums and an increase in mem-
bership fees in the fitness club business.
In the fitness club business, we opened various types of fitness
clubs such as a personal gym MEGALOS_0+ Ebisu (Shibuya-ku,
Tokyo), a woman-only studio MEGALOS_Reflet Ebisu (Shibuya-ku,
Tokyo), and an around-the-clock MEGALOS_24 Hamadayama
(Suginami-ku, Tokyo). In addition, we are promoting the senior
business under the brand name OUKAS.
In addition, as of the end of the fiscal year under review, the
number of buildings under management was 702 buildings (down
3 from the end of the previous fiscal year), and the number of con-
dominiums under management was 168,999 units (up 5,963).
Other Unit
Operating revenue in the Other Unit totaled ¥106 million, which
represents a decrease of 92.2% year on year, and operating loss
totaled ¥30 million (the previous fiscal year was operating loss of
¥152 million).
Key Factors of Changes by Segment from 2016 to 2017 (billions of yen)
2016Actual
ResidentialDevelopment
LeasingInvestment
Management PropertyBrokerage
& CRE
Property & Facility
Management
Other Adjustments
2017Actual
– 4.1
– 1.3
– 0.7
+0.8+1.2
+0.1 +0.4
80.9 77.2
• Decrease in the number of housing units sold
• Increase in rent due to the improvement in vacancy rate
• Rebound from acquisition fee associated with the merger of 3 listed REITs in FY16/3
(Years ended March 31)
Nomura Real Estate Holdings, Inc. 3 Financial Report 2017 Nomura Real Estate Holdings, Inc. 4 Financial Report 2017

Analysis of Financial Position
Assets
Total assets were ¥1,593,094 million, which was an increase of
¥107,644 million compared to March 31, 2016. Current assets
increased by ¥75,528 million compared to March 31, 2016 to
¥684,307 million. Noncurrent assets were ¥908,787 million, which
was an increase of ¥32,117 million compared to March 31, 2016.
This was mainly due to an increase of ¥73,977 million in invento-
ries, including real estate for sale, and an increase of ¥25,975
million in land compared to March 31, 2016.
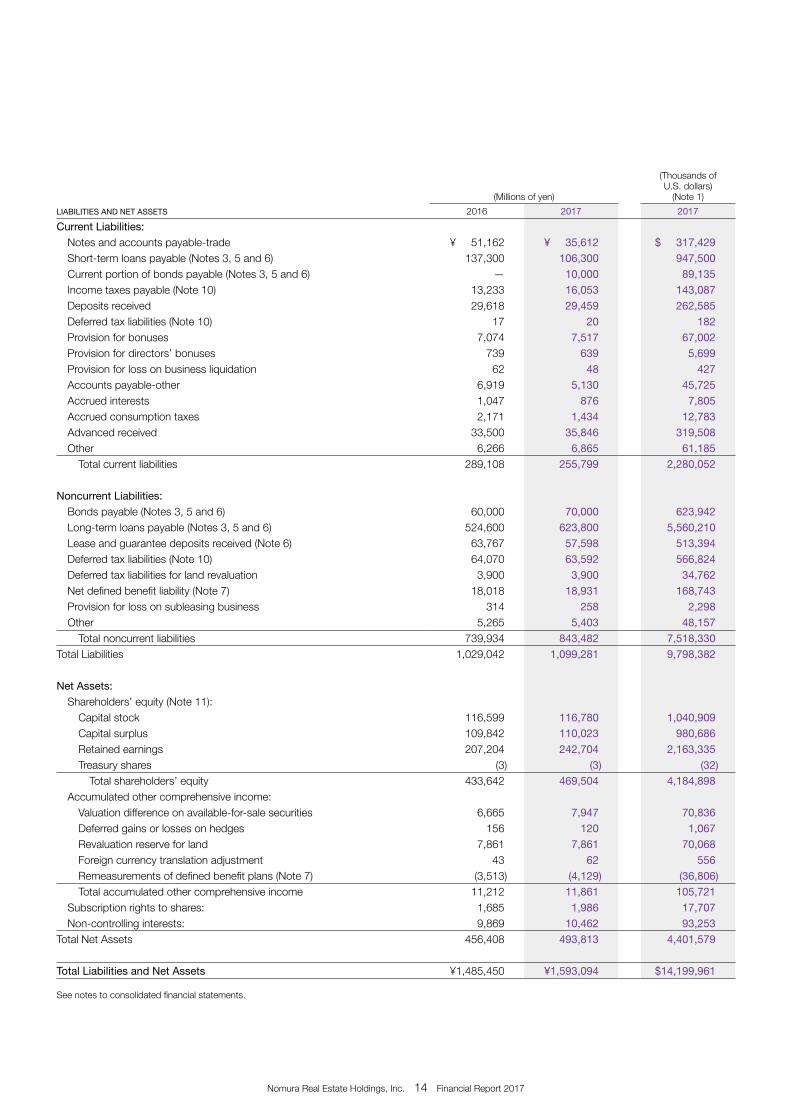
Liabilities
Total liabilities were ¥1,099,281 million, which was an increase of
¥70,239 million compared with March 31, 2016.
Current liabilities decreased by ¥33,309 million compared with
March 31, 2016 to ¥255,799 million. This was mainly due to a de-
crease of ¥15,550 million in notes and accounts payable - trade
compared to March 31, 2016.
Noncurrent liabilities were ¥843,482 million, which was an in-
crease of ¥103,548 million compared to March 31, 2016. This was
mainly due to an increase of ¥99,200 million in long-term loans
payable and an increase of ¥10,000 million in bonds payable.
As a result of these factors, interest-bearing liabilities were
¥810,100 million, which was an increase of ¥88,200 million com-
pared to March 31, 2016. Further, our debt-to-equity ratio has
increased to 1.7 times from 1.6 times in March 31, 2016.
Net Assets
Net assets increased by ¥37,405 million compared to March 31,
2016 to ¥493,813 million. This was mainly due to factors including
increases of ¥35,500 million in retained earnings compared to
March 31, 2016.
As a result, shareholders’ equity increased by ¥35,862 million
compared to March 31, 2016 to ¥469,504 million. The sharehold-
ers’ equity ratio increased from 29.9% as of March 31, 2016
to 30.2%.
Major operating-related indices for each business are shown in the table below.
(As of March 31) 2013 2014 2015 2016 2017
Residential Development Unit:
Condominium sales (units) 5,111 5,491 6,162 5,363 4,885
Detached housing sales (units) 638 718 859 643 682
Gross margin ratio of housing sales (%) 22.5 21.7 21.1 21.9 21.7
Completed housing inventories (released for sale) (units) (Note 1) 42 31 87 134 252
Completed housing inventories (unreleased) (units) (Note 1) — 0 2 215 402
Leasing Unit:
Vacancy rate 2.2 2.9 4.5 2.2 0.8
Investment Management Unit:
Outstanding assets under management (millions of yen) 1,127,495 1,132,246 1,123,188 1,074,481 1,260,064
Property Brokerage & CRE Unit:
Brokerage: Number of transactions 6,494 7,437 7,174 7,710 8,272
Brokerage: Total transaction value (millions of yen) 540,698 672,774 710,980 713,574 745,147
Property & Facility Management Unit:
Buildings under management 723 703 729 705 702
Condominiums under management (units) 137,745 147,516 155,706 163,036 168,999
Other Unit:
Members of MEGALOS 132,196 141,564 140,395 144,263 140,743
Note 1: The number of March 2013 is the sum of completed housing inventories (released for sale) (unit) and completed housing inventories (unreleased) (unit).
Changes in Interest-bearing Liabilities (millions of yen)
810,100
2012 2013 2014 2015 2016 20170
300,000
600,000
900,000
(As of March 31)
Nomura Real Estate Holdings, Inc. 3 Financial Report 2017 Nomura Real Estate Holdings, Inc. 4 Financial Report 2017

Business Unit (Millions of yen) 2016 2017 Change
Residential Development ¥ 686 ¥ 427 ¥ (257)Leasing 47,885 56,224 8,339Investment Management 46 22 (23)Property Brokerage and CRE 633 649 16 Property and Facility Management 1,336 1,754 419Other 6 0 (6)Subtotal 50,592 59,079 8,487 Adjustments 1,213 1,295 81 Total 51,805 60,374 8,569
We acquired the following properties in the fiscal year ended March 31, 2017:
Company Name Property Name (location)Business Segment Use Size of Construction or Details of Facilities, etc. Area (m2)
Acquisition Price (Millions of yen)
Nomura Real Estate Development Co., Ltd. (Note)
Yokohama Nomura Building (Nishi-ku, Yokohama-shi, Kanagawa)
Leasing Office, Retail facility
Steel-framed concrete construction, 17 floors above ground / 1 other building
Building: 58,755Land: 6,721
¥29,573
Nomura Rea Estate Development Co., Ltd.
NOF Nihonbashi honcho Building (Chuo-ku, Tokyo)
Leasing Office Steel-framed reinforced concrete construction, 8 floors above ground / 3 floors below
Building: 29,430Land: 3,196
23,130
Nomura Real Estate Development Co., Ltd.
NOF Tameike Building (Minato-ku, Tokyo)
Leasing Office Steel-framed concrete construction, 9 floors above ground / 1 floor below
Building: 6,478 Land: 690
4,562
NREG TOSHIBA BUILDING Co., Ltd.
NREG Sapporo Building (Sapporo-shi, Hokkaido)
Leasing Hotel, Retail
Steel-framed concrete construction, (partially steel-framed reinforced con-crete construction), 10 floors above ground / 1 floor below
Building: 5,905 Land: 946
3,068
Note: Refers to calculated area owned including both total floor and land area.
We sold the following properties in the fiscal year ended March 31, 2017:
Company Name Property Name (location)Business Segment Use Size of Construction or Details of Facilities, etc. Area (m2)
Selling Price (Millions of yen)
Nomura Real Estate Development Co., Ltd.
Hukagawa Gyazaria Tower (Note) (Koto-ku, Tokyo)
Leasing Office Steel-framed concrete construction, (partially steel-framed reinforced con-crete construction), 22 floors above ground / 2 floors below
Building: 41,446 Land: 2,948
¥7,820
Note: Land area includes leased land.
Changes in Net Assets and Shareholders’ Equity Ratio(millions of yen) (%)
Credit Rating Situation
Rating and Investment Information, Inc. (R&I) and Japan Credit
Rating Agency, Ltd. (JCR) assign the following ratings to the various
corporate bonds issued by Nomura Real Estate Holdings:
Rating Agency Long-term Short-term
Rating and Investment Information, Inc. (R&I) A– a-1Japan Credit Rating Agency, Ltd. (JCR) A J-1
Cash Flows
Cash flows from operating activities
Net cash used in operating activities was ¥31,890 million (a de-
crease of ¥45,148 million year-on-year). This was mainly due to
profit before income taxes of ¥69,307 million, while inventories and
income taxes paid increased.
Cash flows from investing activities
Net cash used in investing activities amounted to ¥54,559 million
(a year-on-year increase of ¥5,156 million). This mainly reflected the
purchase of tangible and intangible assets.
Cash flows from financing activities
Net cash provided by financing activities totaled by ¥76,576 million
(a year-on-year increase of ¥22,938 million). This was mainly due
to the implementation of funds procurement through long-term
borrowings and issuance of corporate bonds, despite the payment
of dividends.
Facilities Situation
In the fiscal year ended March 31, 2017, we invested a total amount
of ¥60,374 million in facilities, including the NOF Nihonbashi honcho
Building (Chuo-ku, Tokyo).
493,813
30.2
0
100,000
200,000
300,000
400,000
500,000
0
10
20
30
40
50
2012 2013 2014 2015 2016 2017 Net Assets (left axis) Shareholders’ Equity Ratio (right axis) (As of March 31)
Nomura Real Estate Holdings, Inc. 5 Financial Report 2017 Nomura Real Estate Holdings, Inc. 6 Financial Report 2017

Major Facilities and Equipment
Major facilities and equipment by unit for the Nomura Real Estate Group and its consolidated subsidiaries are as follows.
1) Leasing Unit
Company Name Property Name (location) Use Size of Construction or Details of Facility, etc.Total Floor Area (m2)
Completion of Construction or
(Time of Acquisition)
Area of Property
(m2)
Book Value (Millions of yen)
Facility Land Other Total
NREG TOSHIBA BUILDING
Hamamatsucho Building / Toshiba Building (Minato-ku, Tokyo)
Office
Steel-framed reinforced concrete con-struction (partially steel-framed reinforced concrete), 3 floors below ground, 39 floors above ground
158,732 March 1984 33,921 ¥15,795 ¥129,809 ¥ 313 ¥145,918
Nomura Real Estate Development
Yokohama Business Park(Hodogaya-ku, Yokohama-shi, Kanagawa)
Office
Steel-framed construction (partially steel-framed reinforced concrete), 2 floors below ground, 21 floors above ground, 11 other buildings
245,200Mainly
February 199070,817 33,272 14,584 524 48,382
NREG TOSHIBA BUILDING
LAZONA Kawasaki Toshiba Building(Saiwai-ku, Kawasaki-shi, Kanagawa)
OfficeSteel-framed construction, 15 floors above ground
98,428 March 2013 9,764 15,733 22,245 543 38,522
Shinjuku Mirai Development
MIRRAZA Shinjuku 2
(Shinjuku-ku, Tokyo)Retail facility
Steel-framed construction (partially steel-framed reinforced concrete), 3 floors below ground, 10 floors above ground
7,628 August 2010 781 2,863 32,132 24 35,019
Nomura Real Estate Development
Nihonbashi Muromachi Nomura Building(Chuo-ku, Tokyo)
OfficeSteel-framed construction (partially steel-framed reinforced concrete), 5 floors below ground, 21 floors above ground
44,989 September 2010 2,737 15,141 19,227 348 34,717
Nomura Real Estate Development
Yokohama Nomura Building 2
(Nishi-ku, Yokohama-shi, Kanagawa)
OfficeSteel-framed construction, 17 floors above ground, 1 other building
58,755 January 2017 6,721 20,168 8,809 594 29,573
Nomura Real Estate Development
Nomura Fudosan Ginza Building 3
(Chuo-ku, Tokyo)Office
Steel-framed reinforced concrete con-struction (partially steel-framed reinforced concrete), 5 floors below ground, 17 floors above ground
26,748 March 1982 3,184 1,868 22,677 18 24,564
Nomura Real Estate Development
NOF Nihonbashi Honcho Building (Chuo-ku, Tokyo)
OfficeSteel-framed reinforced concrete construction, 3 floors below ground, eight floors above ground
29,430 April 1961 3,196 2,080 21,026 — 23,107
Nomura Real Estate Development
Shinjuku Nomura Building 2, 3 (Shinjuku-ku, Tokyo)
Office
Steel-framed reinforced concrete con-struction (partially steel-framed reinforced concrete), 5 floors below ground, 50 floors above ground
58,512 May 1978 4,639 5,955 16,303 163 22,422
Midosuji Mirai Development
Midosuji Nomura Building 2 (Chuo-ku, Osaka-shi, Osaka)
OfficeSteel-framed construction (partially steel-framed reinforced concrete), 2 floors below ground, 14 floors above ground
20,420 February 2009 1,939 3,835 15,707 27 19,571
Nomura Real Estate Development
Nomura Fudosan Tennozu Building 2, 3
(Shingawa-ku, Tokyo)Office
Steel-framed reinforced concrete con-struction (partially reinforced concrete), 2 floors below ground, 26 floors above ground
39,943 June 1996 5,730 4,484 11,685 83 16,253
NREG TOSHIBA BUILDING
LAZONA Kawasaki Plaza 3, 4 (Saiwai-ku, Kawasaki-shi, Kanagawa)
Retail facility
Steel-framed reinforced concrete con-struction (partially steel-framed reinforced concrete), 1 floor below ground, 6 floors above ground
98,254 September 2006 72,013 15,611 — 379 15,990
Toranomon Real Estate
Bansui Building and Toranomon Station-Front Redevelopment (tentative name) (Minato-ku, Tokyo)
OfficeLand slated for building construction
Reinforced concrete construction (partially steel-framed reinforced concrete), 1 floor below ground, 7 floors above ground
3,289Mainly
October 19731,099 60 15,120 10 15,191
Nomura Real Estate Development
Nomura Fudosan Shibadaimon Building (Minato-ku, Tokyo)
OfficeSteel-framed construction (partially steel-framed reinforced concrete), 2 floors below ground, 11 floors above ground
15,700 April 2010 2,447 4,055 10,650 83 14,790
Nomura Real Estate Development
Otemachi Nomura Building 2, 3 (Chiyoda-ku, Tokyo)
OfficeSteel-framed construction (partially steel-framed reinforced concrete), 5 floors below ground, 27 floors above ground
9,815 February 1994 749 1,309 12,584 5 13,899
Nomura Real Estate Development
Nomura Musashikosugi Building N 3 (Nakahara-ku, Kawasaki-shi, Kanagawa)
OfficeSteel-framed construction, 1 floor below ground, 14 floors above ground
21,268 February 2010 3,979 5,764 7,529 9 13,303
NREG TOSHIBA BUILDING
Toshiba Hamamatsucho Building (Minato-ku, Tokyo)
OfficeSteel-framed reinforced concrete construction, 8 floors above ground
13,482 July 1974 2,907 359 10,956 0 11,316
Nomura Real Estate Development
bono Sagamiono Shopping Center (Minami-ku, Sagamihara-shi, Kanagawa)
Retail facilityReinforced concrete construction (partially steel-framed construction), 1 floor below ground, 11 floors above ground
43,509 January 2013 5,797 6,153 4,649 418 11,221
Nomura Real Estate Holdings, Inc. 5 Financial Report 2017 Nomura Real Estate Holdings, Inc. 6 Financial Report 2017

Company Name Property Name (location) Use Size of Construction or Details of Facility, etc.Total Floor Area (m2)
Completion of Construction or
(Time of Acquisition)
Area of Property
(m2)
Book Value (Millions of yen)
Facility Land Other Total
Nomura Real Estate Development
Dai-ni Edobashi Building 4 (Chuo-ku, Tokyo)
OfficeSteel-framed reinforced concrete construction, 3 floors below ground, 9 floors above ground
13,359 November 1973 1,376 ¥ 663 ¥ 10,553 ¥ 0 ¥ 11,217
Nomura Real Estate Development
Minamigyotoku SC 2 (Ichikawa-shi, Chiba)
Retail facilitySteel-framed construction (partially rein-forced concrete), 2 floors below ground, 2 floors above ground
35,612 April 2000 16,503 5,388 4,942 15 10,346
Nomura Real Estate Development
Landport Takatsuki Project (tentative name) (Takatsuki-shi, Osaka)
Land slated for building construction
— — (September 2014) 35,276 — 10,247 — 10,247
NREG TOSHIBA BUILDING
Fuchu Toshiba Building (Fuchu-shi, Tokyo)
Office
Steel-framed reinforced concrete construction (partially reinforced concrete), 1 floor below ground, eight floors above ground, 1 other building
32,299 April 1993 8,290 3,917 5,247 23 9,188
NREG TOSHIBA BUILDING
Shinyokohama Toshiba Build-ing (Kohoku-ku, Yokohama-shi, Kanagawa)
Training facility
Reinforced concrete construction, 1 floor below ground, four floors above ground, 4 other buildings
28,822Mainly
June 196915,829 3,082 5,660 33 8,776
Nomura Real Estate Development
Iidabashi Plano Stage Building 3 (Chiyoda-ku, Tokyo)
OfficeReinforced concrete construction, 2 floors below ground, 38 floors above ground
3,958 February 2009 785 1,717 6,401 1 8,120
Nomura Real Estate Development
Nihonkouku Tamachi Building 2 (Minato-ku, Tokyo)
OfficeSteel-framed reinforced concrete construction, 1 floor below ground, 7 floors above ground
17,515 January 1984 4,134 75 7,820 — 7,895
NREG TOSHIBA BUILDING
NREG Kawasaki Logistics Center (Kawasaki-ku, Kawasaki-shi, Kanagawa)
Logistics facility
Reinforced concrete construction (partially steel-framed construction), 5 floors above ground
49,046 March 2014 27,866 3,975 3,109 465 7,550
NREG TOSHIBA BUILDING
Umeda Sky Building 3 (Kita-ku, Osaka-shi, Osaka)
Office
Steel-framed construction (partially steel-framed reinforced concrete and reinforced concrete), 2 floors below ground, 40 floors above ground
43,093 March 1993 8,325 2,404 4,585 85 7,075
NREG TOSHIBA BUILDING
Toshiba Osaka Building (Chuo-ku, Osaka-shi, Osaka)
OfficeSteel-framed reinforced concrete construction, 4 floors below ground, 10 floors above ground
15,220 October 1965 1,307 1,008 5,989 6 7,004
NREG TOSHIBA BUILDING
NREG Midosuji Building / Nomura Fudosan Midosuji Building (Chuo-ku, Osaka-shi, Osaka)
OfficeSteel-framed reinforced concrete construction, 2 floors below ground, 10 floors above ground
21,007 April 1974 2,366 596 5,768 27 6,391
Nomura Real Estate Development
Nomura Fudosan Ichigaya Building (Chiyoda-ku, Tokyo)
OfficeSteel-framed reinforced concrete construction, 2 floors below ground, 9 floors above ground
6,753 January 1982 1,220 3,098 3,182 3 6,285
NREG TOSHIBA BUILDING
Creare Toshiba Fuchu (Fuchu-shi, Tokyo)
ResidentialReinforced concrete construction (partially steel-framed reinforced concrete), 10 floors above ground
26,352 January 1992 20,590 4,378 1,516 43 5,938
Nomura Real Estate Development
Nomura Fudosan Nishishinjuku Building (Shinjuku-ku, Tokyo)
OfficeSteel-framed construction (partially steel-framed reinforced concrete), 1 floor below ground, 9 floors above ground
6,000 March 2010 1,078 1,632 4,115 48 5,796
Nomura Real Estate Development
Toranomon Central Building (Minato-ku, Tokyo)
Office
Steel-framed construction (partially steel-reinforced concrete and steel-framed reinforced concrete), 3 floors below ground, 10 floors above ground
4,431 August 1977 548 762 4,999 0 5,762
NREG TOSHIBA BUILDING
Tsurumi Toshiba Building (Tsurumi-ku, Yokohama-shi, Kanagawa)
OfficeResidential
Steel-framed reinforced concrete construction, 1 floor below ground, 10 floors above ground
20,648 March 1991 3,501 2,536 3,073 42 5,652
Nomura Real Estate Development
Fukuoka Tenjin Center Building 2, 3 (Chuo-ku, Fukuoka-shi, Fukuoka)
OfficeSteel-framed reinforced concrete construction, 3 floors below ground, 19 floors above ground
25,103 April 1976 2,256 1,003 4,413 1 5,418
Nomura Real Estate Development
Nomura Musashikosugi Building S 3
(Nakahara-ku, Kawasaki-shi, Kanagawa)
OfficeSteel-framed construction, 1 floor below ground, 6 floors above ground
7,375 February 2010 2,878 2,093 3,210 2 5,307
Nomura Real Estate Development
PMO Yaesu Dori (Chuo-ku, Tokyo)
OfficeSteel-framed construction (partially steel-framed reinforced concrete), 1 floor below ground, 9 floors above ground
7,074 May 2013 931 1,428 3,840 32 5,300
Nomura Real Estate Development
PMO Nihonbashi Muromachi 3 (Chuo-ku, Tokyo)
OfficeSteel-framed construction (partially steel-framed reinforced concrete), 1 floor below ground, 9 floors above
5,333 January 2013 701 1,078 3,716 14 4,809
Nomura Real Estate Holdings, Inc. 7 Financial Report 2017

Company Name Property Name (location) Use Size of Construction or Details of Facility, etc.Total Floor Area (m2)
Completion of Construction or
(Time of Acquisition)
Area of Property
(m2)
Book Value (Millions of yen)
Facility Land Other Total
Nomura Real Estate Development
NOF Tameike Building (Minato-ku, Tokyo)
OfficeSteel-framed reinforced concrete construction, 1 floor below ground, 9 floors above ground
6,478 July 1959 690 ¥ 223 ¥ 4,393 ¥ — ¥ 4,616
NREG TOSHIBA BUILDING
Toshiba Fukuoka Building (Chuo-ku, Fukuoka-shi, Fukuoka)
OfficeSteel-framed construction (partially steel-framed reinforced concrete), 2 floors below ground, 17 floors above ground
23,711 July 1993 4,597 2,063 1,918 30 4,013
NREG TOSHIBA BUILDING
Toshiba Manseibashi Building 4
(Chiyoda-ku, Tokyo)Office
Reinforced concrete construction, 1 floor below ground, 9 floors above ground
5,319 September 1961 681 260 3,551 1 3,813
NREG TOSHIBA BUILDING
Nomura Fudosan Nishishin-juku Kyodo Building 3 (Shinjuku-ku, Tokyo)
Office
Steel-framed construction (partially steel-framed reinforced concrete and reinforced concrete), 1 floor below ground, 8 floors above ground
6,716 October 1993 1,249 996 2,700 2 3,698
NREG TOSHIBA BUILDING
Toshiba Sendai Building 3, 4 (Aoba-ku, Sendai-shi, Miyagi)
HotelOffice
Steel-framed construction (partially rein-forced concrete), 2 floors below ground, 11 floors above ground
16,179 April 1975 1,731 667 2,817 8 3,493
Nomura Real Estate Development
Nomura Fudosan Sendai Aoba-dori Building Project (tentative name) 5 (Aoba-ku, Sendai-shi, Miyagi)
Land slated for building construction
— — (March 2005) 1,599 — 3,306 — 3,306
NREG TOSHIBA BUILDING
NREG Sapporo Building (Chuo-ku, Sapporo-shi, Hokkaido)
HotelBranch store
Steel-framed construction (partially steel-framed reinforced concrete), 1 floor below ground, 10 floors above ground
5,905 August 2016 946 1,526 1,396 113 3,036
Notes: 1. “Facility” represents building accounts, “land” represents land and lease accounts, and “others” represents structures; machinery; tools, appliances, and fixtures; vehicles and delivery equipment; and leased asset accounts. “Total” represents the sum of lease accounts and tangible fixed assets excluding construction in progress accounts.
2. Includes the trust beneficial right. 3. Refers to calculated area owned including both total floor space and land area. 4. Area of property includes rental property. 5. Construction of property completed in April 2017.
The following major Leasing Unit facilities for sublet are rented by the Group and do not appear in the previous table.Company Name Property Name (location) Rentable Area (m2)
Nomura Real Estate Development Across Shin Osaka (Yodogawa-ku, Osaka-shi, Osaka) 17,298
Nomura Real Estate Development AKS Building (Chiyoda-ku, Tokyo) 7,516
2) Property and Facility Management Unit
Company Name Property Name (location) Use Size of Construction or Details of Facility, etc.Total Floor Area (m2)
Completion of Construction or
(Time of Acquisition)
Area of Property
(m2)
Book Value (Millions of yen)
Facility Land Other Total
Nomura Real Estate Life & Sports
Megaros Souka and other 36 facilities(Souka-shi, Saitama and others)
Fitness ClubReinforced concrete construction, 3 floors, 1 other building and fitness club
15,321 June 2002 15,430 ¥8,360 ¥— ¥1,136 ¥9,497
Notes: 1. “Facility” represents building accounts, “land” represents land accounts, and “others” represents structures; machinery; tools, appliances, and fixtures; vehicles and delivery equipment; and leased asset accounts. “Total” represents tangible fixed assets excluding construction in progress accounts.
2. “Total floor area” represents the total owned area of Megalos Kashiwa, Megalos Chikusa, and Megalos Saginuma. “Area of property” represents the leased land area of the three preceding facilities. “Size of construction or details of facility, etc.” and “completion of construction of (time of acquisition)” are in reference to Megalos Kashiwa.
Nomura Real Estate Holdings, Inc. 7 Financial Report 2017 Nomura Real Estate Holdings, Inc. 8 Financial Report 2017

Facilities Establishment and Renovation
In the fiscal year ended March 31, 2017, we will establish and renovate the following facilities. However, there is no major expansion or
removal of facilities.
1) Establishment of major facilities
Company NameProperty Name
(location)Business Segment Use Size of Construction or Details of Facility, etc.
Planned aggregate investment (Millions of yen)
Sources of funding
Schedule
Total Amount Paid Start Completion
Nomura Real Estate Development
Toranomon Station-Front Redevelopment (tentative name) (Minato-ku, Tokyo)
LeasingOffice, Retail facility
Steel-framed concrete construction (partially steel-framed reinforced concrete construction), 24 floors above ground / 4 floors below
¥35,300 ¥11,971Loans payable and own funds
FY17/3 FY21/3
Nomura Real Estate Development
Landport Takatsuki Project (tentative name) (Takatsuki-shi, Osaka)
LeasingLogistics facility
Steel-framed concrete construction (partially reinforced concrete) 5 floors above ground
21,600 12,602Loans payable and own funds
FY16/3 FY18/3
Nomura Real Estate Development
Nomura Fudosan Sendai Aoba-dori Building Project (tentative name) (Aoba-ku, Sendai-shi, Miyagi) (Note)
Leasing Office
Steel-framed concrete construction (partially reinforced concrete), 10 floors above ground / 1 floor penthouse / 1 floors below
8,000 5,689Loans payable and own funds
FY16/3 FY18/3
NREG TOSHIBA BUILDING CO., Ltd.
Ginza 6chome Project (tentative name) (Chuo-ku, Tokyo) (Note)
Leasing Office
Steel-framed concrete construction (partially steel-framed reinforced concrete construction) 11 floors above ground / 3 floors below
4,600 2,083Loans payable and own funds
FY18/3 FY18/3
Note: This building is completed in April,2017.
2) Renovation of major facility
Company Name Property Name Business Segment
Planned aggregate investment (Millions of yen)
Construction Period NoteTotal Amount Paid
Nomura Real Estate Development Existing buildings Leasing ¥3,300 — April, 2017 – March, 2018 Construction for facility renovation
Nomura Real Estate Holdings, Inc. 9 Financial Report 2017

We intend to increase our dividend by a further ¥5 in the fiscal
year ending March 31, 2018 making our total forecast annual divi-
dend ¥70 per share.
Consolidated Performance Outlook for the fiscal year ending
March 31, 2018 (announced on April 27, 2017)
We expect to post operating revenue of ¥646,000 million, operating
profit of ¥76,000 million, ordinary profit of ¥67,000 million, and
profit attributable to owners of parent of ¥44,000 million for the
fiscal year ending March 31, 2018.
Changes in Dividend Payments(yen)
70.065.0
2012 2013 2014 2015 2016 2017 2018(Forecast)
0
20
40
60
80
Key Factors of Changes by Segment from 2017 to 2018 (billions of yen)
2017Actual
ResidentialDevelopment
Leasing Investment Management
PropertyBrokerage
& CRE
Property & Facility
Management
Adjustments
2018Forecast
– 2.7
– 0.5– 0.5
+1.3 +0 +0
+1.1
77.2 76.0
Other
• Drop of gross margin ratio in housing sales
• Increase of repair work cost etc.
• Rebound from acquisition fee associated with the merger of TOP REIT in FY17/3
• Increase in commission in Property Brokerage
• Decrease of the numbers of internal transactions in Brokerage and construction ordered
Basic Policy Concerning Profit Distribution and Dividends
for the fiscal year ended March 31, 2017 and the fiscal year
ending 2018
The Company’s basic policy regarding the distribution of profits is
to aim for a payout ratio of approximately 30% over the medium to
long term in accordance with business performance, comprehen-
sively considering factors including the operating environment and
capital investment plans, and taking retained earnings into
consideration.
Concerning dividends for the fiscal year ended March 31, 2017,
the Company has set a year-end dividend per share for the fiscal
year ended March 31, 2017 of ¥35, which is ¥5 higher than the
Company’s most recent dividend forecast. Combined with the
second quarter-end dividend already paid, the annual dividend per
share will be ¥65.
(Years ended / ending March 31)
(Years ended / ending March 31)
Nomura Real Estate Holdings, Inc. 9 Financial Report 2017 Nomura Real Estate Holdings, Inc. 10 Financial Report 2017

Risks Affecting the Business of Nomura Real Estate Group
We believe that the following matters related to the Group’s busi-
ness, accounting and other conditions could have a material
impact on the decision-making of investors.
It should be noted that matters concerning the future in this
document have been determined based on information available to
the Group as of March 31, 2017.
(1) Trends in the real estate market
The Group’s performance for the fiscal year ended March 31, 2017
resulted in increased income compared to the previous fiscal year.
In regard to the economic outlook, the gradual recovery is
expected to continue into the future with pickups in consumer
spending expected as a result of improvements in the employment
and personal income environments on the back of improved corpo-
rate earnings, although it is necessary to pay careful attention to
the economic trends of the advanced countries of Europe and
North America.
In the future, certain events could still cause a decline in
purchasing sentiment among customers of the Residential Devel-
opment Business, the Property Brokerage & CRE Business and
other businesses. These events include the current economic slow-
down, an associated deterioration in corporate earnings, a decline
in consumer spending, a rise in interest rates, or an excess supply
in the real estate market. There may also be falls in selling prices or
increases in inventories due to the decline in purchasing sentiment,
or losses on valuation of inventories. For the Leasing Business and
the Investment Management Business, moreover, such events
could also spark declines in office rents,increases in vacancy rates,
falls in asset values, or drops in profit ratios, and an accompanying
valuation loss on assets owned by the Group. In addition, declining
investment unit price and weakening demand for investment funds
are possibilities in the REIT market. Such events could have an
adverse impact on the Group’s business performance.
(2) Changes to real estate-related legislation or the tax system
A number of laws and regulations apply to the various businesses
of the Group, which will be subject to new regulations as it expands
its operational scope in the future. Going forward, the Group may
face new obligations and expense burdens if the Building Stan-
dards Law, the Building Lots and Buildings Transaction Business
Law, the Financial Instruments and Exchange Law, or other real
estate-related laws are revised, or if new legislation is implemented.
Such events could adversely affect the Group’s business
performance.
Furthermore, if revisions to the tax system that impact the
Real Estate Development Business are implemented, this could
lead to an increase in expenses for holding, acquisition, and sales
of assets, or a decline in the purchasing sentiment of customers. It
could also prompt a change in the facility strategies of companies
and revisions of their investment plans. Such events could have
an adverse impact on the Group’s business performance.
(3) Licenses and permits for major businesses
The Group obtains licenses and permits, such as real estate
brokerage and construction licenses, when carrying out business
activities. Currently, there are no reasons for any of these licenses
or permits to be cancelled. However, in the future, if such licenses
or permits are cancelled for whatever reason, this could adversely
affect the Group’s business performance.
(4) Impact of interest-bearing debt
The balance of interest-bearing debt at March 31, 2017 was
¥810,100 million, which represents an increase of ¥88,200 million
year on year (equivalent to 50.9% of total assets, increased by 2.3
percentage points year on year). When raising funds by borrowing,
the Group attempts to deal with the risk of a short-term rise in inter-
est rates mainly by taking out long-term, fixed-rate loans. However,
an increase in borrowing costs due to a rise in market interest rates
could have a negative impact on the Group’s business performance
and financial condition.
(5) M&A
The Company has positioned M&A as an important strategy for
long-term growth, and aims at boosting Group enterprise value by
implementing M&A that can be expected to generate synergies
while making the most of the advantages offered by the holding
company system. However, in the event of changes in the operat-
ing environment, the expected growth of the acquired company,
or the synergy expected from the acquisition, may not be realized.
This could have an adverse impact on the Group’s business
performance.
(6) Natural disasters
Natural disasters, such as earthquakes and wind and flood
damage, as well as sudden accidents, could lead to damage or
destruction of real estate owned or managed by the Group. Such
incidents could have a negative impact on the Group’s business
performance and financial condition.
Nomura Real Estate Holdings, Inc. 11 Financial Report 2017 Nomura Real Estate Holdings, Inc. 12 Financial Report 2017

(7) Personal information
In the course of carrying out its operations, the various businesses
of the Group handle large quantities of personal information. The
Group endeavors to comply with various laws and regulations
pertaining to personal information, such as the Law Concerning
Protection of Personal Information, and also handle information in
the proper manner. Moreover, Group companies have produced
various documents, such as “Information Security Provisions,”
“Rules for Handling Personal Information” and “Guidelines for
Entrusting the Handling of Personal Information.” In these ways,
the Group strives to train and educate employees and protect the
interests of customers. In the event of external leakage of personal
information due to unforeseen circumstances, however, confidence
in the Group could be lost, leading to a decrease in sales and the
incurrence of expenses to pay compensation for damages. This
could have an adverse impact on the Group’s business performance.
(8) Soil pollution
Under the Soil Contamination Countermeasures law, owners of
land are obliged to evaluate and report on the soil pollution status
of their properties with respect to the presence of specific harmful
substances, and also to take measures to remove such polluting
substances. When considering purchases of land for business
use, the Group conducts historical and pollution assessments in
advance. If the presence of pollution is confirmed, the Group either
cancels the acquisition or engages specialists to remove such pol-
lution. However, it is possible that the aforementioned assessments
fail to confirm the full extent of soil pollution, or that the seller is
unable to fulfill his or her guarantee against defects even if soil pol-
lution is detected. Detection of soil pollution on land purchased by
the Group, therefore, could lead to changes in the Group’s original
business schedules or to the incurrence of the additional expenses,
which could have a negative impact on its business performance or
financial condition.
(9) Asbestos
Some of the buildings owned by the Group have been sprayed with
materials that include asbestos. The Group has engaged third-party
organizations to assess such buildings. According to the results of
those assessments, the said materials are showing no signs of
age-related degradation and are in stable condition. In the future,
however, it is possible that asbestos may be scattered if age-related
degradation occurs. Such an event could require removal or con-
tainment of the asbestos in question, resulting in the incurrence of
additional costs that could have an adverse effect on the Group’s
business performance or financial condition.
(10) Concentration of revenues in fourth quarter
In the Residential Development Unit, which accounts for more than
50% of the group’s revenues, housing sales are registered as sales
when properties are handed over to the customers. In many cases,
however, the completion and handover occur in February or March
of each year, in accordance with the requirements of customers
taking up residence. For this reason, a large proportion of the
group’s revenues is concentrated in the fourth quarter of each
fiscal year.
(11) Capital relationship with other affiliates
The Company’s other affiliate is Nomura Holdings, Inc. As of
March 31, 2016, Nomura Holdings owned 33.9% of the Compa-
ny’s shares. This holding percentage could change in the event
of a sale of the Company’s shares by Nomura Land and Building
or a capital increase of the Company.
Nomura Real Estate Holdings, Inc. 11 Financial Report 2017 Nomura Real Estate Holdings, Inc. 12 Financial Report 2017

Consolidated Balance SheetNomura Real Estate Holdings, Inc. and its subsidiaries March 31, 2016 and 2017
(Millions of yen)
(Thousands of U.S. dollars)
(Note 1)
ASSETS 2016 2017 2017
Current Assets: Cash and deposits (Notes 2(3) and 3) ¥ 57,594 ¥ 47,701 $ 425,181 Notes and accounts receivable-trade 15,371 16,535 147,385 Real estate for sale (Note 6) 78,133 120,385 1,073,049 Real estate for sale in process 269,547 249,664 2,225,365 Land held for development 148,730 199,812 1,781,016 Equity investments (Notes 3 and 4) 819 2,568 22,886 Deferred tax assets (Note 10) 5,286 5,555 49,518 Other 33,338 42,124 375,468 Allowance for doubtful accounts (39) (37) (334) Total current assets 608,779 684,307 6,099,534
Investments and Other Assets: Investment securities (Notes 3 and 4) 45,511 46,253 412,268 Lease and guarantee deposits (Note 3) 21,380 21,739 193,768 Deferred tax assets (Note 10) 14,840 14,992 133,633 Other 5,168 5,993 53,415 Allowance for doubtful accounts (1) (1) (4) Total investments and other assets 86,898 88,976 793,080
Property, Plant and Equipment: Land (Notes 6 and 15) 523,697 549,672 4,899,472 Buildings and structures (Notes 6 and 15) 374,378 394,607 3,517,311 Construction in progress (Note 6) 13,208 9,039 80,569 Machinery and equipment (Note 6) 12,906 14,769 131,647 Other 2,050 2,245 20,009
926,239 970,332 8,649,008 Accumulated depreciation (147,147) (161,506) (1,439,580) Net property and equipment 779,092 808,826 7,209,428
Intangible Assets 10,681 10,985 97,919Total Assets ¥1,485,450 ¥1,593,094 $14,199,961
See notes to consolidated financial statements.
Nomura Real Estate Holdings, Inc. 13 Financial Report 2017 Nomura Real Estate Holdings, Inc. 14 Financial Report 2017
(Millions of yen)
(Thousands of U.S. dollars)
(Note 1)
LIABILITIES AND NET ASSETS 2016 2017 2017
Current Liabilities: Notes and accounts payable-trade ¥ 51,162 ¥ 35,612 $ 317,429 Short-term loans payable (Notes 3, 5 and 6) 137,300 106,300 947,500 Current portion of bonds payable (Notes 3, 5 and 6) — 10,000 89,135 Income taxes payable (Note 10) 13,233 16,053 143,087 Deposits received 29,618 29,459 262,585 Deferred tax liabilities (Note 10) 17 20 182 Provision for bonuses 7,074 7,517 67,002 Provision for directors’ bonuses 739 639 5,699 Provision for loss on business liquidation 62 48 427 Accounts payable-other 6,919 5,130 45,725 Accrued interests 1,047 876 7,805 Accrued consumption taxes 2,171 1,434 12,783 Advanced received 33,500 35,846 319,508 Other 6,266 6,865 61,185 Total current liabilities 289,108 255,799 2,280,052
Noncurrent Liabilities: Bonds payable (Notes 3, 5 and 6) 60,000 70,000 623,942 Long-term loans payable (Notes 3, 5 and 6) 524,600 623,800 5,560,210 Lease and guarantee deposits received (Note 6) 63,767 57,598 513,394 Deferred tax liabilities (Note 10) 64,070 63,592 566,824 Deferred tax liabilities for land revaluation 3,900 3,900 34,762 Net defined benefit liability (Note 7) 18,018 18,931 168,743 Provision for loss on subleasing business 314 258 2,298 Other 5,265 5,403 48,157 Total noncurrent liabilities 739,934 843,482 7,518,330Total Liabilities 1,029,042 1,099,281 9,798,382
Net Assets: Shareholders’ equity (Note 11): Capital stock 116,599 116,780 1,040,909 Capital surplus 109,842 110,023 980,686 Retained earnings 207,204 242,704 2,163,335 Treasury shares (3) (3) (32) Total shareholders’ equity 433,642 469,504 4,184,898 Accumulated other comprehensive income: Valuation difference on available-for-sale securities 6,665 7,947 70,836 Deferred gains or losses on hedges 156 120 1,067 Revaluation reserve for land 7,861 7,861 70,068 Foreign currency translation adjustment 43 62 556 Remeasurements of defined benefit plans (Note 7) (3,513) (4,129) (36,806) Total accumulated other comprehensive income 11,212 11,861 105,721 Subscription rights to shares: 1,685 1,986 17,707 Non-controlling interests: 9,869 10,462 93,253Total Net Assets 456,408 493,813 4,401,579
Total Liabilities and Net Assets ¥1,485,450 ¥1,593,094 $14,199,961
See notes to consolidated financial statements.
Nomura Real Estate Holdings, Inc. 13 Financial Report 2017 Nomura Real Estate Holdings, Inc. 14 Financial Report 2017

Consolidated Statement of IncomeNomura Real Estate Holdings, Inc. and its subsidiaries Years Ended March 31, 2016 and 2017
(Millions of yen)
(Thousands of U.S. dollars)
(Note 1)
Operating Revenues and Expenses 2016 2017 2017
Operating Revenue: ¥569,545 ¥569,681 $5,077,820
Operating revenue 569,545 569,681 5,077,820
Operating Expenses: 488,633 492,410 4,389,066
Operating cost 391,571 392,439 3,497,984
Selling, general and administrative expenses 97,062 99,971 891,082
Operating Profit 80,912 77,271 688,754
Other Income and Expenses (9,937) (7,964) (70,988)
Interest income 72 52 464
Dividends income 1,008 253 2,254
Share of profit of entities accounted for using equity method 16 83 740
Gain on sales of noncurrent assets (Note 8) — 946 8,434
Interest expenses (7,817) (7,540) (67,206)
Impairment loss (Note 9) (1,426) (255) (2,269)
Loss on building reconstruction — (337) (3,006)
Loss on valuation of investment securities (279) — —
Other, net (1,511) (1,166) (10,399)
Profit before Income Taxes 70,975 69,307 617,766
Income Taxes (Note 10):
Income taxes-current 20,992 22,957 204,631
Income taxes-deferred 825 (1,177) (10,495)
Total Income Taxes 21,817 21,780 194,136
Profit 49,158 47,527 423,630
Profit attributable to non-controlling interests 1,976 522 4,652
Profit attributable to owners of parent ¥ 47,182 ¥ 47,005 $ 418,978
See notes to consolidated financial statements.
Nomura Real Estate Holdings, Inc. 15 Financial Report 2017 Nomura Real Estate Holdings, Inc. 16 Financial Report 2017

Consolidated Statement of Comprehensive IncomeNomura Real Estate Holdings, Inc. and its subsidiaries Years Ended March 31, 2016 and 2017
(Millions of yen)
(Thousands of U.S. dollars)
(Note 1)
2016 2017 2017
Profit ¥49,158 ¥47,527 $423,630Other Comprehensive Income (Note 18): Valuation difference on available-for-sale securities 1,595 1,282 11,428 Deferred gains or losses on hedges 78 (36) (323) Revaluation reserve for land 216 (0) (1) Foreign currency translation adjustment (10) 19 174 Remeasurements of defined benefit plans (4,944) (616) (5,491) Share of other comprehensive income of entities accounted
for using the equity method (8) (0) (4) Total other comprehensive income (3,073) 649 5,783
Comprehensive Income (Note 18) ¥46,085 ¥48,176 $429,413
(Breakdown)Comprehensive income attributable to owners of parent ¥44,109 ¥47,654 $424,762Comprehensive income attributable to non-controlling interests 1,976 522 4,651
See notes to consolidated financial statements.
Nomura Real Estate Holdings, Inc. 15 Financial Report 2017 Nomura Real Estate Holdings, Inc. 16 Financial Report 2017

Consolidated Statement of Changes in Net AssetsNomura Real Estate Holdings, Inc. and its subsidiaries Years Ended March 31, 2016 and 2017
(Millions of yen)
Number of shares issued
Capital stock
Capital surplus
Retained earnings
Treasury stock
Valuation difference on available-for-sale securities
Deferred gains / losses
on hedges
Revaluation reserve for land
Foreign currency
translation adjustments
Remeasurements of defined
benefit plans
Subscription rights
to shares
Non- controlling interests
Total net assets
Balance at April 1, 2015 191,119,700 ¥116,189 ¥ 93,518 ¥170,069 ¥ (2) ¥5,069 ¥ 78 ¥7,645 ¥ 61 ¥ 1,432 ¥1,564 ¥ 65,408 ¥461,031
Issuance of new shares 559,901 410 410 — — — — — — — — — 820
Dividends from surplus — — — (10,047) — — — — — — — — (10,047)
Profit attributable to owners of parent — — — 47,182 — — — — — — — — 47,182
Purchases of treasury shares — — — — (1) — — — — — — — (1)
Increase by share exchanges — — 374 — — — — — — — — — 374
Changes in parent ownership interests regarding the transactions with non-controlling shareholder — — 15,540 — — — — — — — — — 15,540
Net changes of items other than shareholders’ equity — — — — — 1,596 78 216 (18) (4,945) 121 (55,539) (58,491)
Balance at March 31, 2016 191,679,601 116,599 109,842 207,204 (3) 6,665 156 7,861 43 (3,513) 1,685 9,869 456,408
Issuance of new shares 198,200 181 181 — — — — — — — — — 362
Dividends from surplus — — — (11,505) — — — — — — — — (11,505)
Profit attributable to owners of parent — — — 47,005 — — — — — — — — 47,005
Purchases of treasury shares — — — — 0 — — — — — — — 0
Reversal of revaluation reserve for land — — — 0 — — — — — — — — 0
Net changes of items other than shareholders’ equity — — — — — 1,282 (36) 0 19 (616) 301 593 1,543
Balance at March 31, 2017 191,877,801 ¥116,780 ¥110,023 ¥242,704 ¥ (3) ¥7,947 ¥120 ¥7,861 ¥ 62 ¥(4,129) ¥1,986 ¥ 10,462 ¥493,813
(Thousands of U.S. dollars) (Note 1)
Capital stock
Capital surplus
Retained earnings
Treasury stock
Valuation difference on available-for-sale securities
Deferred gains / losses
on hedges
Revaluation reserve for land
Foreign currency
translation adjustments
Remeasurements of defined
benefit plans
Subscription rights
to shares
Non- controlling interests
Total net assets
Balance at March 31, 2016 $1,039,298 $979,075 $1,846,902 $(28) $59,407 $1,390 $70,071 $386 $(31,315) $15,021 $87,966 $4,068,173
Issuance of new shares 1,611 1,611 — — — — — — — — — 3,222
Dividends from surplus — — (102,547) — — — — — — — — (102,547)
Profit attributable to owners of parent — — 418,978 — — — — — — — — 418,978
Purchases of treasury shares — — — (4) — — — — — — — (4)
Reversal of revaluation reserve for land — — 2 — — — — — — — — 2
Net changes of items other than shareholders’ equity — — — — 11,429 (323) (3) 170 (5,491) 2,686 5,287 13,755
Balance at March 31, 2017 $1,040,909 $980,686 $2,163,335 $(32) $70,836 $1,067 $70,068 $556 $(36,806) $17,707 $93,253 $4,401,579
See notes to consolidated financial statements.Note: The number of issued shares outstanding increased by 559,901 shares and 198,200 shares in the years ended March 31, 2016 and 2017, respectively, due to the
exercise of stock options.
Nomura Real Estate Holdings, Inc. 17 Financial Report 2017 Nomura Real Estate Holdings, Inc. 18 Financial Report 2017

Consolidated Statement of Cash FlowsNomura Real Estate Holdings, Inc. and its subsidiaries Years Ended March 31, 2016 and 2017
(Millions of yen)
(Thousands of U.S. dollars)
(Note 1)
Cash Flows 2016 2017 2017Cash Flows from Operating Activities: Profit before income taxes ¥ 70,975 ¥ 69,307 $ 617,766 Depreciation 16,027 16,878 150,436 Impairment loss 1,426 255 2,269 Loss (gain) on valuation of investment securities 279 — — Loss (gain) on sales of non-current assets — (946) (8,434) Share of (profit) loss of entities accounted for using equity method (16) (83) (740) Increase (decrease) in allowance for doubtful accounts (14) (2) (14) Increase (decrease) in provision for loss on business liquidation (22) (14) (124) Increase (decrease) in provision for loss on subleasing business (152) (56) (496) Increase (decrease) in net defined benefit liability (282) 913 8,136 Interest and dividends income (1,080) (305) (2,718) Interest expenses 7,817 7,540 67,206 Decrease (increase) in notes and accounts receivable-trade (623) (1,157) (10,314) Decrease (increase) in inventories (67,146) (73,978) (659,397) Decrease (increase) in equity investments 5,498 (1,748) (15,585) Increase (decrease) in notes and accounts payable-trade 2,497 (15,547) (138,573) Increase (decrease) in deposits received 4,522 (159) (1,413) Other, net 1,953 (2,245) (20,008) Subtotal 41,659 (1,347) (12,003) Interest and dividends income received 1,064 285 2,541 Interest expenses paid (7,970) (9,333) (83,187) Income taxes paid (21,495) (21,495) (191,601) Net cash flows from operating activities 13,258 (31,890) (284,250)
Cash Flows from Investing Activities: Purchase of investment securities (3,990) (1,500) (13,370) Proceeds from sales and liquidation of investment securities 2,907 1,410 12,571 Purchase of investments in subsidiaries resulting in change in scope of consolidation (9,693) — — Purchase of property, plant and equipment and intangible assets (50,367) (61,300) (546,397) Proceeds from sales of property, plant and equipment and intangible assets 308 12,067 107,554 Payments for lease and guarantee deposits (758) (1,019) (9,080) Proceeds from collection of lease and guarantee deposits 1,502 965 8,600 Repayments of lease and guarantee deposits received (2,559) (12,448) (110,955) Proceeds from lease and guarantee deposits received 4,521 6,124 54,589 Other, net (1,586) 1,142 10,183 Cash flows from investing activities (59,715) (54,559) (486,305)
Cash Flows from Financing Activities: Net increase (decrease) in short-term loans payable (3,300) (500) (4,457) Repayments of finance lease obligations (149) (149) (1,325) Proceeds from long-term loans payable 184,000 160,000 1,426,152 Repayments of long-term loans payable (102,500) (91,300) (813,798) Proceeds from issuance of bonds 29,820 19,870 177,106 Redemption of bonds (3,000) — — Proceeds from issuance of common shares 427 89 791 Proceeds from share issuance to non-controlling shareholders 106 98 874 Purchase of treasury shares (1) 0 (4) Cash dividends paid (10,047) (11,505) (102,547) Dividends paid to non-controlling interests (1,465) (27) (237) Payments from changes in ownership interests in subsidiaries that do
not result in change in scope of consolidation (40,253) — —
Cash flows from financing activities 53,638 76,576 682,555
Effect of exchange rate changes on cash and cash equivalents (8) (25) (224)Net increase (decrease) in cash and cash equivalents 7,173 (9,898) (88,224)
Cash and cash equivalents at beginning of the fiscal year 50,419 57,592 513,343Increase (decrease) in cash and cash equivalents resulting from change of scope of consolidation — 5 44
Cash and cash equivalents at end of period (Note 2 (3)) ¥ 57,592 ¥ 47,699 $ 425,163
See notes to consolidated financial statements.
Nomura Real Estate Holdings, Inc. 17 Financial Report 2017 Nomura Real Estate Holdings, Inc. 18 Financial Report 2017

Notes to Consolidated Financial StatementsNomura Real Estate Holdings, Inc. and its subsidiaries March 31, 2016 and 2017
1. Basis of Presentation of Consolidated Financial Statements
The accompanying consolidated financial statements of Nomura Real Estate Holdings, Inc. (the “Company”) and its subsidiar-
ies (collectively, the “Group”) have been prepared in accordance with the provisions set forth in the Financial Instruments and
Exchange Act of Japan and its related accounting regulations, and accounting principles generally accepted in Japan (“Japa-
nese GAAP”), which are different in certain respects as to the application and disclosure requirements of International
Financial Reporting Standards.
The accompanying consolidated financial statements have been compiled from the consolidated financial statements of
the Company prepared in accordance with Japanese GAAP, and translated into English for the benefit of readers outside
Japan. In addition, the notes to the consolidated financial statements include information which may not be required under
Japanese GAAP but is presented herein as additional information.
The translations of the Japanese yen amounts into U.S. dollars are included solely for the convenience of readers using
the prevailing exchange rate at March 31, 2017 of ¥112.19=U.S.$1. The approximate rate of exchange prevailing at June 29,
2017 was ¥112.35=U.S.$1. These translations should not be construed as representations that the Japanese yen amounts
have been, could have been, or could in the future be, converted into U.S. dollars at this or any other rate of exchange.
2. Significant Accounting Policies
(1) Principles of Consolidation and Accounting for Investments in Affiliates
The accompanying consolidated financial statements include the accounts of the Group that the Company controls directly or
indirectly. Investments in companies over which the Company exercises significant influence in terms of their operating and
financial policies have been accounted for using the equity method.
All significant intercompany balances and transactions have been eliminated in consolidation. All material unrealized profit
included in the assets resulting from transactions among the consolidated companies has also been eliminated.
(2) Foreign Currency Translation
All current and non-current accounts denominated in foreign currencies are translated into Japanese yen at the spot
exchange rates in effect at the consolidated balance sheet date. Differences arising from such translation are recognized as
gain or loss.
The asset and liability accounts of the overseas subsidiaries and affiliates are translated into Japanese yen at the
exchange rates prevailing at the respective balance sheet dates of the subsidiaries and affiliates and the revenue and expense
accounts are translated into Japanese yen at the average rates of exchange for the year. Differences arising from such trans-
lation are presented as “Foreign currency translation adjustments” in Net Assets.
(3) Cash and Cash Equivalents
In preparing the Consolidated Statement of Cash Flows, cash on hand, readily-available deposits and short-term, highly liquid
investments with a maturity of three months or less at the time of purchase and with an insignificant risk of market value fluc-
tuation are considered to be cash and cash equivalents.
A reconciliation between cash and deposits in the Consolidated Balance Sheet and cash and cash equivalents is pre-
sented in Note 12.
(4) Recognition of Revenues and Related Costs
The percentage-of-completion method is applied when the outcome of the construction activity during the fiscal year is
deemed certain in the course of the activity (percentage of completion is calculated by dividing the related cost incurred by
the estimated total cost), otherwise the completed-contract method is applied.
Nomura Real Estate Holdings, Inc. 19 Financial Report 2017 Nomura Real Estate Holdings, Inc. 20 Financial Report 2017

(5) Inventories
Inventories are mainly stated at cost, determined by the specific identification cost method (the amounts of inventories in the
accompanying Consolidated Balance Sheet are computed based on the write-down method reflecting decreased profitability).
Write-downs of inventories as a result of a decrease in profitability for the years ended March 31, 2016 and 2017 were
¥4 million and ¥167 million ($1,485 thousand), respectively, and recognized in operating cost.
(6) Short-term Investments and Investment Securities
Held-to-maturity debt securities are stated at amortized cost by the straight-line method.
Available-for-sale securities with market value are stated at fair market value based on market quotations at the balance
sheet date.
Unrealized gains and losses are reported, net of the applicable taxes, as a separate component of Net Assets. Cost of
securities sold is determined by the moving-average method. Available-for-sale securities without market value are stated at
cost by the moving-average method.
(7) Property and Equipment (except for leased assets)
Depreciation of property and equipment is computed mainly by the straight-line method.
Estimated useful lives used in the computation of depreciation are generally as follows:
Buildings and structures 2 to 65 years
(8) Software (except for leased assets)
Costs of software for internal use are amortized using the straight-line method over an estimated useful life of five years.
(9) Leased Assets
Leased assets are depreciated using the straight-line method, assuming the lease period to be the useful life and the residual
value to be zero.
Finance leases, other than those that transfer ownership, that started on or before March 31, 2008, are accounted for as
operating leases.
(10) Amortization of Goodwill
Goodwill is amortized using the straight-line method over a period of 14 to 20 years.
(11) Allowance for Doubtful Accounts
In order to prepare for possible bad debt losses on notes and accounts receivable and loans, allowance for doubtful
accounts is provided at an amount calculated on the basis of a historical bad debt ratio for a certain reference period for
normal claims, plus an estimated uncollectible amount determined on the basis of individual assessments for specific claims
with potential losses.
(12) Income Taxes
Current income taxes are stated at the estimated amount payable during each fiscal year for corporation, enterprise and
inhabitants’ taxes in the Consolidated Statement of Income.
The tax effect of temporary differences between the carrying amounts of assets and liabilities for financial reporting and
income tax purposes is recognized as deferred income taxes.
(13) Provision for Retirement Benefits
To calculate retirement benefit obligations, the estimated amount of retirement benefits attributable to the fiscal year is deter-
mined based on the benefit formula method.
Prior service costs are amortized as incurred by the straight-line method over 10 years, which is within the average
number of remaining service years of the eligible employees.
Actuarial gains and losses are amortized in the following fiscal year in which the gain or loss is recognized by the straight-
line method mainly over 10 years, which is within the average number of remaining service years of the eligible employees.
Nomura Real Estate Holdings, Inc. 19 Financial Report 2017 Nomura Real Estate Holdings, Inc. 20 Financial Report 2017

(14) Per Share Information
Basic profit attributable to owners of parent per share is computed by dividing the profit attributable to owners of parent
available for distribution to shareholders of common stock by the weighted-average number of shares of common stock
outstanding during each fiscal year. Diluted profit attributable to owners of parent per share is computed by dividing the
profit attributable to owners of parent available for distribution to the shareholders by the weighted-average number of
shares of common stock outstanding during each fiscal year assuming full conversion of convertible bonds and full execution
of warrants.
Net assets per share as of March 31, 2016 and 2017 were ¥2,320.84 and ¥2,508.73 ($22.36), respectively.
Profit attributable to owners of parent per share as of March 31, 2016 and 2017 was ¥246.42 and ¥245.10 ($2.18),
respectively.
Diluted profit attributable to owners of parent per share for the years ended March 31, 2016 and 2017 was ¥245.40 and
¥244.06 ($2.18), respectively.
(15) Land Revaluation
Under the “Law Concerning Revaluation Reserve for Land” promulgated on March 31, 1998, the Company revalued its land
held for business use. The tax amount for the difference between the appraisal value and the carrying amount is accounted
for as “Deferred tax liabilities for land revaluation” in Noncurrent Liabilities and the difference net of such tax amount is
recorded as “Revaluation reserve for land” in Net Assets.
Method of revaluation:
The value of land is determined based on a reasonable adjustment to the assessed value of the fixed assets as stipulated in
Item 3, Article 2 of the “Enforcement Ordinance Concerning Land Revaluation” (Ordinance No. 119 enacted on March 31,
1998). Date of revaluation: March 31, 2002
At March 31, 2016 and 2017, market value was not less than book value after revaluation.
(16) Derivative Financial Instruments
Net assets and liabilities arising from derivative financial instruments are measured at fair value, with any changes in unrealized
gain or loss credited or charged to income. Hedging transactions are accounted for using deferral hedge accounting, which
requires the unrealized gains or losses to be deferred as assets or liabilities until the losses or gains on the underlying hedged
items are recognized.
For interest rate swaps that meet certain hedging criteria, the Group applies exceptional treatment where the Group does
not record these instruments at fair value but charges or credits the net cash flows from these instruments to the interest
arising from the hedged borrowings and corporate bonds. However, for currency swaps that meet certain hedging criteria,
the currency swap contracts (the “Contracts”) and the securities denominated in foreign currencies (the “Hedged items”) are
accounted for in the following manner:
(a) If the Contracts are executed to hedge an existing the Hedged items,
(i) the difference, if any, between:
• the Japanese yen amount of the Hedged items translated using the spot rate at the inception date of
the Contracts and
• the book value of the Hedged items
is recognized in the Consolidated Statement of Income in the period which includes the inception date, and
(ii) the discount or premium on the Contracts (that is, the difference between:
• the Japanese yen amount of the Contracts translated using the contracted swap rate and
• the Japanese yen amount of the Contracts translated using the spot rate at the inception date of the Contracts) is
recognized over the term of the Contracts.
(b) If the Contracts are executed to hedge a future transaction denominated in a foreign currency, the swap transac-
tion will be recorded using the contracted swap rate, and no gains or losses on the Contracts are recognized.
Nomura Real Estate Holdings, Inc. 21 Financial Report 2017 Nomura Real Estate Holdings, Inc. 22 Financial Report 2017

3. Financial Instruments
(1) Policies on Financial Instruments
It is the policy of the Group to limit its fund management to safe and highly liquid deposits while raising funds primarily through
loans from financial institutions and the issuance of corporate bonds. Derivatives are utilized for hedging against the risks
described below not for speculative purposes.
(2) Details of Financial Instruments and Risks
Short-term investment securities comprise safe and highly liquid negotiable deposits held for the purpose of managing tem-
porary surplus funds.
Equity investments and investment securities primarily consist of stocks, investment units, units in an investment trust,
preferred investments and investments in silent partnerships held for the purpose of business promotion, all of which are
exposed to market price fluctuation and issuer credit risk. Currency swaps and forward exchange contracts are used to
hedge risks from exchange rate fluctuations on securities in foreign currencies. Interest rate swaps are used to hedge risks
arising from fluctuations in interest rates on long-term borrowings.
Derivative transactions used by the Company are as follows:
Hedging instruments Hedged itemsInterest rate swap contracts Borrowings
Currency swaps and foreign exchange forward contracts Securities denominated in foreign currencies
The Group evaluates hedge effectiveness by comparing the cumulative changes in market fluctuations or in cash flows of
the Hedged items to the corresponding changes in the hedging derivative instruments. However, the Group does not evaluate
hedge effectiveness of interest rate swaps for which the Group applies the exceptional treatment.
(3) Policies and Systems for Risk Management
The Company regularly checks the market value of equity investments and investment securities, as well as the financial
conditions of their issuers.
Nomura Real Estate Holdings, Inc. 21 Financial Report 2017 Nomura Real Estate Holdings, Inc. 22 Financial Report 2017

The Finance Department conducts execution of derivative transactions and risk management based on the risk manage-
ment policies and operational plan determined by the Director in charge of Finance. The Finance Department also reports
the status of transactions and risk information to the Director on a regular basis. The consolidated subsidiaries conduct exe-
cution of derivative transactions and risk management in accordance with internal policies. The Company considers there is
no substantial credit risk associated with these transactions because of the transactions being conducted only with highly
creditworthy financial institutions.
Based on the reports from each division of the Group, the Finance Department of the Company creates and updates cash
flow plans in a timely manner, managing liquidity risk through such methods as ensuring that a specific amount of on-hand
liquidity is always available.
(4) Supplemental Information on Fair Values
The fair values of financial instruments are based on their market prices. The fair values of financial instruments with no avail-
able market prices are determined by using prices calculated in a reasonable manner. However, as various factors are
incorporated into these calculations, the resulting values may vary if different assumptions are provided. The contract amount
shown in Note 13. Derivative Financial Instruments does not represent the market risk regarding the derivative transactions.
(5) Fair Values of Financial Instruments
The book values, fair values and differences of financial instruments as of March 31, 2016 and 2017 are as follows. Items for
which fair value is extremely difficult to determine have not been included.
Book value Fair value Difference
2016(Millions of yen)
(Millions of yen)
(Millions of yen)
(1) Cash and deposits ¥ 57,594 ¥ 57,594 ¥ —(2) Investment securities 1 41,000 41,060 59Total assets 98,594 98,654 59(1) Short-term loans payable 2 46,000 46,000 —(2) Bonds payable 60,000 61,510 1,510(3) Long-term loans payable 2 615,900 636,057 20,157Total liabilities 721,900 743,567 21,667Derivative transactions 3 ¥ 140 ¥ 140 ¥ —
Book value Fair value Difference
2017(Millions of yen)
(Thousands of U.S. dollars)
(Millions of yen)
(Thousands of U.S. dollars)
(Millions of yen)
(Thousands of U.S. dollars)
(1) Cash and deposits ¥ 47,701 $ 425,182 ¥ 47,701 $ 425,181 ¥ — $ —
(2) Investment securities 1 42,498 378,800 42,545 379,220 47 420
Total assets 90,199 803,982 90,246 804,401 47 420
(1) Short-term loans payable 2 45,500 405,562 45,500 405,562 — —
(2) Bonds payable 80,000 713,076 80,890 721,009 890 7,933
(3) Long-term loans payable 2 684,600 6,102,148 697,963 6,221,261 13,363 119,113
Total liabilities 810,100 7,220,786 824,353 7,347,832 14,253 127,046
Derivative transactions 3 ¥ (207) $ (1,842) ¥ (207) $ (1,842) ¥ — $ —
Notes: 1. Includes government bonds, etc. presented as lease and guarantee deposits on the Consolidated Balance Sheet. 2. Current portion of long-term loans payable is included in (3) Long-term loans payable. 3. For derivative transactions, stated values are the net amounts of receivables and payables arising from the transactions. Figures in parentheses are
liability amounts.
Nomura Real Estate Holdings, Inc. 23 Financial Report 2017 Nomura Real Estate Holdings, Inc. 24 Financial Report 2017
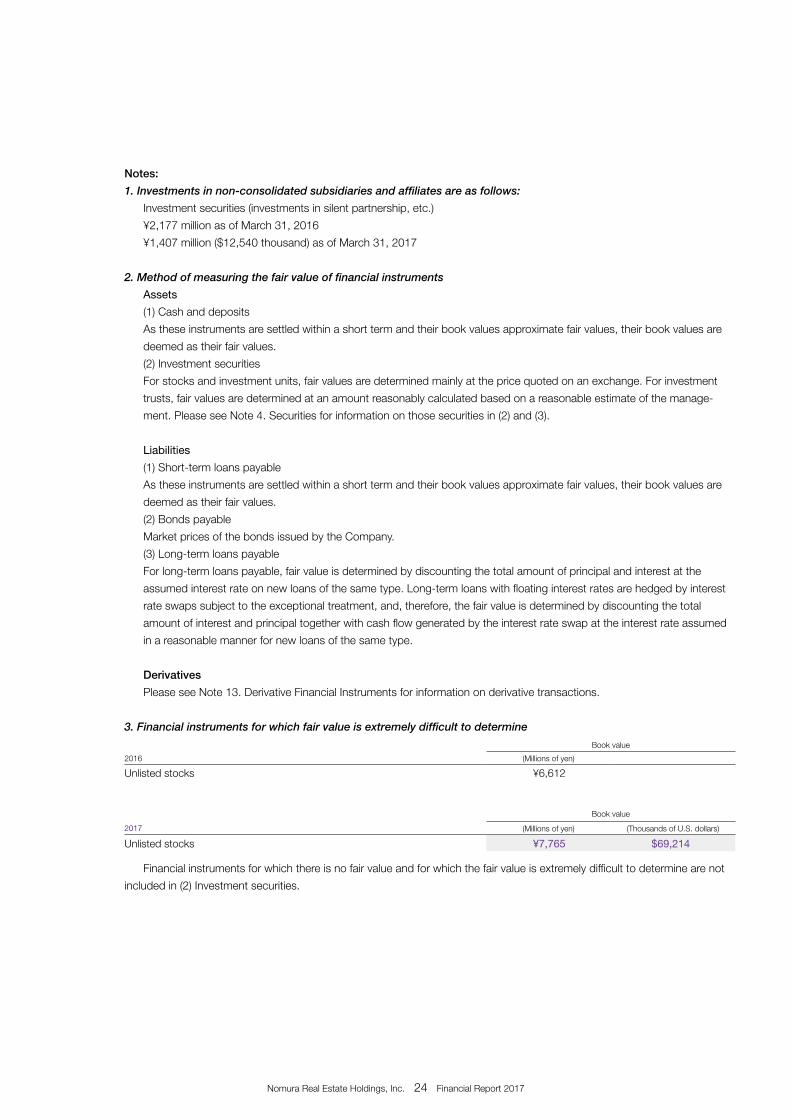
Notes:
1. Investments in non-consolidated subsidiaries and affiliates are as follows:
Investment securities (investments in silent partnership, etc.)
¥2,177 million as of March 31, 2016
¥1,407 million ($12,540 thousand) as of March 31, 2017
2. Method of measuring the fair value of financial instruments
Assets
(1) Cash and deposits
As these instruments are settled within a short term and their book values approximate fair values, their book values are
deemed as their fair values.
(2) Investment securities
For stocks and investment units, fair values are determined mainly at the price quoted on an exchange. For investment
trusts, fair values are determined at an amount reasonably calculated based on a reasonable estimate of the manage-
ment. Please see Note 4. Securities for information on those securities in (2) and (3).
Liabilities
(1) Short-term loans payable
As these instruments are settled within a short term and their book values approximate fair values, their book values are
deemed as their fair values.
(2) Bonds payable
Market prices of the bonds issued by the Company.
(3) Long-term loans payable
For long-term loans payable, fair value is determined by discounting the total amount of principal and interest at the
assumed interest rate on new loans of the same type. Long-term loans with floating interest rates are hedged by interest
rate swaps subject to the exceptional treatment, and, therefore, the fair value is determined by discounting the total
amount of interest and principal together with cash flow generated by the interest rate swap at the interest rate assumed
in a reasonable manner for new loans of the same type.
Derivatives
Please see Note 13. Derivative Financial Instruments for information on derivative transactions.
3. Financial instruments for which fair value is extremely difficult to determine
Book value
2016 (Millions of yen)
Unlisted stocks ¥6,612
Book value
2017 (Millions of yen) (Thousands of U.S. dollars)
Unlisted stocks ¥7,765 $69,214
Financial instruments for which there is no fair value and for which the fair value is extremely difficult to determine are not
included in (2) Investment securities.
Nomura Real Estate Holdings, Inc. 23 Financial Report 2017 Nomura Real Estate Holdings, Inc. 24 Financial Report 2017

4. Redemption schedule for financial assets with maturities
Within 1 year 1–5 years 5–10 years Over 10 years
2016 (Millions of yen)
(Millions of yen)
(Millions of yen)
(Millions of yen)
Cash and deposits ¥57,550 ¥ — ¥ — ¥—Short-term investment securities and investment
securities Held-to-maturity debt
securities Government and
municipal bonds, etc.15 435 824 —
Corporate bonds — — — — Available-for-sale securities
with maturities Debt securities — — — — Others — — — —Total ¥57,565 ¥435 ¥824 ¥—
Within 1 year 1–5 years 5–10 years Over 10 years
2017 (Millions of yen)
(Thousands of U.S. dollars)
(Millions of yen)
(Thousands of U.S. dollars)
(Millions of yen)
(Thousands of U.S. dollars)
(Millions of yen)
(Thousands of U.S. dollars)
Cash and deposits ¥47,662 $424,830 ¥ — $ — ¥ — $ — ¥— $—
Short-term investment securities and investment
securities Held-to-maturity debt
securities Government and
municipal bonds, etc.15 134 479 4,264 942 8,397 — —
Corporate bonds — — — — — — — —
Available-for-sale securities with maturities
Debt securities 2 23 10 93 — — — —
Others — — — — — — — —
Total ¥47,679 $424,987 ¥489 $4,357 ¥942 $8,397 ¥— $—
Nomura Real Estate Holdings, Inc. 25 Financial Report 2017 Nomura Real Estate Holdings, Inc. 26 Financial Report 2017

5. Repayment schedule for bonds payable and long-term loans payable at March 31, 2016 and 2017
Within 1 year 1-2 years 2-3 years
2016 (Millions of yen)
(Millions of yen)
(Millions of yen)
Short-term loans payable ¥ 46,000 ¥ — ¥ —
Bonds payable — 10,000 —
Long-term loans payable 91,300 60,800 68,300Total ¥137,300 ¥70,800 ¥68,300
3-4 years 4-5 years Over 5 years
(Millions of yen)
(Millions of yen)
(Millions of yen)
Short-term loans payable ¥ — ¥ — ¥ —Bonds payable — 10,000 40,000Long-term loans payable 53,500 48,000 294,000Total ¥53,500 ¥58,000 ¥334,000
Within 1 year 1-2 years 2-3 years
2017(Millions of yen)
(Thousands of U.S. dollars)
(Millions of yen)
(Thousands of U.S. dollars)
(Millions of yen)
(Thousands of U.S. dollars)
Short-term loans payable ¥ 45,500 $ 405,562 ¥ — $ — ¥ — $ —
Bonds payable 10,000 89,134 — — — —
Long-term loans payable 60,800 541,938 68,300 608,789 53,500 476,870
Total ¥116,300 $1,036,634 ¥68,300 $608,789 ¥53,500 $476,870
3-4 years 4-5 years Over 5 years
(Millions of yen)
(Thousands of U.S. dollars)
(Millions of yen)
(Thousands of U.S. dollars)
(Millions of yen)
(Thousands of U.S. dollars)
Short-term loans payable ¥ — $ — ¥ — $ — ¥ — $ —
Bonds payable 20,000 178,269 10,000 89,134 40,000 356,538
Long-term loans payable 50,000 445,673 55,000 490,240 397,000 3,538,640
Total ¥70,000 $623,942 ¥65,000 $579,374 ¥437,000 $3,895,178
Nomura Real Estate Holdings, Inc. 25 Financial Report 2017 Nomura Real Estate Holdings, Inc. 26 Financial Report 2017
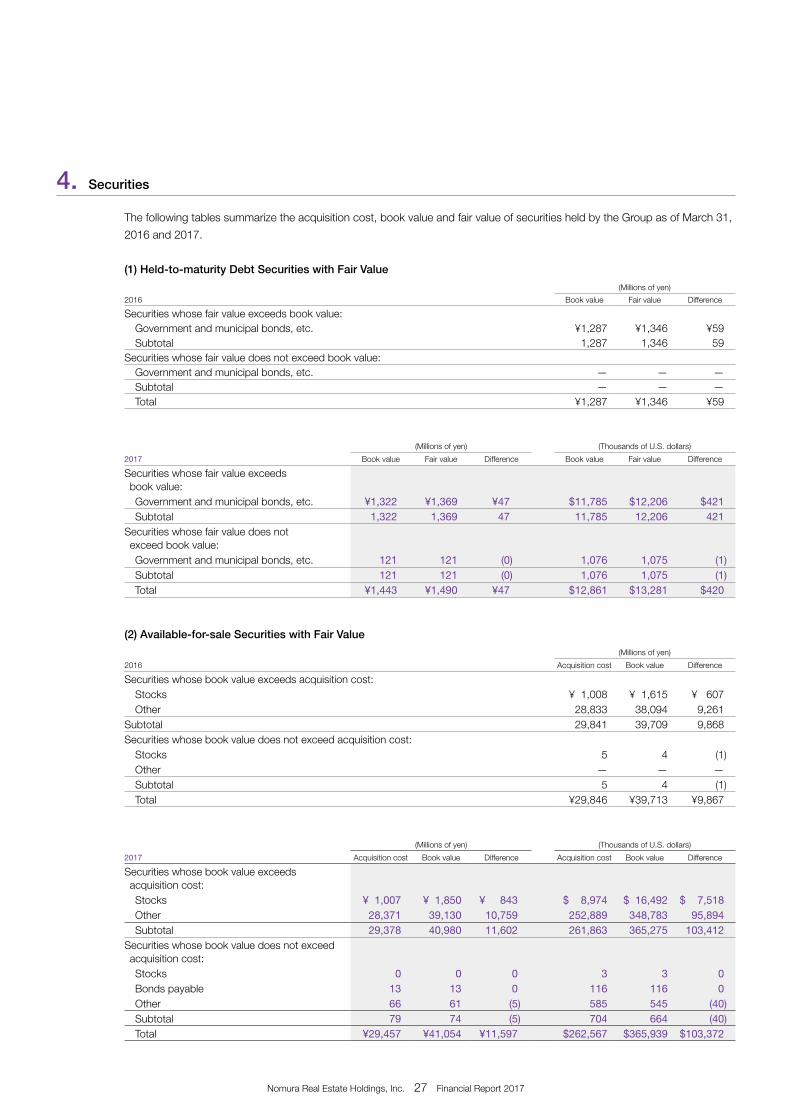
4. Securities
The following tables summarize the acquisition cost, book value and fair value of securities held by the Group as of March 31,
2016 and 2017.
(1) Held-to-maturity Debt Securities with Fair Value
(Millions of yen)
2016 Book value Fair value Difference
Securities whose fair value exceeds book value: Government and municipal bonds, etc. ¥1,287 ¥1,346 ¥59 Subtotal 1,287 1,346 59Securities whose fair value does not exceed book value: Government and municipal bonds, etc. — — — Subtotal — — — Total ¥1,287 ¥1,346 ¥59
(Millions of yen) (Thousands of U.S. dollars)
2017 Book value Fair value Difference Book value Fair value Difference
Securities whose fair value exceeds book value: Government and municipal bonds, etc. ¥1,322 ¥1,369 ¥47 $11,785 $12,206 $421 Subtotal 1,322 1,369 47 11,785 12,206 421Securities whose fair value does not exceed book value: Government and municipal bonds, etc. 121 121 (0) 1,076 1,075 (1) Subtotal 121 121 (0) 1,076 1,075 (1) Total ¥1,443 ¥1,490 ¥47 $12,861 $13,281 $420
(2) Available-for-sale Securities with Fair Value
(Millions of yen)
2016 Acquisition cost Book value Difference
Securities whose book value exceeds acquisition cost: Stocks ¥ 1,008 ¥ 1,615 ¥ 607 Other 28,833 38,094 9,261Subtotal 29,841 39,709 9,868Securities whose book value does not exceed acquisition cost: Stocks 5 4 (1) Other — — — Subtotal 5 4 (1) Total ¥29,846 ¥39,713 ¥9,867
(Millions of yen) (Thousands of U.S. dollars)
2017 Acquisition cost Book value Difference Acquisition cost Book value Difference
Securities whose book value exceeds acquisition cost: Stocks ¥ 1,007 ¥ 1,850 ¥ 843 $ 8,974 $ 16,492 $ 7,518 Other 28,371 39,130 10,759 252,889 348,783 95,894 Subtotal 29,378 40,980 11,602 261,863 365,275 103,412Securities whose book value does not exceed acquisition cost: Stocks 0 0 0 3 3 0 Bonds payable 13 13 0 116 116 0 Other 66 61 (5) 585 545 (40) Subtotal 79 74 (5) 704 664 (40) Total ¥29,457 ¥41,054 ¥11,597 $262,567 $365,939 $103,372
Nomura Real Estate Holdings, Inc. 27 Financial Report 2017 Nomura Real Estate Holdings, Inc. 28 Financial Report 2017

(3) Sales of Available-for-sale Securities
The table below presents sales of available-for-sale securities and corresponding aggregate gains and aggregate losses for
the years ended March 31, 2016 and 2017.
2016
(Millions of yen)
TypeSales
amountAggregate
gainsAggregate
losses
Stocks ¥1 ¥0 ¥4Total ¥1 ¥0 ¥4
2017
(Millions of yen) (Thousands of U.S. dollars)
TypeSales
amountAggregate
gainsAggregate
lossesSales
amountAggregate
gainsAggregate
losses
Stocks ¥ 6 ¥1 ¥— $ 58 $ 6 $ —
Others ¥74 ¥6 ¥ 3 $657 $58 $26
Total ¥80 ¥7 ¥ 3 $715 $64 $26
5. Short-term Loans Payable and Long-term Loans Payable
Short-term loans payable as of March 31, 2016 and 2017 mainly consisted of borrowings from banks with weighted-
average interest rates of 0.2% in 2016 and 0.2% in 2017, respectively.
Long-term loans payable and bonds payable as of March 31, 2016 and 2017 are summarized as follows:
(Millions of yen) (Thousands of
U.S. dollars)
2016 2017 2017
Unsecured bonds (2.1%), due 2017 ¥ 10,000 ¥ 10,000 $ 89,135
Unsecured bonds (2.0%), due 2020 10,000 10,000 89,135
Unsecured bonds (0.8%), due 2024 10,000 10,000 89,135
Unsecured bonds (0.9%), due 2025 10,000 10,000 89,135
Unsecured bonds (0.4%), due 2021 10,000 10,000 89,135
Unsecured bonds (0.8%), due 2026 10,000 10,000 89,135
Unsecured bonds (0.2%), due 2021 — 10,000 89,135
Unsecured bonds (1.0%), due 2036 — 10,000 89,135
Long-term loans payable 1
Unsecured 615,900 684,600 6,102,148
Lease obligations 2 1,268 128 1,137
Subtotal 677,168 764,728 6,816,365
Less amounts due within one year (91,434) (70,928) (632,211)
¥585,734 ¥693,800 $6,184,154
Notes: 1. Long-term loans payable as of March 31, 2016 and 2017 mainly consisted of borrowings from domestic Japanese banks and life insurance companies with weighted-average interest rates of 0.6% in 2016 and 0.5% in 2017.
2. The weighted-average interest rate for lease obligations is not shown because for some consolidated subsidiaries the lease obligations recorded in the Consolidated Balance Sheet are the amounts before deducting the interest equivalents included in the total lease commitments.
Nomura Real Estate Holdings, Inc. 27 Financial Report 2017 Nomura Real Estate Holdings, Inc. 28 Financial Report 2017

The following table shows the maturities of long-term loans payable subsequent to March 31, 2017
Years ending March 31 (Millions of yen)(Thousands of U.S. dollars)
2018 ¥ 68,300 $ 608,789
2019 53,500 476,869
2020 50,000 445,672
2021 55,000 490,240
2022 and thereafter 397,000 3,538,640
¥623,800 $5,560,210
The following table shows the maturities of lease obligations subsequent to March 31, 2017.
Years ending March 31 (Millions of yen)(Thousands of U.S. dollars)
2018 ¥ 102 $ 907
2019 88 788
2020 71 633
2021 68 607
2022 and thereafter 880 7,846
¥1,209 $10,781
6. Pledged Assets and Secured Liabilities
Pledged assets and secured liabilities at March 31, 2016 and 2017 are summarized as follows:
(1) Pledged Assets and Secured Liabilities
(Millions of yen)(Thousands of U.S. dollars)
2016 2017 2017
Pledged assets:
Buildings and structures ¥201 ¥190 $1,696
¥201 ¥190 $1,696
Secured liabilities:
Lease and guarantee deposits received 45 38 336
Total ¥ 45 ¥ 38 $ 336
(2) As of March 31, 2016, cash and deposits in the amount of ¥2 million and investment securities in the amount of
¥10 million are pledged as collateral for trade payables and a portion of liabilities of investee companies, respectively.
As of March 31, 2017, investment securities in the amount of ¥10 million ($89 thousand) are pledged as collateral
for trade payables and a portion of liabilities of investee companies, respectively.
Nomura Real Estate Holdings, Inc. 29 Financial Report 2017 Nomura Real Estate Holdings, Inc. 30 Financial Report 2017

7. Retirement Benefits
(1) Outline of Retirement Benefit Plans
The Company does not have a retirement benefit plan. As defined benefit plans, certain subsidiaries have the lump-sum
pension plan and the defined benefit corporate pension plan, and defined contribution pension plans. In certain cases,
additional retirement benefit payments may be made. For the lump-sum pension plan and the defined benefit corporate
pension plan used by certain subsidiaries, net defined benefit liability and retirement benefit expenses are calculated by
simplified method.
(2) Defined Benefit Plan
A reconciliation of the changes in retirement benefit obligations for the fiscal years ended March 31, 2016 and 2017 (excluding
plans applying a simplified method).
(Millions of yen)(Thousands of U.S. dollars)
2016 2017 2017
Retirement benefit obligations at the beginning of the year ¥24,595 ¥32,420 $288,975
Service cost 1,230 1,702 15,172
Interest cost 385 153 1,365
Actuarial gain or loss 6,862 1,384 12,338
Retirement benefit payments (652) (752) (6,705)
Retirement benefit obligations at the end of the year ¥32,420 ¥34,907 $311,145
A reconciliation of the changes in balance of plan assets for the fiscal years ended March 31, 2016 and 2017 (excluding plans
applying a simplified method)
(Millions of yen)(Thousands of U.S. dollars)
2016 2017 2017
Fair value of plan assets at the beginning of the year ¥15,518 ¥16,541 $147,438
Expected return on plan assets 248 331 2,949
Actuarial gain or loss (413) (13) (115)
Employer contributions 1,532 1,554 13,849
Retirement benefit payments (344) (389) (3,464)
Fair value of plan assets at the end of the year ¥16,541 ¥18,024 $160,657
A reconciliation of the changes in balance of net defined benefit liability applying a simplified method for the fiscal years ended
March 31, 2016 and 2017
(Millions of yen)(Thousands of U.S. dollars)
2016 2017 2017
Net defined benefit liability at the beginning of the year ¥2,000 ¥ 2,139 $ 19,070
Increase due to acquisition of newly consolidated subsidiaries 21 — —
Retirement benefit expenses 357 318 2,831
Retirement benefit payments (217) (387) (3,446)
Contributions to plan (22) (22) (200)
Net defined benefit liability at the end of the year ¥2,139 ¥(2,048) $(18,255)
Nomura Real Estate Holdings, Inc. 29 Financial Report 2017 Nomura Real Estate Holdings, Inc. 30 Financial Report 2017

A reconciliation of retirement benefit obligations as well as plan assets at March 31, 2016 and 2017, and net defined benefit
liability on the Consolidated Balance Sheet
(Millions of yen) (Thousands of U.S. dollars)
2016 2017 2017
Funded retirement benefit obligations ¥ 22,681 ¥ 24,663 $ 219,833
Fair value of plan assets (16,650) (18,154) (161,813)
Subtotal 6,031 6,509 58,020
Unfunded retirement benefit obligations 11,987 12,422 110,723
Net liabilities on the Consolidated Balance Sheet ¥ 18,018 ¥ 18,931 $ 168,743
Net defined benefit liability ¥ 18,018 18,931 168,743
Net liabilities on the Consolidated Balance Sheet ¥ 18,018 ¥ 18,931 $ 168,743
Note: It includes the plans applying a simplified method.
Breakdown of retirement benefit expenses
(Millions of yen) (Thousands of U.S. dollars)
2016 2017 2017
Service cost ¥1,230 ¥1,702 $15,172
Interest cost 385 153 1,365
Expected return on plan assets (248) (331) (2,949)
Amortization of actuarial gain or loss 469 905 8,067
Amortization of prior service cost (396) (396) (3,526)
Retirement benefit expenses calculated by a simplified method 357 317 2,825
Other 2 13 113
Retirement benefit expenses for defined benefit plan ¥1,799 ¥2,363 $21,067
Breakdown of items recorded in the Consolidated Statement of Comprehensive Income as remeasurements of defined benefit
plans, before tax
(Millions of yen)(Thousands of U.S. dollars)
2016 2017 2017
Prior service cost ¥ (396) ¥(396) $(3,526)
Actuarial gain or loss (6,806) (492) (4,386)
Total ¥(7,202) ¥(888) $(7,912)
Breakdown of items recorded in the Consolidated Balance Sheet as remeasurements of defined benefit plans, before tax
(Millions of yen)(Thousands of U.S. dollars)
2016 2017 2017
Unrecognized prior service cost ¥ 1,780 ¥ 1,385 $ 12,342
Unrecognized actuarial gain or loss (6,842) (7,335) (65,376)
Total ¥(5,062) ¥(5,950) $(53,034)
Nomura Real Estate Holdings, Inc. 31 Financial Report 2017 Nomura Real Estate Holdings, Inc. 32 Financial Report 2017

Composition of plan assets by major classifications
2016 2017
Claims 47% 48%
Equity 25% 24%
Other 28% 27%
Total 100% 100%
The expected long-term rate of return on plan assets has been estimated based on the current and projected allocation
of plan assets and the current and expected long-term rate of return on diverse assets which comprise plan assets.
Assumptions used in accounting for the retirement benefit plans are summarized as follows (represented by a weighted average):
2016 2017
Discount rate 0.2~0.5% 0.2~0.5%
Expected rate of return on plan assets 1.6% 2.0%
Expected salary increase rate 2.2~7.5% 2.2~7.5%
(3) Defined Contribution Plan
The required contributions to the defined contribution plans of consolidated subsidiaries for the fiscal years ended March 31,
2016 and 2017 are ¥522 million and ¥571 million ($5,091 thousand).
8. Gain on Sales of Property and Equipment
The breakdown of gain on sales of property and equipment for the fiscal years ended March 31, 2016 and 2017 is as follows:
Gain on sales
(Millions of yen) (Thousands of
U.S. dollars)
2016 2017 2017
Land ¥— ¥ (263) $ (2,347)
Buildings — 1,209 10,781
Total ¥— ¥ 946 $ 8,434
Nomura Real Estate Holdings, Inc. 31 Financial Report 2017 Nomura Real Estate Holdings, Inc. 32 Financial Report 2017

9. Impairment Loss
The Group recognized impairment loss on the following groups of assets for the fiscal years ended March 31, 2016 and 2017:
2016 Primary use Type Location
Stores, leased assets Buildings Shibuya-ku, Tokyo and other locationsLand
(5 locations in total) Other tangible asset
Assets of the Group are grouped into the smallest unit that generates identifiable cash flows that are largely independent of
cash flows from other assets or groups of assets. The headquarters building and certain other assets are considered to be
shared assets.
As a result, with respect to five groups of assets the profitability of which has dropped significantly due to the changes
of usage, the deterioration of the market conditions and the decline in rent level or that the Group plans to sell, the carrying
amount has been reduced to the recoverable amount and the amount of reduction has been recognized as an extraordinary
loss of ¥1,426 million for the fiscal year ended March 31, 2016. The impairment loss is broken down into an impairment loss
of ¥561 million on buildings and an impairment loss of ¥865 million on land and others.
The recoverable amount of these groups of assets is measured at the net realizable value or the value in use and the net
realizable value is determined based on the expected sales price and the appraisal value provided by real estate appraisers.
The value in use is assessed by setting the recoverable value at zero based on an expected negative future cash flow.
2017 Primary use Type Location
Leased assets Buildings Chuo-ku, Tokyo and other locations(2 locations in total) Other tangible asset
Assets of the Group are grouped into the smallest unit that generates identifiable cash flows that are largely independent of
cash flows from other assets or groups of assets. The headquarters building and certain other assets are considered to be
shared assets.
As a result, with respect to two groups of assets etc., comprising those the Group plans to dispose of, the carrying
amount has been reduced to the recoverable amount and the amount of reduction has been recognized in extraordinary
losses as impairment loss of ¥255 million ($2,269 thousand) for the fiscal year ended March 31, 2017. The impairment loss
consists of ¥239 million ($2,129 thousand) of buildings and ¥16 million ($140 thousand) of other.
The recoverable amount of these groups of assets is measured at the value in use and the value in use is assessed
by setting the recoverable value at zero based on an expected negative future cash flow.
Nomura Real Estate Holdings, Inc. 33 Financial Report 2017 Nomura Real Estate Holdings, Inc. 34 Financial Report 2017

10. Income Taxes
The statutory tax rates in Japan for the Company and its domestic subsidiaries were 33.1% for the fiscal year ended March
31, 2016 and 30.9% for the fiscal year ended March 31, 2017.
Significant differences between the statutory tax rate and the effective tax rate
2016 2017
Statutory tax rate 33.1% (Note)
Adjustments: Permanent differences including entertainment expenses 1.0 Effect of tax rate change (4.2) Other 0.9 Effective tax rates 30.7% (Note)
Note: The note has been omitted because the difference between the statutory tax rate and the effective tax rate is less than 5% of the statutory tax rate.
The table below presents an itemized breakdown of deferred tax assets and liabilities as of March 31, 2016 and 2017:
Significant components of the Company’s deferred tax assets and liabilities
(Millions of yen)(Thousands of U.S. dollars)
2016 2017 2017
Deferred tax assets: Unrealized profits ¥ 12,992 ¥ 12,939 $ 115,335
Net defined benefit liability 5,668 5,964 53,159
Impairment loss 5,022 3,923 34,970
Provision for bonuses 2,119 2,236 19,931
Inventory write-downs 1,276 1,567 13,967
Excess of depreciation 1,265 667 5,943
Revaluation of assets on consolidation 459 441 3,929
Loss on valuation of equity investments 264 79 706
Provision for loss on subleasing business 96 — —
Other 4,510 4,950 44,121
Gross deferred tax assets 33,671 32,766 292,061
Valuation allowance (3,258) (3,285) (29,276)
Total deferred tax assets 30,413 29,481 262,785
Deferred tax liabilities: Revaluation of assets on consolidation (50,272) (49,854) (444,372)
Reserve for deferred income taxes (20,116) (18,218) (162,387)
Other (3,987) (4,474) (39,881)
Total deferred tax liabilities (74,375) (72,546) (646,640)
Net deferred tax liabilities ¥(43,962) ¥(43,065) $(383,855)
Nomura Real Estate Holdings, Inc. 33 Financial Report 2017 Nomura Real Estate Holdings, Inc. 34 Financial Report 2017

11. Shareholders’ Equity
Under the Companies Act of Japan (the “Act”), all funds obtained through the issuance of common stock must be treated
as common stock and, by resolution of the board of directors, an amount equivalent to less than half of those funds may
be appropriated to the capital reserve (a component of capital surplus).
The Act provides that an amount equal to 10% of the amount to be distributed as distributions of capital surplus (other
than the capital reserve) and retained earnings (other than the legal reserve) be transferred to the capital reserve and the legal
reserve, respectively, until the sum of the capital reserve and the legal reserve equals 25% of the capital stock account.
As of March 31, 2017, the Group’s capital reserve amounted to ¥110,023 million ($980,686 thousand), and no legal
reserve was recorded.
12. Supplementary Cash Flow Information
A reconciliation of cash and deposits in the Consolidated Balance Sheet and cash and cash equivalents in the Consolidated
Statement of Cash Flows is as follows:
(Millions of yen)(Thousands of U.S. dollars)
2016 2017 2017
Cash and deposits ¥57,594 ¥47,701 $425,181
Time deposits with maturities of more than three months (2) (2) (18)
Cash and cash equivalents ¥57,592 ¥47,699 $425,163
13. Derivative Financial Instruments
(1) Derivatives to which hedge accounting is not applied
There are no derivative transactions to which hedge accounting is not applied.
(2) Derivatives to which hedge accounting is applied
(a) Currency-related derivatives
2016 Contract amountContract amount due after one year Fair value
Hedge accounting method Type of derivatives
Major hedged items
(Millions of yen)
(Millions of yen)
(Millions of yen)
Deferral hedge accounting
Currency swapsReceipts in yen / Payments in U.S. dollars
Securities denominated in foreign currencies
¥2,581 — ¥143
Deferral hedge accounting
CurrencySwapsReceipts in yen / Payments in Euro
Securities denominated in foreign currencies
¥ 503 — ¥ (3)
Total ¥3,084 — ¥140
Nomura Real Estate Holdings, Inc. 35 Financial Report 2017 Nomura Real Estate Holdings, Inc. 36 Financial Report 2017

2017 Contract amountContract amount due after one year Fair value
Hedge accounting method Type of derivatives
Major hedged items
(Millions of yen)
(Thousands of U.S. dollars)
(Millions of yen)
(Thousands of U.S. dollars)
(Millions of yen)
(Thousands of U.S. dollars)
Deferral hedge accounting
Currency swapsReceipts in yen / Payments in U.S. dollars
Securities denominated in foreign currencies
¥1,095 $ 9,757 ¥ 983 $ 8,766 ¥(100) $ (890)
Deferral hedge accounting
Forward exchange contractSell U.S. dollars / Buy yen
Securities denominated in foreign currencies
¥3,576 $31,880 ¥1,159 $10,330 ¥(119) $(1,064)
Deferral hedge accounting
Forward exchange contractSell Chinese Yuan / Buy U.S. dollars
Securities denominated in foreign currencies
¥1,136 $10,124 ¥1,136 $10,124 ¥ 12 $ 112
Total ¥5,807 ¥51,761 ¥3,278 ¥29,220 ¥(207) $(1,842)
Note: The fair value is determined based on the quoted price obtained from the counterparty financial institutions to the derivatives transactions.
(b) Interest rate-related derivatives
2016 Contract amountContract amount due after one year Fair value
Hedge accounting method Type of derivatives
Major hedged items
(Millions of yen)
(Millions of yen)
(Millions of yen)
Exceptional treatment for interest rate swaps
Interest rate swaps Receive
floating rate/ Pay fixed rate
Long-term debt ¥391,600 ¥315,500 (Note)
Total ¥391,600 ¥315,500 —
2017 Contract amountContract amount due after one year Fair value
Hedge accounting method Type of derivatives
Major hedged items
(Millions of yen)
(Thousands of U.S. dollars)
(Millions of yen)
(Thousands of U.S. dollars)
(Millions of yen)
(Thousands of U.S. dollars)
Exceptional treatment for interest rate swaps
Interest rate swaps Receive
floating rate/ Pay fixed rate
Long-term debt ¥327,500 $2,919,155 ¥278,500 $2,482,396 (Note) (Note)
Total ¥327,500 $2,919,155 ¥278,500 $2,482,396 — —
Note: The fair value of the interest rate swaps which qualify for exceptional treatment for interest rate swaps is considered to be included in the fair value of the long-term debt.
Nomura Real Estate Holdings, Inc. 35 Financial Report 2017 Nomura Real Estate Holdings, Inc. 36 Financial Report 2017

14. Leases
Details of significant lease transactions are as follows:
The table below presents the future lease payments and receipts of operating leases subsequent to March 31, 2016
and 2017.
(Millions of yen) (Thousands of
U.S. dollars)
Operating leases 2016 2017 2017
Future lease payments: Due within 1 year ¥ 3,381 ¥ 3,178 $ 28,329
Due after 1 year 16,657 15,128 134,840
Total ¥ 20,038 ¥ 18,306 $ 163,169
Future lease receipts: Due within 1 year ¥ 24,528 ¥ 24,261 $ 216,247
Due after 1 year 113,675 96,799 862,812
Total ¥138,203 ¥121,060 $1,079,059
Note: The note on finance leases has been omitted due to a lack of materiality.
15. Real Estate for Rent
Some of the Company’s subsidiaries own rental office buildings and rental facilities (including land) in Tokyo and other regions.
The book values in the Consolidated Balance Sheet, changes during the fiscal years ended March 31, 2016 and 2017,
and fair values of real estate, of which some portions are used as rental property, are as follows:
(1) Changes in fair value of rental and other properties during the fiscal years ended March 31, 2016 and 2017
Book value 1 Fair value 2
March 31, 2015 Increase/Decrease March 31, 2016 March 31, 2016
2016(Millions of yen)
(Millions of yen)
(Millions of yen)
(Millions of yen)
Rental properties ¥689,655 ¥48,348 ¥738,003 ¥824,258 Other properties used as rental properties 3 25,337 663 26,000 50,740
Book value 1 Fair value 2
March 31, 2016 Increase/Decrease March 31, 2017 March 31, 2017
2017(Millions of yen)
(Thousands of U.S. dollars)
(Millions of yen)
(Thousands of U.S. dollars)
(Millions of yen)
(Thousands of U.S. dollars)
(Millions of yen)
(Thousands of U.S. dollars)
Rental properties ¥738,003 $6,578,156 ¥28,970 $258,221 ¥766,973 $6,836,376 ¥892,524 $7,955,469
Other properties used as rental properties 3 26,000 231,747 123 1,099 26,123 232,845 54,500 485,783
Notes: 1. Book values in the Consolidated Balance Sheet are the amounts determined by deducting accumulated depreciation from the acquisition cost. 2. Fair values as of March 31, 2016 and 2017 are determined by the Group (including adjustments based on certain indexes) based primarily on their values
according to real estate appraisal standards. However, if there have been no fluctuations in appraisal values or indexes considered to appropriately reflect market values, the Group uses the appraisal values or amounts derived from the indexes of the recent appraisal or acquisition from third parties as the fair values at March 31, 2016 and 2017.
3. In the above table, other properties used as rental properties includes portions used by the Company and certain consolidated subsidiaries.
Nomura Real Estate Holdings, Inc. 37 Financial Report 2017 Nomura Real Estate Holdings, Inc. 38 Financial Report 2017

(2) Operating profit and other information on rental properties in the fiscal years ended March 31, 2016 and 2017
Operating profit Others (gains (losses) on sale of property, etc.) 2
2016 (Millions of yen) (Millions of yen)
Rental properties ¥26,090 ¥(187)Other properties used as rental properties 1 997 —
Operating profit Others (gains (losses) on sale of property, etc.) 2
2017(Millions of yen)
(Thousands of U.S. dollars)
(Millions of yen)(Thousands of U.S. dollars)
Rental properties ¥27,788 $247,685 ¥354 $—
Other properties used as rental properties 1 903 8,048 — —
Notes: 1. As real estate of which some portions are used as rental property includes portions used by the Company and certain consolidated subsidiaries for providing services as well as management and administration, operating income for this type of real estate is not recorded.
2. Others include impairment loss (¥187 million) in the fiscal year ended March 31, 2016, and gain on sales of non-current assets (¥946 million ($8,433 thou-sand)) and loss on building reconstruction (¥337 million ($3,006 thousand)) in the fiscal year ended March 31, 2017.
16. Segment Information
(1) Segment summary
The reportable segments of the Group comprise those business units for which separate financial information is available, and
which are subject to a regular review conducted by the Company’s Board of Directors in order to determine the allocation of
management resources and evaluate their performance.
With the Company as a pure holding company, the Group consists of business companies, such as Nomura Real Estate
Development Co., Ltd. The business companies (or business divisions within Nomura Real Estate Development) formulate
comprehensive strategies on respective products and services handled by them and conduct business activities based on
such strategies.
Therefore, business segments of the Group are distinguished by products and services, primarily by business companies
(or by business divisions within Nomura Real Estate Development).
From the fiscal year ended March 31, 2017, Nomura Real Estate Heating and Cooling Supply Co., Ltd., which had been
classified into the “Leasing Unit,” was transferred to the “Property & Facility Management Unit” to promote business in con-
junction with the property & facility management business.
The results of the fiscal year ended March 31, 2016 are calculated in line with the newly adopted segment classification.
(2) Methods for calculating net sales, income (loss), assets, liabilities and other items by reportable segment
The accounting method for reportable segments is almost equivalent to that specified in “Significant Accounting Policies.”
Reportable segment income is presented based on operating income. Intersegment sales and transfer amounts are pre-
sented based on market prices.
Nomura Real Estate Holdings, Inc. 37 Financial Report 2017 Nomura Real Estate Holdings, Inc. 38 Financial Report 2017

Results by segment for the fiscal years ended March 31, 2016 and 2017 were as follows:
Results by segment for the fiscal year ended March 31, 2016 (Millions of yen)
ResidentialDevelopment Leasing
Investment Management
Property Brokerage
& CRE
Property & Facility
Management Other 1 TotalEliminations
or corporate 2 Consolidated 3
Operating revenue and operating income
Operating revenue:
External customers ¥333,875 ¥107,592 ¥10,973 ¥33,239 ¥82,512 ¥1,354 ¥ 569,545 ¥ — ¥ 569,545
Inter-segment 640 2,635 0 2,134 9,041 0 14,450 (14,450) —
Subtotal 334,515 110,227 10,973 35,373 91,553 1,354 583,995 (14,450) 569,545
Segment income (loss) 31,909 31,719 7,377 9,901 5,694 (152) 86,448 (5,536) 80,912
Segment assets 414,812 918,710 36,693 32,048 55,696 1,565 1,459,524 25,926 1,485,450
Other items
Depreciation ¥ 161 ¥ 13,588 ¥ 57 ¥ 337 ¥ 1,467 ¥ 6 ¥ 15,616 ¥ 411 ¥ 16,027
Amortization of goodwill — 236 — — 29 — 265 — 265
Investment in affiliates accounted for using equity method 68 1,057 0 — — — 1,125 — 1,125
Increase in property, plant and equipment and intangible assets 686 47,885 46 633 1,336 6 50,592 1,213 51,805
Notes: 1. The “Other” category, which represents operating segments that are not included in reportable segments, includes other businesses. 2. (1) The deduction of ¥5,536 million shown in the eliminations or corporate column for segment income (loss) includes an addition of ¥1,204 million for the
elimination of inter-segment transactions and a deduction of ¥6,740 million for corporate expenses not allocated to reportable segments. These corpo-rate expenses mainly consist of general and administrative expenses not attributable to reportable segments.
(2) The addition of ¥25,926 million shown in the eliminations or corporate column for segment assets includes a deduction of ¥57,016 million for the elimi-nation of inter-segment transactions and an addition of ¥82,942 million for corporate assets not allocated to reportable segments.
3. The segment income (loss) is reconciled to the operating income stated in the consolidated financial statements.
Results by segment for the fiscal year ended March 31, 2017 (Millions of yen)
Residential Development Leasing
Investment Management
Property Brokerage
& CRE
Property & Facility
Management Other 1 TotalEliminations
or corporate 2 Consolidated 3
Operating revenue and operating income
Operating revenue:
External customers ¥329,303 ¥112,477 ¥ 9,663 ¥32,300 ¥85,832 ¥106 ¥ 569,681 ¥ — ¥ 569,681
Inter-segment 485 2,533 — 2,520 9,933 0 15,471 (15,471) —
Subtotal 329,788 115,010 9,663 34,820 95,765 106 585,152 (15,471) 569,681
Segment income (loss) 27,787 32,567 6,017 9,124 6,939 (30) 82,404 (5,133) 77,271
Segment assets 450,699 993,986 35,649 22,874 56,529 930 1,560,667 32,427 1,593,094
Other items
Depreciation ¥ 264 ¥ 14,139 ¥ 27 ¥ 379 ¥ 1,481 ¥ 6 ¥ 16,296 ¥ 581 ¥ 16,877
Amortization of goodwill — 236 — — 29 — 265 — 265
Investment in affiliates 2,525 930 — — 519 — 3,974 — 3,974
Increase in property, plant and equipment and intangible assets 428 56,225 22 649 1,755 — 59,079 1,296 60,375
Nomura Real Estate Holdings, Inc. 39 Financial Report 2017 Nomura Real Estate Holdings, Inc. 40 Financial Report 2017

(Thousands of U.S. dollars)
Residential Development Leasing
Investment Management
Property Brokerage
& CRE
Property & Facility
Management Other 1 TotalEliminations
or corporate 2 Consolidated 3
Operating revenue and operating income
Operating revenue:
External customers $2,935,228 $1,002,562 $ 86,127 $287,902 $765,055 $ 946 $ 5,077,820 $ — $ 5,077,820
Inter-segment 4,318 22,571 — 22,464 88,541 1 137,895 (137,895) —
Subtotal 2,939,546 1,025,133 86,127 310,366 853,596 947 5,215,715 (137,895) 5,077,820
Segment income (loss) 247,682 290,286 53,630 81,327 61,851 (270) 734,506 (45,752) 688,754
Segment assets 4,017,279 8,859,844 317,756 203,885 503,872 8,288 13,910,924 289,037 14,199,961
Other items
Depreciation $ 2,356 $ 126,033 $ 242 $ 3,375 $ 13,201 $ 50 $ 145,257 $ 5,179 $ 150,436
Amortization of goodwill — 2,100 — — 261 — 2,361 — 2,361
Investment in affiliates accounted for using equity method 22,512 8,290 — — 4,624 — 35,426 — 35,426
Increase in property, plant and equipment and intangible assets 3,812 501,158 200 5,789 15,642 — 526,601 11,545 538,146
Notes: 1. The “Other” category, which represents operating segments that are not included in reportable segments, includes other businesses. 2. (1) The deduction of ¥5,133 million ($45,752 thousand) shown in the eliminations or corporate column for segment income (loss) includes an addition of
¥1,389 million ($12,378 thousand) for the elimination of inter-segment transactions and a deduction of ¥6,522 million ($58,130 thousand) for corporate expenses not allocated to reportable segments. These corporate expenses mainly consist of general and administrative expenses not attributable to reportable segments.
(2) The addition of ¥32,427 million ($289,037 thousand) shown in the eliminations or corporate column for segment assets includes a deduction of ¥48,081 million ($428,565 thousand) for the elimination of inter-segment transactions and an addition of ¥80,508 million ($717,602 thousand) for corporate assets not allocated to reportable segments.
3. The segment income (loss) is reconciled to the operating income stated in the consolidated financial statements.
Impairment loss on noncurrent assets by reportable segments for the years ended March 31, 2016 and 2017 is summarized
as follows:
(Millions of yen)
2016Residential
Development Leasing Investment
Management
Property Brokerage
& CRE
Property & Facility
Management Other (Note) Total
Impairment loss ¥— ¥187 ¥— ¥— ¥1,239 ¥— ¥1,426
(Millions of yen)
2017Residential
Development Leasing Investment
Management
Property Brokerage
& CRE
Property & Facility
Management Other (Note) Total
Impairment loss ¥— ¥255 ¥— ¥— ¥— ¥— ¥255
(Thousands of U.S. dollars)
2017Residential
Development Leasing Investment
Management
Property Brokerage
& CRE
Property & Facility
Management Other (Note) Total
Impairment loss $— $2,269 $— $— $— $— $2,269
Nomura Real Estate Holdings, Inc. 39 Financial Report 2017 Nomura Real Estate Holdings, Inc. 40 Financial Report 2017

The following table presents the amortization and balance of goodwill as of and for the years ended March 31, 2016 and
2017 by reportable segments:
(Millions of yen)
2016Residential
Development Leasing Investment
Management
Property Brokerage &
CRE
Property & Facility
Management Total
Amortization ¥— ¥ 236 ¥— ¥— ¥ 29 ¥ 265Balance at March 31, 2016 ¥— ¥3,004 ¥— ¥— ¥205 ¥3,209
(Millions of yen)
2017Residential
Development Leasing Investment
Management
Property Brokerage &
CRE
Property & Facility
Management Total
Amortization ¥— ¥ 236 ¥— ¥— ¥ 29 ¥ 265
Balance at March 31, 2017 ¥— ¥2,768 ¥— ¥— ¥176 ¥2,944
(Thousands of U.S. dollars)
2017Residential
Development Leasing Investment
Management
Property Brokerage &
CRE
Property & Facility
Management Total
Amortization $— $ 2,100 $— $— $ 261 $ 2,361
Balance at March 31, 2017 $— $24,674 $— $— $1,566 $26,240
17. Contingent Liabilities
Contingent liabilities as of March 31, 2016 and 2017 are as follows:
(Millions of yen)(Thousands of U.S. dollars)
2016 2017 2017
Guarantees for home loans of house purchasers from banks and other ¥58,401 ¥64,278 $572,937
Guarantees for loans to business partners in the business of commercial buildings for rent
608 538 4,795
¥59,009 ¥64,816 $577,732
Nomura Real Estate Holdings, Inc. 41 Financial Report 2017 Nomura Real Estate Holdings, Inc. 42 Financial Report 2017

18. Consolidated Statement of Comprehensive Income
The amount of recycling and amount of income tax effects associated with other comprehensive income for the years ended
March 31, 2016 and 2017 are as follows:
(Millions of yen) (Thousands of U.S. dollars)
2016 2017 2017
Valuation difference on available-for-sale securities:Amount recognized during the year ¥ 2,878 ¥ 1,713 $ 15,266
Amount of recycling (772) 135 1,205
Before income tax effect 2,106 1,848 16,471
Income tax effect (511) (566) (5,043)
Valuation difference on available-for-sale securities 1,595 1,282 11,428
Deferred gains or losses on hedges:Amount recognized during the year 149 81 719
Amount of recycling (39) (133) (1,188)
Before income tax effect 110 (52) (469)
Income tax effect (32) 16 146
Deferred gains or losses on hedges 78 (36) (323)
Revaluation reserve for land: Income tax effect 216 (0) (1)
Foreign currency translation adjustment: Amount recognized during the year (10) 19 174
Amount of recycling — — —
Before income tax effect (10) 19 174
Income tax effect — — —
Foreign currency translation adjustment (10) 19 174
Remeasurements of defined benefit plans: Amount recognized during the year (6,850) (1,388) (12,369)
Amount of recycling (351) 500 4,457
Before income tax effect (7,201) (888) (7,912)
Income tax effect 2,257 272 2,421
Remeasurements of defined benefit plans (4,944) (616) (5,491)
Share of other comprehensive income of entities accounted for using the equity method:Amount recognized during the year (13) 0 1
Amount of recycling — — —
Before income tax effect (13) 0 1
Income tax effect 5 (1) (5)
Share of other comprehensive income of entities accounted for using the equity method (8) 0 (4)
Total other comprehensive income ¥(3,073) ¥ 649 $ 5,783
Nomura Real Estate Holdings, Inc. 41 Financial Report 2017 Nomura Real Estate Holdings, Inc. 42 Financial Report 2017

19. Schedule of Asset Retirement Obligations
A presentation of this schedule is omitted pursuant to the provisions of Article 92-2 of the Consolidated Financial Statements
Regulations as the amount of asset retirement obligations is not more than 1% of the total amount of liabilities and net assets
as of March 31, 2016 and 2017.
20. Stock Options
In accordance with the Act on November 30, 2007, the Group granted certain stock options to certain directors, executive
officers and employees of the Group.
Information regarding the Group’s stock option plans is summarized as follows:
1. Amount and account title of costs related to stock options
(Millions of yen)(Thousands of U.S. dollars)
2016 2017 2017
Selling, general and administrative expenses ¥587 ¥616 $5,495
2. Amount of gain on non-exercise of stock options
(Millions of yen)(Thousands of U.S. dollars)
2016 2017 2017
¥41 ¥42 $378
3. Description
Nomura Real Estate Holdings, Inc.
FY2009 3rd issue of stock options
Recipients Directors of the Company (8 persons)Directors and executive officers of the Company’s subsidiaries (51 persons)
Employees of the Company’s subsidiaries (129 persons)
Type/number of shares reserved (Note) Common stock: 202,700 shares
Grant date August 11, 2009
Vesting conditions No conditions attached
Service period No period specified
Exercisable period August 11, 2011 – August 10, 2016
Nomura Real Estate Holdings, Inc. 43 Financial Report 2017 Nomura Real Estate Holdings, Inc. 44 Financial Report 2017

Nomura Real Estate Holdings, Inc.
FY2010 2nd issue of stock options 3rd issue of stock options
Recipients Directors and executive officers of the Company’s subsidiaries (57 persons)
Directors of the Company (7 persons)Directors and executive officers of the Company’s subsidiaries (57 persons)
Employees of the Company’s subsidiaries (147 persons)
Type/number of shares reserved (Note) Common stock: 66,100 shares
Common stock: 226,400 shares
Grant date August 23, 2010 August 23, 2010
Vesting conditions No conditions attached No conditions attached
Service period No period specified No period specified
Exercisable period August 23, 2011 – August 22, 2016
August 23, 2012 – August 22, 2017
Nomura Real Estate Holdings, Inc.
FY2011 2nd issue of stock options 3rd issue of stock options
Recipients Directors and executive officers of the Company’s subsidiaries (57 persons)
Directors of the Company (6 persons)Directors and executive officers of the Company’s subsidiaries (57 persons)
Employees of the Company’s subsidiaries (152 persons)
Type/number of shares reserved (Note) Common stock: 66,700 shares
Common stock: 227,800 shares
Grant date August 23, 2011 August 23, 2011
Vesting conditions No conditions attached No conditions attached
Service period No period specified No period specified
Exercisable period August 23, 2012 – August 22, 2017
August 23, 2013 – August 22, 2018
Nomura Real Estate Holdings, Inc.
FY2012 1st issue of stock options 2nd issue of stock options 3rd issue of stock options
Recipients Directors of the Company (5 persons)
Directors and executive officers of the Company’s subsidiaries (64 persons)
Directors of the Company (5 persons)Directors and executive officers of the Company’s subsidiaries (64 persons)
Employees of the Company’s subsidiaries (152 persons)
Type/number of shares reserved (Note)
Common stock: 31,500 shares
Common stock: 188,900 shares
Common stock: 242,700 shares
Grant date August 23, 2012 August 23, 2012 August 23, 2012
Vesting conditions No conditions attached No conditions attached No conditions attached
Service period No period specified No period specified No period specified
Exercisable period August 23, 2014 – August 22, 2019
August 23, 2014 – August 22, 2019
August 23, 2014 – August 22, 2019
Nomura Real Estate Holdings, Inc. 43 Financial Report 2017 Nomura Real Estate Holdings, Inc. 44 Financial Report 2017
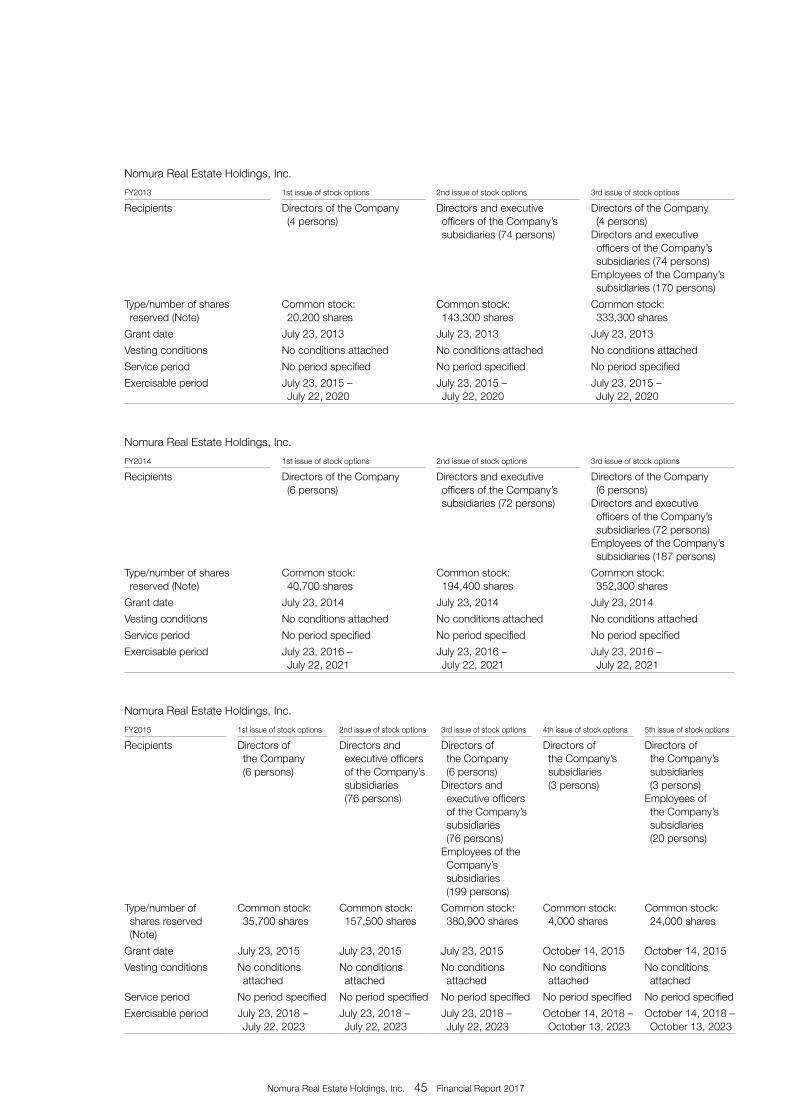
Nomura Real Estate Holdings, Inc.
FY2013 1st issue of stock options 2nd issue of stock options 3rd issue of stock options
Recipients Directors of the Company (4 persons)
Directors and executive officers of the Company’s subsidiaries (74 persons)
Directors of the Company (4 persons)Directors and executive officers of the Company’s subsidiaries (74 persons)
Employees of the Company’s subsidiaries (170 persons)
Type/number of shares reserved (Note)
Common stock: 20,200 shares
Common stock: 143,300 shares
Common stock: 333,300 shares
Grant date July 23, 2013 July 23, 2013 July 23, 2013
Vesting conditions No conditions attached No conditions attached No conditions attached
Service period No period specified No period specified No period specified
Exercisable period July 23, 2015 – July 22, 2020
July 23, 2015 – July 22, 2020
July 23, 2015 – July 22, 2020
Nomura Real Estate Holdings, Inc.
FY2014 1st issue of stock options 2nd issue of stock options 3rd issue of stock options
Recipients Directors of the Company (6 persons)
Directors and executive officers of the Company’s subsidiaries (72 persons)
Directors of the Company (6 persons)Directors and executive officers of the Company’s subsidiaries (72 persons)
Employees of the Company’s subsidiaries (187 persons)
Type/number of shares reserved (Note)
Common stock: 40,700 shares
Common stock: 194,400 shares
Common stock: 352,300 shares
Grant date July 23, 2014 July 23, 2014 July 23, 2014
Vesting conditions No conditions attached No conditions attached No conditions attached
Service period No period specified No period specified No period specified
Exercisable period July 23, 2016 – July 22, 2021
July 23, 2016 – July 22, 2021
July 23, 2016 – July 22, 2021
Nomura Real Estate Holdings, Inc.
FY2015 1st issue of stock options 2nd issue of stock options 3rd issue of stock options 4th issue of stock options 5th issue of stock options
Recipients Directors of the Company (6 persons)
Directors and executive officers of the Company’s subsidiaries (76 persons)
Directors of the Company (6 persons)
Directors and executive officers of the Company’s subsidiaries (76 persons)
Employees of the Company’s subsidiaries (199 persons)
Directors of the Company’s subsidiaries (3 persons)
Directors of the Company’s subsidiaries (3 persons)
Employees of the Company’s subsidiaries (20 persons)
Type/number of shares reserved (Note)
Common stock: 35,700 shares
Common stock: 157,500 shares
Common stock: 380,900 shares
Common stock: 4,000 shares
Common stock: 24,000 shares
Grant date July 23, 2015 July 23, 2015 July 23, 2015 October 14, 2015 October 14, 2015
Vesting conditions No conditions attached
No conditions attached
No conditions attached
No conditions attached
No conditions attached
Service period No period specified No period specified No period specified No period specified No period specified
Exercisable period July 23, 2018 – July 22, 2023
July 23, 2018 – July 22, 2023
July 23, 2018 – July 22, 2023
October 14, 2018 – October 13, 2023
October 14, 2018 – October 13, 2023
Nomura Real Estate Holdings, Inc. 45 Financial Report 2017 Nomura Real Estate Holdings, Inc. 46 Financial Report 2017

Nomura Real Estate Holdings, Inc.
FY2016 1st issue of stock options 2nd issue of stock options 3rd issue of stock options
Recipients Directors of the Company (6 persons)
Directors and executive officers of the Company’s subsidiaries (83 persons)
Directors of the Company (6 persons)Directors and executive officers of the Company’s subsidiaries (83 persons)
Employees of the Company’s subsidiaries (226 persons)
Type/number of shares reserved (Note)
Common stock: 56,700 shares
Common stock: 250,300 shares
Common stock: 421,800 shares
Grant date July 22, 2016 July 22, 2016 July 22, 2016
Vesting conditions No conditions attached No conditions attached No conditions attached
Service period No period specified No period specified No period specified
Exercisable period July 22, 2019 – July 21, 2024
July 22, 2019 –July 21, 2024
July 22, 2019 – July 21, 2024
(Note) Described in terms of the number of shares.
4. Scale of offer and status of changes
(1) Number of stock options
Nomura Real Estate Holdings, Inc.
FY2009 3rd issue of stock options
Non-vested: (shares)
Previous fiscal year end —
Granted —
Forfeited —
Vested: —
End of the year —
Vested: (shares)
Previous fiscal year end 50,500
Vested: —
Exercised 24,000
Forfeited 26,500
End of the year —
Nomura Real Estate Holdings, Inc. 45 Financial Report 2017 Nomura Real Estate Holdings, Inc. 46 Financial Report 2017

Nomura Real Estate Holdings, Inc.
FY2010 2nd issue of stock options 3rd issue of stock options
Non-vested: (shares)
Previous fiscal year end — —
Granted — —
Forfeited — —
Vested: — —
End of the year — —
Vested: (shares)
Previous fiscal year end 3,200 36,700
Vested: — —
Exercised 3,200 5,400
Forfeited — —
End of the year — 31,300
Nomura Real Estate Holdings, Inc.
FY2011 2nd issue of stock options 3rd issue of stock options
Non-vested: (shares)
Previous fiscal year end — —
Granted — —
Forfeited — —
Vested: — —
End of the year — —
Vested: (shares)
Previous fiscal year end 5,000 81,600
Vested: — —
Exercised 1,500 10,100
Forfeited — —
End of the year 3,500 71,500
Nomura Real Estate Holdings, Inc.
FY2012 1st issue of stock options 2nd issue of stock options 3rd issue of stock options
Non-vested: (shares)
Previous fiscal year end — — —
Granted — — —
Forfeited — — —
Vested: — — —
End of the year — — —
Vested: (shares)
Previous fiscal year end 13,800 67,600 123,700
Vested: — — —
Exercised 5,400 18,300 19,000
Forfeited — — 500
End of the year 8,400 49,300 104,200
Nomura Real Estate Holdings, Inc. 47 Financial Report 2017 Nomura Real Estate Holdings, Inc. 48 Financial Report 2017

Nomura Real Estate Holdings, Inc.
FY2013 1st issue of stock options 2nd issue of stock options 3rd issue of stock options
Non-vested: (shares)
Previous fiscal year end — — —
Granted — — —
Forfeited — — —
Vested: — — —
End of the year — — —
Vested: (shares)
Previous fiscal year end 16,100 80,500 316,400
Vested: — — —
Exercised 9,700 18,600 —
Forfeited — — 37,400
End of the year 6,400 61,900 279,000
Nomura Real Estate Holdings, Inc.
FY2014 1st issue of stock options 2nd issue of stock options 3rd issue of stock options
Non-vested: (shares)
Previous fiscal year end — — 338,700
Granted — — —
Forfeited — — 4,900
Vested: — — 333,800
End of the year — — —
Vested: (shares)
Previous fiscal year end 40,700 194,400 9,400
Vested: — — 333,800
Exercised 6,000 77,000 —
Forfeited — — —
End of the year 34,700 117,400 343,200
Nomura Real Estate Holdings, Inc.
FY20151st issue of
stock options 2nd issue of
stock options 3rd issue of
stock options 4th issue of
stock options5th issue of
stock options
Non-vested: (shares)
Previous fiscal year end — — 379,900 — 24,000
Granted — — — — —
Forfeited — — 2,600 — 1,000
Vested: — — 16,800 — —
End of the year — — 360,500 — 23,000
Vested: (shares)
Previous fiscal year end 35,700 157,500 1,000 4,000 —
Vested: — — 16,800 — —
Exercised — — — — —
Forfeited — — — — —
End of the year 35,700 157,500 17,800 4,000 —
Nomura Real Estate Holdings, Inc. 47 Financial Report 2017 Nomura Real Estate Holdings, Inc. 48 Financial Report 2017

Nomura Real Estate Holdings, Inc.
FY20161st issue of
stock options 2nd issue of
stock options 3rd issue of
stock options
Non-vested: (shares)
Previous fiscal year end — — —
Granted 56,700 250,300 421,800
Forfeited — — 2,000
Vested: 56,700 250,300 3,000
End of the year — — 416,800
Vested: (shares)
Previous fiscal year end — — —
Vested: 56,700 250,300 3,000
Exercised — — —
Forfeited — — —
End of the year 56,700 250,300 3,000
(2) Unit price data
Nomura Real Estate Holdings, Inc.
FY2009 3rd issue of stock options
Exercise price (¥) 1,663
Average price upon exercise (¥) 1,809
Fair value on grant date (¥) 641
Nomura Real Estate Holdings, Inc.
FY2010 2nd issue of stock options 3rd issue of stock options
Exercise price (¥) 1 1,194
Average price upon exercise (¥) 1,764 1,934
Fair value on grant date (¥) 1,119 437
Nomura Real Estate Holdings, Inc.
FY2011 2nd issue of stock options 3rd issue of stock options
Exercise price (¥) 1 1,457
Average price upon exercise (¥) 1,925 1,925
Fair value on grant date (¥) 1,045 315
Nomura Real Estate Holdings, Inc.
FY2012 1st issue of stock options 2nd issue of stock options 3rd issue of stock options
Exercise price (¥) 1 1 1,451
Average price upon exercise (¥) 1,663 1,980 1,854
Fair value on grant date (¥) 1,283 1,283 454
Nomura Real Estate Holdings, Inc.
FY2013 1st issue of stock options 2nd issue of stock options 3rd issue of stock options
Exercise price (¥) 1 1 2,429
Average price upon exercise (¥) 1,855 1,827 —
Fair value on grant date (¥) 2,297 2,297 675
Nomura Real Estate Holdings, Inc. 49 Financial Report 2017 Nomura Real Estate Holdings, Inc. 50 Financial Report 2017

Nomura Real Estate Holdings, Inc.
FY2014 1st issue of stock options 2nd issue of stock options 3rd issue of stock options
Exercise price (¥) 1 1 2,016
Average price upon exercise (¥) 1,899 1,866 —
Fair value on grant date (¥) 1,718 1,718 371
Nomura Real Estate Holdings, Inc.
FY20151st issue of
stock options 2nd issue of
stock options 3rd issue of
stock options 4th issue of
stock options5th issue of
stock options
Exercise price (¥) 1 1 2,741 1 2,355
Average price upon exercise (¥) — — — — —
Fair value on grant date (¥) 2,260 2,260 516 2,085 536
Nomura Real Estate Holdings, Inc.
FY20161st issue of
stock options 2nd issue of
stock options 3rd issue of
stock options
Exercise price (¥) 1 1 1,927
Average price upon exercise (¥) — — —
Fair value on grant date (¥) 1,593 1,593 377
5. Method for estimating per share fair value of stock options
The per share fair value of the stock options granted during the fiscal year ended March 31, 2017 (FY2016) was estimated
as follows:
(1) Valuation technique used: Black-Scholes method
(2) Main base data and estimation methods
Nomura Real Estate Holdings, Inc.
Nomura Real Estate Holdings, Inc. 1st issue of FY2016 stock options
Nomura Real Estate Holdings, Inc. 2nd issue of FY2016 stock options
Nomura Real Estate Holdings, Inc. 3rd issue of FY2016 stock options
Expected volatility of the share price (Note 1) 32.9% 32.9% 32.9%
Expected remaining life of the option (Note 2) 5.5 years 5.5 years 5.5 years
Expected dividend (Note 3)
¥60 ($0.53) per share
¥60 ($0.53)per share
¥60 ($0.53)per share
Risk-free interest rate (Note 4)
0.00% 0.00% 0.00%
Notes: 1. Calculated based on the actual stock price for five years and six months (from January 2011 to July 2016). 2. Calculated with an assumption that the stock option is exercised at the middle of the exercise period as the Company does not have sufficient data for a
more precise estimation. 3. Based on the expected dividend for the fiscal year ended March 31, 2017 at the grant date. 4. Based on the yield of Japanese government bonds for the period equivalent to the expected remaining life of the option.
6. Estimation of the number of vested options
The estimation of the number of vested options is made based on the actual number of forfeited options due to difficulty in
reasonably estimating future forfeitures.
Nomura Real Estate Holdings, Inc. 49 Financial Report 2017 Nomura Real Estate Holdings, Inc. 50 Financial Report 2017

21. Subsequent Events
(a) Stock Acquisition Rights
The Company has resolved to issue stock acquisition rights as stock options at the meeting of its Board of Directors held on
June 29, 2017.
1. Stock acquisition rights with exercise price of ¥1 per share
(1) Recipients
Directors of the Company: 6 persons
Directors and executive officers of the Company’s subsidiaries: 90 persons
(2) Type and number of shares subject to the stock acquisition rights
Common stock: 268,100 shares
The number of shares issuable under each stock acquisition right shall be 100 shares.
(3) Amount per share to be paid at the time of the exercise
¥1 per share
(4) Allotment date
July 21, 2017
(5) Exercise period of the stock acquisition rights
July 21, 2020 – July 20, 2025
(6) Conditions for assignment of the stock acquisition rights
Assignment of the stock acquisition rights to third parties requires the resolution approved by the Company’s
Board of Directors.
Nomura Real Estate Holdings, Inc. 51 Financial Report 2017 Nomura Real Estate Holdings, Inc. 52 Financial Report 2017

2. Stock acquisition rights with exercise price to be determined by reference the market price of the Company’s
stock at the time of the exercise
(1) Recipients
Directors of the Company: 6 persons
Directors and executive officers of the Company’s subsidiaries: 90 persons
Employees of the Company’s subsidiaries: 241 persons
(2) Type and number of shares subject to the stock acquisition rights
Common stock: 456,400 shares
The number of shares issuable under each stock acquisition right shall be 100 shares.
(3) Amount per share to be paid at the time of the exercise
The amount to be paid per share shall be the higher of the average closing price of the Company’s common stock in regular
trading on the Tokyo Stock Exchange in the month preceding the month of the allotment date multiplied by 1.05 (fractional
amounts less than ¥1 are to be rounded up) or the closing price on the allotment date (if there is no closing price, the most
recent closing price prior to this date).
(4) Allotment date
July 21, 2017
(5) Exercise period of the stock acquisition rights
July 21, 2020 – July 20, 2025
(6) Conditions for assignment of the stock acquisition rights
Assignment of the stock acquisition rights to third parties requires the resolution approved by the Company’s
Board of Directors.
Nomura Real Estate Holdings, Inc. 51 Financial Report 2017 Nomura Real Estate Holdings, Inc. 52 Financial Report 2017

Independent Auditors’ Report
Nomura Real Estate Holdings, Inc. 53 Financial Report 2017